Review

Establishment of Intrinsic Permeability of Coarse Open-Graded Materials: Review and Analysis of Existing Data from Natural Air Convection Tests

1
Department of Civil and Environmental Engineering, Norwegian University of Science and Technology, Høgskoleringen 7A, 7491 Trondheim, Norway
2
Department of Civil and Water Engineering, Laval University, Pavillon Adrien-Pouliot, 1065, Avenue de la Médecine, Québec City, QC G1V 0A6, Canada
*
Author to whom correspondence should be addressed.
Minerals 2020, 10(9), 767; https://doi.org/10.3390/min10090767
Submission received: 20 June 2020 / Revised: 10 August 2020 / Accepted: 11 August 2020 / Published: 29 August 2020
(This article belongs to the Special Issue Minerals and Other Phases in Constructional Geomaterials)

Abstract

:
This paper presents a review and analysis of large-scale air convection tests and the establishment of intrinsic permeability in coarse open-graded materials. Natural air convection can make a significant contribution to heat transfer during cooling periods. In seasonally freezing environments this can result in excessive frost penetration and subsequent frost-related problems. Intrinsic permeability largely defines the onset of convective heat transfer in granular materials. Conventional methods for measuring intrinsic permeability cannot be applied to very coarse materials. Large-scale laboratory experiments on natural air convection can serve as an alternative method for determining this crucial parameter. This paper gives an overview of four different experimental test setups for measuring natural air convection, all differing in physical shape, boundary conditions and heat flux/temperature measurement devices. Comparison between these is difficult because the air convection pattern can differ and in some cases the shape and number of convection cells cannot be validated. Most of the studies available in the literature use theoretical equations to approximate intrinsic permeability. A method based on the analytical Nu-Ra number relationship is employed to establish the values of intrinsic permeability. Tests that provide enough data to enable the use of the Nu-Ra relationship are very limited. The overall results show a reasonable correlation between experiment-based intrinsic permeability and theoretical approximation. However, several issues must be addressed: first, differences may exist between the intrinsic permeability of natural and of crushed materials due to the shape effect. Second, the method used is in theory valid only for two-dimensional air convection within a square enclosure heated from below. Yet the results show that this method could be extended to other conditions with a certain degree of confidence. Third, a good estimate of intrinsic permeability is possible only with accurate experimental measurement.

1. Introduction

Thermal conduction is the major heat transfer mode in conventional road and railway construction materials [1,2]. However, when coarse open-graded materials are used, other heat transfer types may contribute significantly to the overall heat transfer rate. Natural air convection has been a topic of interest for road and railway engineers for the last few decades because it is a temperature gradient-dependent heat transfer mode (upward heat flow). In addition, it considerably increases the overall heat transfer extraction rate only during the cooling periods. This in turn can yield favorable effects only in permafrost conditions, contributing to the ground cooling rate and maintaining subzero temperatures under road or railway structures [3]. The same process in a seasonally freezing environment can result in excessive frost-penetration depth [4], leading to frost heave problems. In permafrost conditions, air convection embankment (ACE) is a typical example of how free air convection can be employed. ACE is constructed of granular material of large and mainly uniform particle size. Highly porous material has high intrinsic permeability, which ensures the initiation of convective heat transfer at low temperature gradients. As a result convection contributes to ground cooling when the ground temperature is higher than the air temperature [5]. Figure 1 shows the pattern of air convection cells contributing to heat extraction from the ground. The same physical process in terms of air circulation can also occur in a seasonally freezing environment if the intrinsic permeability of the material is high enough to initiate and enable convective heat transfer.
Thermal design in seasonally freezing environments has the opposite goal to that in permafrost conditions: to prevent excessive ground cooling by controlling or reducing the freezing of frost-susceptible subgrade soils. Convective heat transfer in this case would contribute to excessive heat extraction during wintertime, with no heat input possible during summertime. Therefore the primary objective in terms of heat transfer is to limit heat flow to conduction conditions.
Intrinsic permeability is the key parameter of materials that defines the onset of convection. Estimating permeability can be difficult because conventional methods such as measuring hydraulic conductivity cannot be applied to very coarse materials. In addition, extending theoretical models developed for fine materials to coarse fractions introduces large variations. An alternative method for estimating permeability was introduced by Côté et al. (2011) [6]. The method is based on natural air convection tests in combination with the analytical Nu-Ra relationship. The literature provides only a limited number of tests with enough data to allow the use of the Nu-Ra relationship.
This paper presents an overview of the establishment of the intrinsic permeability of coarse open-graded materials based on laboratory experiments. It first gives the background to natural air convection phenomenon occurring in coarse granular materials. Theoretical models for the approximation of intrinsic permeability are provided. The paper then describes four experimental studies on this topic in the chronological sequence in which they were carried out in recent decades. It then presents the experimental results of all of the studies and the established intrinsic permeability values based on a method proposed by Côté et al. (2011) [6]. A discussion of the effect of particle gradation follows. Finally, general conclusions regarding large-scale air convection tests and the establishment of intrinsic permeability are given.

2. Natural Air Convection in Porous Media

Johansen (1975) [2] established the limits of different heat transfer mechanisms that can take place in soils in field conditions. He proposed defining the domains of each of these mechanisms as a function of effective particle diameter (d10) and degree of saturation (Sr). This is shown in Figure 2 as follows, according to the various regions numbered from 1 to 6: (1) conduction; (2) temperature-driven vapor diffusion; (3) humidity-driven vapor diffusion; (4) free water convection; (5) natural air convection; (6) radiation. Johansen (1975) [2] also defined the d10 size of 0.01 m as the limit above which natural convection and radiation can make a significant contribution to overall heat transfer.

2.1. Natural Air Convection

Natural air convection in porous materials used in road and railway construction may occur only if certain conditions are met [2]. The principal condition is the temperature gradient along the thickness of a particular material layer. Natural air convection is buoyancy-driven, meaning that the fluid flow is the result of density variations along the temperature gradient. The presence of convective heat flow in superstructures represents the ground cooling period. During this period the ground temperature is higher than the air temperature, creating unstable pore-air density gradients [4]. As a result, the lighter warm air from the ground may rise while the denser cold air penetrates the ground. Fluid flow is strongly associated with heat flow. The circulating pore air carries a certain amount of heat stored in the structural layers and subsoil. As a result, the rise of warm air can speed up the ground-cooling process considerably. An increased temperature gradient will increase the density variations, resulting in higher air velocity and in turn increasing the heat extraction rate.
In laboratory conditions the samples are tested in both upward and downward heat flow conditions to evaluate the magnitude of convection. For downward heat flow conditions, the heat is transferred by a combination of thermal conduction and radiation [7] that can be considered an equivalent conduction term. For upward heat flow conditions, in addition to effective thermal conduction, heat can be transferred by natural air convection. Under the same temperature gradient, heat flux from the opposite movements can be expressed as a ratio called the Nusselt number (Nu, no units) as showed in Equation (1). The Nu number describes the increase in heat transferred due to convection compared to pure conduction. If Nu number is greater than 1 it means that convection is contributing to the upward heat flow.
N u = q q
where q and q are the upward and downward heat fluxes (W/m2) respectively.
The magnitude of convection can be expressed by a Rayleigh number (Ra, no units). According to Nield and Bejan (2013) [8], the Ra number is calculated as follows:
R a = g β C K H 2 T ν k e
where H (m) is the height of the sample, T is the temperature gradient (°C/m), g is gravitational acceleration (m/s2), K and ke is the intrinsic permeability (m2) and effective thermal conductivity (W/m°C) of the material, and β, C and ν are the thermal expansion (K−1), heat capacity (J·m−3·K−1) and kinematic viscosity of the fluid respectively. Estimation of effective thermal conductivity and the intrinsic permeability are presented in the following section.
Schubert and Straus (1979) [9] have demonstrated that convection can be initiated in a square enclosure heated from below only when the Ra number exceeds 4π2 (~40). A strictly two-dimensional convection is steady for Ra number values of up to 320. In a cube, a maximum Ra number of 200 makes two-dimensional convection possible, and when the Ra value exceeds 200, perturbations in an orthogonal direction lead to unsteady conditions. Under such conditions steady-state convection in a three-dimensional enclosure can be maintained only when the ratio of the width of a sample to the dimension of the square’s cross section is below 0.38. Above the critical Ra number value, convection becomes unsteady and the Nu number value fluctuates increasingly with increasing Ra values [9,10,11].

2.2. Effective Thermal Conductivity

In coarse open-graded materials tested under downward heat flow conditions, the heat is transferred by conduction and radiation and the rate of heat flow is governed by the effective thermal conductivity (ke), which is the sum of the contributions of thermal (kc) and radiant (kr) conductivity as follows:
ke = kc + kr
Numerous models have been developed for the approximation of pure thermal conductivity of dry, moist and saturated soils. The materials discussed in the experimental studies have been tested in dry conditions, enabling the use of the two-phase model proposed by Côté and Konrad (2009) [12]. For a two-phase material consisting of a solid part (rock) and a fluid part (air), thermal conductivity kc can be approximated as follows:
k c = ( κ 2 p k s k f ) ( 1 n ) + k f 1 + ( κ 2 p 1 ) ( 1 n )
where ks and kf are the thermal conductivity (W/m°C) of the solid and the fluid (air phase) respectively, n is porosity (no units), while κ2p is a structure parameter (no units) obtained as follows:
κ 2 p = 0.29 ( 15 k f k s ) φ
where φ is empirical factor set equal to 0.54 for crushed materials.
Radiation in a porous media can be assimilated to diffusion process and estimated through diffusion approximation [13,14]. Radiant conductivity (kr), as stated by Tien (1988) [15] can be calculated as follows:
k r = 4 E d 10 σ T 3
where E is the exchange factor, σ is the Stephan–Boltzmann constant equal to 5.67 × 10⁻⁸ W m−3 K−4 and T is the mean sample temperature. Numerous equations are available for approximation of the exchange factor. Fillion et al. (2011) [7] has shown that the equation proposed by Argo and Smith (1953) [16] fits best the experimental data obtained in their own study and the results of the study by Johansen (1975) [2]. The equation proposed by Argo and Smith (1953) [16] is as follows:
E = ε ( 2 ε )
where ε is surface emissivity.
Equations (1)–(7) are used in the analysis of the experimental data presented later in this paper.

2.3. Intrinsic Permeability

Many of the parameters taken into account by the Rayleigh number can be measured easily or obtained from published tables. Most existing theoretical models for approximating intrinsic permeability are based on experimental measurement of much finer soils (e.g., [10,11]) and therefore should be used with caution when extended to a range of coarse materials. Moreover, conventional experimental methods such as hydraulic conductivity measurement cannot be applied to coarse materials. In such experiments turbulent flows can form at relatively small hydraulic gradients, as shown by Dudgeon (1966) [17] in uniform materials with a particle size larger than 20 mm. However, Côté et al. (2011) [6] have shown that large-scale air convection tests can work as a substitute for the determination of this essential parameter.
Most studies involving natural air convection rely on estimated values of intrinsic permeability obtained using the Kozeny–Carman model, as derived by Carman (1956) [18] from Kozeny (1927) [19], Equation (8), or a modified version proposed by Chapuis (2004) [20] Equation (9):
K = C f 2 d 10 2 n 3 ( 1 n ) 2
where C/f2 accounts for tortuosity as well as pore and particle shape (no units) and d10 is the effective particle diameter (m). This theoretical model was used in the studies by Johansen (1975) [2] and NGI (1999) [21] covered in this paper.
K = 0.000125 α 0.7825
where α is defined as d 10 2 n 3 / ( 1 n ) 2 .
The two theoretical models for the estimation of intrinsic permeability presented here are compared to experimental data from various studies.

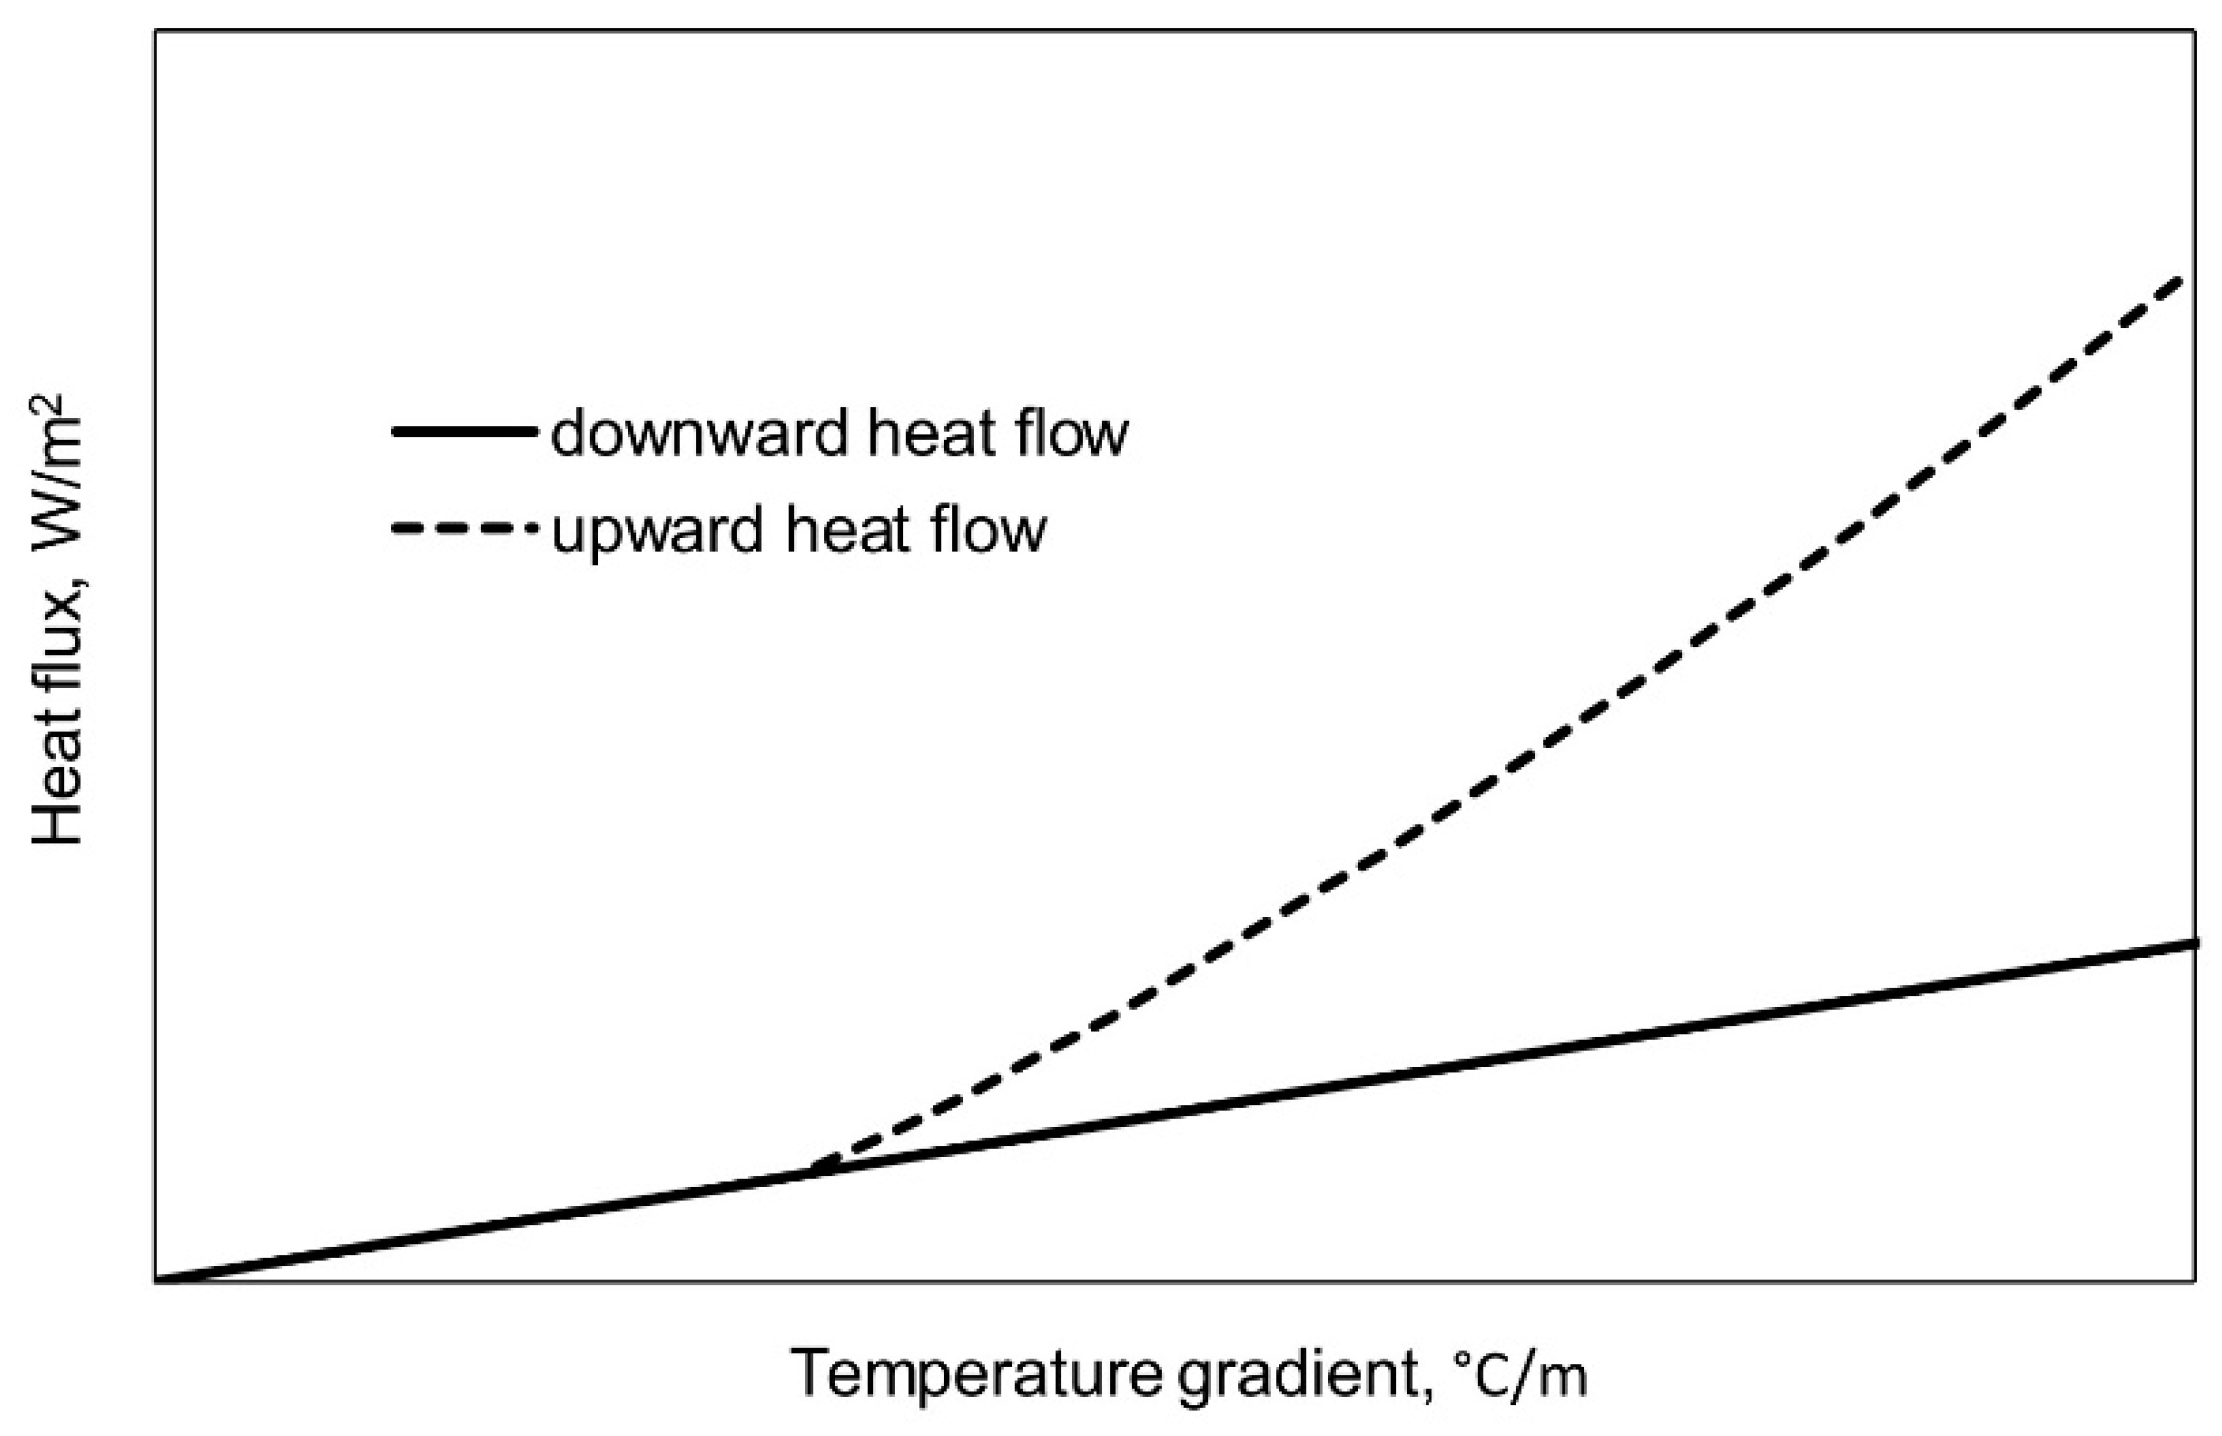
3. A Method for Determining the Intrinsic Permeability from Natural Air Convection Tests

This section describes a method of analysis for establishing the values of intrinsic permeability based on measurement of heat convection in large-scale laboratory tests. The method is proposed by Côté et al. (2011) [6] as an alternative way of defining the intrinsic permeability of coarse open-graded materials.
Schubert and Straus (1979) [9] proposed the analytical Nu–Ra number relationship for natural air convection within a square enclosure heated from below and provided numerical values for the Nu and Ra numbers. Côté et al. (2011) [6] modelled the Nu–Ra relationship by best fit-analysis using a log-function:
N u = 1.735 ln ( R a ) 5.38
Figure 3 shows the analytical Nu–Ra number relationship together with laboratory results from various studies on natural air convection [8,22,23,24,25]. The laboratory results deviate relatively widely from the analytical solution. The scattering may be attributed to external effects such as variation in vertical wall temperatures [6]. In addition, to establish the Ra number values, different theoretical models are used for the approximation of intrinsic permeability. This could also explain the deviation from the analytical solution. The numerical values for Nu and Ra as well as the equation derived are strictly for two-dimensional convection within a square enclosure heated from below. Based on Schubert and Straus (1979) [9] the Nu–Ra relationship is applicable to a cubical enclosure if the Ra number value does not exceed 200. Below the critical Ra number no orthogonal perturbation is expected.
Substituting the Nu and Ra numbers with their corresponding equations (Equations (1) and (2)) yields (Côté et al., 2011 [6,26]):
q q = 1.735 ln ( g β C K H 2 T ν k e ) 5.38
Equation (11) can easily be used to best fit experimental data to obtain the value of intrinsic permeability. The values of q and q can be obtained from laboratory tests as an average heat flux value of the whole horizontal cross section of the sample. The values of β, C and ν can be read from material property tables using the corresponding reference temperature taken as the average temperature between the upper and lower boundary conditions. H is the sample height, while T is the corresponding temperature gradient at which the values of heat flux are defined. The value of ke can be obtained from the downward heat flow conditions where there is no convection.
The Nu–Ra number relationship given above is geometry- and boundary-condition-dependent and theoretically applicable only in certain conditions. Different numbers of convection cells within a given geometry will result in different Nu–Ra relationships [8]. However, as shown later, the same Nu–Ra relationship can be applied to other geometry and air convection cell conditions to yield reasonable intrinsic permeability values [6,27].
Figure 4 is a schematic of typical experimental results of natural downward (no air convection) and upward (with air convection) heat transfer tests on coarse open-graded materials. The slope of the solid line is the value of effective thermal conductivity (ke). The line can be established as a best fit line for downward heat flow measurements at various values of temperature gradient. The dashed line represents the upward heat flow conditions when natural air convection is initiated above a certain temperature gradient. The experimental results provide data points with mean heat flux values and the average temperature gradient over the sample. The dashed line can be obtained by employing Equation (11) and using K as best fit parameter. The best-fit line for upward heat flow conditions is slightly curved because Equation (11) has a logarithmic term. The intercept point of the two lines defines the minimum temperature gradient necessary for the initiation of convective heat transfer. The intercept point refers to the critical temperature gradient (Tc).

4. Large-Scale Laboratory Experiments

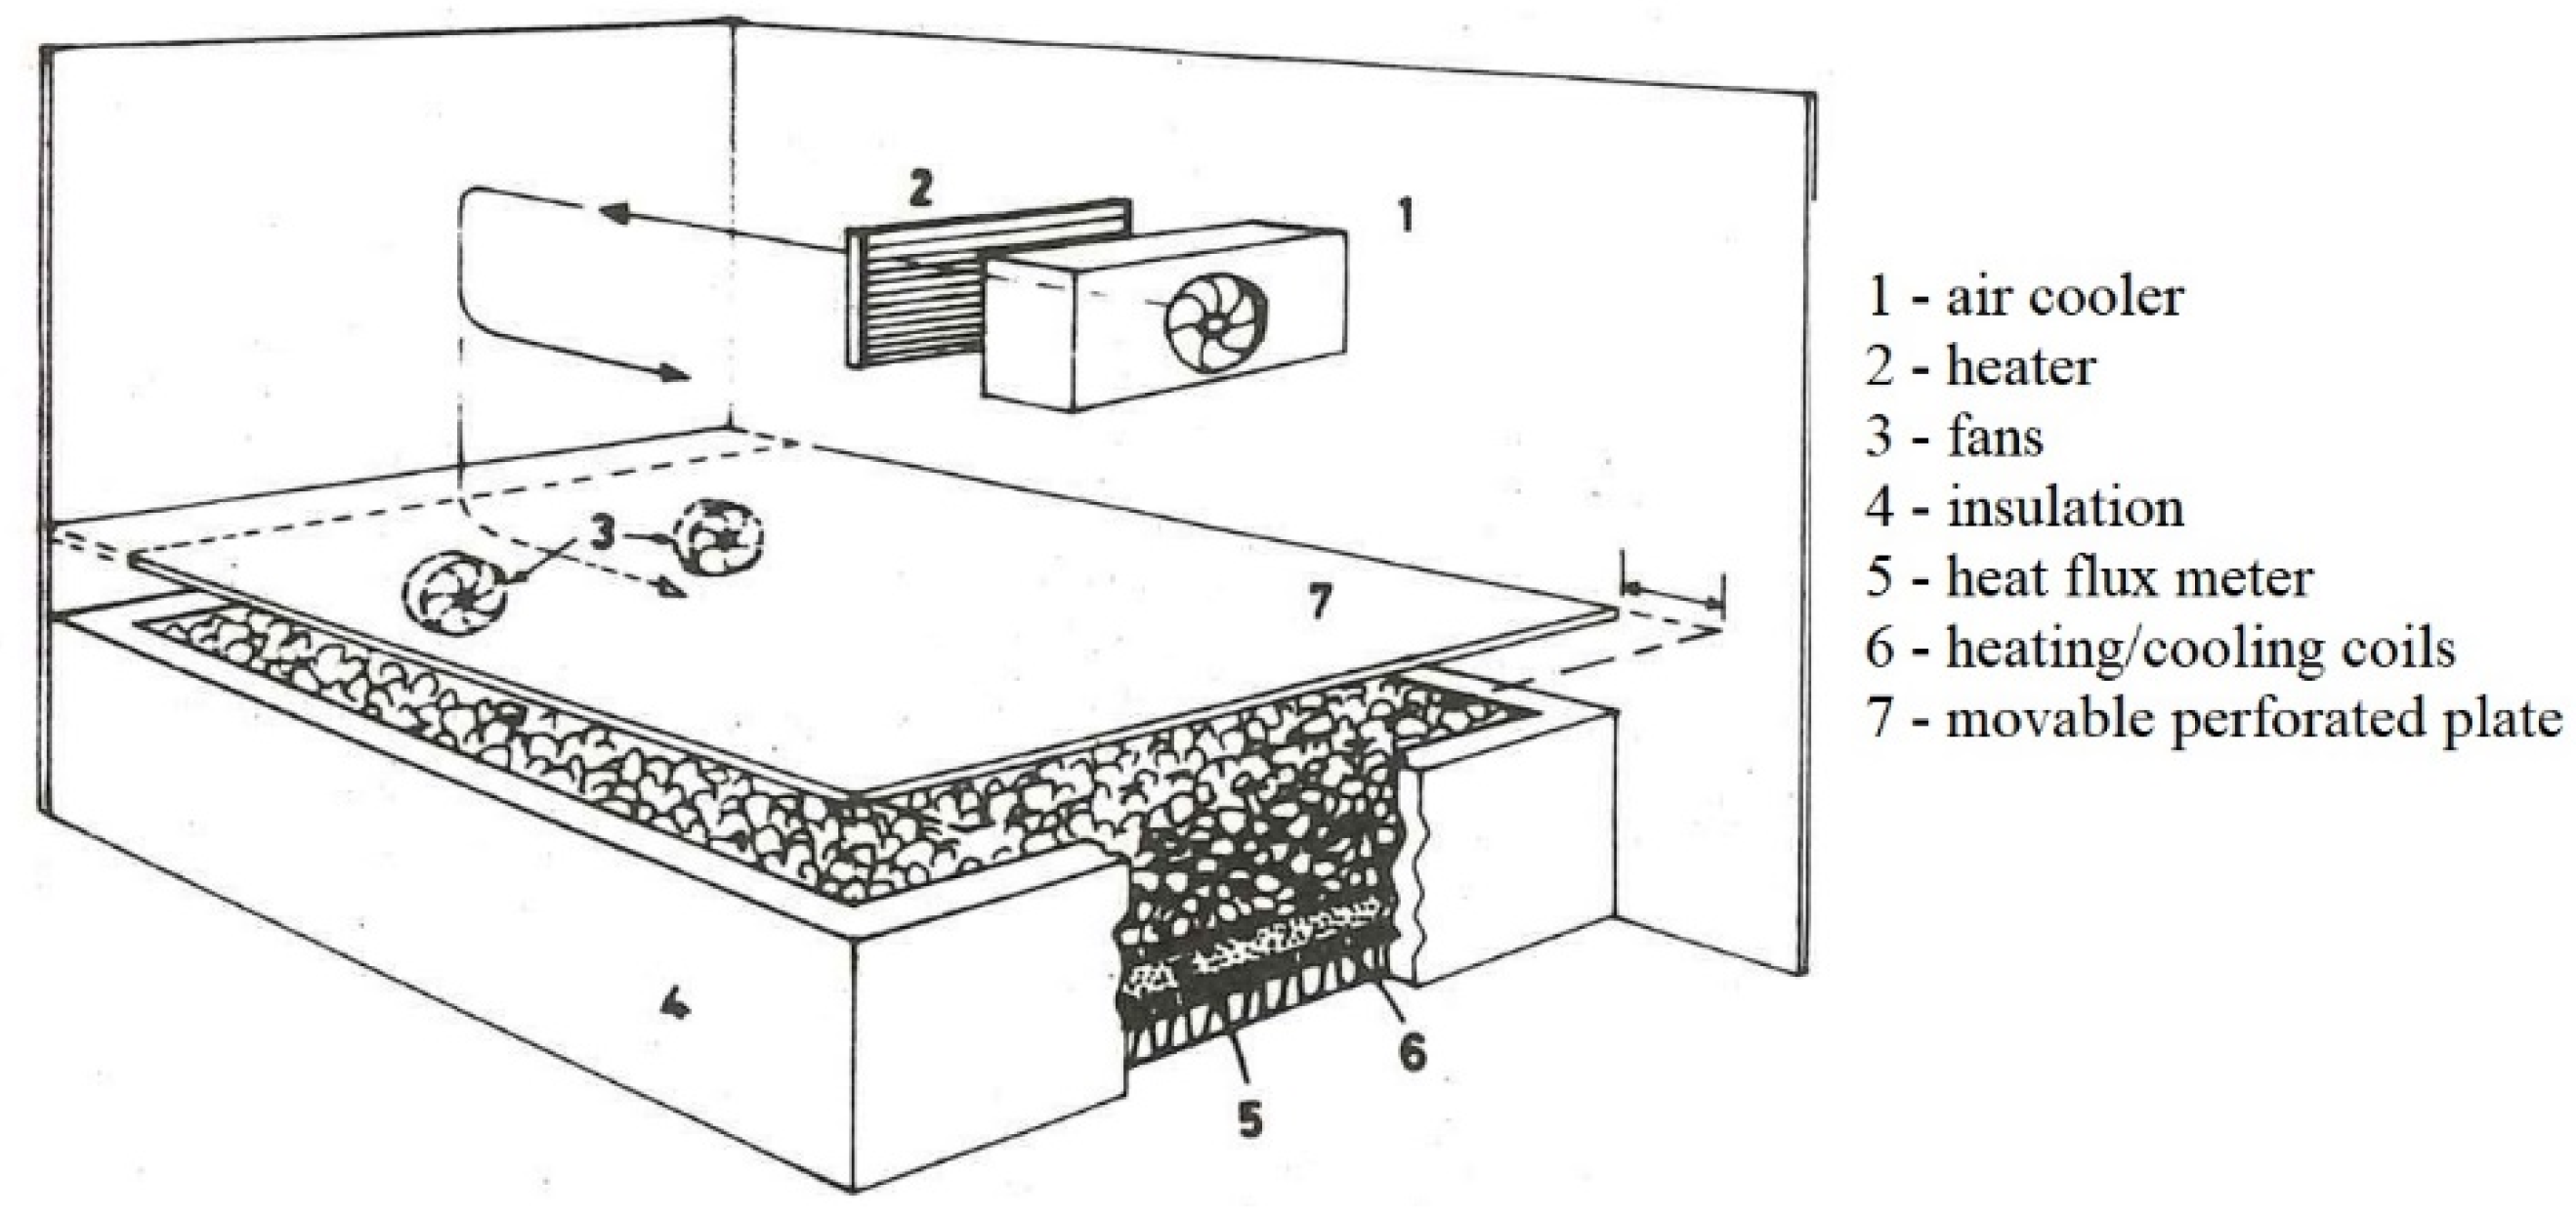
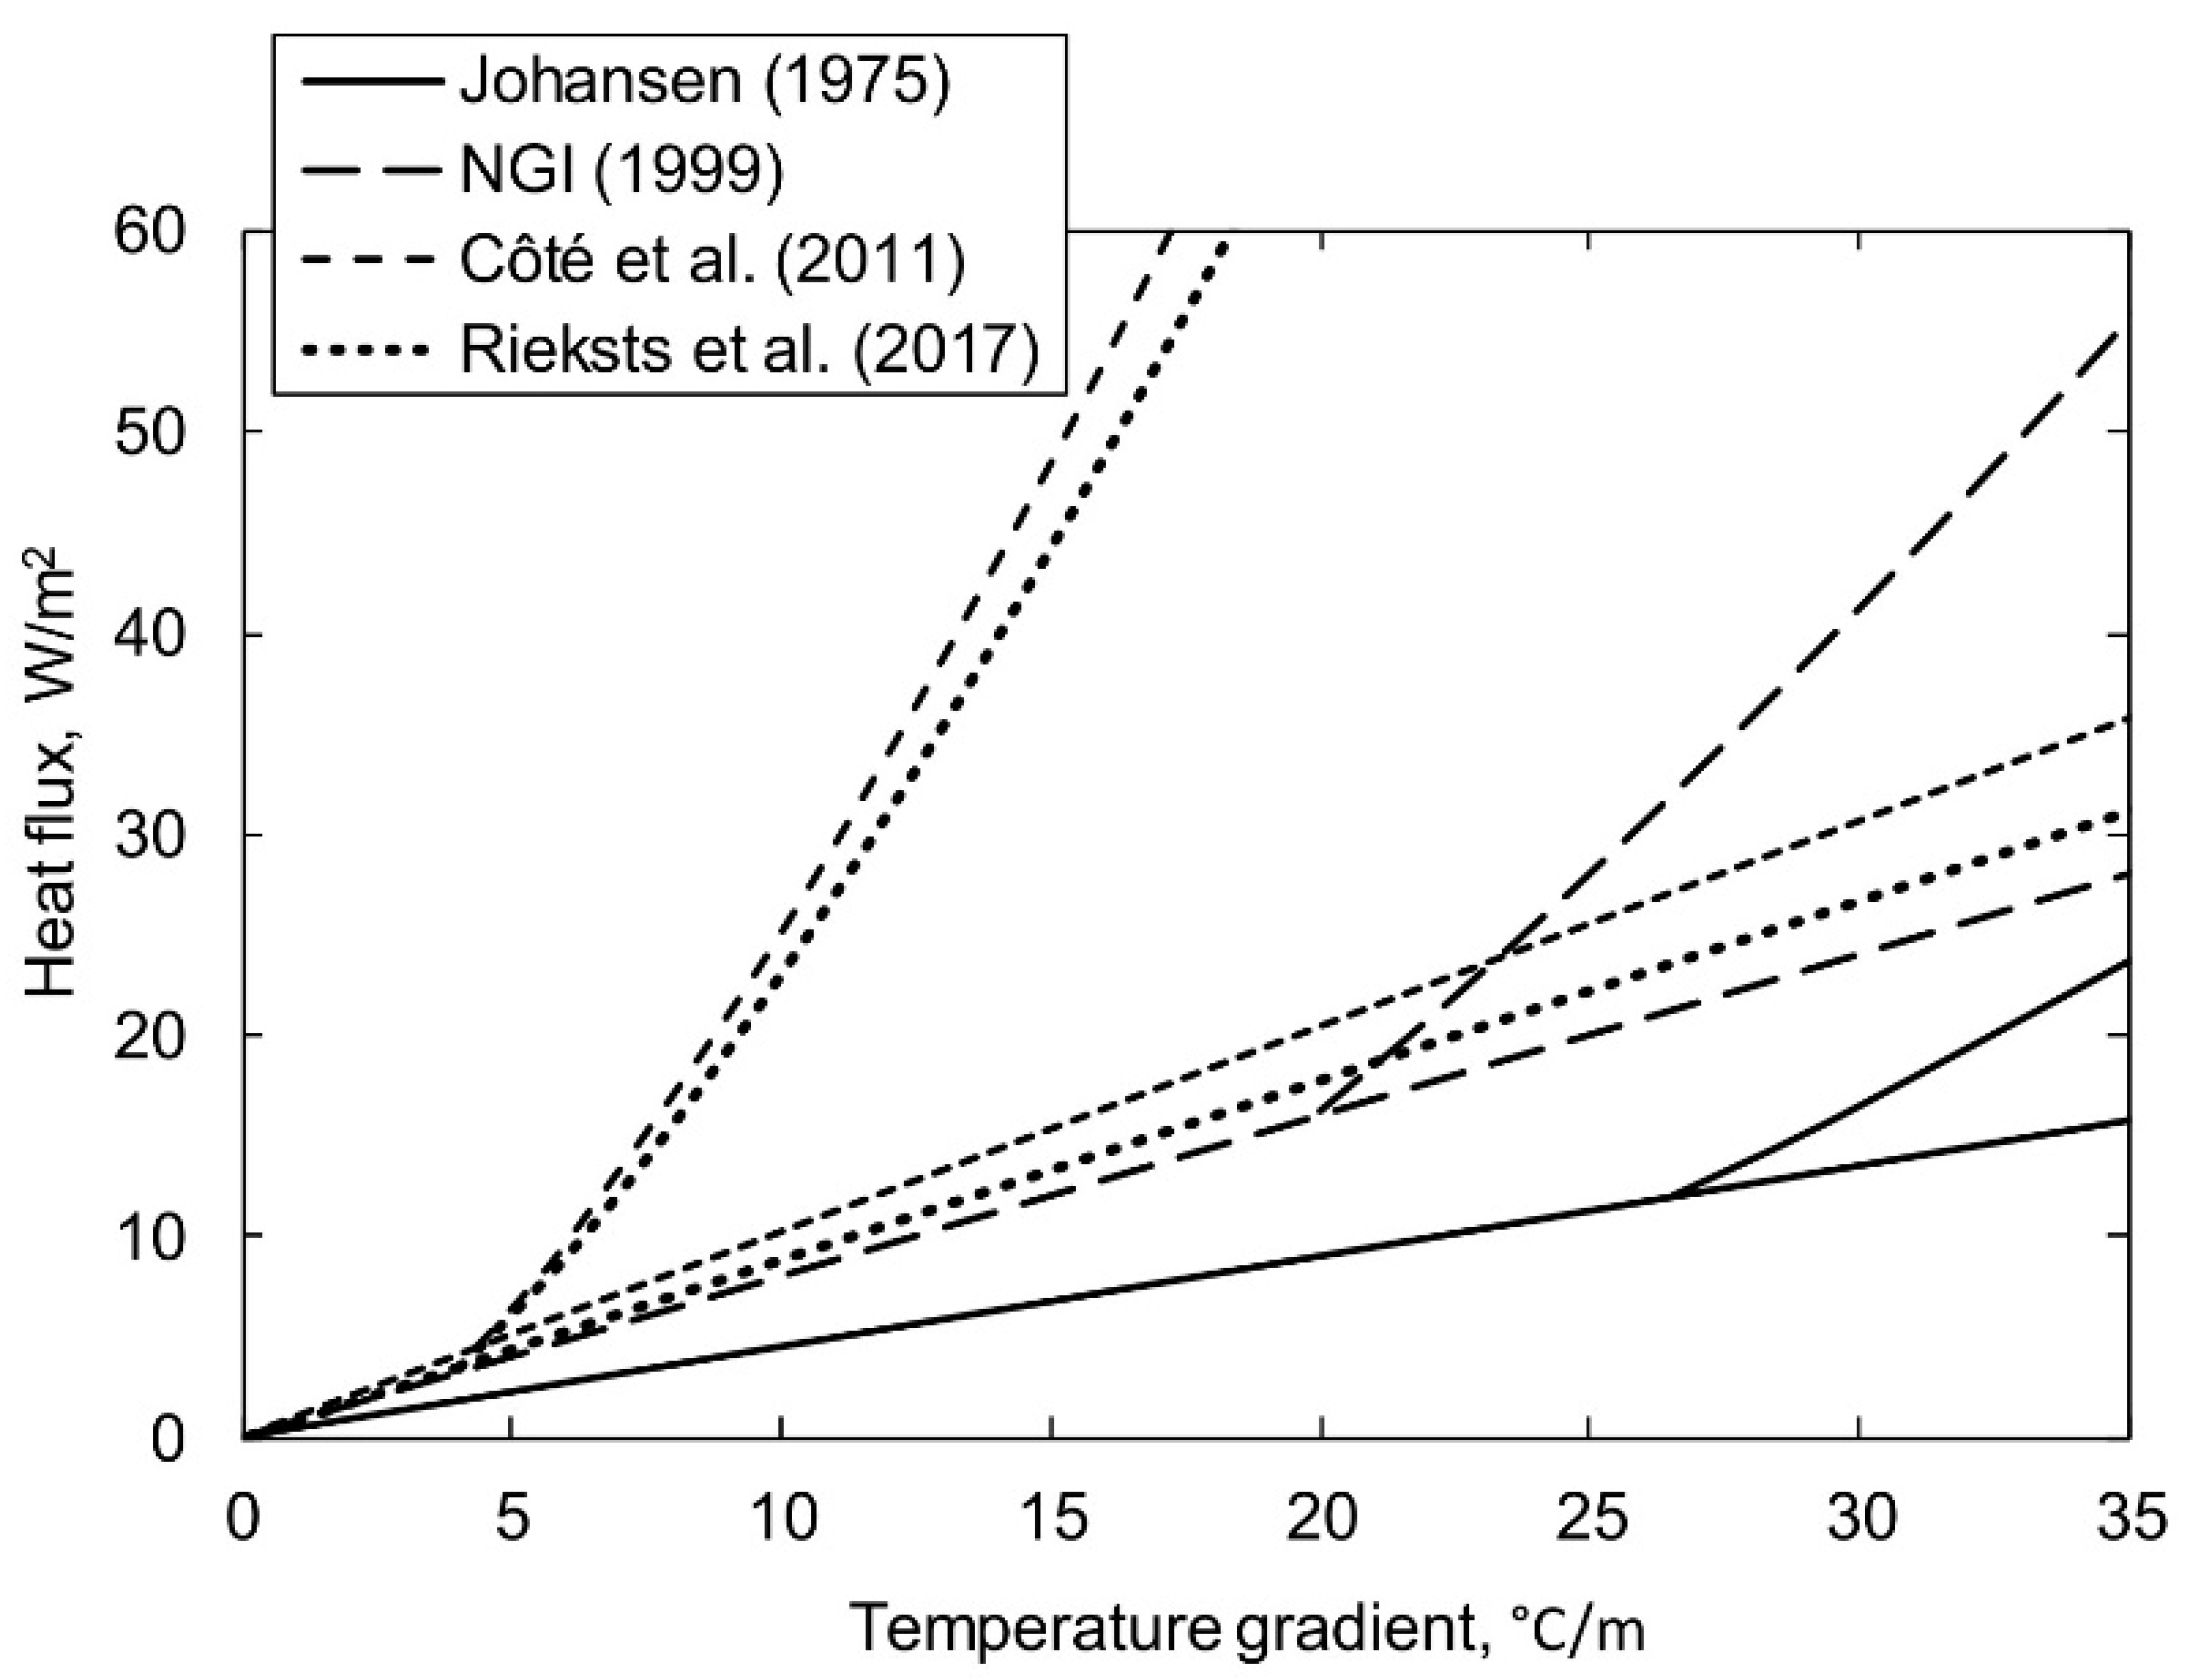
4.1. Experiments by Johansen (1975)

Johansen’s (1975) [2] experiments were conducted at the Norwegian University of Science and Technology (NTNU). While the majority of Johansen’s doctoral thesis was concerned with the thermal conductivity of soils, a minor part was dedicated to other modes of heat transfer in soils. Among these, air convection was tested in laboratory experiments under both free and forced conditions. Johansen’s work on this phenomenon has been used as the basis of studies discussed later in this paper.
Figure 5 shows the geometry of Johansen’s (1975) large-scale experimental test setup. The internal size of the heat transfer cell was 1.8 m in width and 2.2 m in length and allowed the testing of a 0.48 m thick layer of crushed-rock material. The vertical heat flow was measured using 9 heat flow gauges placed below the sample and the temperature profile was measured in 7 horizontal planes spaced 8 cm apart. Each cut contained 22 temperature sensors. The experimental setup for forced convection tests is displayed in Figure 5. The same setup without the fans was used for the natural air convection tests.
The material tested was crushed rock with particle sizes ranging from 20 to 80 mm. The material was loosely packed, resulting in a dry density of 1500 kg/m3 and porosity of 0.44. In total, the sample was subjected to nine different temperature gradients for upward heat flow (convection) conditions. The upper boundary condition was set by the room temperature, while the lower boundary was controlled by fluid circulating in a plate heat exchanger. Only four tests were performed with an impermeable upper boundary (closed system); in the other five tests the upper surface was held open, exposing the air flow to room conditions (open system).
Johansen’s (1975) [2] analysis of the experimental data was limited to calculation of the Ra and Nu numbers. Johansen (1975) [2] calculated the Rayleigh numbers for both exposed and covered surface conditions and defined the critical Ra numbers. The intrinsic permeability values were approximated using the Kozeny–Carman equation (Equation (8)), as when the study was conducted no analytical Nu–Ra relationship such as that proposed by Schubert and Straus (1979) [9] was available. Therefore no additional analysis of the intrinsic permeability of coarse materials was possible for Johansen (1975) [2]. Although the experiments on natural convection were limited to just one test sample, Johansen (1975) was able to show the importance of this heat transfer in coarse materials and later defined the limits of convection in terms of material properties such as Sr and d10 [2].

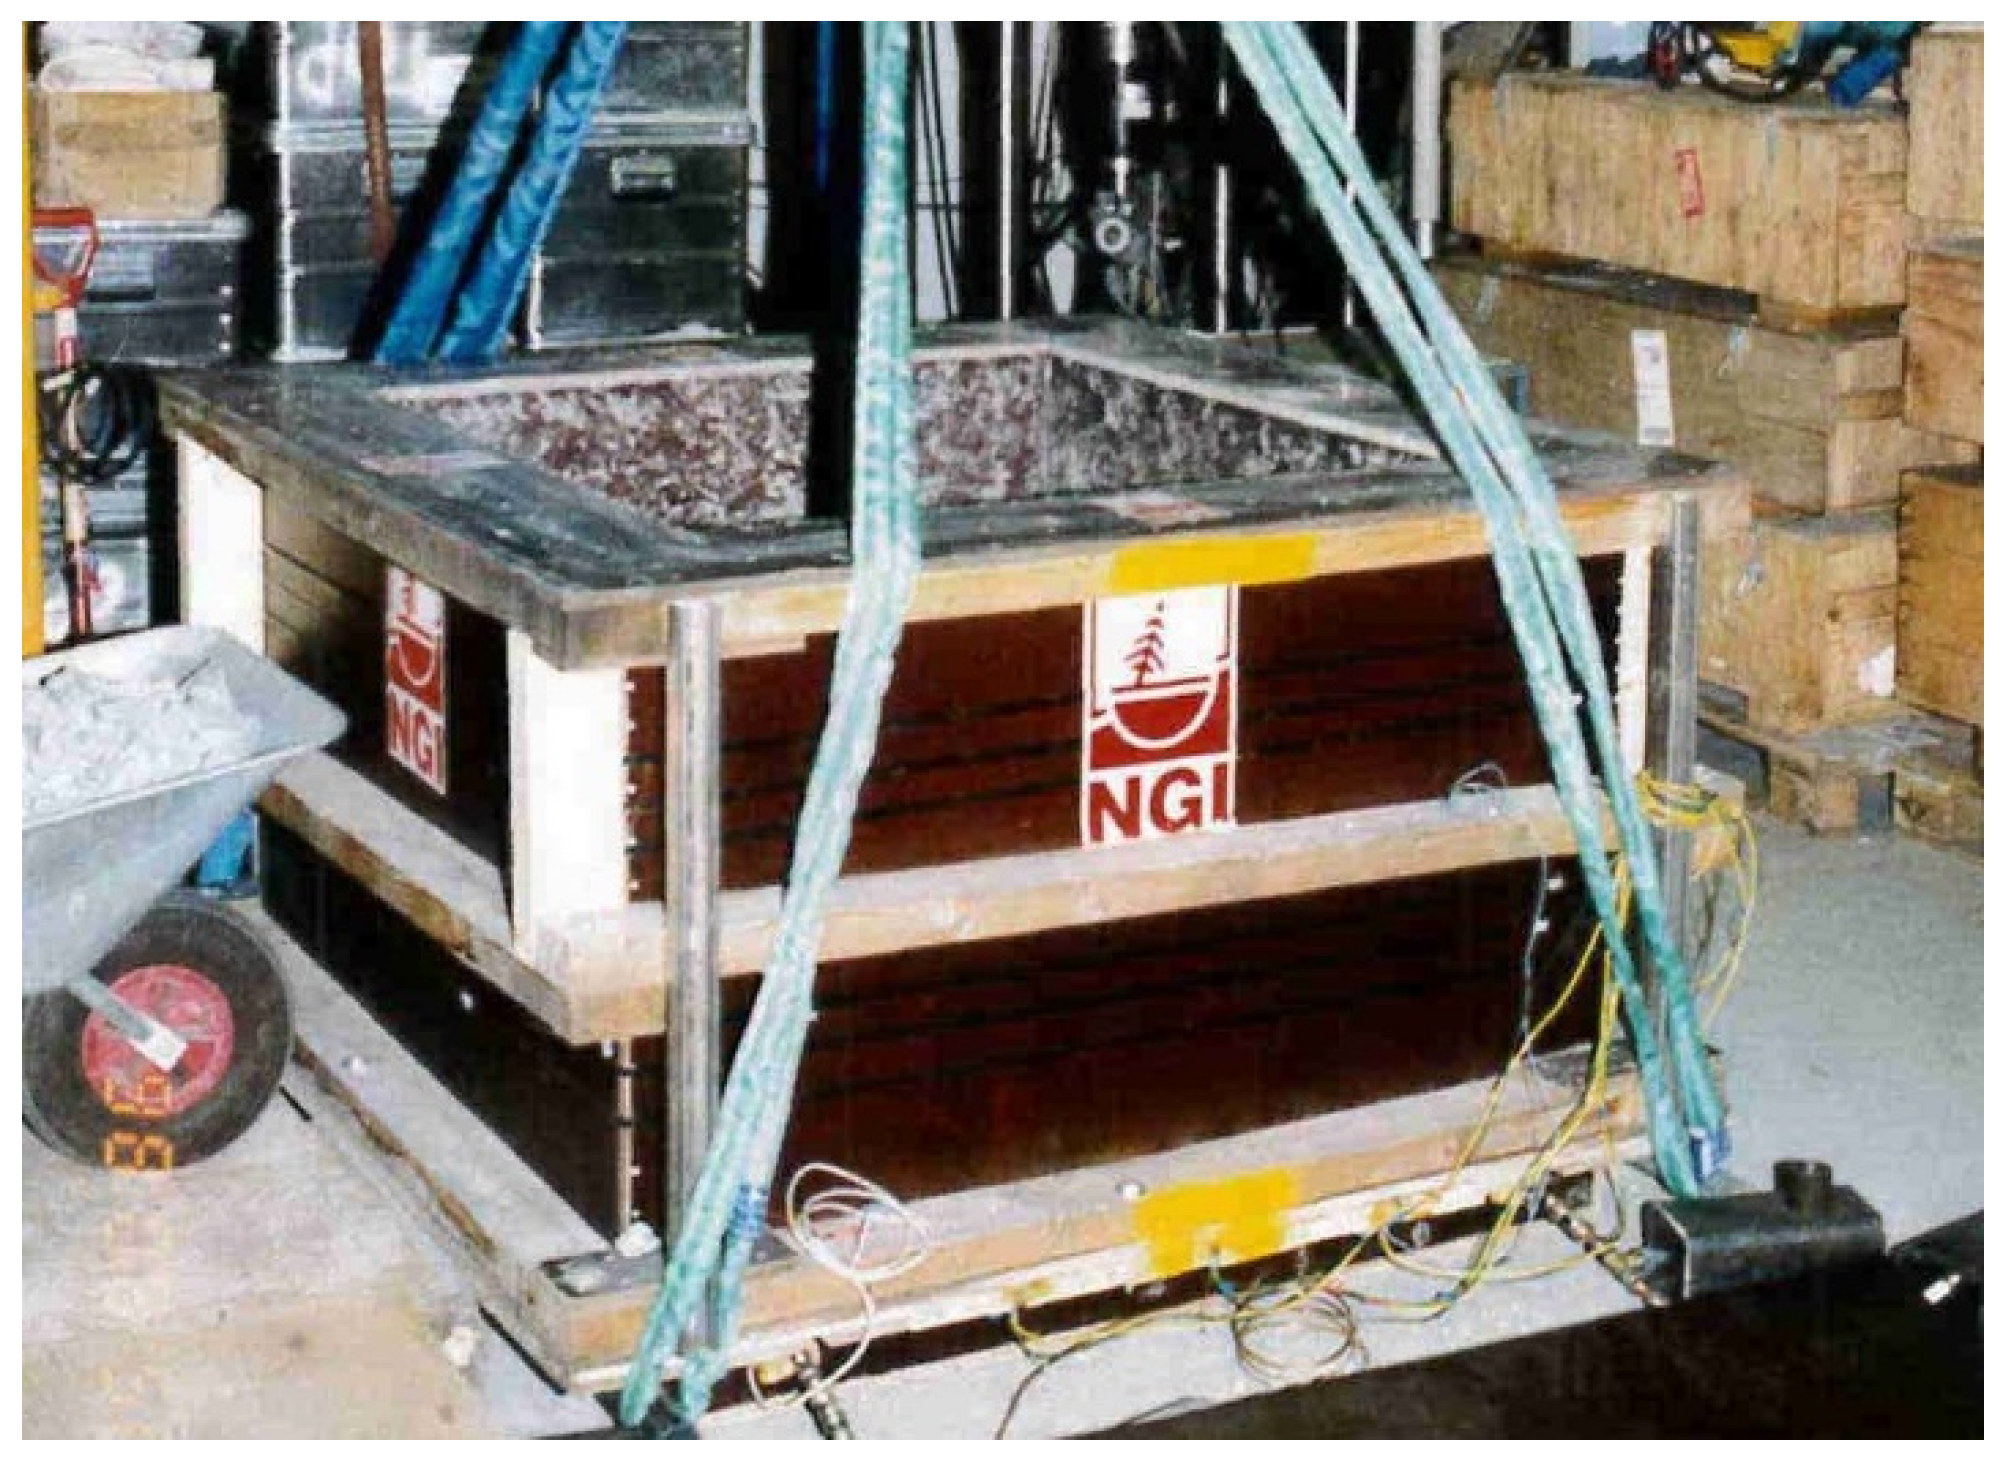
4.2. Experiments by the Norwegian Geotechnical Institute (NGI)

During the winter of 1995/96 frost heave problems occurred on some newly built railway lines in the south of Norway. The Norwegian Railway Administration formed a research group to investigate the problem. The Norwegian Geotechnical Institute (NGI) had a mandate to conduct a study on thermal conductivity on various crushed rock materials. Their findings are reported in NGI (1996) [28,29,30]. During the winter of 1996/97 frost heave problems occurred again on some parts of the railway lines. The NGI’s general conclusion was that heat loss during the winter and the freezing of frost-susceptible soils had been driven by coupled heat and mass transfer (conduction and natural convection) in coarse open-graded materials.
The NGI was assigned to further investigate heat transfer mechanisms in coarse crushed materials. The outcome of this substantial study has been published in numerous reports. Report 982519-1 [14] summarizes the laboratory investigations into natural convection in coarse crushed rock materials and the reported data are analyzed in this paper.
Figure 6, below, shows the experimental heat transfer cell, while Figure 7 shows a vertical cross section. The specimen tested had a horizontal area of 1 × 1 m and a height of 0.75 m. The top and bottom heat exchange plates were equipped with fluid-circulating tubes to create cold temperatures (temperature boundary condition) and an electrical heating (heat flux boundary condition) cable to create high temperatures. Electrical input was accurately monitored during the tests to allow calculation of the total heat input. This gave the average value of the heat flux for the whole horizontal cross section of the sample. The test sample was equipped with 8 thermistors, placed in pairs and spaced 0.25 m apart from the bottom to the top and all located 5 cm from the center line. The report provides the average values of each pair of thermistors.
The NGI study used three different crushed rock materials: (i) ballast material 25–63 mm; (ii) crushed rock 20–120 mm; (iii) blasted rock 0–250 mm. Figure 8 shows the gradations of all three materials used and shows that the 0–250 material has a well-graded particle distribution.
Table 1 gives the approximate values of effective particle size (d10) and mean particle size (d50) obtained from the gradation curves.
The study found that the 0–250 mm material did not allow for convection heat transfer under the temperature gradients at which it was tested. This agrees with Johansen’s (1975) [2] findings that the d10 value was considerably lower than the theoretical limit (10 mm). The other two materials had a d10 value higher than the limit suggested by Johansen (1975) [2] and were therefore found prone to convective heat transfer at relatively low temperature gradients. Laboratory measurements of these two materials are presented in the results section.

4.3. Experiments by Côté et al. (2011)

One of the most recent experimental studies and analyses of its kind was conducted by Côté et al. (2011) [6] at Laval University in Quebec City, QC, Canada. It was carried out to evaluate the heat transfer mechanisms involved in undesired artificial formation of permafrost conditions in rock-fill embankment dams. It is worth mentioning that Côté et al. (2011) [6] largely based their research on those of Johansen (1975) [2] and the NGI (1999) [21], emphasizing the importance of continuity and development of the particular domain of heat and mass transfer in coarse particulate media.
Compared to the previous studies, the heat transfer cell built by Côté et al. (2011) [6] had few improvements. First, the dimensions of the sample were almost cubical with a 1 × 1 m horizontal area and a height of 0.94 m. These proportions were found reasonable to allow the use the analytical Nu–Ra number relationship proposed by Schubert and Straus (1979) [9] to establish intrinsic permeability based on the experimental data. Second, as in Johansen’s (1975) [2] test setup, but unlike the NGI setup, it was solely temperature-controlled at the top and bottom using fluid-circulating heat exchange plates. Third, it had four heat flux sensors each measuring 0.4 × 0.4 m at the top of the sample covering 65% of sample’s top surface area. Fourth, the temperature profiles were measured using five vertical thermistor strings, with one placed in the center of the sample and the other four placed 0.1 m from each of the vertical faces. Finally, the heat transfer cell was also equipped with a line heat source at one of the bottom edges, allowing initiation of convection in the desired direction. All of this allowed the shape and direction of the convective cell to be initiated and validated, and monitoring of the heat transfer rates and temperature gradients at various locations.
The materials used by Côté et al. (2011) [6] were natural granite cobbles with particle sizes ranging from 75 to 205 mm. Four different samples were prepared with the corresponding d10 values of 0.092, 0.100, 0.128 and 0.150 m. The particle gradation of all four samples is shown in Figure 9. Porosity ranged from 0.37 to 0.41. The variation of d10 was expected to influence the rate of the experimental convective heat transfer and subsequently the value of the back-analyzed intrinsic permeability.
Figure 10 shows the sample preparation phase for the study by Côté et al. (2011) [6] and Fillion et al. (2011) [7].

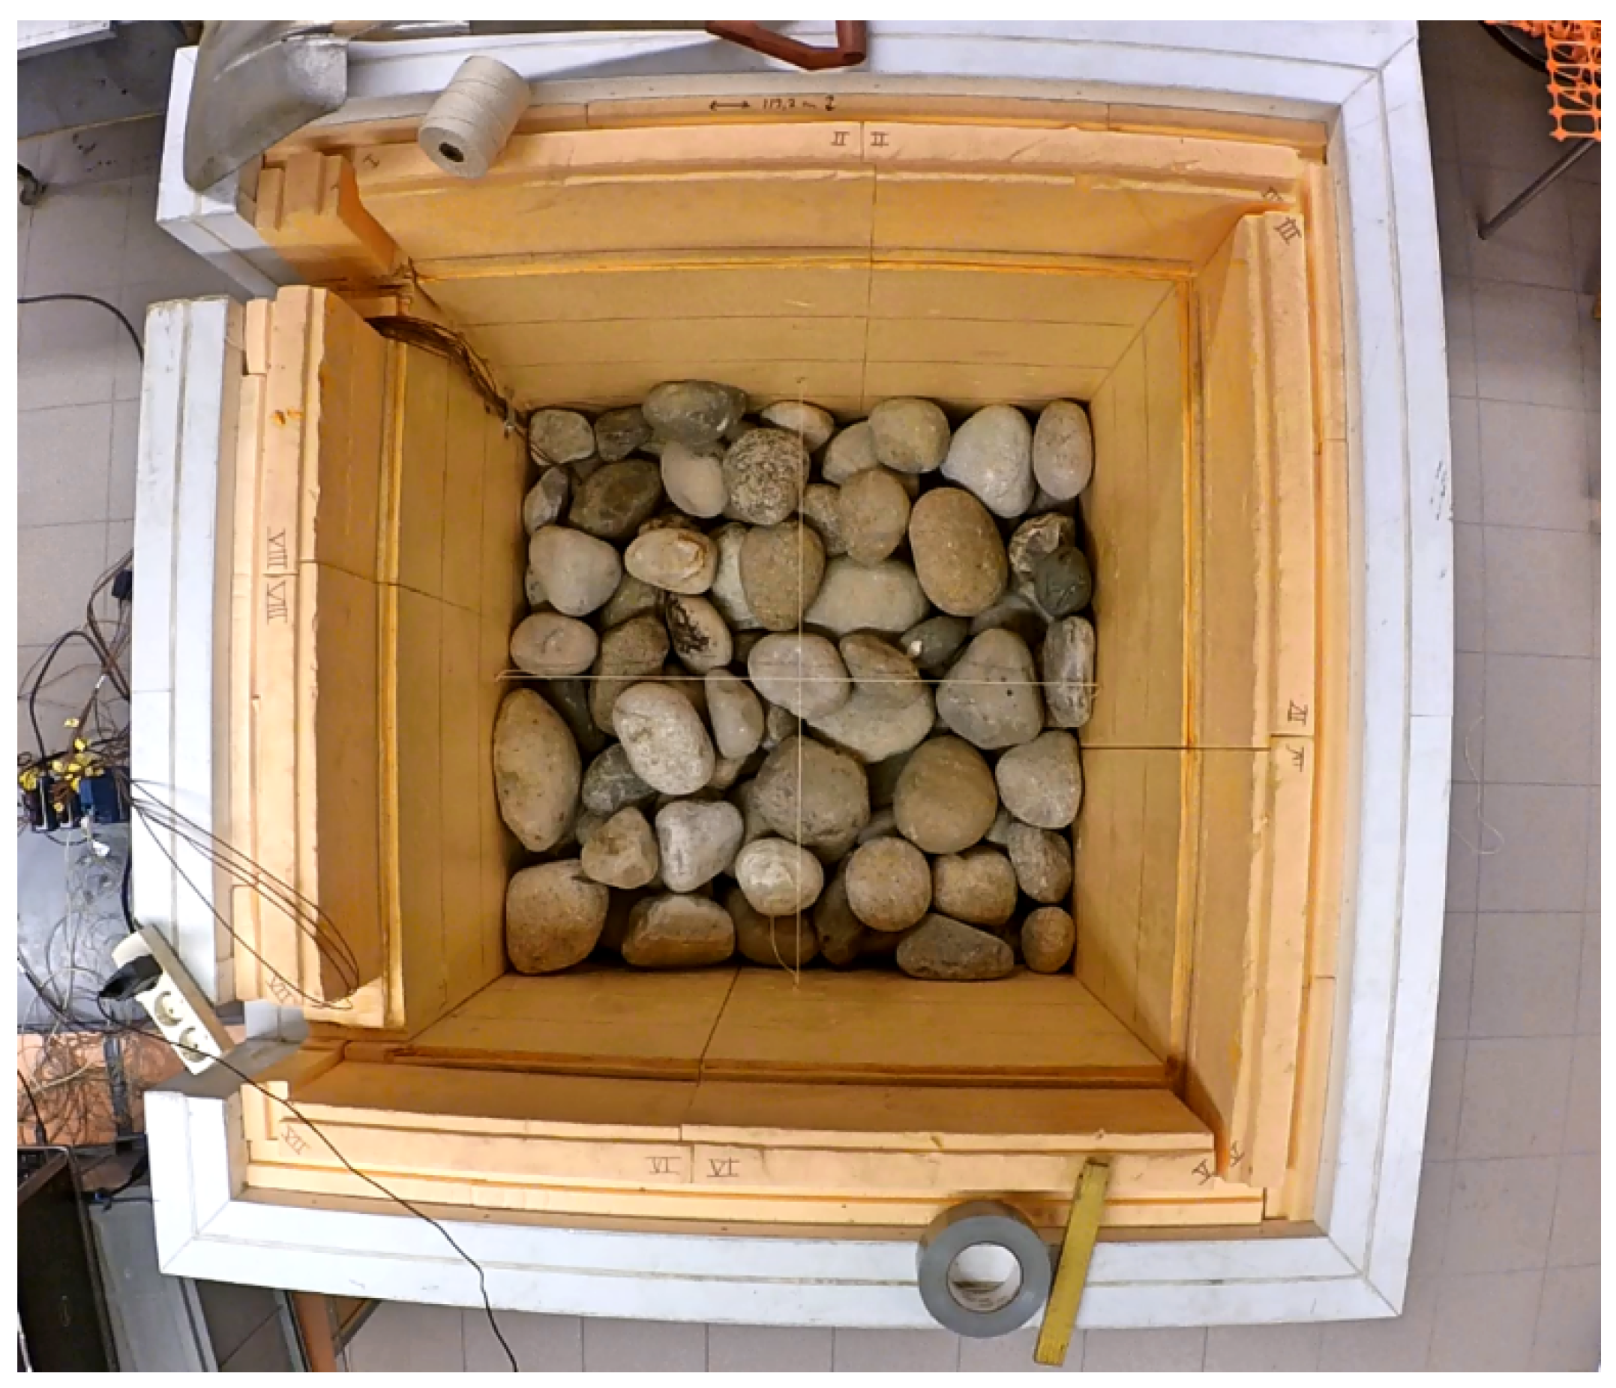
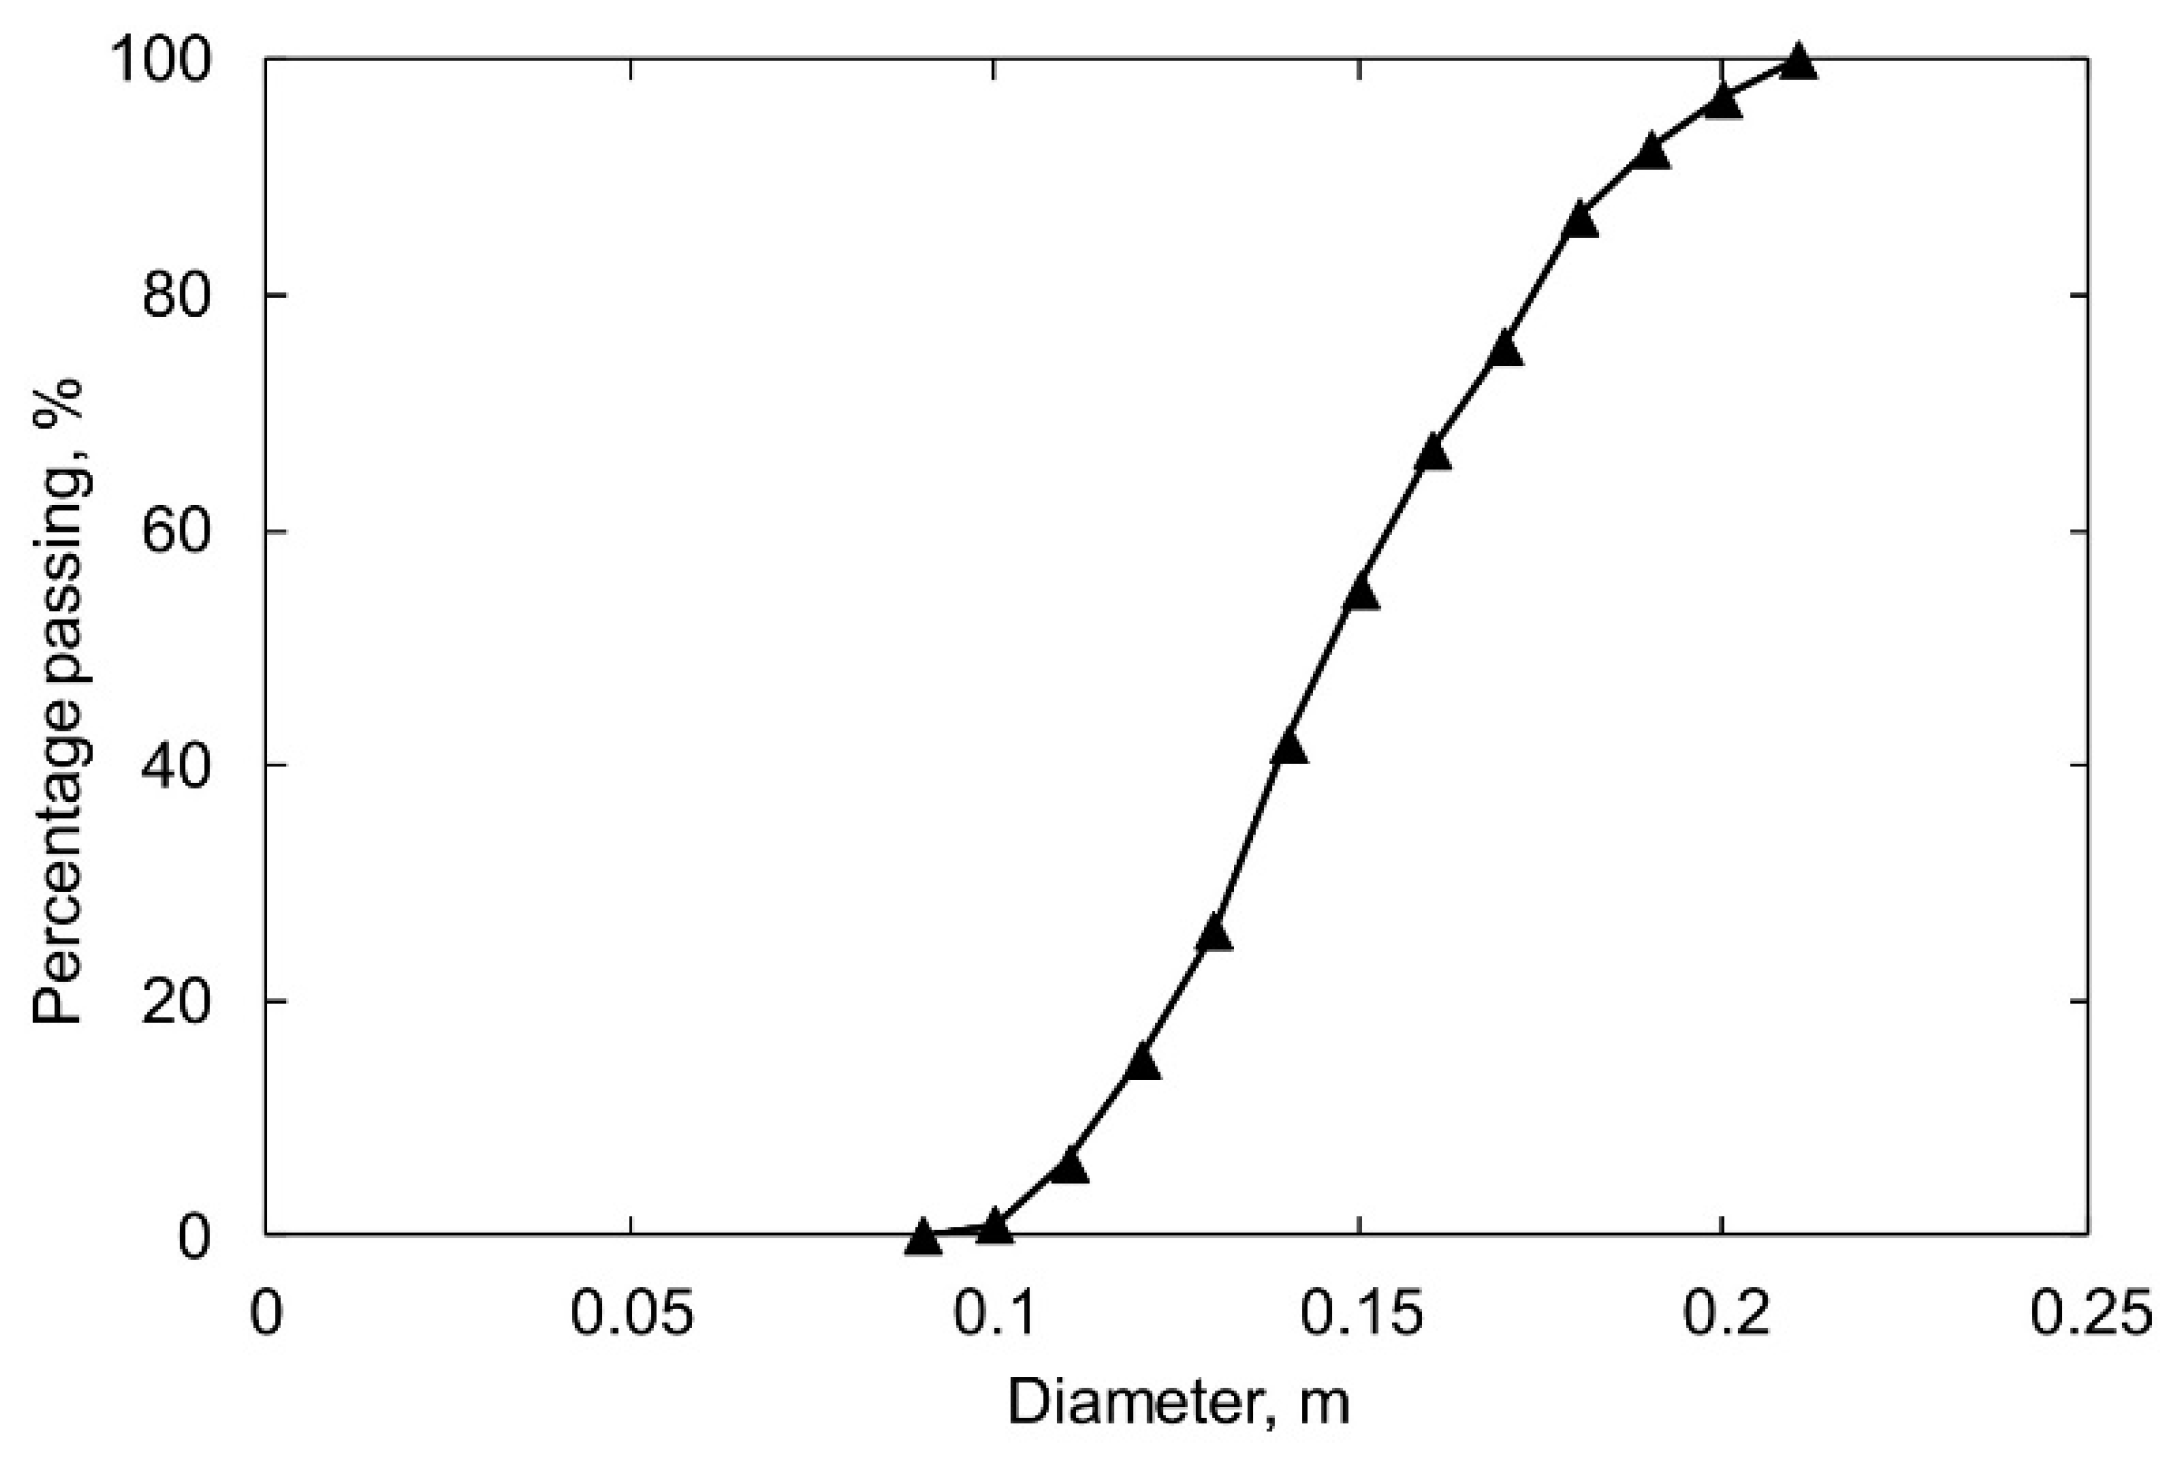
4.4. Experiments by Rieksts et al. (2017)

The latest study investigating natural air convection in coarse open-graded aggregates under laboratory conditions was conducted at the Norwegian University of Science and Technology (NTNU). The main objective of these laboratory experiments was to test road construction materials (crushed rock and lightweight aggregates) for their convective heat transfer characteristics. The study used a large-scale heat transfer cell designed based on that used by Côté et al. (2011) [6]. The vertical and horizontal cross sections of the experimental setup are shown in Figure 11. To increase the general accuracy, the heat transfer cell was equipped with nine heat flux plates, each measuring 0.3 × 0.3 m, allowing for a detailed characterization of overall convective heat flow. Figure 12 shows the heat flux sensors placed between two Plexiglas sheets.
To increase the general accuracy, the heat transfer cell was equipped with nine heat flux plates, each measuring 0.3 × 0.3 m, allowing for a detailed characterization of overall convective heat flow. Figure 12 shows the heat flux sensors placed between two Plexiglas sheets. Vertical temperature gradients throughout the sample were measured using thermocouples placed in levels by five thermocouples per level and spaced 0.16–0.17 m apart. At each level one thermocouple was located in the center of the sample and the other four were located about 0.16–0.17 m from each inner wall. The thermocouples were located below the midpoint of the heat flux sensor above (see Figure 12).
The study conducted at NTNU was carried out in three phases. The first phase included a test using pure sand for validation of conductive heat transfer. The second phase was the validation of convective heat transfer, the results of which are reported in Rieksts et al. (2017) [27]. Figure 13 shows the heat transfer cell partially filled with natural cobbles of 0.09–0.21 m particle diameter, with a d10 of 0.12 m and a porosity of 0.36. The general objective of this validation was to compare the results with the those obtained by Côté et al. (2011) [6].
Figure 14 shows the gradation of cobbles assessed by weighing the cobles and computing the equivalent sphere sizes.
After the first two initial phases to validate the experimental setup, the study continued with tests using road construction materials. The results of the third phase are reported in Rieksts et al. (2020) [31]. These tests included crushed rock materials with particle gradations of 20/120, 40/120 and 20/250 mm.

4.5. Summary of Experimental Setup Overviewed

The four different test setups reviewed in this paper mainly vary in their physical dimensions, boundary condition settings, and the instrumentation used to measure heat flux and temperature distribution. Table 2 gives a summary of the general characteristics of all four test setups.

5. Establishment of Intrinsic Permeability from Experimental Convection Results

5.1. Study by Côté et al. (2011)

One of the main objectives of Côté et al.’s (2011) [6] experimental study was to develop and validate a new method for determining intrinsic permeability, as described in detail in Section 3 above.
Figure 15 shows a q-∇T plot of experimental data on the coarsest material with a d10 value of 0.15 m. Two different specimens of the same material were tested to validate repeatability. As shown in the figure, the data points for upward heat flow in both tests lie fairly closely along the same line. Interpolation of the experimental data shows that the critical upward thermal gradient to initiate convection would be a little higher than 4 °C/m.
All the tests on different samples and different thermal gradients were conducted at an average sample temperature of 20°C, for which the parameters C, β and ν were set to 1211 J/m3°C, 0.00343 1/°C and 1.5 × 10⁻⁵ m2/s respectively. For the data shown in Figure 15, with downward thermal gradients ranging from 3 to 23 W/m2, it was possible to establish that the equivalent thermal conductivity was equal to 1.02 W/m°C (see slope of the dotted line), while the upward thermal gradients ranging from 7 to 15 °C/m allowed the establishment of the intrinsic permeability at a value of 3.9 × 10⁻⁶ m2, as obtained using Equation (11). Table 3 summarizes the sample characteristics, experimental results, and values of the established intrinsic permeability of the materials tested by Côté et al. (2011) [6]. The values in Table 3 show that, for a porosity in the same range, the intrinsic permeability increases with increasing d10, which is in agreement with Carman (1956) [18] and Chapuis’s (2004) formulations [20].

5.2. Reanalysis of Johansen’s (1975) Data by Côté et al. (2011)

To further validate the intrinsic permeability model, Côté et al. (2011) [6] re-analyzed Johansen’s (1975) [2] experimental data. Figure 16 shows a q- T plot of the experimental data obtained by Johansen (1975) [2] as represented by Côté et al. (2011) [6]. As the figure shows, the lowest value of heat flux for upward heat movement is in the region of the temperature gradient at which convection is not initiated. In this case the value of Nu is not higher than 1. These results clearly show the extent of natural convection in coarse materials, as well as its contribution to the overall heat transfer rate.
To establish intrinsic permeability, Côté et al. (2011) [6] used C, β and ν values of 1345 J/m3°C, 0.00385 1/°C and 1.23 × 10⁻⁵ m2/s respectively. These values refer to the average testing temperature of −13.5 °C. Effective thermal conductivity as measured and reported by Johansen (1975) [2] was 0.45 W/m°C. Table 4 summarizes sample characteristics, experimental results and the established K value. The dashed line in Figure 16 shows the best fit of K using Equation (11). As reported by Côté et al. (2011) [6] the best-fit value of K is equal to 0.71 × 10⁻⁶ m2. This value is fairly close to that used by Johansen (1975) [2] using Equation (8). The established K value also emphasizes the effect of decreased value of d10. The porosity of the material used by Johansen (1975) [2] was in the same range as that of the materials used by Côté et al. (2011) [6]. However, the d10 of the material used by Johansen (1975) was considerably lower, resulting in a lower permeability, resulting in a higher critical temperature to initiate air convection (26°C/m in Figure 16 with a d10 of 0.03 compared to 4°C/m in Figure 15 with a d10 of 0.15 m).
Johansen (1975) [2] provided limited data on the formation of his convection cell. The width and depth of the heat transfer cell were several times greater than its height, and hence it is very likely that multiple convection cells formed within the test sample. The method proposed by Côté et al. (2011) [6] employs a Nu–Ra relationship for a square enclosure. Therefore one should be critical of the intrinsic permeability value obtained using Equation (11).

5.3. Studies by Rieksts et al. (2017, 2020)

Figure 17 shows the experimental data for upward and downward heat flux as a function of temperature gradient in the validation test case. The study reports that convection was not initiated from face to face as it was in the work by Côté et al. (2011) [6]. Due to the lack of power for the line heat source, convective heat transfer initiated freely. Based on the temperature distribution and heat flux readings it was concluded that the air flow was in a diagonal direction. The convection cell has the upward flow in one corner and the downward heat flow in the diagonally opposite corner. The subsequent tests reported by Rieksts et al. (2020) [31] had much more stable convection initiation. A stronger line heat source was used for these experiments, which successfully initiated convection in a 2-dimensional pattern and remained stable throughout the test.
Table 5 summarizes the material characteristics, experimental results and established K values of the tests reported by Rieksts et al. (2017, 2020) [27,31]. Using Equation (11) to establish K gives a best-fit value of 3.38 × 10⁻⁶ m2. It must be emphasized here that similar to Johansen’s (1975) [2] case, the convection pattern is not in agreement with the conditions in which Schubert and Straus’s (1979) [9] analytical solution should be applied. However, the study showed that the established K value is very close to that of Côté et al.’s (2011) [6] with very similar materials. This test served as the basis for validating convective heat transfer with the equipment used by Rieksts et al. (2017) [27].

5.4. Reanalysis of Experimental Data by NGI (1999) and Goering et al. (2000)

This section presents a full reanalysis of the NGI’s (1999) [21] experimental data using Côté et al.’s (2011) method [6]. Figure 18 shows the experimental data obtained by NGI (1999) [21]. As mentioned before, only the data for 25–63 and 20–120 mm material are presented here, because the 0–250 material did not allow initiation of convection within the temperature gradients made possible by the heat transfer cell. The slope of the solid lines in Figure 18 depict the effective thermal conductivity. As reported by NGI (1999) [21] the ke is 0.80 and 0.85 W/m°C for the 25–65 and 20–120 mm materials respectively. The dashed line is a best-fit curve based on Equation (11) with K the fitting parameter.
Table 6 presents the material characteristics, experimental results and established K values from tests performed by NGI (1999). The best fit K for the 25–63 mm material is established for a mean experimental temperature of 25.9 °C. At this temperature β, C and ν are 0.00335 1/°C, 1189 J/m3°C and 0.000016 m2/s respectively. The best fit of Equation (11) yields a K value of 1.14 × 10⁻⁶ m2. On the other hand, the best fit K for the 20–120 mm material is determined at an average testing temperature of 22.9°C, with values of β, C and ν at this temperature being 0.0039 1/°C, 1201 J/m3°C and 0.000015 m2/s respectively. The best fit of Equation (11) gives a K value of 1.11 × 10⁻⁶ m2.
The NGI’s (1999) [21] tests give limited observations, preventing characterization of the shape and direction of the convection cells, as the setup only provides one mean heat flux value. In addition the temperature gradient was measured only at the centerline. However, in another study, Goering et al. (2000) [4] developed a three-dimensional numerical model based on the NGI’s (1999) [21] laboratory experiments on 25/63 mm material. He found good agreement between the experimental and the numerical results and stated that convective heat transfer in the 25–63 mm material formed as four individual air convection cells. He describes the upward stream as concentrated in the center of the sample, while the downward streams flowed towards each corner of the sample. Yet again, this is a significant deviation from a single-cell convection occurring in a square enclosure. Hence one should be critical of the established K values for these based on the NGI’s (1999) experimental results. In addition, the tests performed by NGI (1999) [21] show some discrepancies and overestimation of effective thermal conductivity, as discussed further in Section 6.2.

6. Discussion

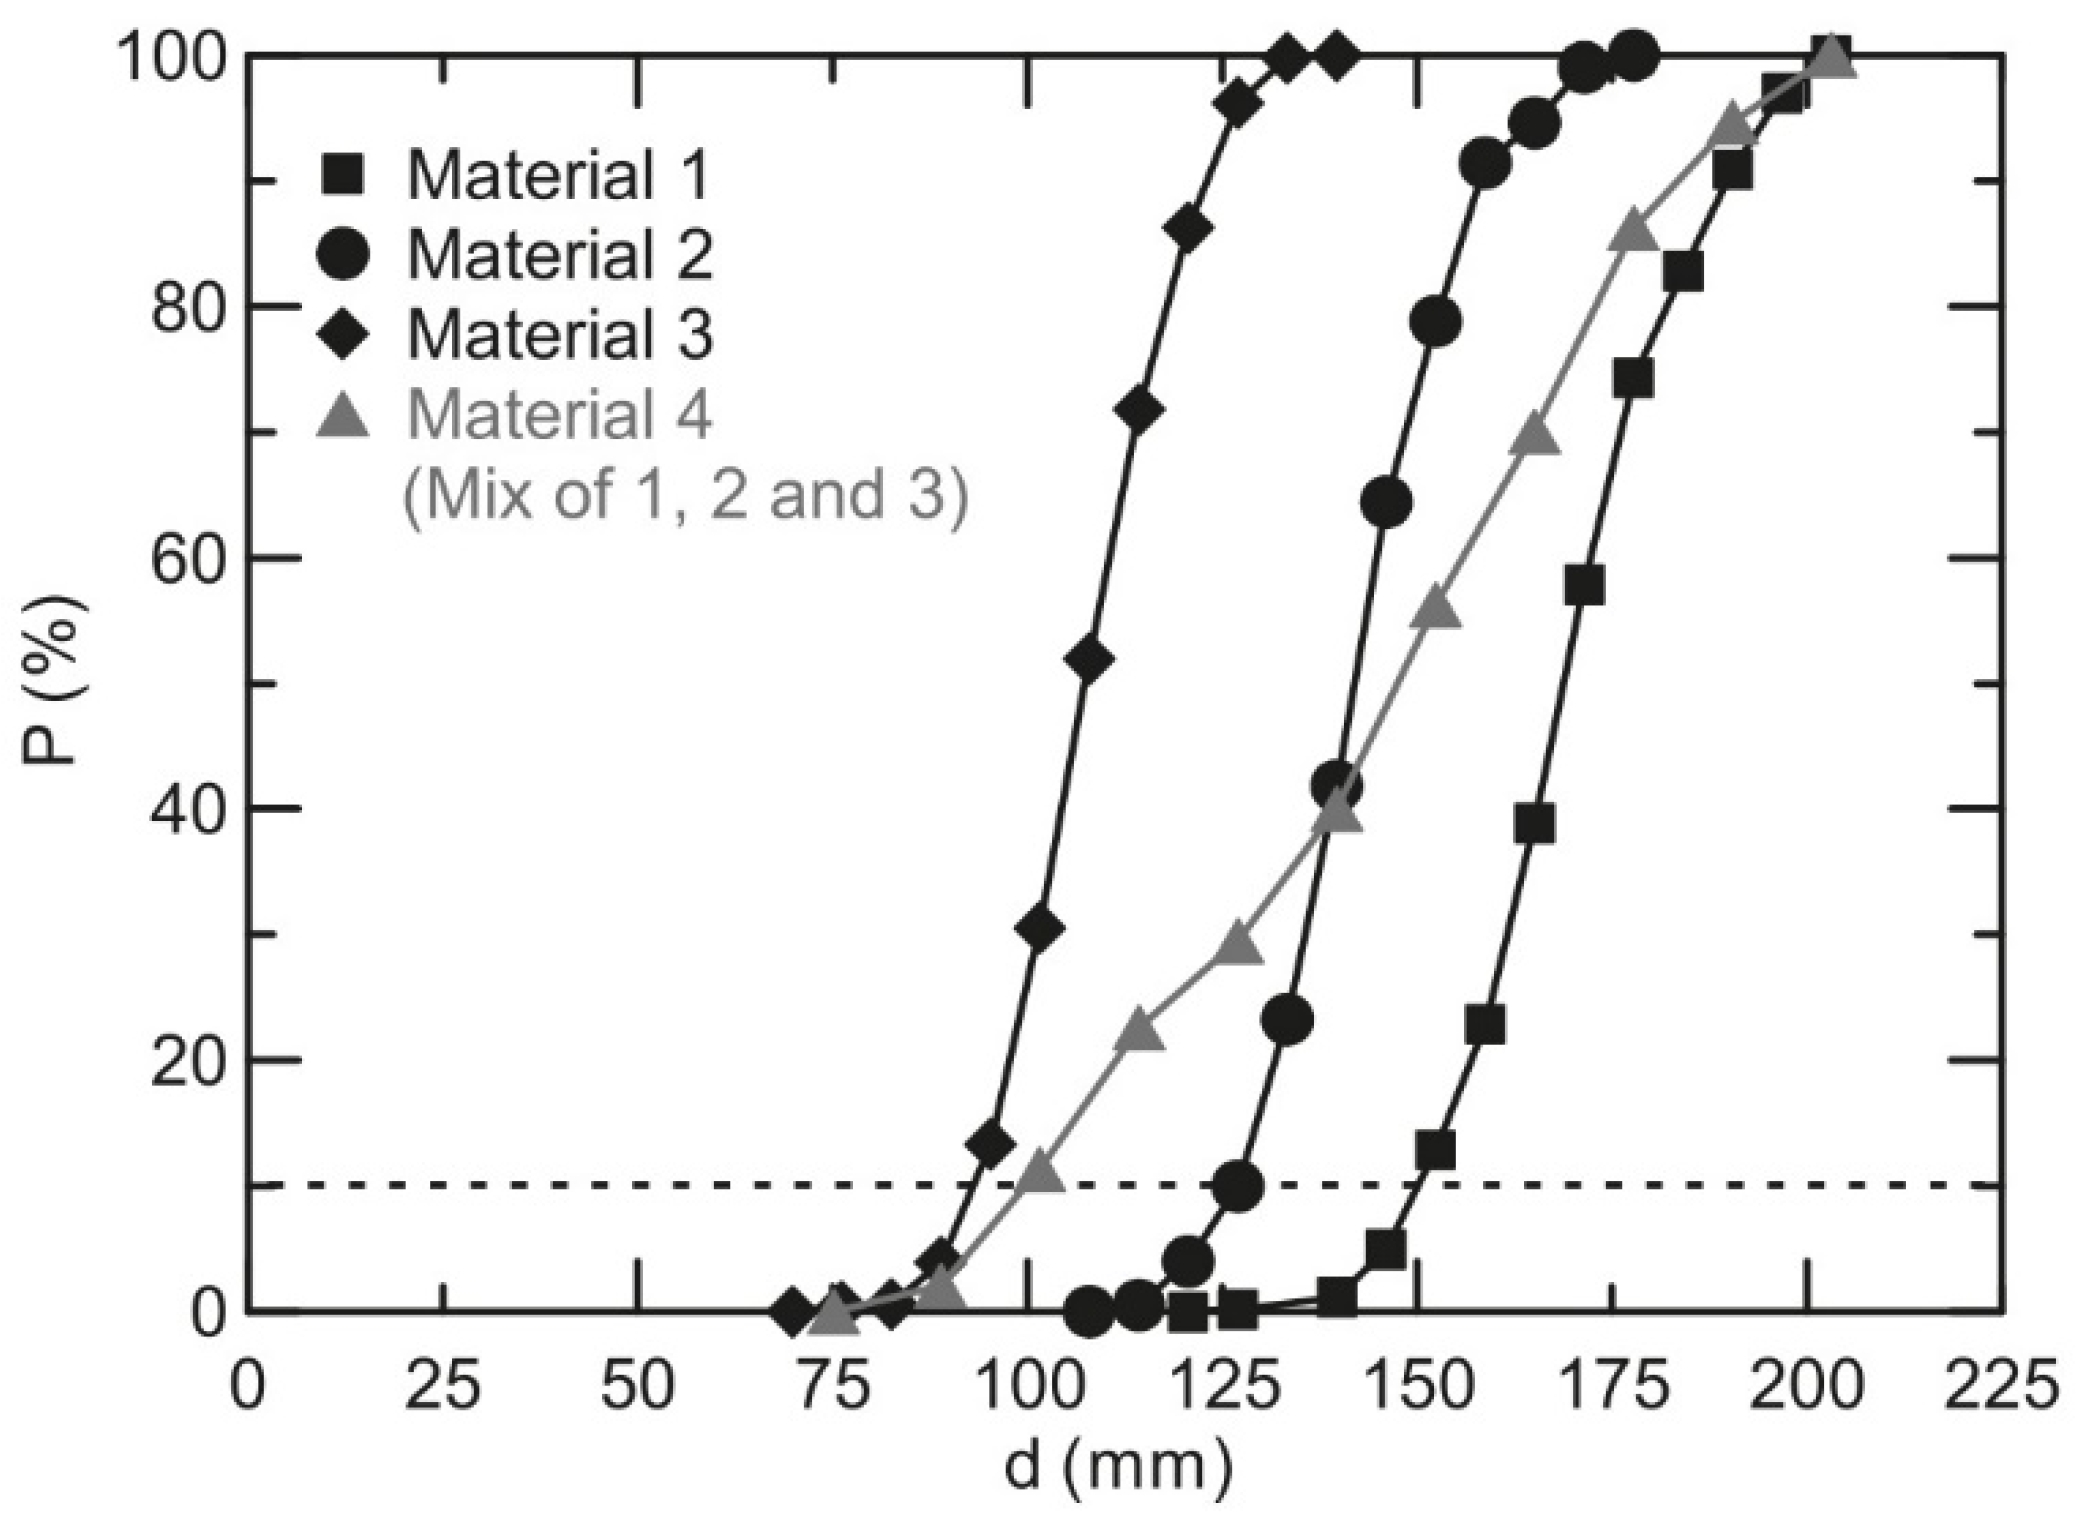
6.1. Effect of Particle Gradation

The data presented and that reanalyzed in Section 5 were obtained from materials with different particle size distributions. Figure 19 shows a plot compiled with selected experimental q-∇T relationships to illustrate a broad spectrum of critical temperature gradients. Table 7 gives a summary of the material characteristics, critical temperature gradients and established K values of different studies. The materials discussed can be generally grouped as: (a) materials with d10 close to or above 0.10 m (cobbles), and (b) materials with d10 equal to or below 0.03 m (crushed rock). The variation in the porosity (0.34 to 0.44) of all the materials is minimal compared to the variation of d10 (0.019 to 0.15). The d10 values are one degree of magnitude higher for the cobbles than for the crushed rock materials discussed in this study. Hence the increased value of d10 (with increasing pore size) will have a much greater impact on the resulting permeability than variations in porosity. This in turn allows for the initiation of convective heat transfer at lower temperature gradients. The effect of d10 can also be seen in theoretical equations (Equations (8) and (9)) where d10 is raised to a higher power than porosity. The comparison in Figure 19 clearly shows the effect of particle size in terms of the critical gradient for the initiation of convective heat transfer. For instance, for the cobbles tested by Côté et al. (2011) [6] and Rieksts et al. (2017) [27] the critical temperature gradient is about 4°C/m, whereas convection in the crushed materials tested by NGI (1999) [21] and Johansen (1975) [2] is initiated only when the temperature gradient exceeds 20°C/m. This agrees with Johansen’s (1975) [2] findings shown in Figure 2. The convective heat transfer becomes predominant and plays a larger part in coupled heat transfer (conduction, convection and radiation), with increasing d10 values. With a constant temperature gradient, convective heat transfer will be higher in material with a larger d10 value.

6.2. Intrinsic Permeability

The values of the experimental intrinsic permeability of coarse rock materials were established using convection test results together with an analytical solution to natural convection in a square enclosure. It is worth comparing these experimental K values with estimated values in the most-used models in the literature, as developed for cohesionless and uniform materials. Figure 20 shows the reported and re-analyzed values of intrinsic permeability as a function of parameter α ( d 10 2 n 3 / ( 1 n ) 2 ), similar to Côté et al. (2011) [6]. The values are compared to Kozeny–Carman (Equation (8)) and Chapius (Equation (9)) models. In addition, the figure includes experimental data by Côté et al., 2011 [32]) for the low range of intrinsic permeability. The low range of K is the extent of experimental data based on which Equations (8) and (9) were developed.
As Figure 20 shows, the experimental K value from Rieksts et al. (2017) [27] agrees fairly well with those obtained by Côté et al. (2011) [6]. In general, the K values in both studies lie between the two theoretical models. The good agreement of the results of the two very similar tested materials indirectly validates Rieksts et al.’s (2017) [27] experimental procedure, allowing for confident measurement of different coarse aggregates as reported in Rieksts et al. (2020) [31].
Figure 20 also shows that the re-analyzed K value obtained from data by Johansen (1975) [2] fits the Kozeny–Carman model very well. However, it seems that the re-analyzed K values from the NGI (1999) [21] study are higher than those of both theoretical models. Several factors could explain this. First, one could speculate that particle shape could be a reason, as the materials tested by NGI were crushed rock. However, the results from the crushed rock tested by Johansen (1975) [2] were very similar to those that Rieksts et al. (2017) [27] and Côté et al. (2011) [26] obtained using natural cobbles, which are fairly rounded. Also, Côté et al (2011) [6] clearly demonstrated that particle shape only affects K on the low spectrum of values, several orders of magnitude lower than the values of coarse materials discussed in this study. Second, of all the studies covered in this paper, only the experiments by Côté et al. (2011) [6] and Rieksts et al. (2020) [31] fit the conditions for the Nu–Ra relationship proposed by Schubert and Straus (1979) [9]. In the tests performed by Johansen (1975) [2] and NGI (1999) [21] the sample was not cubical. In addition, the studies lack experimental data to validate the formation, number and shape of the convection cells; in Rieksts et al. (2017) [27] the sample size was cubical, but the convection cell was diagonal (not square-shaped). Hence one should be critical of established K values, as the Nu–Ra relationship changes with changing convection cell patterns [14]. Finally NGI’s (1999) [21] overestimation of experimental K values could originate from a malfunction in the experimental setup, as discussed in the next section.

6.3. Possible Discrepancies in NGI Data

The experimental K values found after re-analyzing the data from NGI (1999) [21] were found to be higher than would normally be obtained from the studied materials. This is mostly based on comparison with theoretical K values and the results of other studies. The discrepancies found gave a reason for discussion of the accuracy of measurements in the NGI setup, and this can easily be done by comparing the effective thermal conductivity measurements with results from other studies and established theoretical models. NGI (1999) [21] provides thermal conductivities of 0.80 and 0.85 W/m°C for 25–63 and 20–120 mm materials, obtained at porosities of 0.37 and 0.34 and with d10 of 0.026 and 0.019 m respectively. Table 8 summarizes experimental ke values from different studies together with the theoretical contribution of pure thermal conductivity (Equation (4)) and radiant conductivity (Equation (6)). The studies did not provide the ks value necessary for the calculation of pure thermal conductivity using Equation (4). Hence an arbitrary ks value of 3.0 W/m°C was used for all materials to calculate the theoretical kc values. However, the variation of ks has a fairly low impact on the resulting kc.
As can be seen, the experimental ke values for the materials tested by NGI (1999) [21] are significantly higher (by 35–36%) than the theoretical values. This again suggests that the measurements may not be accurate. To further validate this assumption, experimental data from Johansen (1975) [2] were compared with data from NGI (1999) [21], as the materials tested had similar characteristics. Based on the laboratory experiments, the value of effective conductivity reported by Johansen (1975) [2] is only 0.45 W/m°C. The porosity and d10 of the specimen were approximately 0.44 and 0.03 m respectively. The average testing temperature was −13.5 °C. Using theoretical equations, the contribution of thermal conduction is 0.34 W/m°C, while that of radiant conduction is only 0.10 W/m°C. The corresponding effective thermal conductivity is 0.44 W/m°C. in this case, the theoretical value of ke is only slightly lower than the experimental value. This is contrary to the ke values in NGI (1999) [21] where the experimental values are much higher than the theoretical ones. The two studies using cobbles have experimental values 4–13% higher than the theoretical studies. This once more suggests that the experimental values obtained by NGI (1999) [21] might be somewhat overestimated.
Furthermore, examining Figure 16 and Figure 18 shows that convective heat transfer is initiated at about 26 °C/m in the material tested by Johansen (1975) [2] and about 20 °C/m in the material tested by NGI (1999) [21]. Given that the material tested by NGI (1999) [21] had a lower porosity and d10, it should have: (a) a lower intrinsic permeability, (b) a higher critical upward thermal gradient to initiate natural convection, and (c) a lower effective thermal conductivity compared to Johansen’s material. However, the experimental results show the opposite: Johansen’s results agree fairly well with those of Rieksts et al. (2017) [27] and Côté et al. (2011) [26]. This once more confirming that the experimental results provided by NGI may be corrupted by measurement errors.

7. Conclusions

Natural air convection can considerably increase the rate of heat extraction from road and railway structures during the cold season. This can result in excessive frost penetration depth and undesirable frost heave in frost-susceptible soils. The onset of convection in construction materials is largely dependent on the intrinsic permeability (K) of granular materials used in the construction of roads and railways. This paper concentrates on establishing K values for coarse open-graded materials, based on laboratory measurements. The paper reviews some available large-scale laboratory experiments on free air convection in both natural and crushed materials. The laboratory setups are presented followed by the experimental results and the establishment of K values using the method proposed by Côté et al. (2011) [6] employing a Nusselt (Nu)–Rayleigh (Ra) relationship for a square enclosure.
In total, four different experimental test setups have been reviewed. Côté et al. (2011) [6] successfully applied the method of establishing K values to natural cobbles. In addition, they reanalyzed Johansen’s (1975) [2] data and found a good agreement with theoretical intrinsic permeability models. Furthermore, Rieksts et al. (2017) [27] conducted an experimental study to verify new test equipment for natural air convection. The established K values were in good agreement with those obtained by Côté et al. (2011) [6] using similar materials. Rieksts et al. (2020) [31] also tested several other road construction materials and reported the results. Moreover, the present study performed a reanalysis of another set of experiments conducted on crushed rock materials by NGI (1999) [21].
This paper has shown the effect of particle gradation on established intrinsic permeability values. Cobble-sized materials have a much higher d10 value than crushed rock materials, as discussed in this paper. Higher d10 results in higher permeability and a lower critical temperature gradient for the initiation of convective heat transfer. This has been clearly shown by comparing the q-∇T relationships of different studies.
This paper has also shown that the experimental K values of materials tested by NGI (1999) [21] seem to be higher than those in the study by Johansen (1975) [2] using similar materials. In addition, the experimental K values did not show good agreement with theoretical K values compared to other studies. This suggests possible discrepancies in the NGI’s (1999) measurements [21]. Further investigation and the experimental effective thermal conductivity values and their comparison with theoretical ones have shown that the NGI’s (1999) [21] measurements may be overestimated, leading to inaccurate K values.
Although all the laboratory experiments considered here investigate the same physical phenomena, comparing them is complicated. The foremost reason for this is the different geometries of the experimental setups and variations in the measurement systems. Different geometries results in different shapes and possibly different numbers of convection cells. In addition, due to limitations in measurement capacity it is not possible to evaluate the convection conditions of some studies. The method for establishing K values relies on a Nu–Ra relationship with a particular geometry. As shown in this paper, disregarding the testing conditions, the method gives a reasonable estimate of K values. However, one should be critical when the proposed method is applied to different geometrical setups.

Funding

This research was supported by the Norwegian Research Council (NRC) under grant 246826/O70.

Conflicts of Interest

The authors declare no conflict of interests.

References

  1. Farouki, O.T. Thermal Properties of Soils; CRREL Monograph 81-1; US Army Corps of Engineering, Cold Regions Research and Engineering Laboratory: Hanover, NH, USA, 1981. [Google Scholar]
  2. Johansen, O. Thermal Conductivity of Soils. Ph.D. Thesis, University of Trondheim, Trondheim, Norway, 1975. US Army Corps of Engineering, Cold Regions Research and Engineering Laboratory, Hanover. N.H. CRREL Draft English Translation 637.291. [Google Scholar]
  3. Goering, D.J. Experimental investigation of air convection embankments for permafrost-resistant roadway design. In Proceedings of the Seventh International Conference on Permafrost, Yellowknife, Northwest Territories, NWT, Canada, 23–27 June 1998; pp. 319–326. [Google Scholar]
  4. Goering, D.J.; Instanes, A.; Knudsen, S. Convective heat transfer in railway embankment ballast. In Proceedings of the International Symposium on Ground Freezing and Frost Action in Soils, Ground Freezing 2000: Frost Action in Soils, Louvan-la-Neuve, Belgium, 11–13 September 2000; pp. 31–36. [Google Scholar]
  5. Goering, D.J. Passively Cooled Railway Embankments for Use in Permafrost Areas. J. Cold Reg. Eng. 2003, 17, 119–133. [Google Scholar] [CrossRef]
  6. Côté, J.; Fillion, M.-H.; Konrad, J.-M. Intrinsic permeability of materials ranging from sand to rock-fill using natural air convection tests. Can. Geotech. J. 2011, 48, 679–690. [Google Scholar] [CrossRef]
  7. Fillion, M.-H.; Côté, J.; Konrad, J.-M. Thermal radiation and conduction properties of materials ranging from sand to rock-fill. Can. Geotech. J. 2011, 48, 532–542. [Google Scholar] [CrossRef]
  8. Nield, D.A.; Bejan, A. Convection in Porous Media; Springer: Berlin/Heidelberg, Germany, 2013; p. 778. [Google Scholar]
  9. Schubert, G.; Straus, J.M. Three-dimensional and multicellular steady and unsteady convection in fluid-saturated porous media at high Rayleigh numbers. J. Fluid Mech. 1979, 94, 25–38. [Google Scholar] [CrossRef]
  10. Straus, J.M. Large amplitude convection in porous media. J. Fluid Mech. 1974, 64, 51–63. [Google Scholar] [CrossRef]
  11. Straus, J.M.; Schubert, G. On the existence of three-dimensional convection in a rectangular box containing fluid-saturated porous material. J. Fluid Mech. 1978, 87, 385–394. [Google Scholar] [CrossRef]
  12. Côté, J.; Konrad, J.-M. Assessment of structure effects on the thermal conductivity of two-phase porous geomaterials. Int. J. Heat Mass Transf. 2009, 52, 796–804. [Google Scholar] [CrossRef]
  13. Howell, J.R.; Menguc, M.P.; Siegel, R. Thermal Radiation Heat Transfer; CRC Press: Boca Raton, FL, USA, 2010. [Google Scholar]
  14. Xue, S.C.; Poladian, L.; Barton, G.W.; Large, M.C.J. Radiative heat transfer in preforms for microstructured optical fibres. Int. J. Heat Mass Transf. 2007, 50, 1569–1576. [Google Scholar] [CrossRef]
  15. Tien, C.L. Thermal Radiation in Packed and Fluidized Beds. J. Heat Transf. 1988, 110, 1230–1242. [Google Scholar] [CrossRef]
  16. Argo, W.; Smith, J. Heat transfer in packed beds-prediction of radial rates in gas-solid beds. Chem. Eng. Prog. 1953, 49, 443–451. [Google Scholar]
  17. Dudgeon, C.R. An experimental study of the flow of water through coarse granular media. La Houille Blanche 1966, 7, 785–801. [Google Scholar] [CrossRef] [Green Version]
  18. Carman, P.C. Flow of Gases through Porous Media; Academic Press: Cambridge, MA, USA, 1956. [Google Scholar]
  19. Kozeny, J. Ueber kapillare Leitung des Wassers im Boden. Sitz. Wien. Akad. 1927, 136, 271–306. [Google Scholar]
  20. Chapuis, R.P. Predicting the saturated hydraulic conductivity of sand and gravel using effective diameter and void ratio. Can. Geotech. J. 2004, 41, 787–795. [Google Scholar] [CrossRef]
  21. NGI. Måling av Varmetap i Ulike Steinfyllingsfraksjoner. Måling av Varmetap i Ballastpukk, Maskinkult og Sprengstein; Norges Geotekniske Institutt (Norwegian Geotechnical Institute): Oslo, Norway, 1999; p. 35. [Google Scholar]
  22. Combarnous, M.A.; Bories, S.A. Hydrothermal Convection in Saturated Porous Media. Adv. Hydrosci. 1975, 10, 231–307. [Google Scholar] [CrossRef]
  23. Elder, J.W. Steady free convection in a porous medium heated from below. J. Fluid Mech. 1967, 27, 29–48. [Google Scholar] [CrossRef]
  24. Kaneko, T.; Mohtadi, M.; Aziz, K. An experimental study of natural convection in inclined porous media. Int. J. Heat Mass Transf. 1974, 17, 485–496. [Google Scholar] [CrossRef]
  25. Yen, Y.-C. Effects of density inversion on free convective heat transfer in porous layer heated from below. Int. J. Heat Mass Transf. 1974, 17, 1349–1356. [Google Scholar] [CrossRef]
  26. Côté, J.; Fillion, M.-H.; Konrad, J.-M. Corrigendum: Intrinsic permeability of materials ranging from sand to rock-fill using natural air convection tests. Can. Geotech. J. 2011, 48, 1149. [Google Scholar] [CrossRef]
  27. Rieksts, K.; Hoff, I.; Kuznetsova, E.; Côté, J. Laboratory investigations on heat transfer of coarse crushed rock materials. In Proceedings of the 70th Canadian Geotechnical Conference and the 12th Joint CGS/IAH-CNC Groundwater Conference, Ottawa, ON, Canada, 1–4 October 2017. [Google Scholar]
  28. NGI. Måling av Varmeledningsevne i Springstein. Ufrosset Varmeledningstall for Stein i Fraksjon 0–100 mm og 0–250 mm; Norges Geotekniske Institutt (Norwegian Geotechnical Institute): Oslo, Norway, 1996; p. 16. [Google Scholar]
  29. NGI. Måling av Varmeledningsevne i Springstein. Ufrosset Varmeledningstall for Stein i Fraksjon 20–250 mm; Norges Geotekniske Institutt (Norwegian Geotechnical Institute): Oslo, Norway, 1996; p. 20. [Google Scholar]
  30. NGI. Måling av Varmeledningsevne i Springstein. Ufrosset Varmeledningstall for Stein i Fraksjon 20–250 mm, jordfuktig tilstand; Norges Geotekniske Institutt (Norwegian Geotechnical Institute): Oslo, Norway, 1996; p. 20. [Google Scholar]
  31. Rieksts, K.; Hoff, I.; Kuznetsova, E.; Côté, J. Laboratory investigations into convective heat transfer in road construction materials. Can. Geotech. J. 2020, 57, 959–973. [Google Scholar] [CrossRef]
  32. Côté, J.; Fillion, M.-H.; Konrad, J.-M. Estimating Hydraulic and Thermal Conductivities of Crushed Granite Using Porosity and Equivalent Particle Size. J. Geotech. Geoenviron. Eng. 2011, 137, 834–842. [Google Scholar] [CrossRef]
Figure 1. Pattern of pore-air circulation in an air convection embankment (ACE) (Goering, 1998 [3]).
Minerals 10 00767 g001
Figure 2. Heat transfer mode in soils (redrawn and adapted from Johansen (1975) [2] and Côté et al., (2011) [6]).
Minerals 10 00767 g002
Figure 3. Experimental and analytical Nu–Ra relationships in porous media in a square enclosure heated from below (Côté et al., 2011 [6]).
Minerals 10 00767 g003
Figure 4. Typical experimental results of natural air convection tests.
Minerals 10 00767 g004
Figure 5. Experimental setup for forced and free convection tests (Johansen, 1975 [2]).
Minerals 10 00767 g005
Figure 6. Experimental setup developed by Norwegian Geotechnical Institute (NGI, 1999 [21]).
Minerals 10 00767 g006
Figure 7. Center cross-section of experimental setup used by NGI (Goering et al., 2000 [4]).
Minerals 10 00767 g007
Figure 8. Gradation of materials tested by the NGI (redrawn according to NGI (1999) [21]).
Minerals 10 00767 g008
Figure 9. Equivalent sphere-size distribution of tested material. d, particle diameter, mm; P, percentage passing, % (Fillion et al., 2011 [7]).
Minerals 10 00767 g009
Figure 10. Experimental setup during filling process (Fillion et al., 2011 [7]).
Minerals 10 00767 g010
Figure 11. Experimental test setup: A-A vertical cross-sectional view; B-B horizontal cross-sectional view at heat flux sensor level (Rieksts et al., 2017 [27]).
Minerals 10 00767 g011
Figure 12. Heat flux plates at the top of the sample (Rieksts et al., 2017 [27]).
Minerals 10 00767 g012
Figure 13. Test sample in preparation phase (Rieksts et al., 2017 [27]).
Minerals 10 00767 g013
Figure 14. Equivalent sphere-size distribution of test sample (Rieksts et al., 2017 [27]).
Minerals 10 00767 g014
Figure 15. Experiment relationships between heat flux (q) and temperature gradient (∇T) for material with d10 of 0.15 m (Côté et al., 2011 [6]).
Minerals 10 00767 g015
Figure 16. Downward and upward heat flux results for study conducted by Johansen (1975) [2] as represented by Côté et al. (2011) [6].
Minerals 10 00767 g016
Figure 17. Experimental data on upward and downward heat flow through natural cobbles (Rieksts et al., 2017 [27]).
Minerals 10 00767 g017
Figure 18. Experimental data for upward and downward heat flow through 25–63 and 20–120 mm materials as reported by NGI (1999) [21].
Minerals 10 00767 g018
Figure 19. Experimental relationship between heat flux and temperature gradient from studies reviewed (120–200 mm material shown is from Côté et al. (2011) [6]; 25–63 mm material shown is from NGI (1999) [21]).
Minerals 10 00767 g019
Figure 20. Measured and predicted K-α relationships.
Minerals 10 00767 g020
Table 1. d10 and d50 of test materials.
Materiald10, mmd50, mm
25–63 mm26.236.8
20–120 mm19.042.2
0–250 mm0.753.1
Table 2. Summary of experimental laboratory test setups.
Johansen (1975) [2]NGI (1999)
[21]
Côté et al. (2011) [6]Rieksts et al. (2017) [27]
Sample width1.8 m1 m1 m1 m
Sample depth2.2 m1 m1 m1 m
Sample height0.48 m0.75 m0.94 m0.98 m
Boundary conditionsTemperature controlled on both sidesHeat flux controlled on warm side/temperature controlled on cold sideTemperature controlled on both sidesTemperature controlled on both sides
Heat flux measurementsNine heat-flux gauges (size not specified)Measurement of electrical current converted to heat fluxFour heat flux plates (each 0.4 × 0.4 m) covering 65% of sample surfaceNine heat flux plates (each 0.3 × 0.3 m) covering 90% of sample surface
Temperature measurementsTemperature sensors in layers with 22 sensors in each layerThermistors only along the centerlineThermistors placed in layers with five sensors in each layerThermocouples placed in layers with five sensors in each layer
Table 3. Sample characteristics, experimental results and back-calculated values of intrinsic permeability.
Materialnd10, mke, W/m°C T q ,   W / m 2 q * ,   W / m 2 K, m2
1 (sample 1)0.410.1501.026.816.97.03.9 × 10−6
10.828.711.1
15.445.915.9
1 (sample 2)0.410.1501.0210.130.310.4
15.451.415.9
20.410.1280.9521.760.020.62.1 × 10−6
28.089.226.6
30.390.0920.7125.353.017.91.5 × 10−6
40.370.1000.8324.577.620.32.9 × 10−6
* calculated based on ke and ∇T.
Table 4. Sample characteristics, experimental results and back-calculated values of intrinsic permeability.
Materialnd10, mke, W/m°C T q ,   W / m 2 q * ,   W / m 2 K, m2
1 (sample 1)0.440.030.456.826.712.00.71 × 10−6
10.836.316.3
15.440.818.4
* calculated based on ke and ∇T.
Table 5. Sample characteristics, experimental results and back-calculated values of intrinsic permeability (Rieksts et al., 2017 [27]).
Materialnd10, mke, W/m°C T q ,   W / m 2 q * ,   W / m 2 K, m2
Cobbles0.390.1210.897.014.06.23.38 × 10−6
14.139.212.6
17.049.715.1
Crushed rock
20–120 mm
0.450.0300.5410.913.55.82.2 × 10−6
16.420.18.8
21.336.411.4
Crushed rock0.450.0380.599.014.05.11.1 × 10−6
40–120 mm17.834.510.6
Crushed rock
20–250 mm
0.400.0280.729.45.75.70.9 × 10−6
15.216.911.0
19.929.814.5
* calculated based on ke and ∇T.
Table 6. Sample characteristics, experimental results and back-calculated values of intrinsic permeability.
Materialnd10, mke, W/m°C T q ,   W / m 2 q * ,   W / m 2 K, m2
25–63 mm0.380.0260.8018.014.914.41.14 × 10−6
28.033.622.4
30.741.424.6
20–120 mm0.340.0190.8518.717.915.91.11 × 10−6
30.039.025.5
* calculated based on ke and ∇T.
Table 7. Material characteristics and established K values of different studies.
StudyMaterial TypeMaterial Size, mmd10, mPorosity T crit ,   ° C / m K (× 10−6), m2
Côté et al. (2011) [6]Cobbles120–2000.1500.4143.90
110–1550.1280.4172.10
70–1400.0920.3981.50
75–2000.1000.3752.90
Rieksts et al. (2017) [27]Cobbles90–2100.1210.3943.38
Rieksts et al. (2020) [31]Crushed rock20–1200.0300.4551.50
40–1200.0380.4562.20
20–2500.0380.45111.10
Johansen (1975) [2]Crushed rock20–800.0300.44260.71
NGI (1999) [21]Crushed rock25–630.0260.38201.14
20–1200.0190.34191.11
Table 8. Experimental and theoretical values of effective conductivity from different studies.
StudyMaterial Size, mmke, W/m°C
Experimental
kc, W/m°C (Equation (4))kr, W/m°C (Equation (6))ke, W/m°C (Equation (3))
Côté et al. (2011) [6]120–2001.020.230.700.93
11–1550.950.230.600.83
70–1400.710.250.430.68
75–2000.830.270.470.74
Rieksts et al. (2017) [27]90–2100.890.250.570.82
Rieksts et al. (2020) [31]20–1200.540.340.110.45
40–1200.590.340.180.52
20–2500.720.380.140.51
Johansen (1975) [2]20–800.450.340.100.44
NGI (1999) [21]25–630.800.390.130.52
20–1200.850.450.090.54

