Abstract
This study is focused on a barian titanian phlogopite found in an alkaline ultramafic dyke transecting Mesozoic limestones of the Gargano Promontory (Apulia, Italy). The rock containing the barian titanian phlogopite, an olivine-clinopyroxene-rich lamprophyre with nepheline and free of feldspars, has been classified as monchiquite. The present study combines chemical analyses, single crystal X-ray diffraction and Raman spectroscopy. Chemical variations suggest that the entry of Ba into the phlogopite structure can be explained by the exchange Ba + Al = K + Si. The crystal structure refinement indicates that the Ti uptake is consistent with the Ti–oxy exchange mechanism. The structural parameters associated with the oxy substitution mechanism are extremely enhanced and rarely reported in natural phlogopite: (a) displacement of M2 cation toward the O4 site (~0.7); (b) M2 octahedron bond-length distortion (~2.5); (c) very short c cell parameter (~10.14 Å). Raman analysis showed most prominent features in the 800–200 cm−1 region with the strongest peaks occurring at 773 and 735 cm−1. Only a weak, broad band was observed to occur in the OH-stretching region. As concerns the origin of the barian titanian phlogopite, the rock textural features clearly indicate that it crystallized from pockets of the interstitial melt. Here, Ba and Ti enrichment took place after major crystallization of olivine under fast-cooling conditions, close to the dyke margin.
1. Introduction
Phlogopite is a rock-forming mineral that plays a key function in geochemical and petrological processes of the upper mantle [1]. In this respect, the role of some elements such as Ti and Ba is important. It was found that Ti content critically expands the thermal stability of phlogopite, consequently affecting melting processes within the upper mantle [2]. The experimental study of Guo and Green [3] showed that a Ti increase is accompanied also by an increase in Ba content, concluding that the genesis of ultrapotassic lamproitic magmas can be related to partial melting of phlogopite-bearing peridotite.
The increase of the Ti content in phlogopite has a relevant impact also on technological applications. The entry of Ti into the structure improves the electronic conductivity, an important factor in the fabrication of heterostructures, combining with mica nanosheets to yield a variety of novel and interesting optical and electrical properties [4].
The discovery of a phlogopite with an unusual high Ti and Ba content in an alkaline ultramafic dyke of the Gargano Promontory in the Apulia region of southern Italy (Figure 1a) prompted us to undertake a crystal chemistry and petrological study. Although quite rare, barian titanian phlogopites and biotites have been identified in a wide range of magmatic lithotypes such as gabbro, [5,6,7], ultramafic rocks [8,9], nephelinite [10,11], leucitic rocks [12,13], melilitite [14,15] and lamprophyre [16].
Structural features, for instance bond-lengths and distortion parameters, are remarkably different when Ti and Ba are incorporated in the phlogopite structure [17,18].
The interlayer cavity adjusts in size in order to allow Ba to produce more hexagonal shapes of the tetrahedral rings as a consequence of the preference of the divalent Ba to surround itself by as many neighbors as possible [19,20,21]. Ba2+-for-Kl+ substitution in the interlayer site requires a charge compensation that can involve different cations in tetrahedral coordination and/or vacancies in the interlayer site [22]. Ba–K substitution mechanisms can be easily tested by representing chemical variability plots of Ba vs. vacancies or Ba + Al vs. K + Si.
The main exchange mechanisms by which Ti enters the phlogopite octahedral layer have been reviewed in detail in Waters and Charnley [23] and generally involve the occurrence of vacancies, oxidation, fluorination or coupled substitutions in different sites. In most cases, Ti substitution schemes in barian titanian phlogopite have been determined only by means of correlation plots on the basis of microprobe analyses, and this may lead to a misinterpretation of the correct exchange mechanism occurring in the structure when structural details are lacking or when data on Fe3+ and OH content are not available. Thus, when Ti–oxy substitution is not properly verified, the Ti uptake is generally modeled by the Ti-vacancy exchange [24,25].
Clear evidence for the Ti–oxy substitution has been recognized by means of single-crystal X-ray diffraction [17] in absence of Fe3+ and/or OH− determinations. According to these Authors [17] the shortening of the c lattice parameter coupled to the marked distortion of M2 octahedron, where Ti is preferentially partitioned, are strong indications of the oxy mechanisms.
Crystal structure refinements on biotite, fully characterized in terms of anion and cation speciation, have validated the relationships between the Ti–oxy mechanism and key structural features [26]. Recently, other structural parameters have been further introduced to better assess the main Ti-substitution mechanism [27,28].
In this work, after an introductory part devoted to outlining the geological setting and to define the nature of the hosting magmatic rock, a characterization of a barian titanian phlogopite is presented. To this end, we performed an approach that includes a petrographic analysis, electron microprobe analysis (EMPA), scanning electron microscopy coupled with energy dispersive spectrometer (SEM-EDS), single-crystal X-ray diffraction (SCXRD) and micro-Raman spectroscopy. Inductively coupled plasma mass spectrometry (ICP-MS) for whole rock analysis was also carried out. In addition, environmental conditions favoring crystallization of the studied barian titanian phlogopite are also examined.
2. Geological Setting
The Gargano Promontory is the site of two distinct occurrences of mafic to ultramafic intrusive rocks of alkaline affinity. These can be found at Punta delle Pietre Nere, close to the Lesina Lake and at San Giovanni in Pane locality, in the Apricena territory (Figure 1a). The melasyenite and melagabbro magmatic body of Punta delle Pietre Nere—brought up to the surface by the Lesina gypsum diapir [29]—have been the object of several studies that defined an age of 62–56 Ma [30,31] and compositional features typical of lamprophyric rocks [32], in the Apulian foreland domain [33]. Vollmer [30,34] related the within-plate magmatism of Punta delle Pietre Nere to the activation of an asthenosphere hotspot, later responsible for the genesis of the Roman Comagmatic Province volcanism. In terms of isotopic composition, the Punta delle Pietre Nere magmas show an intraplate signature free of subduction influence [33,35], acquired from a mantle source located in the neighborhood of the spinel- to garnet-peridotite transition [36].
A decidedly lower number of studies is available for the magmatic rocks of San Giovanni in Pane, close to a former Monastery (41°47′37″ N; 15°23′40″ E) and approximately 15 km south of the Punta delle Pietre Nere outcrop (Figure 1a). In the nineteenth century, Pilla [37] first described these enigmatic magmatic rocks, which were subsequently interpreted by Carella [38] as constituting an E–W oriented, 40-m-thick dyke intruding Cretaceous limestones (Figure 1b). The first analyses of the San Giovanni in Pane rocks were provided by Amendolagine et al. [39] that also performed a comparative study with the Punte delle Pietre Nere rocks. In recent surveys of the zone—subsequent to intensive quarry excavation—only limited blocks of the former dyke remain.
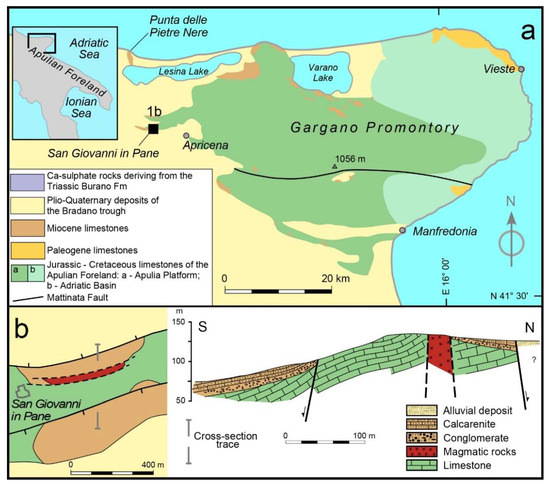
Figure 1.
(a) Geological sketch map showing the location of the Punta delle Pietre Nere and San Giovanni in Pane mafic and ultramafic rocks in the context of northern Apulian foreland; (b) geological sketch map of the San Giovanni in Pane area (left) and related cross-section (right) modified from the study of Carella [38].
3. Materials and Methods
Rock composition was obtained for powders analyzed at Activation Laboratories (www.actlabs.com) in Kamloops, BC, Canada. Fusion of rock powders was performed employing a lithium metaborate/tetraborate and was followed by a digestion of the bead with weak nitric acid solution. Major oxides and trace elements concentrations were then determined by ICP optical emission spectrometry and ICP mass spectrometry, respectively. The petrographic study was carried out combining observation of thin sections at the microscope with phase analysis and identification at the SEM-EDS. A Zeiss EVO 50 XVP SEM having an EDS spectrometer with X-Max Silicon drift detector from Oxford Instruments, hosted at Dipartimento di Scienze della Terra e Geoambientali of Bari University, was used. Operating conditions were: 15 kV accelerating potential; 1-nA probe current; counting time 100 s; working distance of 8.5 mm. More refined mineral analyses were obtained by EMPA at the Dipartimento di Scienze della Terra Universita’ di Milano using a JEOL JXA 8200 Superprobe equipped with five wavelength-dispersive (WDS) spectrometers. Minerals were analyzed using 1-micron beam at 15 kV and 5-nA beam current. Natural and synthetic minerals and glasses were used as standards. In particular, omphacite USNM110607 and albite were used as a standard for Na, olivine USNM2566 for Mg, anorthite USNM137041 for Al, wollastonite for Ca and Si, K-feldspar PSU-Or1A for K, ilmenite USNM96189 for Ti, chromite USNM117075 and pure Cr for Cr, rhodonite for Mn, fayalite USNM85276 for Fe, nickeline and pure Ni for Ni and sanbornite for Ba. All standards were calibrated within 0.5% at one standard deviation. Raw data were corrected using a Phi-Rho-Z quantitative analysis program.
In addition, for one rock type, a few phlogopite single crystals were directly hand-picked from crushed rocks, in order to carry out a structural investigation. A Bruker AXS APEXII diffractometer with Kappa geometry, installed at Dipartimento di Scienze della Terra e Geoambientali, University of Bari (Bari, Italy), equipped with a CCD area detector (model 1 K SMART; 40-mm crystal-to-detector distance) and graphite-monochromatized MoKα radiation (50-kV and 30-mA operating conditions), was used for data collection.
The collection strategy was optimized by the Apex program suite by combining several ω and φ rotation scans (scan width 1.0°/frame, exposure time 10 s/frame). Data reduction, including intensity integration, correction for Lorentz and polarization effects, was done using the software SAINT-IRIX 6.28 [40]. A semi-empirical absorption correction was applied to all data using the SADABS package [41]. Preliminary lattice parameters and an orientation matrix were obtained from the xyz centroids of reflections from three sets of frames and refined during the integration process of the intensity data. Data analysis, initially carried out with XPREP software Version 6.02 [42], confirmed the space group C2/m. Subsequently, the crystal structure was anisotropically refined by a full-matrix least-squares method using the CRYSTALS software Version 12 [43] starting from the atomic parameters of Scordari et al. [44]. Scattering curves for fully ionized chemical species were used for non-tetrahedral sites, whereas ionized vs. neutral scattering curves were used for Si and O. Only reflections with I > 3σ(I) were considered suitable for the structure refinements. Refined parameters were atomic positions, anisotropic atomic displacement parameters and the overall scale factor.
Single-crystal Raman spectra were obtained with a confocal Horiba Jobin Yvon Labram HR Evolution spectrometer at Dipartimento di Chimica, University of Bari (Bari, Italy). This spectrometer is equipped with an Olympus optical microscope, an ultra-low frequency (ULF) filter, a He–Ne laser working at 632.8 nm and a multichannel air-cooled charge-coupled device (CCD) detector. The samples were positioned under the microscope objective with the hk0 faces, which are also cleavage planes, normal to the incident beam. The measurements were carried out at room temperature and each spectrum was accumulated three times with an integration time of 60 s to improve the signal to noise ratio. Spectral data were smoothed, and baseline corrected using the LabSpec 6 software. The Raman peak position of an unstrained silicon substrate (520.5 cm−1) was used to calibrate spectral frequency.
4. Results and Discussion
4.1. Petrology and Classification of the Studied Rock Types
Among the blocks at San Giovanni in Pane locality, we recognized two different rock types—both characterized by an elevated density of ~3.15 g/cm3. The first one has a homogeneous grain size and a mineralogical composition dominated by olivine, diopside, labradoritic plagioclase and minor alkali feldspar, with titanomagnetite and apatite as main accessory phases. The second type—the main focus of this paper—has a porphyritic texture (Figure 2a) with a more unusual feldspar-free and feldspathoid-bearing mineralogical composition, including olivine, diopside, phlogopite, nepheline, analcime with titanomagnetite and apatite as accessory phases. Olivine occurs mostly as phenocrysts with a flow-related preferred orientation (Figure 2a). Predominantly, olivine shows a skeletal texture (Figure 2b) and sometimes it is partly or completely replaced by green nontronite. Diopside was by far the dominant mineral in the rock matrix. It occurs as microlites having a length in most cases between 10 and 60 µm (Figure 2c).
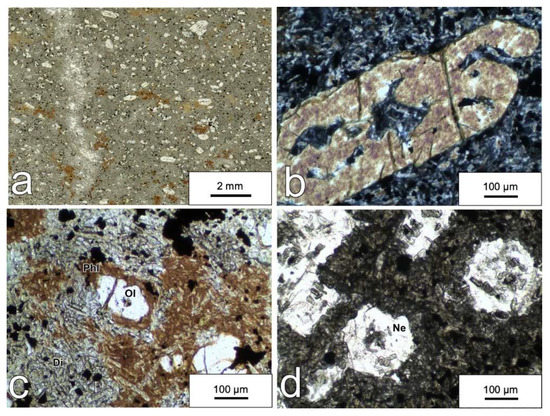
Figure 2.
(a) Thin-section scan in polarized light showing the porphyritic texture of the monchiquite with olivine phenocrysts, phlogopite oikocrysts and a matrix mainly made up of diopside microlites. A vertical band enriched in nepheline can be observed on the left of the scan; (b) micrograph showing an olivine phenocryst with skeletal texture within the diopside-rich matrix (crossed polars); (c) micrograph showing oikocrysts of phlogopite enclosing numerous chadacrysts and a resorbed olivine surrounded by a thin corona of phlogopite (plane polarized light); (d) micrograph showing basal and longitudinal sections of nepheline microphenocrysts (plane polarized light). Phl—phlogopite; Ol—olivine; Di—diopside; Ne—nepheline.
Phlogopite occurs throughout the rock as brown to reddish spots. It mostly occurs in the form of oikocrysts including pale green diopside chadacrysts (Figure 2c) and opaque minerals. More rarely, a phlogopite devoid of diopside inclusions makes up a corona around olivine grains (Figure 2c). Owing to these textural features, the separation of pure single crystals of phlogopite was obtained only with difficulty.
Euhedral nepheline (Figure 2d) is not homogeneously distributed throughout the rock, but it is concentrated in thin bands (Figure 2a). Nepheline was also observed in the chilled margins of the Punta delle Pietre Nere melagabbro layered body [45]. Analcime was identified in the rock matrix by SEM/EDS analysis.
On the basis of the mineralogical composition and rock texture, the first rock type can be classified as a melagabbro. The second type can be assigned to the lampropyhire group, with most of the characteristics typical of monchiquite. From the textural features and chiefly for the presence of skeletal olivine, microlitic diopside and acicular apatite with elongation exceeding 20:1 [46], it can be deduced that the monchiquite magma underwent a fast cooling history.
Chemical analyses for major oxides of the two rock types are provided in Table 1. Irvine and Baragar [47] classification diagram based on CIPW normative composition indicates that both rock types plot in the field of picrite basalt and ankaramite, being undersaturated in silica. The content of nepheline emerging from the CIPW norm (Table 1), indicates the highest degree of undersaturation in silica for the monchiquite, in agreement with the observed mineralogical composition.

Table 1.
Major oxide contents and CIPW normative composition of the melagabbro and monchiquite samples from San Giovanni in Pane. For norm calculation it was assumed a Fe3+/(Fe3+ + Fe2+) ratio of 0.30.
Trace element analyses (Table 2) show that both rock types are enriched in Sr and in Ni, Cr, V and Zn. In addition—and particularly in the monchiquite—several HFSE, such as Zr, Nb, Ta, LREE are characterized by elevated contents.

Table 2.
Trace element contents of the melagabbro and monchiquite samples from San Giovanni in Pane.
REE patterns of the San Giovanni in Pane rocks (Figure 3a and Table 2) are well fractionated with an elevated CeN/YbN ratio (up to 23.8 in monchiquite) and are devoid of a significant Eu anomaly. Figure 3a shows that the patterns are similar to those of the Punta delle Pietre Nere rocks, except for the slightly lower contents of the HREE. In the multielement spider diagram normalized to the primitive mantle (Figure 3b and Table 2), overall convex-up patterns with maxima at Ta and Nb can be observed. A pronounced K negative anomaly, sharper in the monchiquite rock type, is very distinctive. Lower negative anomalies can be observed for Rb and Hf. Compared to the San Giovanni in Pane rocks, the Punta delle Pietre Nere rocks, still show the negative anomaly of K, even though with a lower intensity. Rb and, to a minor extent, Ba, Yb and Lu are higher in the Punta delle Pietre Nere samples. Instead, Sr, probably carried in large amount by apatite, seems to be more elevated in the San Giovanni in Pane samples. It can be concluded that the geochemical features of the San Giovanni in Pane rocks are similar to those of the PPN rocks, although some differences—chiefly the more pronounced K negative anomaly—appear indicative of a slightly different magma typology.
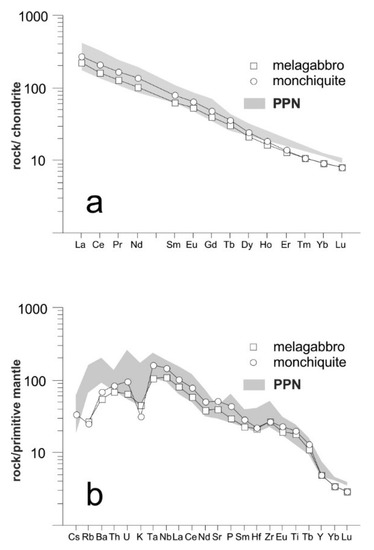
Figure 3.
REE patterns (a) and multi-element spider diagram (b) of the San Giovanni in Pane and Punta delle Pietre Nere (PPN) rocks. Normalizing values are from McDonough and Sun [48] and Sun and McDonough [49] in (a) and (b), respectively. Patterns of PPN rocks (in gray) from analyses by De Astis et al. [35] and Avanzinelli et al. [50].
4.2. Chemistry of the Monchiquite Main Minerals
Microprobe analyses were made of phlogopite and the other main phases of the monchiquite rock type (Table 3 and Table 4). EMPA data for each mineral in Table 3 and Table 4 represent the average over about five spots. Results indicate that olivine has a moderate compositional variation from Fo76 to Fo81 and is characterized by a significant content in CaO, up to 0.45 wt% (Table 3). The observed Ca content confirms that the olivine-melt system underwent a fast cooling, preventing the Ca loss expected during re-equilibration at progressively lower temperatures.

Table 3.
Average composition of olivine (Ol), clinopyroxene (Cpx) and nepheline (Ne) in the monchiquite sample. Standard deviation in parenthesis.

Table 4.
Average chemical composition and structural formula (apfu) of the barian titanian phlogopite investigated by single-crystal X-ray diffraction (SCXRD). Standard deviation in parenthesis.
Diopside [51]—owing to the elevated contents in Al2O3 and TiO2 (4.37 and 2.97 wt%, respectively)—is a aluminian titanian variety with an average Mg/(Mg + Fe) ratio of 0.79. In addition, the value of Fe3+, estimated on the basis of the charge balance, tends to be relevant and in some cases higher than Fe2+.
Nepheline composition is characterized by a maximum content of the kalsilite molecule of ~20%. In addition, it shows a low, but significant content of Ca and a silicon to aluminum ratio exceeding the value of the ideal formula (Table 3).
As concerns phlogopite, the main compositional features (Table 4) are the elevated content in TiO2 and BaO (10.10 and 3.34 wt%, respectively) with an average Mg/(Mg + Fe) ratio of 0.71.
In order to investigate the compositional variability, in terms of Ti and Ba contents, a large number (n = 53) of SEM/EDS analyses was also performed. Observed maximum contents in TiO2 and BaO were, respectively, 10.83 and 7.39 wt%. While the variability in TiO2 content is moderate (9.78 ± 0.52), the BaO content widely changes (3.73 ± 2.07). The Ba content is a maximum in the phlogopite oikocrysts and very low or zero in phlogopite coronas around olivine. The SEM/BSE image in Figure 4 shows the difference in brightness between the two phlogopite types, owing to the contrasting content in Ba.
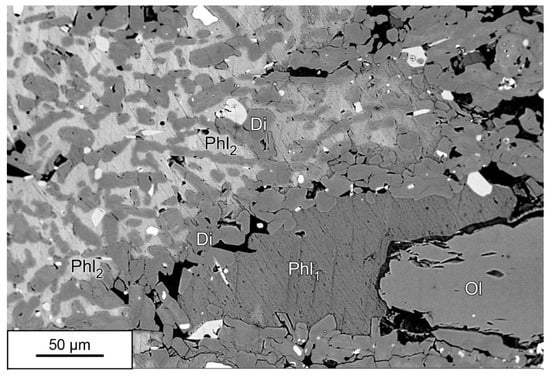
Figure 4.
SEM/BSE image showing the difference in brightness between the phlogopite (Phl1) in corona around olivine (Ol) and the oikocrysts of phlogopite (Phl2) enclosing numerous chadacrysts of diopside (Di). The bright Phl2 is characterized by a high content in Ba (BaO up to 7.39 wt%) whereas the dark Phl1 has a low (BaO up to 1.46 wt%) to negligible Ba content. The brightest mineral phases are titanomagnetite (white) and apatite.
Overall, chemical features indicate that mica can be classified as barian titanian phlogopite. In a comparison with the phlogopite found in the melasyenite of the Punta delle Pietre Nere outcrop (TiO2 up to 6.33 wt% and BaO not quantified in [45]), Ti content in the presently studied mica is distinctly higher.
4.3. Crystallographic Features of the Barian Titanian Phlogopite
The analyzed phlogopite sample belong to the 1M polytype, having sharp reflections both for k = 3n and k ≠ 3n indicating that disorder arising from stacking faults, a well-known feature in phyllosilicates, is very unlikely. The results of the structure refinement performed in space group C2/m, converged to R1 = 3.1 (Table 5). Similar results were found for three other single crystals and are reported as crystallographic interchange format (CIF) files in the Supplementary Materials. The final atomic coordinates and displacement parameters are reported in Table 6, whereas selected bond distances and main distortion parameters which describe the structural features of the investigated phlogopite are provided in Table 7 and are discussed taking into account the unusual high content of Ti and Ba.

Table 5.
Crystal, experimental and refinement data.

Table 6.
Crystallographic coordinates and equivalent displacement parameters (×103 Å2). Square brackets indicate cations used for occupancy refinement.

Table 7.
Selected bond lengths (Å) and parameters derived from structure refinement.
In particular, we can note marked geometric differences (bond distances and distortion parameters) between M1 and M2 octahedral site in response of high Ti incorporation. This is due to the known preference of Ti for M2 site, as it has been confirmed by several structural studies of natural biotite, e.g., [17,26,52].
Moreover, the sample is characterized by a highly distorted M2 polyhedron, as evidenced by high values of M2 bond lengths distortion, BLDM2 (Table 7) with distance M2–O4 remarkably shorter with respect to the other two M2–O3 distances as a consequence of the strong displacement, shiftM2 (Table 7) of the M2 central cation from the geometric center of the octahedron.
The observed distortions fall in the trend (Figure 5) defined by most oxy-biotites found by other authors [17,26,27,44]. The remaining structural parameters concerning the octahedral sheet (Table 7) are consistent with those found in the literature for Ti–oxy phlogopites. The short c lattice parameter (Table 5) and short K-O4 distance (Table 7) confirm that the Ti incorporation is ruled by the oxy-mechanism involving the deprotonation process at O4 according to the exchange mechanism (Mg, Fe2+) + 2OH−1 ↔ Ti4+ + 2O2−. Indeed, in phlogopite where the oxy-mechanisms are important, the short c parameter is a consequence of the shortening of the K-O4 distance due to the decreased coulombic repulsion between the interlayer cation and the O4 site when OH−/O2− replacement occurs [53,54].
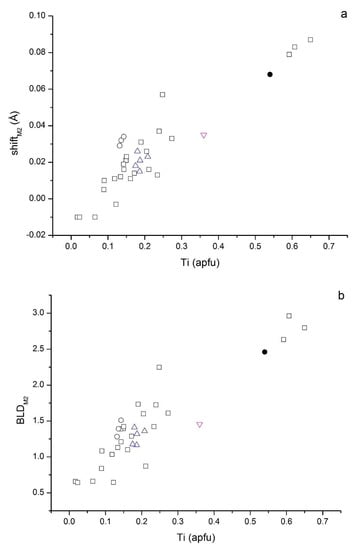
Figure 5.
(a) Plot of the off-center shift of the cation within the M2 site vs. VITi content; (b) plot of edge length distortion parameter of octahedral M2 site vs. VITi content. Symbols: open squares from Cruciani and Zanazzi [17]; open circles from Cesare et al. [26]; up-pointing triangles from Scordari et al. [44]; down-pointing triangle from Schingaro et al. [27]; filled circle this study.
Recently, other geometric parameters were introduced in order to better discriminate the Ti- substitution mechanism involved in the mica structure. In particular, a relationship between the difference (O3–O3)M1–(O3–O3)M2 and the displacement of the O4 oxygen ([(xO3–xO4)·a]) from the center of a octahedral hexagon defined by the O3 oxygen atoms around the O4 site was found [27,28]. These two parameters, calculated for the sample under study here, fall within the trend defined by most Ti–oxy biotites (Figure 6). We can, therefore, conclude that in our samples all the structural effects point to the Ti–oxy substitution mechanism occurring in the structure.
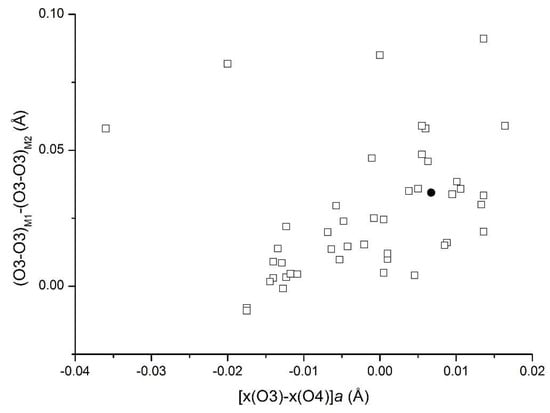
Figure 6.
Plot of the O3 hexagon distortion vs. the O4 atom offset from the “octahedral hexagon center”. Symbols: open squares—from Mesto et al. [28]; filled circle—this study.
Other structural features characterizing our sample concern the tetrahedral and interlayer sheets. It can be noted a small tetrahedron rotation angle (α = 7.16°). The parameter α describes the in-plane rotation of adjacent tetrahedra in opposite directions about c* and main adjustment mechanism to obtain congruence between tetrahedral and octahedral sheet [18]. Oxy-mechanisms, causing the opposite movement of oxygens at O3 and O4 site along the [100] crystallographic direction, determine small α values [54].
The α rotation angle is inversely related to the difference between the inner and outer distances (ΔK-O) around the interlayer cation and to the interlayer cation coordination number [54]. Less rotation of the tetrahedra produces a larger size and more hexagonal shape of the tetrahedra ring which allows Ba to better fit within the ring [21] as a consequence of the preference of the divalent Ba to surround itself by as many neighbors as possible [19]. We determined the effective coordination number (ECoN) of the interlayer cation using the iterative procedure described in Nespolo et al. [55]. We found a decidedly high coordination number (ECoN = 10.72), considering that the ECoN varies from 9 to 11 in phlogopite [18].
4.4. Micro-Raman Spectroscopy
The Raman spectrum in the 50–3800 cm−1 range for a Ti–Ba-rich phlogopite sample is shown in Figure 7. The spectrum shows two weak and relatively broad bands at 1090 and 890 cm−1, a small, but well defined peak at 1006 cm−1, a doublet of intense peaks at 773, 735 cm−1 with a shoulder at 670 cm−1 and wide bands at 550, 422 and 350 cm−1. Intense bands at 190 and 150 cm−1 plus a well-defined peak at 97 cm−1 are in the lower part of the spectrum. Finally, a broad weak band peaked at about 3700 cm−1 is also observed in the higher frequency part.
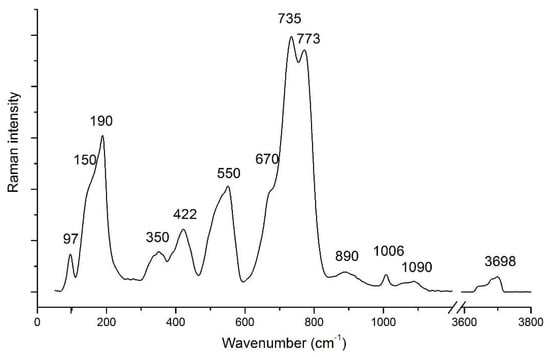
Figure 7.
µ-Raman spectrum of the Ba–Ti phlogopite sample in the region 50–3800 cm−1.
According to literature data for micas and other phyllosilicates, e.g., [57,58], Raman bands are generally discussed in terms of well-defined spectral regions.
The Raman peaks in the spectral region 1150–800 cm−1 arise from the vibrational mode due to T- Onb stretch displacements (T = tetrahedral cation; Onb = non-bridging oxygen). The strongest Raman peaks in the spectral region 800–550 cm−1 arise by the vibrational bending modes of T-Ob-T bonds (Ob = bridging oxygen). In particular, the wide, strong peak at ~550 cm−1 is characteristic of most Fe-bearing phyllosilicates. A correct assignment of the bands is very difficult in the spectral region <600 cm−1, where a complex set of vibrational modes of cations in octahedral sites and in interlayer sites and the OH librational modes occur. It is generally accepted that the translational M–O (M = octahedral cation) motions give rise to the bands at about 422, 350 and 190 cm−1. The remaining lower frequency bands at about 150 and 97 cm−1 most likely are ascribed to I–O (I = interlayer cation) translational motions.
The Raman bands in the spectral region 3800–3000 cm−1 are contributed by the stretching mode of hydroxyl groups (OH) coordinated with the cations (Al, Fe3+, Fe2+ and Mg) that occupy the octahedral sites [44,59]. The spectrum (Figure 7) shows a weak band in this region, due to oxy-mechanisms plus small amount of F− substituting the OH−.
4.5. Barian Titanian Phlogopite Chemistry
The composition reported in Table 3 was obtained by combining the results from the average of the microprobe point analyses and the information obtained from single-crystal structure refinement (Table 6 and Table 7). In detail, the best crystal chemical formula was reached in order to obtain (i) a good fit between the SCXRD-refined and EMPA-derived mean electron count of tetrahedral, octahedral and interlayer cation sites; (ii) an agreement between observed and calculated average bond lengths of tetrahedral and octahedral sites from ionic radii of Shannon [60].
The chemical formula was based on (O2−, OH−, F−)12 anionic charge. In this regard, an estimation of OH content was obtained from the linear regression analysis of the lattice parameter c vs. OH− [17]. This approach has demonstrated its worth, giving an OH content in agreement with H experimental determinations [26,44,54].
From the inspection of Table 3, it is worth noting that the sum of Si and Al cations is <4.0 apfu, implying that: (1) Al is confined exclusively to the tetrahedral sheet; (2) the occurrence of a small amount of another high charge cation to fill the tetrahedral site; (3) the Ti-Tschermak substitution mechanism can be ruled out, due to low Al content. As only a few single crystals were available for study, due to textural issues, it was not feasible to determine the Fe2+ and Fe3+ contents spectroscopically. An estimation of a Fe3+/(Fe2+ + Fe3+) ratio of 0.227 was obtained by the best crystal chemical formula calculation.
The introduction of tetrahedral Ti4+ is a controversial matter [17,28]. Although the positive correlation between Si and total Ti (Figure 8a) supports the preference of Ti for tetrahedral occupation, it is generally accepted that the presence of Ti in tetrahedral sites would decrease phlogopite stability [12]. The composition reported in Table 3 was obtained by the best match of the mean distances <M–O> and <T–O> and the mean electron counts calculated from formula molar fractions with those observed from SCXRD data. When Ti4+ is restricted to the M sites, Fe3+ is partitioned into both tetrahedral and octahedral sites.
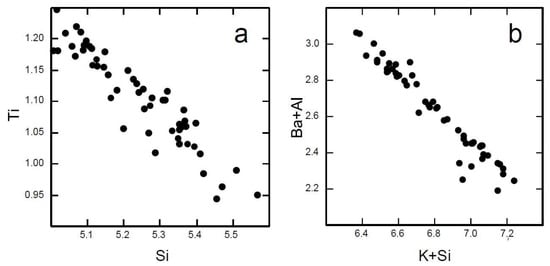
Figure 8.
Plots showing the negative correlations between (a) Ti4+ and Si and between (b) Ba + Al and K + Si. Data obtained from SEM/EDS analyses.
Regarding the interlayer site, the investigated sample has almost stoichiometric interlayer occupancy. Tetrahedral Al is sufficient to compensate the charge imbalance due to Ba entrance. The almost perfect negative correlation obtained by plotting IVSi + XIIK versus IVAl + XIIBa (Figure 8b) confirms that this coupled substitution accounts for the accommodation of whole Ba content in the structure.
4.6. Conditions Favoring Crystallization of the Barian Titanian Phlogopite
The remarkable simultaneous enrichment in Ba and Ti of the studied phlogopite has been rarely observed and notably by Zhang et al. [12], Cruciani and Zanazzi [17] and Greenwood [16], in leucitites and lamprophyre. In some cases, Ba and Ti concentrations can be even higher than those observed in the presently studied phlogopite. Zhang et al. [12] and Greenwood [16] maintained that crystallization of the barian titanian phlogopite occurred from the residual melt at low pressure conditions. These conditions are easily confirmed for the Gargano Promontory phlogopite, as indicated by the textural features of the lamprophyre (Figure 3) and by the injection of the dyke in limestone (Figure 1b). Owing to the shallow level of emplacement, the lamprophyric magma was subjected to a fast cooling rate. The acicular shape of apatite and the skeletal texture of olivine are strictly related to this. In addition, the significant Ca content detected in olivine can be also interpreted as an effect of fast cooling, able to prevent re-equilibration and Ca loss at progressively lower temperatures. Quantitative estimation of T and cooling rate are possible, starting from the Ca content of olivine. Thermometers based on the partition of CaO and MgO between olivine and melt [61] and on the Ca exchange between olivine and clinopyroxene [62] allow to obtain olivine crystallization temperatures of ~1200 and 1240 °C, respectively. Then, following the approach described by Van Tongeren et al. [63], an initial cooling rate of ~110 °C/year can be estimated for the studied lamprophyric magma. This result seems consistent with a numeric thermal model. Taking into account the geological profile of Figure 1b and making some simple assumptions on the physical properties of the magma it is possible to reproduce the cooling history of the magma body. To this end, a 1D numeric thermal model in Stella® code was built. Model results (Figure 9) indicate that starting from a temperature of 1200 °C, the dyke border underwent an initial cooling rate of about 130 °C/year. Meanwhile, temperature in the dyke core decreased by less than 0.01 °C in the first year after emplacement.
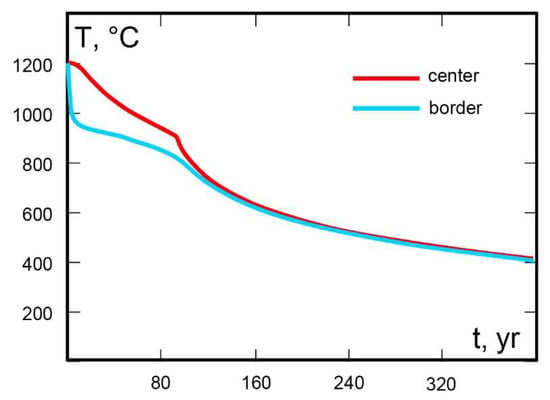
Figure 9.
T–t diagram showing the cooling history simulated in the center and in the border of a dyke, by means of a numeric thermal model in Stella® code. The dyke has a thickness of 40 m, in accordance with Carella [38] cross-section (Figure 1b). The cooling path of the border is related to a point at a distance of 2 m from the contact with the wall rock. Initial temperatures of 1200 °C and 100 °C are assumed for magma and wall rocks, respectively. Thermal diffusivity is fixed at 8.3 × 10⁻⁷ m2/s. Finally, a value of 600 kJ/kg is assumed for the latent heat of crystallization in the T interval of 1200–900 °C.
Therefore, it is suggested here that a further condition favoring the genesis of barian titanian phlogopite is the fast cooling rate, especially close to the dyke margins. Here, after massive crystallization of olivine, nearly isolated pockets of residual melt with anomalous enrichment in elements such as Ba and Ti were possibly generated, thus allowing crystallization of titanian diopside microlites and of the barian titanian phlogopite. Interestingly, a role of the rapid cooling rate in the genesis of Ba–Ti-enriched phlogopite in kimberlite was recently underlined by Barnett and Laroulandie [64].
5. Conclusions
The barian titanian phlogopite found in an alkaline ultramafic dyke transecting limestones of the Gargano Promontory is characterized by extremely high concentration in BaO (up to 7.4 wt% in SEM/EDS analyses) and in TiO2 (up to 10.8 wt%). The phlogopite belongs to an olivine-diopside-rich lamprophyre, containing also titanomagnetite, nepheline and apatite, but free of feldspars, which has been classified as monchiquite.
Structural effects resulting from Ti incorporation in the mica structure (short c parameter and enhanced distortion of the M2 octahedron) are consistent with the occurrence of a Ti–oxy substitution. Raman spectrum shows a weak broad band in the principal OH-stretching region in agreement with a reduced OH content at O4 site concomitant with the Ti uptake.
The dominant Ba- and Ti-substitution mechanisms operating in the investigated sample are:
K + Si ↔ Ba + Al
(Mg, Fe2+) + 2OH−1 ↔ Ti4+ + 2O2−.
Phlogopite growth took place after massive crystallization of olivine in conditions of fast cooling rate (>100 °C/year). This is indicated by textural features of the monchiquite, the significant Ca content of olivine and also by a thermal modeling. Barian titanian phlogopite formed from Ti- and Ba-enriched residual melt pockets, close to the dyke margin.
Supplementary Materials
The following are available online at https://www.mdpi.com/2075-163X/10/9/766/s1, CIF files: SGP-Ph1; SGP-Ph2; SGP-Ph3; SGP-Ph4.
Author Contributions
G.V. and A.C. coordinated and wrote the paper; G.V. performed XRD and Raman experiments and data interpretation; A.C. performed SEM analyses, petrological study and thermal modeling; V.F. contributed to the “Geological setting” section. A.L. performed EMPA and ICP analyses. All authors participated in the manuscript preparation. All authors have read and agreed to the final version of the manuscript.
Funding
This research received no external funding.
Acknowledgments
We thank the two anonymous reviewers whose comments/suggestions helped improve and clarify this manuscript. This research work was supported by MIUR-Italy Dipartimenti di Eccellenza, ARTICOLO 1, COMMI 314–337 LEGGE 232/2016), by University of Bari (Italy) and by CNR-National Research Council (Italy).
Conflicts of Interest
The authors declare no conflict of interest.
References
- Rogers, N.W.; Hawkesworth, C.J.; Palcz, Z.A. Phlogopite in the generation of olivine-melilitites from Namaqualand, South Africa and implications for element fractionation processes in the upper mantle. Lithos 1994, 28, 347–365. [Google Scholar] [CrossRef]
- Forbes, W.C.; Flower, M.J.F. Phase relations of titan-phlogopite, K2Mg4TiAl2Si6O20(OH)4: A refractory phase in the upper mantle? Earth Planet. Sci. Lett. 1974, 22, 60–66. [Google Scholar] [CrossRef]
- Guo, J.; Green, T.H. Experimental study of barium partitioning between phlogopite and silicate liquid at upper-mantle pressure and temperature. Lithos 1990, 24, 83–95. [Google Scholar] [CrossRef]
- Davidson, A.T.; Yoffe, A.D. Hopping Electrical Conduction and Thermal Breakdown in Natural and Synthetic Mica. Phys. Status Solidi 1968, 30, 741–754. [Google Scholar] [CrossRef]
- Bigi, S.; Brigatti, M.F.; Mazzucchelli, M.; Rivalenti, G. Crystal chemical variations in Ba-rich biotites from gabbroic rocks of lower crust (Ivrea Zone, NW Italy). Contrib. Mineral. Petrol. 1993, 113, 87–99. [Google Scholar] [CrossRef]
- Henderson, C.M.B.; Foland, K.A. Ba- and Ti-rich primary biotite from the Brome alkaline igneous complex, Monteregian Hills, Quebec: Mechanisms of substitution. Can. Mineral. 1996, 34, 1241–1252. [Google Scholar]
- Shaw, C.S.J.; Penczak, R.S. Barium- and titanium-rich biotite and phlogopite from the western and eastern gabbro, Coldwell Alkaline Complex, northwestern Ontario. Can. Mineral. 1996, 34, 967–975. [Google Scholar]
- Lippard, S.J. Petrology of alkali wehrlite sills in the Oman Mountains. Mineral. Mag. 1984, 48, 13–20. [Google Scholar] [CrossRef]
- Kogarko, L.N.; Ryabchikov, I.D.; Kuzmin, D.V. High-Ba mica in olivinites of the Guli massif (Maimecha–Kotui province, Siberia). Russ. Geol. Geophys. 2012, 53, 1209–1215. [Google Scholar] [CrossRef]
- Mansker, W.L.; Ewing, R.C.; Keil, K. Barian-titanian biotites in nephelinites from Oahu, Hawaii. Am. Mineral. 1979, 64, 156–159. [Google Scholar]
- Mitchell, R.H.; Platt, R.G. Primitive nephelinitic volcanism associated with rifting and uplift in the Canadian Arctic. Nature 1983, 303, 609–612. [Google Scholar] [CrossRef]
- Zhang, M.; Suddaby, P.; Thompson, R.N.; Dungan, M.A. Barian titanian phlogopite from potassic lavas in northeast China: Chemistry, substitutions, and paragenesis. Am. Mineral. 1993, 78, 1056–1065. [Google Scholar]
- Gaeta, M.; Fabrizio, G.; Cavarretta, G. F-phlogopites in the Alban Hills Volcanic District (Central Italy): Indications regarding the role of volatiles in magmatic crystallization. J. Volcanol. Geotherm. Res. 2000, 99, 179–193. [Google Scholar] [CrossRef]
- Boctor, N.Z.; Yoder, H.S., Jr. Petrology of some melilite-bearing rocks from Cape Province, Republic of South Africa: Relationship to kimberlites. Am. J. Sci. 1986, 286, 513–539. [Google Scholar] [CrossRef]
- Dunworth, E.A.; Wilson, M. Olivine melilitites of the SW German Tertiary Volcanic Province: Mineralogy and petrogenesis. J. Petrol. 1998, 39, 1805–1836. [Google Scholar] [CrossRef]
- Greenwood, J.C. Barian-titanian micas from Ilha da Trindade, South Atlantic. Mineral. Mag. 1998, 62, 687–695. [Google Scholar] [CrossRef]
- Cruciani, G.; Zanazzi, P.F. Cation partitioning and substitution mechanisms in 1M phlogopite; a crystal chemical study. Am. Mineral. 1994, 79, 289–301. [Google Scholar]
- Brigatti, M.F.; Guggenheim, S. Mica Crystal Chemistry and the Influence of Pressure, Temperature, and Solid Solution on Atomistic Models. In Micas: Crystal Chemistry and Metamorphic Petrology; Mottana, A., Sassi, F.P., Thompson, J.B., Guggenheim, S., Eds.; Mineralogical Society of America: Washington, DC, USA, 2002; Volume 46, pp. 1–97. [Google Scholar]
- Giuseppetti, G.; Tadini, C. The crystal structure of 2O brittle mica: Anandite. Tschermaks Mineral. Petrogr. Mitt. 1972, 18, 169–184. [Google Scholar] [CrossRef]
- Kato, T.; Miura, Y.; Yoshii, M.; Maeda, K. The crystal structures of 1M-kinoshitalite, a new barium brittle mica and 1M-manganese trioctahedral micas. Mineral. J. 1979, 9, 392–408. [Google Scholar] [CrossRef]
- Guggenheim, S.; Frimmel, H.E. Ferrokinoshitalite, a new species of brittle mica from the Broken Hill mine, South Africa: Structural and mineralogical characterization. Can. Mineral. 1999, 37, 1445–1452. [Google Scholar]
- Speer, R. Micas in igneous rocks. In Micas (Reviews in Mineralogy 13); Bailey, S.W., Ed.; Mineralogical Society of America: Washington, DC, USA, 1984; pp. 299–349. [Google Scholar]
- Waters, D.J.; Charnley, N.R. Local equilibrium in polymetamorphic gneiss and the titanium substitution in biotite. Am. Mineral. 2002, 87, 383–396. [Google Scholar] [CrossRef]
- Patiño Douce, A.E. Titanium substitution in biotite; an empirical model with applications to thermometry, O2 and H2O barometries, and consequences for biotite stability. Chem. Geol. 1993, 108, 133–162. [Google Scholar] [CrossRef]
- Dymek, R.F. Titanium, aluminum and interlayer cation substitutions in biotite from high-grade gneisses, West Greenland. Am. Mineral. 1983, 68, 880–899. [Google Scholar]
- Cesare, B.; Cruciani, G.; Russo, U. Hydrogen deficiency in Ti-rich biotite from anatectic metapelites (El Joyazo, SE Spain): Crystal-chemical aspects and implications for high-temperature petrogenesis. Am. Mineral. 2003, 88, 583–595. [Google Scholar] [CrossRef]
- Schingaro, E.; Scordari, F.; Mesto, E.; Brigatti, M.F.; Pedrazzi, G. Cation-site partitioning in Ti-rich micas from Black Hill (Australia): A multitechnical approach. Clay Clay Miner. 2005, 53, 179–189. [Google Scholar] [CrossRef]
- Mesto, E.; Schingaro, E.; Scordari, F.; Ottolini, L. An electron microprobe analysis, secondary ion mass spectrometry, and single-crystal X-raydiffraction study of phlogopites from Mt. Vulture, Potenza, Italy: Consideration of cation partitioning. Am. Mineral. 2006, 91, 182–190. [Google Scholar] [CrossRef]
- Festa, V.; Fregola, R.A.; Acquafredda, P.; De Giosa, F.; Monno, A.; Ventruti, G. The enigmatic ascent of Ca-sulphate rocks from a deep dense source layer: Evidences of hydration diapirism in the Lesina Marina area (Apulia, southern Italy). Int. J. Earth Sci. 2019, 1897–1912. [Google Scholar] [CrossRef]
- Vollmer, R. Rb-Sr and U-Th-Pb systemalics of alcaline rocks: The alkaline rocks of Italy. Geochim. Cosmochim. Acta 1976, 40, 283–295. [Google Scholar] [CrossRef]
- Bigazzi, G.; Laurenzi, M.A.; Principe, C.; Brocchini, D. New geochronological data on igneous rocks and evaporites of the Pietre Nere Point (Gargano Peninsula, southern Italy). Boll. Soc. Geol. Ital. 1996, 115, 439–448. [Google Scholar]
- De Fino, M.; La Volpe, L.; Piccarreta, G. Geochemistry and petrogenesis of the Paleocene platform magmatism at Punta delle Pietre Nere (Southeastern Italy). Neues Jahrb. Miner. Abh. 1981, 142, 161–177. [Google Scholar]
- Lavecchia, G.; Bell, K. Magmatectonic Zonation of Italy: A Tool to Understanding Mediterranean Geodynamics. In Updates in Volcanology—A Comprehensive Approach to Volcanological Problems; Stoppa, F., Ed.; InTech: London, UK, 2012; ISBN 978-953-307-434-4. Available online: http://www.intechopen.com/books/updates-in-volcanology-a-comprehensive-approach-to-volcanological-problems/magmatectonic-zonation-of-italy-a-tool-to-understanding-mediterranean-geodynamics (accessed on 1 July 2020).
- Vollmer, R. On the origin of Italian potassic magmas: A one-dimensional diffusion controlled model of source metasomatism. Earth Planet. Sci. Lett. 1991, 107, 487–498. [Google Scholar] [CrossRef]
- De Astis, G.; Kempton, P.D.; Peccerillo, A.; Wu, T.W. Trace element and isotopic variations from Mt. Vulture to Campanian volcanoes: Constraints for slab detachment and mantle inflow beneath southern Italy. Contrib. Mineral. Pet. 2006, 151, 331–351. [Google Scholar] [CrossRef]
- Mazzeo, F.; Arienzo, I.; Aulinas, M.; Casalini, M.; Di Renzo, V.; D’Antonio, M. Mineralogical, geochemical and isotopic characteristics of alkaline mafic igneous rocks from Punta delle Pietre Nere (Gargano, Southern Italy). Lithos 2018, 308–309, 316–328. [Google Scholar] [CrossRef]
- Pilla, L. Rapporto 1° e 2° a S.E. il Ministro Segretario degli interni. Atti della Società Economica Capitanata Foggia 1840, 5. [Google Scholar]
- Carella, R. Gli eruttivi di San Giovanni in Pane e della Punta delle Pietre Nere (Gargano). Boll. Soc. Geol. Ital. 1963, 82, 97–109. [Google Scholar]
- Amendolagine, M.; Dell’Anna, L.; Ventriglia, U. Le rocce ignee alla Punta delle Pietre Nere presso Lesina (Provincia Foggia). Period. Mineral. 1964, 33, 337–444. [Google Scholar]
- Bruker. APEX2, SAINT and TWINABS; Bruker AXS Inc.: Madison, WI, USA, 2008. [Google Scholar]
- Sheldrick, G.M. SADABS, Program for Empirical Absorption Correction; University of Gottingen: Gottingen, Germany, 1996. [Google Scholar]
- Sheldrick, G.M. XPREP; Bruker AXS Inc.: Madison, WI, USA, 2005. [Google Scholar]
- Betteridge, P.W.; Carruthers, J.R.; Cooper, R.I.; Prout, K.; Watkin, D.J. CRYSTALS version 12: Software for guided crystal structure analysis. J. Appl. Crystallogr. 2003, 36, 1487. [Google Scholar] [CrossRef]
- Scordari, F.; Ventruti, G.; Sabato, A.; Bellatreccia, F.; Della Ventura, G.; Predazzi, G. Ti-rich phlogopite from Mt. Vulture (Potenza, Italy) investigated by a multianalytical approach: Substitutional mechanisms and orientation of the OH dipoles. Eur. J. Mineral. 2006, 18, 379–391. [Google Scholar] [CrossRef]
- De Fino, M.; La Volpe, L.; Piccarreta, G. Mafic minerals from Punta delle Pietre Nere Subvolcanites (Gargano, Southern Italy): Their petrological significance. Tschermak’s Mineral. Petrogr. Mitt. 1983, 32, 69–78. [Google Scholar] [CrossRef]
- Wyllie, P.J. The habit of apatite in synthetic systems and igneous rocks. J. Petrol. 1962, 3, 238–243. [Google Scholar] [CrossRef]
- Irvine, T.N.; Baragar, W.R.A. A guide to the chemical classification of the common volcanic rocks. Can. J. Earth Sci. 1971, 8, 523–548. [Google Scholar] [CrossRef]
- McDonough, W.F.; Sun, S. The composition of the Earth. Chem. Geol. 1995, 120, 223–253. [Google Scholar] [CrossRef]
- Sun, S.; McDonough, W.F. Chemical and isotopic systematics of oceanic basalts: Implications for mantle composition and processes. Geol. Soc. Lond. Spec. Publ. 1989, 42, 313–345. [Google Scholar] [CrossRef]
- Avanzinelli, R.; Sapienza, G.T.; Conticelli, S. The Cretaceous to Paleogene within-plate magmatism of Pachino-Capo Passero(southeastern Sicily) and Adria (La Queglia and Pietre Nere, southern Italy): Geochemical and isotopic evidence against a plume-related origin of circum-Mediterranean magmas. Eur. J. Mineral. 2012, 24, 73–96. [Google Scholar] [CrossRef]
- Morimoto, N. Nomenclature of Pyroxenes. Miner. Petrol. 1988, 39, 55–76. [Google Scholar] [CrossRef]
- Ventruti, G.; Levy, D.; Pavese, A.; Scordari, F.; Suard, E. High-temperature treatment, hydrogen behaviour and cation partitioning of a Fe-Ti bearing volcanic phlogopite by in situ neutron powder diffraction and FTIR spectroscopy. Eur. J. Mineral. 2009. [Google Scholar] [CrossRef]
- Kogarko, L.N.; Uvarova, Y.A.; Sokolova, E.; Hawthorne, F.C.; Ottolini, L.; Grice, J.D. Oxykinoshitalite, a new mica from Fernando-de-Norohna Island, Brazil: Occurrence and crystal structure. Can. Mineral. 2005, 43, 1501–1510. [Google Scholar] [CrossRef]
- Ventruti, G.; Zema, M.; Scordari, F.; Pedrazzi, G. Thermal behavior of a Ti-rich phlogopite from Mt. Vulture (Potenza, Italy): An in situ X-ray single crystal diffraction study. Am. Mineral. 2008, 93, 632–643. [Google Scholar] [CrossRef]
- Nespolo, M.; Ferraris, G.; Ivaldi, G.; Hoppe, R. Charge distribution as a tool to investigate structural details. II. Extension to hydrogen bonds, distorted and hetero-ligand polyhedra. Acta Cryst. 2001, B57, 652–664. [Google Scholar] [CrossRef]
- Kunz, M.; Armbruster, T.; Lager, G.A.; Schultz, A.J.; Goyette, R.J.; Lottefinoser, W.; Amthauer, G. Fe,Ti ordering and octahedral distortions in acentric neptunite: Temperature dependent X-ray and neutron structure refinements and Mössbauer spectroscopy. Phys. Chem. Miner. 1991, 18, 199–213. [Google Scholar] [CrossRef]
- McKeown, D.A.; Bell, M.I.; Etz, E.S. Raman spectra and vibrational analysis of the trioctahedral mica phlogopite. Am. Mineral. 1999, 84, 970–976. [Google Scholar] [CrossRef]
- Wang, A.; Freeman, J.J.; Jolliff, B.L. Understanding the Raman spectral features of phyllosilicates. J. Raman Spectrosc. 2015, 46, 829–845. [Google Scholar] [CrossRef]
- Scordari, F.; Schingaro, E.; Ventruti, G.; Lacalamita, M.; Ottolini, L. Red micas from basal ignimbrites of Mt. Vulture (Italy): Interlayer content appraisal by a multi-methodic approach. Phys. Chem. Miner. 2008, 35, 163–174. [Google Scholar] [CrossRef]
- Shannon, R.D. Revised effective ionic radii and systematic studies of interatomic distances in halides and chalcogenides. Acta Cryst. 1976, A32, 751–767. [Google Scholar] [CrossRef]
- Jurewicz, A.J.G.; Watson, E.B. Calcium partitioning and calcium-magnesium distribution between olivines and coexisting melts, with petrologic applications. Contrib. Mineral. Pet. 1988, 99, 176–185. [Google Scholar] [CrossRef]
- Köhler, T.P.; Brey, G.P. Calcium exchange between olivine and clinopyroxene calibrated as a geothermobarometer for natural peridotites from 2 to 60 kb with applications. Geochim. Cosmochim. Acta 1990, 54, 2375–2388. [Google Scholar] [CrossRef]
- Van Tongeren, J.A.; Keleman, P.B.; Hnghøj, K. Cooling rates in the lower crust of the Oman ophiolite: Ca in olivine, revisited. Earth Planet. Sci. Lett. 2008, 267, 69–82. [Google Scholar] [CrossRef]
- Barnett, R.L.; Laroulandie, C. Barium and titanium enrichment of zoned phlogopite xenocrysts and phenocrysts in the Adamantin kimberlites, Québec, Canada. In Proceedings of the 11th International Kimberlite Conference, Gaborone, Botswana, 18–22 September 2017; Extended Abstract No. 11IKC-004587. 3p. [Google Scholar]
© 2020 by the authors. Licensee MDPI, Basel, Switzerland. This article is an open access article distributed under the terms and conditions of the Creative Commons Attribution (CC BY) license (http://creativecommons.org/licenses/by/4.0/).