Magnetic Survey for Iron-Oxide-Copper-Gold (IOCG) and Alkali Calcic Alteration Signatures in Gadarwara, M.P, India: Implications on Copper Metallogeny

Abstract
1. Introduction
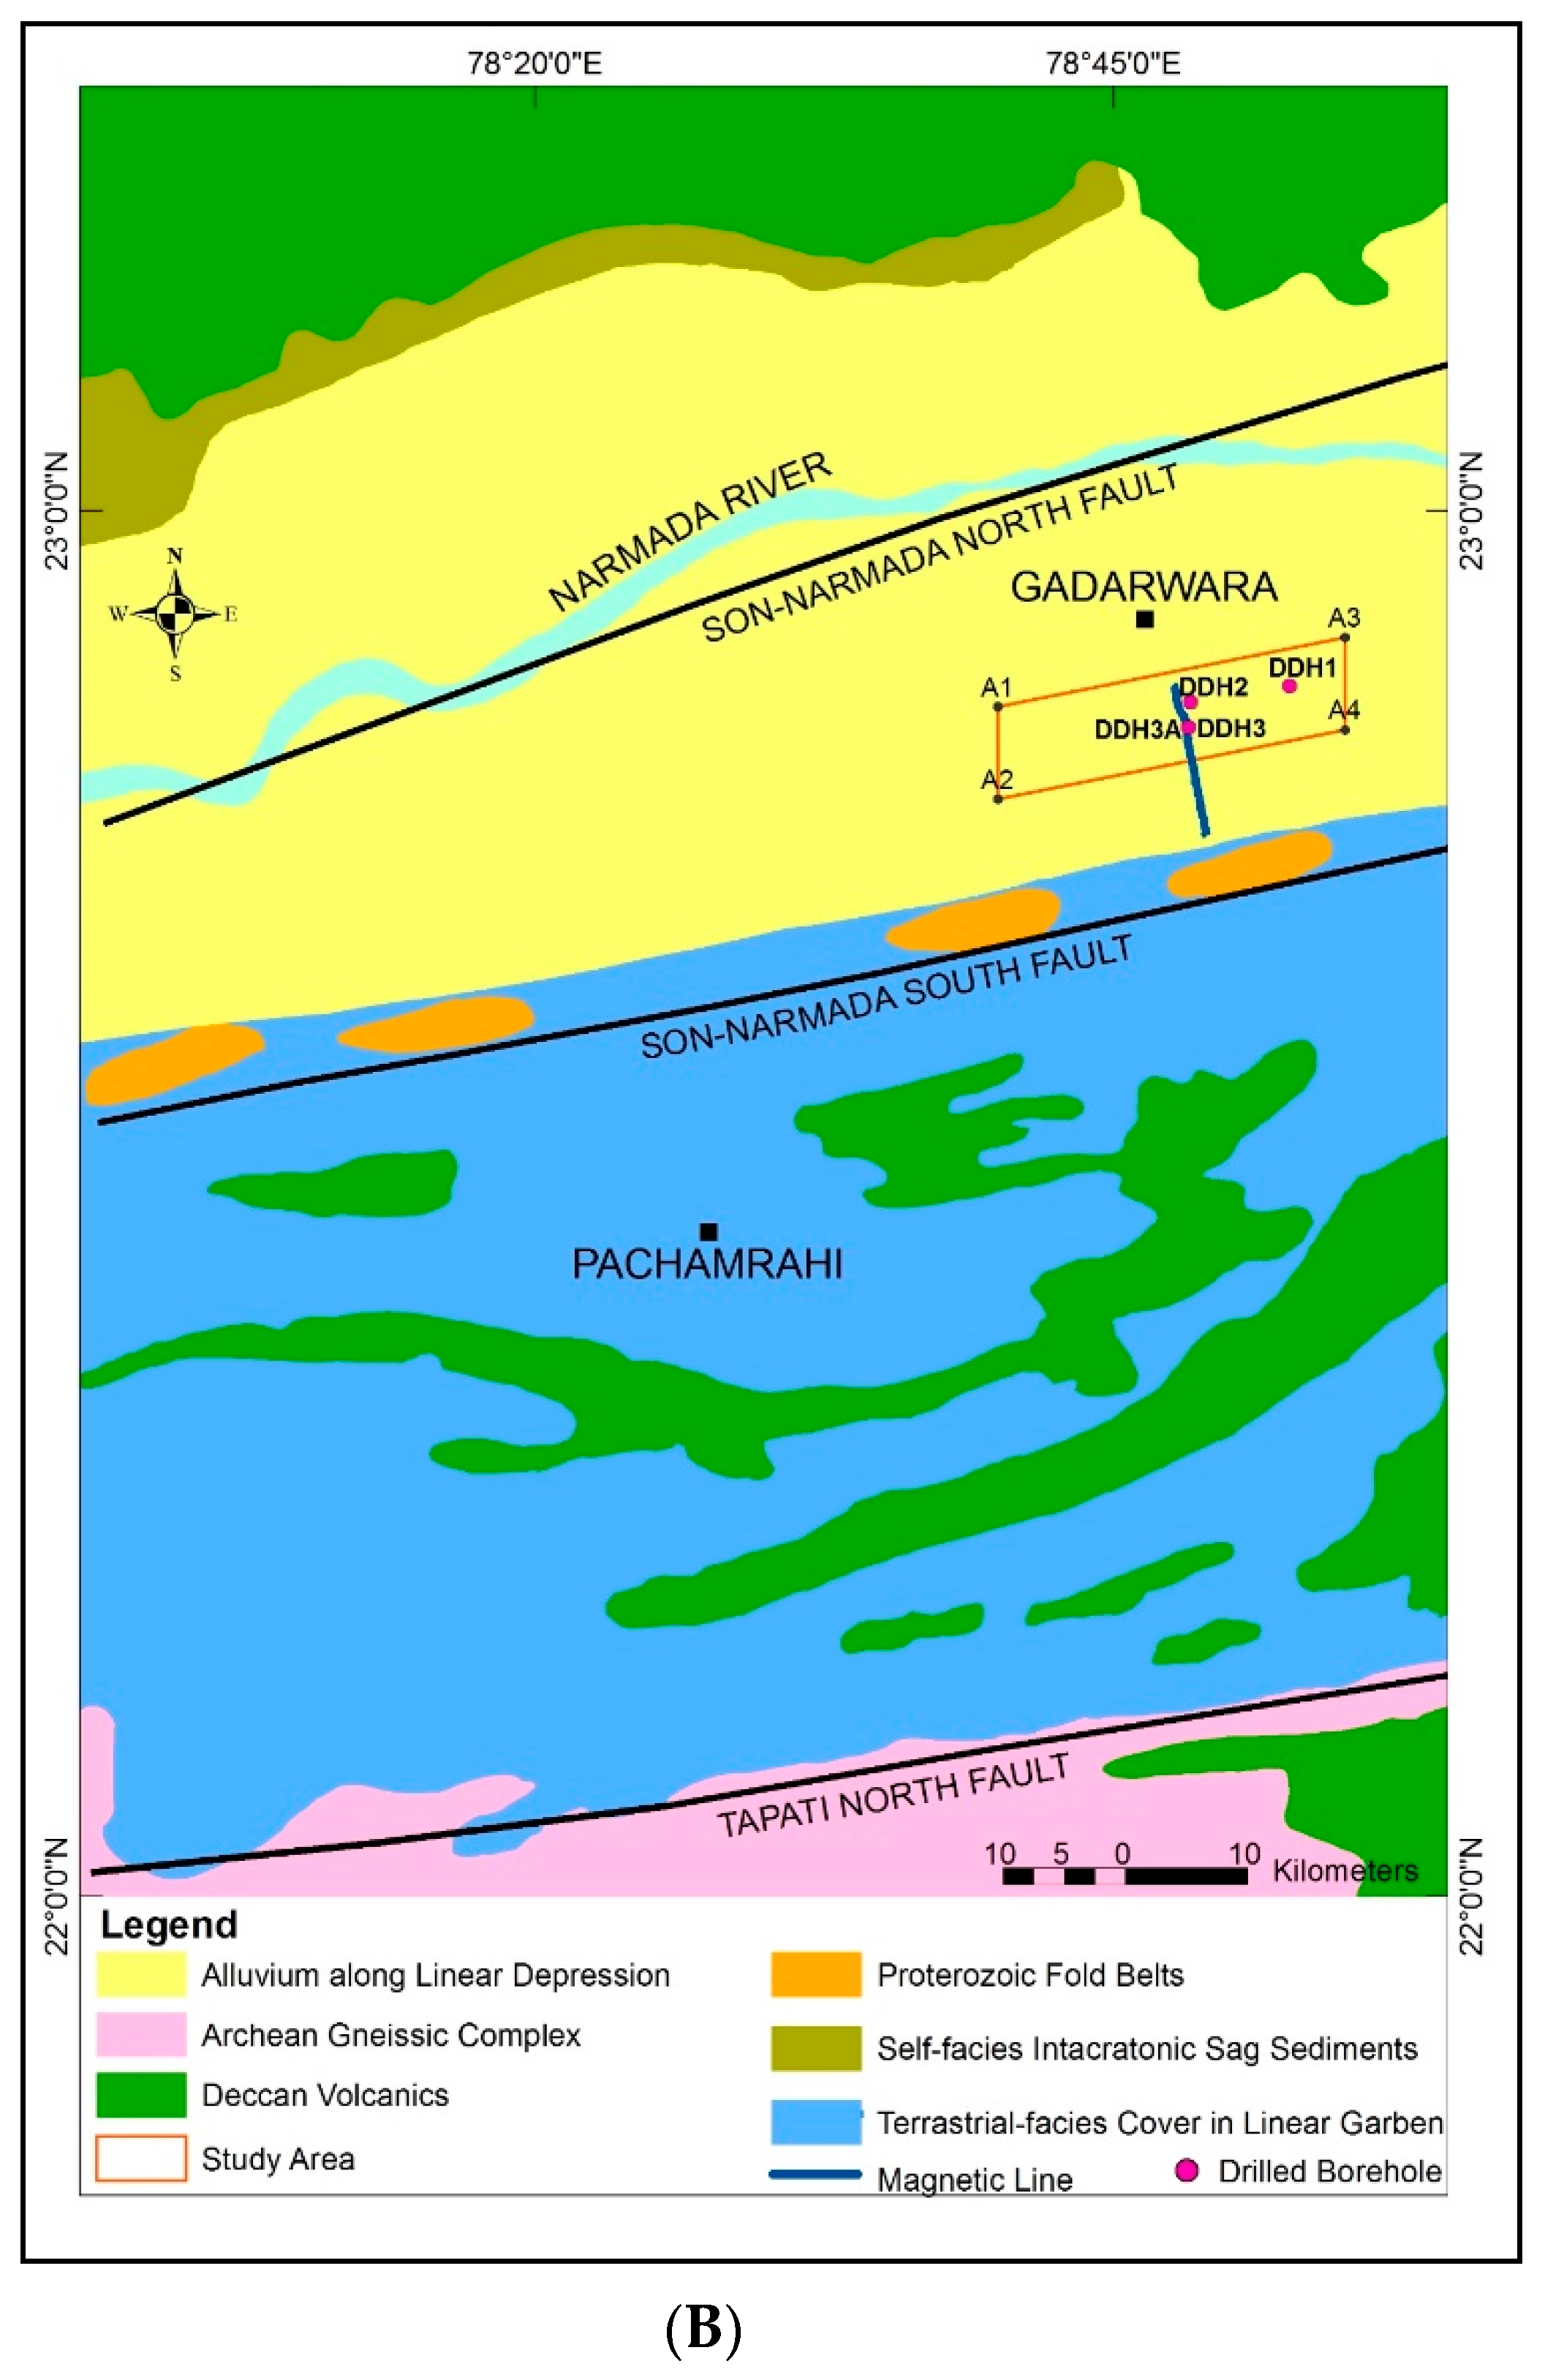
2. Regional Geology
3. Methodology
3.1. Magnetic Survey
3.2. The Gadarwara Magnetic Anomaly
4. Results
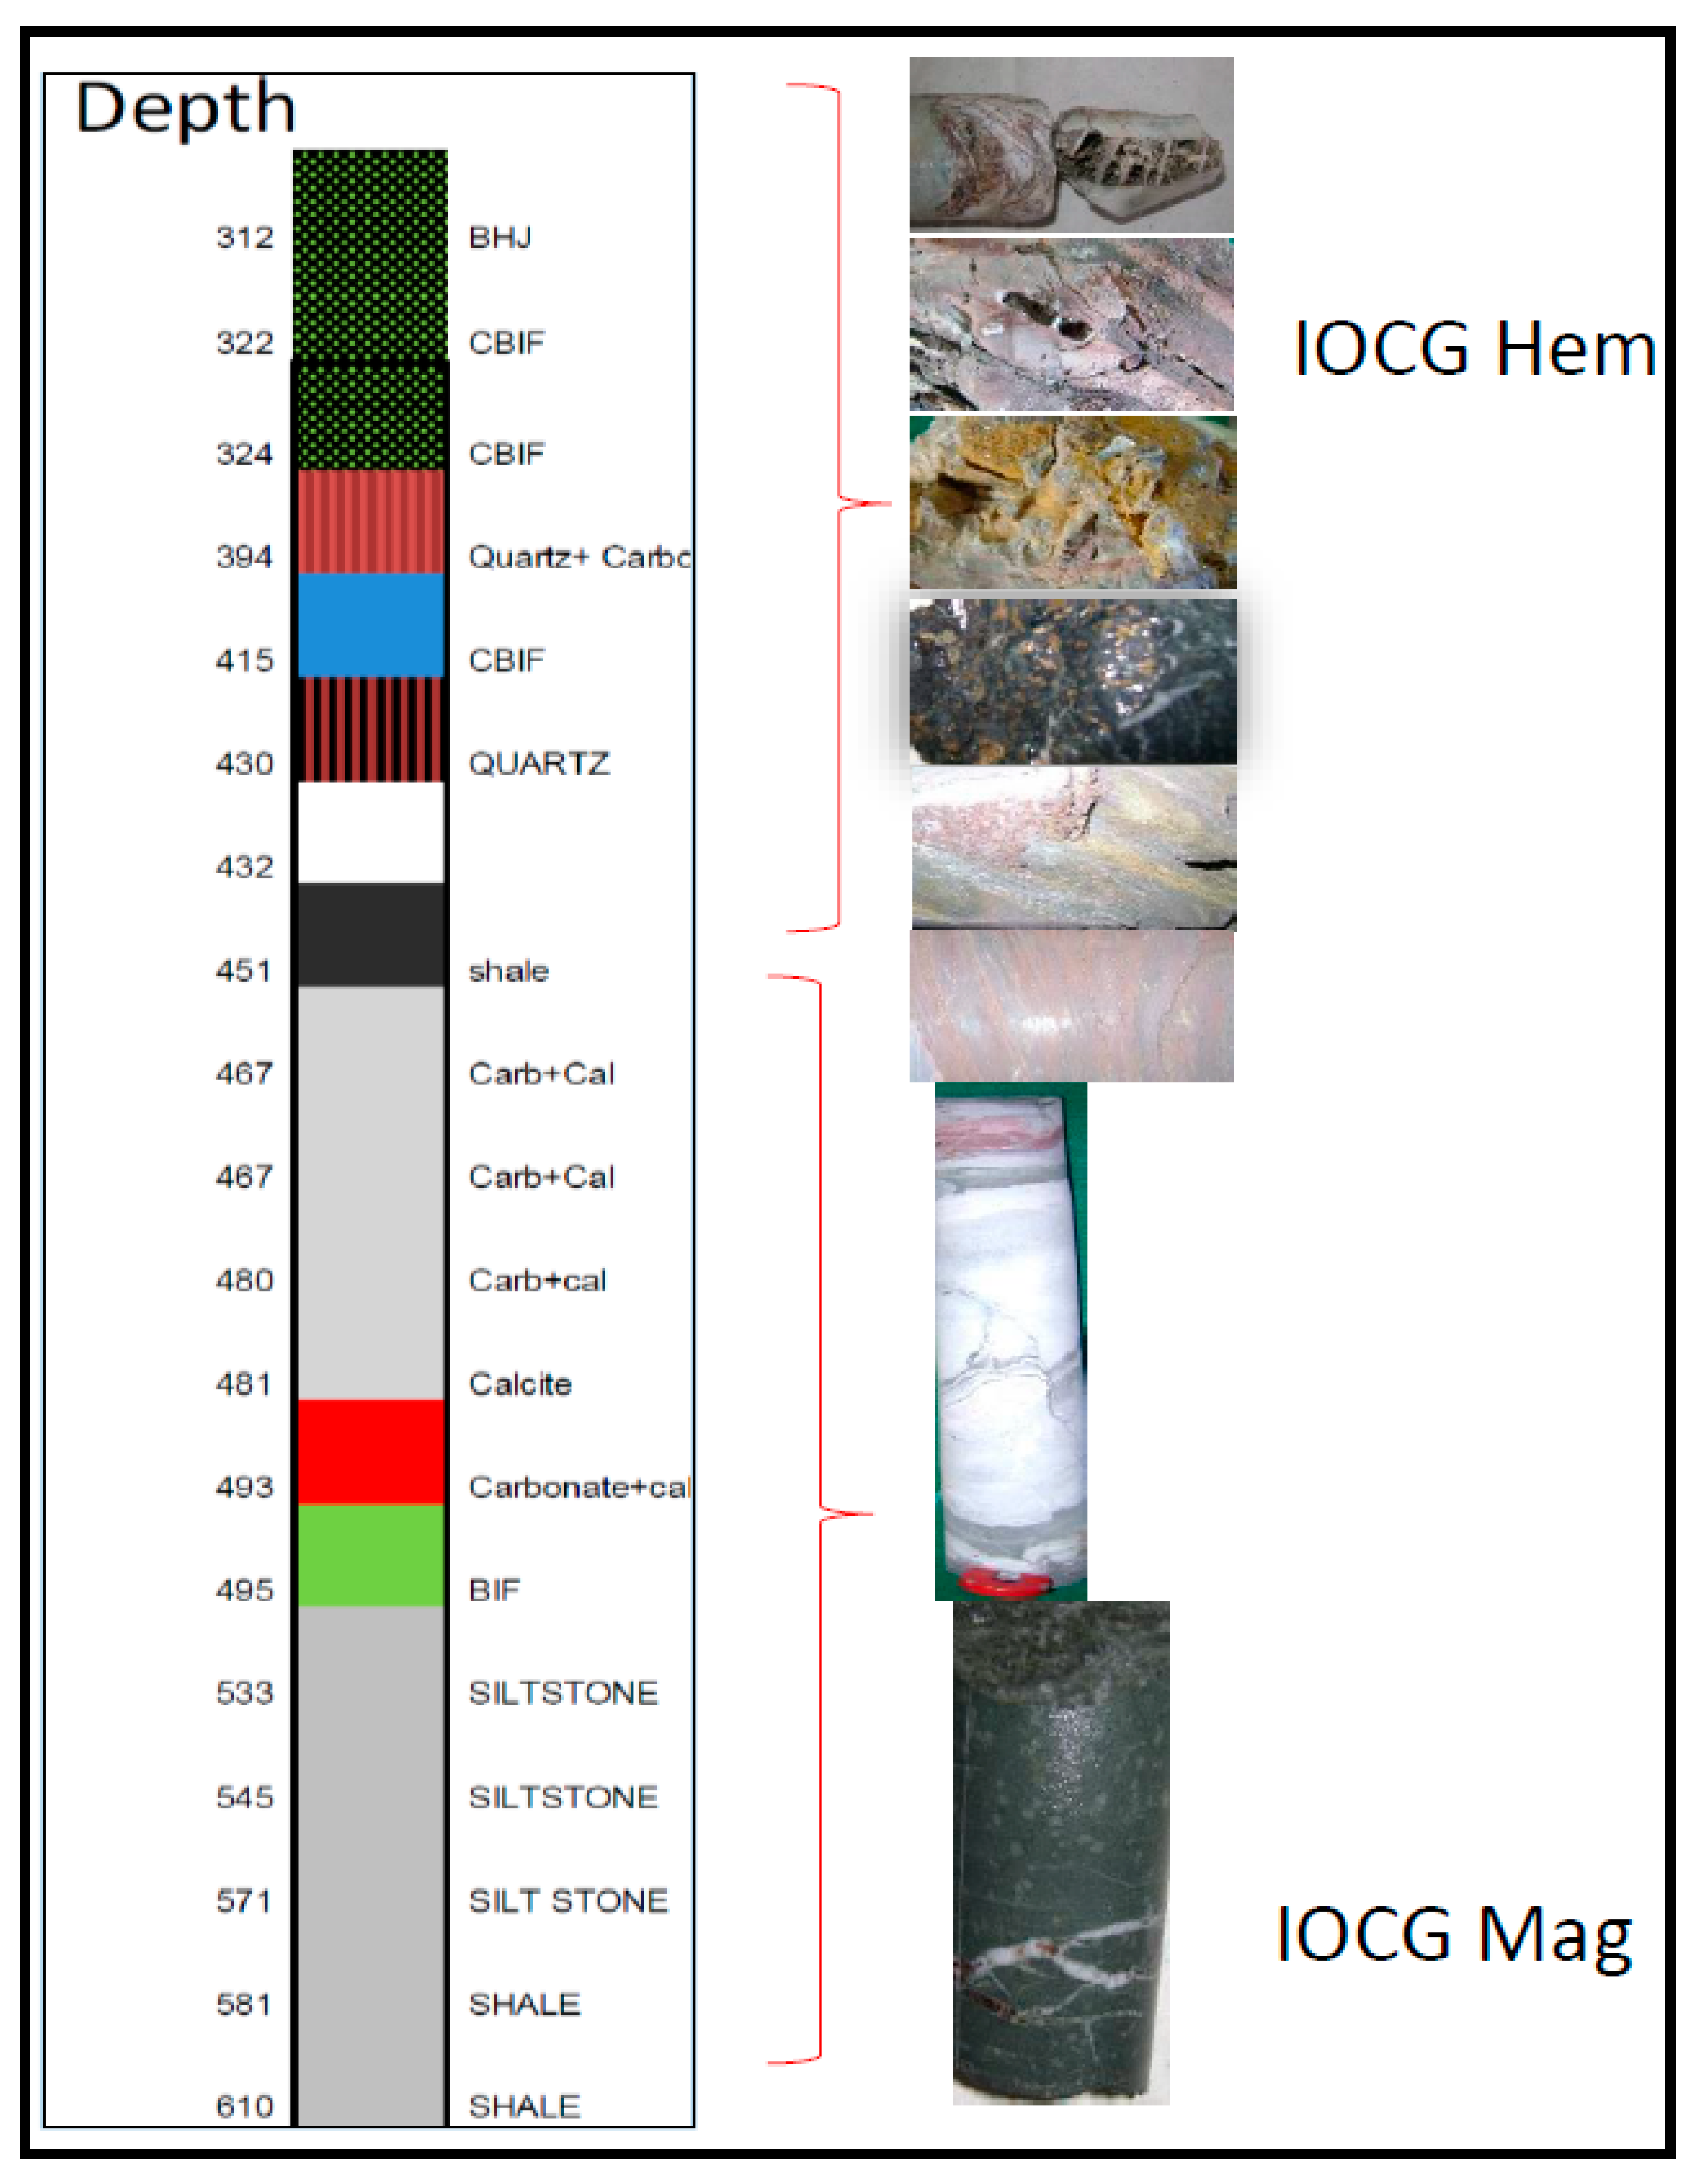
4.1. Drilling Results
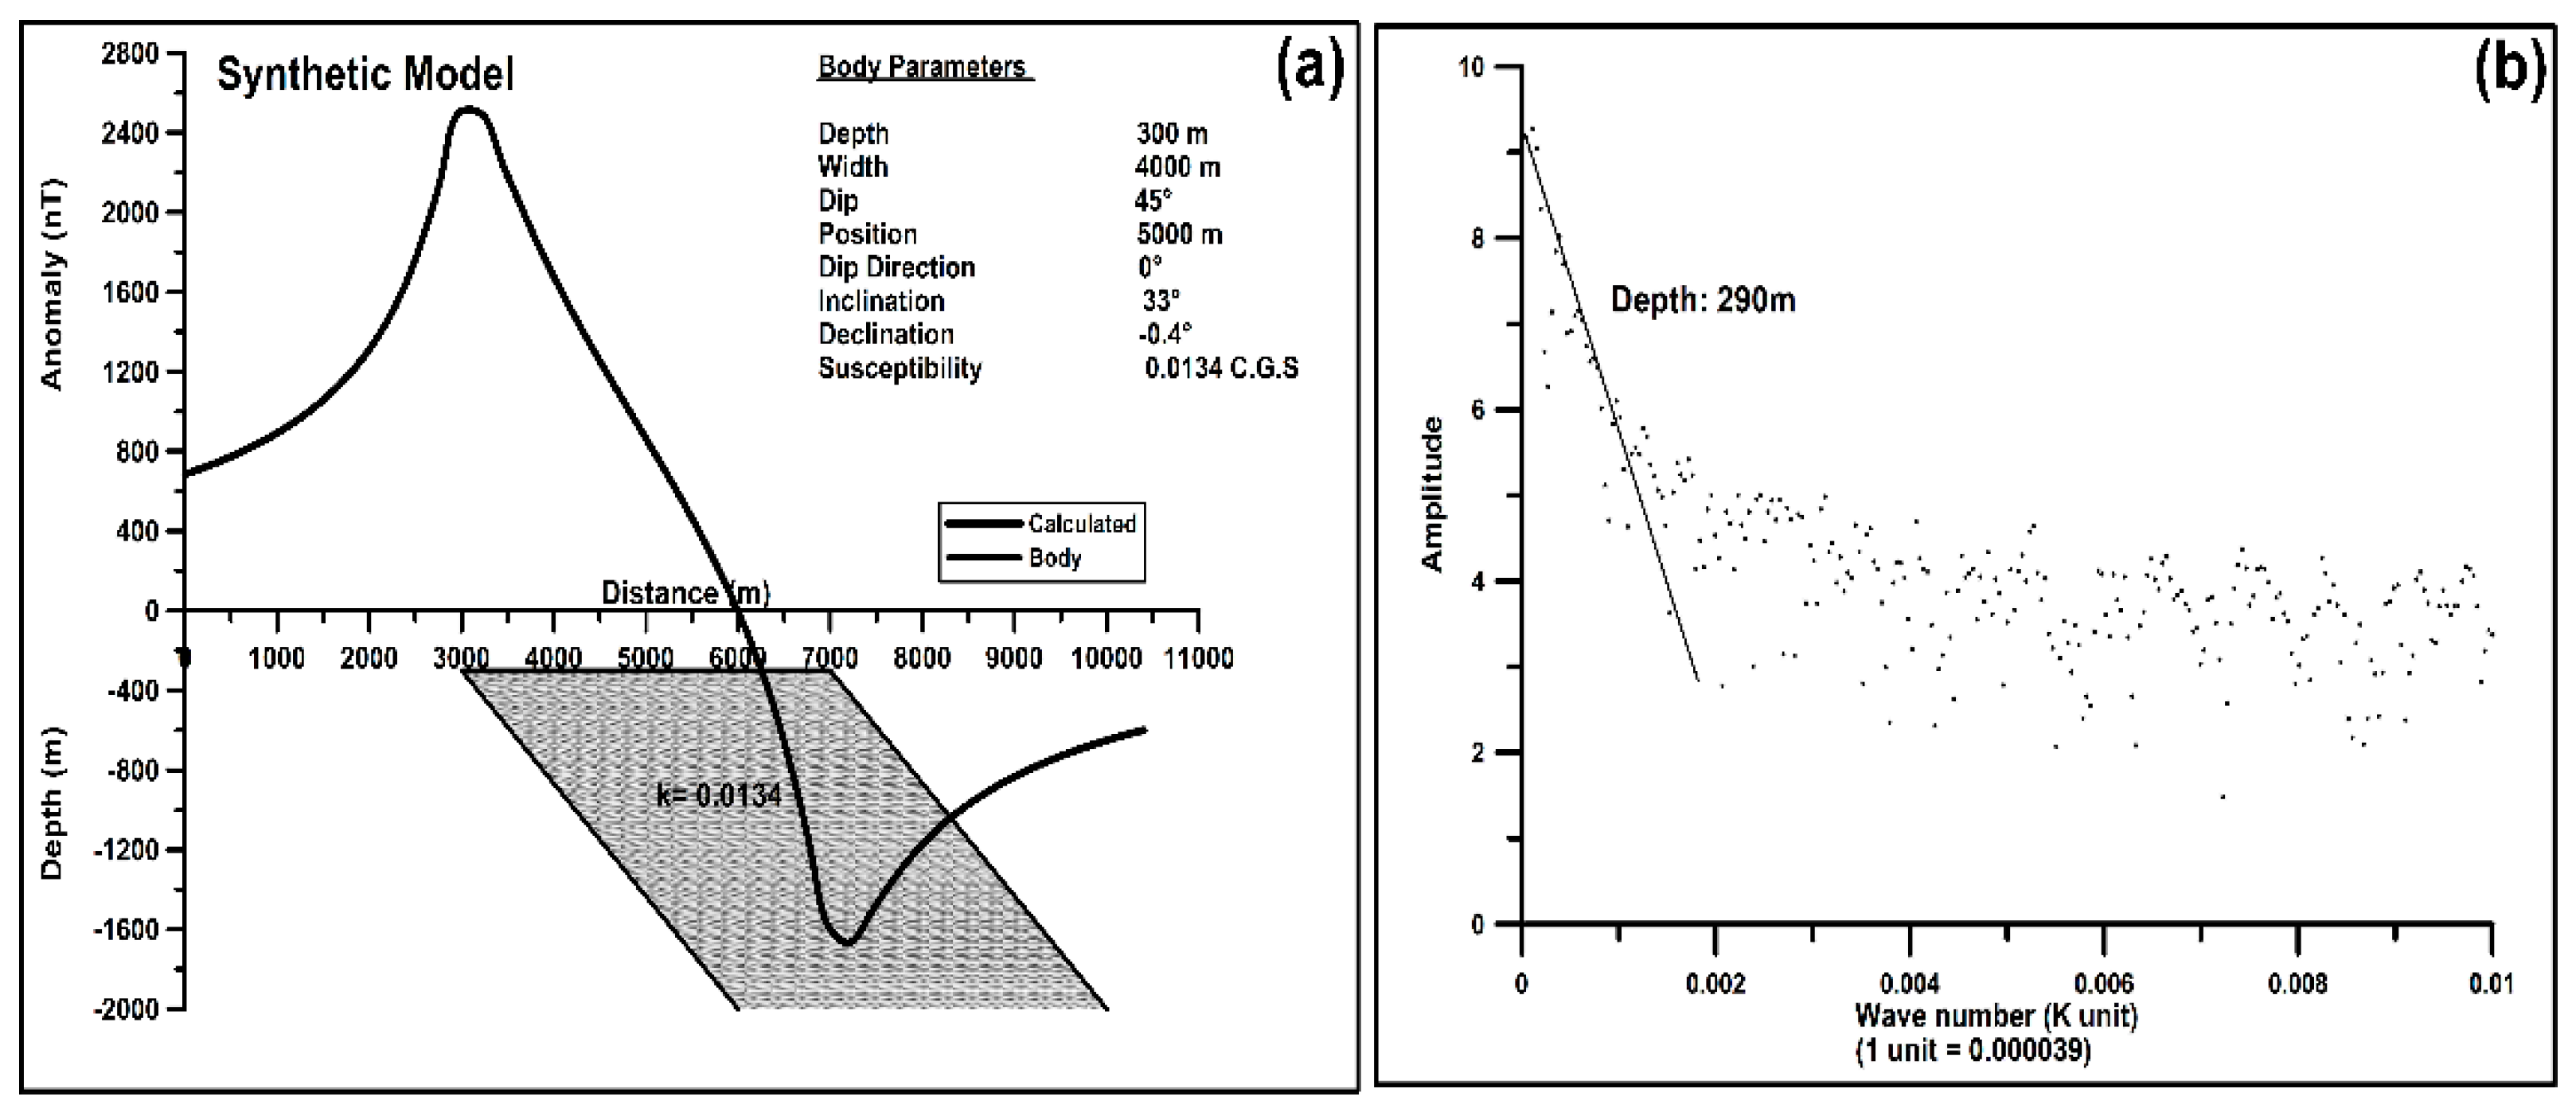
4.2. Magnetic Anomaly Modelling
5. Discussion
6. Conclusions
Author Contributions
Funding
Acknowledgments
Conflicts of Interest
References
- Hitzman, M.W.; Porter, T.M. Iron oxide-Cu-Au deposits: What, where, when, and why. Hydrothermal Iron Oxide Copp. -Gold Relat. Depos. A Glob. Perspect. 2000, 1, 9–25. [Google Scholar]
- Hitzman, M.W.; Porter, T.M. Current Understanding of Iron Oxide Associated-Alkali Altered Mineralised Systems: Part II, A Review. In 2010 Hydrothermal Iron Oxide Copper-Gold and Related Deposits: A Global Perspective; Porter, T.M., Ed.; PGC Publishing: Adelaide, Australia, 2010; Volume 3, pp. 33–106. [Google Scholar]
- Bastrakov, E.N.; Skirrow, R.G. Fluid evolution and origin of Cu and Au prospect in the Olympic dam district, Gawler Craton, South Australia. Econ. Geol. 2007, 102, 1415–1440. [Google Scholar] [CrossRef]
- Skirrow, R.G.; Bastrakov, E.N.; Barovich, K.; Fraser, G.L.; Creaser, R.A.; Fanning, C.M.; Davidson, G.J. Timing of iron oxide Cu-Au-(U) hydrothermal activity and Nd isotope constraints on metal sources in the Gawler craton, South Australia. Econ. Geol. 2007, 102, 1441–1470. [Google Scholar] [CrossRef]
- Ehrig, K.; McPhie, J.; Kamenetsky, V.S. Geology and Mineralogical Zonation of the Olympic Dam Iron-OxideCu-U-Au-Ag Deposit, South Australia. Available online: https://www.researchgate.net/profile/Vadim_Kamenetsky/publication/291217932_Geology_and_mineralogical_zonation_of_the_Olympic_Dam_iron_oxide_Cu-U-AuAg_deposit_South_Australia/links/5c403ec1a6fdccd6b5b2dd26/Geology-and-mineralogical-zonation-of-the-Olympic-Dam-iron-oxide-Cu-U-Au-Ag-deposit-South-Australia.pdf (accessed on 6 July 2020).
- Groves, D.I.; Bierlein, F.P.; Meinert, L.D.; Hitzman, M.W. Iron oxide copper-gold (IOCG) deposits through Earth history: Implications for origin, lithospheric setting, and distinction from other epigenetic iron oxide deposits. Econ. Geol. 2010, 105, 641–654. [Google Scholar] [CrossRef]
- Skirrow, R.G. Gold-copper-bismuth deposits of the Tennant Creek district, Australia: A reappraisal of diverse high-grade systems. In Hydrothermal Iron Oxide Copper-Gold & Related Deposits: A Global Perspective; Porter, T.M., Ed.; PGC Publishing: Adelaide, Australia, 2000; Volume 1, pp. 149–160. [Google Scholar]
- Williams, P.J.; Corriveau, L.; Mumin, A.H. Magnetite-group IOCGs with special reference to Cloncurry (NW Queensland) and northern Sweden: Settings, alteration, deposit characteristics, fluid sources, and their relationship to apatite-rich iron ores. Geol. Assoc. Can. Short Course Notes 2010, 20, 23–38. [Google Scholar]
- Corriveau, L.; Montreuil, J.-F.; Potter, E.G. Alteration facies linkages among IOCG, IOA, and affiliated deposits in the Great Bear magmatic zone. Can. Econ Geol. 2016, 111, 2045–2072. [Google Scholar] [CrossRef]
- Torresi, I.; Xavier, R.P.; Bortholoto, D.F.; Monteiro, L.V. Hydrothermal alteration, fluid inclusions and stable isotope systematics of the Alvo 118 iron oxide–copper–gold deposit, Carajás Mineral Province (Brazil): implications for ore genesis. Miner. Depos. 2012, 47, 299–323. [Google Scholar] [CrossRef]
- Hunt, J.A.; Baker, T.; Thorkelson, D.J. A review of iron oxide copper-gold deposits, with focus on the Wernecke Breccias, Yukon, Canada, as an example of a non-magmatic end member and implications for IOCG genesis and classification. Explor. Min. Geol. 2007, 16, 209–232. [Google Scholar] [CrossRef]
- Mumin, A.H. The IOCG-Porphyry-Epithermal Continuum of Deposit Types in the Great Bear Magmatic Zone, Northwest Territories, Canada. In Exploring for iron Oxide Copper-Gold Deposits: Canada and Global Analogues; Corriveau, L., Mumin, H., Eds.; Geological Association of Canada: St. John’s, NL, Canada, 2010; pp. 59–78. [Google Scholar]
- Knight, J. The Khetri copper belt, Rajasthan: iron-oxide copper-gold terrane in the Proterozoic of NW India. In Hydrothermal Iron Oxide Copper-Gold & Related Deposits: A Global Perspective; Porter, T.M., Ed.; PGC Publishing: Adelaide, Australia, 2002; Volume 2, pp. 321–341. [Google Scholar]
- Pal, D.C.; Barton, M.D.; Sarangi, A.K. Deciphering a multistage history affecting U-Cu (-Fe) mineralization in the Singhbhum Shear Zone, eastern India, using pyrite textures and compositions in the Turamdih U-Cu (-Fe) deposit. Miner. Depos. 2009, 44, 61–80. [Google Scholar] [CrossRef]
- Corriveau, L.; Potter, E.G.; Montreuil, J.F.; Blein, E.K.; Fabris, A.; Reid, A.J. Alteration facies of IOA, IOCG and affiliated deposit: Understanding the similarities recognising the diversity of the ore systems GSA. In Proceedings of the GSSA Workshop, Qubéc, QC, Canada, 11–12 May 2019. [Google Scholar]
- Corriveau, L.; Williams, P.J.; Mumin, A.H. Alteration vectors to IOCG mineralisation–From uncharted terranes to deposits. Can. Glob. Analog. 2010, 20, 89110. [Google Scholar]
- Kirmani, I.R.; Chander, S. Petrology, geochemistry and fluid inclusion studies of Cu-Au mineralization in paleoproterozoic Salumber-Ghatol belt, Aravalli Supergroup, Rajasthan. J. Geol. Soc. India. 2012, 80, 5–38. [Google Scholar]
- Dora, M.L.; Saha, A.K.; Randive, K.R.; Rao, K.K. Iron oxide–copper–gold mineralization at Thanewasna, western Bastar Craton. Curr.Sci. 2017, 112, 1045–1050. [Google Scholar] [CrossRef]
- Shukla, A.K.; Behera, P.; Basavaraja, K.; Mohanty, M. Iron oxide–copper–gold-type mineralization in Machanur area, Eastern Dharwar Craton, India. Curr. Sci. 2016, 5, 1853–1858. [Google Scholar] [CrossRef]
- NGRI. High-Resolution Air Borne Geophysical Surveys for Mineral Exploration—Aeromagnetic Discovery of Gadarwara Gold Prospect; NGRI Report; NGRI: Hyderabad, India, 2007; p. 59. [Google Scholar]
- Mazumder, R.; De, S.; Sunder Raju, P.V. Archean-Proterozoic transition: the Indian perspective. Earth Sci. Rev. 2019, 188, 427–440. [Google Scholar] [CrossRef]
- Crumansonata. Crumansonata Geoscientific studies of the Son–Narmada–Tapti Lineament Zone. Geol. Surv. India Spec. Publ. 1995, 10, 244. [Google Scholar]
- Chakraborty, C.; Bhattacharya, A.A. The Vindhyan Basin: An overview in the light of crustal perspective. Mem. Geol. Soc. India. 1996, 36, 301–312. [Google Scholar]
- Yedekar, D.B. The central Indian collision suture. Geol. Surv. India, Spec. Publ. 1990, 28, 1–4. [Google Scholar]
- Acharyya, S.K.; Roy, A. Tectonothermal history of the Central Indian Tectonic Zone and reactivation of major faults/shear zones. J. Geol. Soc. India 2000, 55, 239–256. [Google Scholar]
- Chattopadhyay, A.; Khasdeo, L. Structural evolution of Gavilgarh-Tan Shear Zone, central India: A possible case of partitioned transpression during Mesoproterozoic oblique collision within Central Indian Tectonic Zone. Precam. Res. 2011, 186, 70–88. [Google Scholar] [CrossRef]
- Raju, P.V.S.; Hart, C.; Kathal, P. Newly recognized IOCG-like mineralization at Gadarwara, M.P, India. Mineral. Mag. 2014, 77, 2026. [Google Scholar]
- Mallet, F.R. On the Vindhyan Series, as exhibited in the north-western and central provinces of India. Mem. Geol. Surv. India. 1869, 7, 1–129. [Google Scholar]
- Ghosh, D.B. The nature of Narmada-Son Lineament. Geol. Surv. India Misc. Pub. 1976, 34, 119–132. [Google Scholar]
- Nair, K.K.K. Stratigraphy, structure and geochemistry of the Mahakoshal greenstone. Mem. Geol. Soc. India. 1995, 37, 403–432. [Google Scholar]
- Babu, H.R. Relationship of gravity, magnetic, and self-potential anomalies and their application to mineral exploration. Geophysics 2003, 68, 181–184. [Google Scholar] [CrossRef]
- Bickford, M.E.; Mishra, M.; Mueller, P.A.; Kamenov, G.D.; Schieber, J.; Basu, A. U-Pb age and Hf isotopic compositions of magmatic zircons from a rhyolite flow in the Porcellanite Formation in the Vindhyan Supergroup, Son Valley (India): implications for its tectonic significance. J. Geol. 2017, 125, 367–379. [Google Scholar] [CrossRef]
- Ray, J.S.; Martin, M.W.; Veizer, J.; Bowring, S.A. U-Pb zircon dating and Sr isotope systematics of the Vindhyan Supergroup, India. Geology 2002, 30, 131–134. [Google Scholar] [CrossRef]
- Kumar, S.; Schidlowski, M.; Joachimski, M.M. Carbon isotope stratigraphy of the Palaeo-Neoproterozoic Vindhyan Supergroup, central India: implications for basin evolution and intrabasinal correlation. J. Palaeontol. Soc. India 2005, 50, 65–81. [Google Scholar]
- Jain, S.C.; Nair, K.K.K.; Yedekar, D.B. Tectonic evolution of the Son-Narmada-Tapti lineament zone. Geol. Surv. India Spec. Pub. 1995, 10, 333–371. [Google Scholar]
- Mishra, D.C. Gravity and Magnetic Methods for Geological Studies; BS Publications: Hyderabad, India, 2011. [Google Scholar]
- Rao, D.A.; Babu, H.R.; Sinha, G.S. Crustal structure associated with Gondwana graben across the Narmada-Son lineament in India: inference from aeromagnetics. Tectonophysics 1992, 212, 163–172. [Google Scholar] [CrossRef]
- Medlicott, H.B. Notes on Satpura Coal Basin. Mem. Geol. Surv. India 1873, 10, 133–188. [Google Scholar]
- Medlicott, H.B.; Blanford, W.T. A Manual Geology of India; Govt of India Press: Calcutta, India, 1879. [Google Scholar]
- Talwani, M. Computation of magnetic anomalies caused by two-dimensional bodies of arbitrary shape. Comput. Miner. Ind. 1964, 1, 464–480. [Google Scholar]
- Spector, A.; Bhattacharyya, B.K. Energy density spectrum and autocorrelation function of anomalies due to simple magnetic models. Geophys. Prospect. 1966, 14, 242–272. [Google Scholar] [CrossRef]
- Spector, A.; Grant, F.S. Statistical models for interpreting aeromagnetic data. Geophysics 1970, 35, 293–302. [Google Scholar] [CrossRef]
- MacLeod, I.N.; Jones, K.; Dai, T.F. 3-D analytic signal in the interpretation of total magnetic field data at low magnetic latitudes. Explor. Geophys. 1993, 24, 679–688. [Google Scholar] [CrossRef]
- PGW. Program Documentation-MAGMOD Version 1.4 Magnetic Interpretation Software Library; Paterson, Grant and Watson Ltd.: Toronto, ON, Canada, 1982; p. 17. [Google Scholar]
- Raju, P.V.S.; Hart, C.; Kathal, P. Integrated SWIR spectral and XRD studies on core samples from Gadarwara, Central India Craton, Madhya Pradesh, India-footprints for IOCG mineralisation. In Proceedings of the 14th SGA Biennial Meeting, Québec, QC, Canada, 20–23 August 2017; pp. 963–966. [Google Scholar]
- Haynes, D.W.; Porter, T.M. Iron oxide copper (-gold) deposits: Their position in the ore deposit spectrum and modes of origin. Hydrothermal Iron Oxide Copp. -Gold Relat. Depos. A Glob. Perspect. 2000, 1, 71–90. [Google Scholar]
- Hitzman, M.W.; Oreskes, N.; Einaudi, M.T. Geological characteristics and tectonic setting of proterozoic iron oxide (Cu-U-Au-REE) deposits. Precambrian Res. 1992, 58, 241–287. [Google Scholar] [CrossRef]
- Belperio, A.; Flint, R.; Freeman, H. Prominent hill: a hematite-dominated iron oxide copper gold system. Econ. Geol. 2007, 102, 1499–1510. [Google Scholar] [CrossRef]
- Williams, P.J.; Barton, M.D.; Johnson, D.A.; Fontboté, L.; De Haller, A.; Mark, G.; Marschik, R. Iron oxide copper-gold deposits: Geology, space-time distribution, and possible modes of origin. Econ. Geol. 2005, 100, 371–405. [Google Scholar] [CrossRef]
- Seedorff, E.; Dilles, J.H.; Proffett, J.M., Jr.; Einaudi, M.T.; Zurcher, L.; Stavast, W.J.A.; Johnson, D.A.; Barton, M.D. Porphyry Deposits: Characteristics and Origin of Hypogene Features. Econ. Geol. 2005, 100, 251–298. [Google Scholar]
- Sillitoe, R.H. Porphyry copper systems. Econ. Geol. 2010, 105, 3–41. [Google Scholar] [CrossRef]
- Richards, J.P. Magmatic to hydrothermal metal fluxes in convergent and collided margins. Ore Geol Rev. 2011, 40, 1–26. [Google Scholar] [CrossRef]
- Mumin, A.H.; Phillips, A.; Katsuragi, C.J.; Mumin, A.; Ivanov, G. Geotectonic Interpretation of the Echo Bay Stratovolcano Complex, Northern Great Bear Magmatic Zone; Northwest Territories Geoscience Office: Yellowknife, NT, Canada, 2013; p. 35. [Google Scholar]
- Richards, J.P.; Mumin, A.H. Magmatic-hydrothermal processes within an evolving Earth: Iron oxide-copper-gold and porphyry Cu ± Mo ± Au deposits. Geology 2013, 41, 767–770. [Google Scholar] [CrossRef]


| Age | Group | |
|---|---|---|
| Recent | Alluvium (study area) | |
| Pleistocene | Laterite | |
| Eocene | Trap intrusions, dolerite dykes, | |
| intertrappean beds, Deccan trap dikes, | ||
| Deccan trap flows, Bagh beds, Lameta beds | ||
| unconformity | ||
| Lower Cretaceous | Gondwana | Upper Gondwana |
| Upper Carboniferous | Lower Gondwanas | |
| Lower Paleozoic | Vindhyan | Upper Vindhyans |
| Upper Precambrian | Super Group | Lower Vindhyans |
| Lower Proterozoic | Bijawar Group | Limestones, quartzites |
| unconformity | ||
| Archean | Granites, gneisses, schists and phyllites | |
| Depth (in mts) | Litho-Unit | Description |
|---|---|---|
| 312 | BHJ | Dark brown to reddish brown in colour, intensely weathered and fractured, banded-hematite-jasper (BHJ), non-magnetic, specular hematite showing metallic lustre thin < 1 mm, fine grained jasper and hematite, soft yellow limonitic staining is noted at the fractured planes. The sulphides are pyrite, chalcopyrite and iron hydroxide like hematite. |
| 322 | Cherty IF | Weathered cherty iron bearing formation, the fine grained chert is hard and shiny lustre with sulphides and mostly pyrite, chalcopyrite and weathered staining on surface could be due leaching of iron oxides |
| 324 | Cherty IF | Weathered cherty iron bearing formation, the fine grained chert is hard and shiny lustre with sulphides and mostly pyrite, chalcopyrite and weathered staining on core surface. |
| 394 | Quartz + Carbonate | Dark brown to reddish brown in colour, intensely weathered and fractured, banded-hematite-jasper (BHJ), non-magnetic, specular hematite showing metallic lustre thin < 1 mm, fine grained. Due to intense weathering process the argillite’s are altered to clay and to limonitic ( yellow powdery nature) at carbonate show reactive nature with intense effervescence |
| 415 | CIF | Weathered cherty iron bearing formation, the fine grained chert is hard and shiny lustre with sulphides and mostly pyrite, chalcopyrite and weathered staining on surface could be due leaching of iron oxides. |
| 430 | Quartz | Fine grained quartz vein sample with saccharoiadal texture. |
| 450 | Shale | Grey to dark grey in colour, very fine grained, carbonate rock with calcite occurring as grey bands of sulphidic minerals and often as relict textures. Both fine bands of purple coloured minerals varying from white to purple green. |
| 467 | Carbonate + Calcite | Carbonate show reactive nature with intense effervescence with typical calcite texture perfect cleavage and conchoidal with brittle around with gentle hardness. |
| 480 | Carbonate + Calcite | Carbonate show reactive nature with intense effervescence with typical calcite texture perfect cleavage and conchoidal with brittle around with gentle hardness. |
| 481 | Calcite | Calcite typical texture with perfect cleavage and conchoidal with brittle around with gentle hardness. |
| 493 | Carbonate + Calcite | Carbonate show reactive nature with intense effervescence with typical calcite texture perfect cleavage and conchoidal with brittle around with gentle hardness. |
| 495 | Iron Formation | Dark brown to reddish brown in colour, intensely weathered and fractured, banded-hematite-jasper(BHJ), non-magnetic, specular hematite showing metallic lustre thin < 1 mm, fine grained jasper and hematite, soft yellow limonitic staining is noted at the fractured planes. The sulphides are pyrite, chalcopyrite and iron hydroxide like hematite. |
| 533 | Siltstone | Grey to dark grey in colour, very fine grained, carbonate rock with calcite occurring as bands with grey mineral and often as relict texture, fine bands of purple coloured mineral (carbonate-as it reacts with HCl), the colour of carbonates vary from white to purple and green; fractured. Magnetite (very fine-grained) crystals as fine zones, Pyrite, Chalcopyrite. |
| 545 | Siltstone | Grey to dark grey in colour, very fine grained, carbonate rock hard and fissile. The colour of carbonates vary from white to purple and green; fractured. Magnetite (very fine-grained) crystals as fine zones, Pyrite, Chalcopyrite. |
| 571 | Siltstone | Grey to dark grey in colour, very fine grained, carbonate rock with calcite occurring as bands with grey mineral and often as relict texture, fine bands of purple coloured mineral (carbonate—as it reacts with HCl), the colour of carbonates vary from white to purple and green; fractured. Magnetite (very fine-grained) crystals as fine zones, Pyrite, Chalcopyrite. |
| 581 | Siltstone | Grey to dark grey in colour, very fine grained, carbonate rock with calcite fractured. Magnetite (very fine-grained) crystals as fine zones, Pyrite, Chalcopyrite and other sulphides. |
| 610 | Shale | Dark grey to black in colour, hard, very fine grained shale with inter-layers of carbonate; well foliated, fine grains sulphides (pyrite) randomly oriented. |
| 610 | Shale | Dark grey to black in colour, hard, very fine grained shale with inter-layers of carbonate; well foliated, fine grains sulphides (pyrite) randomly oriented. |
| Giant Ore Deposit | Type | Mineralisation | Alteration | Commodity | Orebody |
|---|---|---|---|---|---|
| Olympic Dam, Australia | Olympic Dam | Magnetite-hematite-bornite-chalcopyrite-breccia matrix | Potassic | Fe, Cu, Au, Ag, REE, U | Pipe like and irregular breccia |
| Osborne, Queensland, Australia | Cloncurry | Magnetite-hematite-apatite replaced by Cu-Fe sulphides, Au etc. | Potassic | Cu, Au, Ag, Bi, Co, W | Stratabound vein, breccia |
| Kiirunavaara, Sweden | Kiruna | Massive magnetite-apatite-actinolite | sodic | Fe ± Cu, Au | Tabular, pipe like, irregular |
| Magnitogorsk, Urals, Russia | Iron skarn | Massive magnetite-garnet-pyroxene | Sodic | Fe ± Cu, Au | Stratabound lensoid, irregular |
| Phalaborwa, South Africa | Phalaborwa | Magnetite, apatite, fluorite.Cu sulphides | Sodic + potassic | Cu, Au, Ag, REE, PGE, vermiculte, magnetite, P, U, Zr, Se, Te, Bi | Veins, layers, disseminations |
| Bayan Obo, Mongolia, China | Bayan Obo | Magnetite, hematite, bastnaesite, Fe-Ti-Cr-Nb oxides, monazite | Weathering of Fe oxides | REE | disseminations |
| Madhya Pradesh, Central India | Gadarwara | Magnetite, hematite, Cu-Fe, Au, monazite, apatite, zircon, sulphides | Sodic + potassic | Cu, Ni, Au, REE | Irregular breccia |
| Western Bastar Craton, India | Thaneswasna | Magnetite, hematite, pyrite, arsenopyrite, chalcopyrite, monazite | Potassic | Fe-Cu-Ba-Au-Ag-Th | breccia |
© 2020 by the authors. Licensee MDPI, Basel, Switzerland. This article is an open access article distributed under the terms and conditions of the Creative Commons Attribution (CC BY) license (http://creativecommons.org/licenses/by/4.0/).
Share and Cite
Raju, P.V.S.; Kumar, K.S. Magnetic Survey for Iron-Oxide-Copper-Gold (IOCG) and Alkali Calcic Alteration Signatures in Gadarwara, M.P, India: Implications on Copper Metallogeny. Minerals 2020, 10, 671. https://doi.org/10.3390/min10080671
Raju PVS, Kumar KS. Magnetic Survey for Iron-Oxide-Copper-Gold (IOCG) and Alkali Calcic Alteration Signatures in Gadarwara, M.P, India: Implications on Copper Metallogeny. Minerals. 2020; 10(8):671. https://doi.org/10.3390/min10080671
Chicago/Turabian StyleRaju, P.V. Sunder, and K. Satish Kumar. 2020. "Magnetic Survey for Iron-Oxide-Copper-Gold (IOCG) and Alkali Calcic Alteration Signatures in Gadarwara, M.P, India: Implications on Copper Metallogeny" Minerals 10, no. 8: 671. https://doi.org/10.3390/min10080671
APA StyleRaju, P. V. S., & Kumar, K. S. (2020). Magnetic Survey for Iron-Oxide-Copper-Gold (IOCG) and Alkali Calcic Alteration Signatures in Gadarwara, M.P, India: Implications on Copper Metallogeny. Minerals, 10(8), 671. https://doi.org/10.3390/min10080671