1. Introduction
The gravity exploration method is used to detect polymetallic ores because of its higher density feature, and they can use the density inversion method of gravity anomaly to obtain the approximate horizontal position of the ores. The most commonly gravity inversion method is three-dimensional gravity inversion, which can directly obtain the subsurface density distribution to interpret the three-dimensional area of ores [
1,
2,
3]. The high-density borders of general gravity inversion are not sharp enough to match the ores. Last and Kubic presented compact gravity inversion, which is the precursor of gravity focusing inversion [
4,
5,
6]. The focusing inversion uses the minimum support functional to increase the high-density value with the iteration of solution, so the volume of high-density results of inversion is minimal. In this way, the focusing inversion has a higher resolution and better convergence speed than the standard smooth inversion. However, the gravity method is suitable for the interpretation of mass data over a large area. Therefore, many geophysics make an effort to improve the computational efficiency of gravity inversion [
7,
8].
The JFNK method is designed for solving the large implicit nonlinear equations, and it is the combinations of Newton’s method and Krylov subspace methods. This method uses the differential of vector instead of the jacobian matrix, so it does not need to form and store the elements of the true jacobian matrix. The jacobian matrix consists of the first-order partial derivatives of objective equation, which represents the optimal linear approximation of the equation to a given solution, so memory is intensive in solving large sparse nonlinear equations. Therefore, the JFNK method has a much faster convergence and smaller computation cost. This method has been successfully applied in fluid computing and other fields [
9,
10]. The Krylov subspace method is a kind of common iterative algorithm, and the conjugate gradient (CG) is a representative method of the Krylov subspace method which is commonly used in gravity inversion. Vandecar and Snieder used the preconditioned conjugate gradient method for solving the inversion problem of large data [
11].
The study on the gravity inversion method considering the undulating terrain can be divided into two categories. The first type is to reduce the curved surface into a horizontal plane to offset the effects of undulating terrain, e.g., the equivalent source method, finite element method, boundary element method, Taylor series method and iterative method [
12,
13,
14,
15,
16]. Yao also used the data of field and vertical gradient to reduce the curved surface into a horizontal plane to obtain more accurate and stable results [
17]. To improve the direct solution method, Liang used the gradient data and boundary element method to obtain the potential field of the horizontal plane directly from the curved surface data [
18,
19]. Unfortunately, this method assumes that there is no field source between the undulating terrain and the converted horizontal plane. The data obtained by this way are only an approximation of the actual data, which reduces the precision of inversion results. The second type is to mesh the subsurface that corresponds to the undulating terrain. Currently, the common method is unstructured mesh technology. This method can fit the surface by dividing the subsurface into multiple triangles or tetrahedrons in two-dimensional (2D) or 3D inversions. Zhong used tetrahedrons to fit the terrain to realize terrain correction [
20]. Geophysicists obtained the mesh with undulating terrain by using the triangulation technology to be applied on the inversion of the electrical prospecting with the complicated terrain [
21,
22]. Zhang applied triangulation technology on forward modeling and inversion of gravity and magnetic profiles [
23]. In the gravity and magnetic inversion field, the triangulation was mainly used to fit geological models to obtain more accurate forward results [
24]. The unstructured mesh method is complex and computationally intensive, which is not suitable for the inversion of gravity with a large amount of data. However, the common structured mesh method cannot fit the undulating terrain. Therefore, it is necessary to combine the structured and unstructured mesh methods in the gravity and magnetic inversion field.
In this paper, we presented the preconditioned JFNK gravity focusing density inversion method to obtain the density feature of the ores with accuracy and efficiency. To solve the inversion meshing under the undulating terrain, we also presented an adaptive equivalent-dimension method, which processed the subsurface by combining triangulation unstructured and rectangular structure mesh. Considering that the density variation and the terrain fitting are related to the anomaly and the change rate of the terrain, the horizontal size of each grid unit depends on the gradient of anomaly or terrain. We used the models with the undulating terrain and compared common unstructured meshing methods to gauge the performance of the algorithm and test its accuracy and efficiency. Then, we applied this approach to interpret gravity data collected in the Huayangchuan polymetallic mining area in Shaanxi Province.
2. Methodology of Preconditioned JFNK Gravity Focusing Inversion
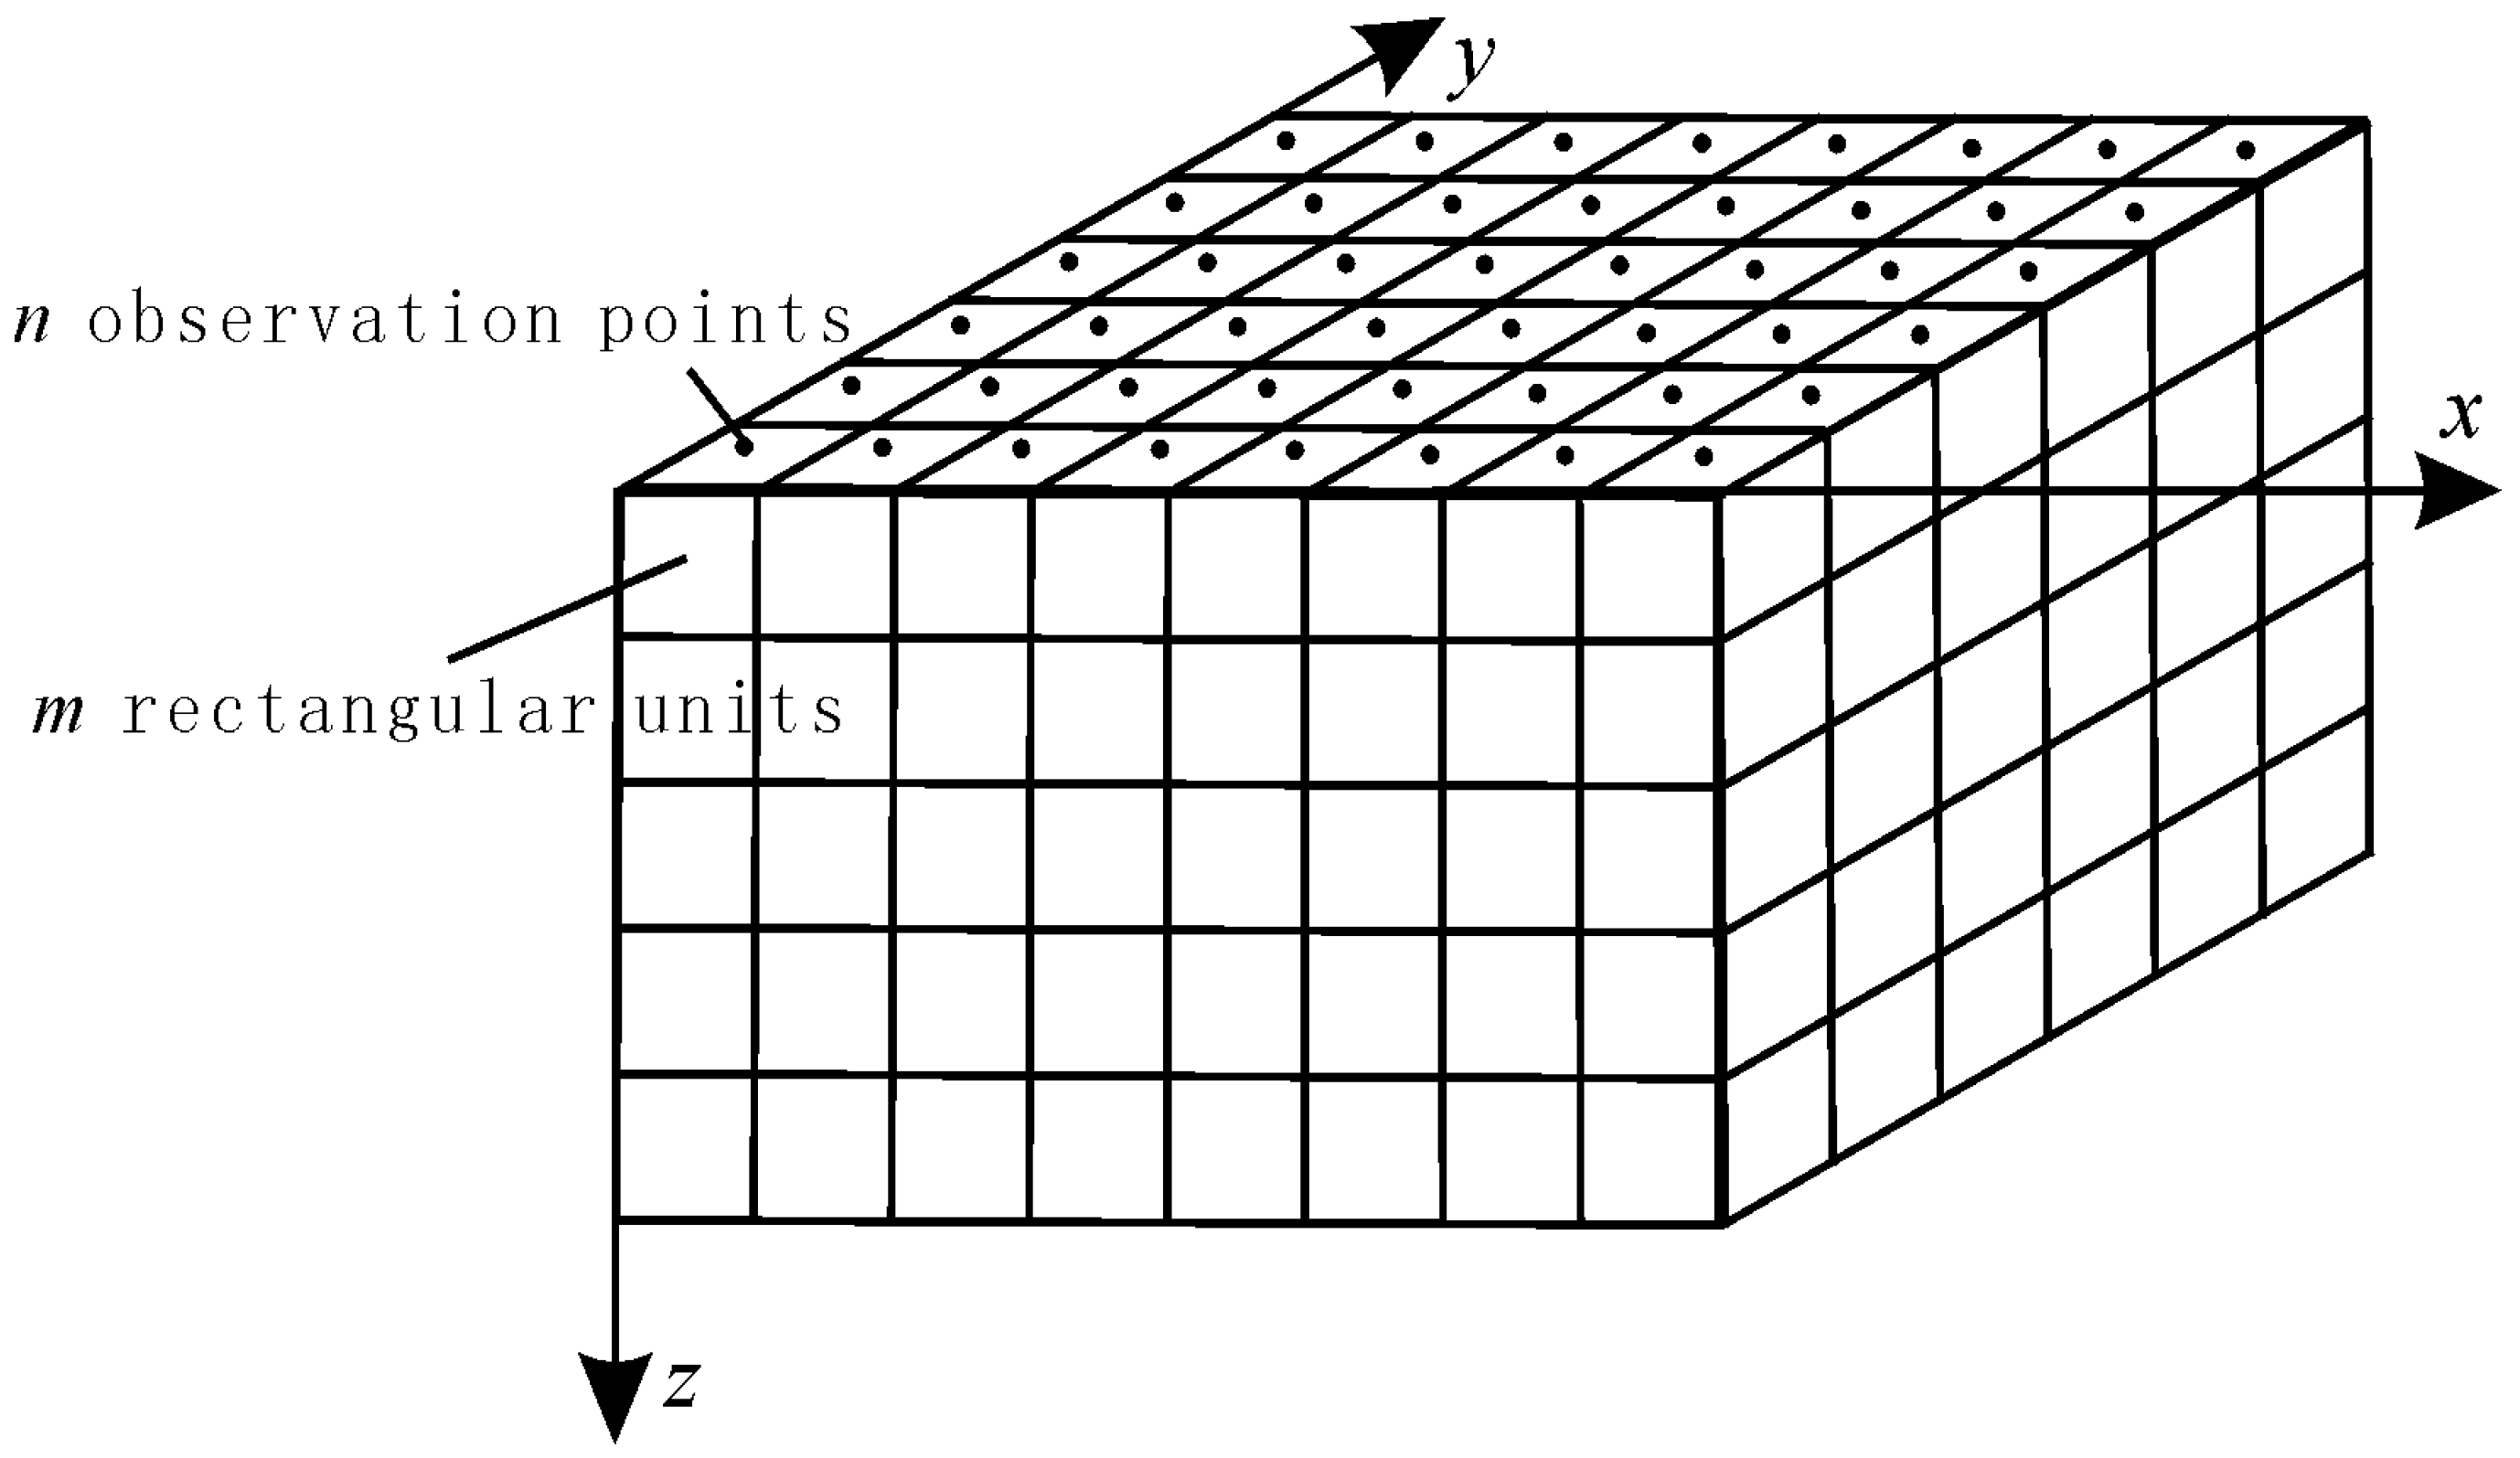
The gravity inversion involved discretizing the subsurface into a finite number of rectangular units, and the discrete map is shown in
Figure 1. There are
n observation points and
m rectangular units, the forward expression of the gravity anomaly could be expressed as:
where
is the gravity anomaly,
is the contribution to the
nth datum of a unit density in the
mth cell called kernel function matrix, and
is the density matrix of rectangular units.
The kernel function matrix is [
25]:
In the expression, is the gravitational constant, (x, y, z) are the coordinates of the observation points, and and are the coordinates of the minimum and maximum corner points of the cells.
Performing gravity inversion requires solving Equation (1) for . Since the number of underground cells was greater than the data, the Equation (1) was underdetermined.
We solved this underdetermined equation in the following manner [
26]:
where
is the square norm of the difference between the observed anomaly(
) and the calculated anomaly(
), and it represents the fitting functional of the data. In the expression,
is the stabilizing functional that constrained the inversion results to the real conditions.
is a regularization parameter. The value of the regularization parameter is usually 10
n, and the
n is determined by a “trial and error” method.
Wz is the depth-weighting function which was used to counteract the inherent decay of the kernel function [
27].
is the weighted solution variable, we replaced it with
. The Equation (4) is the minimum support function [
4]. In general, the e is 0.1, which is a focusing parameter to determine the sharpness of the inversion results.
The derivative formula of Equation (3) is:
We can substitute the solution of Equation (3) with the minimization of Equation (5). Finally, we used the JFNK method to obtain the of Equation (5), and the results can be obtained by removing the depth-weighting function.
The JFNK method was introduced as follows. The
can be processed as:
The Krylov subspace method was created to solve the Equation (7), and we used the CG method which is a common solution technique with the Krylov subspace [
26]. The matrix-vector product required by CG method was approximated by forward finite difference schemes:
where
v is a vector of the Krylov subspace. The process of the preconditioned CG method used to solve Equation (7) is:
where
k is the number of iterations, and as the number of iteration increased, the residual
r was minimized by moving a distance
in search direction
p. The
S is a preconditioner of the search direction, and we could obtain the new search direction. The optimum preconditioning is (
ATA)
-1. It produced the least-squares solution to Equation (7) in a single iteration. Since we were unable to obtain the optimum preconditioning directly, we substituted the optimum preconditioning with a depth-weighting function [
10]. All the other parameters were intermediate variables with no significance.
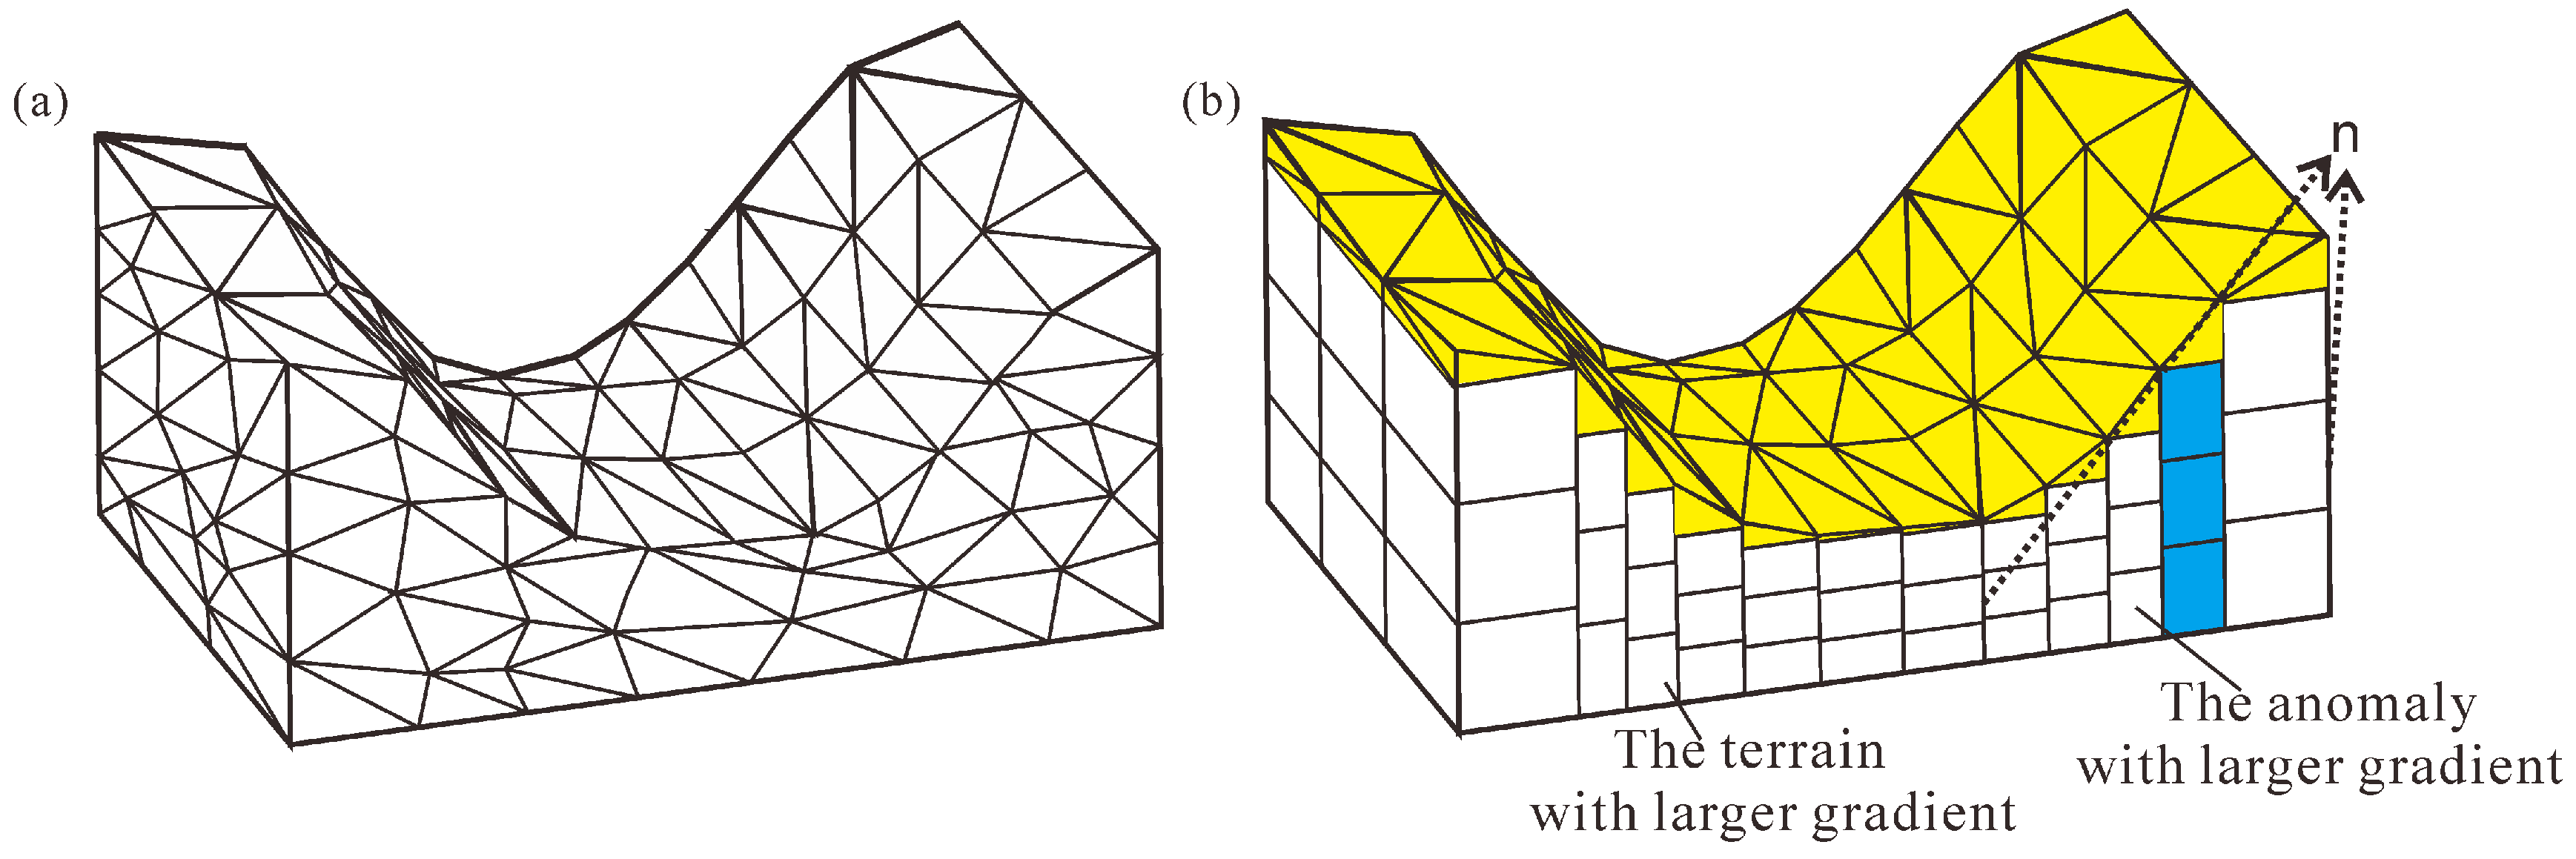
Under the condition of the natural surface, the structured mesh method was not applicable, and the unstructured mesh method w triangulation (shown in
Figure 2a). The structured method is computationally intensive. We proposed the adaptive equivalent-dimensional mesh method which combines the unstructured and structure mesh to achieve gravity inversion with the undulating terrain. Only the surface layer (the yellow area in
Figure 2b) was discretized by the triangular unstructured mesh method, and the other subsurface was discretized into structure rectangular mesh. The three blue cells in
Figure 2b have the same height, and it is shown that the structure rectangular mesh was the
n dimension in each horizontal position. Therefore, many judgment processes were avoided in the calculation, and the calculation efficiency was improved; the memory was not increased in the case of fitting the surface as far as possible. This method could efficiently and accurately obtain the 3D density models, so it was more applicable to the gravity inversion with a large amount of data.
As the adaptive equivalent-dimensional mesh method, we derived the equations to determine intervals (
dx,
dy) of the mesh according to the terrain and anomaly:
In the expression, and represent the total length of the measuring area along x and y directions. THDg and THDh represent the total horizontal derivative (THD) of gravity anomaly g and elevation of measure points h, respectively. Its equation is shown in Equation (12). In this way, the dx and dy of the cells would be 0.5~1.5 times the average length. Therefore, the intervals of mesh were close in the area where the gravity anomaly or terrain varied greatly.
3. Gravity Model Tests
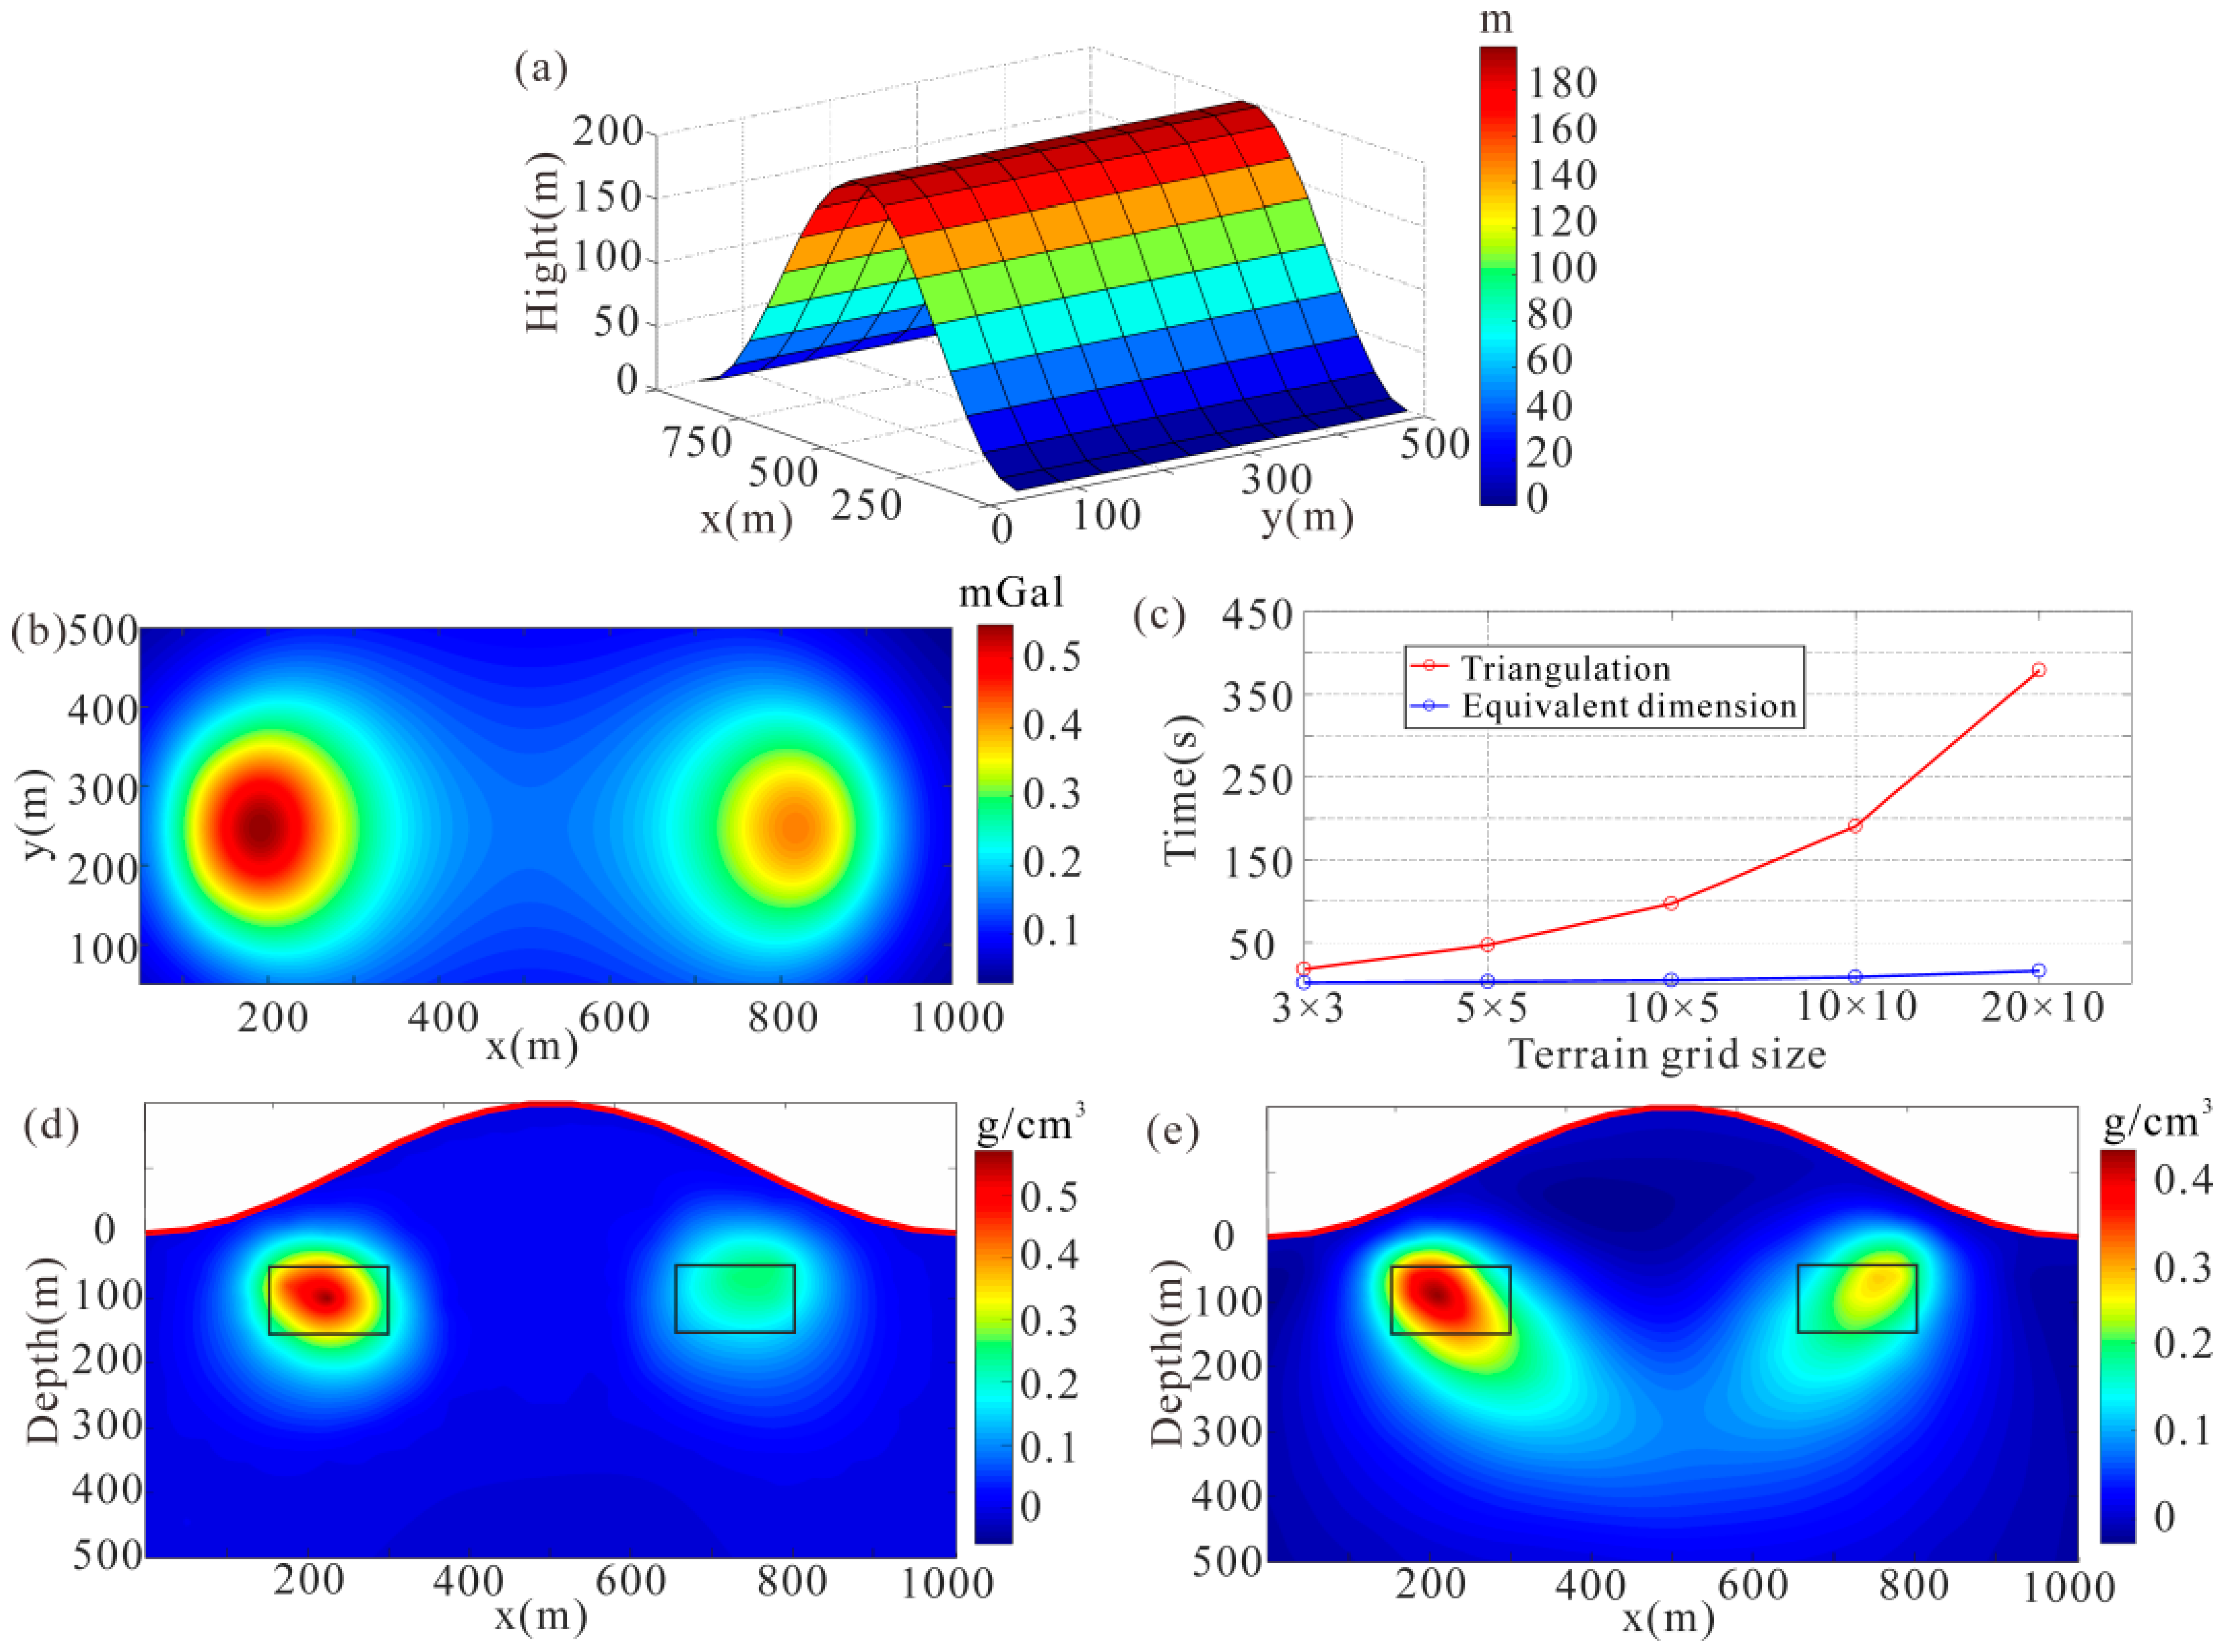
We tested our method in the inversion consisting of typical models of 150 × 150 × 100 m with undulating terrain, and the results are shown in
Figure 3. The buried depth of the center of models was 100 m from the surface, and the central coordinates of two models were (225, 250) m and (725, 250) m. As we can see in
Figure 3b, the extreme value position of the gravity effect was asymmetric because of the asymmetry of the undulating terrain. Therefore, the x-coordinates of the two extreme value positions of the gravity anomaly were 200 and 800 m, respectively. There was deviation from the x-coordinates of 225 and 725 m of the two actual models. When the terrain fitting accuracy was consistent, the terrain grid size was positively correlated with the fineness of the subsurface mesh.
Figure 3c shows the run time of programs in different terrain grid sizes with twenty-five obverse points. It is shown in
Figure 3c that the run time of programs with equivalent-dimensional mesh was obvious shorter than with triangulation mesh.
The 3D gravity inversion in
Figure 3d was performed based on equivalent-dimensional mesh.
Figure 3d shows the slice of the inversion result at y = 250 m, and the red curve is consistent with the undulating terrain and represents the top of the subsurface, and the black rectangles represent real positions of typical models. It can be seen in
Figure 3d that the high-density units in the inversion result were similar to the actual range of models. Therefore, this method could obtain the information of models directly by the inversion with equivalent-dimensional mesh.
Figure 3e shows the 3D gravity inversion with triangulation mesh, and the result of the inversion with equivalent-dimensional mesh was similar to the inversion with triangulation mesh, comparing
Figure 3d,e. Therefore, the new meshing method proposed by us can obtain gravity inversion results consistent with the traditional method in the regions with undulating terrain efficiently.
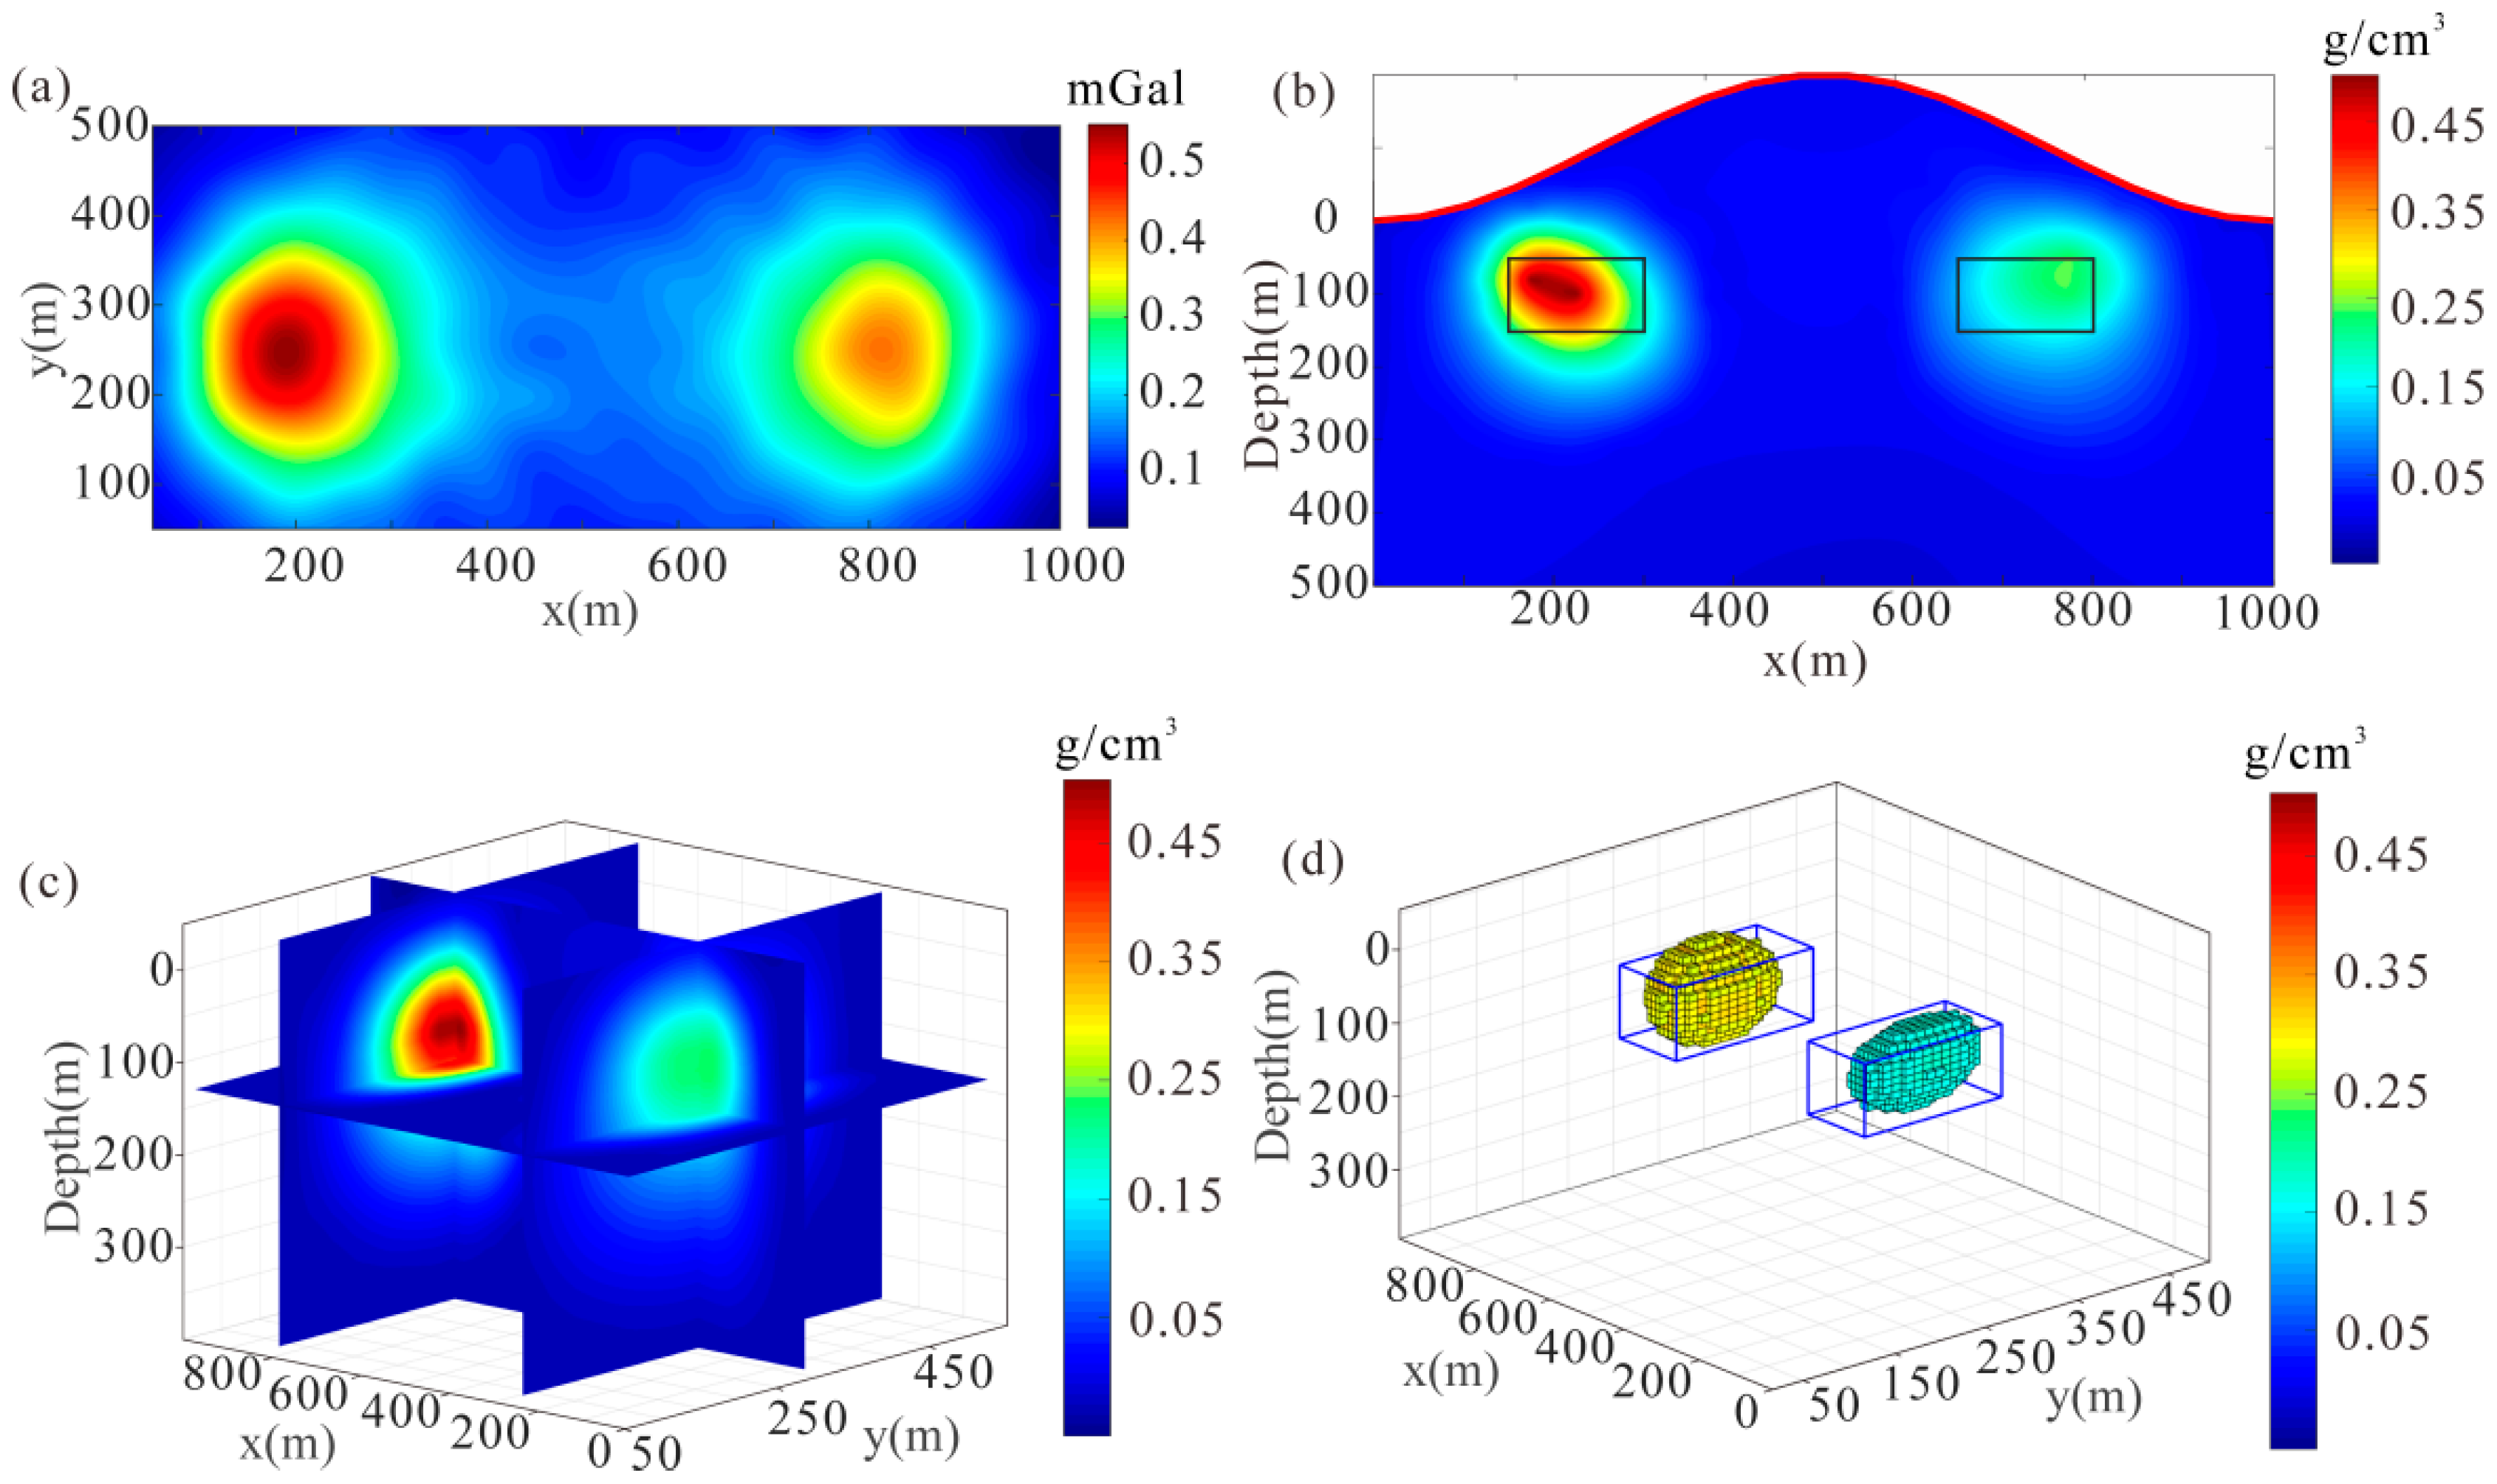
Figure 4a shows the gravity anomaly of
Figure 3a with noise, and the anomaly showed some distortion after the addition of 30 signal noise ratio noise.
Figure 4b is the slice of the inversion result, and
Figure 4c is the 3D view of slices. In
Figure 4d, blue lines represent the edge of the models, and the yellow and blue blocks represent densities greater than 0.28 and 0.16 g/cm
3 in the inversion results, respectively. The inversion results shown in
Figure 4b–d are close to the result in
Figure 3c. Therefore, the method was stabilized and could obtain an accurate range of models after adding noise.
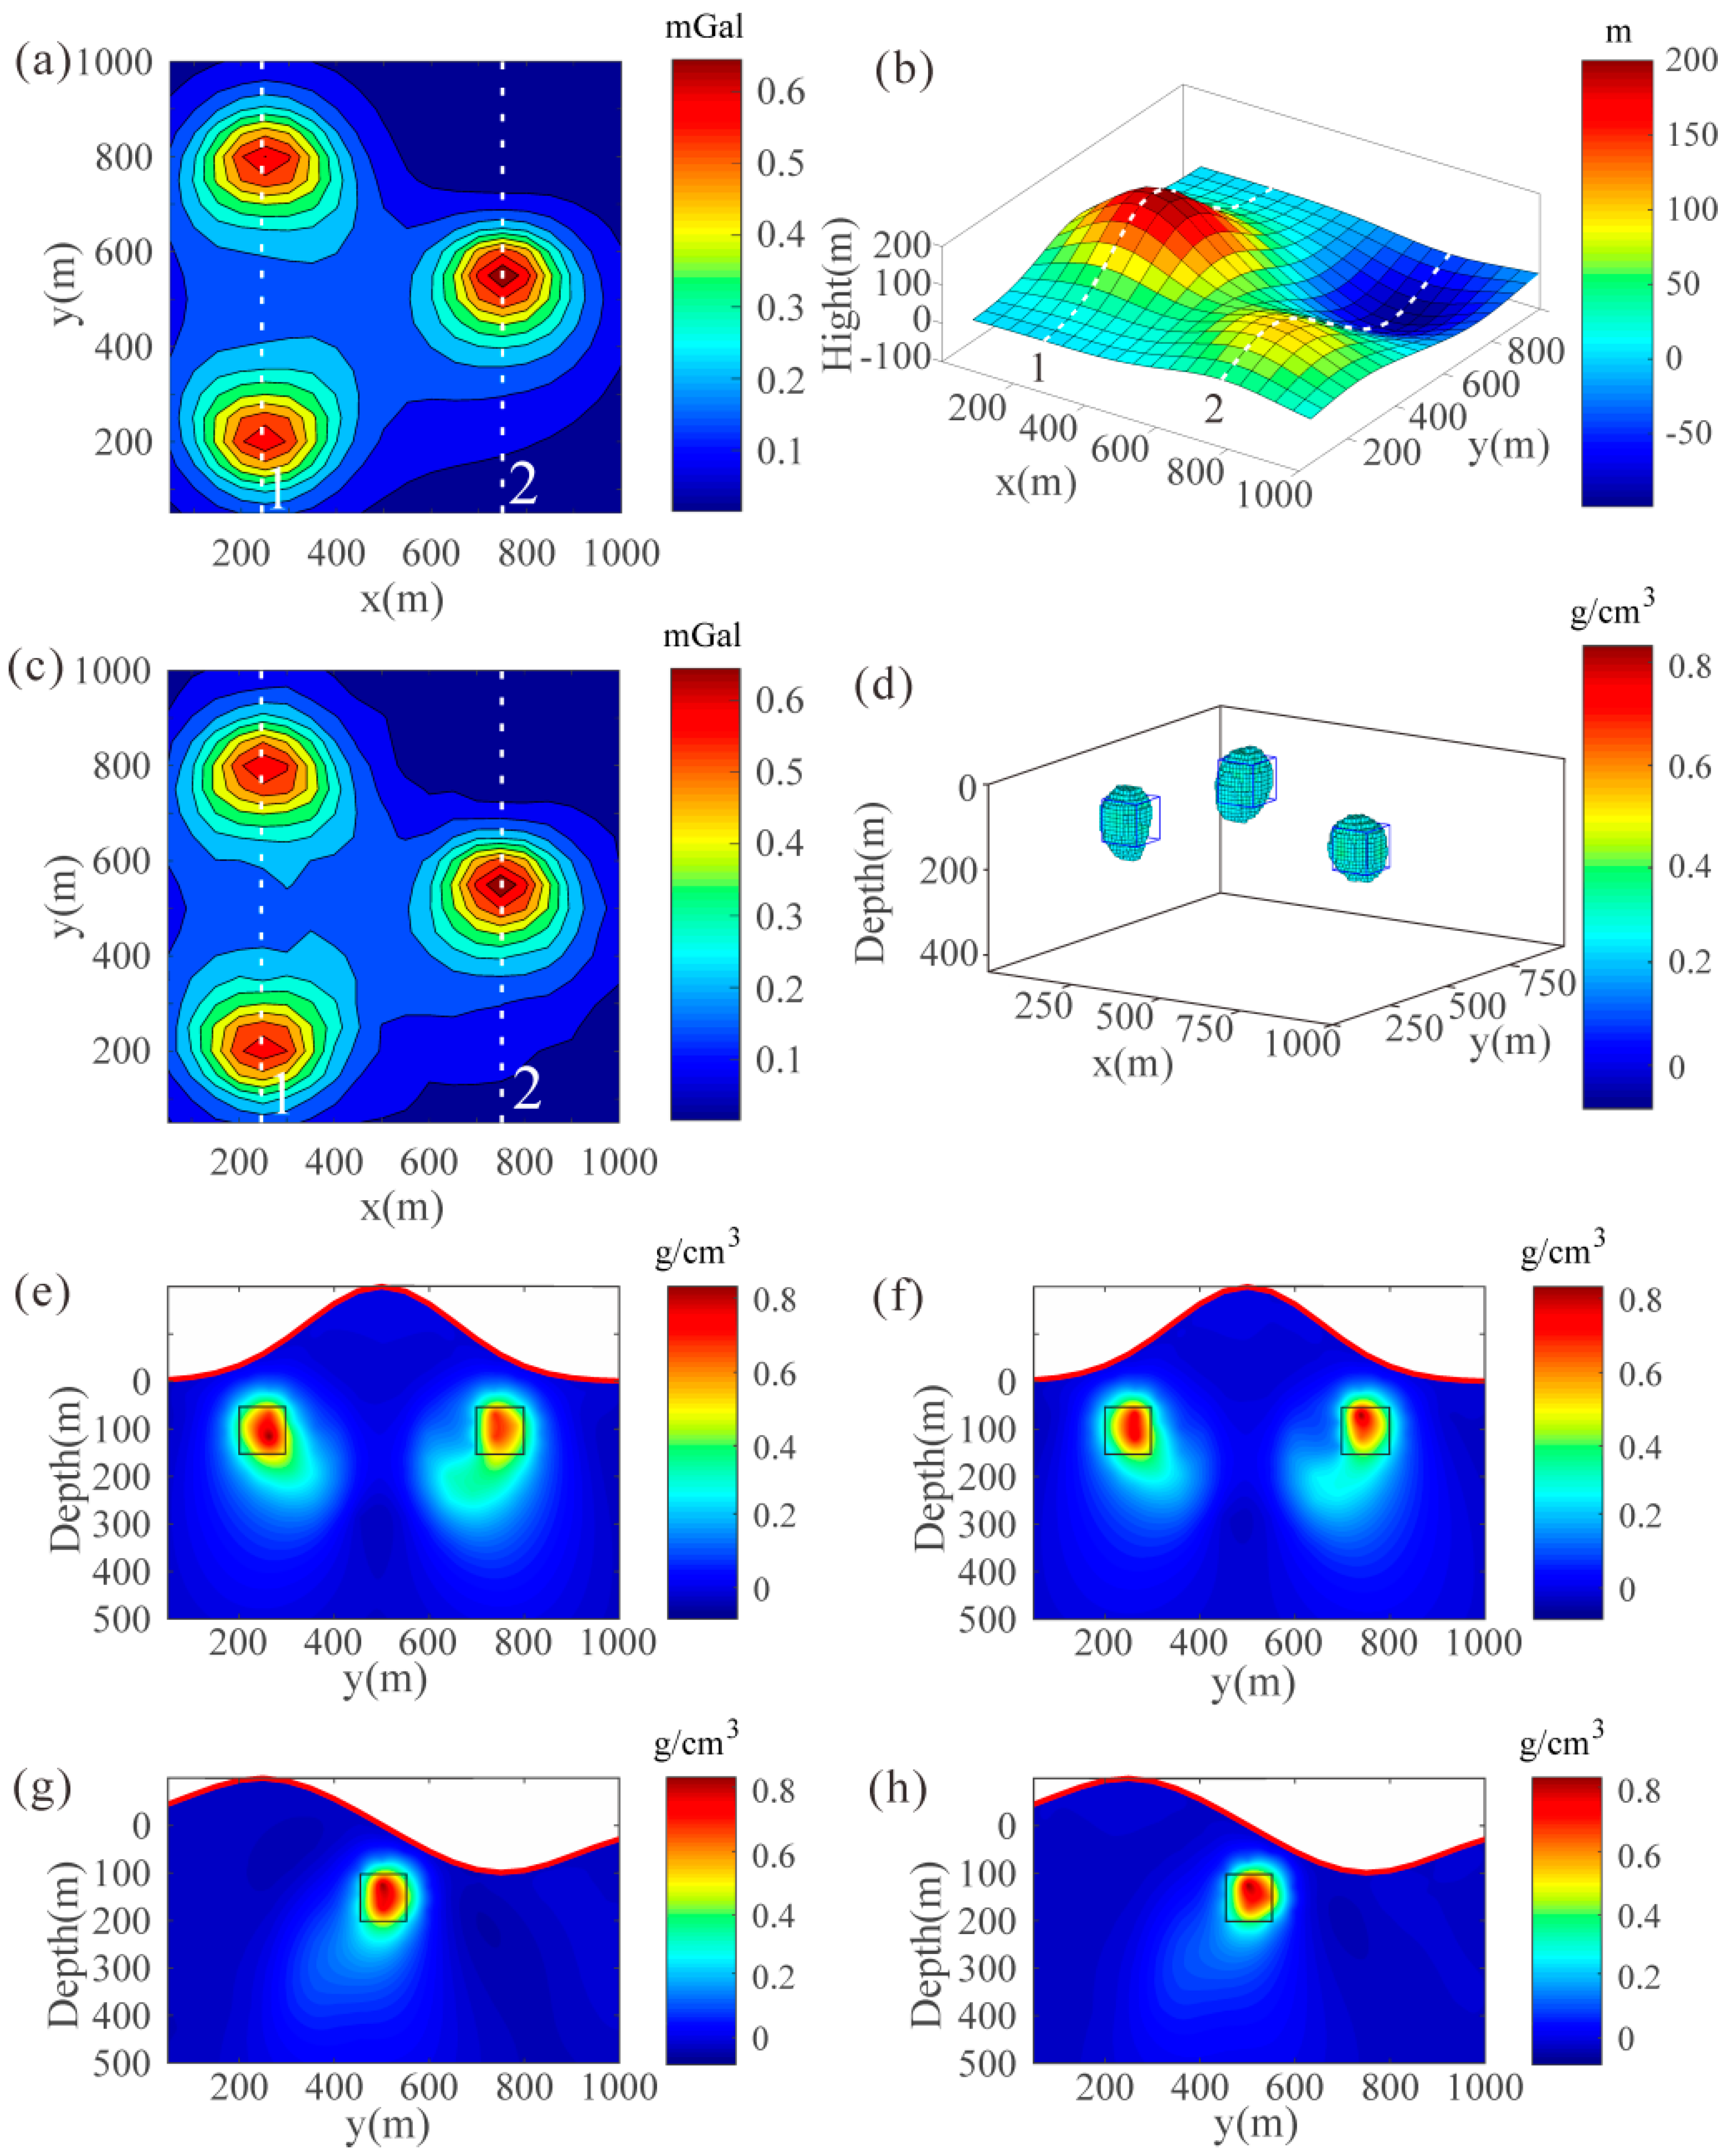
We processed a gravity anomaly with complex terrain to verify the method of equivalent-dimensional mesh. There were two peaks and one valley—shown in
Figure 5b. In the 100 m depth from the surface, there were three prisms of 100 × 100 × 100 m; the central coordinates of which were (250, 250), (250, 750), and (750, 500) m, respectively.
Figure 5a is the gravity anomaly of models, and the gravity containing 30 SNR noise is shown in
Figure 5c. Because of the complex terrain’s effect, the coordinates of the extreme value points shown in
Figure 5a were (250, 200), (250, 800), and (750, 550) m, and the coordinates were not consistent with the models’ coordinates. We achieved the density inversion based on the mesh with the equivalent dimension and obtained the slice diagram of the inversion results shown in
Figure 5e–h by cutting along the white dashed lines numbered 1 and 2 shown in
Figure 5a–c.
Figure 5d shows the high-density blocks of a density greater than 0.3 g/cm
3, and the blue lines represent the edge of the models.
Although the extreme values’ coordinates of the gravity anomaly deviated from the model positions at lines 1 and 2, the central position of the inversion results obtained by the gravity inversion based on equivalent-dimensional mesh were still consistent with the model position. The results shown in
Figure 5d–h indicate that this method is applicable and stabilized in complex terrain.
4. Actual Data Processing
In order to validate the applicability of the adaptive equivalent-dimensional mesh method in the field data, we processed the gravity data of polymetallic mining areas in Shaanxi province of China. The area is located in Huayangchuan in Shaanxi province. Its tectonic location belongs to Xiaoqinling intracontinental orogenic belt in the southern margin of north China landmass. The main outcrops are the Neoarchean erathem Taihua group (deep metamorphic crystalline complex), the Mesoproterozoic erathem Xionger group (volcanic–sedimentary), Gaoshanhe formation (clasolite), and the Luonan group (carbonatite); some areas have the Sinian series and the Cambrian system clasolite. Paleogene, Neogene, and Quaternary are deposited in Cenozoic basins, and the Ordovician, Silurian, and Paleozoic to Mesozoic stratums are missing [
28,
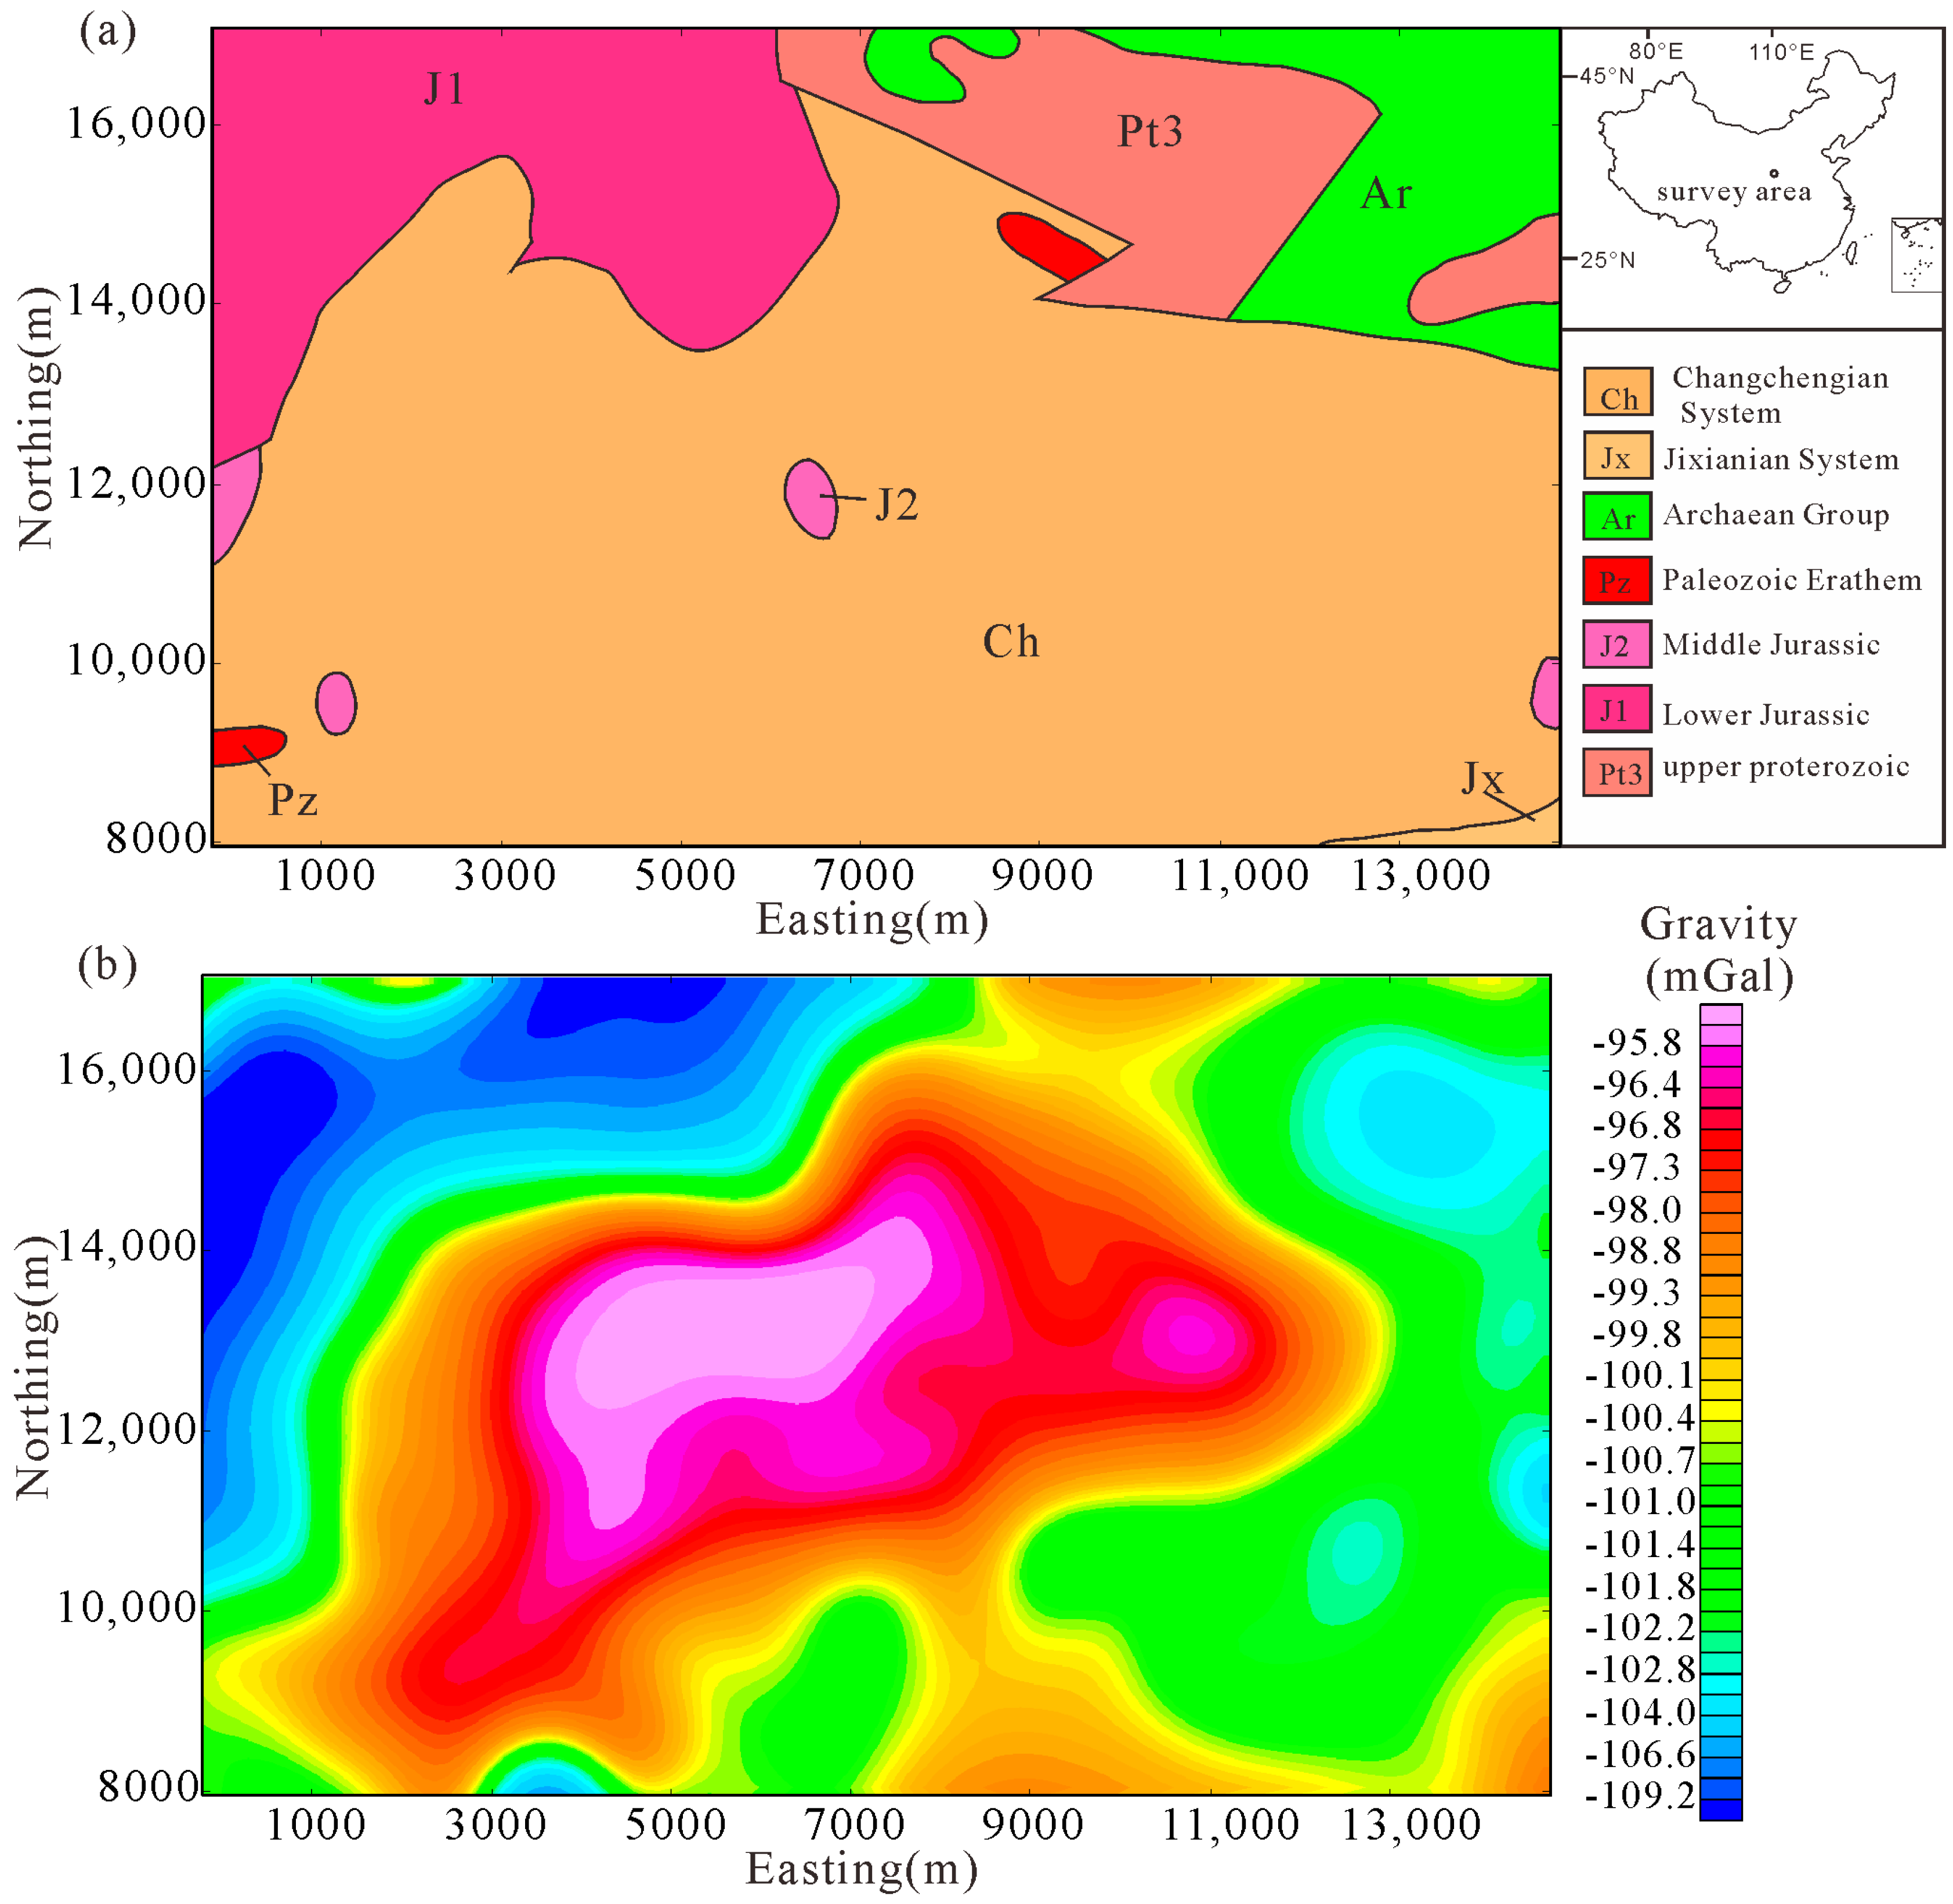
29]. The geological condition of the survey area is shown in
Figure 6a.
Figure 6b shows the Bouguer gravity anomaly of the survey area. The center area obviously had a high-value gravity anomaly in
Figure 6b, so there was a high-density body in the subsurface. There were polymetallic mines in the vicinity of this area, and the geophysical characteristics of the metal minerals were high values of density. Therefore, we inferred that the high-value gravity in this area was a polymetallic deposit. Metallic minerals were produced by magma intruding into the shallow strata of the subsurface through the faults, so the location of faults had great value for us to infer the range of minerals.
The total horizontal derivative, of which the maximum value indicates the location of the faults, is commonly used to detect faults in gravity interpretation [
30]. Therefore, by comprehensively analyzing the geological map and the gravity data of this region, we finally divided the faults of this region into the total horizontal derivative and local gravity field map shown in
Figure 7a.
The Bouguer gravity anomaly is the comprehensive response of the density at all depths. The 3D density inversion depth range was an altitude of −1500 m from the surface, so we needed to perform separation of the potential field by using the matched filter method. The expression of the matched filter is [
31,
32]:
where
is the average logarithmic power of the potential field,
H is the depth of the layer corresponding to the anomaly,
is the wave number, and
B is a constant related to the deep or shallow source anomaly.
In this way, we removed the regional field anomaly corresponding to the density below −1500 m and extracted the shallow response of the gravity anomaly, namely the local field. The result is shown in
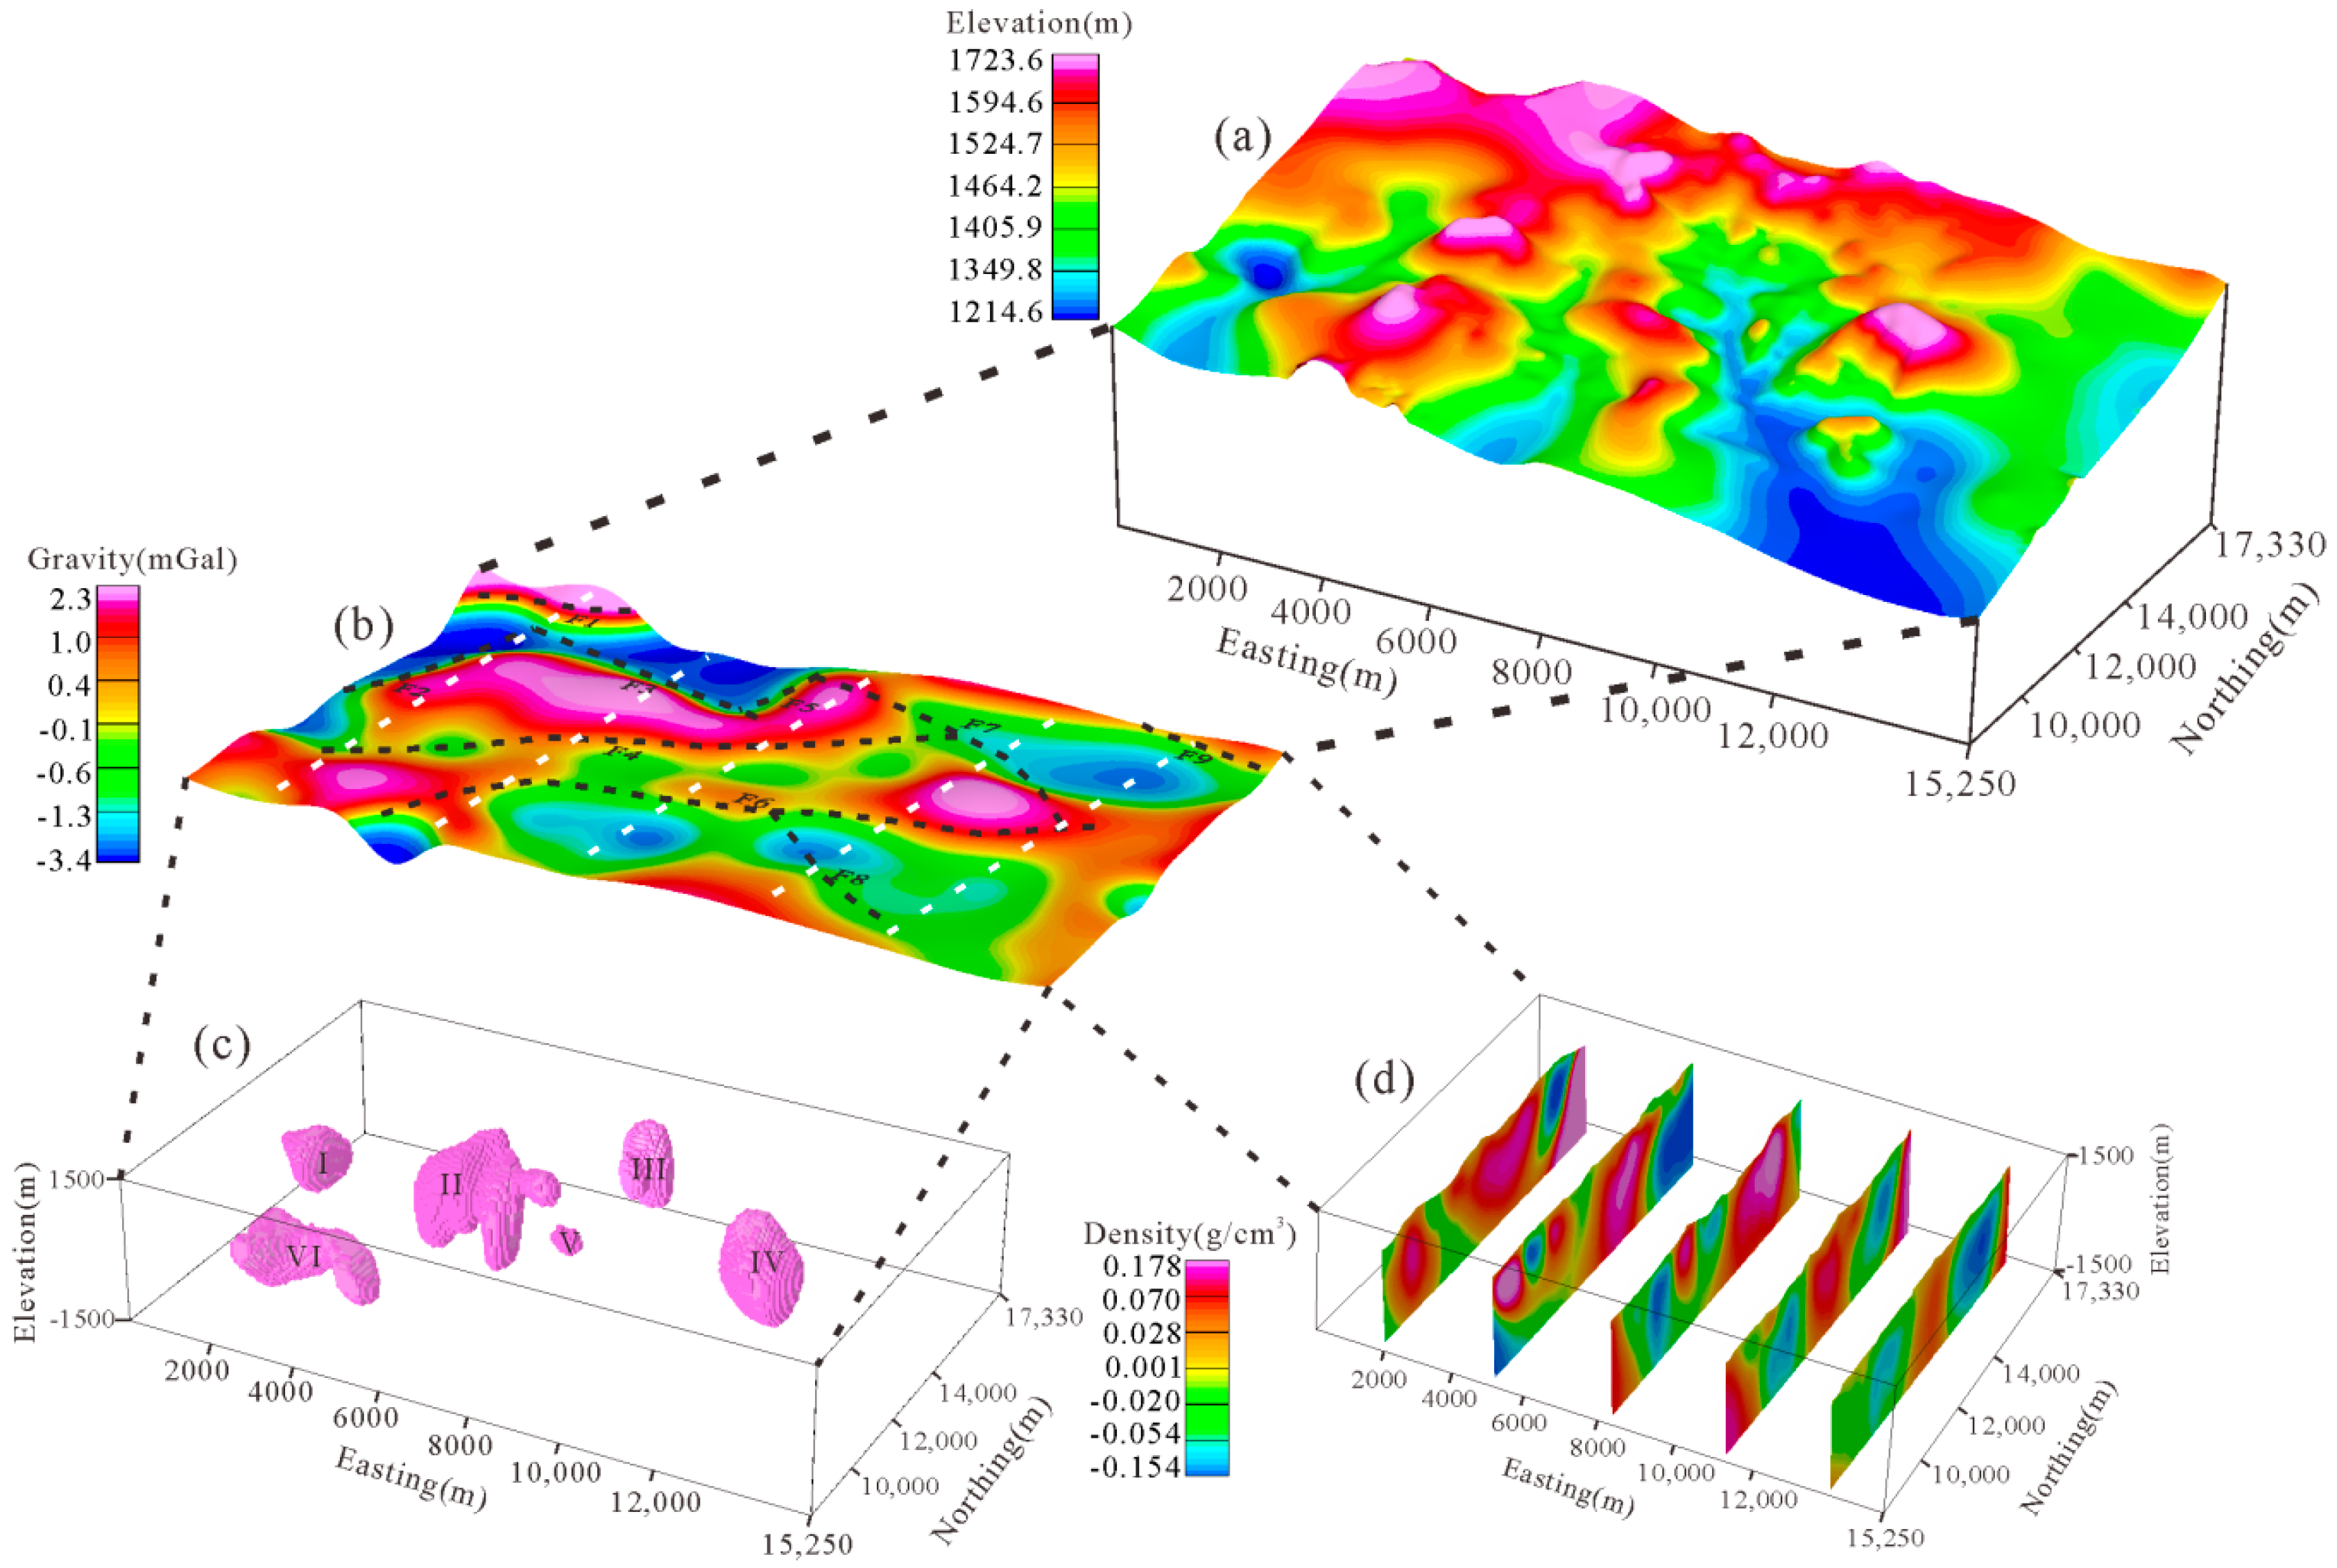
Figure 7b, indicating that the local anomalies in this area were separated by faults; this is consistent with the geological characteristics of the ores distributed around the faults, which shows the accuracy of the matched filter method. The terrain in this region was complex with an average altitude of 1480 m and a maximum height difference of 509 m, as shown in
Figure 8a. Considering the regional terrain relief, our adaptive equivalent-dimensional mesh method was suitable for this real case.
The depth of −1500 m extending to surface of this region was meshed by the proposed method in this paper, and 3D gravity inversion was performed to obtain the density in the subsurface, as shown in
Figure 8c,d.
Figure 8b is the local field of gravity, in which the white dotted lines represent the horizontal position of the slices, and
Figure 8d shows the slices of the 3D density model obtained from the gravity inversion results shown in
Figure 8c. The density model in each section show the high-density units, which represent the position of the explained minerals.
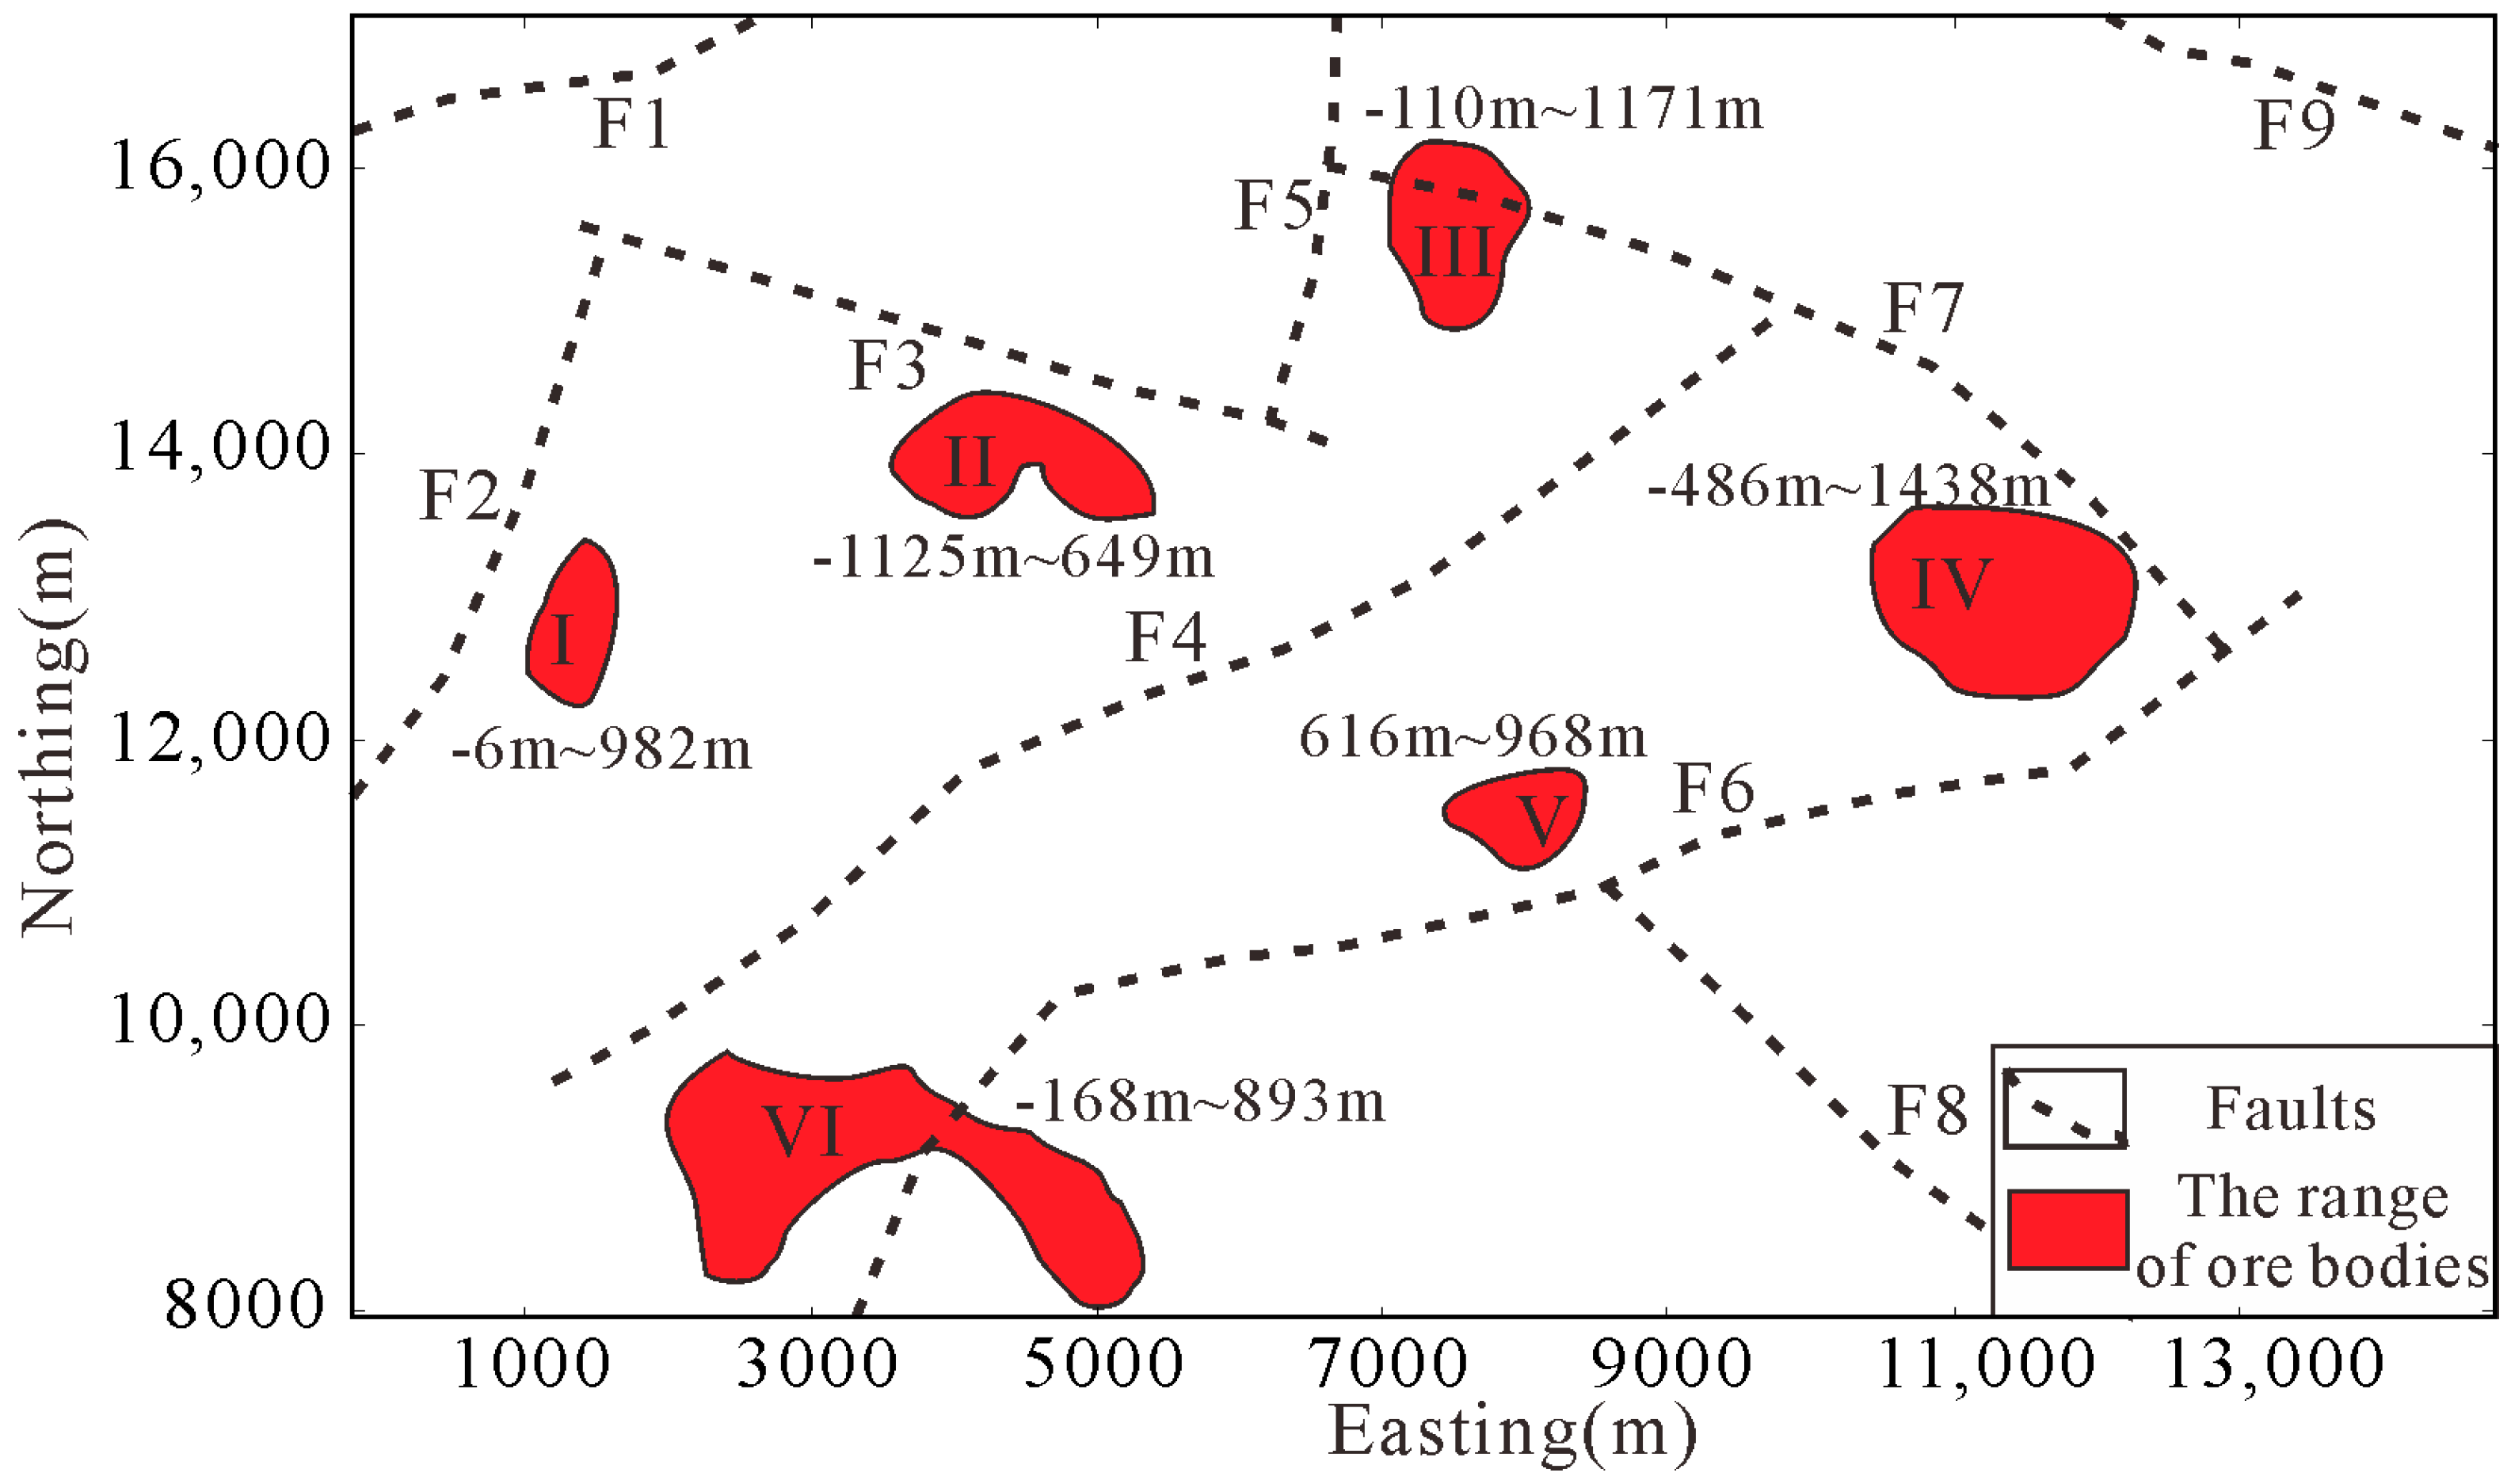
Through the recognition of high-density units in the 3D density inversion model, the range of metallic ore bodies in this region was interpreted in
Figure 9 by a red range. The ore bodies distributed near the faults that conform to the principle of the metal minerals were generated in the magma which intruded along the faults. There were six ore bodies explained in this area, and the number shown in
Figure 9 around the red range is the height above sea level of these ore bodies.
