Article

Physico-Chemical, Mineralogical, and Chemical Characterisation of Cretaceous–Paleogene/Neogene Kaolins within Eastern Dahomey and Niger Delta Basins from Nigeria: Possible Industrial Applications

by
Olaonipekun Oyebanjo
1,2,*,
Georges-Ivo Ekosse
2 and
John Odiyo
3
1
Natural History Museum, Obafemi Awolowo University, Ile-Ife 220282, Osun State, Nigeria
2
Directorate of Research and Innovation, University of Venda, P/Bag X5050, Thohoyandou 0950, South Africa
3
School of Environmental Sciences, University of Venda, P/Bag X5050, Thohoyandou 0950, South Africa
*
Author to whom correspondence should be addressed.
Minerals 2020, 10(8), 670; https://doi.org/10.3390/min10080670
Submission received: 17 June 2020 / Revised: 14 July 2020 / Accepted: 15 July 2020 / Published: 28 July 2020
(This article belongs to the Special Issue Special Clays and Their Applications)

Abstract

:
The demand for kaolinitic clays for various industrial applications is increasing globally. The present study evaluated the potential industrial applications of kaolins from the Eastern Dahomey and Niger Delta Basins, Nigeria. The colour, pH, electrical conductivity (EC), particle size distribution (PSD), plastic limits and liquid limits of the kaolins were determined. Mineralogical properties were assessed using X-ray diffractometry (XRD), scanning electron microscopy (SEM), and differential thermal analysis (DTA). The chemical compositions of the kaolins were determined using X-ray fluorescence spectrometry (XRF). The kaolins were generally acidic, with pH less than 7 with low EC. The moderate plasticity indices (PI ≥ 10%) for the kaolins suggested their potential use in the manufacturing of structural clay products without extrusion. Kaolinite was the only kaolin mineral present with anhedral–subhedral–euhedral crystals. The platy morphology of the kaolinites in the Cretaceous kaolins are very important in paper production. Other minerals present in the kaolins were quartz, muscovite, anatase and goethite. The major oxide contents of the kaolins were dominated by SiO2, Al2O3, Fe2O3 and TiO2. Based on chemical specifications, the raw kaolins are not suitable for most industrial applications except for the Cretaceous Lakiri kaolins in the paper and ceramic industries (except for TiO2 and K2O content). The study concluded that the kaolin deposits would require beneficiation for large-scale industrial applications.

1. Introduction

Large kaolin deposits of primary and secondary origins with enormous reserves have been identified across Nigeria [1,2]. Known kaolin deposits of Cretaceous and Paleogene/Neogene ages occur within the sedimentary basins, which are believed to be filled with Cretaceous–Recent sediments except for some Paleogene/Neogene kaolin occurring within the Jos Plateau in areas underlain by the younger granites [3]. Several kaolin deposits in the world are mined and processed for industrial uses. These include the Cretaceous–Paleogene/Neogene Georgia and South Carolina sedimentary kaolins in United States of America, which have been explored since the 1750s [4], the Cornwall and Devon kaolins in Southwestern England, which are believed to be the world’s largest and highest grade primary kaolin deposits, and the Jari and Capim Rivers Paleogene/Neogene sedimentary kaolins in the Amazon region of Northern Brazil [5].
The kaolin (Al2Si2O5(OH)4) group consisting of minerals such as kaolinite, dickite, nacrite and halloysite is important and widely used for various industrial applications. Global applications of kaolins are largely in the manufacturing of paper, ceramics, paints and coatings among others. Kaolins are in high demand in coating papers due to the rise in the use of paper products as an alternative to non-biodegradable products. In addition, the traditional use of kaolins in ceramic production has risen sharply globally in the manufacturing of ceramic tiles because of the increase in construction activities with growing urbanisation and population. This also increased its usage in the production of cements. High-purity kaolins are also useful as natural cosmetics and applied in pharmaceutics [5,6]. The global kaolin market was put at $5.8 billion with China as the leading importer worldwide (with $2.6 billion import value) in 2018 [7]. The physical and chemical characteristics of kaolin determine its ultimate application. Some of these characteristics are dependent on the geological origin, environment of formation and method of processing [8].
Kaolin is an important industrial mineral which has played a very important role in the economic and technological development of many industrialised nations [5]. The demand for kaolin which is also referred to as “white gold” in the world market consistently continues to increase [2]. In 2018, the annual demand and local production of kaolins in Nigeria were estimated at about 360,000 tonnes and 125,000 tonnes, respectively. The deficit of about 235,000 tonnes were imported [9]. One of the factors responsible for this deficit is the non-availability of large kaolin deposits that are relatively pure and commercially usable [5]. The proper evaluation and characterisation of some of the nation’s kaolin deposits are inevitable in meeting the growing local and global demands [7]. This will further boost the nation’s economy in terms of its gross domestic product (GDP) and foreign exchange earnings. Hence, this study aimed at assessing the potential applications of some Cretaceous–Paleogene/Neogene kaolins from Eastern Dahomey and Niger Delta Basins in Nigeria based on their physico-chemical, mineralogical and chemical characteristics.

2. Materials and Methods
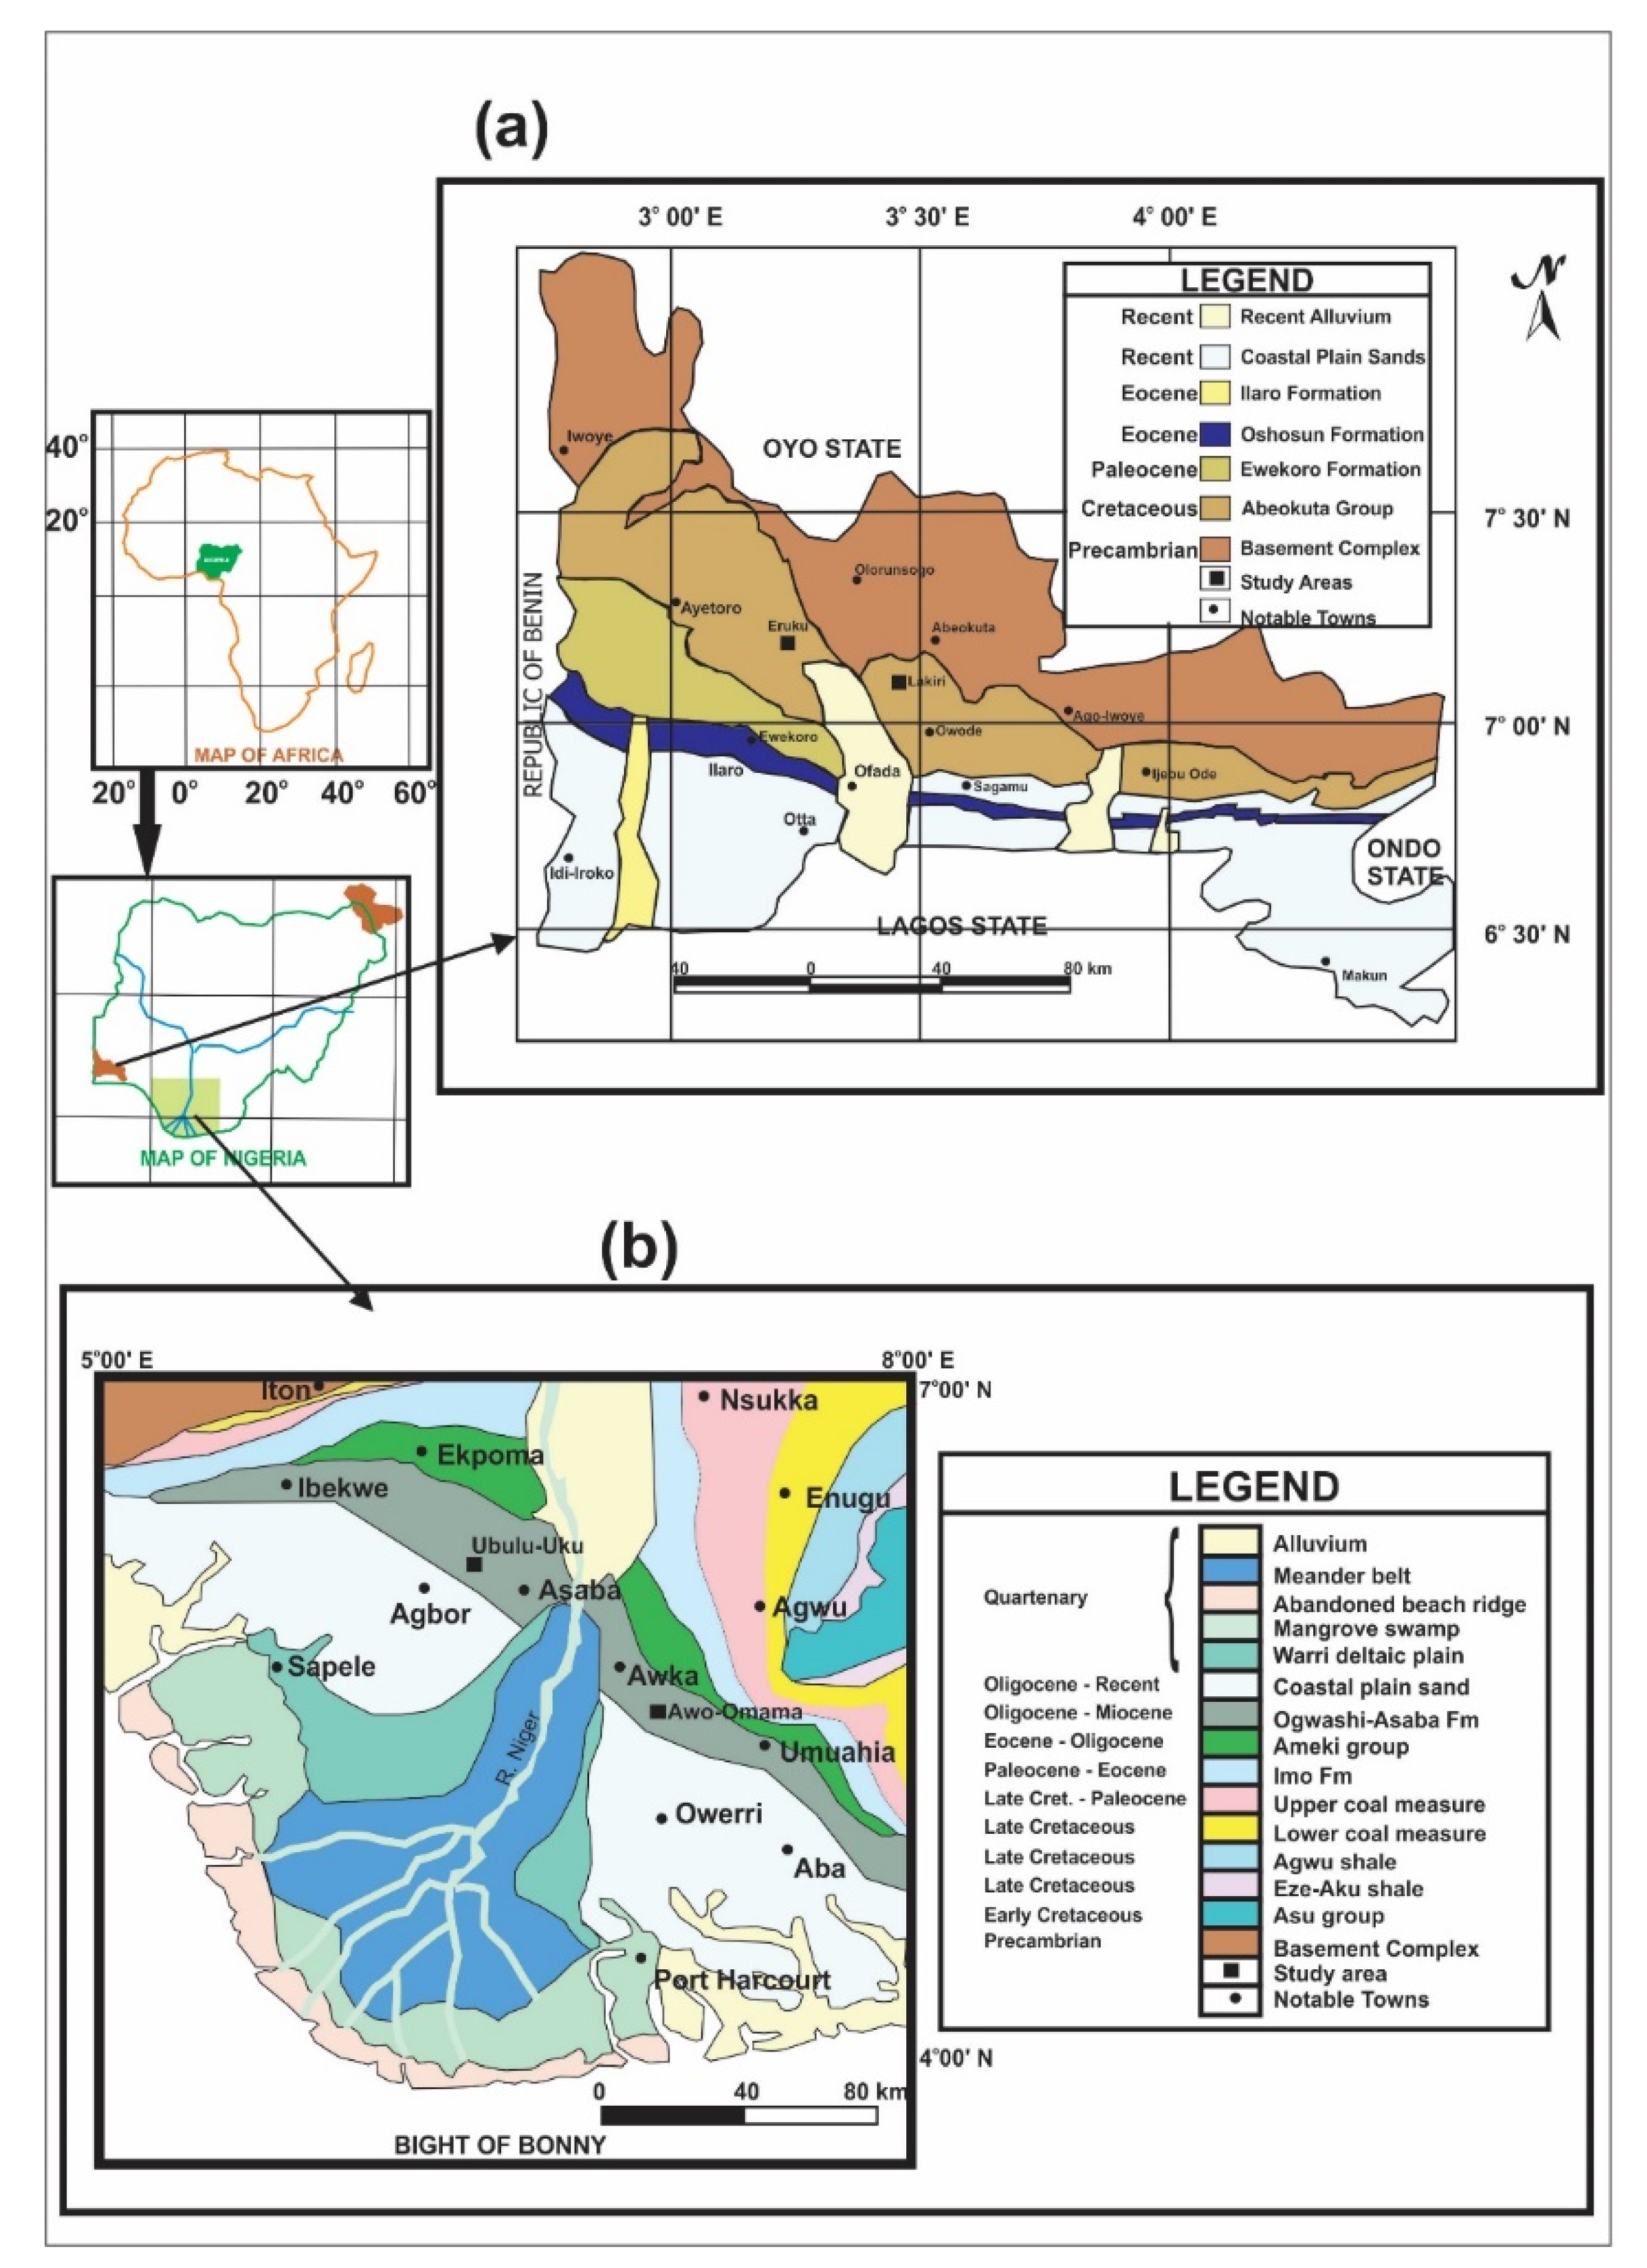
2.1. Study Areas

The Cretaceous (Lakiri and Eruku) and Paleogene/Neogene (Ubulu-Uku and Awo-Omama) kaolin deposits are exposed within the Abeokuta Group and Ogwashi-Asaba Formation of the Eastern Dahomey and Niger Delta Basins, respectively (Figure 1 and Table 1). The Lakiri kaolin deposit outcrops within the Lakiri village in Obafemi-Owode local government area (LGA) of Ogun State. The kaolin is dominantly purple to creamy-white with thicknesses up to 5 m with no distinct horizon and overburden up to 2 m (Figure 2). The deposit is quite extensive beyond the study site with estimated thickness based on geoelectrical vertical sounding (VES) varying from 0.4 m to 17 m [10]. The Eruku kaolin deposit outcrops within the Eruku village in Ado-Odo LGA of Ogun State. The deposit is generally reddish yellow with a height of about 5 m and more than 35 m wide with overburden top sandy soil of 1.5 m (Figure 2). The Ubulu-Uku kaolin outcrops along Agokun River near Anioma village, east of Agbor, Delta State. It extends for more than 2.5 km and thickness varies from 10 m to 40 m with an estimated reserve of more than 15.5 × 10⁶ metric tonnes [11]. It is overlain by a brown-reddish ferricretic layer from which iron is leached by percolating water, giving rise to a purplish colour at the contact zone between the base of the ferricretic layer and the upper horizon of the kaolin deposit (Figure 2). The Awo-Omama kaolin deposit outcrops along the western wall of the Njiagba river valley near Awo-Omama village in the Orlu LGA of Imo State. Exposures of this deposit are also known to occur along the Onitsha–Owerri road (about 5 km south of the main outcrop and quarry site). The deposit grades downwards from creamy-white to purplish-yellow at the base (Figure 2). The deposit is embedded within a friable cross-bedded sandstone deposit with herringbone structures at some spots. Large sub-angular to rounded pebbles were also found within the sandstone. Based on VES, the estimated thickness of the deposit varied from 30 m to 90 m with an estimated reserve of 3.92 × 10⁶ metric tonnes [11].

2.2. Sampling

Two profiles were sampled for each kaolin deposit (except for Eruku with three profiles) at intervals with 28 kaolin samples obtained (Table 1, Figure 2). Composite samples (obtained by mixing all the samples from each kaolin profile into one homogenous sample) were used for the determination of Atterberg limits, giving a total of 9 samples (one sample per kaolin profile). The <2 mm fraction was taken as the bulk [15].

2.3. Analyses

The colour of each bulk sample was obtained by making a visual comparison with the soil colours in the Munsell soil colour chart [16]. The pH and electrical conductivity (EC) were determined using Crison BasiC 20 and 30 pH and EC meters, respectively following the procedures outlined by van Reeuwijk [15]. The determination of three fractions (sand, silt and clay) by the hydrometer method followed the procedures described by van Reeuwijk [15]. The Atterberg limit (liquid and plastic limits) tests were determined using the Casagrande method [17,18].
X-ray diffraction (XRD) qualitative analyses of the bulk kaolin samples were carried using a Bruker AXS D8 Advance PSD system operated at 40 kV and 40 mA, scanned between 3–85° with a 0.034° 2θ step scan, and 2 s/step with Cu-Kα radiation at the Ithemba LABS, Cape Town, South Africa (SA). The phase identifications were carried out by search/match function using X’Pert Highscore Plus Software with the Inorganic Crystal Structure Database (ICSD). Characteristic kaolinite peaks were observed at 7.13 Ǻ, 4.36 Ǻ, 4.16 Ǻ and 3.57 Ǻ; whereas peaks at 4.25 Ǻ and 3.34 Ǻ were assigned to quartz. Peaks observed at 3.51 Ǻ, 4.15 Ǻ, 2.71 Ǻ and 10.01 Ǻ were assigned to anatase, goethite, hematite, and muscovite, respectively. The weight percentages of the mineral phases were obtained using the Rietveld method at XRD Analytical and Consulting cc, Pretoria.
The morphological analyses of the samples were carried out using a Zeiss MERLIN field-emission scanning electron microscope (Carl Zeiss, Jena, Germany) at the Central Analytical Facilities (CAF), Stellenbosch University (SU), SA. The SDT Q600 thermogravimetric analysis and differential scanning calorimetry (TGA-DSC) analyser in the Department of Chemistry, University of Johannesburg (UJ) in Johannesburg, South Africa, was used for the thermal analysis. Ten milligram (10 mg) of the samples were heated from 25 °C to 1100 °C, at a rate of 10 °C /min [19]. Major element compositions of the bulk kaolin samples were determined by X-ray fluorescence (XRF) spectrometry on a PANalytical Axios Wavelength Dispersive spectrometer (Malvern Panalytical Ltd., Malvern, UK) at the CAF, SU, SA. The machine is equipped with a 2.4 kW Rh anode X-ray tube and linked to a SuperQ PANalytical software.

3. Results

3.1. Physico-Chemical Characteristics
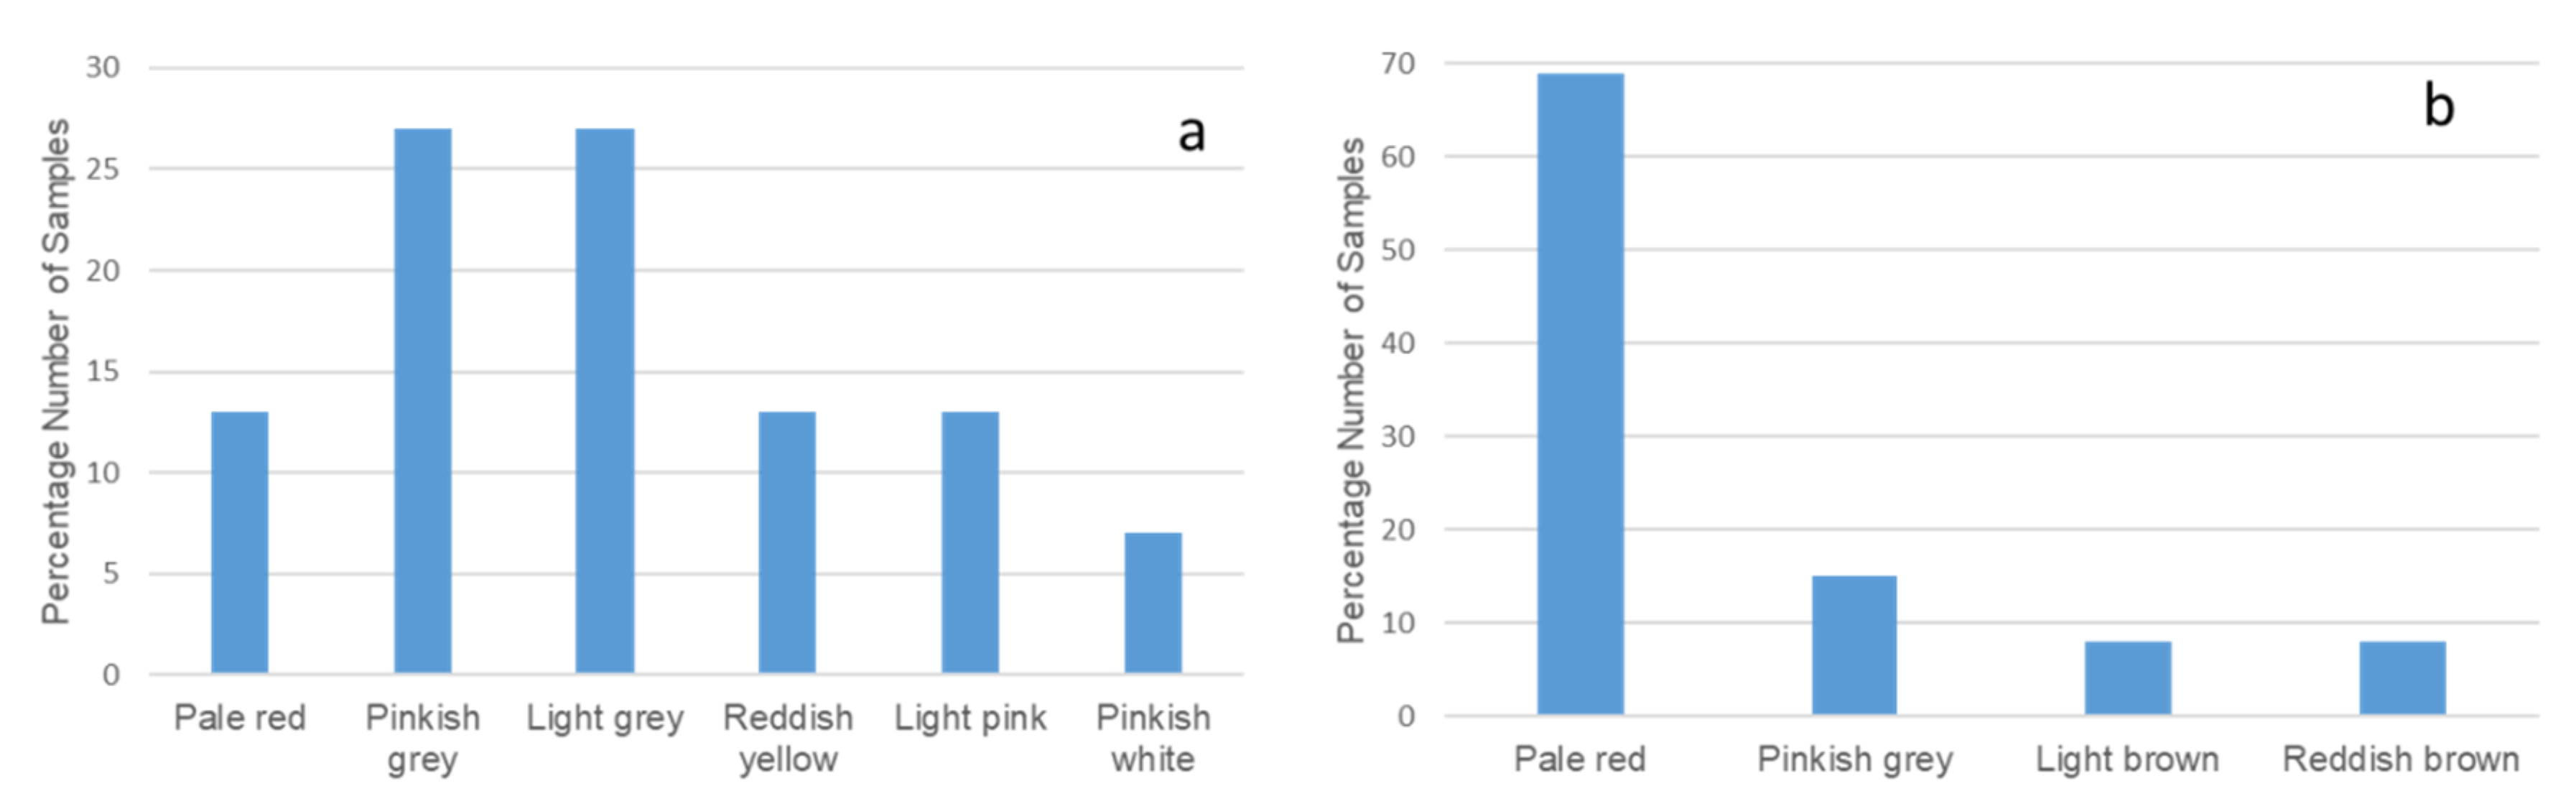
3.1.1. Colour

The percentage colour distribution for the Cretaceous kaolins was dominated by light and pinkish grey, followed by light pink, reddish yellow and pale red, and pinkish white; whereas the Paleogene/Neogene kaolins were dominated by pale red followed by pinkish grey, reddish brown and light brown (Table 2 and Figure 3).

3.1.2. Hydrogen Ion Concentration (pH) and Electrical Conductivity (EC)

The pH values of the studied kaolins were generally acidic with values < 7 (4.27–5.29) (Table 2). The measured EC values for the Cretaceous–Paleogene/Neogene kaolins ranged between 0.2 and 5.0 μS/cm (except for EP2 0 m, LP1 2 m, LP2 0 m, AL1 1 m and UL2 2 m with EC values > 8.0 μS/cm) (Table 2).

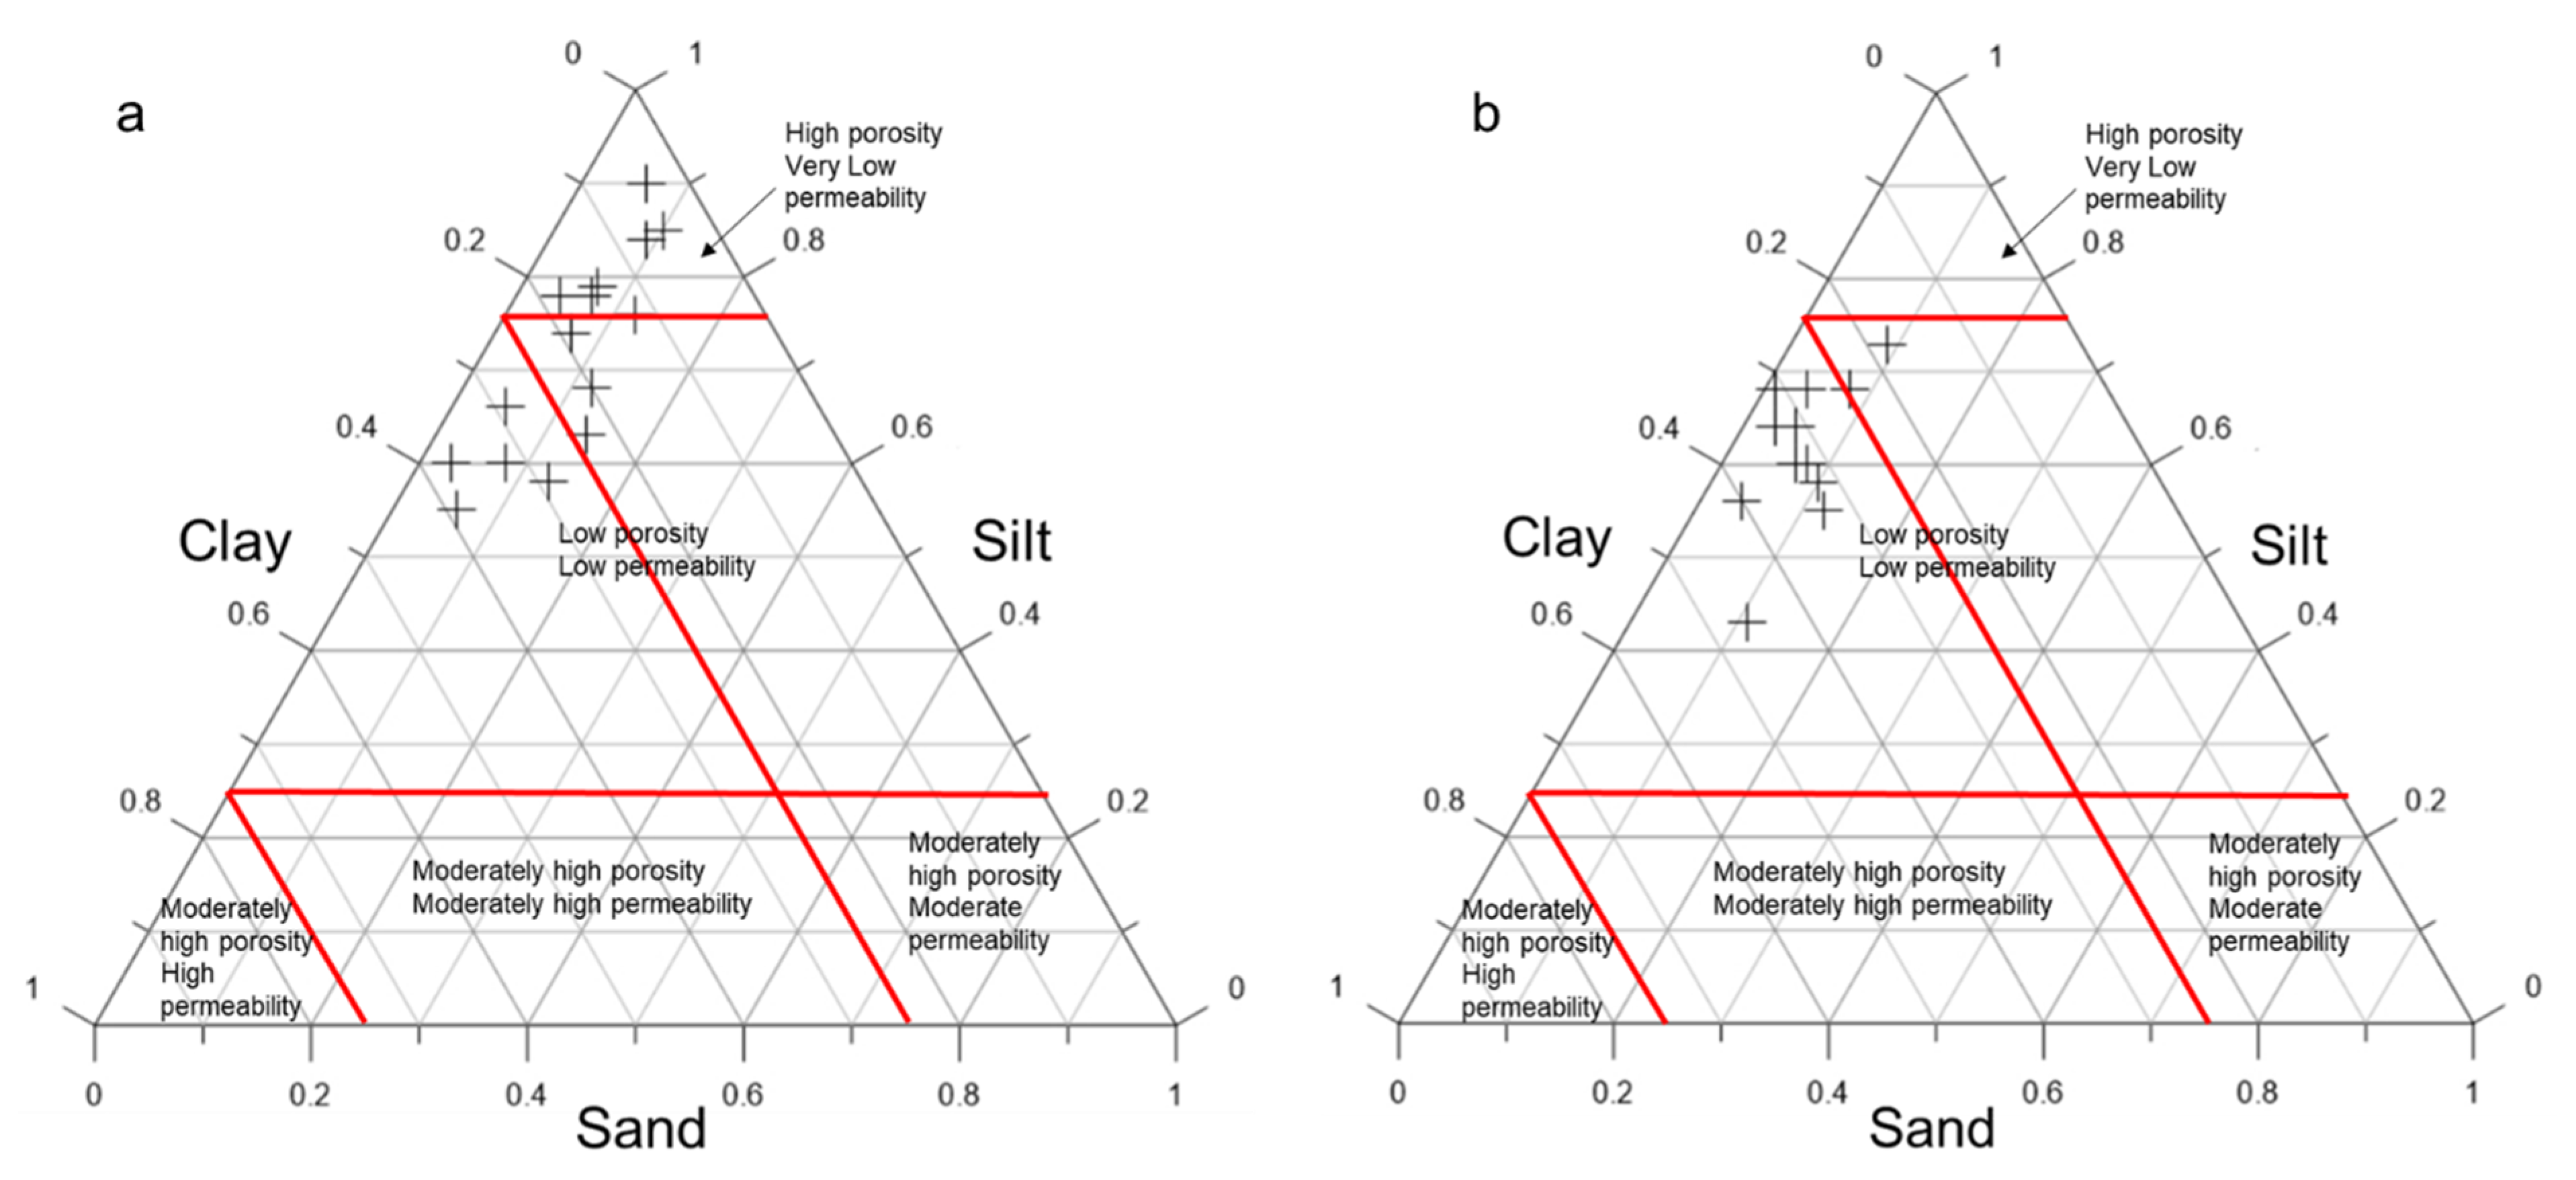
3.1.3. Particle Size Distribution
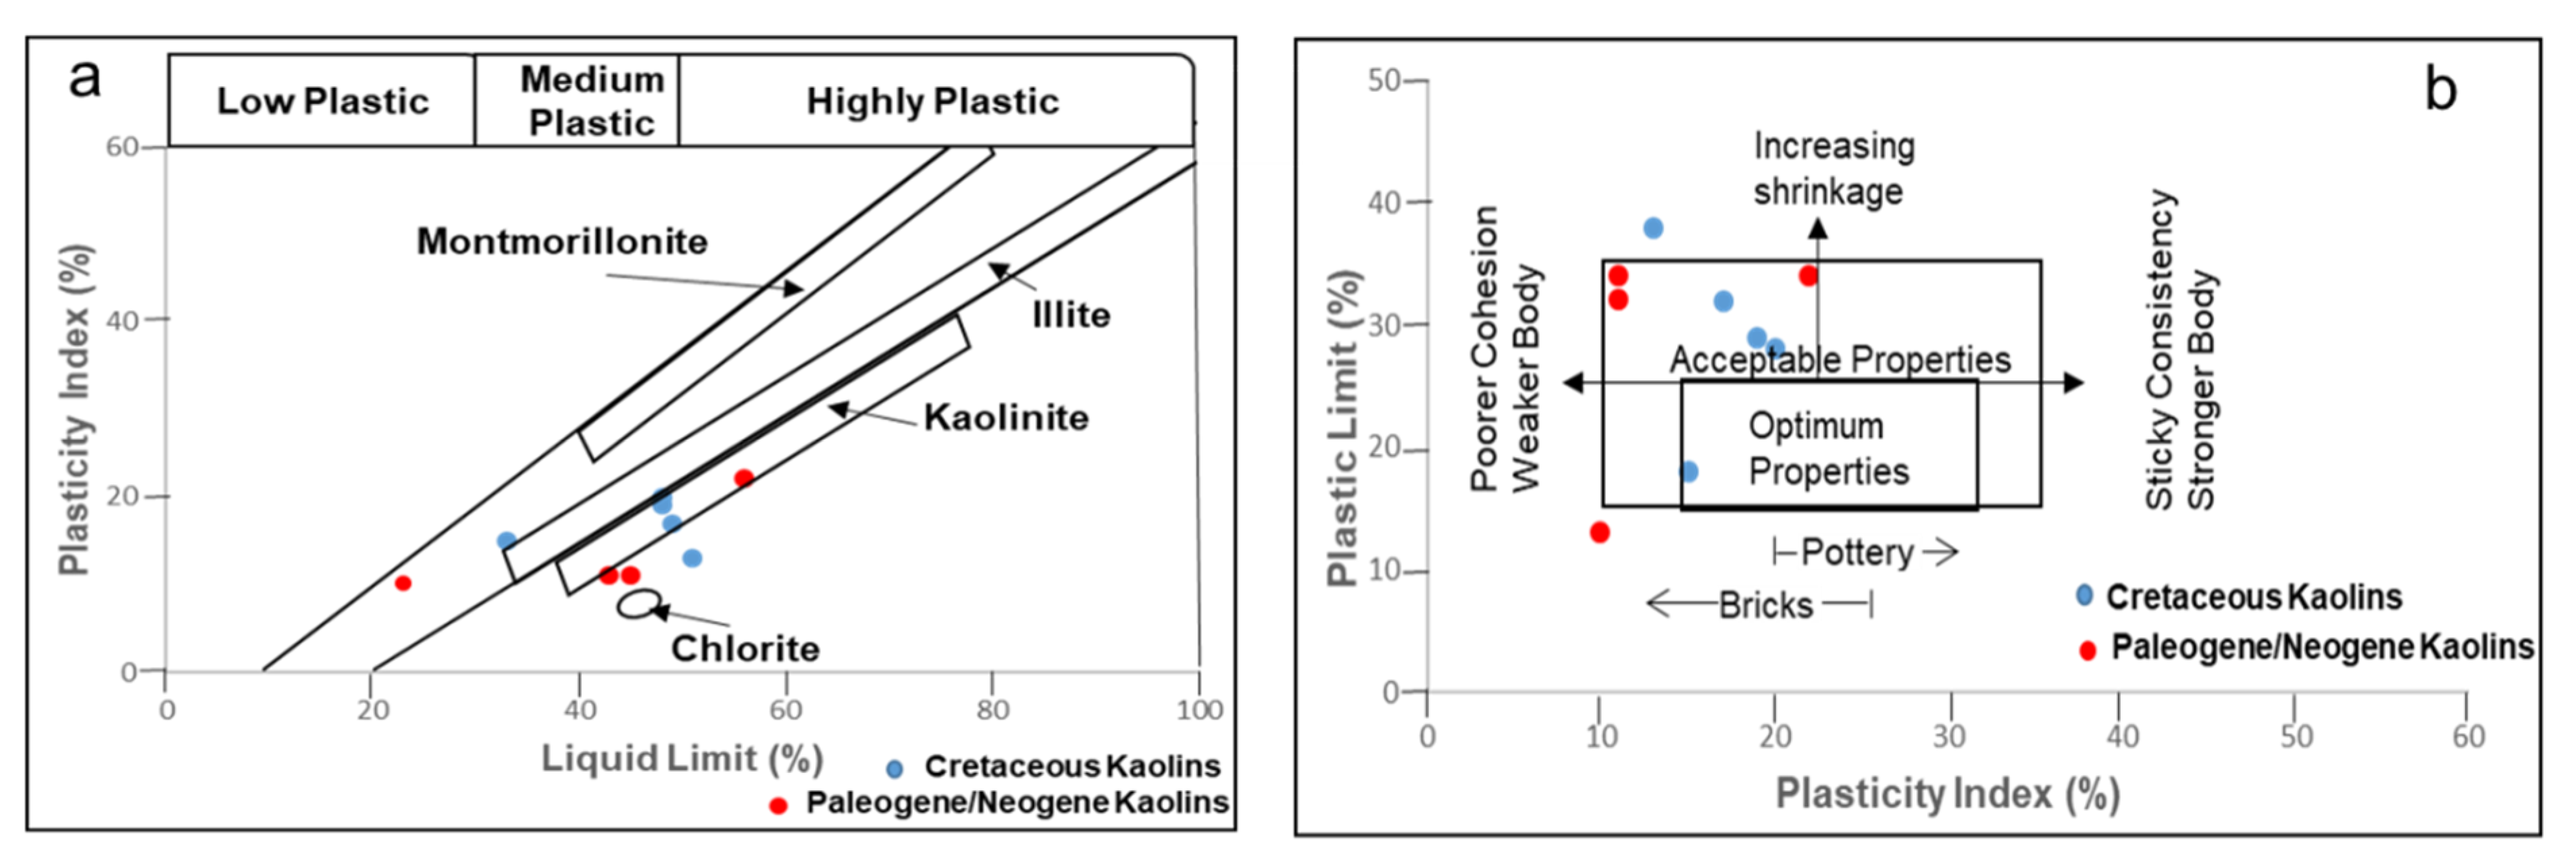
The analysed samples showed wide variations in the particle size (Table 2) with clay fraction (<2 μm) ranging from 55% to 90% and 43% to 61%, silt fraction from 3% to 14% and 1% to 11%, and sand fraction from 4% to 39% and 32% to 48% for the Cretaceous and Paleogene/Neogene kaolins, respectively.

3.1.4. Plasticity

The liquid limit (LL) of the Cretaceous and Paleogene/Neogene kaolins were between 33–51% and 23–56%, plastic limit (PL) ranged from 18–38% and 13–34%, and plastic index (PI) ranged between 13–20% and 10–22%, respectively (Table 3).

3.2. Mineralogical Characteristics

3.2.1. Mineral Compositions

In the Cretaceous kaolins, kaolinite was indicated as the predominant kaolin mineral, followed by quartz, muscovite, anatase, goethite and hematite; whereas in the Paleogene/Neogene kaolins, kaolinite was also predominant followed by quartz, anatase and goethite (Table 4, Figure 4). Anatase, goethite and hematite are the discolouring minerals in the studied kaolins that contain iron and titanium with abundances ranging from 1 to 2 wt%. In the Cretaceous kaolins, quartz and muscovite were the primary minerals present; whereas quartz was the only primary mineral present in the Paleogene/Neogene kaolins. The main secondary minerals in the Cretaceous and Paleogene/Neogene kaolins were kaolinite, anatase and goethite (Table 4, Figure 4).

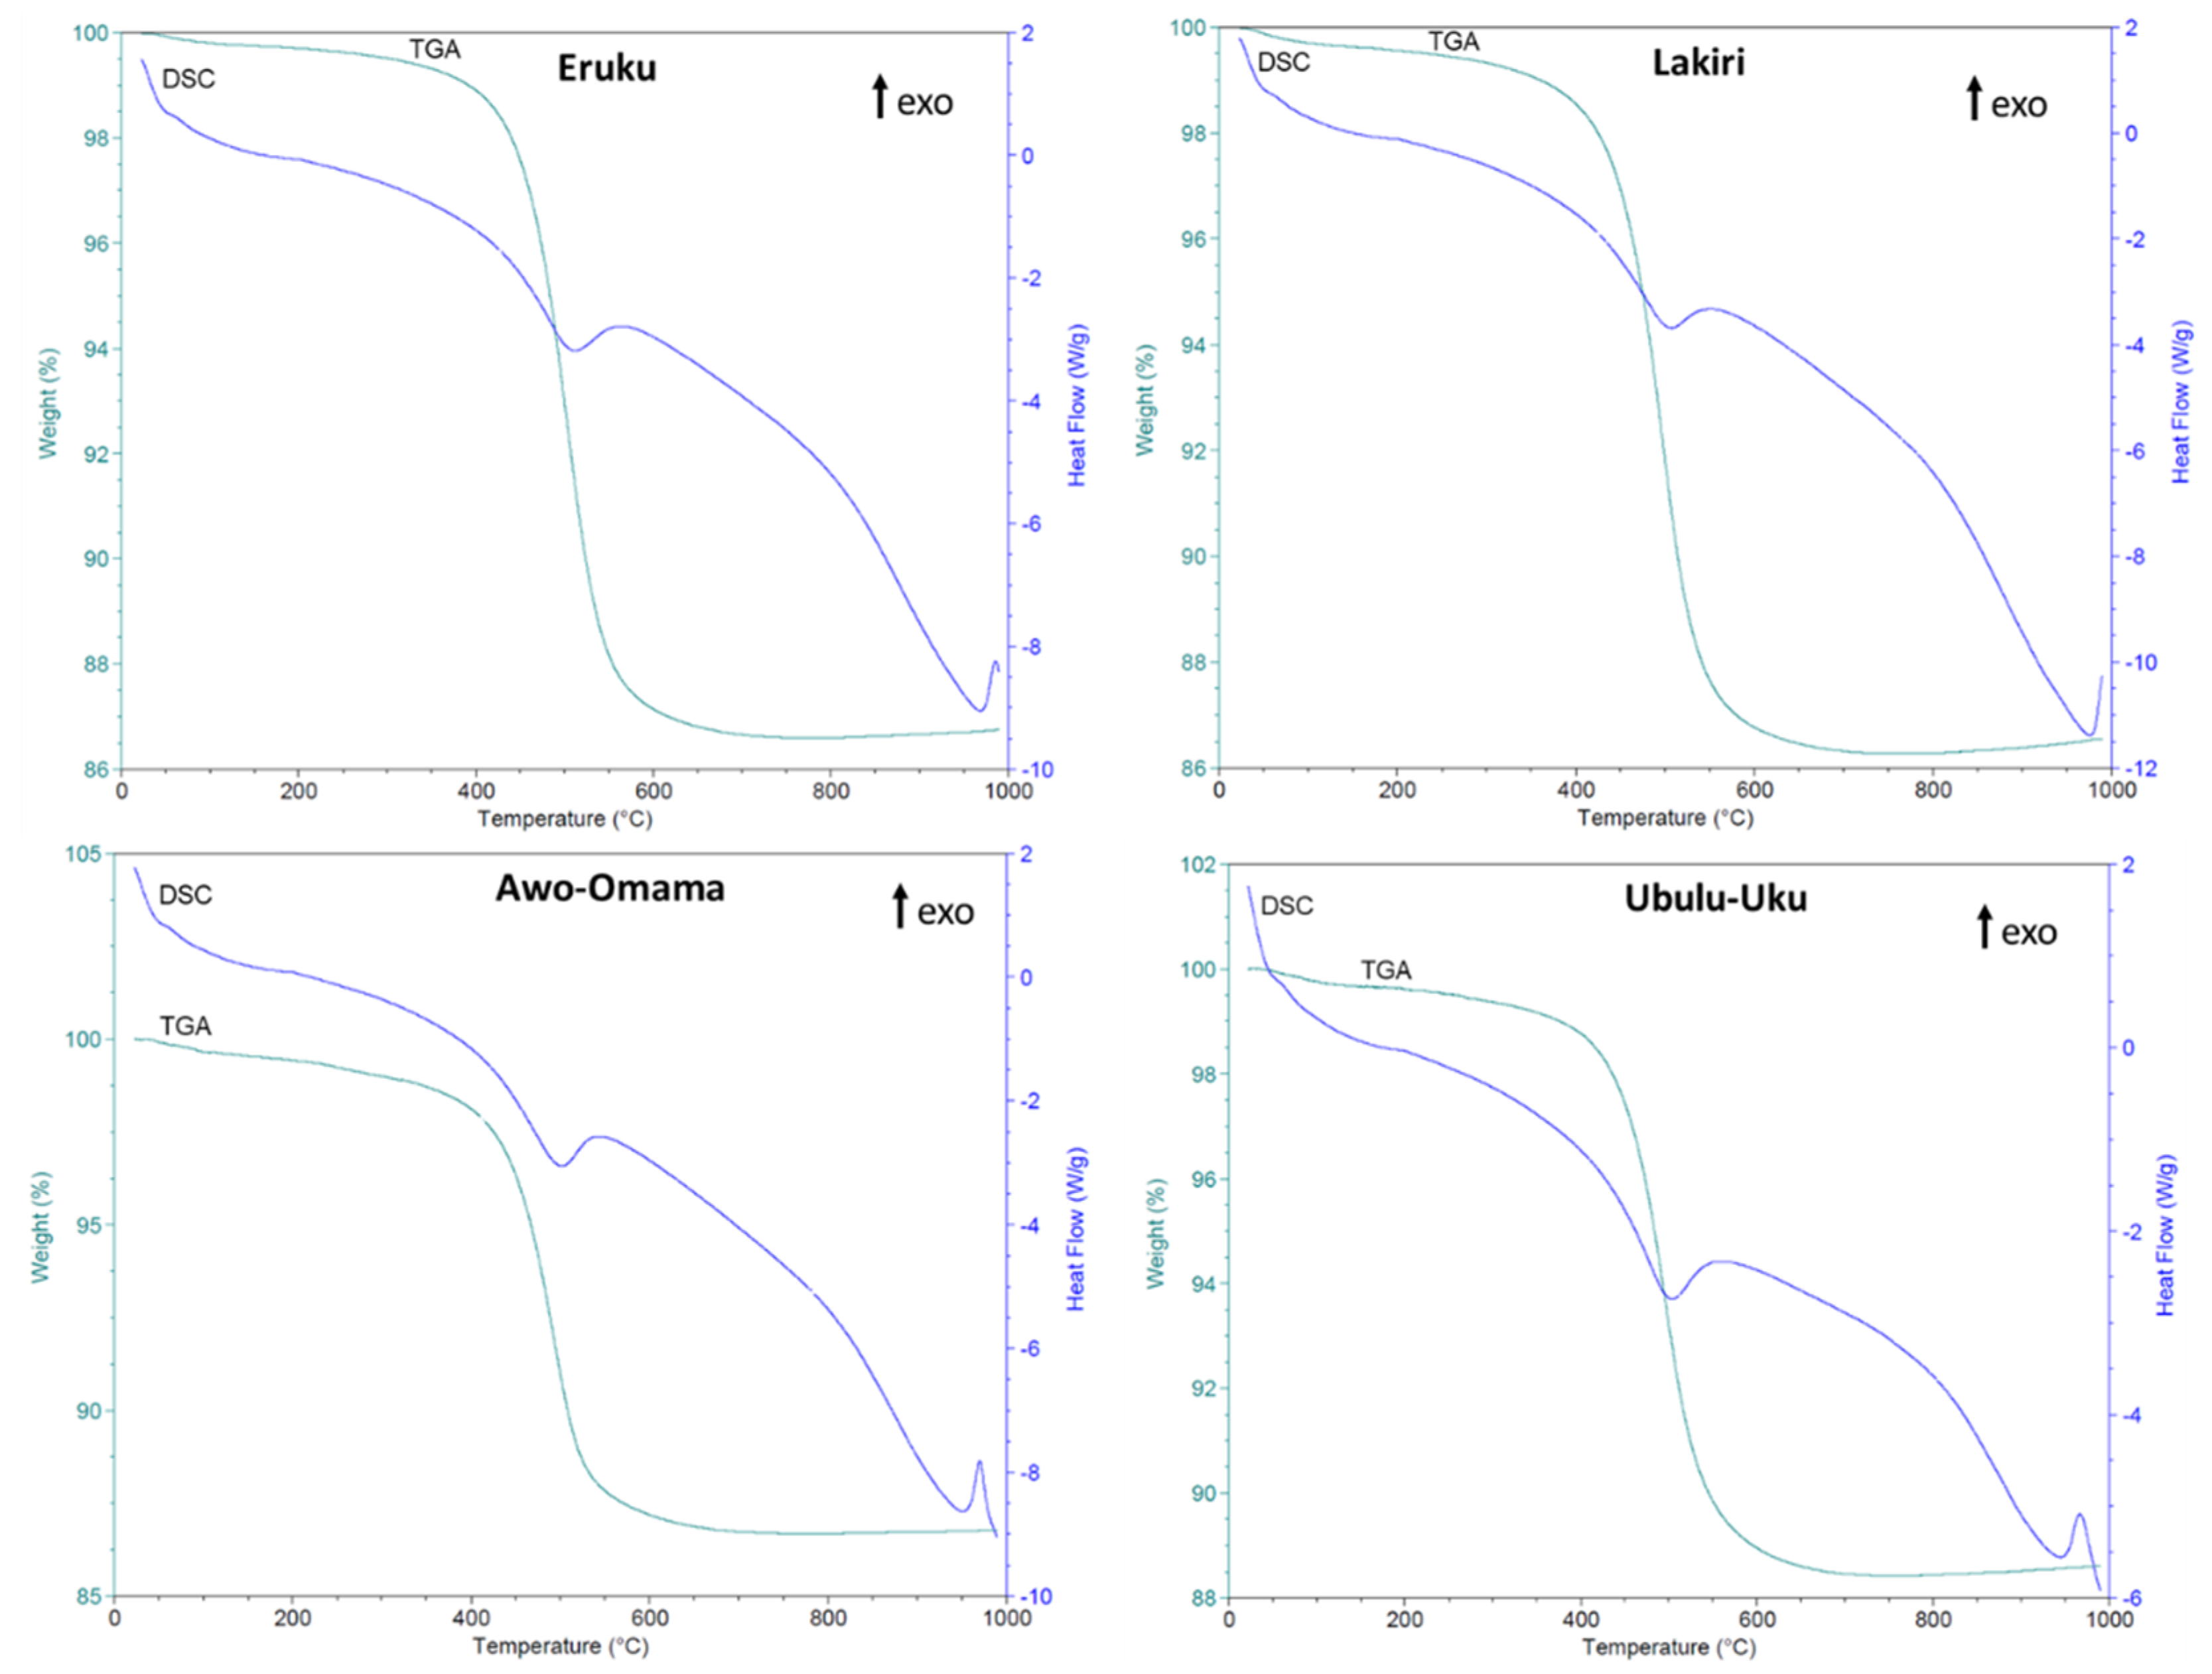
3.2.2. Kaolinite Thermal Evolution

The endothermic (dehydroxylation) and exothermic (mullite formation) temperature peaks were between 488–517 °C and 980–985 °C, 500–514 °C and 951–970 °C for Cretaceous and Paleogene/Neogene kaolins, respectively (Table 4, Figure 5). The reactions were accompanied with total weight losses ranging from 13.1–14.4% and 10.7–13.8% for Cretaceous and Paleogene/Neogene kaolins, respectively.

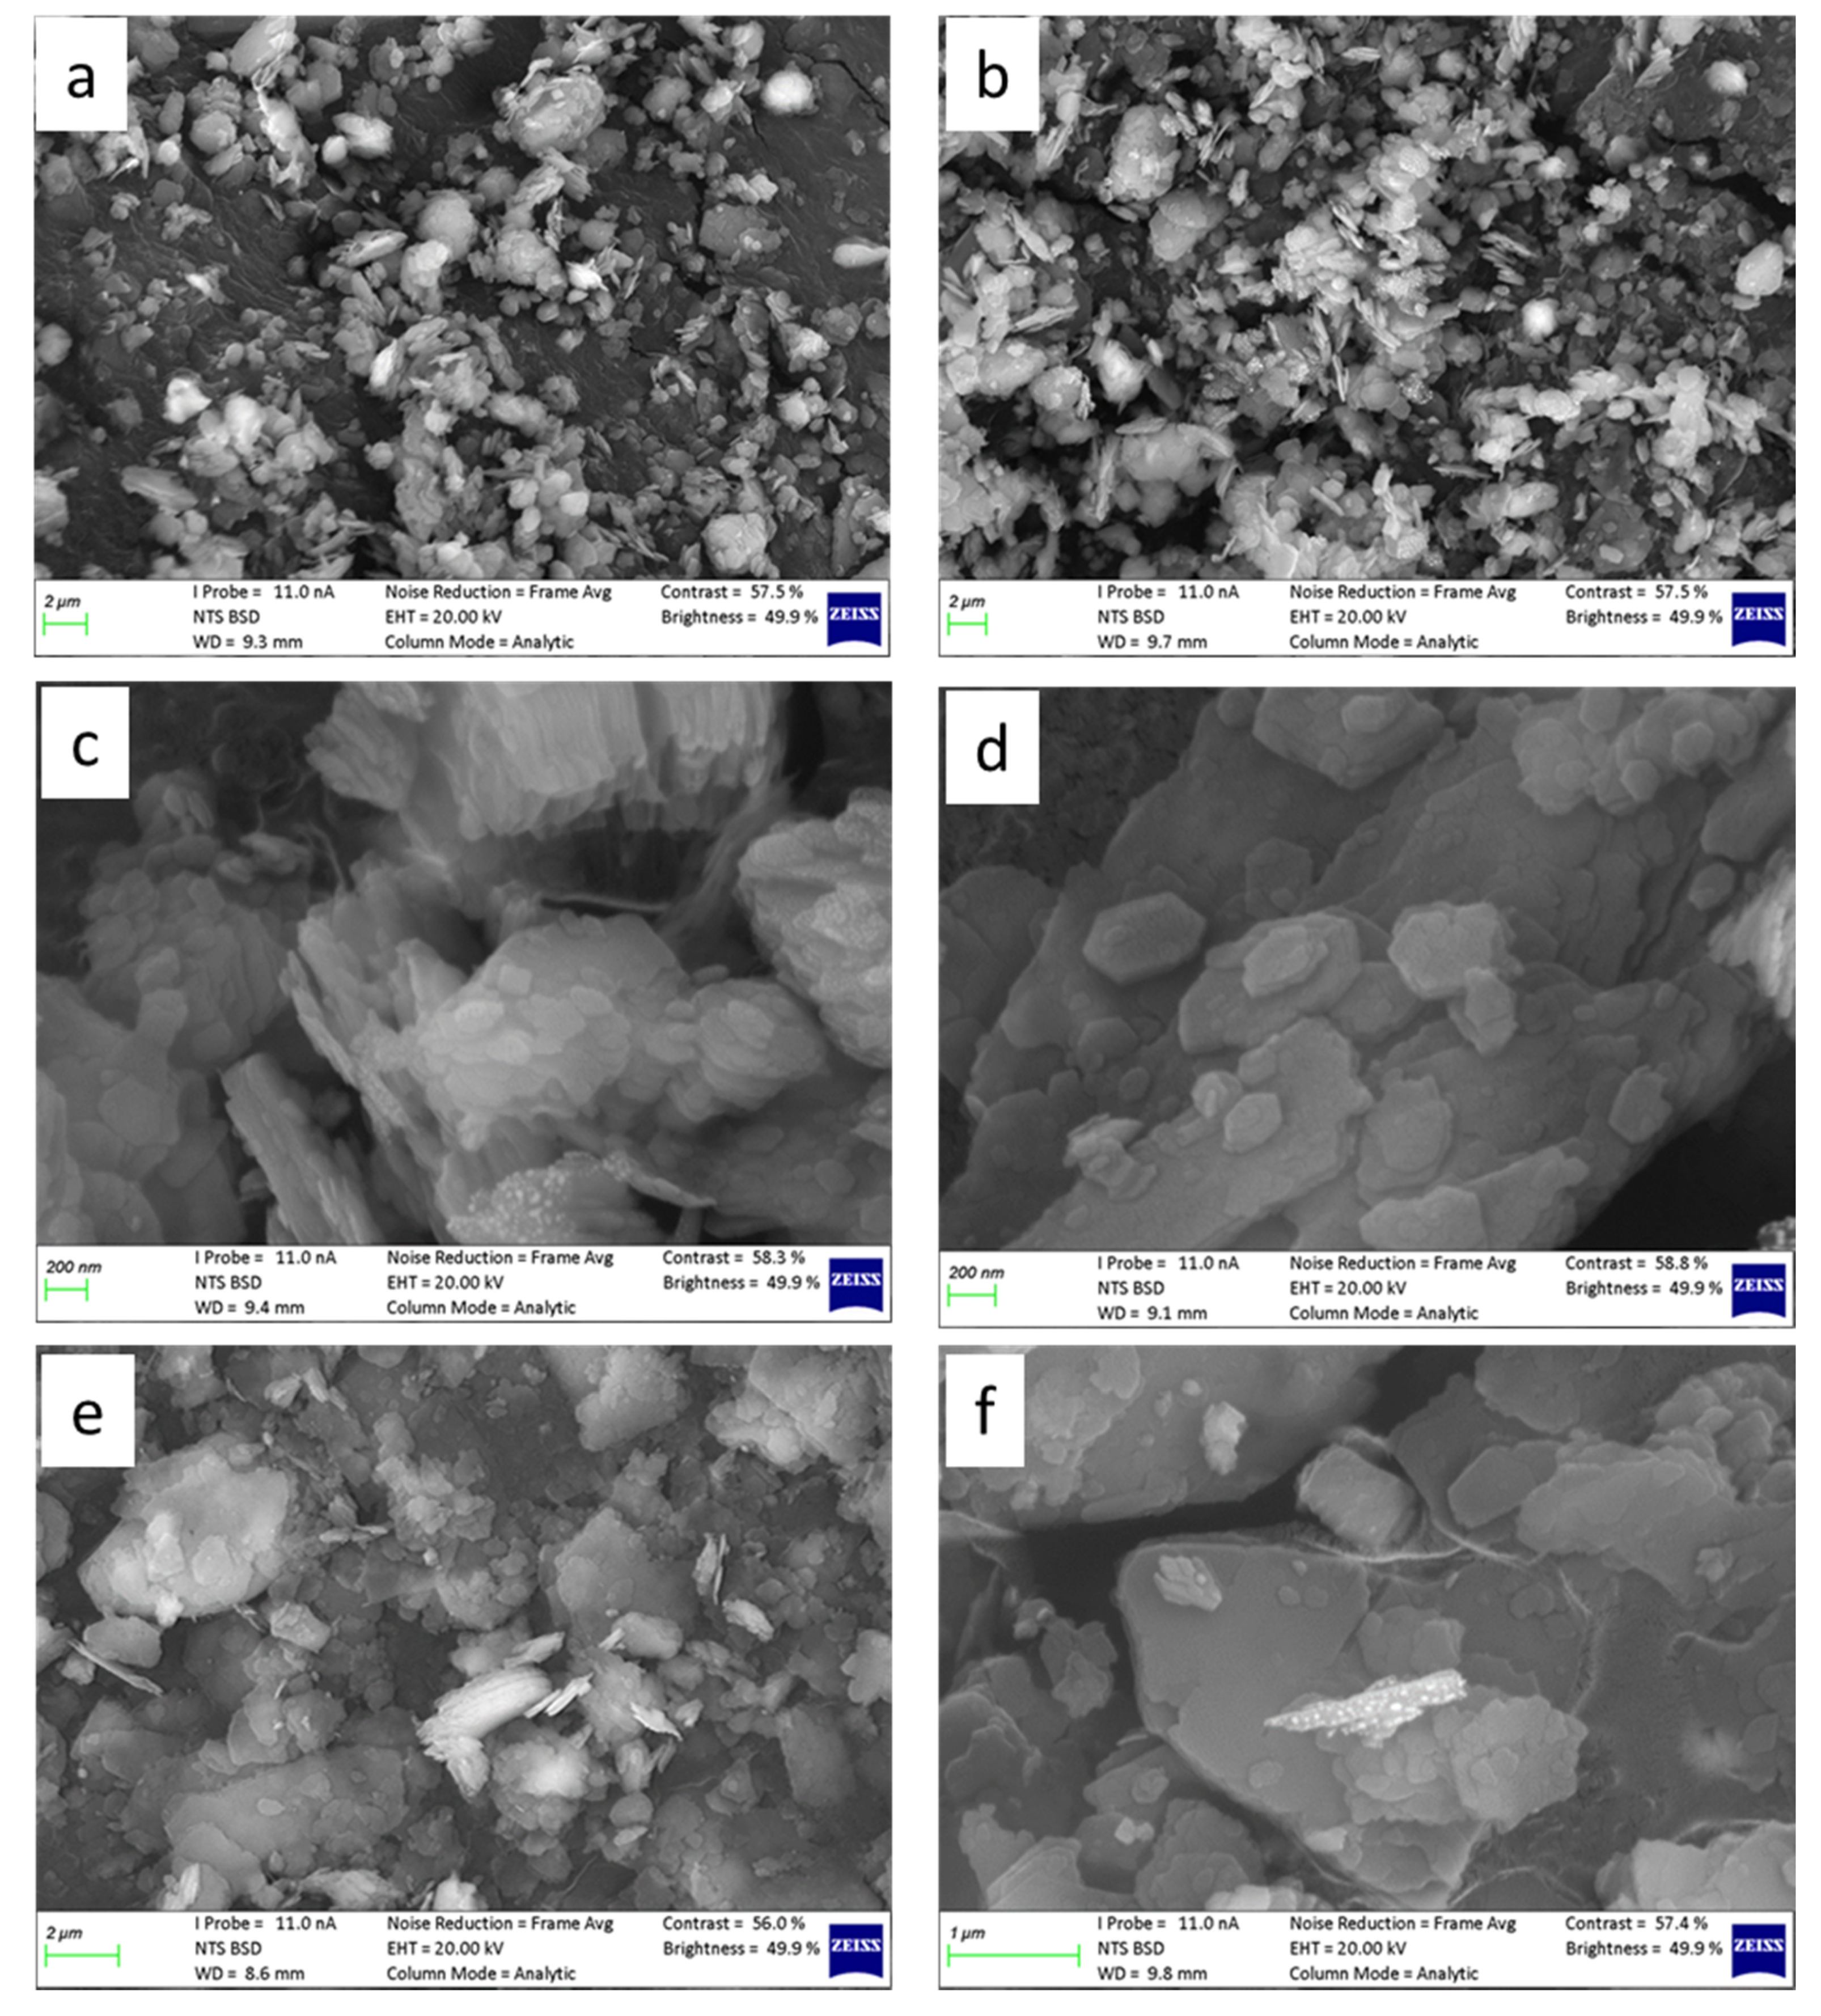
3.2.3. Kaolinite Morphology

The SEM images displayed the various morphologies and textures of the studied Cretaceous–Paleogene/Neogene kaolins (Figure 6). The Cretaceous kaolins, comprised of thin platy kaolinite particles with no stacks (Figure 6a,b), are comparable to the hard Paleogene/Neogene Georgia kaolins with thin platy particles with no large books or stacks [5]. However, the Paleogene/Neogene kaolins, characterised by pseudohexagonal stacks to books with thin platy particles (Figure 6c–f), are comparable to the soft Cretaceous Georgia kaolin with large coarse stacks interspersed in a matrix of finer platy particles, as well as the soft Late Cretaceous/Early Paleogene/Neogene Capim River kaolin with larger stacks [5].

3.3. Chemical Characteristics

The major oxide compositions of the Cretaceous–Paleogene/Neogene kaolins are presented in Table 5. The most abundant oxides were SiO2, Al2O3, Fe2O3 and TiO2; whereas MgO, CaO, Na2O and K2O were present in small quantities. The predominance of SiO2 and Al2O3 were mainly associated with quartz and kaolinite minerals. Fe2O3 and TiO2 are the main discolouring component. The presence of Fe2O3 and TiO2 can be associated with hematite, goethite and anatase minerals.
The loss on ignition (LOI) average values for Paleogene/Neogene kaolins were relatively lower than those for the Cretaceous kaolins. This is understandable since LOI is related to the dehydroxylation of kaolins, organic matter oxidation, and decomposition of carbonates and hydroxides [22].

4. Discussion

Raw kaolin colour and fired products have aesthetic importance in their application, particularly in ceramics [23]. Colours are imparted by colour-causing elements retained either in the structure of the kaolin mineral or as associated oxides (such as anatase, hematite and goethite) occurring with the kaolin mineral [24]. Clay minerals such as kaolin with Fe and Mg in its octahedral sites, contain less structural water; hence less energy will be required for dehydroxylation and less temperature for vitrification than usual. The lesser temperature is possible because Fe, Mg, Ca, Na and K oxides can act as fluxing agents [11,19,25].
The EC estimates the amounts of soluble salts (such as chlorides, phosphates, sulphates, carbonates and nitrates), which could cause severe problems in many applications [26,27]. In drying and firing of ceramic clay bodies, visible surface-scum due to the migration of soluble salts have been observed on the surface of vessels coupled with exfoliation and peeling of the surface under extensive crystallisation condition [24]. The relatively low EC values suggest little or no dissolved salts in the kaolins [26]. Chemically inert (pH range of 4–9) and low conductivity kaolins could be useful in the production of excellent fillers and extenders [5]. Considering the clayey nature of the samples in addition to the relatively low conductivity, production waste resulting from cracking due to shrinkage when fired would be low for ceramic applications [24].
The control of the sand, silt and clay fractions over porosity and permeability was assessed based on the ternary diagram of McManus [28] (Figure 7). The Lakiri kaolins plotted predominantly within the high porosity and very low permeability region (except for LP1 0 m); whereas the Eruku (except EP1 4 m and EP2 4 m), Awo-Omama, and Ubulu-Uku kaolins all plotted in the low porosity and low permeability region (Figure 7). Based on the Strazzera et al. [29] and Murray [5] criteria, the more fine-grained Cretaceous kaolins with higher porosity could be suitable to produce porous ceramic wares. The very low to low permeability is indicative of low cohesion and difficulty to extrude because moderate permeability will facilitate penetration of water into the kaolin, rendering its adsorption faster and more important. In addition, the water in the ceramic paste must provide enough cohesion to the ceramic body to equilibrate extrusion [27].
One of the most important factors in the industrial applications of kaolin is its plasticity. It is controlled by several factors, such as the particle size distribution, mineral composition and the presence of organic matter [30]. The PI and LL values for the Cretaceous-Paleogene/Neogene kaolins plotted on the Holtz and Kovacs diagram [31] (Figure 8a) shows that all the kaolins plotted in the medium plastic region except for two Paleogene/Neogene samples which are in the low (UL1) and high (AL2) regions.
The slight differences in the plasticity of the studied kaolins are related to the differences in the abundance of silt and clay fractions. Higher clay and silt fractions give rise to relatively higher plasticity [30]. In addition, a moderate PI indicates moderate potential for swelling. However, excessive shrinkage is not expected since the PI values obtained were <35% [32]. Kaolins with PI < 10% are not suitable for building-related ceramic production due to the risk of problems such as unsuitable dimensional characteristics and cracks related to the visible variation in the amount of extrusion water [33,34]. Clays with low PI (7 < PI < 10) require the addition of polymers to obtain an adequate plastic behaviour and prevent cracking during extrusion [35,36]. Most of the studied kaolin have PI ≥ 10%. Hence, the Cretaceous-Paleogene/Neogene kaolins could possibly be used in their raw state to produce structural clay products by extrusion. Furthermore, the Casangrande chart (Figure 8b) indicates that the studied kaolins are fit for brick making and possibly pottery wares. They predominantly plotted in the region of acceptable properties, except for sample LP1 that plotted within the optimum properties region and samples EP2 and UL1, which plotted outside both the acceptable and optimum property regions.
Keller [37] described clays containing 3 wt% iron oxides with 1 to 3 wt% titania as useless to the ceramist. However, Pruett and Alves [38] reported that the beneficiation of a kaolin to nearly white is probable for kaolins containing a total of <6 wt% iron oxides and hydroxides, and titania. Iron could be associated with kaolinite by Fe substituting for Al in the octahedral sheet of the kaolinite and hence present in the kaolinite structure [39,40]. Iron has also been reported to be associated with rutile and anatase in some kaolins from Georgia, USA [41] and Egypt [42]. The possible precursor for the occurrence of anatase in sedimentary kaolin deposits have been suggested to be ilmenite and biotite minerals [43]. Known world sedimentary economic kaolin deposits such as Georgia kaolins, Capim River kaolins, and Maoming kaolins in USA, Brazil, and China respectively are currently mined for various industrial applications. The average kaolinite abundances obtained for the Cretaceous and Paleogene/Neogene kaolins (83 and 62 wt%, respectively) were lower relative to the soft Late Cretaceous/Early Paleogene/Neogene Capim River kaolin in Brazil (98 wt%) and the soft Cretaceous Georgia kaolin in USA (95 wt%) [44]; but higher than those for the Late Paleogene/Neogene Maoming kaolins in China (20–25 wt%) [5].
The exposure of raw kaolin material to the hot environment in a calciner with increasing temperature is accompanied by a few reactions (Equations (1) and (2)) such as dehydroxylation and phase transformations [45].
Between 450–700 °C: endothermic: dehydroxylation:
Al2Si2O5(OH)4 → Al2O3.2SiO2 (metakaolinite) + H2O
Between 900–1000 °C: exothermic: transformation into crystalline phases:
Al2O3.2SiO2 → 2Al2O3.3SiO2 (primary mullite or pseudomullite: Si-Al spinel with mullite-like composition) + amorphous SiO2
The dehydroxylation and mullite formation temperatures obtained for the Cretaceous–Paleogene/Neogene kaolins were lower than the corresponding average values of 576 °C and 1001 °C reported for Georgia kaolins [46]. The Cretaceous kaolins had higher average weight loss (13.6%) than the Paleogene/Neogene kaolins (12.2%) due to their relatively higher kaolinite content (Table 4). The presence of higher quartz percentages in the Paleogene/Neogene kaolins also contributed to their lower average weight loss [47]. Weight losses accompanied by shrinkages due to exothermic and endothermic reactions in the kaolins have been reported [48]. Minimal shrinkage during firing of the kaolins as raw materials in ceramic processing is vital [47,49].
The occurrence of these kaolins as pseudohexagonal stacks to books and thin platy particles is suggestive of kaolin emplacement through weathering processes. In addition, kaolinite euhedral–subhedral–anhedral external forms and the irregular edges are characteristic of actively growing crystals [50]. The presence of non-uniform crystal sizes is typical of sedimentary kaolins. The absence of smaller and thinner packets or sheaves crystals typical of hydrothermally altered kaolins further affirms the formation of these kaolins from weathering processes [51]. In addition, the absence of tubular-shaped crystals confirms the absence of halloysite in the kaolins [49,52]. Kaolinite crystal forms directly affect properties such as brightness, glossiness and printability in paper coating [44]. The relatively finer particle sizes, coupled with the platy kaolinite shapes observed within the Cretaceous kaolins, are ideal for imparting a smooth and dense surface that is uniformly porous which will further give the paper a more uniform ink receptivity [5].
The average SiO2/Al2O3 ratios were 2.33 and 1.53 for Cretaceous Eruku and Lakiri kaolins and 5.69 and 2.76 for Paleogene/Neogene Awo-Omama and Ubulu-Uku kaolins. These SiO2/Al2O3 ratios were higher than the value for the ideal kaolinite (1.18) [53] and some commercially marketed sedimentary kaolins (Table 5) due to higher SiO2 concentrations in the Cretaceous–Paleogene/Neogene kaolins. The average bulk TiO2, MgO, CaO, Na2O and K2O concentrations of the studied kaolins were comparable to the commercially marketed sedimentary kaolins; whereas Fe2O3 concentrations were quite higher. However, the average LOI values varying from 6.87–12.57 wt% were lower than the LOI of ideal kaolinite (13.9) and that of commercially marketed sedimentary kaolins (Table 5).
Specifications related to the major oxides’ data are very important for industrial applications of the kaolins. The average major oxides compositions of the studied Eruku, Awo-Omama and Ubulu-Uku kaolins compared with specifications for paper coating, paper filler, ceramics, pharmaceutical and cosmetics industries [20,21] showed that they cannot be used in their raw states without proper beneficiation (Table 5). However, Lakiri kaolin could be more suited for applications in the paper coating and ceramics industries except for TiO2 and K2O contents (Table 5). The use of high magnetic separators, possibly with other techniques such as flotation and/or selective flocculation will be effective in refining the kaolins to increase their commercial uses [5,54].

5. Conclusions

This study determined the physico-chemical, mineralogical and chemical compositions of the studied kaolins. The kaolins were considered to contain little or no soluble salts which can cause exfoliation and peeling of the surfaces of ceramic clay bodies. The Cretaceous kaolins were more clayey than the Paleogene/Neogene kaolins. Hence, from their particle size distribution, the Lakiri kaolins were found to be highly porous with very low permeability; whereas the Eruku, Awo-Omama, and Ubulu-Uku kaolins have low porosity and permeability, which have implications for the cohesion and extrusion of the kaolins when used in the ceramic industry. Medium plasticity for the Cretaceous and Paleogene/Neogene kaolins suggests moderate potential for swelling. The PI ≥ 10% values obtained were appropriate for building related ceramic productions particularly in brick making and possibly pottery wares without extrusion. In addition, PI < 35% suggest that excessive shrinkage is not expected. Weight losses, if accompanied by shrinkages, would affect the use of the kaolins in ceramic processing during firing. The platy morphology, particularly in the Cretaceous kaolins, is ideal for imparting better paper quality.
For paper coating, paper filler, ceramics, pharmaceutical and cosmetics industries, the Cretaceous Eruku and Paleogene/Neogene Awo-Omama and Ubulu-Uku kaolins are unsuitable as raw materials due to their chemical compositions. However, the Cretaceous Lakiri kaolins could be suitable in the paper coating and ceramic industries except for their TiO2 and K2O contents. To improve the commercial usage of the kaolins, beneficiation would be required.

Author Contributions

Investigation, O.O.; Writing—original draft, O.O.; Writing—review & editing, G.-I.E. and J.O. All authors have read and agreed to the published version of the manuscript.

Funding

This research was funded by the University of Venda’s Research and Publication Committee, grant number S 677.

Acknowledgments

The authors acknowledge the financial support received from the Research and Publication Committee (RPC), University of Venda. We also appreciate Remy Bucher of the iThemba Labs, Sabine Verryn of XRD Analytical and Consulting, Thivhani Meshack of the Department of Chemistry, UJ, and Mareli Grobbelaar of the CAF, SU.

Conflicts of Interest

The authors declare no conflict of interest.

References

  1. Onyemaobi, O.O. Mineral Resources Exploitation, Processing and Utilization—A Sine Qua Non for Nigeria’s Metallurgical Industrial Development Inaugural Lecture Series 5 of FUTO; FUTO Press: Owerri, Nigeria, 2002; p. 48. [Google Scholar]
  2. Ekosse, G.-I.E. Kaolin deposits and Occurrences in Africa: Geology, Mineralogy and Utilization. Appl. Clay Sci. 2010, 50, 212–236. [Google Scholar] [CrossRef]
  3. Oyebanjo, O.M. Paleo-Environmental Conditions and Tectonic Settings of Cretaceous-Tertiary Kaolins in the Eastern Dahomey and Niger Delta Basins in Nigeria. Ph.D. Thesis, University of Venda, Thohoyandou, South Africa, May 2018. [Google Scholar]
  4. Virta, R.L. Kaolin Industrial Mineral. Rev. Min. Eng. 2004, 56, 28–29. [Google Scholar]
  5. Murray, H.H. Applied Clay Mineralogy. Occurrences, Processing and Application of Kaolins, Bentonites, Palygorskite–Sepiolite, and Common Clays, 1st ed.; Elsevier: Oxford, UK, 2007; p. 189. [Google Scholar]
  6. Awad, M.E.; López-Galindo, A.; Medarević, D.; Đuriš, J.; El-Rahmany, M.M.; Ibrić, S.; Viseras, C. Flow and Tableting Behaviors of Some Egyptian Kaolin Powders as Potential Pharmaceutical Excipients. Minerals 2020, 10, 23. [Google Scholar] [CrossRef] [Green Version]
  7. IndustryArc. Kaolin Market—Industry Analysis, Market Size, Share, Trends, Application Analysis, Growth and Forecast 2019–2025. Available online: https://www.industryarc.com/Research/Kaolin-Market-Research-500193 (accessed on 2 June 2020).
  8. Murray, H.H.; Kogel, J.E. Engineered clay products for the paper industry. Appl. Clay Sci. 2005, 19, 199–206. [Google Scholar] [CrossRef]
  9. Premium Times. Nigeria: The Travails of Nigeria’s Artisanal Kaolin Miners Who Toil Daily to Earn Little. Available online: https://allafrica.com/stories/201908160047.html (accessed on 29 May 2020).
  10. Badmus, B.S.; Olatinsu, O.B. Geophysical evaluation and chemical analysis of kaolin clay deposit of Lakiri village, southwestern Nigeria. Int. J. Phys. Sci. 2009, 4, 592–606. [Google Scholar]
  11. Emofurieta, W.O.; Kayode, A.A.; Coker, S.A. Mineralogy, Geochemistry and Economic Evaluation of the Kaolin Deposits near Ubulu-Uku, Awo-Omama and Buan in Southern Nigeria. J. Min. Geol. 1992, 28, 211–220. [Google Scholar]
  12. Oyebanjo, O.M.; Ekosse, G.E.; Odiyo, J.O. Mineral constituents and kaolinite crystallinity of the <2 µm fraction of Cretaceous-Paleogene/Neogene Kaolins from Eastern Dahomey and Niger Delta Basins, Nigeria. Open Geosci. 2018, 10, 157–166. [Google Scholar]
  13. Nwajide, C.S. Geology of Nigeria’s Sedimentary Basins; CSS Press: Lagos, Nigeria, 2013; p. 565. [Google Scholar]
  14. Omatsola, M.E.; Adegoke, O.S. Tectonic evolution and Cretaceous stratigraphy of Dahomey Basin. J. Min. Geol. 1981, 18, 130–137. [Google Scholar]
  15. Van Reeuwijk, L.P. Procedures for Soil Analysis; Tech. Paper 9; International Soil Reference and Information Centre: Wageningen, The Netherlands, 2002; p. 100. [Google Scholar]
  16. Ruck, L.; Brown, C.T. Quantitative analysis of Munsell color data from archeological ceramics. J. Archaeol. Sci. Rep. 2015, 3, 549–557. [Google Scholar] [CrossRef] [Green Version]
  17. Casagrande, A. Plasticity chart for the classification of cohesive soils. Trans. Am. Soc. Civ. Eng. 1948, 113, 901. [Google Scholar]
  18. Ekosse, G.-I.E. Physico-Chemical Studies of Some Clay Deposits in Anambra State, Nigeria. Ph.D. Thesis, Anambra State University of Science and Technology, Uli, Nigeria, 1990; p. 112. [Google Scholar]
  19. Ekosse, G. Thermoanalytical characterisation, stable isotope and paleoenvironmental considerations of kaolinite from two genetic sources. Fresenius Environ. Bull. 2008, 17, 29–42. [Google Scholar]
  20. Siddiqui, M.A.; Ahmed, Z.; Saleemi, A.A. Evaluation of Swat kaolin deposits of Pakistan for industrial uses. Appl. Clay Sci. 2005, 29, 55–72. [Google Scholar] [CrossRef]
  21. Lopez-Galindo, A.; Viseras, C.; Cerezo, P. Compositional, technical and safety specifications of clays to be used as pharmaceutical and cosmetic products. Appl. Clay Sci. 2007, 36, 51–63. [Google Scholar] [CrossRef]
  22. Semiz, B. Characteristics of clay-rich raw materials for ceramic applications in Denizli region (Western Anatolia). Appl. Clay Sci. 2017, 137, 83–93. [Google Scholar] [CrossRef]
  23. Bloodworth, A.J.; Highley, D.E.; Mitchell, C.J. Industrial Minerals Laboratory Manual—Kaolin; Techical Report British Geological Survey WG/93/1; Natural Environment Research Council: Nottingham, UK, 1993; pp. 1–76. [Google Scholar]
  24. Ekosse, G.; Mulaba-Bafubiandi, A.; Nkoma, J.S. Physico-Chemistry of Continental Bentonites and Kaolin for Ceramic Applications. Afr. J. Sci. Technol. AJST Sci. Eng. Ser. 2007, 8, 107–115. [Google Scholar]
  25. Kuscu, M.; Yildiz, A. The mineralogy, geochemistry, and suitability for ceramic applications of Akharm (Afyonkarahisar, W. Turkey) kaolinitic clay. Arab. J. Geosci. 2016, 9, 510. [Google Scholar] [CrossRef]
  26. Murray, H.H. Clays. In Ullman’s Encyclopedia of Industrial Chemistry, 5th ed.; John Wiley & Sons: New York, NY, USA, 1986; pp. 109–136. [Google Scholar]
  27. El Ouahabi, M.; Daoudi, L.; de Vleeschouwer, F.; Bindler, R.; Fagel, N. Potentiality of Clay Raw Materials from Northern Morocco in Ceramic Industry: Tetouan and Meknes Areas. J. Miner. Mater. Charact. Eng. 2014, 2, 145–159. [Google Scholar] [CrossRef] [Green Version]
  28. McManus, J. Grain size distribution and interpretation. In Techniques in Sedimentology; Tucker, M.E., Ed.; Blackwell Scientific Publications: Oxford, UK, 1988; pp. 63–85. [Google Scholar]
  29. Strazzera, B.; Dondi, M.; Marsigli, M. Composition and ceramic properties of tertiary clays from southern Sardinia (Italy). Appl. Clay Sci. 1997, 12, 247–266. [Google Scholar] [CrossRef]
  30. Daoudi, L.; Elboudour, E.H.; Saadi, L.; Albizane, A.; Bennazha, J.; Waqif, M.; El Ouahabi, M.; Fagel, N. Characteristics and ceramic properties of clayey materials from Amezmiz region (Western High Atlas, Morocco). Appl. Clay Sci. 2014, 102, 139–147. [Google Scholar]
  31. Holtz, R.D.; Kovacs, W.D. An Introduction to Geotechnical Engineering; Prentice-Hall, Inc.: Upper Saddle River, NJ, USA, 1981. [Google Scholar]
  32. Daniel, D.E. Seminar Publication: Design and Construction of RCRA/CERCLA Final Covers; Environmental Protection Agency: Washington, DC, USA, 1991.
  33. Abajo, M. Manual Sobre Fabricación de Baldosas. Tejas y Ladrillos; Beralmar S.A.: Barcelona, Spain, 2000. [Google Scholar]
  34. Vieira, C.M.; Sa’nchez, R.; Monteiro, S.N. Characteristics of clays and properties of building ceramics in the state of Rio de Janeiro, Brazil. Constr. Build. Mater. 2008, 22, 781–787. [Google Scholar] [CrossRef]
  35. Bain, J.A. A plasticity chart as an aid to the identification and assessment of industrial clays. Clay Miner. 1971, 9, 1–17. [Google Scholar] [CrossRef]
  36. Dondi, M.; Fabbri, B.; Guarini, G. Grain-Size Distribution of Italian Raw Materials for Building Clay Products: A Reappraisal of the Winkler Diagram. Clay Miner. 1998, 33, 435–442. [Google Scholar] [CrossRef]
  37. Keller, W.D. Flint clay and flint-clay facies. Clays Clay Miner. 1968, 16, 113–128. [Google Scholar] [CrossRef]
  38. Pruett, R.J.; Alves, P.A. Compositions Comprising Fine Sedimentary Kaolin and Methods for Preparing Same. U.S. Patent 8465583, 18 June 2013. [Google Scholar]
  39. Wilson, M.J. Rock-Forming Minerals, Sheet Silicates–Clay Minerals, 2nd ed.; The Geological Society: London, UK, 2013; Volume 3c, p. 724. [Google Scholar]
  40. Gilkes, R.J.; Prakongkep, N. How the unique properties of soil kaolin affect the fertility of tropical soils. Appl. Clay Sci. 2016, 131, 100–106. [Google Scholar] [CrossRef]
  41. Luz, A.B.; Middea, A. Purification of kaolin by selective flocculation. In Proceedings of the 43rd Annual Conference of Metallurgist of CIM, Hamilton, ON, Canada, 22–25 August 2004; pp. 243–253. [Google Scholar]
  42. Baioumy, H.M. Geochemistry and origin of the Cretaceous sedimentary kaolin deposits, Red Sea, Egypt. Chem. Erde 2014, 74, 195–203. [Google Scholar] [CrossRef]
  43. Schroeder, P.A.; Pruett, R.J.; Melear, N.D. Crystal-chemical changes in an oxidative weathering front in a Georgia kaolin deposit. Clays Clay Miner. 2004, 52, 211–220. [Google Scholar] [CrossRef]
  44. Pruett, R.J. Kaolin deposits and their uses: Northern Brazil and Georgia, USA. Appl. Clay Sci. 2016, 131, 3–13. [Google Scholar] [CrossRef]
  45. Teklay, A.; Yin, C.; Rosendahl, L.; Bøjer, M. Calcination of kaolinite clay particles for cement production: A modeling study. Cem. Concr. Res. 2014, 61–62, 11–19. [Google Scholar] [CrossRef]
  46. Vaculíková, L.; Plevová, E.; Vallová, S.; Koutník, I. Characterization and differentiation of kaolinites from selected Czech deposits using infrared spectroscopy and differential thermal analysis. Acta Geodyn. Geomater. 2011, 8, 59–67. [Google Scholar]
  47. Garcia-Valles, M.; Pi, T.; Alfonso, P.; Canet, C.; Martinez, S.; Jimenez-Franco, A.; Tarrago, M.; Hernández-Cruz, B. Kaolin from Acoculco (Puebla, Mexico) as raw material: Mineralogical and thermal characterization. Clay Miner. 2015, 50, 405–416. [Google Scholar] [CrossRef] [Green Version]
  48. El Ouahabi, M.; Daoudi, L.; Fagel, N. Mineralogical and geotechnical characterization of clays from northern Morocco for their potential use in the ceramic industry. Clay Miner. 2014, 49, 35–51. [Google Scholar] [CrossRef]
  49. Garcia-Valles, M.; Alfonso, P.; Martinez, S.; Roca, N. Mineralogical and Thermal Characterization of Kaolinitic Clays from Terra Alta (Catalonia, Spain). Minerals 2020, 10, 142. [Google Scholar] [CrossRef] [Green Version]
  50. Keller, W.D. Scan electron micrographs of kaolins collected from diverse environments of origin–I. Clays Clay Miner. 1976, 24, 107–113. [Google Scholar] [CrossRef]
  51. Keller, W.D. Classification of kaolins exemplified by their textures in scan electron micrographs. Clays Clay Miner. 1978, 26, 1–20. [Google Scholar] [CrossRef]
  52. Joussein, E.; Petit, S.; Churchman, J.; Theng, B.; Righi, D.; Delvaux, B. Halloysite clay minerals—A review. Clay Miner. 2005, 40, 383–426. [Google Scholar] [CrossRef]
  53. Ekosse, G. Provenance of the Kgwakgwe kaolin deposit, southeastern Botswana and its possible utilization. Appl. Clay Sci. 2001, 20, 137–152. [Google Scholar] [CrossRef]
  54. Gougazeh, M. Removal of iron and titanium contaminants from Jordanian Kaolins by using chemical leaching. J. Taibah Univ. Sci. 2018, 12, 247–254. [Google Scholar] [CrossRef] [Green Version]
Figure 1. Geologic Maps of (a) Eastern Dahomey and (b) Niger Delta Basins showing the study areas (modified after [12,13]).
Minerals 10 00670 g001
Figure 2. Vertical profiles showing sampling depths and lithologic units of the studied kaolin deposits (after [12]).
Minerals 10 00670 g002
Figure 3. Colour distribution of the studied kaolins: (a) Cretaceous and (b) Paleogene/Neogene.
Minerals 10 00670 g003
Figure 4. X-ray diffractograms of the profiles of the studied kaolin deposits with the highest kaolinite contents showing kaolinite (k), quartz (q), muscovite (m), anatase (a), and goethite (g).
Minerals 10 00670 g004
Figure 5. Representative thermogravimetric analysis and differential scanning calorimetry (TGA/DSC) curves of the samples of the studied kaolin deposits with the highest kaolinite contents.
Minerals 10 00670 g005
Figure 6. Scanning electron microscopy (SEM) micrographs of: Eruku (a) and Lakiri (b) kaolins showing platy particles, Awo-Omama (c,d) pseudohexagonal stacks and books with euhedral crystals, and Ubulu-Uku (e,f) kaolins showing pseudohexagonal stacks and books with subhedral crystals.
Minerals 10 00670 g006
Figure 7. Ternary diagram of studied Cretaceous (a) and Paleogene/Neogene (b) kaolins based on their sand, silt, clay fraction percentages (Fields after [28]).
Minerals 10 00670 g007
Figure 8. Position of the studied Cretaceous-Paleogene/Neogene kaolins on the Holtz and Kovacs [31] diagram (a) and clay workability chart (After [17]) (b).
Minerals 10 00670 g008
Table 1. Summary details of the studied kaolin deposits.
S/NBasinFormationAge 1DepositCoordinatesNumber of Samples
1Eastern DahomeyAbeokuta GroupCretaceous (Valanginian–Barremian)Eruku (EP)
Lakiri (LP)
7°10′20″ N
3°15′0″ E
7°5′21″ N
3°27′26″ E
9 samples from 3 profiles at 2 m intervals
6 samples from 2 profiles at 2 m intervals
2Niger DeltaOgwashi-AsabaPaleogene/Neogene
(Oligocene–Miocene)
Awo-Omama (AL)
Ubulu-Uku (UL)
5°39′23″ N
6°56′4″ E
6°24′0″ N
6°25′18″ E
6 samples from 2 profiles at 1 m intervals
7 samples from 2 profiles at 1 m intervals
1—[13,14].
Table 2. Colour, pH, electrical conductivity (EC), and particle size distribution of the studied Cretaceous–Paleogene/Neogene kaolins.
AgeDepositSample IDColourpHEC (μm/cm)Clay (%)Silt (%)Sand (%)
CretaceousErukuEP1 0 mLight pink4.565.00581329
2 mLight pink4.800.7060337
4 mLight grey4.741.209064
EP2 0 mReddish yellow4.738.1060832
2 mPinkish grey4.702.2066529
4 mReddish yellow4.680.7074719
EP3 0 mPinkish grey4.870.6055639
2 mPinkish grey4.270.20631423
4 mLight grey4.503.3078715
LakiriLP1 0 mPinkish white5.212.20681220
2 mPale red4.708.4078418
4 mPinkish grey4.732.9085105
LP2 0 mPale red4.789.10761212
2 mLight grey4.940.5079714
4 mLight grey4.351.108497
Paleogene/NeogeneAwo-OmamaAL1 0 mPale red4.630.3060733
1 mPale red4.8813.1581032
2 mPale red4.684.30551233
AL2 0 mPale red4.690.2056440
1 mPinkish grey4.921.5064531
2 mPale red4.960.4068428
Ubulu-UkuUL1 0 mPale red4.501.1068824
1 mLight brown4.621.3073918
2 mPale red4.274.4064333
UL2 0 mPale red4.840.7068131
1 mPinkish grey5.293.9068824
2 mPale red5.159.70431146
3 mReddish brown4.701.1060832
Table 3. Liquid limit (LL), plastic limit (PL), and plastic index (PI) (%) of the studied Cretaceous–Paleogene/Neogene kaolins.
AgeDepositSample IDLLPLPI
CretaceousErukuEP1482919
EP2513813
EP3493217
LakiriLP1331815
LP2482820
Paleogene/NeogeneAwo-OmamaAL1433211
AL2563422
Ubulu-UkuUL1231310
UL2453411
Table 4. Mineral composition, thermal peak temperatures, and total weight losses for the studied Cretaceous–Paleogene/Neogene kaolins.
AgeXRD (wt%)DTA
KaoQtzAnaHemMusGoeDht (°C)MFt (°C)TWL (%)
CretaceousAverage83211-51511981.913.6
(n = 15)Max99572-9151798514.4
Min4911tr1148898013.1
Paleogene/NeogeneAverage62371--1505964.312.2
(n = 13)Max93741--151497013.8
Min2561--150095110.7
Kao—kaolinite; Qtz—quartz; Ana—anatase; Hem—hematite; Mus—muscovite; Goe—goethite; Dhy—dehydroxylation temperature; MFt—mullite formation temperature; TWL—total weight loss; tr—trace; (-)—not detected.
Table 5. Major oxide compositions (wt%) of the studied Cretaceous–Paleogene/Neogene kaolins compared with the world sedimentary kaolin deposits.
DepositAl2O3CaOFe2O3K2OMgONa2OSiO2TiO2LOISiO2/Al2O3
ErukuMin11.440.011.480.270.040.0247.221.074.031.29
(n = 9)Max36.640.035.040.650.050.0580.302.8412.897.02
Average28.250.022.560.410.040.0256.822.1010.002.33
LakiriMin21.400.010.590.06bdl0.0144.631.147.421.13
(n = 6)Max39.500.022.700.56bdl0.0469.602.0013.923.25
Average35.550.021.090.20bdl0.0249.641.6012.571.53
Awo-OmamaMin7.160.020.850.080.040.0250.110.832.831.56
(n = 6)Max32.090.044.240.270.060.0287.991.9911.9712.29
Average18.020.032.420.160.040.0271.041.356.875.69
Ubulu-UkuMin17.800.014.630.330.010.0154.631.676.812.08
(n = 7)Max26.830.028.300.600.170.0367.632.3810.023.80
Average22.650.026.340.460.060.0259.952.038.712.76
SCGK 1Average38.380.050.300.040.250.2745.301.4413.971.18
HPNGK 1Average39.500.031.130.060.030.0844.002.4313.901.11
SLCEPNCK 1Average38.030.010.590.020.010.0346.560.7813.801.22
Paper Coating 2Min36-0.50.5--450.5--
Max38-1.001.50--49.001.30--
Paper Filler 2Min37-0.50.5--460.5--
Max38-1.001.50--48.001.50--
Ceramics 2Min36-0.61.2--450.0211.2-
Max38-1.002.70--50.000.1012.50-
Pharm. &Min38.10.10.100.1044.6013.8-
Cosmetics 2Max39.50.20.200.200.20.146.401.4013.90-
SCGK—Soft Cretaceous Georgia Kaolins; HPNGK—Hard Paleogene/Neogene Georgia Kaolins; Soft Late Cretaceous/Paleogene/Neogene Capim River Kaolins; bdl—below detection limit; LOI—loss on ignition; 1—[5]; 2—[20,21].

