Article

The Evolution of Pollutant Concentrations in a River Severely Affected by Acid Mine Drainage: Río Tinto (SW Spain)

by
Manuel Olías
*,
Carlos R. Cánovas
,
Francisco Macías
,
María Dolores Basallote
and
José Miguel Nieto
Department of Earth Sciences/Research Center on Natural Resources, Health and the Environment (RENSMA), Faculty of Experimental Sciences, University of Huelva, Campus ‘El Carmen’ s/n, 21071 Huelva, Spain
*
Author to whom correspondence should be addressed.
Minerals 2020, 10(7), 598; https://doi.org/10.3390/min10070598
Submission received: 13 May 2020 / Revised: 23 June 2020 / Accepted: 29 June 2020 / Published: 30 June 2020
(This article belongs to the Special Issue Pollutants in Acid Mine Drainage)

Abstract

:
The Río Tinto, located in the Iberian Pyrite Belt (SW Spain), constitutes an extreme case of pollution by acid mine drainage. Mining in the area dates back to the Copper Age, although large-scale mining of massive sulfide deposits did not start until the second half of the 19th century. Due to acidic mining discharges, the Río Tinto usually maintains a pH close to 2.5 and high concentrations of pollutants along its course. From a detailed sampling during the hydrological year 2017/18, it was observed that most pollutants followed a similar seasonal pattern, with maximum concentrations during autumn due to the washout of secondary soluble sulfate salts and minimum values during large flood events. Nevertheless, As and Pb showed different behavior, with delayed concentration peaks. The dissolved pollutant load throughout the monitored year reached 5000 tons of Fe, 2600 tons of Al, 680 tons of Zn, and so on. While most elements were transported almost exclusively in the dissolved phase, Fe, Pb, Cr, and, above all, As showed high values associated with particulate matter. River water quality data from 1969 to 2019 showed a sharp worsening in 2000, immediately after the mine closure. From 2001 on, an improvement was observed.

Graphical Abstract

1. Introduction

The Río Tinto is a relatively small river (101 km long) known worldwide for its extreme conditions (in Spanish “Tinto” means dark red). From its source to its mouth at the Ria of Huelva estuary (Figure 1), its waters usually maintain a pH value of around 2.5 and very high concentrations of Fe and other toxic elements. No plants, fish, or other higher aquatic organisms can survive in these conditions, with the exception of some invertebrates [1]. Nevertheless, the river water is rich in extremophile organisms (bacteria, algae, fungi, and protists), with a remarkably high eukaryotic diversity [1,2,3,4].
Mining wastes containing sulfide minerals can generate acid mine drainage (AMD) [5,6]. Under natural conditions, most sulfides remain underground within an anoxic environment, where they are stable and highly insoluble. The mining activities cause a sharp increase in the oxidation of sulfides due to their contact with oxygen and water, releasing acidity and large amounts of sulfates and toxic metals (e.g., Fe, Cu, Zn, Cd, Pb) into the aquatic medium. The oxidation of sulfide minerals is accelerated by microbial catalysis of the oxidation of aqueous ferrous iron and sulfide [7,8]. This process leads to the generation of significant discharges of acid leachates with very high concentrations of toxic elements [9]. The generation of AMD depends on the types and quantities of sulfide and carbonate minerals present, as well as the dissolution rates of these minerals [10]. Pollution of water resources by AMD is a major worldwide environmental problem associated with the mining of sulfide and coal deposits, affecting many sites [11,12].
The Río Tinto’s headwaters are located in the Iberian Pyrite Belt (IPB), a metallogenic region that runs from the Seville and Huelva provinces (SW Spain) to the Portuguese coast and has one of the largest concentrations of giant and supergiant polymetallic massive sulfide deposits on Earth [13]. Metal exploitation in the IPB, including the Río Tinto mines, began in the third millennium BC (the Copper Age). Mining consisted of extracting copper from carbonates, oxides, and some sulfides (chalcocite and covellite) located close to the land surface [14]. During the Roman period, mining increased. After a long time of little activity, large-scale mining began in the second half of the 19th century and continued until 2000, when exploitation ceased due to falling mineral prices [15]. In 2015 the Río Tinto mine reopened, beginning a new period of activity. Currently, the headwaters of the Río Tinto are considered a protected zone, becoming a tourist attraction due to the special characteristics and colors of its waters, the rich industrial heritage, and the spectacular landscape left by the mining.
The Odiel River (Figure 1) is also deeply affected by AMD, although the pollutant concentrations are lower than those of the Río Tinto [16,17]. The high concentrations of pollutants transported by both rivers have a severe environmental impact on the estuary, where most of the pollutants precipitate when the acid waters are neutralized by mixing with alkaline seawater. High concentrations of metal(loid)s such as As, Cd, and Pb have been measured in the estuarine waters, sediments, and biota [18,19,20,21]. Nevertheless, some of the most conservative metals under circumneutral pH conditions, such as Zn, Cd, and Mn, reach the Atlantic Ocean or even the Mediterranean Sea [22,23].
Although there are numerous cases worldwide of streams contaminated by AMD, to our knowledge there are no other rivers that maintain such extreme conditions as the Río Tinto along its almost 100 km. Another similar case of an extremely affected stream could be the King River (Tasmania, Australia), which receives acidic mine discharges (around 2 tons/day of Cu) from Mount Lyell [24,25]. Nevertheless, the length affected by AMD and dissolved concentrations are lower than those of Río Tinto. In this context, the main goal of this work is to study the seasonal variations of the pollutant concentrations and loads to investigate the main processes controlling toxic element behavior in rivers with extreme acidic conditions.

2. Site Description

The Río Tinto watershed runs mainly over the IPB (Figure 1), except at its lower course, where more recent Neogene materials outcrop. The IPB consists of three main geological units: the Phyllite‒Quartzite Group (PQ), the Volcano‒Sedimentary Complex (VSC), and the Culm Group (CG). The PQ group consists of a thick sequence of phyllites and sandstones of upper Devonian age [13,26]. The materials of the VSC (upper Devonian‒lower Carboniferous age) are composed of a volcanic sequence with alternating episodes of felsic (dacites and, in a lower proportion, rhyolites) and mafic rocks (basalts) intercalated in a sedimentary sequence (mainly phyllites). The VSC hosts numerous sulfide deposits, mainly composed of pyrite (FeS2) with sphalerite (ZnS), galena (PbS), chalcopyrite (CuFeS2), arsenopyrite (FeAsS), and other sulfides in much lower proportions. Finally, the CG is a detrital unit of synorogenic turbidites of shales and conglomerates of Carboniferous age. There are no carbonate rocks in the IPB, so the acidity generated by AMD processes is not neutralized; this, together with the intensive mining developed, causes the extreme pollution of most streams in the area.
The climate is of Mediterranean type, with cold winters and warm summers. The annual mean temperature is close to 17 °C and rainfall ranges from 800 mm at the north of the basin to 550 mm at the south. The rainiest period of the year is commonly from November to January, while during the summer rainfall is practically nonexistent. Nevertheless, rainfall exhibits a high inter- and intra-annual variability, with long droughts and intense wet periods. The Río Tinto’s main tributaries are the Jarrama and Corumbel Rivers (Figure 1), both regulated by reservoirs. According to the water authorities, the mean river discharge is 7.2 m3/s, although, due to the absence of permeable rocks in the watershed, the river flow presents high variability, depending on the rainfall regime [16].
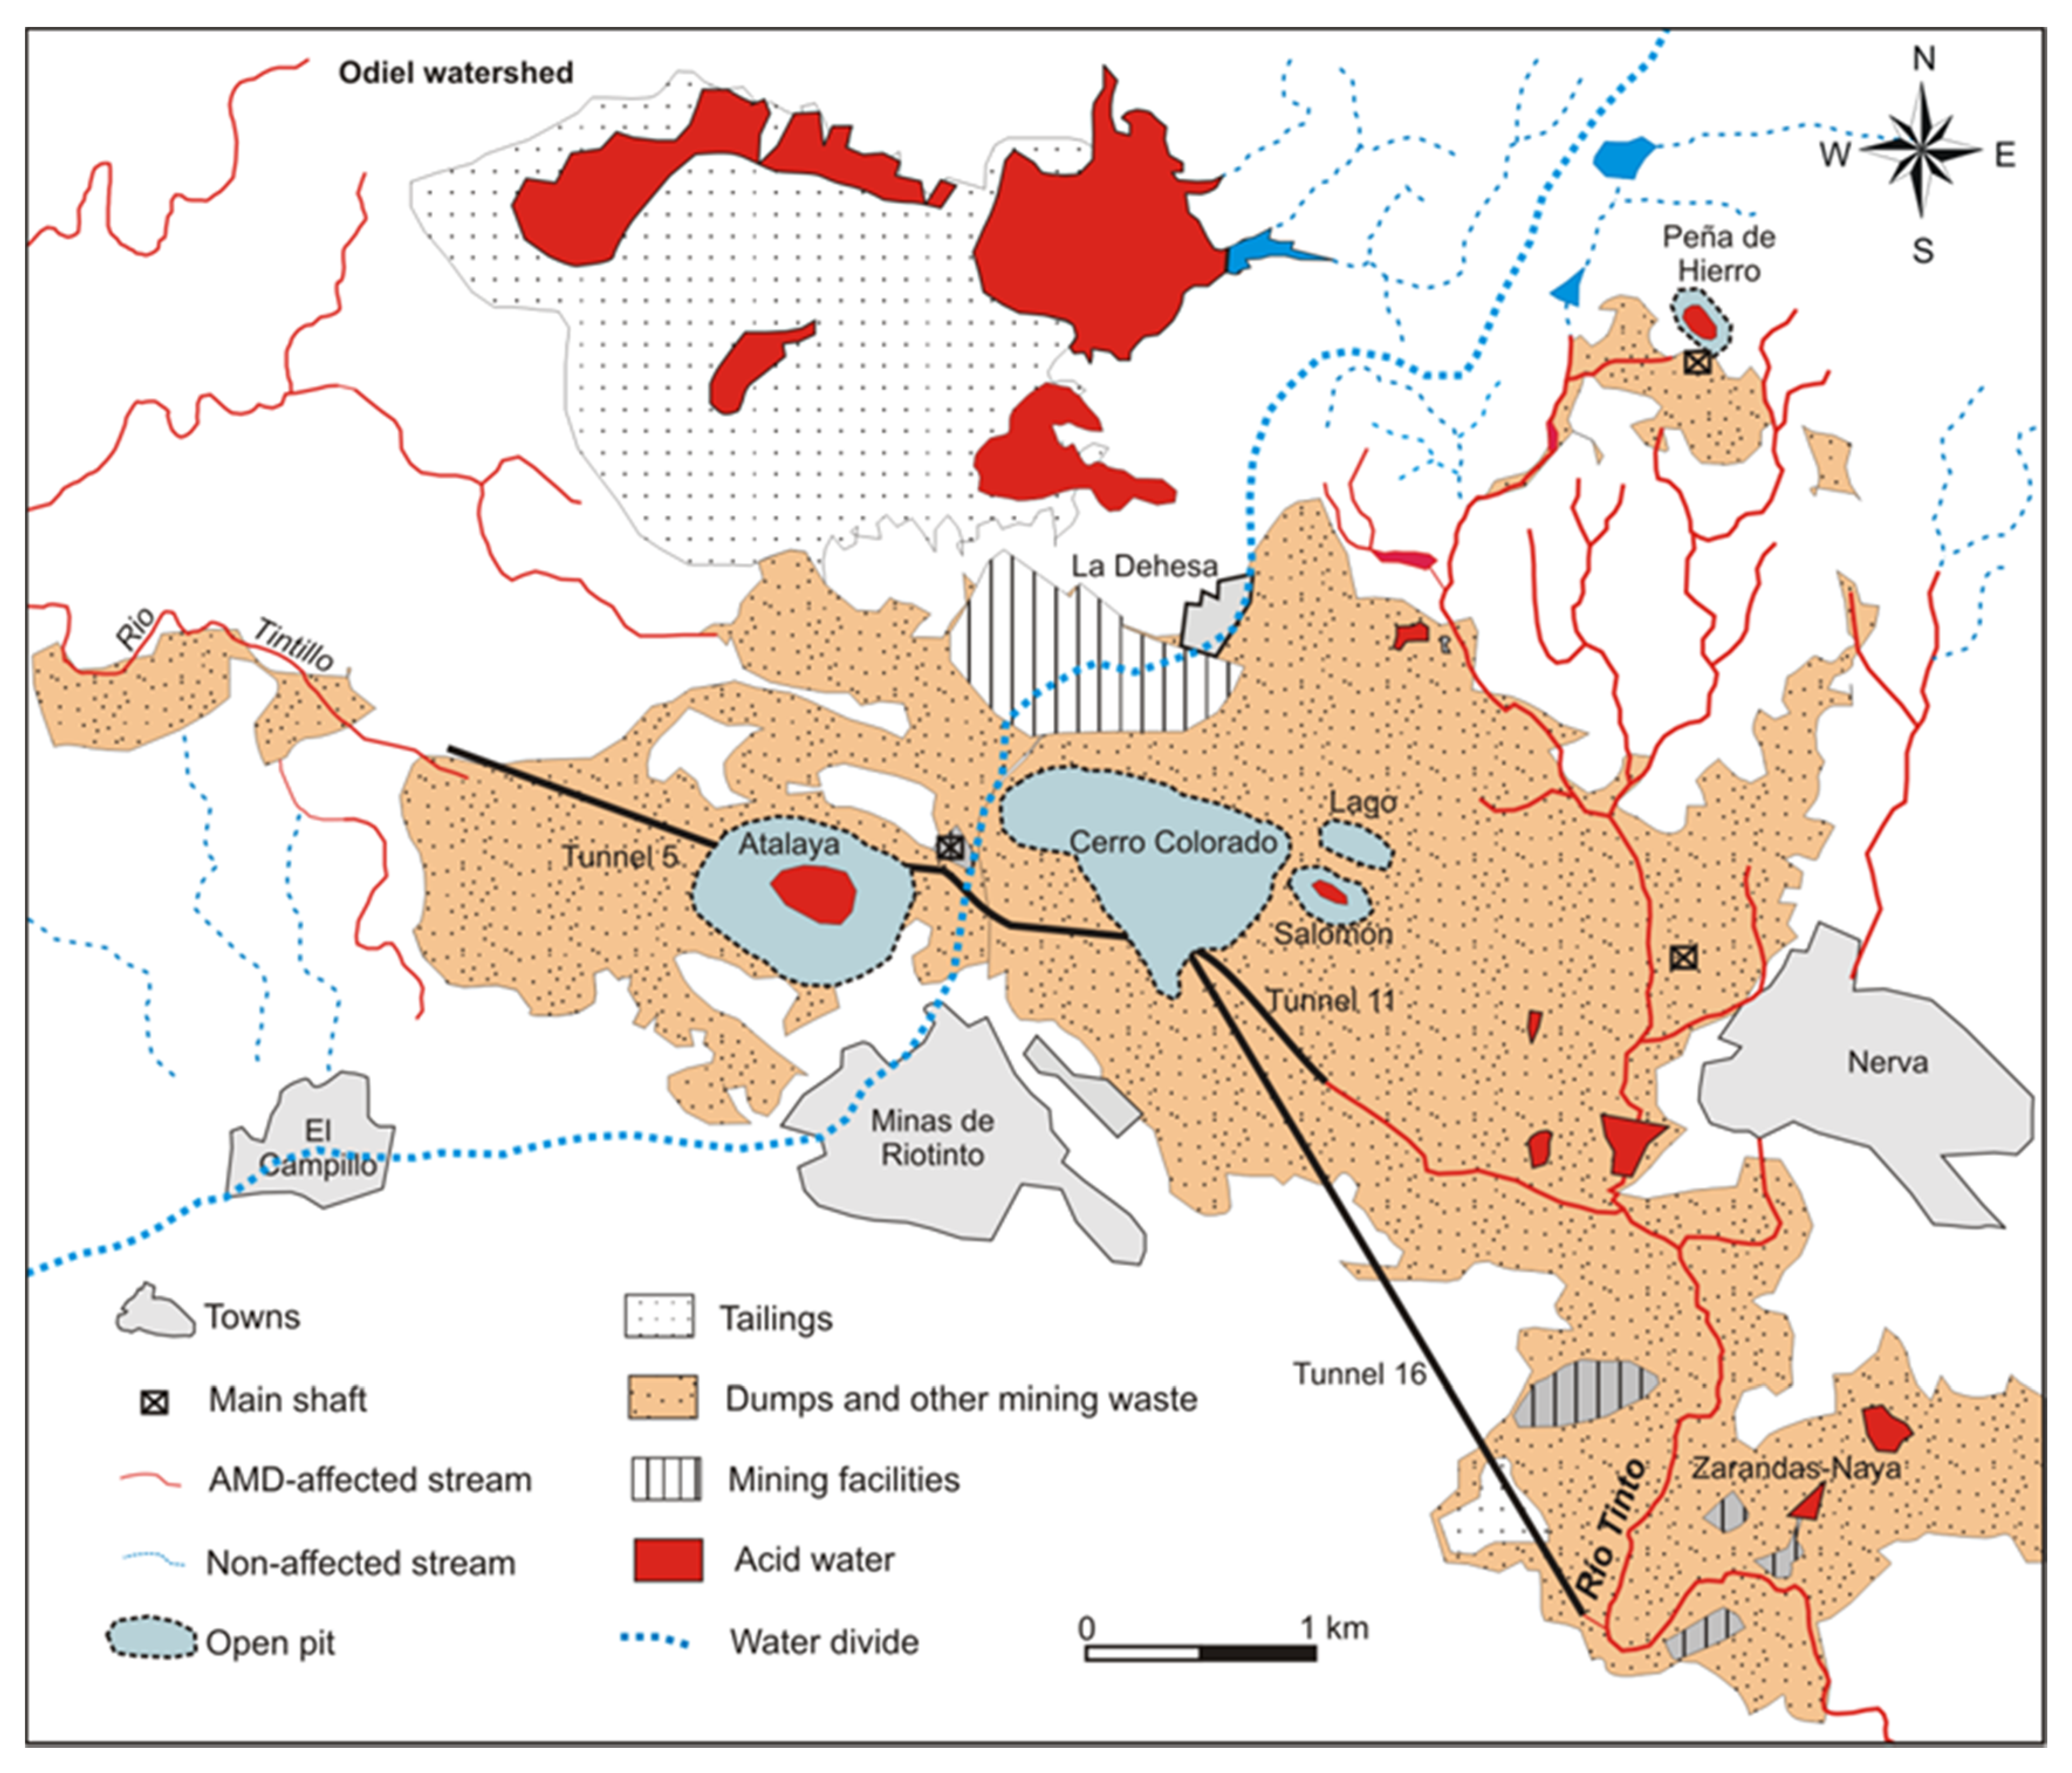
Nowadays, the Río Tinto’s source is considered to be located at the foot of a sulfide dump of Peña de Hierro mine, northeast of the Río Tinto mines (Figure 2). Nevertheless, the main acidic discharges come from the much larger Rio Tinto mine, which has a surface area of 21 km2 covered by waste dumps, tailings, flooded open pits, slags, and other mining facilities (Figure 2). In addition, there is a dense and complex network of underground mine galleries. There is geological, archaeological, and historical evidence indicating that, although natural sulfide oxidation in the zone dates back 24 million years [27], the current river conditions are mainly due to large-scale mining since the second half of 19th century, while natural processes of acid rock drainage can be considered negligible [15]. Despite all this evidence, there are some works claiming that the Río Tinto’s conditions are mainly caused by natural processes [28].
Río Tinto mines also constitute the main source of pollution in the Odiel River watershed [29,30], through several streams running to the west (Figure 2). The current exploitation is focused on the Cerro Colorado open pit (Figure 2). According to the environmental requirements for the reopening, the mining company is obligated to progressively reduce the acidic discharges to the Odiel River, where a water reservoir is being constructed [31]. Thus, a reduction of 30% must be achieved before the third year from the start of exploitation, 50% before the sixth year, and 100% before the tenth year. However, there is a large surface covered by mining wastes producing acidic leachates at the Zarandas‒Naya zone (Figure 2), which is outside the current exploitation area, and therefore, no remediation measures are considered.
In the Río Tinto, downstream of the mining area, a decrease in most dissolved element concentrations is observed, mainly by dilution with clean waters from tributaries [32]. Moreover, the Fe concentration diminishes in greater proportion because of the precipitation of Fe oxyhydroxy sulfates along the river, mainly schwertmannite and jarosite [32,33]. Other types of abundant secondary minerals precipitating on the riverbanks and the mining area are soluble efflorescent salts formed by water evaporation [34], being especially abundant at the end of the summer.

3. Methods

3.1. Data Acquisition

In order to study the seasonal variation in pollutant concentrations and loads of the Río Tinto, high-resolution sampling was carried out during one hydrological year (from September 2017 to August 2018) at the streamgage station, located 8.9 km upstream at Niebla (Figure 1). This location was determined by the availability of streamflow data and the possibility of having a place to protect the sampling equipment. An autosampler (Teledyne ISCO) was programmed with a frequency ranging from 2 to 24 h, depending on the weather forecast. Only those samples reflecting variations in electrical conductivity (EC) were selected for analysis (n = 143). The distribution of collected samples within the study period is highly variable, mainly linked to rainfall-induced hydrochemical variations (from 65 samples collected in March 2018 to only two samples in the summer). The autosampler was equipped with a 24-bottle container. Cross-contamination between pumping cycles was avoided by scheduled purge sequences. Bottles were previously washed in 10% (v/v) HNO3 and Milli-Q water before sampling. Manual samples coinciding with the visits for the collection of the automatic samples were taken. Physicochemical parameters such as pH, EC, oxidation‒reduction potential (ORP), and temperature were measured in each sample using a previously calibrated Crison MM40+ multimeter (HACH LANGE GmbH, Düsseldorf, Germany). ORP readings in the field were converted to redox potential values with reference to the standard hydrogen electrode (Eh), according to Nordstrom and Wilde [35]. Selected samples (according to changes in EC) were filtered through 0.45-µm Millipore Teflon filters and subsequently acidified with suprapure HNO3 Merk to pH < 1 and stored in the dark at 4 °C until analysis. Unfiltered aliquots (n = 53) were taken from selected samples and acidified to study metal particulate transport by the river. Thus, the difference between the concentrations in the filtered and unfiltered samples is considered to be associated with the particulate matter.
Rainfall data belonging to the weather station network of the Andalusian Government were obtained from two stations located north and south of the Río Tinto basin (Figure 1). Flow data were obtained every 15 min from a streamgage station (Figure 1). Historical data from the Water Authority for the Río Tinto at Niebla (Figure 1) were collected in 1969‒2019 for pH and electrical conductivity (EC) and from 1980 (when concentration data were available on a regular basis) to 2019 for As, Cd, Cu, Fe, Mn, Pb, SO4, and Zn (n = 669; an average of 17 samples per year).

3.2. Analysis

Samples were analyzed at the R&D laboratories at the University of Huelva (Huelva, Spain) by Inductively Coupled Plasma-Atomic Emission Spectroscopy (ICP-AES) for major elements, and by Inductively Coupled Plasma-Mass Spectroscopy (ICP-MS) for trace elements. Detection limits were 200 µg/L for Al, Ca, Fe, K, Mn, Mg, Na, and S; 50 µg/L for Zn; 5 µg/L for Cu; 1 µg/L for Ba and Sr; and 0.1 µg/L for As, Cd, Co, Cr, Ni, and Pb. The accuracy of the analyses was checked with NIST-1640 certified reference materials. Homemade standards from certified materials were also used during each analysis sequence to check the accuracy. The analytical precision was assessed by performing analyses in triplicate, being better than 5% in each case. The average balance error obtained by the PHREEQC code was 2.4% (interquartile range between −0.4% and 4.8%).

3.3. Pollutant Load

The calculation of river loads introduces inevitable uncertainties: whereas continuous records of streamflow are commonly available from flow gauging stations, concentration data frequently only represent individual samples [36]. Several procedures have been employed to reliably estimate loads based on limited concentration data [16,37]. Owing to the existence of high number of collected samples coinciding with dissolved concentration variations, the pollutant loads delivered by the Río Tinto were calculated, interpolating concentrations between two consecutives samples according to the following equation:
C i = C n C n 1 t n t n 1 ( t i t n 1 ) + C n 1
where Ci is the concentration at time i, Cn−1 and Cn are the concentrations of the available samples before and after time i and tn and tn−1 are the dates of samples Cn and Cn−1.
Thus, the concentrations were obtained every 15 min and multiplied by the corresponding river flow for obtaining the pollutant load. These 15-min data were added for each month to obtain the monthly loads.

3.4. Saturation Indices and Multivariate Analysis

Saturation indices (SI) of water were obtained using the PHREEQC code v3.4 (US Geological Survey, Denver, CO, USA) [38]. Thermodynamic constants were taken from the geochemical MINTEQA2 database (USEPA Environmental Research Laboratory, Athens, GA, USA) [39]. The equilibrium constants (Ke) of schwertmannite were obtained from [40,41]. On the other hand, a principal component analysis (PCA) was performed on the data to evaluate the statistical relationships between multivariate datasets [42,43]. Previously, a normality test was performed on samples, which evidenced the non-normality of all variables. Then, Spearman’s correlation coefficient was used to determine the significant relationships between data.

4. Results and Discussion

4.1. Evolution during the Hydrological Year 2017/18

The annual rainfall in the study period was close to the mean value of the area (517 and 814 mm in the south and north rain gauges, respectively). Nevertheless, the rainfall distribution through the year was irregular (Figure S1). The autumn and winter were anomalously dry (mean of 175 mm between September 1 and February 27), while an intense rainy period was recorded between February 28 and March 20 (mean of 333 mm). The wet period continued in April (100 mm).
River flow was below 0.025 m3/s in September 2017 (Figure S1). Scarce rainfall recorded from October to February provoked some discharge peaks, with a maximum close to 6 m3/s. On February 27, the river flow was only 0.13 m3/s, but intense rains recorded afterwards provoked a sharp flow increase, reaching a value of 51.5 m3/s on March 1. Discharges were very high until March 22 and at the beginning of April. After that, the streamflow decreased progressively down to 0.001 m3/s at the end of August. In addition, frequent and sharp daily increases due to water releases from the Jarrama and Corumbel reservoirs were observed during the spring (Figure S1).
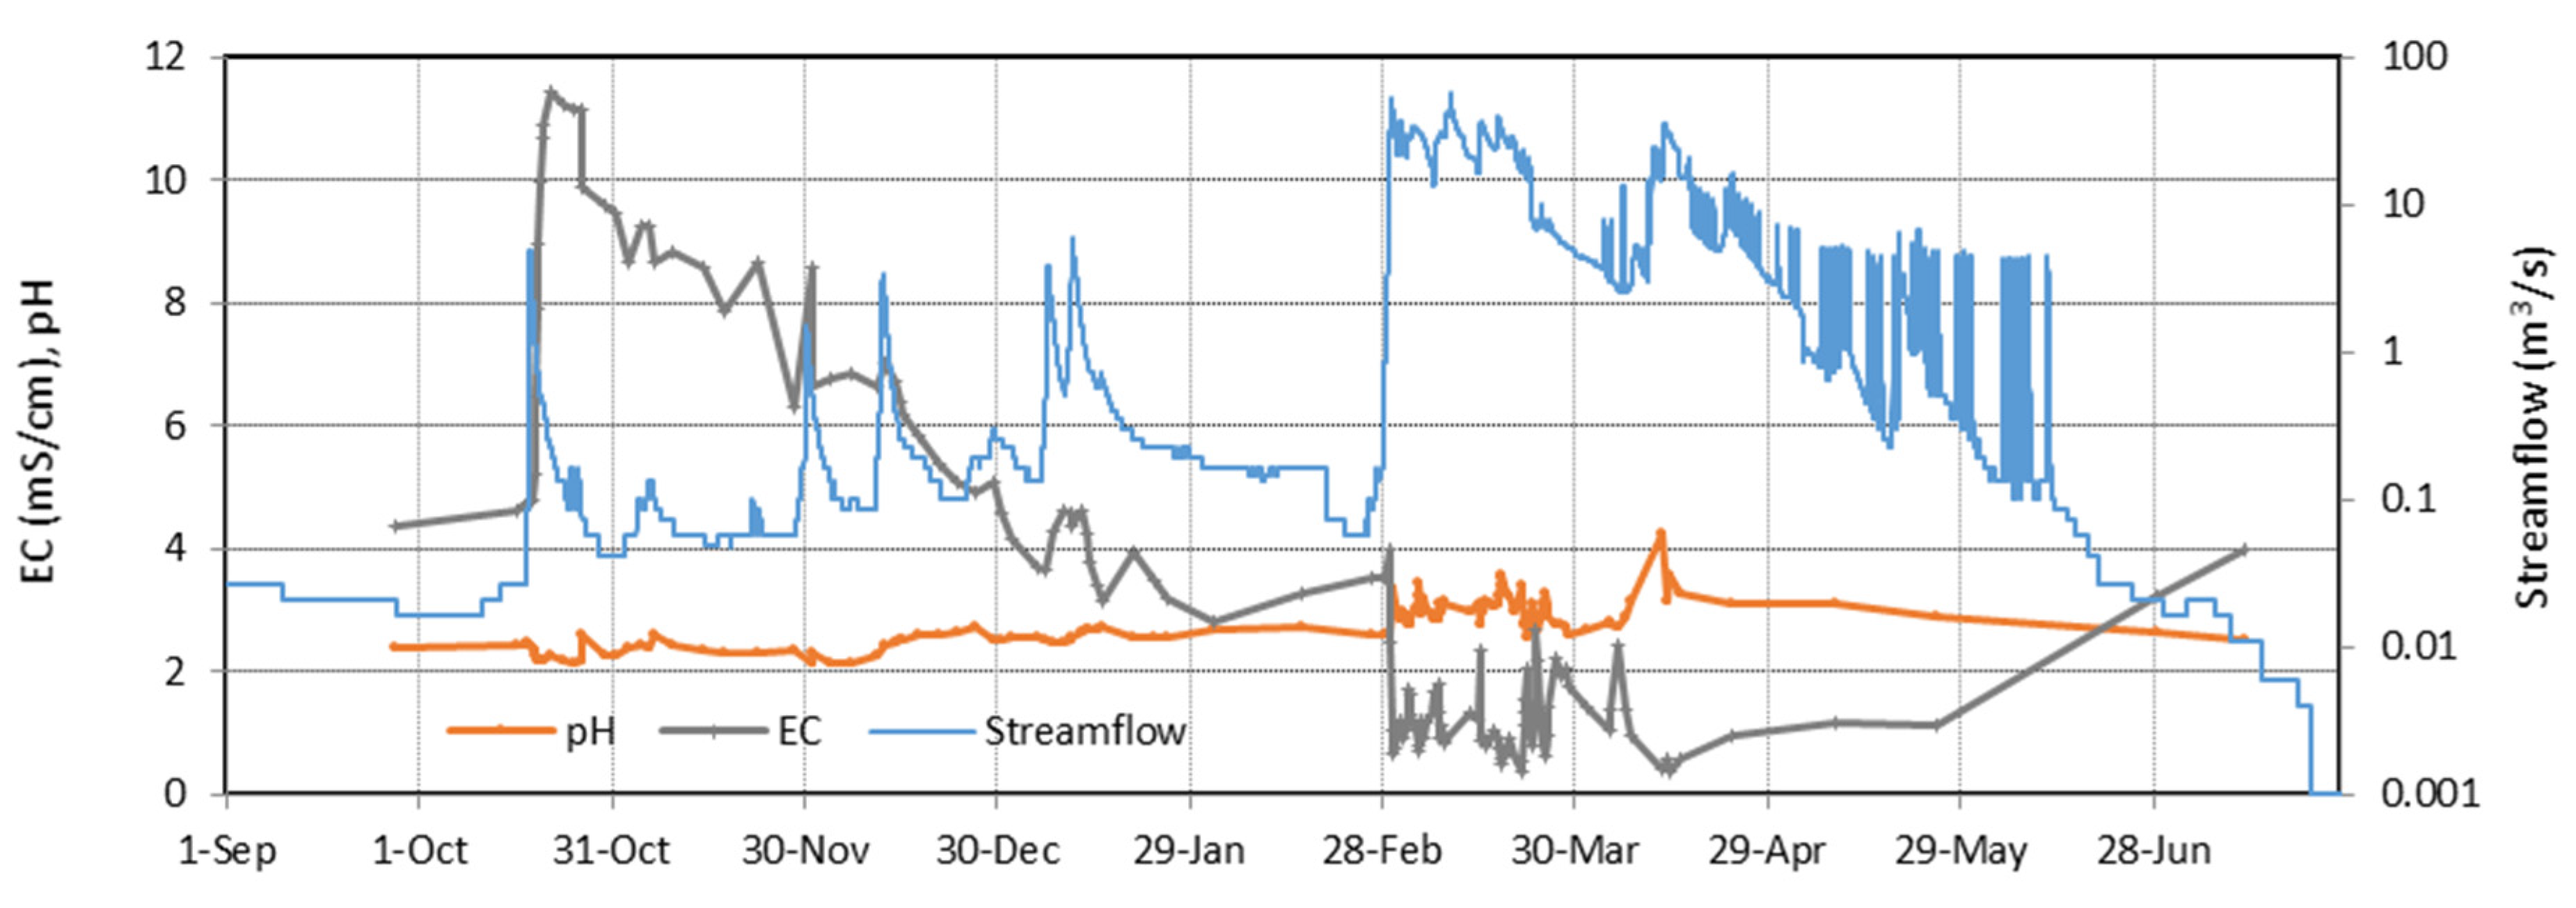
Values of pH during the autumn and winter were close to 2.5 and increased up to around 3 with the floods in March, although with some fluctuations (Table 1 and Figure 3). Nevertheless, the highest values were reached in April, with a maximum pH of 4.22. Electrical conductivity values underwent a fast and progressive increase with the first October rainfalls, from 4.7 to 11.4 mS/cm just four days after the beginning of rainfalls, due to the dissolution of efflorescent salts precipitated during the summer. These values were higher than those previously observed during the autumn in the Río Tinto, ranging between 8 and 9 mS/cm, with pH values between 2.3 and 3.6 [34,44]. Throughout autumn and winter, there was a progressive decrease in EC to approximately 3.5 mS/cm in February, with some increases also linked to the dissolution of remaining evaporitic salts by rains. With the intense rains of March and April, EC values notably diminished to a minimum of 0.38 mS/cm, although with sharp variations in the response to changes in streamflow. From April onwards, a progressive increase in EC values up to a value of around 4 mS/cm in the summer was observed (Figure 3).
The basic statistics of dissolved concentrations can be seen in Table 1. The most abundant metal was Fe (median value of 145 mg/L), followed by Mg (67 mg/L), Al (65 mg/L), and lower concentrations of Ca, Na, Zn, Cu, and Mn. Among trace elements, the high dissolved concentrations of As, Cd, Co, Ni, and Pb stand out (maximum values of 3.31, 0.74, 5.33, 1.06, and 1.07 mg/L, respectively). Mean concentrations were much higher than the median ones (Table 1), showing that dissolved elements did not exhibit a normal distribution (especially As, with a mean value 11 times higher than the median), as indicated by Shapiro‒Wilk and Kolmogorov‒Smirnov tests.
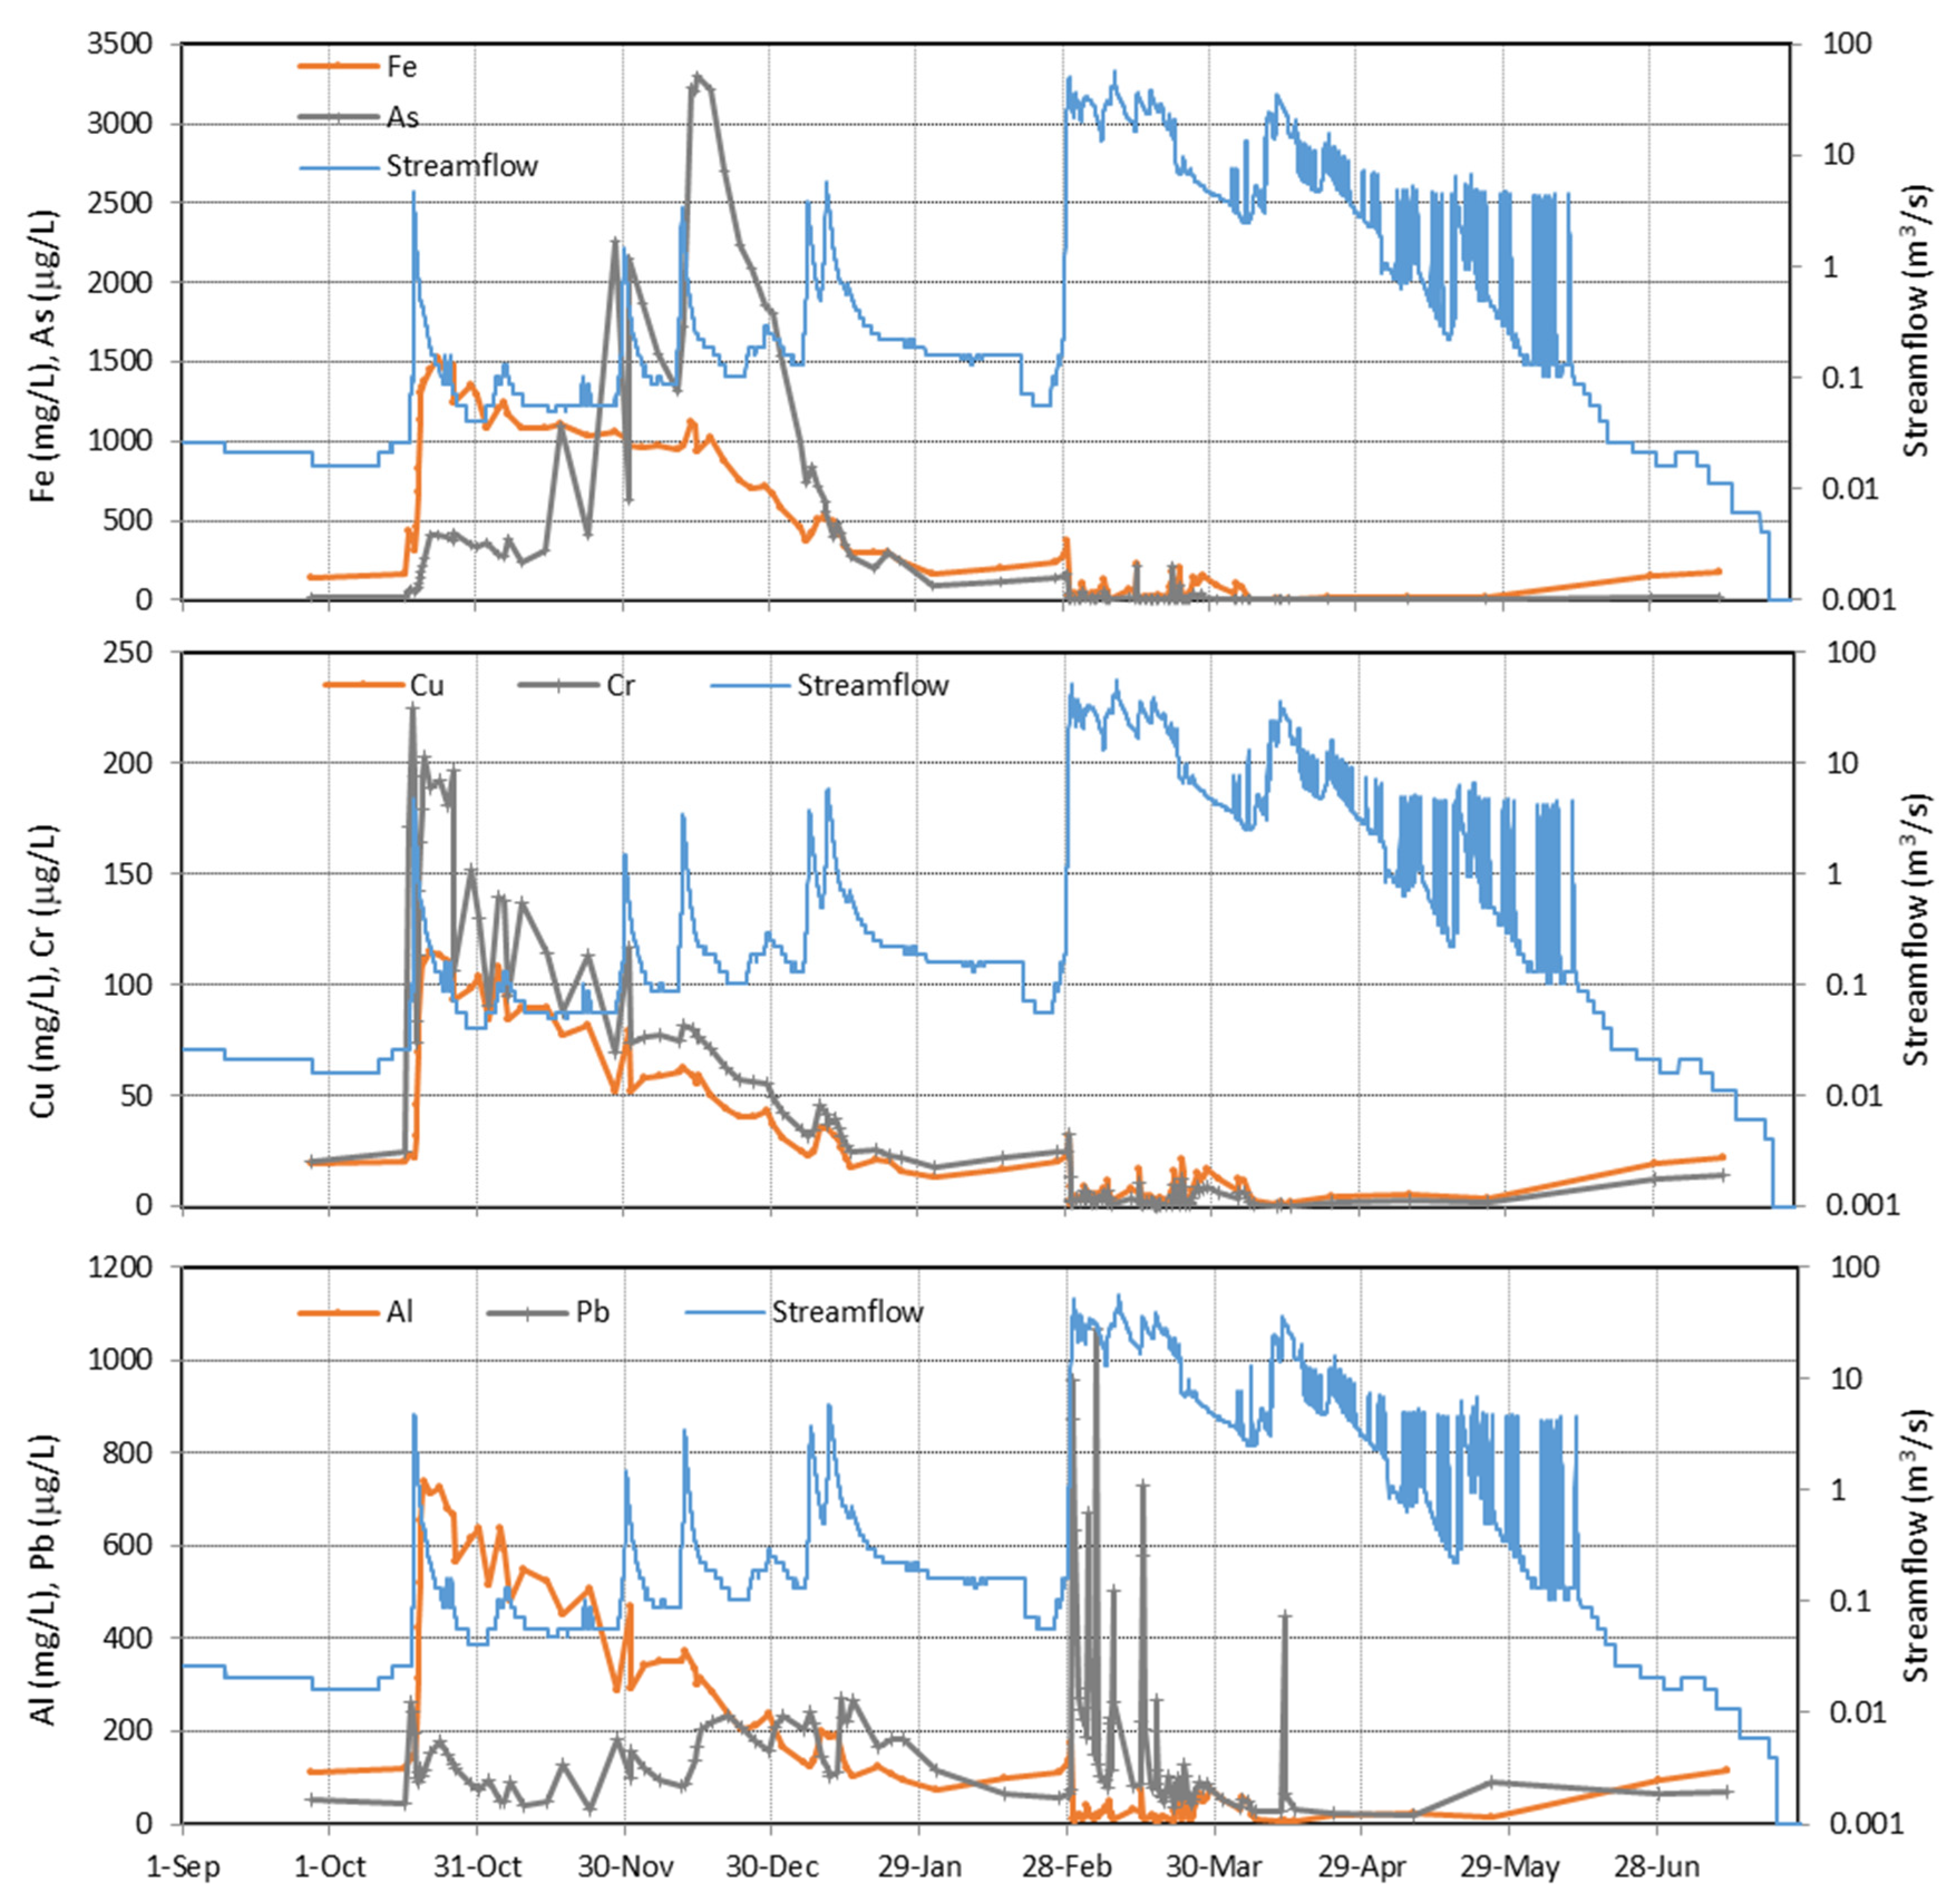
The first rainfalls in October caused a notable increase in the dissolved concentrations because of the redissolution of the riverbank secondary soluble sulfate salts, reaching their maximum values except for Ba, Na, and Sr (Figure 4 and Figure S2). The increase was especially significant for sulfate (from 2.4 to 12.2 g/L), Fe (from 162 to 1529 mg/L), and As (from 21.6 to 411 µg/L). These secondary minerals are mainly sulfates (such as melanterite, copiapite, and coquimbite), precipitated during dry periods, and play an important role in metal fluxed from areas affected by AMD processes, since they can be either a sink or a source for acidity and toxic metals [34,45,46]. After this peak, the EC and concentrations of most elements progressively decreased, but with some small increases due to several moderate rainy events recorded in the autumn and winter (Figure 4 and Figure S2).
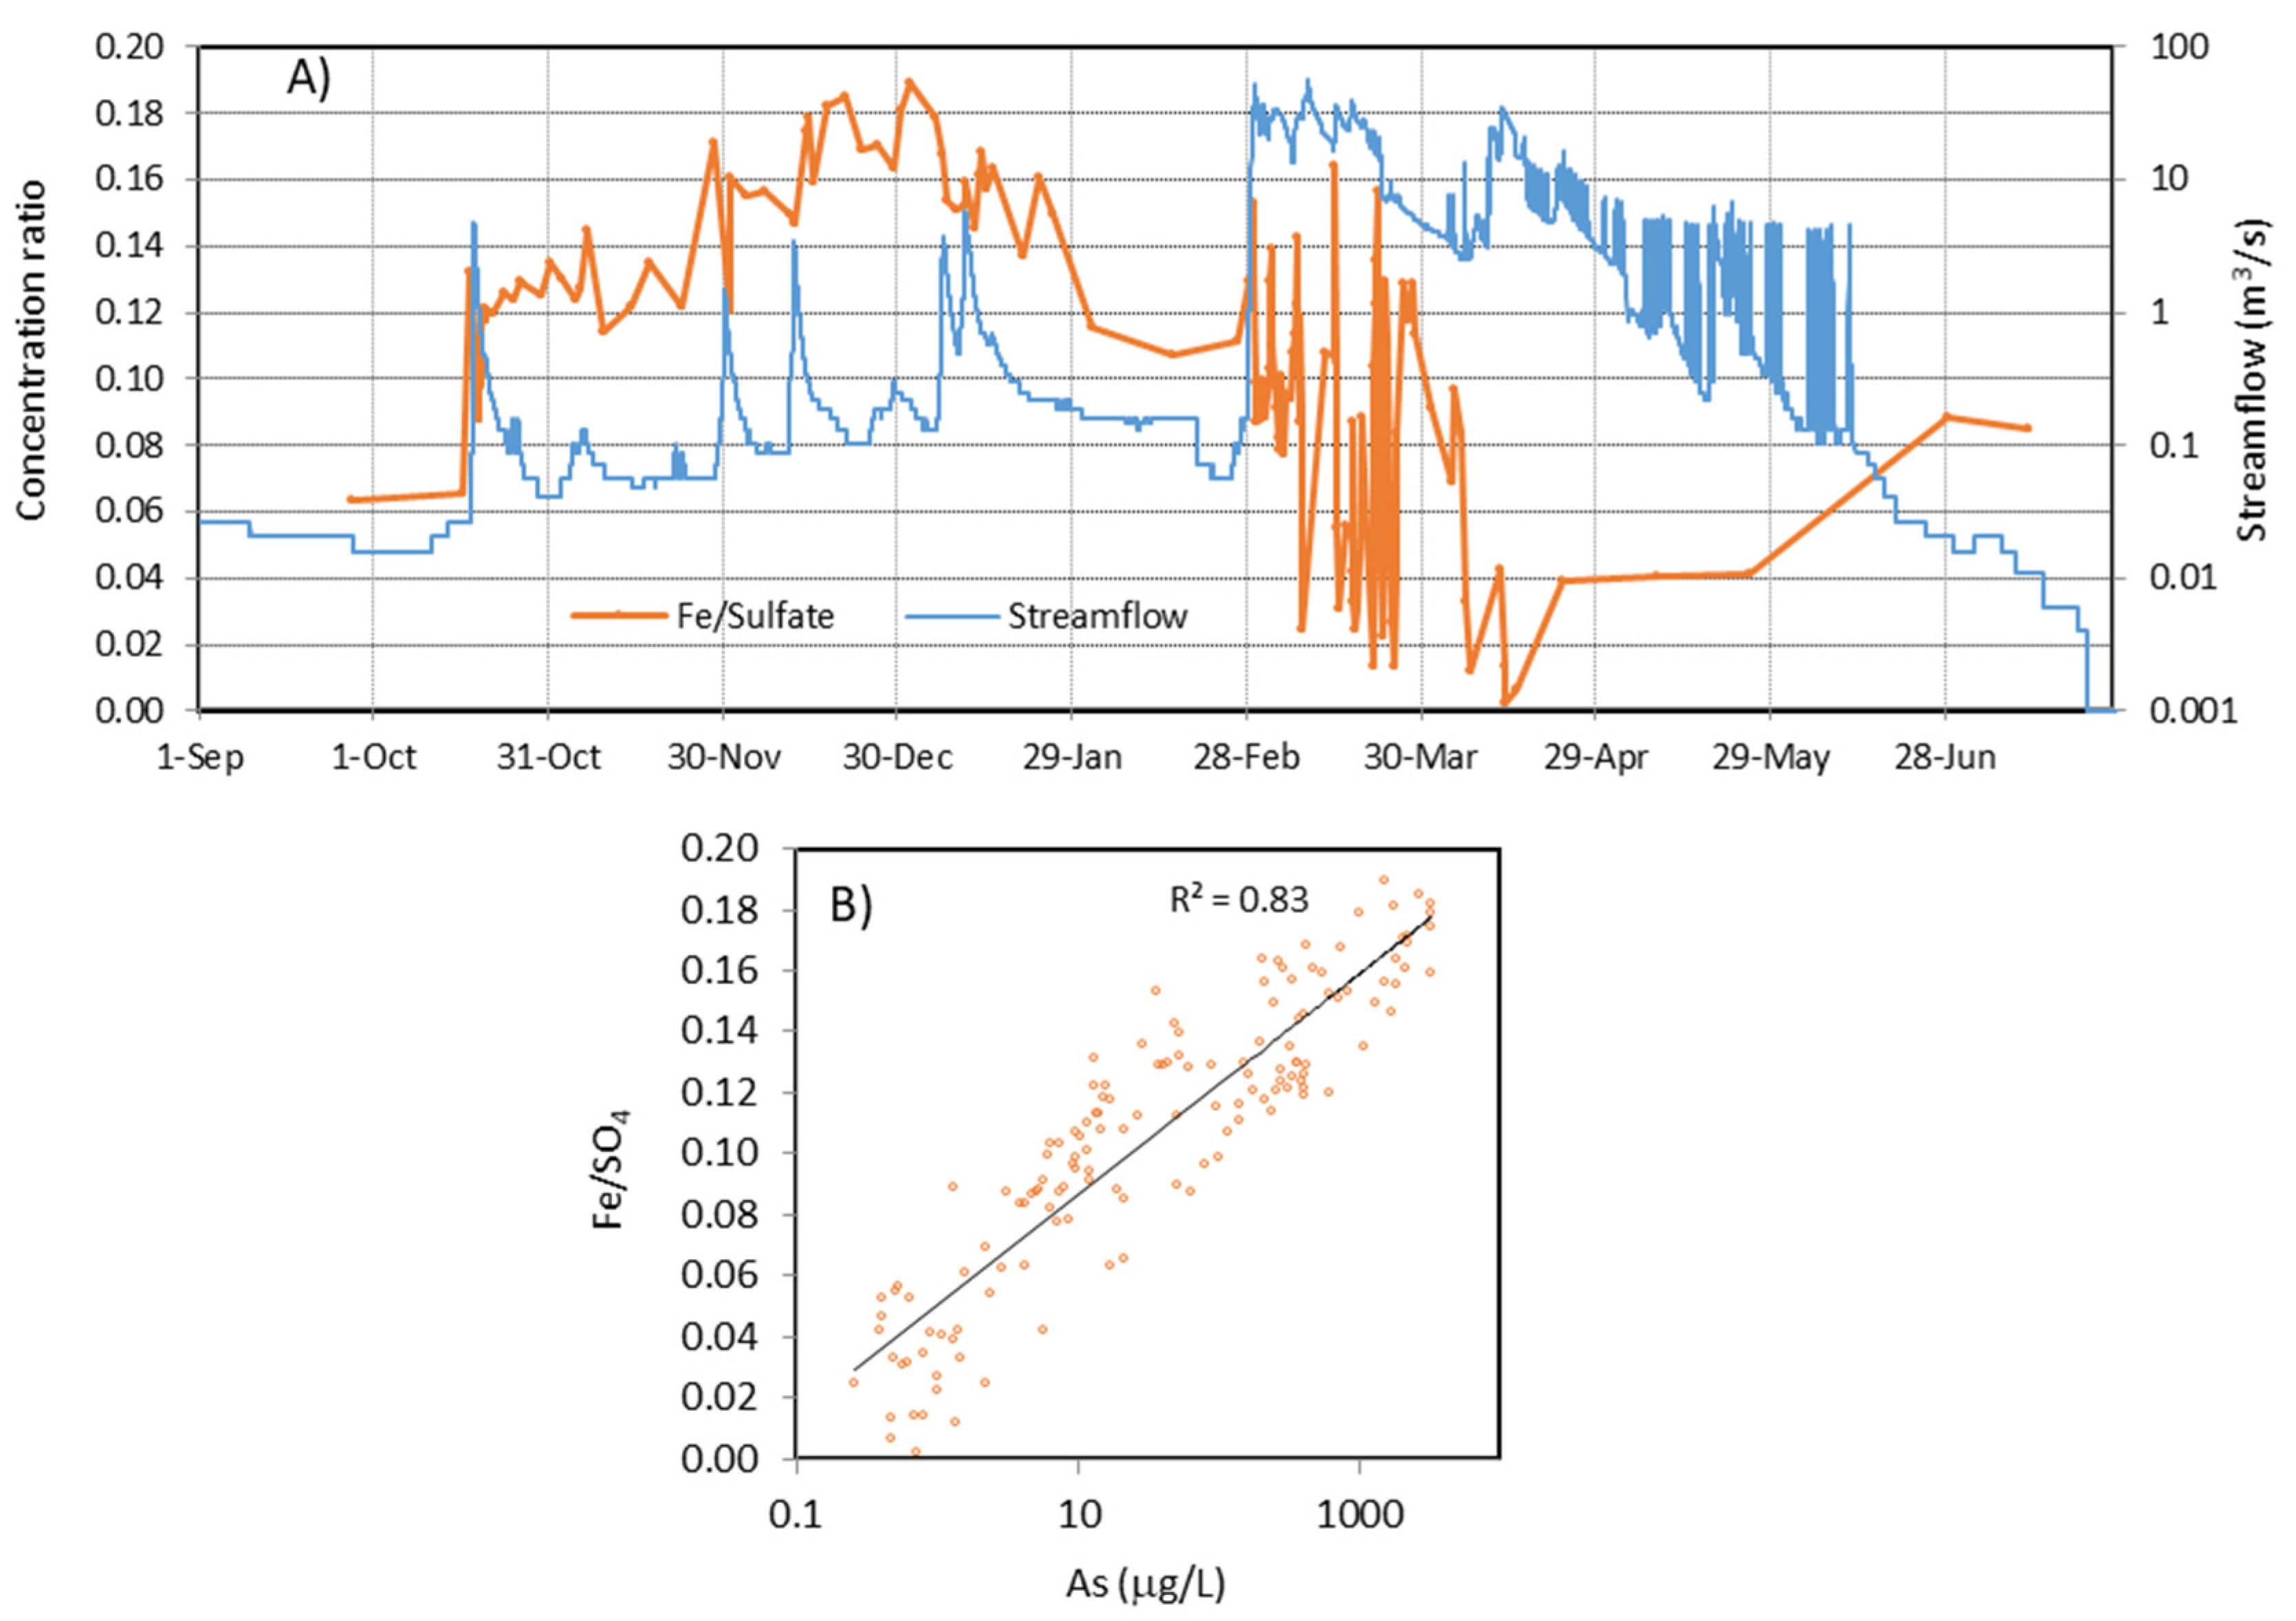
However, As showed different behavior, reaching its maximum dissolved concentrations in mid-December (Figure 4), coinciding with the maximum values of the Fe/SO4 ratio (Figure 5A). Arsenic is strongly adsorbed/coprecipitated with Fe oxyhydroxysulfates [47,48], which is an important attenuation process in waters far from the mine sites. This peak must be related to the arrival of less evolved water from the mining area, with less Fe precipitation and higher concentrations of both Fe/SO4 and As (Figure 5B). From previous tracer tests in the adjacent Odiel River, values of water velocity of 10 cm/s and 0.5 cm/s for flows of 1.1 m3/s and 0.035 m3/s, respectively, were obtained [49]. Considering an approximate water velocity of 1 cm/s and taking into account the distance between the sampling point and the Río Tinto mines (46 km), the water’s travel time from the mining area to the sampling point would be 53 days, which approximately coincides with the delay observed between the first autumn rains and the peak concentration of As.
Due to the scarcity of rainfall during the winter, at the end of February dissolved concentrations for most elements were similar to those commonly recorded at the end of the summer (Figure 4 and Figure S2). With the intense rainfalls of March, there was an initial increase in concentrations due to the washout of soluble sulfate salts, followed by a general decrease, showing later sudden fluctuations in response to successive flood events. Although the highest discharges occurred at the beginning of March, the lowest concentrations for most elements were reached in mid-April due to the progressive washout of sulfide oxidation products. From mid-April onwards, concentration values began to recover, coinciding with decreasing river flows (Figure 4 and Figure S2).
On the other hand, Pb and Ba showed a different evolution (Figure 4 and Figure S2) and their dissolved concentrations increased notably during the peak floods of March and April. This behavior may be related to the solubility control exerted by barite and anglesite or other Pb minerals [17]. In this sense, in the Río Tinto headwaters it was deduced using geochemical modeling that suggested that the dissolved Pb concentrations were limited by the equilibrium with anglesite below pH 1.5 and coprecipitation with a jarosite phase above this pH [50]. Thus, the low content of sulfate during floods would enhance the dissolved concentrations of Ba and Pb. Saturation indices (SI) for anglesite showed values close to −1 throughout the year, although with some fluctuations, while barite was oversaturated (SI between 0 and 1, Figure S3). Previous studies in Wales also reported high fluxes of Pb during stormflows after extended periods of dry weather, due to the encouraged oxidation of Pb sulfide in the mine spoils [51]. However, high concentrations of Pb were also observed following wet conditions [51]. This could be explained by the hypothesis of solubility control, which has significant implications for the load of Pb transported by the rivers, as will be explained further.
Most elements (Al, Cu, Fe, Cd, Co, Cr, Mg, Mn, Ni, SO4, and Zn) exhibited a high correlation with EC (Spearman correlation coefficient > 0.98) due to their similar behavior over the course of the year (Figure S2). However, some slight differences can be observed. For instance, lower values of Cu/Zn ratio (<0.6) were observed from September to November (Figure S4), while maximum values (>1) occurred during the March floods. This pattern may be related to the preferential removal of Cu over Zn by melanterite, and possibly by other soluble sulfate salts’ precipitation [17,52].
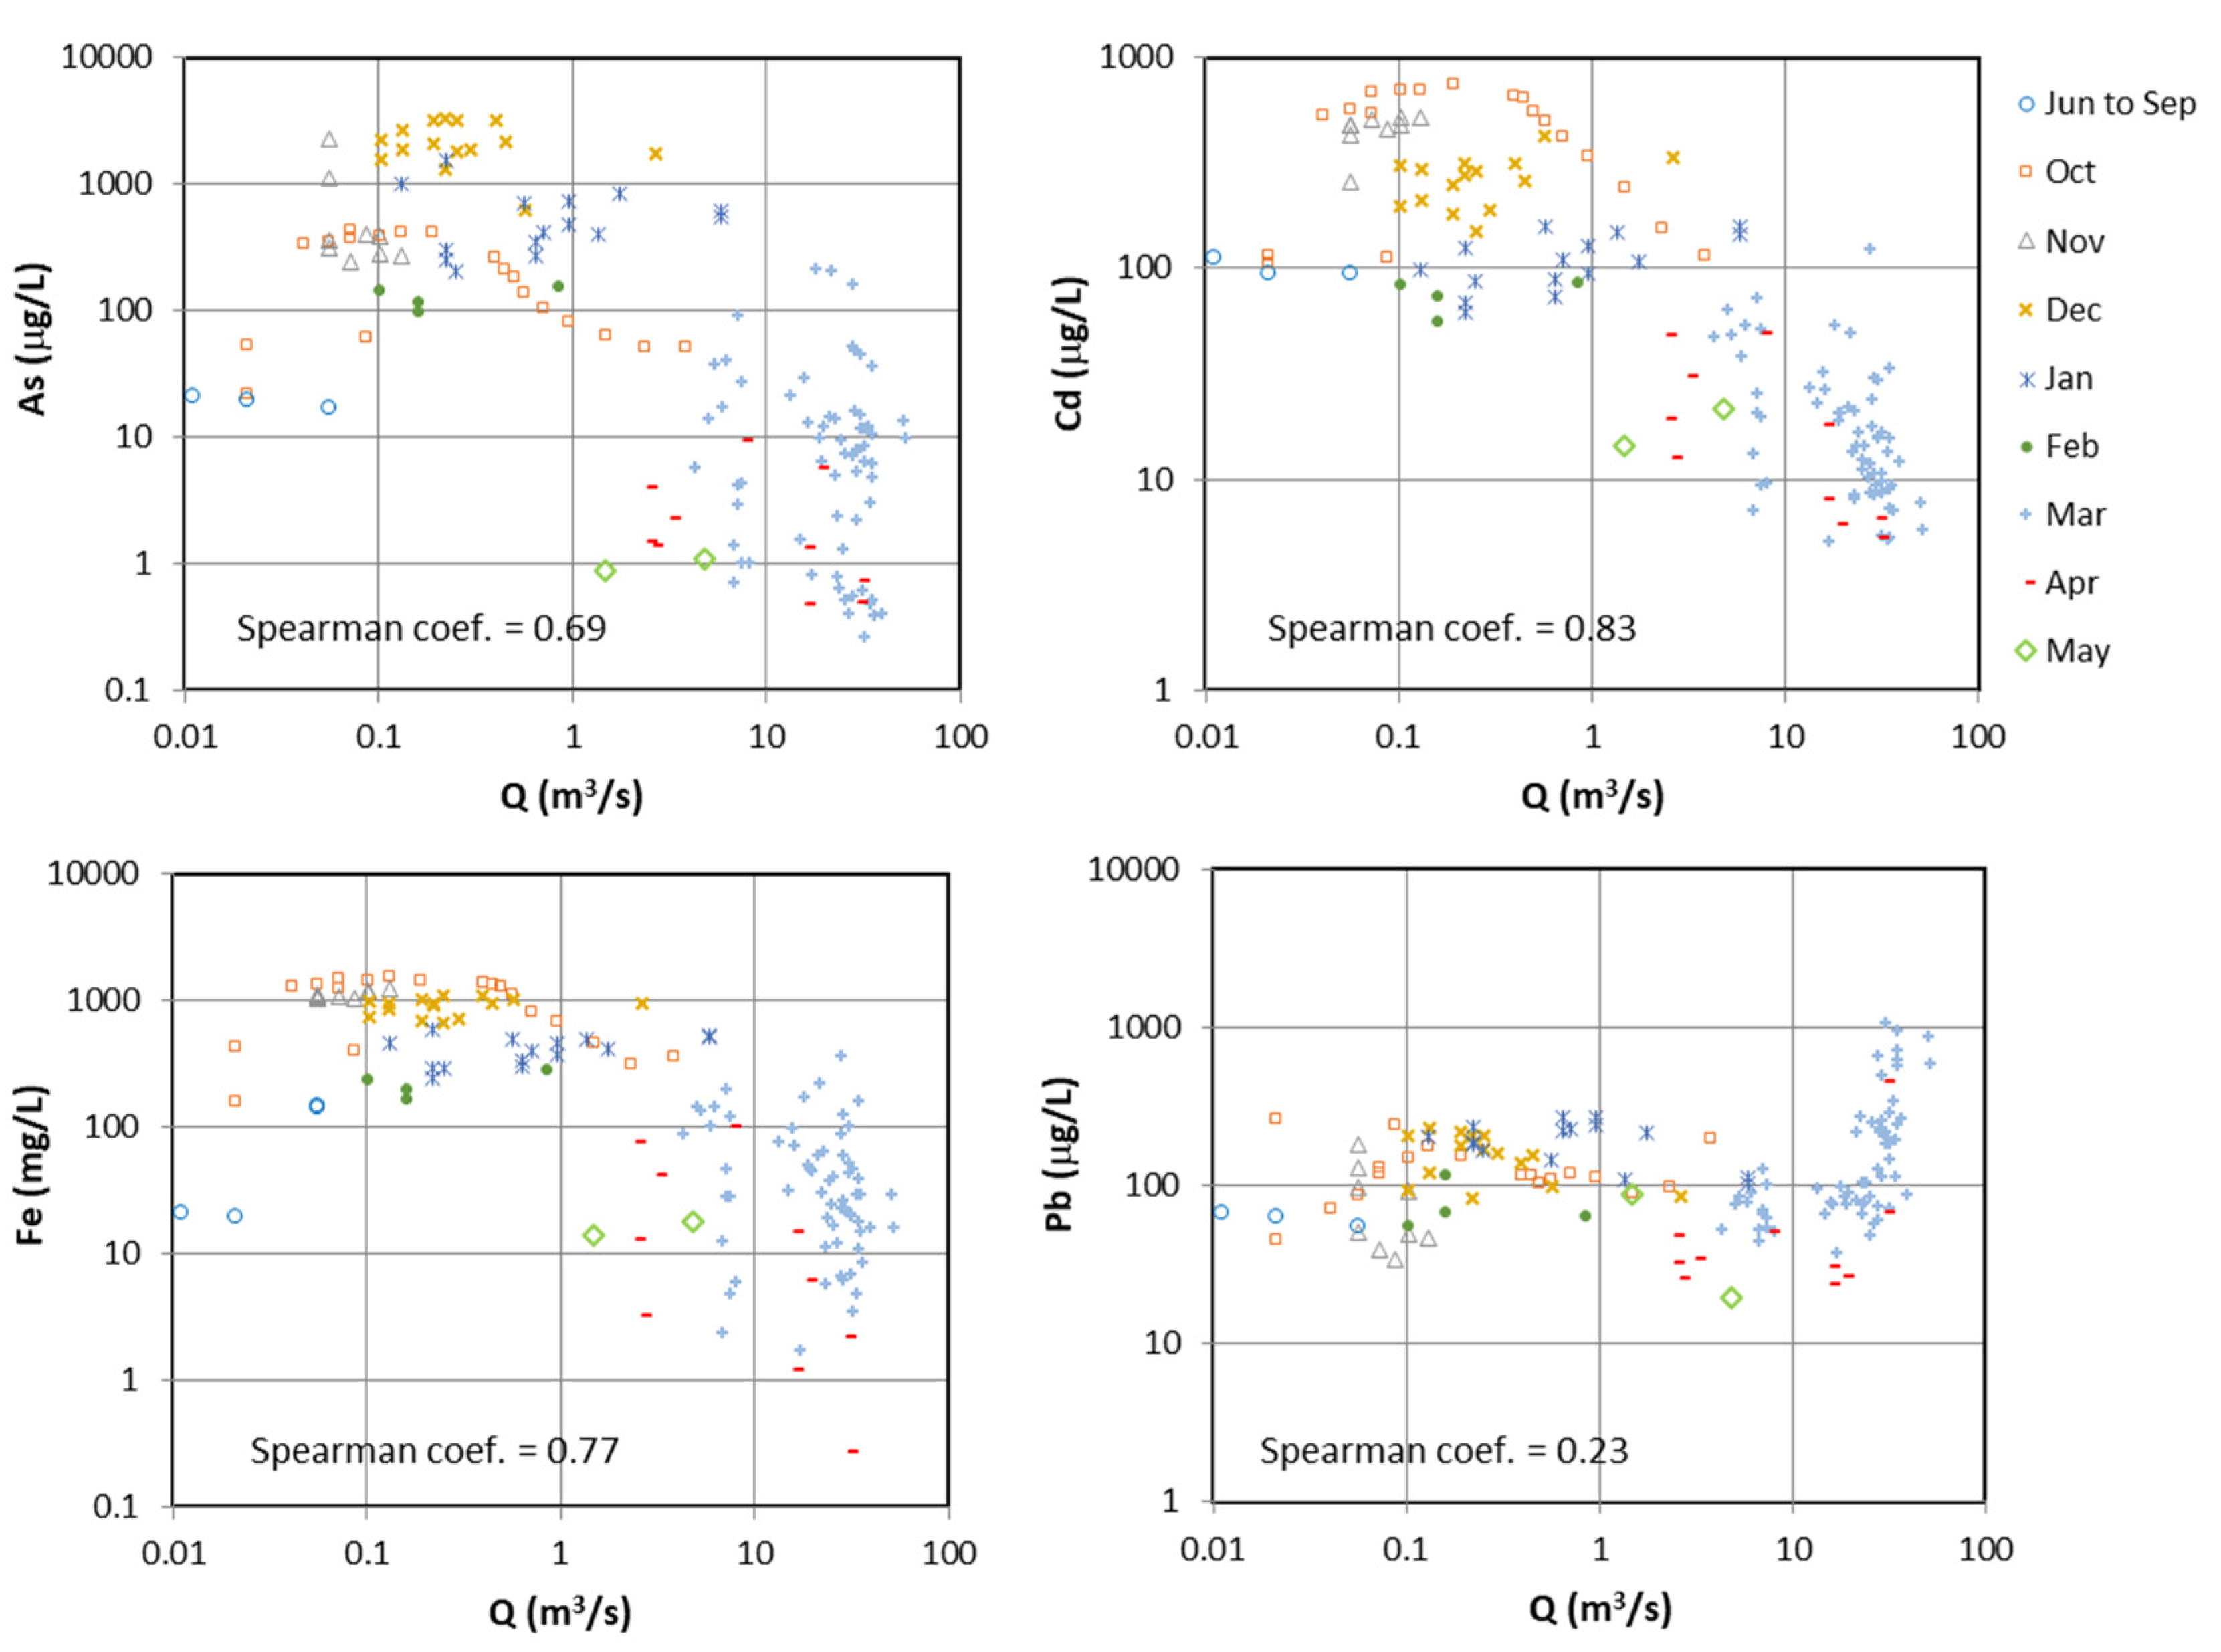
Dissolved concentrations showed highly negative correlations with streamflow for most elements (Figure 6), with a Spearman coefficient between 0.80 and 0.87 for Al, Ca, Cd, Co, Cu, Mg Mn, Na, Ni, SO4, Sr, and Zn, and lower values for Fe (0.77), Cr (0.78), and As (0.69). Lead showed a low positive correlation (0.23, significant at p < 0.05), while there was no significant correlation for Ba and K and streamflow. When the streamflow in a river increases, a decrease in the concentration of dissolved substances is generally observed due to the dilution of the less-concentrated surface runoff, although the transported load can increase [11,51,53]. Elements with the highest correlations are those that are more conservative in the river water, while the lower correlation of Fe, Cr, and As must be associated with precipitation (Fe) and coprecipitation/sorption processes, especially affecting As, but also Cr. Saturation indexes for schwertmannite showed oversaturation or subsaturation, depending on the equilibrium constant used, while for jarosite, oversaturated values were observed during the autumn and winter and subsaturated ones during the spring (Figure S3). The affinity of Cr to be removed during Fe precipitation has been previously observed in the Río Tinto [17] and other AMD-affected systems [54,55,56]. On the other hand, K concentration in AMD water may be controlled by jarosite precipitation [54], not showing any relationship with streamflow, as well as Ba.
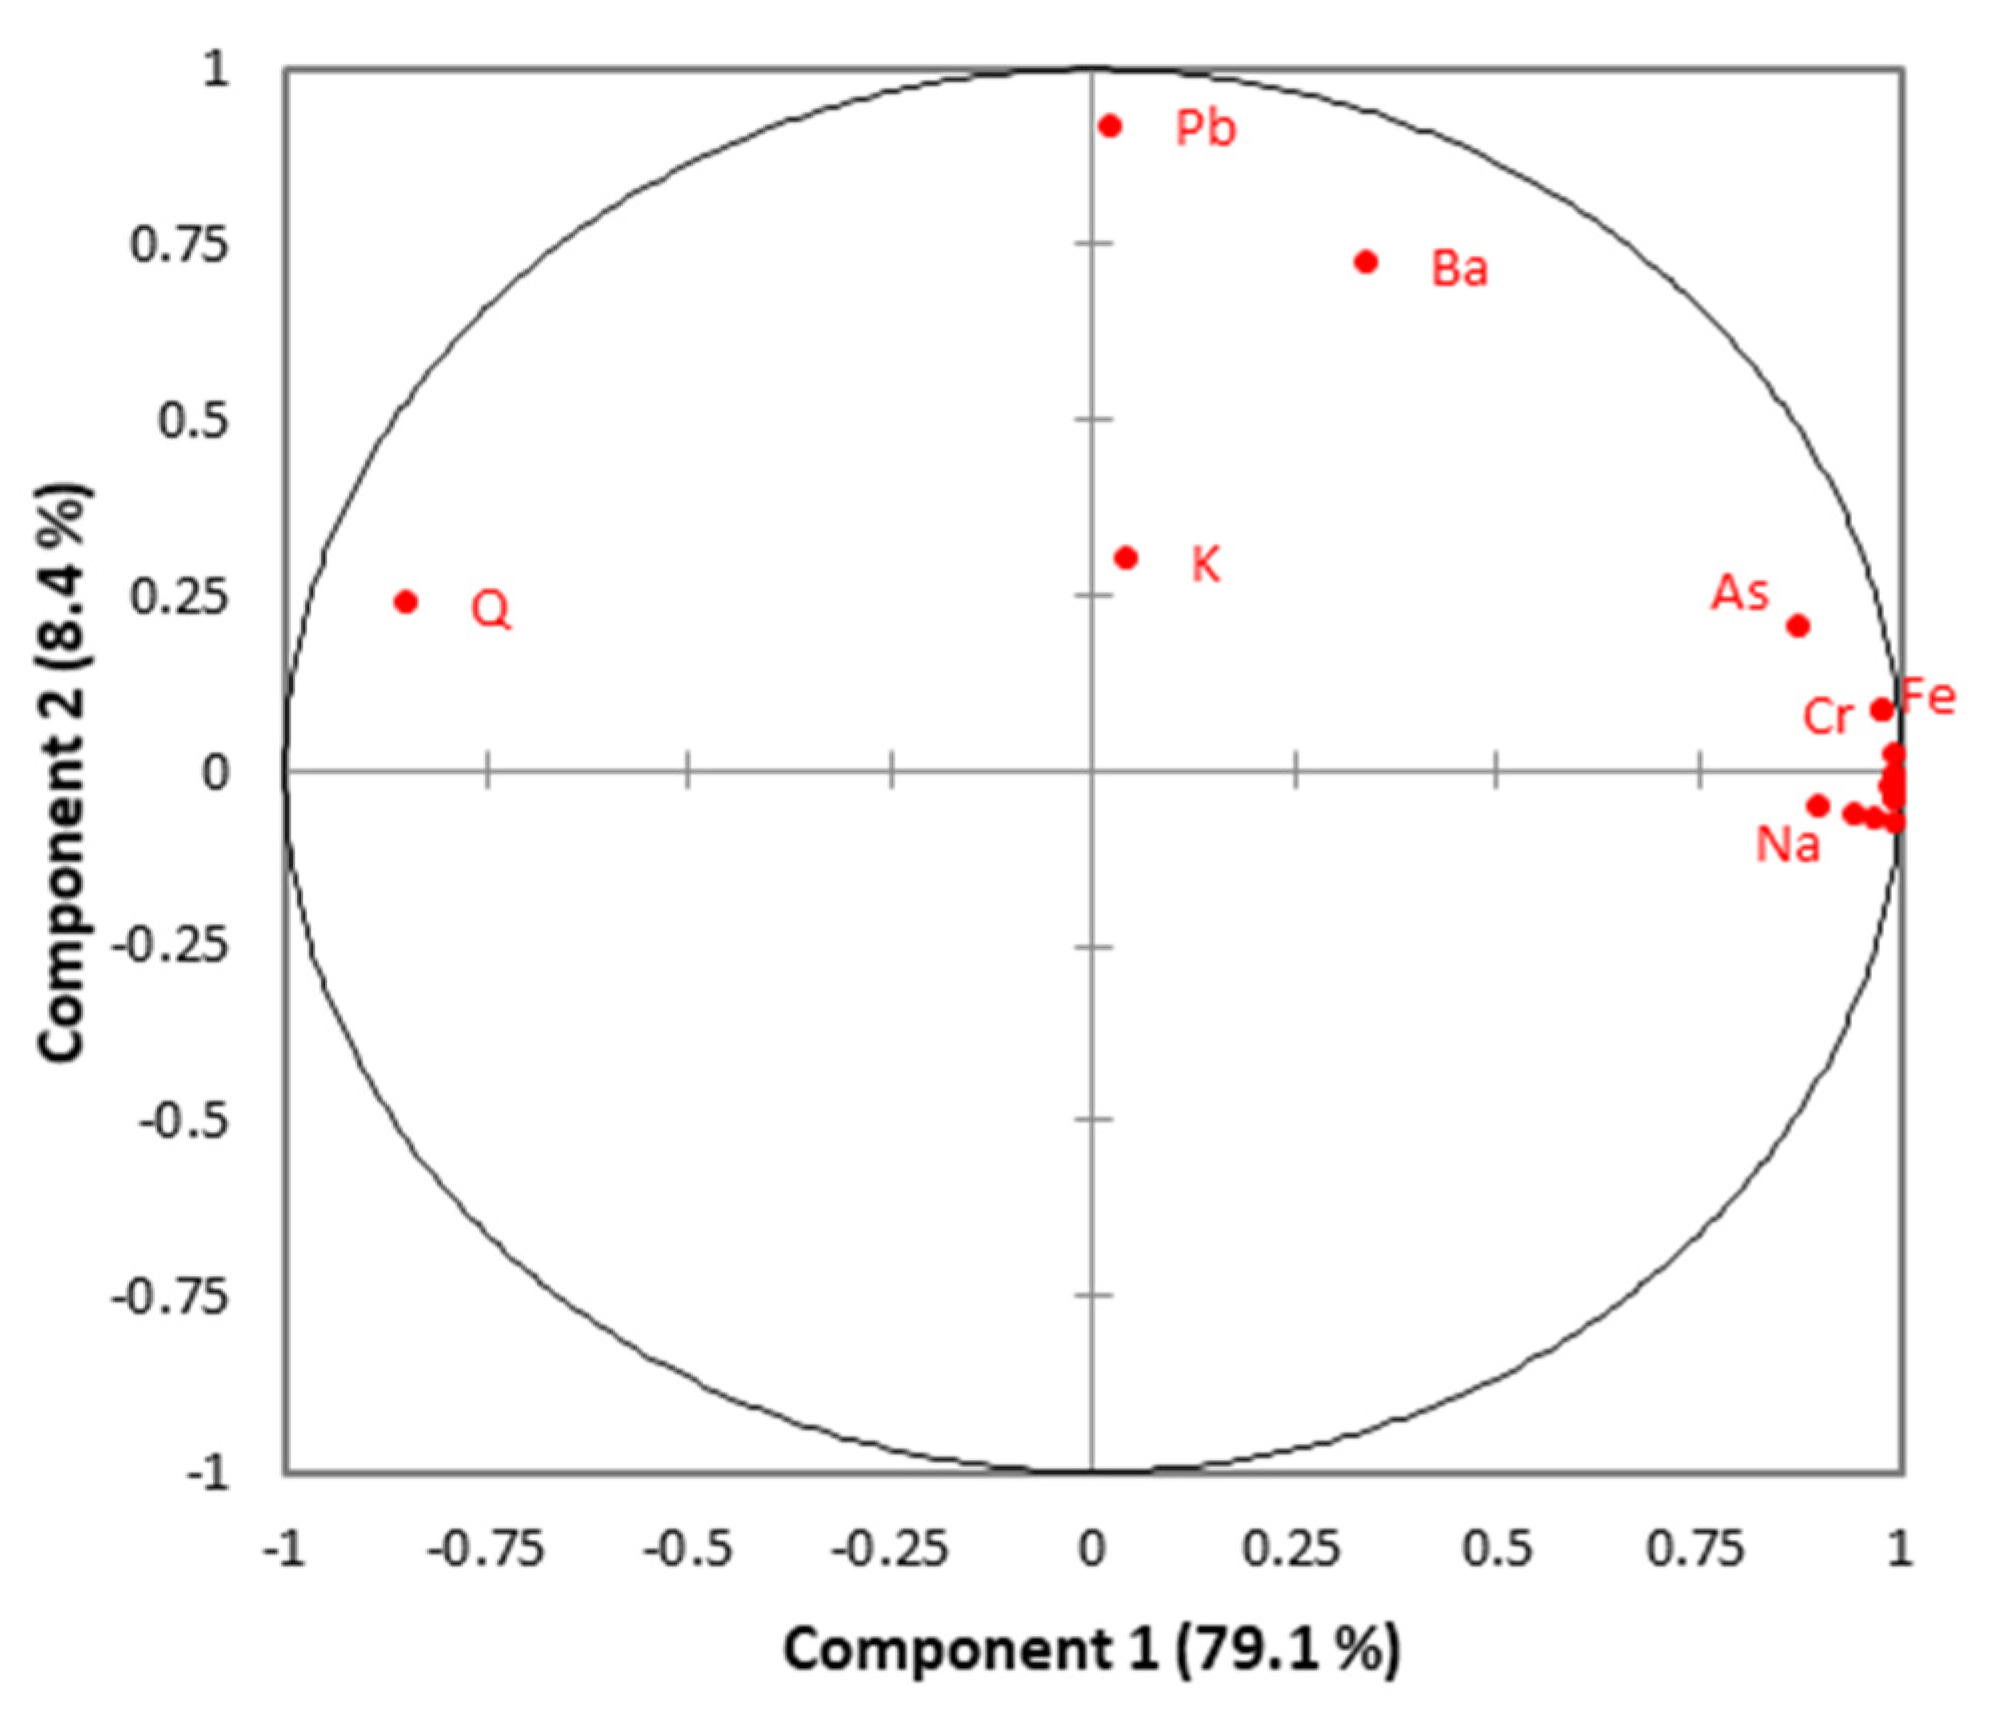
All these results are verified in the performed PCA (Figure 7). The first component explains most of the variance (79%) and seems to be controlled by the element concentration (except for Ba, K, and Pb), while the negative part covers the streamflow. The second component (only 8.4% of the variance) is mainly controlled by Pb and Ba concentrations and, with a lower weight, K. Arsenic and, to a lesser extent, Fe and Cr show slightly different behavior than most elements due to the precipitation/coprecipitation/sorption processes explained above.
However, for those elements exhibiting a high correlation with river flow, dissolved concentrations can vary by approximately one order of magnitude for Cd and Pb and three orders of magnitude for As and Fe with the same streamflow value (Figure 6). In addition, seasonal differences can be seen, with the lowest concentrations in April while the highest were in October for most elements (including Cd and Fe), in December for As and in March for Pb (Figure 6).
The percentages of dissolved concentrations over the total were obtained from the difference in concentrations between unfiltered and filtered aliquots (Table 2). Most elements (mainly those with the highest correlation with the EC) displayed percentages of dissolved concentration higher than 98%, which means that they were almost exclusively transported by the dissolved phase. On the contrary, As was mainly transported by the particulate phase linked to Fe precipitates, as mentioned above (Figure 5). Values for Fe and Ba were close to 50%, while Cr and Pb were mainly transported by the dissolved phase, although with a significant role of particulate matter (10‒30%).
Table 3 shows the dissolved load obtained for the hydrological year 2017/18. The load has only been calculated for elements whose concentrations were above the detection limit in all samples. The Río Tinto transported almost 5000 tons of Fe, 2600 tons of Al, 680 tons of Zn, 560 tons of Cu, and 230 tons of Mn. Among trace elements, the transport of Pb and Co stands out (15 tons), although the median concentration of Pb was much lower than that of Co (110 and 412 µg/L, respectively). Significant loads of As, Cd, and Ni (between 2.1 and 3.6 tons) and other toxic elements were also recorded. These values are similar to those obtained from correlations between flow and element concentrations for the period 1995–2003 [16]. The most striking difference is that obtained for As (12 versus 3.6 tons in this work), which could be explained by the anomalous rainfall distribution observed in 2017/18, together with the extreme As values observed in 2000, coinciding with the cessation of mining (see next section). A high difference was also observed for Al (1224 versus 2593 tons), but for the period 1995‒2003 it is acknowledged that Al data had high uncertainty [16].
The seasonal distribution of dissolved pollutant loads in the Rio Tinto in 2017/18 is shown in Figure 8. Approximately 30% of the annual amount of Al, Cd, Co, Cu, Ni, and Zn was transported from October to February, even though the water contribution during this period was only 4%. However, some small differences among these elements can be seen: for example, the percentage of Cu (26%) was lower than that of Zn (33%) in this period because of the differences in the preferential coprecipitation of Cu in melanterite compared to Zn (Figure S4). It can also be observed that from October to February, 78% of As, 49% of Cr, and 43% of Fe was delivered to the Río Tinto estuary. On the contrary, only 4% of the total Pb delivered by the river in the whole year was transported during this period. Nevertheless, the particulate transport of Cr, Pb, Fe, and, especially, As may be high compared with the dissolved transport, according to the percentages shown in Table 3. A recent work found significant transport of particulate As, Cr, and Pb in the middle course of the Río Tinto [57].
During the March floods, the Río Tinto carried the highest dissolved loads for all elements studied except for As (Figure 8). The first significant floods after summer, normally occurring at the end of autumn or beginning of winter, represent a high percentage of the annual pollutant load of the river [34,58]. The high Pb load (86% of the total of the year) stands out due to its increase in concentration during floods. March floods caused the total washout of sulfide oxidation weathering products from the mining zone. Consequently, although the water contribution in April was high (25% of the total), the dissolved loads carried by the river were much lower, especially for As, Fe, Cr, and Pb (<10%; Figure 8). This indicates that the pyrite oxidation products from the mining zone were not completely washed out until the March floods. Thus, two stages could be differentiated: (1) A washout with the first rainfall after the summer of salts precipitated on the surface of the mining zone and riverbanks, which produces the maximum pollutant concentrations; and (2) total removal of sulfate salts from the mining area after the winter floods, which is less apparent. In the latter case, this could be related to the dissolution during intense rainy periods of: (a) less soluble sulfate minerals, (b) salts precipitated within waste-rock dumps, which can be found as cement filling the interclast porosity and/or as a coating on the particles, and (c) salts from mine voids due to water table elevation [46,51].

4.2. Long-Term Evolution

The basic statistics of the chemical evolution of the Río Tinto from the official water quality monitoring network are shown in Table 4. The conditions are more extreme (higher EC and concentrations and lower pH values) than obtained for 2017/18 (Table 1). These differences are explained by: (1) The sampling point of the official water quality monitoring network (Niebla; Figure 1) being located 9 km downstream of the sampling point for 2017/18 (streamgage station; Figure 1) and, therefore, being affected to a greater extent by dilution with tributaries; (2) different sampling strategies: while samples in the historical dataset were collected periodically, sampling during 2017/18 aimed at determining the concentration variations during the floods and, consequently, the highest number of samples was taken during the rainiest months; and (3) lower levels of pollutants since the mine closure in 2000, as discussed below.
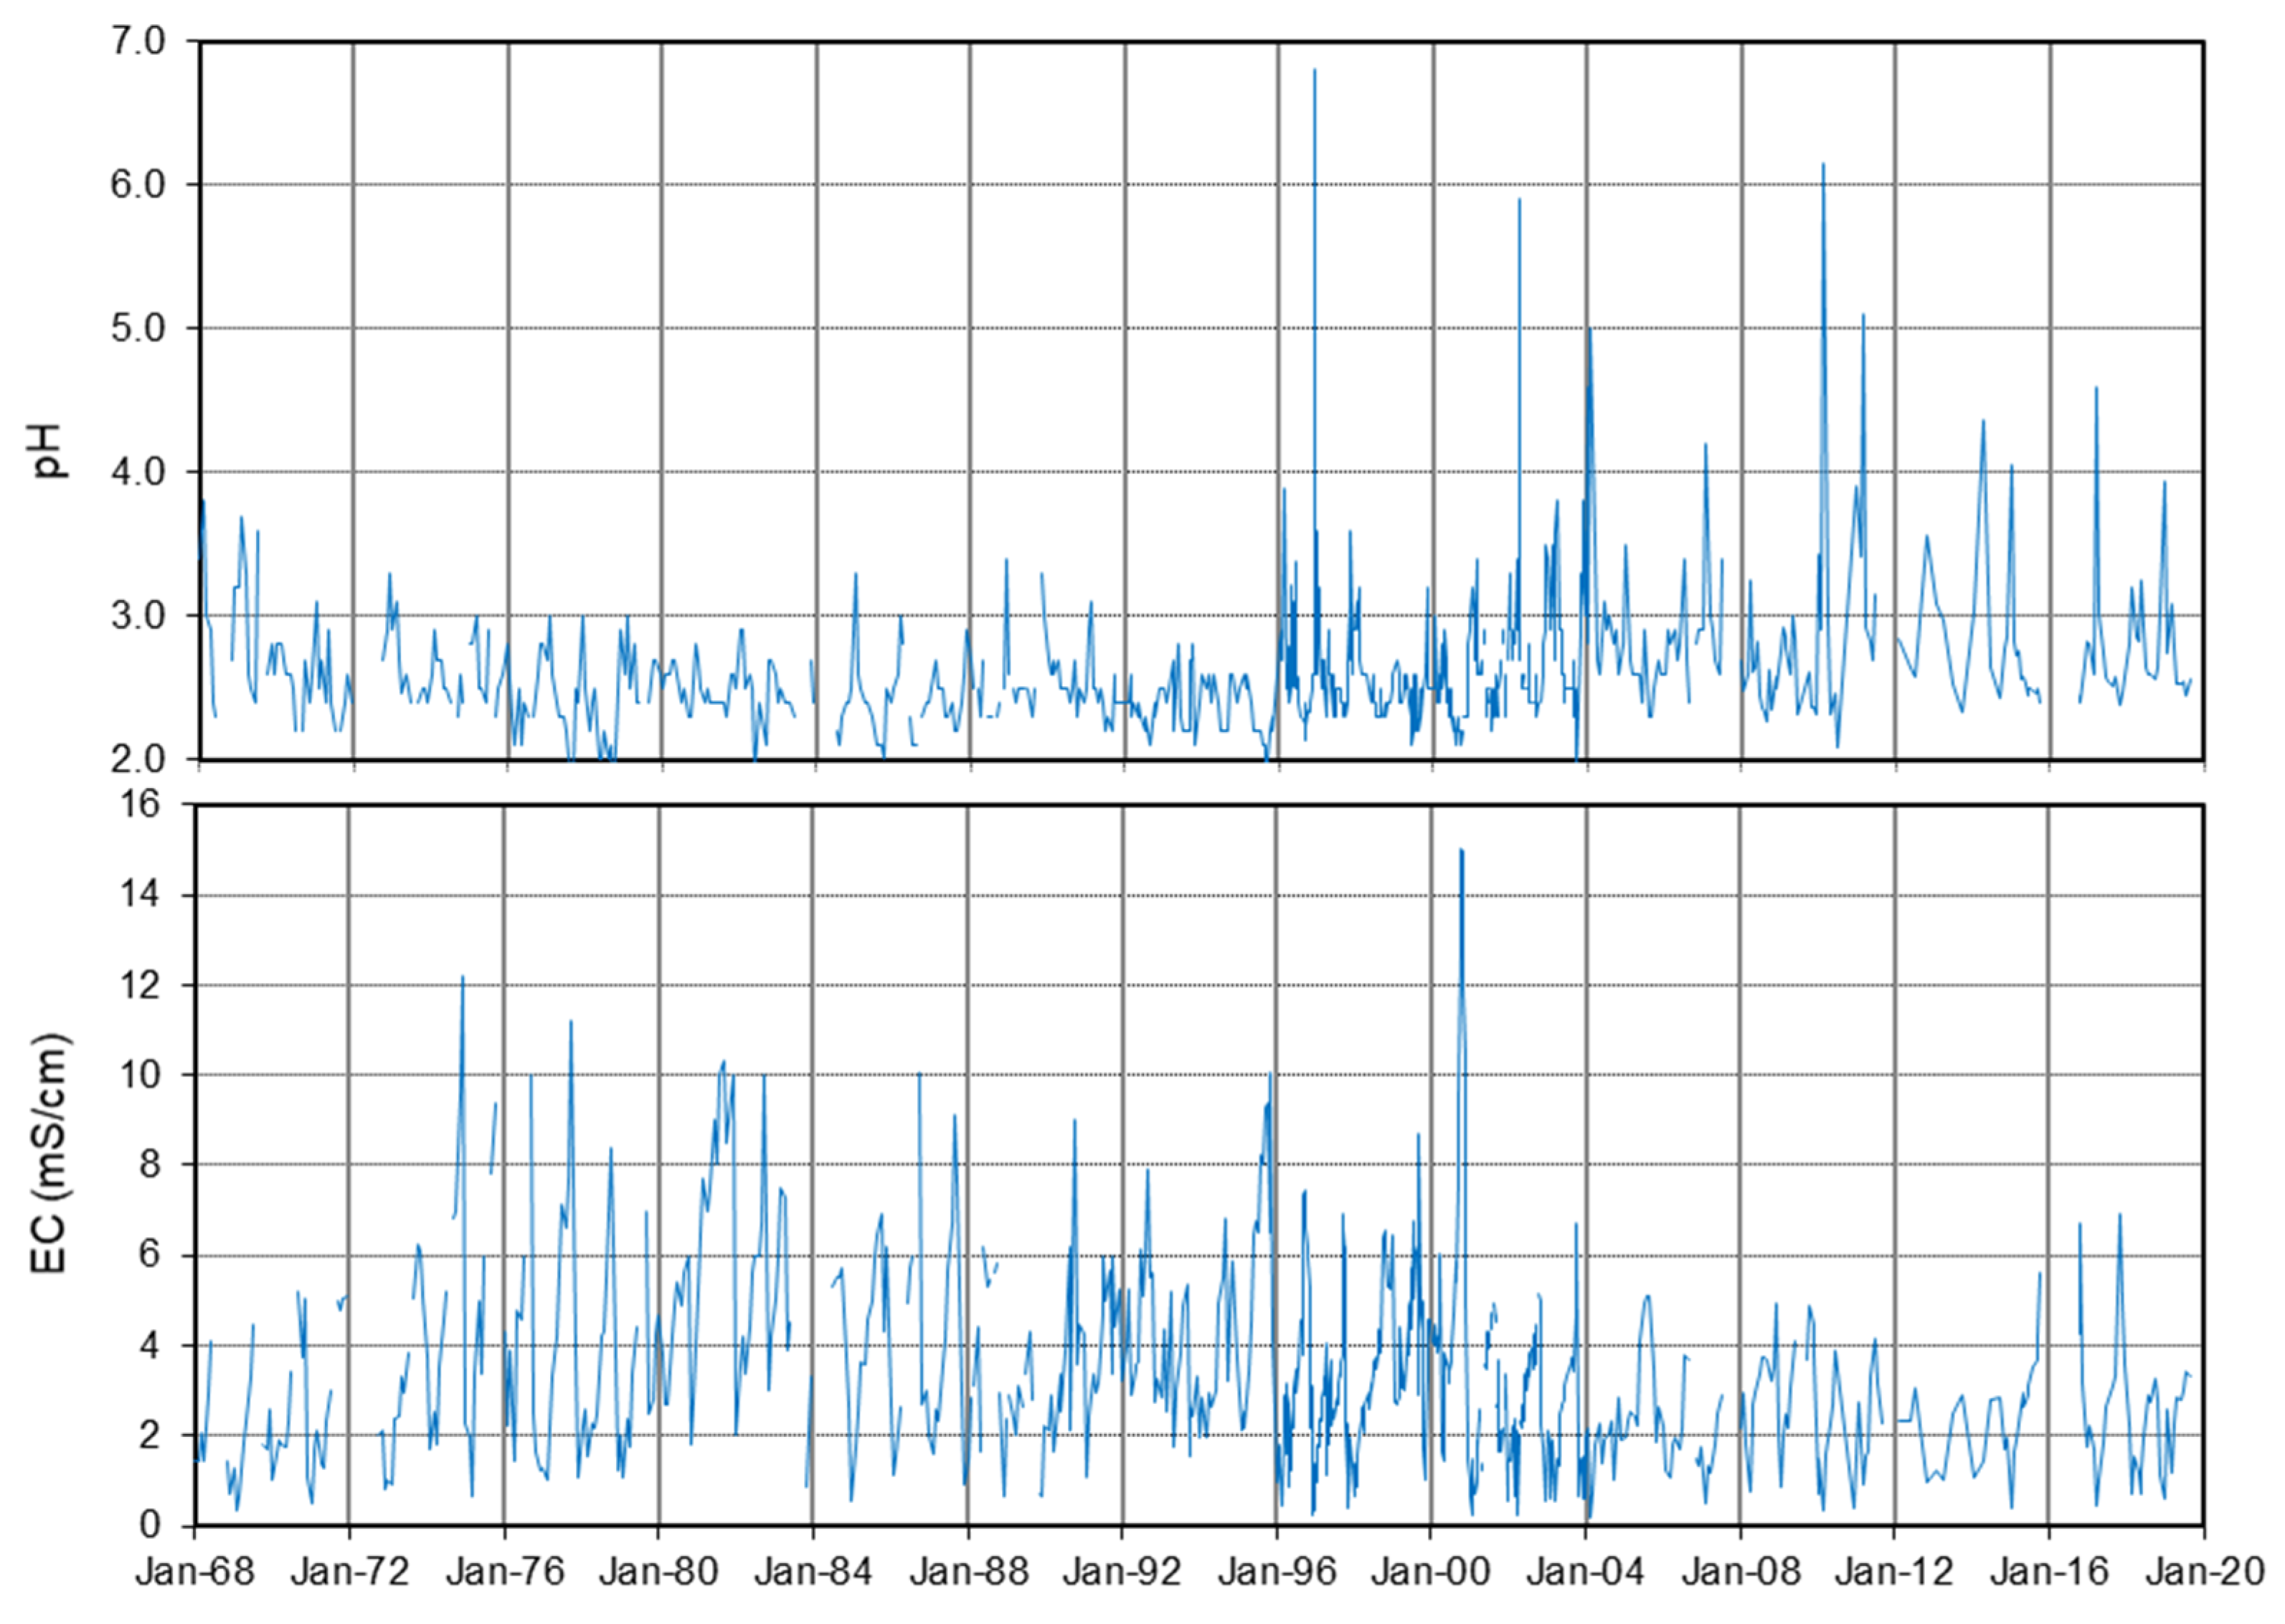
Regarding the temporal evolution of pH and EC since 1968, some samples with pH above 5, coinciding with the lowest EC values during very rainy periods, stand out (Figure 9). On the other hand, pH values tend to increase, and EC values tend to decrease over time. This change is especially evident from 2000 (Figure 9), coinciding with the mine closure (after this year pH values often exceed 3, while before this date this occurs only very sporadically). Likewise, the EC values were at a maximum in 2000. Since then values have rarely exceeded 6 mS/cm, whereas before 2000 this value was frequently surpassed.
Concerning metal concentrations, there is also a worsening of water quality in 2000 (Figure S5), reaching concentrations of up to 5 g/L of Fe, 590 mg/L of Zn, and 50 mg/L of As. This pollutant peak was due to the closure of Rio Tinto mines and the cessation of environmental control works [16]. These peaks are observed in other mines worldwide due to the rebound effect [40], although in the case of Río Tinto this is very sharp. These episodes of high pollution are followed by periods of decreasing concentrations [59]. Consequently, pollutant concentrations in the Río Tinto suffered a significant decrease that seems to be maintained until now (Figure S5). Concerning the reopening of the Río Tinto mine in 2015, from the available data we have not been able to observe a clear influence on the river quality (Figure 9 and Figure S5).

5. Conclusions

The evolution of pollutant concentrations and loads in 2017/18 was controlled by the rainfall distribution. Although the amount of rainfall during this year was close to average values, its distribution throughout the year was irregular: very scarce rainfall was recorded from October to February, while there was an intense rainy period in March. Due to the washing out of efflorescent salts that precipitated during the summer at the surface of the mining zone and along the riverbanks, the maximum concentrations of EC and most elements (Al, Ca, Fe, Cd, Co, Cu, Mg, Mn, Na, Ni, SO4, Si, and Zn) occurred just after the first autumn rainfalls. On the other hand, the maximum concentration of As was recorded in December, which seems to be linked to the arrival of acidic waters with lower Fe precipitation at the sampling point. This behavior is due to the strong tendency of As to coprecipitate/be adsorbed by Fe oxyhydroxysulfate minerals. Chromium may also be affected by this process, although to a lesser degree than As. The maximum concentrations of Ba and Pb occurred during the March and April floods, linked to the low sulfate concentrations, which seems to control the solubility of these elements by the precipitation of barite/anglesite or other minerals. On the contrary, the high floods produced a second washout process (masked by strong runoff dilution processes) of less soluble sulfates and/or soluble salts precipitated within the waste dumps or the mining voids. Consequently, the minimum concentrations for most elements were reached in late March or April.
The detailed sampling carried out in 2017/18 allowed us to obtain a reliable estimate of the load of dissolved pollutants transported by the Río Tinto: 5000 tons of Fe, 2600 of Al, 683 of Zn, and so on. Approximately 30% of the annual amount of Al, Cd, Co, Cu, Ni, and Zn was transported between October and February due to the washout of evaporitic soluble sulfate salts, although the water contribution was only 4%. These values were even higher for Fe (43%), Cr (49%), and, above all, As (78%). Except for this latter element, the highest loads occurred during the intense floods of March. This is especially relevant for Pb (86% of the annual load) due to its concentration increasing strongly during floods, unlike most elements. In April, although the streamflow was high, the pollutant loads were lower due to the total washout of secondary soluble salts. On the other hand, the particulate phase may play an important role in the river metal transport of Cr, Fe, Pb, and, above all, As.
Regarding the long-term evolution, the cessation of mining activities in 2000 produced a worsening of conditions and extreme concentrations were reached (up to 5 g/ L of Fe, 50 mg/L of As, and so on). After that, there was a slight improvement in water quality in terms of pollutant loads. However, the AMD generation in the mining area is expected to continue for many hundreds of years [59], and the Río Tinto will continue to transport very high amounts of toxic metals to the Huelva estuary.

Supplementary Materials

The following are available online at https://www.mdpi.com/2075-163X/10/7/598/s1, Figure S1: (A) Evolution of rainfall and streamflow during the hydrological year 2017/18. (B) Detailed evolution of daily discharge increase from 4–8 June (corresponding to the inner square in (A)), Figure S2: Evolution of dissolved concentrations in 2017/18 for all studied elements, Figure S3: Evolution of saturation indices for some secondary minerals precipitating from AMD in 2017/18, Figure S4: Evolution of the Cu/Zn ratio in 2017/18, Figure S5: Evolution of dissolved concentrations of As, Cd, Cu, Fe, Mn, Pb, SO4, and Zn from 1980 to 2019 (a potential trend line for each element is shown).

Author Contributions

Conceptualization, M.O., J.M.N., and C.R.C.; methodology, C.R.C., F.M., and M.D.B.; writing—original draft preparation, M.O. and C.R.C.; writing—review and editing, J.M.N., F.M., and M.D.B. All authors have read and agreed to the published version of the manuscript.

Funding

This work was supported by the Spanish Ministry of Economy and Competitiveness through the research projects CAPOTE (CGL2017-86050-R) and SCYRE (CGL2016-78783-C2-1-R). M.D. Basallote thanks the Spanish Ministry of Science and Innovation for the postdoctoral fellowship granted under application reference IJC2018-035056-I. F. Macías was funded by the R&D FEDER Andalucía 2014‒2020 call through the project RENOVAME (FEDER; UHU-1255729).

Acknowledgments

The authors would like to thank to Eduardo Navarrete (Junta de Andalucía) for providing access to the sampling point and flow data information and the four anonymous reviewers, whose comments and suggestions allowed us to significantly improve the manuscript.

Conflicts of Interest

The authors declare no conflict of interest.

References

  1. Sabater, S.; Buchaca, T.; Cambra, J.; Catalan, J.; Guasch, H.; Ivorra, N.; Muñoz, I.; Navarro, E.; Real, M.; Romaní, A. Structure and function of benthic algal communities in an extremely acid river 1. J. Phycol. 2003, 39, 481–489. [Google Scholar] [CrossRef] [Green Version]
  2. López-Archilla, A.I.; Marín, I.; Amils, R. Microbial community composition and ecology of an acidic aquatic environment: The Tinto River, Spain. Microb. Ecol. 2001, 41, 20–35. [Google Scholar] [CrossRef] [PubMed]
  3. Zettler, L.A.A.; Gómez, F.; Zettler, E.; Keenan, B.G.; Amils, R.; Sogin, M.L. Eukaryotic diversity in Spain’s River of Fire. Nature 2002, 417, 137. [Google Scholar] [CrossRef] [PubMed]
  4. Gomes, P.; Valente, T.; Geraldo, D.; Ribeiro, C. Photosynthetic pigments in acid mine drainage: Seasonal patterns and associations with stressful abiotic characteristics. Chemosphere 2020, 239, 124774. [Google Scholar] [CrossRef] [PubMed]
  5. Dold, B. Evolution of acid mine drainage formation in sulphidic mine tailings. Minerals 2014, 4, 621–641. [Google Scholar] [CrossRef] [Green Version]
  6. Chopard, A.; Marion, P.; Mermillod-Blondin, R.; Plante, B.; Benzaazoua, M. Environmental impact of mine exploitation: An early predictive methodology based on ore mineralogy and contaminant speciation. Minerals 2019, 9, 397. [Google Scholar] [CrossRef] [Green Version]
  7. Evangelou, V.P.; Zhang, Y. A review: Pyrite oxidation mechanisms and acid mine drainage prevention. Crit. Rev. Environ. Sci. Technol. 1995, 25, 141–199. [Google Scholar] [CrossRef]
  8. Blowes, D.W.; Jambor, J.L.; Hanton-Fong, C.J.; Lortie, L.; Gould, W.D. Geochemical, mineralogical and microbiological characterization of a sulphide-bearing carbonate-rich gold-mine tailings impoundment, Joutel, Québec. Appl. Geochem. 1998, 13, 687–705. [Google Scholar] [CrossRef]
  9. Nordstrom, D.K.; Blowes, D.W.; Ptacek, C.J. Hydrogeochemistry and microbiology of mine drainage: An update. Appl. Geochem. 2015, 57, 3–16. [Google Scholar] [CrossRef]
  10. Elghali, A.; Benzaazoua, M.; Bouzahzah, H.; Bussière, B.; Villarraga-Gómez, H. Determination of the available acid-generating potential of waste rock, part I: Mineralogical approach. Appl. Geochem. 2018, 99, 31–41. [Google Scholar] [CrossRef]
  11. Jarvis, A.P.; Davis, J.E.; Orme, P.H.; Potter, H.A.; Gandy, C.J. Predicting the benefits of mine water treatment under varying hydrological conditions using a synoptic mass balance approach. Environ. Sci. Technol. 2018, 53, 702–709. [Google Scholar] [CrossRef] [PubMed]
  12. Dore, E.; Fancello, D.; Rigonat, N.; Medas, D.; Cidu, R.; Da Pelo, S.; Frau, F.; Lattanzi, P.; Marras, P.A.; Meneghini, C. Natural attenuation can lead to environmental resilience in mine environment. Appl. Geochem. 2020, 104597. [Google Scholar] [CrossRef]
  13. Leistel, J.; Marcoux, E.; Thiéblemont, D.; Quesada, C.; Sánchez, A.; Almodóvar, G.; Pascual, E.; Sáez, R. The volcanic-hosted massive sulphide deposits of the Iberian Pyrite Belt Review and preface to the Thematic Issue. Miner. Depos. 1997, 33, 2–30. [Google Scholar] [CrossRef]
  14. Nocete, F.; Álex, E.; Nieto, J.M.; Sáez, R.; Bayona, M.R. An archaeological approach to regional environmental pollution in the south-western Iberian Peninsula related to Third millennium BC mining and metallurgy. J. Archaeol. Sci. 2005, 32, 1566–1576. [Google Scholar] [CrossRef]
  15. Olías, M.; Nieto, J.M. Background conditions and mining pollution throughout history in the Río Tinto (SW Spain). Environments 2015, 2, 295–316. [Google Scholar] [CrossRef] [Green Version]
  16. Olías, M.; Cánovas, C.R.; Nieto, J.; Sarmiento, A.M. Evaluation of the dissolved contaminant load transported by the Tinto and Odiel rivers (South West Spain). Appl. Geochem. 2006, 21, 1733–1749. [Google Scholar] [CrossRef]
  17. Cánovas, C.; Olías, M.; Nieto, J.; Sarmiento, A.; Cerón, J. Hydrogeochemical characteristics of the Tinto and Odiel Rivers (SW Spain). Factors controlling metal contents. Sci. Total Environ. 2007, 373, 363–382. [Google Scholar] [CrossRef]
  18. Cánovas, C.R.; Basallote, M.D.; Borrego, P.; Millán-Becerro, R.; Pérez-López, R. Metal partitioning and speciation in a mining-impacted estuary by traditional and passive sampling methods. Sci. Total Environ. 2020, 137905. [Google Scholar] [CrossRef]
  19. López-González, N.; Borrego, J.; Morales, J.; Carro, B.; Lozano-Soria, O. Metal fractionation in oxic sediments of an estuary affected by acid mine drainage (south-western Spain). Estuar. Coast. Shelf Sci. 2006, 68, 297–304. [Google Scholar] [CrossRef]
  20. Usero, J.; Izquierdo, C.; Morillo, J.; Gracia, I. Heavy metals in fish (Solea vulgaris, Anguilla anguilla and Liza aurata) from salt marshes on the southern Atlantic coast of Spain. Environ. Int. 2004, 29, 949–956. [Google Scholar] [CrossRef]
  21. Vicente-Martorell, J.J.; Galindo-Riaño, M.D.; García-Vargas, M.; Granado-Castro, M.D. Bioavailability of heavy metals monitoring water, sediments and fish species from a polluted estuary. J. Hazard. Mater. 2009, 162, 823–836. [Google Scholar] [CrossRef] [PubMed]
  22. Van Geen, A.; Adkins, J.; Boyle, E.; Nelson, C.; Palanques, A. A 120-yr record of widespread contamination from mining of the Iberian pyrite belt. Geology 1997, 25, 291–294. [Google Scholar] [CrossRef]
  23. Baconnais, I.; Rouxel, O.; Dulaquais, G.; Boye, M. Determination of the copper isotope composition of seawater revisited: A case study from the Mediterranean Sea. Chem. Geol. 2019, 511, 465–480. [Google Scholar] [CrossRef] [Green Version]
  24. Koehnken, L. Mount Lyell remediation research and demonstration program-final report. Superv. Sci. Rep. 1997, 126, 104. [Google Scholar]
  25. Fergusson, L. A 12-month field trial to remediate an exposed “Tailings Beach” in Tasmania. Resour. Environ. 2014, 4, 238–245. [Google Scholar] [CrossRef]
  26. Tornos, F. Environment of formation and styles of volcanogenic massive sulfides: The Iberian pyrite belt. Ore Geol. Rev. 2006, 28, 259–307. [Google Scholar] [CrossRef]
  27. Essalhi, M.; Sizaret, S.; Barbanson, L.; Chen, Y.; Lagroix, F.; Demory, F.; Nieto, J.M.; Saez, R.; Capitan, M.A. A case study of the internal structures of gossans and weathering processes in the Iberian Pyrite Belt using magnetic fabrics and paleomagnetic dating. Miner. Depos. 2011, 46, 981–999. [Google Scholar] [CrossRef] [Green Version]
  28. Amils, R. Lessons learned from thirty years of geomicrobiological studies of Río Tinto. Res. Microbiol. 2016, 167, 539–545. [Google Scholar] [CrossRef]
  29. Sánchez España, J.; Pamo, E.L.; Santofimia, E.; Aduvire, O.; Reyes, J.; Barettino, D. Acid mine drainage in the Iberian Pyrite Belt (Odiel river watershed, Huelva, SW Spain): Geochemistry, mineralogy and environmental implications. Appl. Geochem. 2005, 20, 1320–1356. [Google Scholar] [CrossRef]
  30. Sarmiento, A.M.; Nieto, J.M.; Olías, M.; Cánovas, C.R. Hydrochemical characteristics and seasonal influence on the pollution by acid mine drainage in the Odiel river Basin (SW Spain). Appl. Geochem. 2009, 24, 697–714. [Google Scholar] [CrossRef]
  31. Olías, M.; Nieto, J.M.; Sarmiento, A.M.; Cánovas, C.R.; Galván, L. Water quality in the future Alcolea reservoir (Odiel River, SW Spain): A clear example of the inappropriate management of water resources in Spain. Water Resour. Manag. 2011, 25, 201–215. [Google Scholar] [CrossRef]
  32. Cánovas, C.R.; Olías, M.; Nieto, J.M. Metal (loid) attenuation processes in an extremely acidic river: The Rio Tinto (SW Spain). Water Air Soil Pollut. 2014, 225, 1795. [Google Scholar] [CrossRef]
  33. Ferris, F.; Hallbeck, L.; Kennedy, C.; Pedersen, K. Geochemistry of acidic Rio Tinto headwaters and role of bacteria in solid phase metal partitioning. Chem. Geol. 2004, 212, 291–300. [Google Scholar] [CrossRef]
  34. Cánovas, C.; Hubbard, C.; Olías, M.; Nieto, J.; Black, S.; Coleman, M.L. Hydrochemical variations and contaminant load in the Río Tinto (Spain) during flood events. J. Hydrol. 2008, 350, 25–40. [Google Scholar] [CrossRef]
  35. Nordstrom, D.; Wilde, F. Reduction–oxidation potential (electrode method). In National Field Manual for the Collection of Water Quality Data; Book 9, Chapter 6.5; US Geological Survey Techniques of Water-Resources Investigations; US Geological Survey: Reston, VA, USA, 1998; 20p. [Google Scholar]
  36. Walling, D.; Webb, B. Estimating the discharge of contaminants to coastal waters by rivers: Some cautionary comments. Mar. Pollut. Bull. 1985, 16, 488–492. [Google Scholar] [CrossRef]
  37. Quilbé, R.; Rousseau, A.N.; Duchemin, M.; Poulin, A.; Gangbazo, G.; Villeneuve, J.-P. Selecting a calculation method to estimate sediment and nutrient loads in streams: Application to the Beaurivage River (Québec, Canada). J. Hydrol. 2006, 326, 295–310. [Google Scholar] [CrossRef]
  38. Parkhurst, D.L.; Appelo, C. Description of Input and Examples for PHREEQC Version 3: A Computer Program for Speciation, Batch-Reaction, One-Dimensional Transport, and Inverse Geochemical Calculations; US Geological Survey: Reston, VA, USA, 2013; pp. 2328–7055.
  39. Allison, J.D.; Brown, D.S.; Novo-Gradac, K.J. MINTEQA2/PRODEFA2, A Geochemical Assessment Model for Environmental Systems: Version 3.0 User’s Manual; Environmental Research Laboratory Office of Research and Development; U.S. Environmental Protection Agency: Athens, GA, USA, 1991.
  40. Bigham, J.; Schwertmann, U.; Traina, S.; Winland, R.; Wolf, M. Schwertmannite and the chemical modeling of iron in acid sulfate waters. Geochim. Cosmochim. Acta 1996, 60, 2111–2121. [Google Scholar] [CrossRef]
  41. Yu, J.-Y.; Heo, B.; Choi, I.-K.; Cho, J.-P.; Chang, H.-W. Apparent solubilities of schwertmannite and ferrihydrite in natural stream waters polluted by mine drainage. Geochim. Cosmochim. Acta 1999, 63, 3407–3416. [Google Scholar] [CrossRef]
  42. Elghali, A.; Benzaazoua, M.; Bussière, B.; Genty, T. Spatial mapping of acidity and geochemical properties of oxidized tailings within the former Eagle/Telbel mine site. Minerals 2019, 9, 180. [Google Scholar] [CrossRef] [Green Version]
  43. Dmitrijeva, M.; Cook, N.J.; Ehrig, K.; Ciobanu, C.L.; Metcalfe, A.V.; Kamenetsky, M.; Kamenetsky, V.S.; Gilbert, S. Multivariate statistical analysis of trace elements in pyrite: Prediction, bias and artefacts in defining mineral signatures. Minerals 2020, 10, 61. [Google Scholar] [CrossRef] [Green Version]
  44. Cánovas, C.; Olías, M.; Nieto, J.; Galván, L. Wash-out processes of evaporitic sulfate salts in the Tinto river: Hydrogeochemical evolution and environmental impact. Appl. Geochem. 2010, 25, 288–301. [Google Scholar] [CrossRef]
  45. Valente, T.M.; Gomes, C.L. Occurrence, properties and pollution potential of environmental minerals in acid mine drainage. Sci. Total Environ. 2009, 407, 1135–1152. [Google Scholar] [CrossRef] [Green Version]
  46. Carbone, C.; Dinelli, E.; Marescotti, P.; Gasparotto, G.; Lucchetti, G. The role of AMD secondary minerals in controlling environmental pollution: Indications from bulk leaching tests. J. Geochem. Explor. 2013, 132, 188–200. [Google Scholar] [CrossRef]
  47. Casiot, C.; Morin, G.; Juillot, F.; Bruneel, O.; Personné, J.C.; Leblanc, M.; Duquesne, K.; Bonnefoy, V.; Elbaz-Poulichet, F. Bacterial immobilization and oxidation of arsenic in acid mine drainage (Carnoulès creek, France). Water Res. 2003, 37, 2929–2936. [Google Scholar] [CrossRef]
  48. Fukushi, K.; Sasaki, M.; Sato, T.; Yanase, N.; Amano, H.; Ikeda, H. A natural attenuation of arsenic in drainage from an abandoned mine dump. Appl. Geochem. 2003, 18, 1267–1278. [Google Scholar] [CrossRef]
  49. Olías, M.; Riera, J.; Galván, L.; Cánovas, C.R.; Pérez-López, R.; Macías, F.; Sarmiento, A.M.; Cruz, P.; Carrero, S.; Bonnail, E.; et al. Obtención de los parámetros hidrodinámicos en un tramo del río Odiel (Huelva) mediante un ensayo de trazadores. In Proceedings of the IX Simposio sobre el Agua en Andalucía, Málaga, Spain, 4–6 November 2015; pp. 1123–1133. [Google Scholar]
  50. Hubbard, C.G.; Black, S.; Coleman, M.L. Aqueous geochemistry and oxygen isotope compositions of acid mine drainage from the Río Tinto, SW Spain, highlight inconsistencies in current models. Chem. Geol. 2009, 265, 321–334. [Google Scholar] [CrossRef]
  51. Byrne, P.; Reid, I.; Wood, P.J. Stormflow hydrochemistry of a river draining an abandoned metal mine: The Afon Twymyn, central Wales. Environ. Monit. Assess. 2013, 185, 2817–2832. [Google Scholar] [CrossRef]
  52. Alpers, C.N.; Nordstrom, D.K.; Thompson, J.M. Seasonal variations of Zn/Cu ratios in acid mine water from Iron Mountain, California. In Environmental Geochemistry of Sulfide Oxidation; Alpers, C.N., Blowes, D.W., Eds.; American Chemical Society: New York, NY, USA, 1994; pp. 324–344. [Google Scholar]
  53. Runkel, R.L.; Kimball, B.A.; Nimick, D.A.; Walton-Day, K. Effects of flow regime on metal concentrations and the attainment of water quality standards in a remediated stream reach, Butte, Montana. Environ. Sci. Technol. 2016, 50, 12641–12649. [Google Scholar] [CrossRef]
  54. Accornero, M.; Marini, L.; Ottonello, G.; Zuccolini, M.V. The fate of major constituents and chromium and other trace elements when acid waters from the derelict Libiola mine (Italy) are mixed with stream waters. Appl. Geochem. 2005, 20, 1368–1390. [Google Scholar] [CrossRef]
  55. Regenspurg, S.; Peiffer, S. Arsenate and chromate incorporation in schwertmannite. Appl. Geochem. 2005, 20, 1226–1239. [Google Scholar] [CrossRef]
  56. Choppala, G.; Burton, E.D. Chromium (III) substitution inhibits the Fe (II)-accelerated transformation of schwertmannite. PLoS ONE 2018, 13, e0208355. [Google Scholar] [CrossRef] [PubMed] [Green Version]
  57. Abramov, S.M.; Tejada, J.; Grimm, L.; Schädler, F.; Bulaev, A.; Tomaszewski, E.J.; Byrne, J.M.; Straub, D.; Thorwarth, H.; Amils, R. Role of biogenic Fe (III) minerals as a sink and carrier of heavy metals in the Rio Tinto, Spain. Sci. Total Environ. 2020, 718, 137294. [Google Scholar] [CrossRef] [PubMed]
  58. Cánovas, C.R.; Olias, M.; Vazquez-Suñé, E.; Ayora, C.; Nieto, J.M. Influence of releases from a fresh water reservoir on the hydrochemistry of the Tinto River (SW Spain). Sci. Total Environ. 2012, 416, 418–428. [Google Scholar] [CrossRef] [PubMed]
  59. Younger, P.L. The longevity of minewater pollution: A basis for decision-making. Sci. Total Environ. 1997, 194, 457–466. [Google Scholar] [CrossRef]
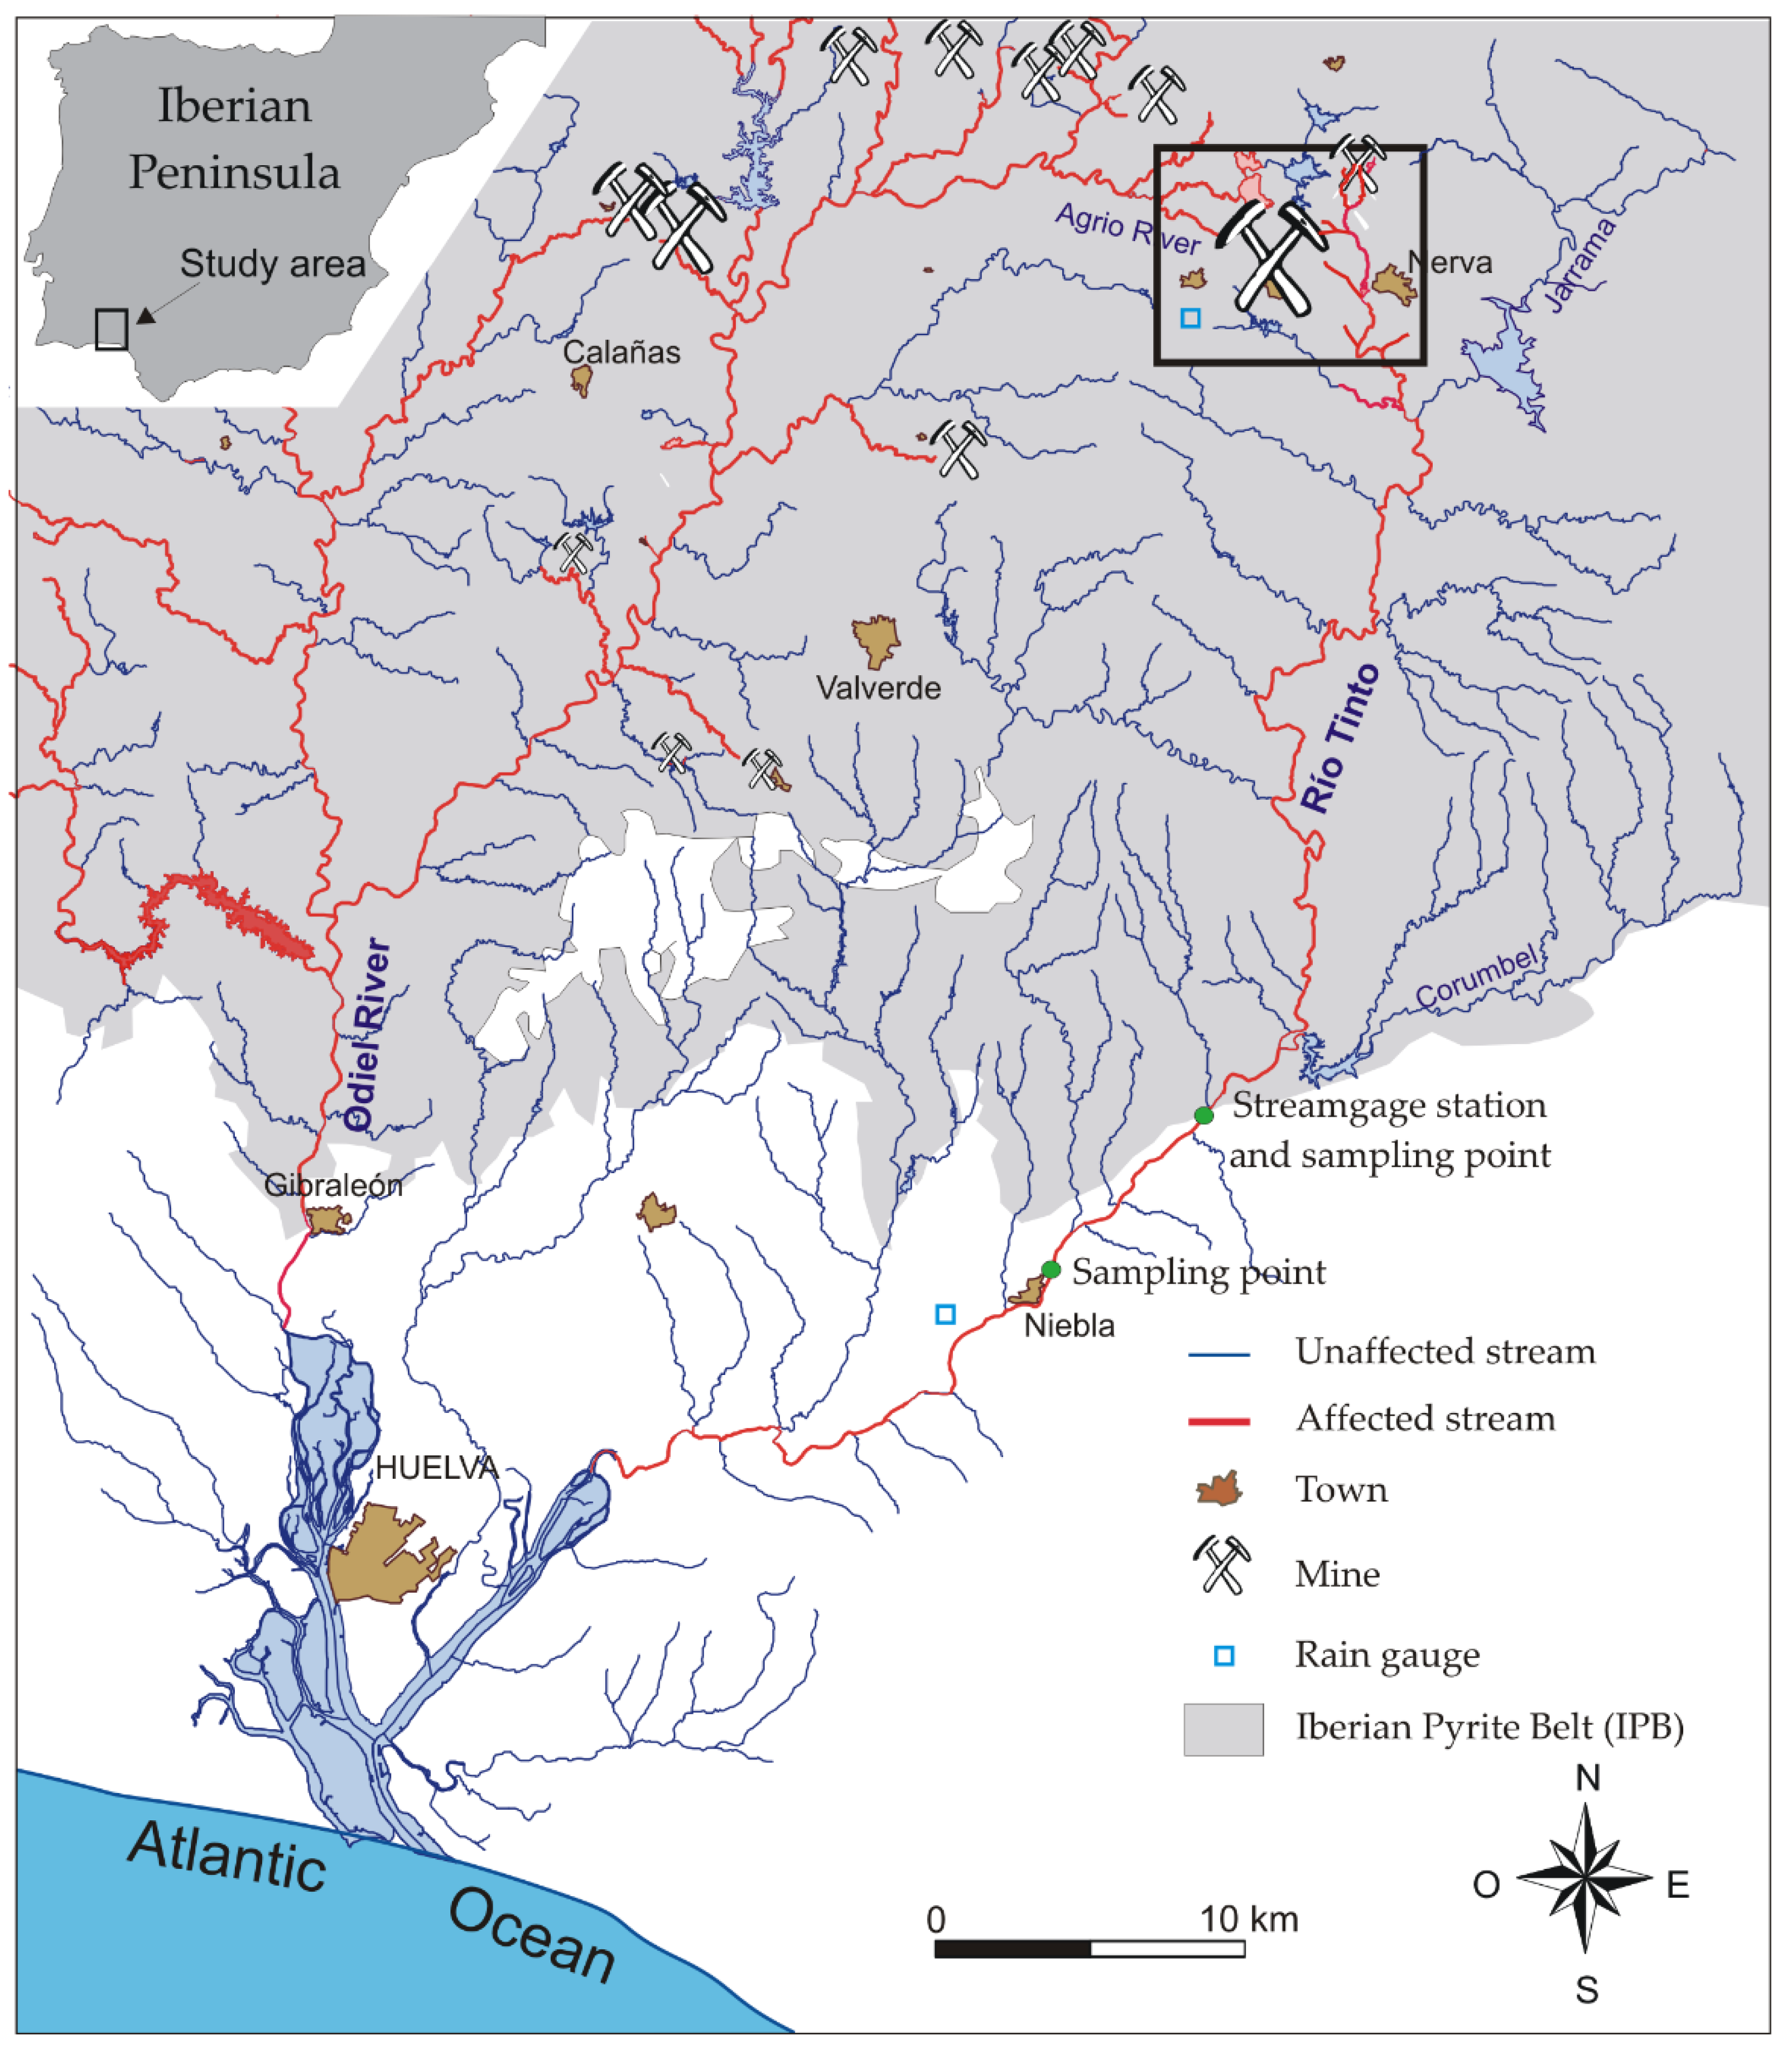
Figure 1. Map of Río Tinto drainage network. The inner rectangle indicates the area shown in Figure 2. The size of the mine symbol (crossed hammers) is proportional to the amount of ore extracted.
Minerals 10 00598 g001
Figure 2. Detailed map of Río Tinto mining district.
Minerals 10 00598 g002
Figure 3. Evolution of pH, electrical conductivity (EC), and streamflow during 2017/18.
Minerals 10 00598 g003
Figure 4. Evolution of dissolved Fe, As, Cr, Cu, Al, and Pb in 2017/18.
Minerals 10 00598 g004
Figure 5. (A) Evolution of Fe/SO4 ratio in 2017/18 and (B) relationship between As concentration and Fe/SO4 ratio.
Minerals 10 00598 g005
Figure 6. Relationships between streamflow (Q) and dissolved concentrations of As, Cd, Fe, and Pb.
Minerals 10 00598 g006
Figure 7. PCA of the analytical data and streamflow (Q). Only variables with a distinguishable position are identified.
Minerals 10 00598 g007
Figure 8. Percentages of the monthly distribution of the pollutant load in 2017/18. The water contribution percentage is also shown for comparison.
Minerals 10 00598 g008
Figure 9. Evolution of pH and EC from 1968 to 2019.
Minerals 10 00598 g009
Table 1. Basic statistic of physicochemical parameters and dissolved concentrations for the hydrological year 2017/18.
StatisticpHECEhAlCaCuFeKMgMnNa
mS/cmmVmg/Lmg/Lmg/Lmg/Lmg/Lmg/Lmg/Lmg/L
Mean2.743.5474016663293771.61781634
Median2.702.217306525151451.3675.318
25th percentile2.471.0266518134.1261.0201.511
75th percentile3.024.98794209100406741.92502250
Min.2.120.385364.68.81.30.3<0.59.20.67.4
Max.4.2211.4289274021911515299.173166310
StatisticSO4SiZnAsBaCdCoCrNiPbSr
mg/Lmg/Lmg/Lμg/Lμg/Lμg/Lμg/Lμg/Lμg/Lμg/Lμg/L
Mean288819453741514489042218166159
Median11237.2163313514129.36511063
25th percentile3475.04.45.18.4141012.3197137
75th percentile4221246234417187129472340205223
Min.1242.91.20.3<15.134<0.26.81925
Max.12,15696205330954739533222510651068708
Table 2. Median value of the percentage of dissolved over total concentration.
MedianElement/Compound
>98%Al, Ca, Cd, Co, Cu, Mg, Mn, Na, Ni, SO4, Sr, Zn
90‒98%K, Si
70‒90%Cr, Pb
50‒70%Fe
30‒50%Ba
<10%As
Table 3. Dissolved pollutant load obtained for 2017/18.
ElementTonsElementTons
Al2593Fe4963
As3.6Mn234
Cd2.1Ni3.0
Co15Pb15
Cr0.44SO449,420
Cu556Zn683
Table 4. Basic statistics on pH and EC (1968‒2019) and dissolved concentrations for some elements (1980‒2019).
StatisticpHECCu FeMnSO4ZnAsCdPb
mS/cmmg/Lmg/Lmg/Lmg/Lmg/Lμg/Lμg/Lμg/L
Mean2.63.528413132801631153278205
Median2.53.020219919463990160120
25th percentile2.42.0121075107618168274
75th percentile2.74.63149115351170550290207
Min.1.70.20.020.020.09580.02<dl<dl<dl
Max.6.815365508011325,25673050,00053401630