Article

Ore Genesis of the Kuergasheng Pb–Zn Deposit, Xinjiang Province, Northwest China: Constraints from Geology, Fluid Inclusions, and H–O–C–S–Pb Isotopes

1
Xinjiang Key Laboratory for Geodynamic Processes and Metallogenic Prognosis of the Central Asian Orogenic Belt, College of Geology and Mining Engineering, Xinjiang University, Urumqi 830047, China
2
College of Earth Sciences, Jilin University, Changchun 130061, China
*
Author to whom correspondence should be addressed.
Minerals 2020, 10(7), 592; https://doi.org/10.3390/min10070592
Submission received: 12 June 2020 / Revised: 29 June 2020 / Accepted: 29 June 2020 / Published: 30 June 2020
(This article belongs to the Special Issue Ore Genesis and Metamorphism: Geochemistry, Mineralogy, and Isotopes)

Abstract

:
The Kuergasheng Pb–Zn deposit is located in the Western Tianshan Orogen, Xinjiang Province, China. The ore bodies are mainly hosted in sandstone of the Tuosikuertawu Formation and are controlled by NW-trending faults. Three paragenetic stages were identified: early pyrite–chalcopyrite–quartz veins (stage 1), middle galena–sphalerite–quartz veins (stage 2), and late sulfide-poor calcite–quartz veins (stage 3). Fluid inclusions (FIs) include liquid-rich aqueous (LV-type), vapor-rich aqueous (VL-type), halite-bearing (S-type), and monophase liquid aqueous (L-type). Homogenization temperatures for FIs from stages 1–3 are 221–251, 173–220, and 145–172 °C, respectively. Stage 1 fluids in LV-, VL-, and S-type FIs yield salinities of 6.2–9.6, 1.7–3.1, and 32.7–34.9 wt % NaCl equiv., respectively. Stage 2 fluids in LV- and S-type FIs have salinities of 5.1–7.9 and 31.9–32.1 wt % NaCl equiv., respectively. Stage 3 fluids in LV- and L-type FIs have salinities of 3.4–5.9 wt % NaCl equiv. Oxygen, hydrogen, and carbon isotopic data (δ18OH2O = −7.7 to 1.7‰, δDH2O = −99.2 to −83.1‰, δ13CH2O = −16.6 to 9.1‰) indicate that the ore-forming fluids have a hybrid origin —an initial magmatic source with input of meteoric water becoming dominant in the later stage. Sulfur and lead isotopic data for galena (δ34S = 5.6 to 6.9‰, 206Pb/204Pb = 18.002–18.273, 207Pb/204Pb = 15.598–15.643, 208Pb/204Pb = 38.097–38.209) reveal that the ore-forming materials were mainly derived from the Beidabate intrusive body and the Tuosikuertawu Formation.

1. Introduction

The Western Tianshan Orogen (WTO) is located at the southwestern margin of the Central Asian Orogenic Belt (CAOB), which represents the largest tectonic assembly of accretionary complexes in the world [1,2,3,4]. The WTO is more than 2500 km long and extends westward from the Xinjiang of China, to Kazakhstan, Kyrgyzstan, Tajikistan, and ends in Uzbekistan [5,6,7] (Figure 1A). Pb–Zn deposits are one of the most economically interesting mineral resources of the WTO. The formation of various types of Pb–Zn deposits is consistent with the process of regional tectonic evolution, which could be divided roughly into four stages [8,9,10,11,12,13]. (1) Sedimentary exhalative-type Pb–Zn deposits formed in the rift basin of an active continental margin in the Precambrian, such as the Tekeli and Tuokesai deposits; (2) Porphyry–skarn–epithermal-type Pb–Zn deposits formed under subduction–accretion of oceanic crust in the Paleozoic, such as the Kurgshinkan and Kuergasheng deposits; (3) Mississippi Valley-type Pb–Zn deposits formed in a collisional–orogenic environment during the Late Paleozoic, such as the Huoshibulake and Salitashi deposits; (4) Sandstone-type Pb–Zn deposits formed in a downwarped basin during the Mesozoic and Cenozoic, such as the Wulagen deposit.
The Kuergasheng Pb–Zn deposit is located in the Sayram Lake area of the WTO (Figure 1B). The deposit was discovered by the Xinjiang Nonferrous Geological Exploration Bureau (XNGEB) during regional geochemical exploration in 1985, and was prospected and evaluated in detail in 1991. Since the establishment of the Kuergasheng mine, the deposit has proven reserves of 288, 800 t Pb and 187, 800 t Zn, with an average grade of 2.81% Pb and 3.05% Zn. Previous studies of this deposit have focused on geological features, as well as geophysical and geochemical exploration [14,15,16,17]. However, most of the literature is in Chinese, and reported data are very limited. The ore-forming fluid studies available are comparatively weak and lack systematic investigations regarding petrography and paragenesis. The evolution process of the ore-forming fluids, the source of ore-forming materials, and the genetic model of the deposit remain poorly understood.
This study is based on fieldwork, focused on geology, mineral assemblages, and ore-forming fluids. Fluid inclusion (FI) petrography and microthermometry were used to determine the phase ratios, compositions, and trapping temperatures of the ore-forming fluids. New H–O–C–S–Pb isotope data obtained have shed light on the source of ore-forming fluids and materials, allowing us to propose a model for the formation of the Kuergasheng deposit.

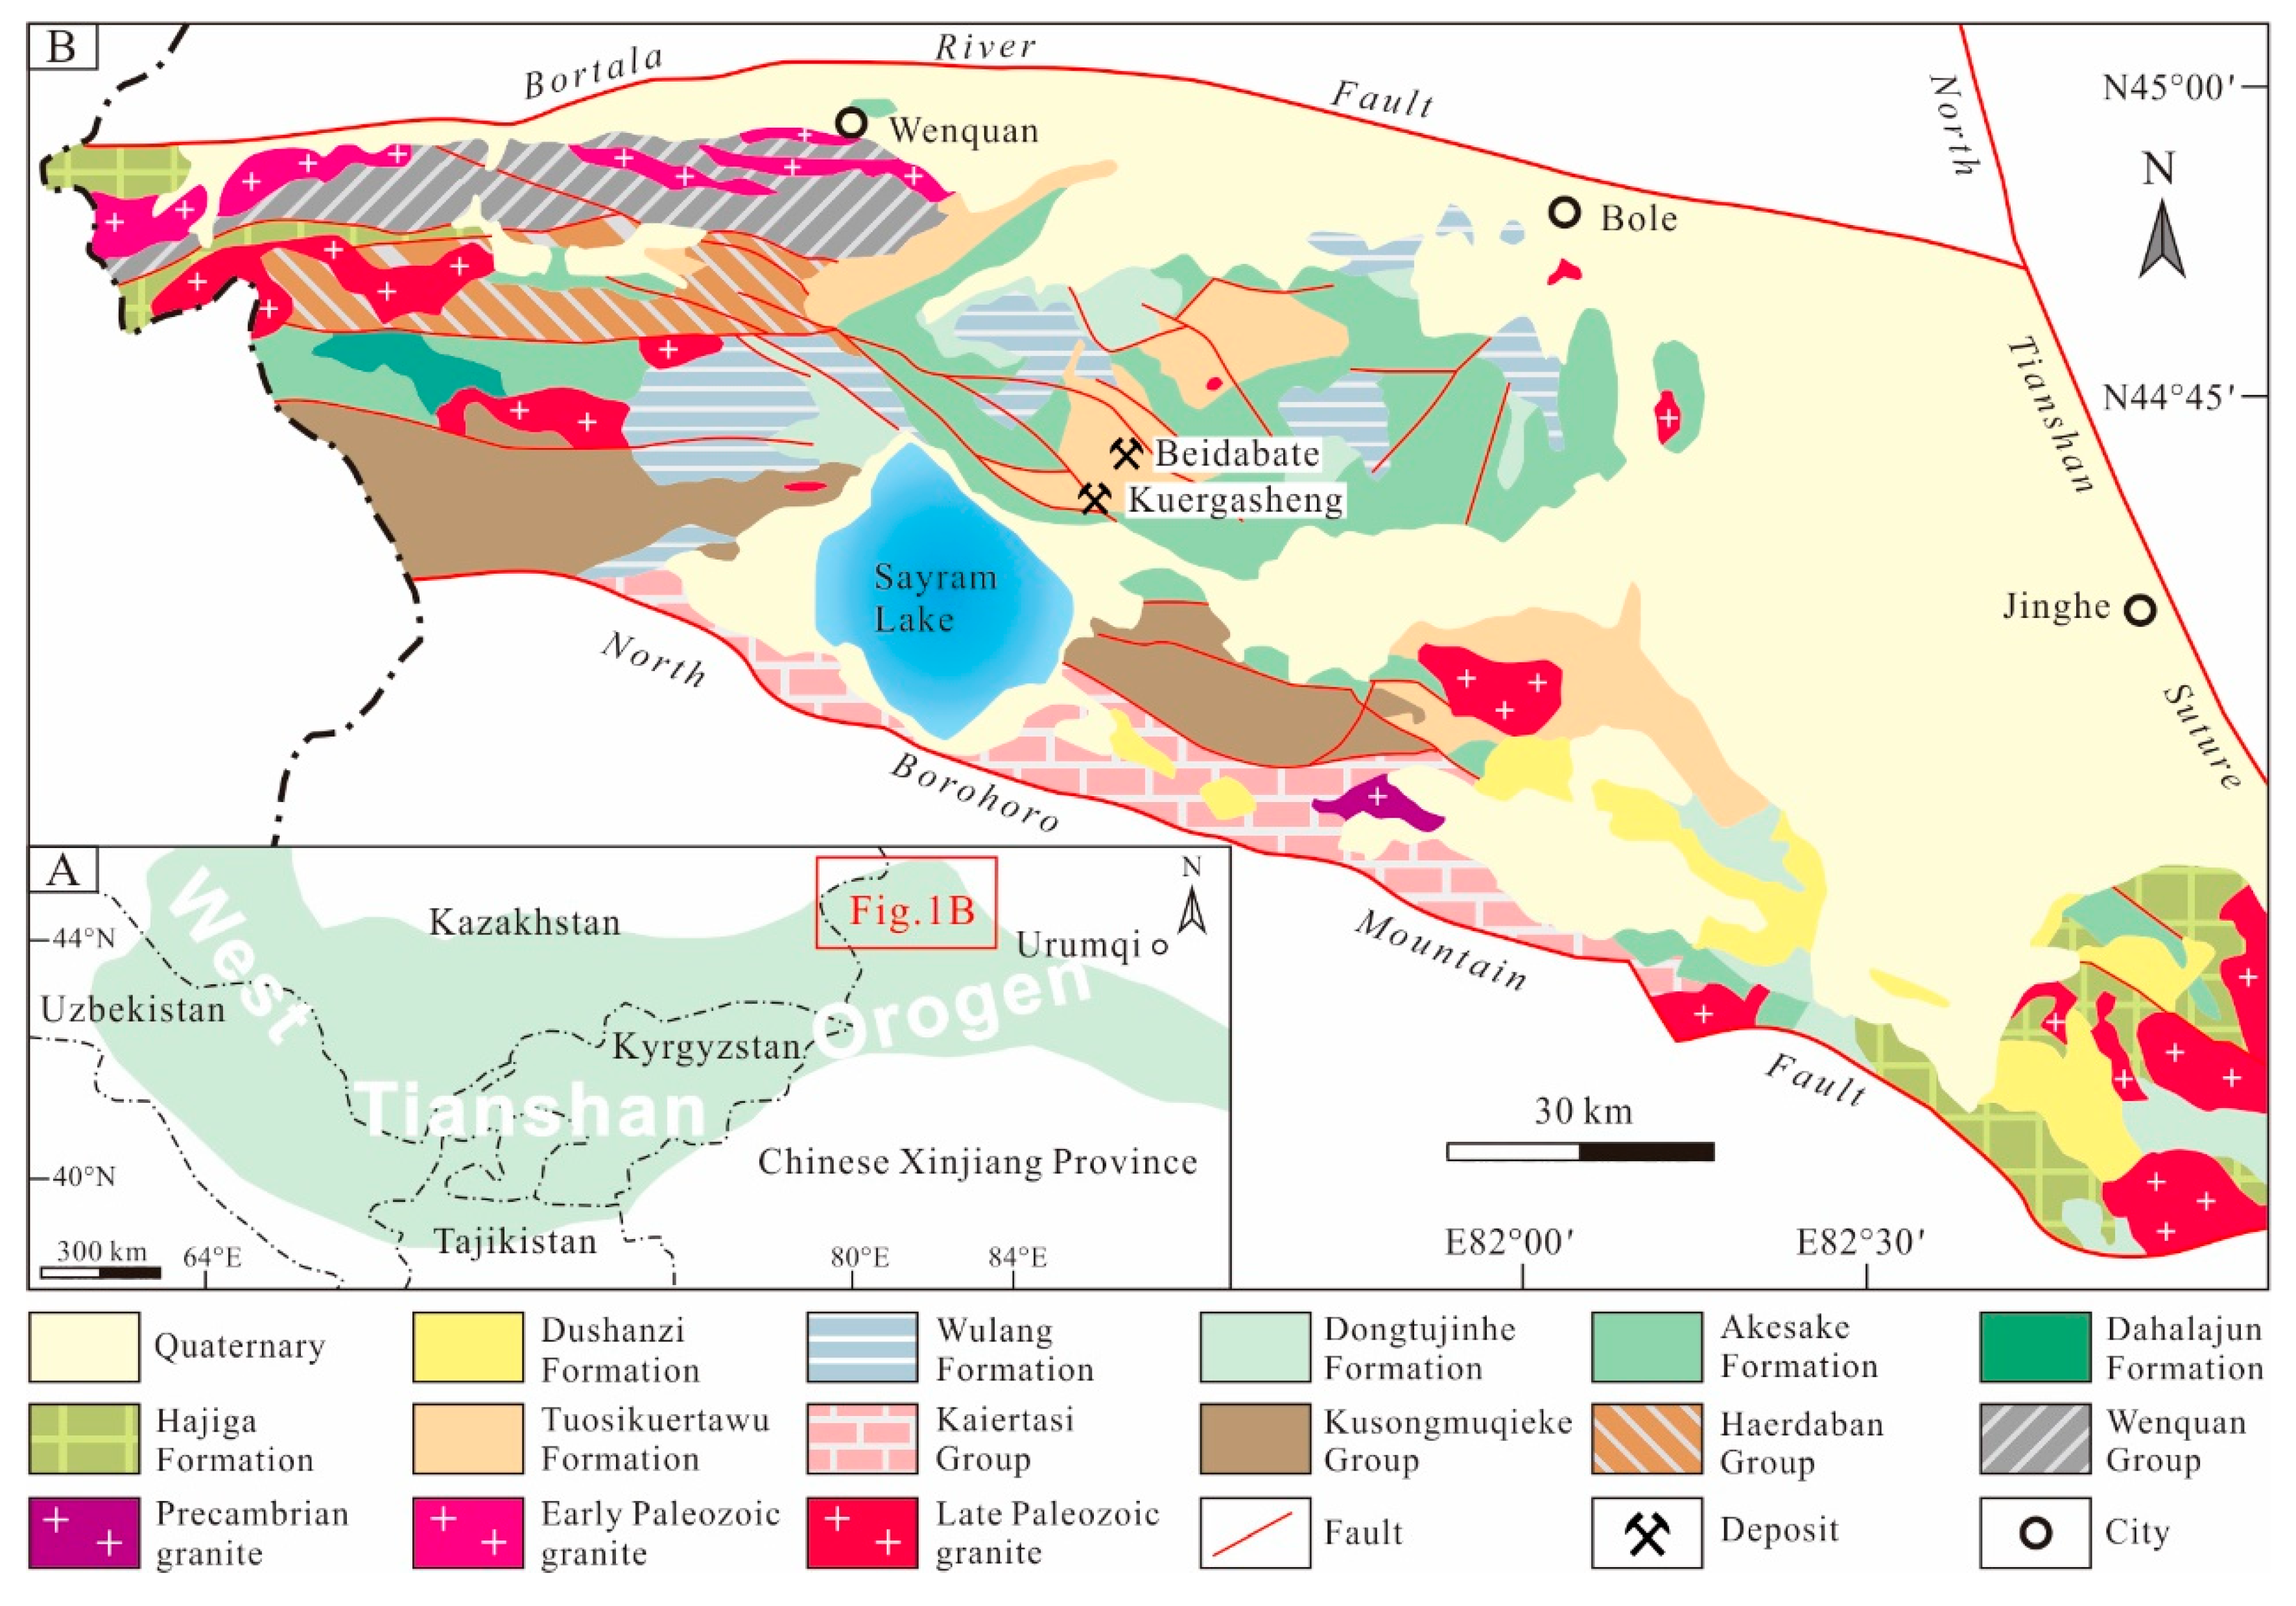
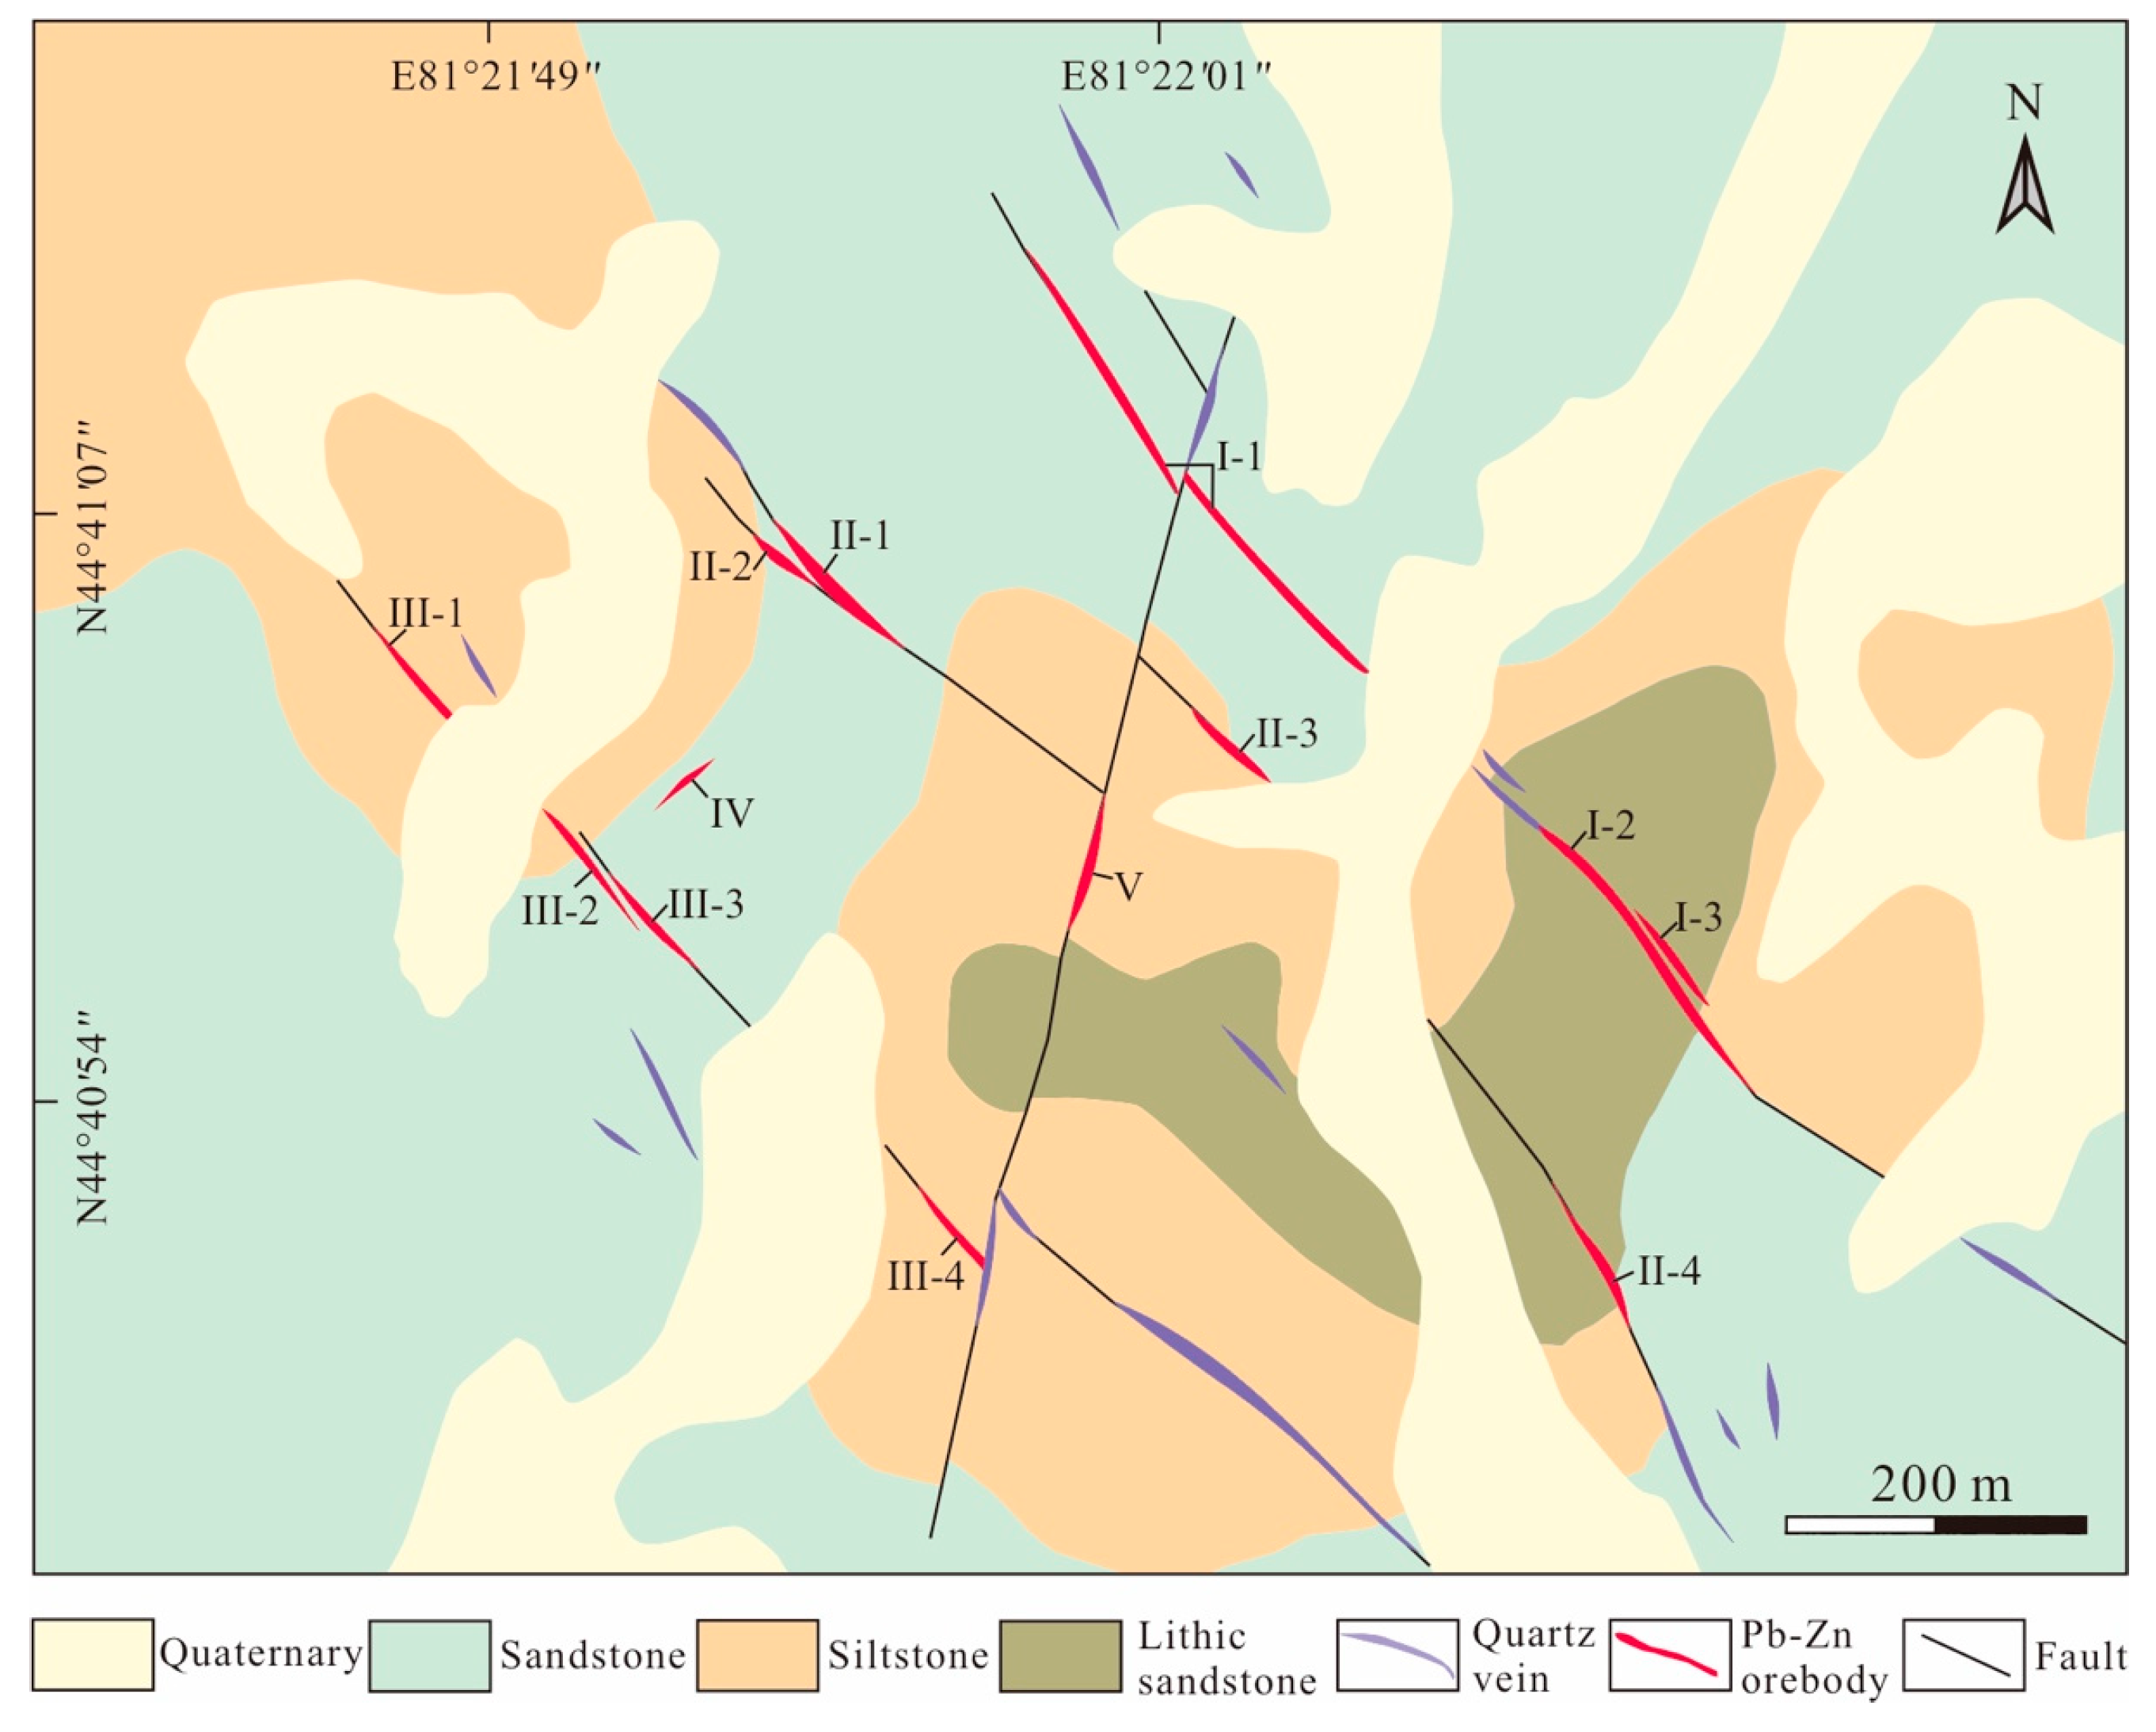
2. Regional and Deposit Geology

The Sayram Lake area is located on the western edge of the Chinese WTO, bounded by the Bortala River Fault, the North Borohoro Mountain Fault, and the North Tianshan Suture to the north, south, and east, respectively (Figure 1B). The rocks exposed in this area include an assemblage of Proterozoic, Paleozoic, and Cenozoic units, described as follows. The lower Proterozoic Wenquan Group is a set of metamorphic rocks composed of schist, gneiss, and granulite with interlayered marble [18]. The middle Proterozoic Haerdaban Group is composed of low-grade metamorphic clastic rocks with carbonate rocks. The middle Proterozoic Kusongmuqieke Group is composed of neritic facies carbonate rocks with minor sand. The upper Proterozoic Kaiertasi Group is dominated by carbonate rocks. The Middle Devonian Hanjiga Formation is composed of neritic facies calcareous clastic rocks with carbonate and volcanic rocks. The Lower Carboniferous Dahalajunshan Formation is composed of volcanic and pyroclastic rocks, with minor clastic and carbonate rocks. The Upper Devonian Tuosikuertawu Formation is composed of paralic facies clastic rocks with minor volcanic rocks. The Lower Carboniferous Akesake Formation is composed of neritic shelf facies carbonate rocks and terrigenous clastic rocks. The Lower Carboniferous Dongtujinhe Formation is composed of bioclastic limestone and acidic pyroclastic rocks. The Lower Permian Wulang Formation is mainly composed of andesite, rhyolite, sandstone, and tuff. The Neogene Dushazi Formation is composed of mudstone, sandstone, and conglomerate. All these units are partially covered by unconsolidated Quaternary sediments. Precambrian granite has limited exposure. Minor early Paleozoic granites were discovered in the Wenquan area, containing biotite monzodiorite, granodiorite, and diorite. Late Paleozoic granites are widespread and consist of granodiorite, monzogranite, granite porphyry, and rhyolite porphyry, many of which are associated with polymetallic mineralization.
The Kuergasheng Pb–Zn deposit (lat. 44°41′ N, long. 81°22′ E) is located to the northeast of Sayram Lake, approximately 70 km north of the city of Wenquan, and covers an area of about 1.4 km2. The strata exposed in the deposit mainly correspond to the Upper Devonian Tuosikuertawu Formation together with Quaternary sediments (Figure 2). The Tuosikuertawu Formation strikes approximately EW, dips 40–60° to the south, and is divided into three lithologic members: (1) a lower lithology of gray–brown lithic sandstone; (2) a middle lithology of steel gray siltstone; and (3) an upper lithology of brown–yellow medium–coarse sandstone with interlayered siltstone. These rock units are partially covered by Quaternary clay and grit. The dominant structures are NW–SE trending faults, along with secondary NE–SW trending faults. The NW–SE trending faults span 200–700 m and mainly dip SW with a dipping angle of 70–90°. NE–SW trending faults with a subvertical dip crosscut the NW–SW trending faults, and ore bodies are mainly present within the former. Igneous rocks are absent in the mining area. It is worth noting that the Beidabate intrusive body is located 7 km northeast of the Kuergasheng deposit. The Beidabate intrusive body has zircon U–Pb ages of 316–289 Ma [19,20]. It consists of granite porphyry and rhyolite porphyry, and comprises the Beidabate Cu–Mo porphyry deposit.

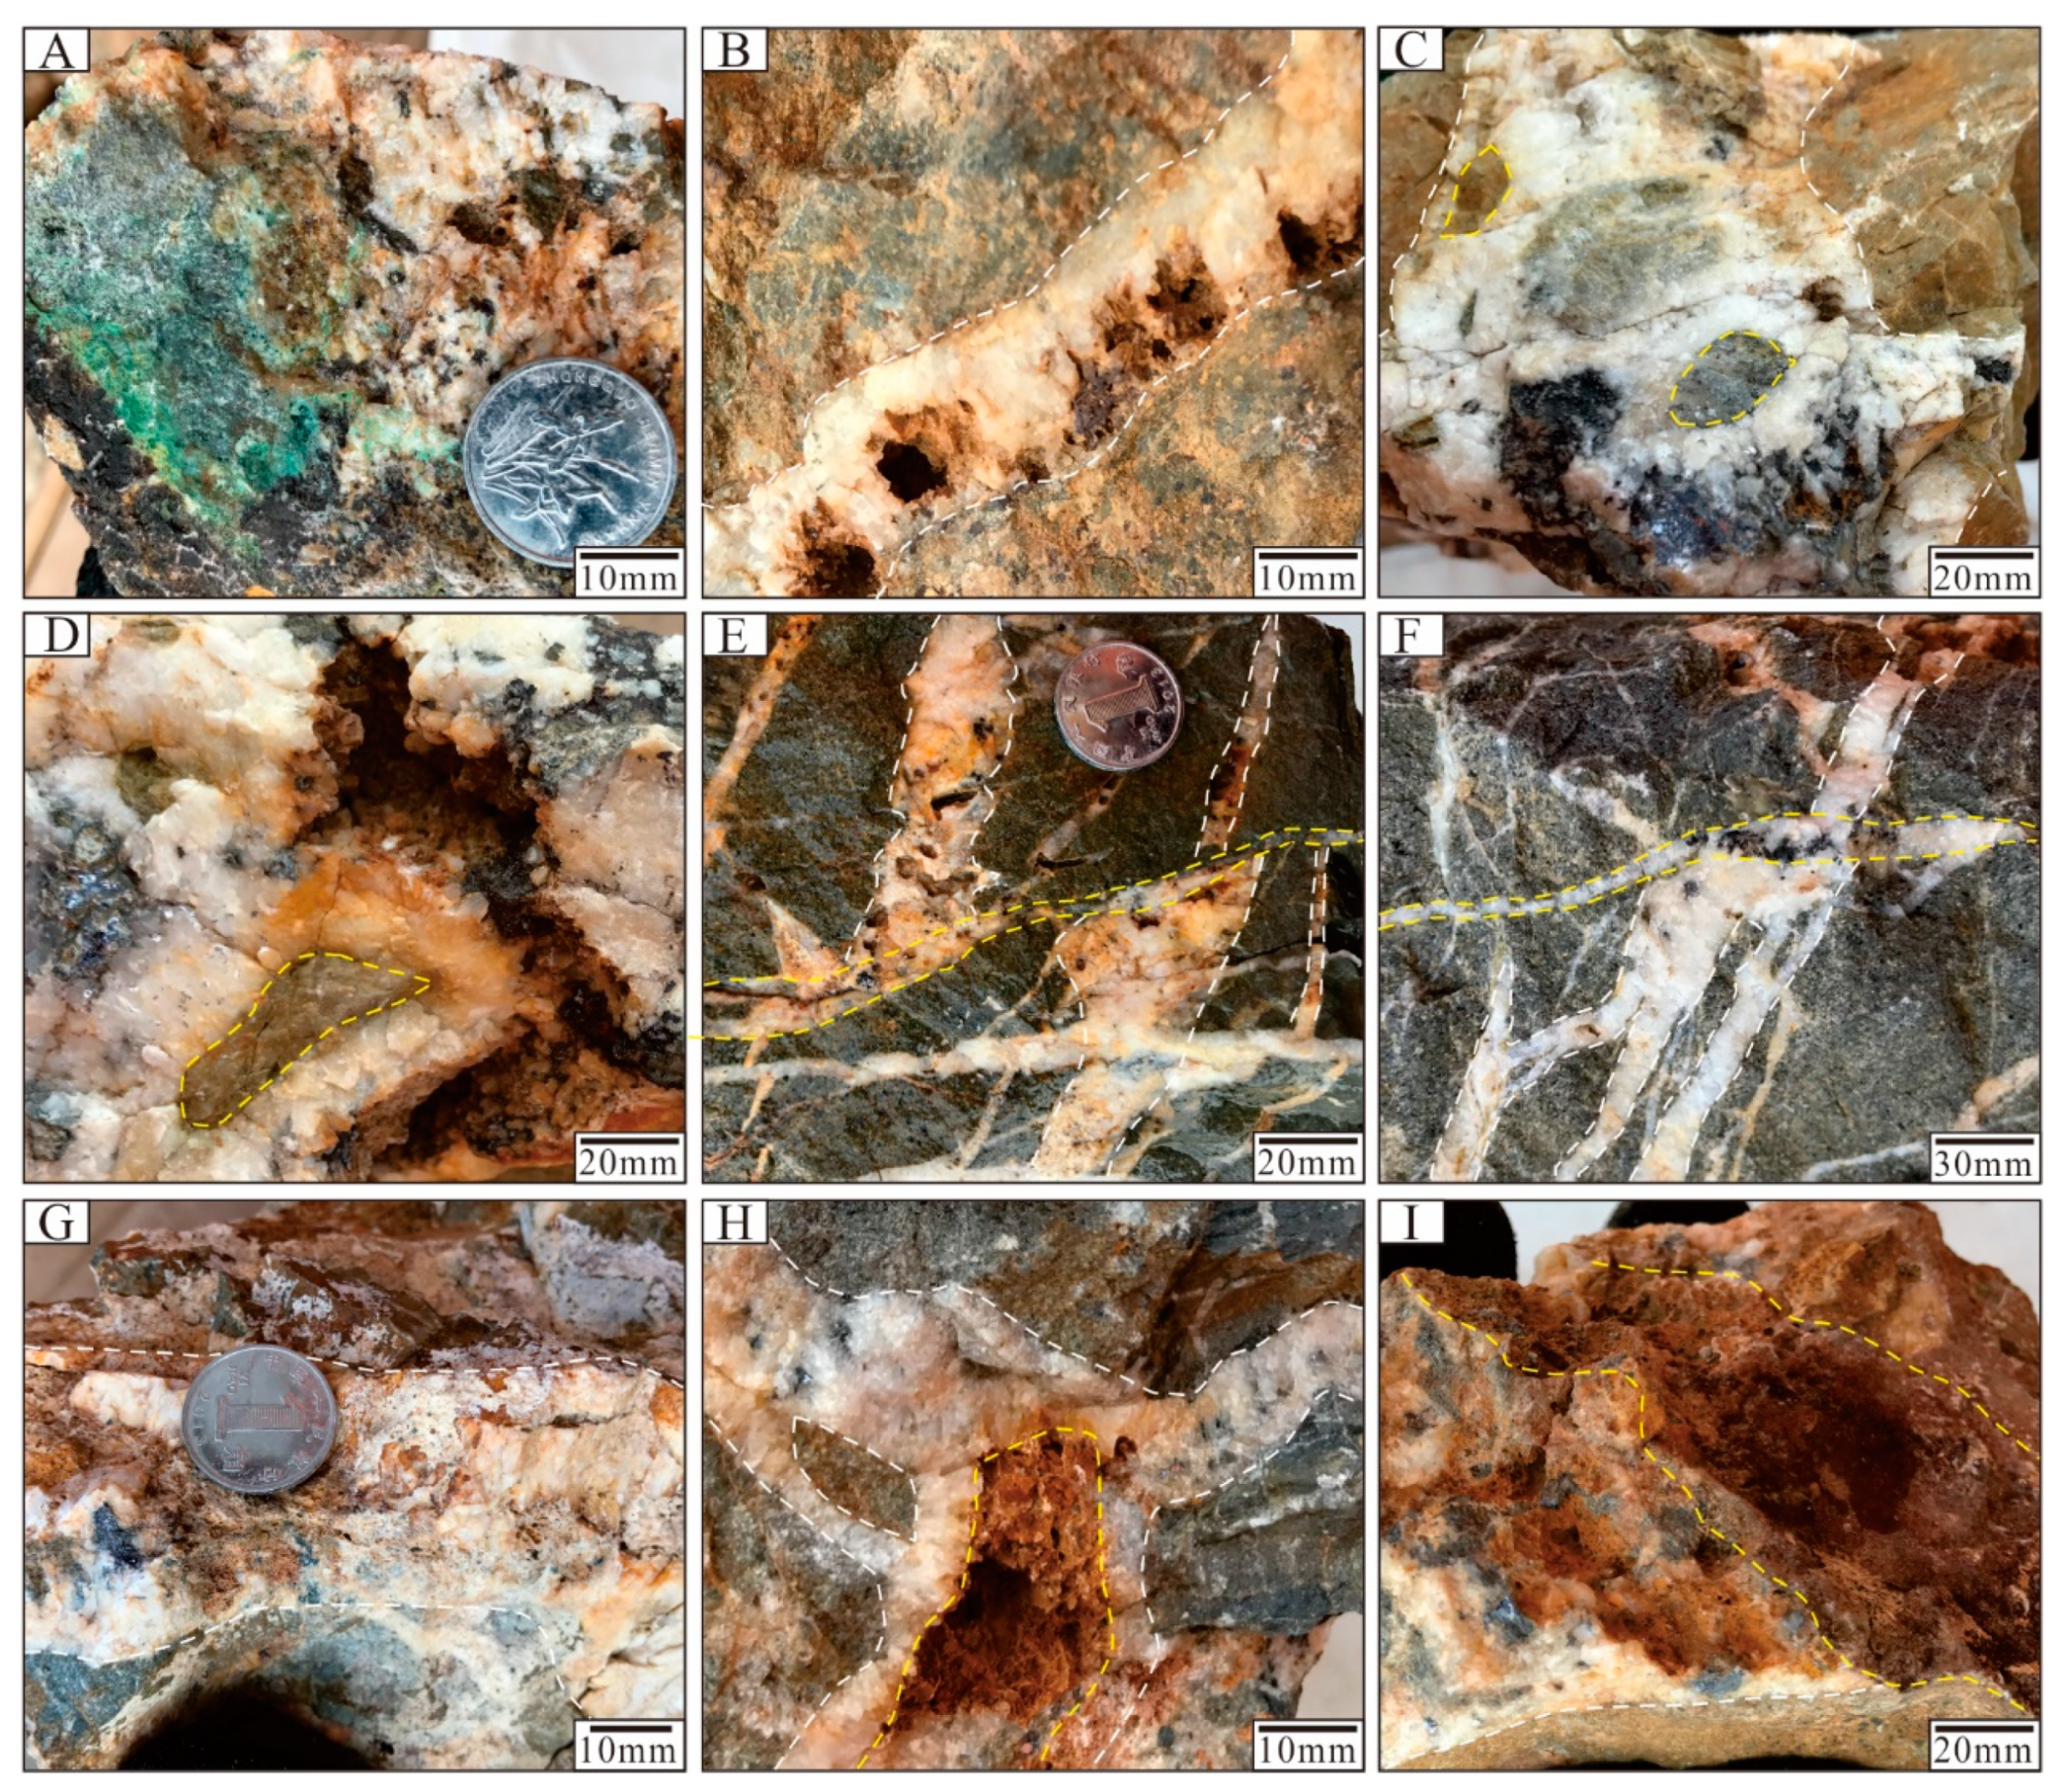
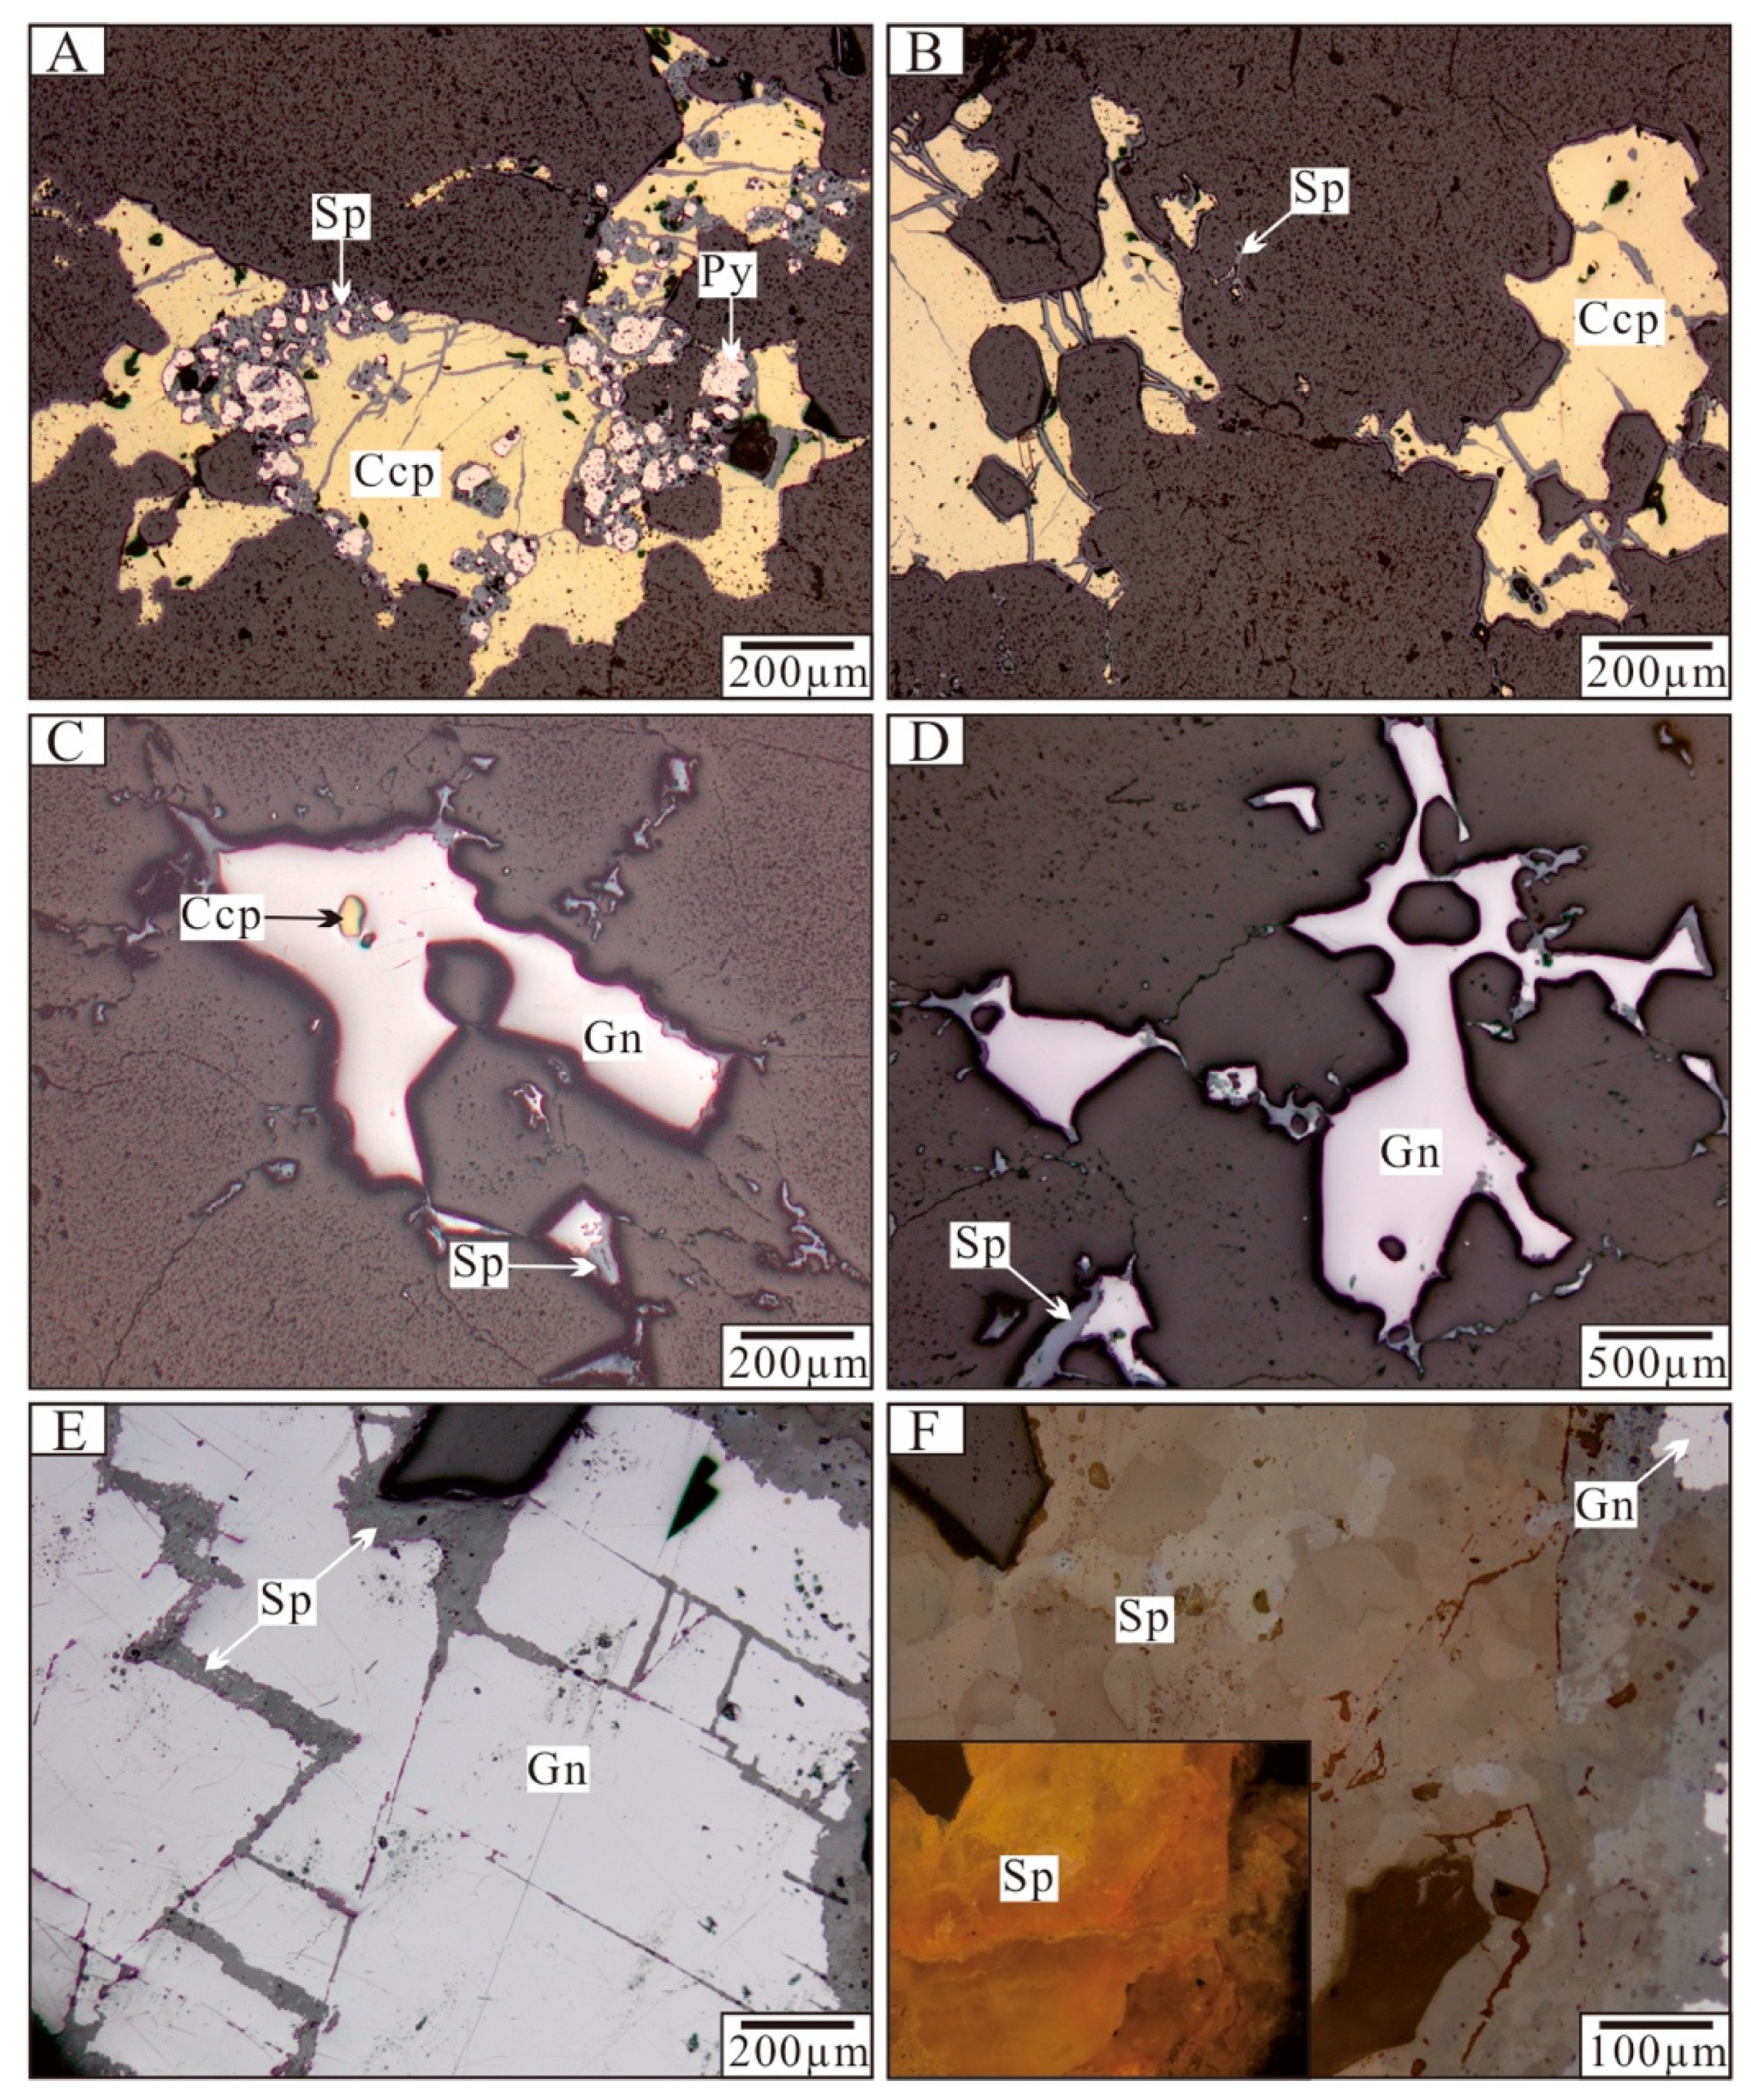
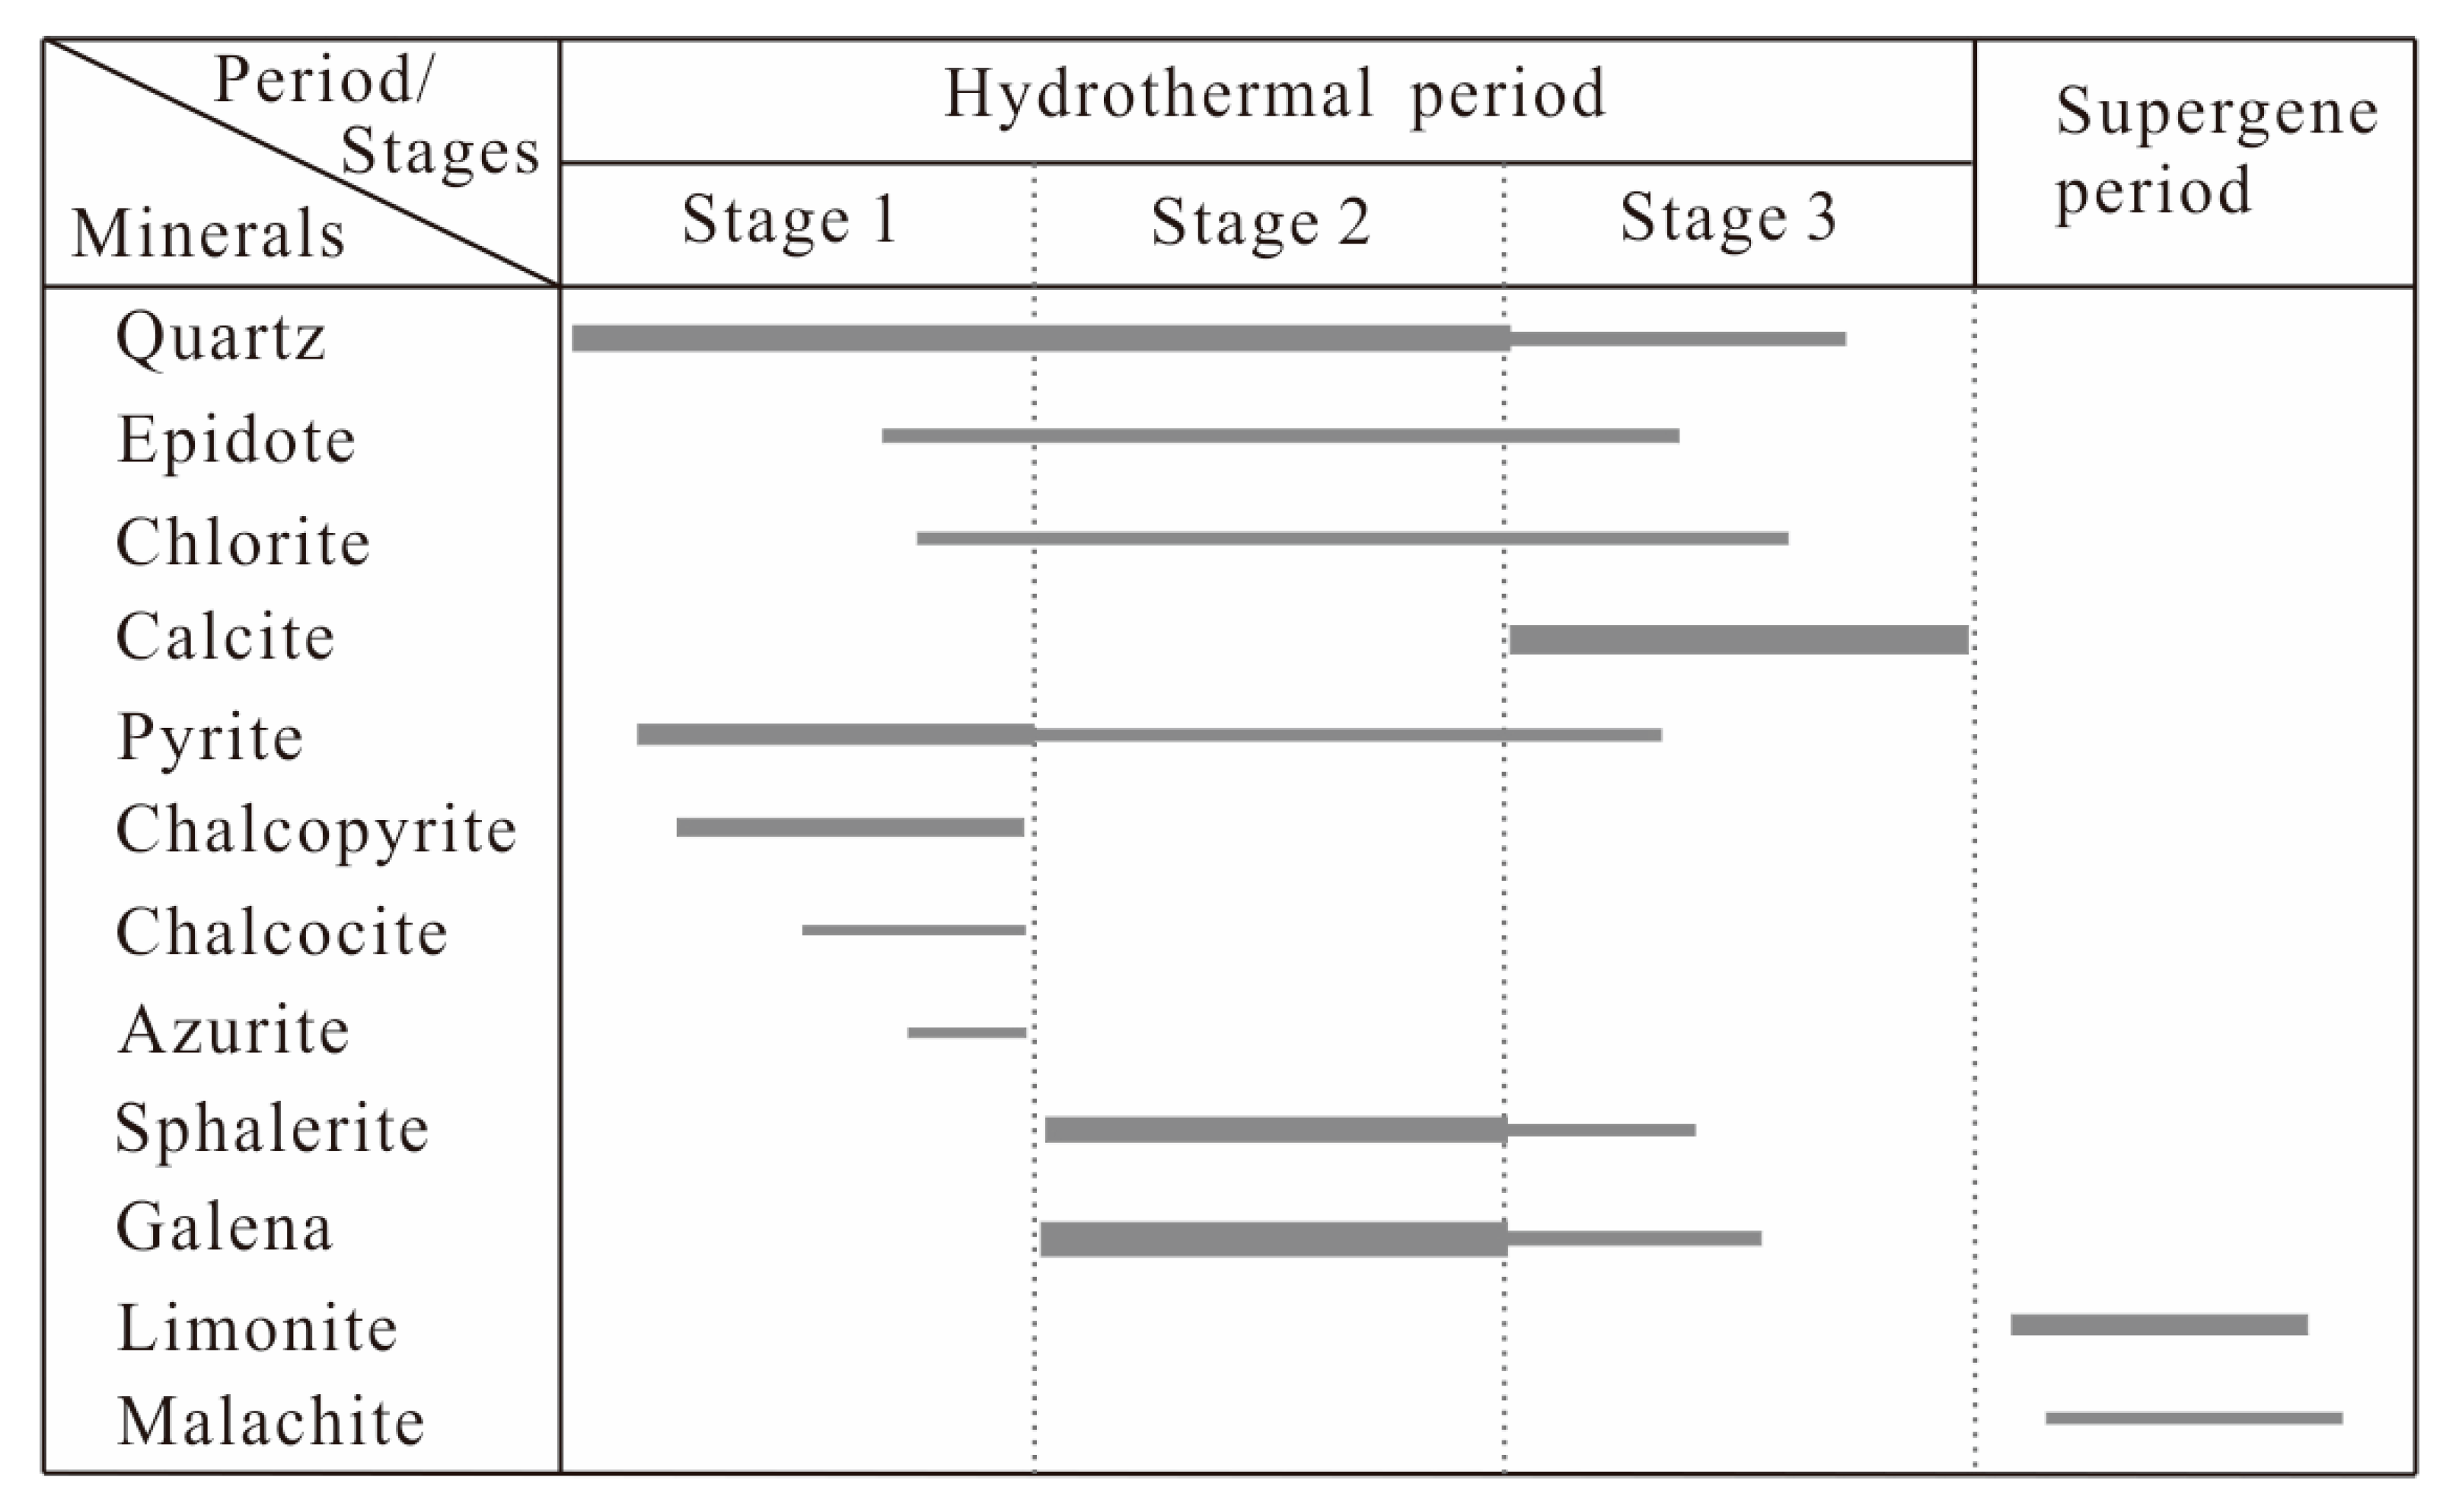
3. Mineralization Characteristics

A total of three mineralized zones (No. I, II, III) and 13 Pb–Zn ore bodies have been discovered in the Kuergasheng deposit (Figure 2). All of the ore bodies are exposed on the surface, occurring as lenticular bodies and veins hosted in the Tuosikuertawu Formation, and are controlled by the NW–SE or NE–SW trending faults. Ore bodies of mineralized zone No. I are 80–270 m long and 1.4–5.5 m thick. These ore bodies dip 70–80° NW, and yield average grades of 4.69% Pb and 3.45% Zn. Ore bodies of mineralized zone No. II are 60–130 m long and 1.0–2.0 m thick. These ore bodies dip 75–85° SW, and have average grades of 1.01% Pb and 2.66% Zn. Ore bodies of mineralized zone No. III are 50–200 m long and 0.7–1.5 m thick. These ore bodies dip 60–70° NE, and have average grades of 2.73 % Pb and 3.03 % Zn.
The Kuergasheng deposit contains numerous hydrothermal veins and various mineral compositions (Figure 3). Sulfide minerals occurring in the ores include galena, sphalerite, pyrite, and chalcopyrite, along with minor chalcocite and azurite (Figure 4). Limonite and malachite are observed in some supergene ores. Gangue minerals include quartz, calcite, chlorite, and epidote. The ore structure is mainly veined, miarolitic, and brecciform. Wall rock alteration consists of silicification, carbonation, and propylitization. Alteration zones are mainly distributed along ore bodies and on either side of faults, with thicknesses of several meters to tens of meters.
Based on the paragenetic relationships of minerals and crosscutting relationships between veins, three paragenetic stages (1–3) of mineralization have been identified (Figure 5). Stage 1 mineralization is characterized by pyrite–chalcopyrite–quartz veins, along with minor chalcocite and azurite. Some ores underwent supergene oxidation, forming limonite, malachite, and porous structures (Figure 3A,B). Stage 2 mineralization consists of galena–sphalerite–quartz veins, which account for the majority of the Pb–Zn production. It is common to find sulfides together with wall rock breccia, infilling quartz veins (Figure 3C,D). Veins of the galena–sphalerite–quartz assemblage crosscut pyrite–chalcopyrite–quartz veins (Figure 3E,F), which indicates their later formation. Stage 3 mineralization consists of sulfide–poor–calcite–quartz veins, which crosscut the earlier ore veins (Figure 3G,H).

4. Samples and Analytical Methods

4.1. Fluid Inclusions

Three generations of quartz are representative of mineralization stages 1–3 for FI analyses. Ore-stage quartz coexists with chalcopyrite, galena, and sphalerite, which shows that the quartz and metallic minerals were coeval. Thirty quartz samples were polished to a thickness of 0.20–0.25 mm, soaked in acetone for 3–4 h, rinsed with clean water, and dried thoroughly. FI petrography involved careful observation of shapes, spatial distribution characteristics, vapor/liquid ratios, and genetic and compositional types. Seventeen samples with abundant representative fluid inclusions (FIs) were selected for microthermometric measurements. FI analyses were carried out at the Geological Fluid Laboratory, Xinjiang University, Urumqi, China, using the fluid inclusion assemblage (FIA) methodology of Goldstein and Reynolds [21]. A Nikon LV–150N microscope (Nikon Corporation, Tokyo, Japan) was used for petrographic analysis. Microthermometry was performed using a Linkam THMS600 (Linkam Scientific Instruments Ltd., Tadworth, UK) heating–freezing stage with a temperature range of −196 to 600 °C. Calibration of the stage was completed using the following standards: pure water inclusions (0 °C), pure CO2 inclusions (−56.6 °C), and potassium bichromate (398 °C). This yielded an accuracy of ±0.2 °C during freezing and ±2 °C for heating at temperatures between 100 °C and 600 °C.

4.2. H–O–C–S–Pb Isotopes

Quartz and galena grains from the different mineralization stages were handpicked from the 40–60 mesh size fraction under a binocular microscope (purity > 99%). H–O–C–S isotopic and Pb isotopic analyses were performed using a MAT–253 mass spectrometer and an ISOPROBE–T thermal ionization mass spectrometer, respectively, at the Analytical Laboratory of the Beijing Research Institute of Uranium Geology, China National Nuclear Corporation.
Oxygen isotopic analyses were performed using the BrF5 method of Clayton and Mayeda [22], and oxygen was converted to CO2 on a platinum coated carbon rod. The hydrogen isotopic composition of FI water was determined by decrepitation of FIs in quartz samples. Water was reduced to H2 by passing it over a uranium metal-bearing tube. Prior to C isotopic analyses, quartz-hosted FIs (bearing trace amounts of carbon) were treated with H3PO4 at 50 °C for 24 h. Various carbonaceous components (CO32−, HCO3, and CO2) dissolved in FIs were converted to CO2 for measuring. Samples for S isotopic analyses were reacted with Cu2O until transformation into pure SO2 [23]. Results are reported as δD and δ18O relative to Standard Mean Ocean Water (SMOW), as δ12C relative to Pee Dee Belemnite (PDB), and as δ34S relative to Canyon Diablo Troilite (CDT) with an analytical precision of ±0.2‰. Samples for Pb isotopic analyses were dissolved with concentrated HCl + HNO3. A two-column AG 1–X8 anion resin method was then used to separate and purify the Pb. Data obtained were corrected using the ANBS–981 standard for analytical error correction. The analysis accuracy is ±0.005%.

5. Results

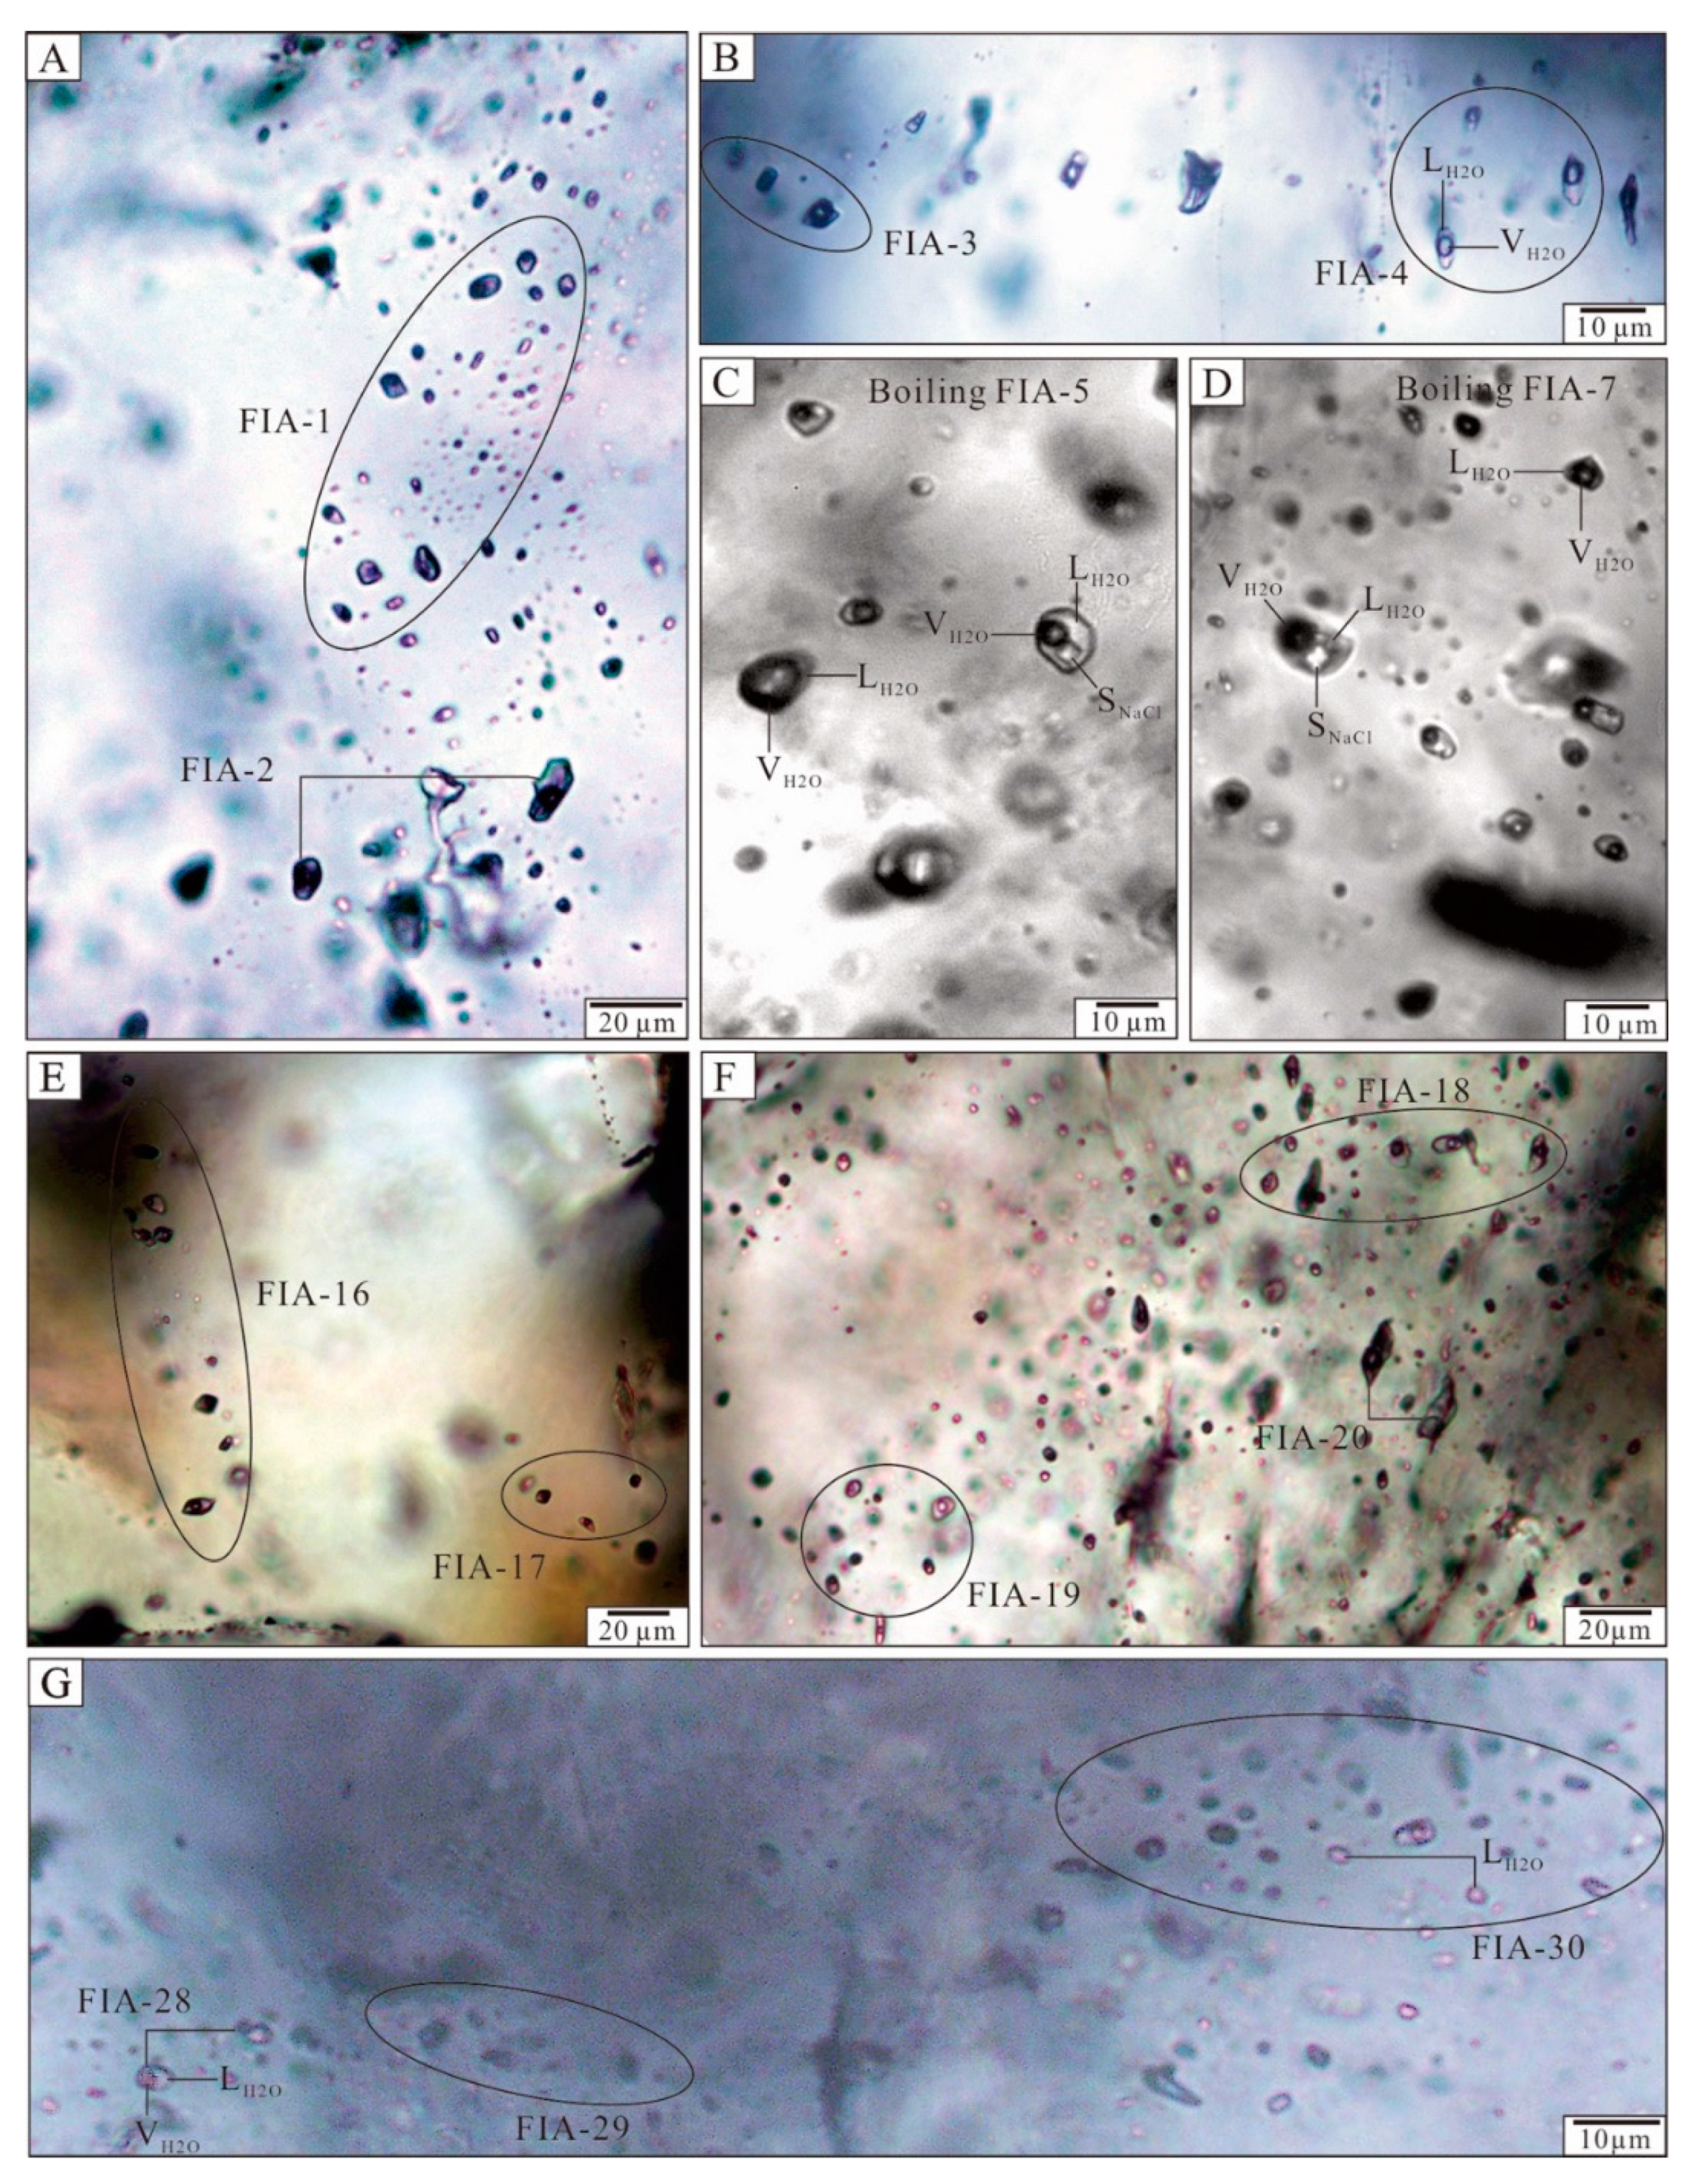
5.1. Fluid Inclusion Petrography

The criteria established by Roedder [24] and Hollister and Burruss [25] were used to distinguish different generations of FIs within hydrothermal quartz. Primary FIs occurred as isolated inclusions or in random groups, while secondary inclusions were found infilling microcracks. Each cluster or group of FIs along growth bands was considered to represent a separate FIA. Based on the room temperature phase relationships and phase transitions during heating and cooling, four types of FIs were identified using the nomenclature of Shepherd et al. [26]: liquid-rich aqueous (LV-type), vapor-rich aqueous (VL-type), halite-bearing (S-type), and monophase liquid aqueous (L-type) FIs.
LV-type FIs consist of a vapor bubble and a liquid phase at room temperature (Figure 6A). These FIs occur as negative quartz crystals or rounded rectangles of 5–20 μm in size. The vapor bubbles account for 5–30% of the total FI volume. These FIs are present in all stages of mineralization and commonly occur as planar arrays restricted to the interiors of quartz crystals. However, some LV-type FIs infill microfractures in quartz, indicating a secondary origin. VL-type FIs consist of a liquid with a vapor bubble, which accounts for 70–90% of the FI volume (Figure 6B–D). This type of FI is typically elliptical to sub-rounded and 5–12 μm in size. Most VL-type FIs are scattered or grouped into clusters in individual quartz grains, and were only trapped during stage 1 mineralization. S-type FIs are comprised of a halite cube, a liquid phase, and a vapor bubble that accounts for 15–20% of the total volume at room temperature (Figure 6C,D). These FIs are always 8–15 μm in size and have negative quartz crystal or multi–sided shapes. S-type FIs are typically found scattered or in clusters within quartz grains, and are most abundant in quartz that also contains VL-type FIs. L-type FIs only contain a liquid phase at room temperature (Figure 6G). This type of FIs are elliptical, 5–10 μm in size, and are only observed in stage 3 quartz grains.

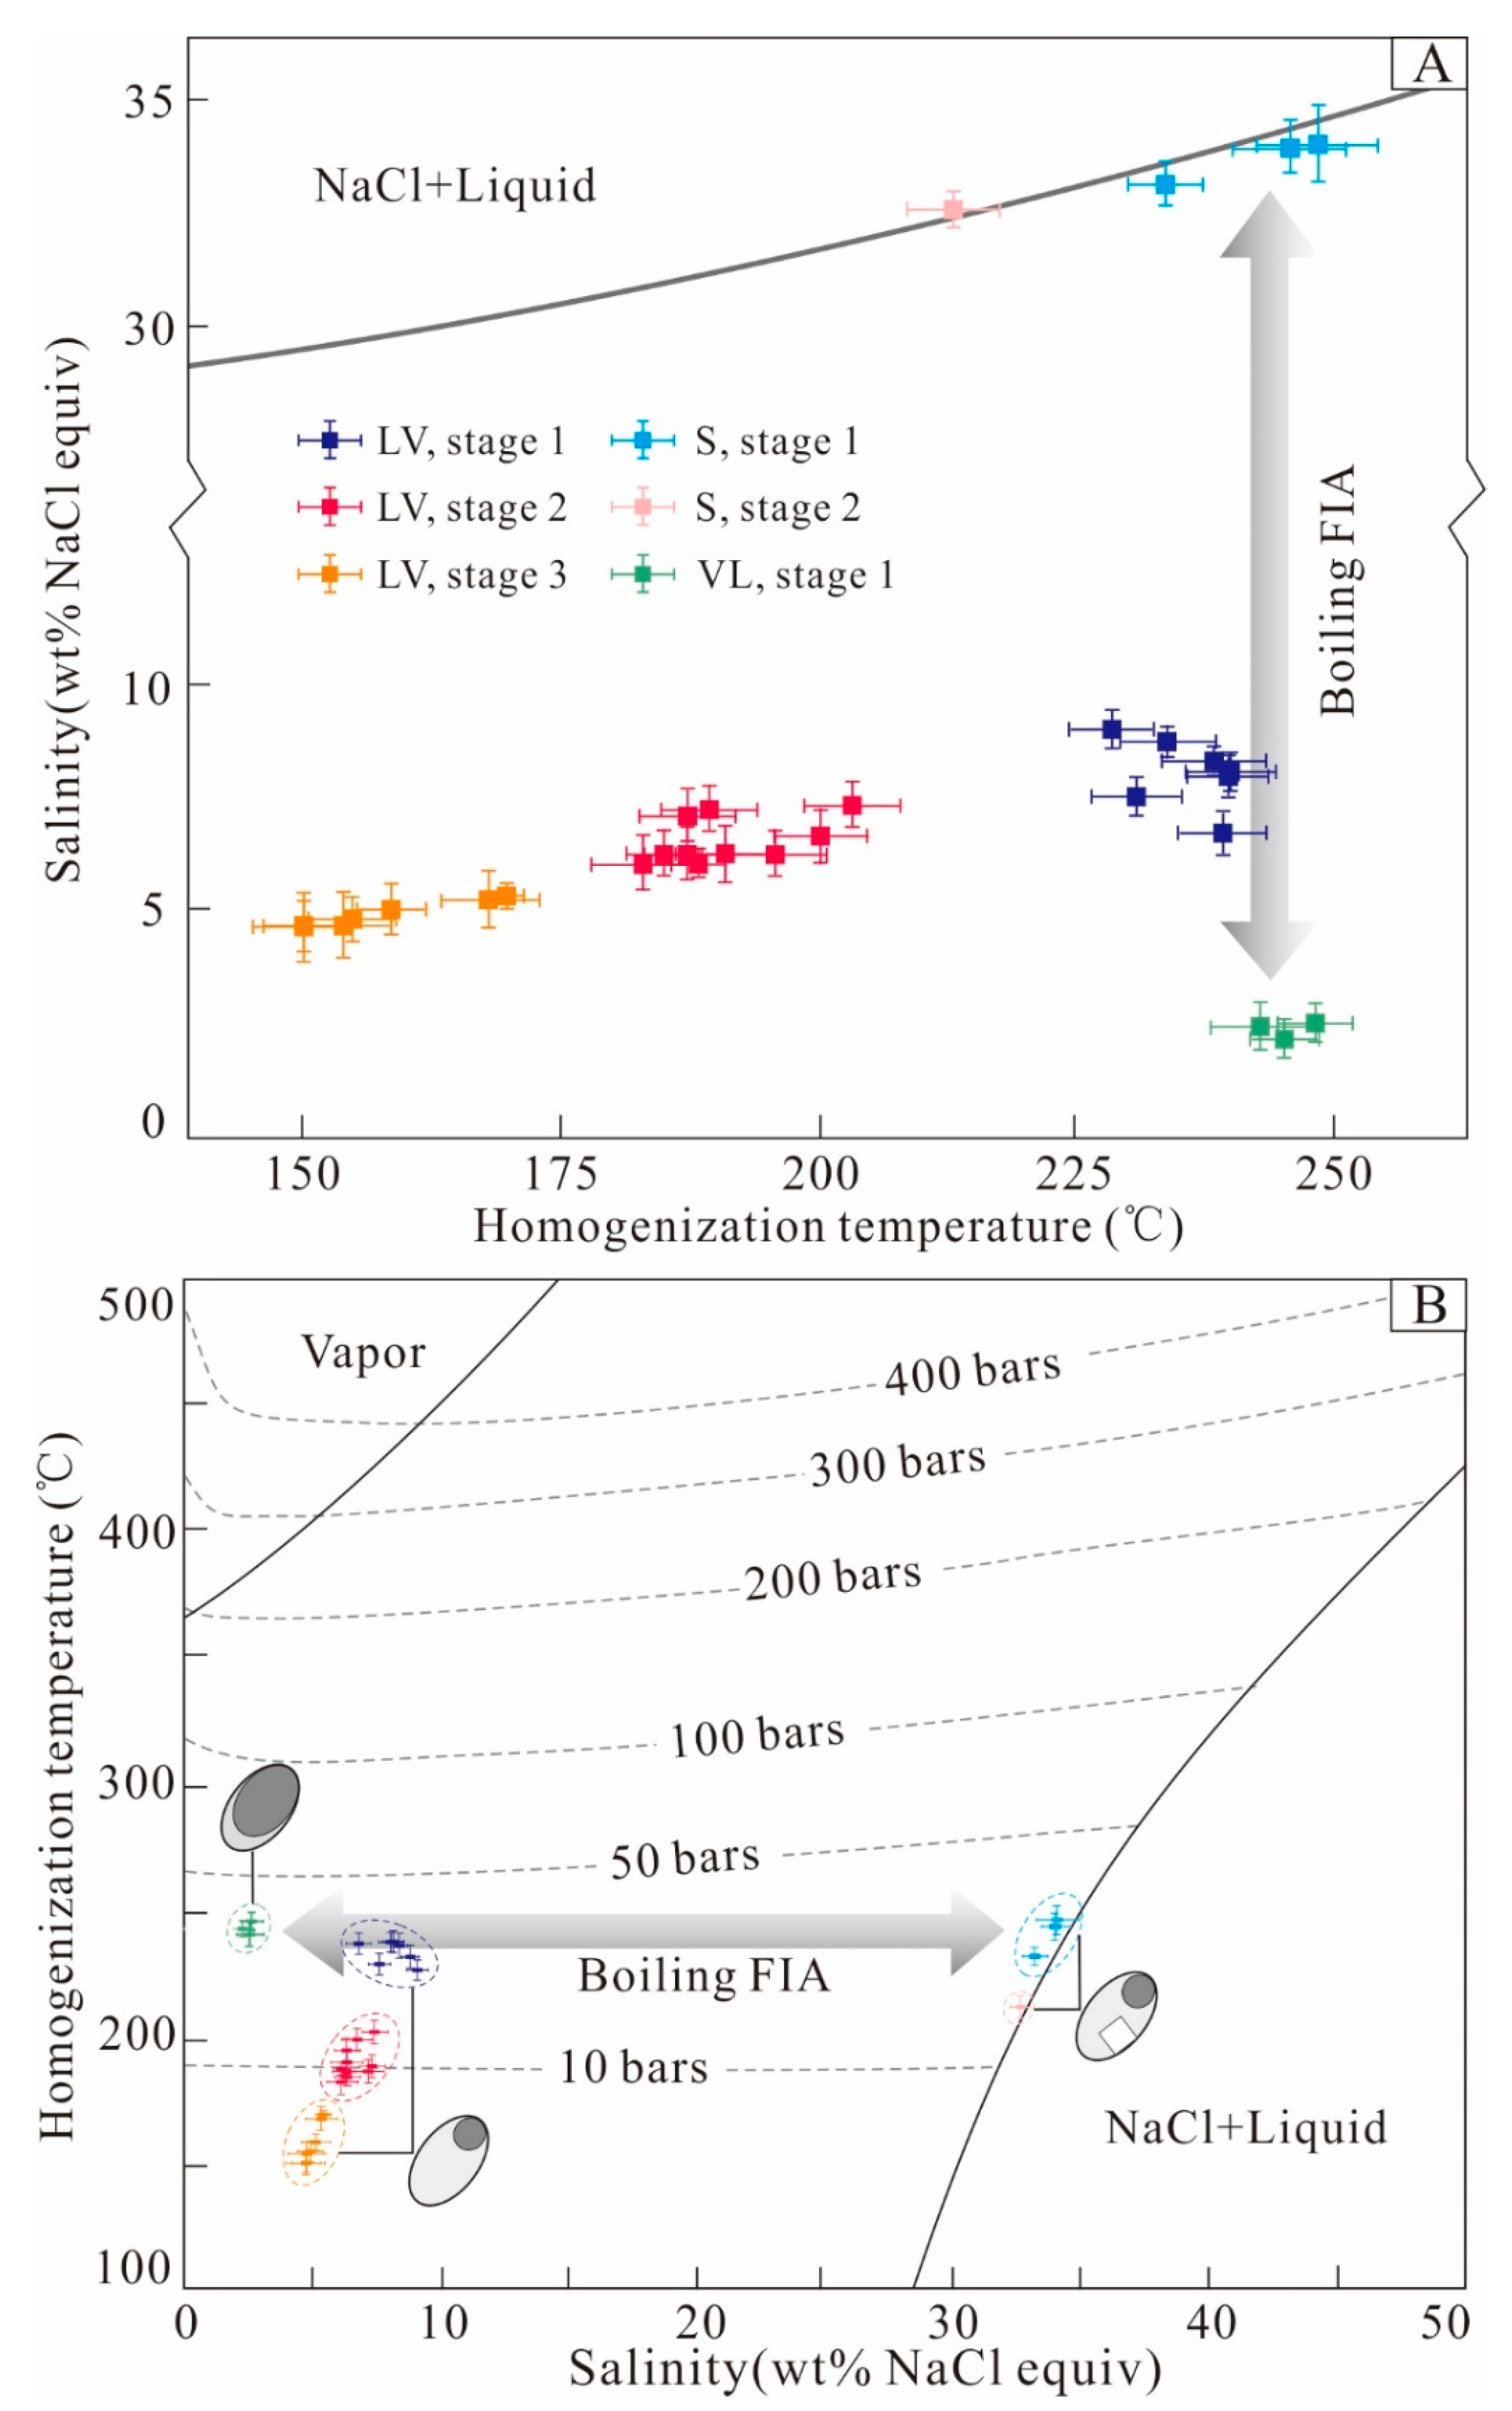
5.2. Fluid Inclusion Microthermometry

Thirty–one FIAs and 173 FIs were chosen for microthermometric analysis. Detailed data are listed in Table 1. Diagrams of homogenization temperatures vs. salinities of the different FIAs are presented in Figure 7A.
Stage 1 quartz veins contain abundant LV-, VL-, and S-type FIs, which account for about 60%, 20%, and 20% of total primary FIs, respectively. Final ice-melting temperatures of LV-type FIs range from −6.3 to −3.8 °C, corresponding to salinities of 6.2–9.6 wt % NaCl equiv. Total homogenization of LV-type FIs to the liquid phase occurred at temperatures of 221–247 °C. When possible, a few eutectic temperatures were measured ranging from −24 to −22 °C, indicating a NaCl-dominated system with low concentrations of KCl [27]. Final ice–melting temperatures of VL-type FIs range from −1.8 to −1.0 °C, corresponding to salinities of 1.7–3.1 wt % NaCl equiv. Total homogenization of VL-type FIs to the vapor phase occurred at temperatures of 238–252 °C. Upon heating, three different homogenization mechanisms were observed in S-type FIs: (1) the vapor phase disappears, first followed by halite crystal dissolution; (2) halite crystals dissolve, followed by the disappearance of the vapor phase; (3) the vapor phase and halite crystals disappear simultaneously. For all of the above mechanisms, S-type FIs finally homogenized to a single liquid phase at temperatures of 229–254 °C. Halite crystals within S-type FIs dissolved at temperatures of 215–254 °C, corresponding to salinities of 32.7–34.9 wt % NaCl equiv.
Stage 2 quartz veins contain LV– and S-type FIs, which account for 90% and 10% of total primary FIs, respectively. Final ice–melting temperatures of LV-type FIs range from −5.0 to −3.1 °C, corresponding to salinities of 5.1–7.9 wt % NaCl equiv. Total homogenization of LV-type FIs to the liquid phase occurred at temperatures of 173–207 °C. A few eutectic temperatures were measured at about ~23 °C. Upon heating, the first change observed in S-type FIs was the dissolution of halite crystals at 200–205 °C, corresponding to salinities of 31.9–32.1 wt % NaCl equiv. Total homogenization of S-type FIs to the liquid phase occurred at 209–220 °C.
Stage 3 quartz veins contain LV– and L-type FIs, which account for 80 and 20% of total primary FIs, respectively. Final ice–melting temperatures of LV-type FIs range from −3.6 to −2.0 °C, corresponding to salinities of 3.4–5.9 wt % NaCl equiv. Total homogenization of LV-type FIs to the liquid phase occurred at temperatures of 145–172 °C. A few eutectic temperatures were measured at ~23 °C.

5.3. H–O–C–S–Pb Isotopes

Isotopic data for 12 quartz samples representing mineralization stages 1–3 have δ18Oqz values of 7.6 to 10.9‰, δDH2O values of −99.2 to −83.1‰, and δ13CH2O values of −16.6 to −9.1‰, respectively (Table 2). δ18OH2O values were calculated using the quartz–H2O equilibrium function (1000lnαqz–H2O = 3.38 × 10⁶ × T−2 − 3.40) of Clayton et al. [28], with the average FI homogenization temperature from the same sample. Calculated δ18OH2O values range from −7.7 to 1.7‰.
Six galena samples record a range of δ34SGn values between 5.6 and 6.9‰ (average =6.3 ± 0.5‰, n = 6) (Table 3). Pb isotope compositions of galena samples yielded 206Pb/204Pb ratios of 18.002 to 18.273, with an average of 18.210; 207Pb/204Pb ratios of 15.598 to 15.643, with an average of 15.620; and 208Pb/204Pb ratios of 38.097 to 38.209, with an average of 38.157 (Table 4).

6. Discussion

6.1. Fluid Boiling and Pressure Estimates

Fluid boiling is a type of fluid immiscibility [29,30] and is thought to have occurred during stage 1 mineralization in the Kuergasheng Pb−Zn deposit, as demonstrated by the following observations. (1) VL−type FIAs occur in stage 1, indicating the presence of a large amount of vapor phase during fluid trapping. (2) Coexisting vapor-rich (VL−type) and high-salinity (S−type) FIs homogenize at similar temperatures, suggesting they were trapped during phase separation, and thus represent a boiling FIA (Figure 6C,D). (3) Most S-type FIs become homogenized in the vapor phase, with daughter minerals disappearing at the same time.
Homogenization temperatures of boiling FIAs are close to quartz crystallization temperatures, which are similar to ore formation temperatures in the Kuergasheng deposit. Trapping pressures can be estimated using the homogenization temperatures and salinities of the boiling FIAs in stage 1, applying the isobaric equations of Driesner and Heinrich [31]. However, the lack of evidence of fluid boiling in veins from stages 2−3 only allows for the estimation of minimum trapping temperatures and pressures for the ore-forming fluids [32].
As shown in Figure 7B, the estimated trapping pressures for boiling FIAs of stage 1 are concentrated around 40 bar. Ore bodies are hosted within structural fractures and have clear boundaries with the wall rocks, indicating that mineralization occurred under hydrostatic pressure [33,34]. Based on these results, mineralization is inferred to have occurred at depths of ~0.4 km, assuming hydrostatic pressure. The low trapping temperatures of LV−type FIs, and the presence of L−type FIs and oxide minerals also suggest relatively shallow paleodepths.

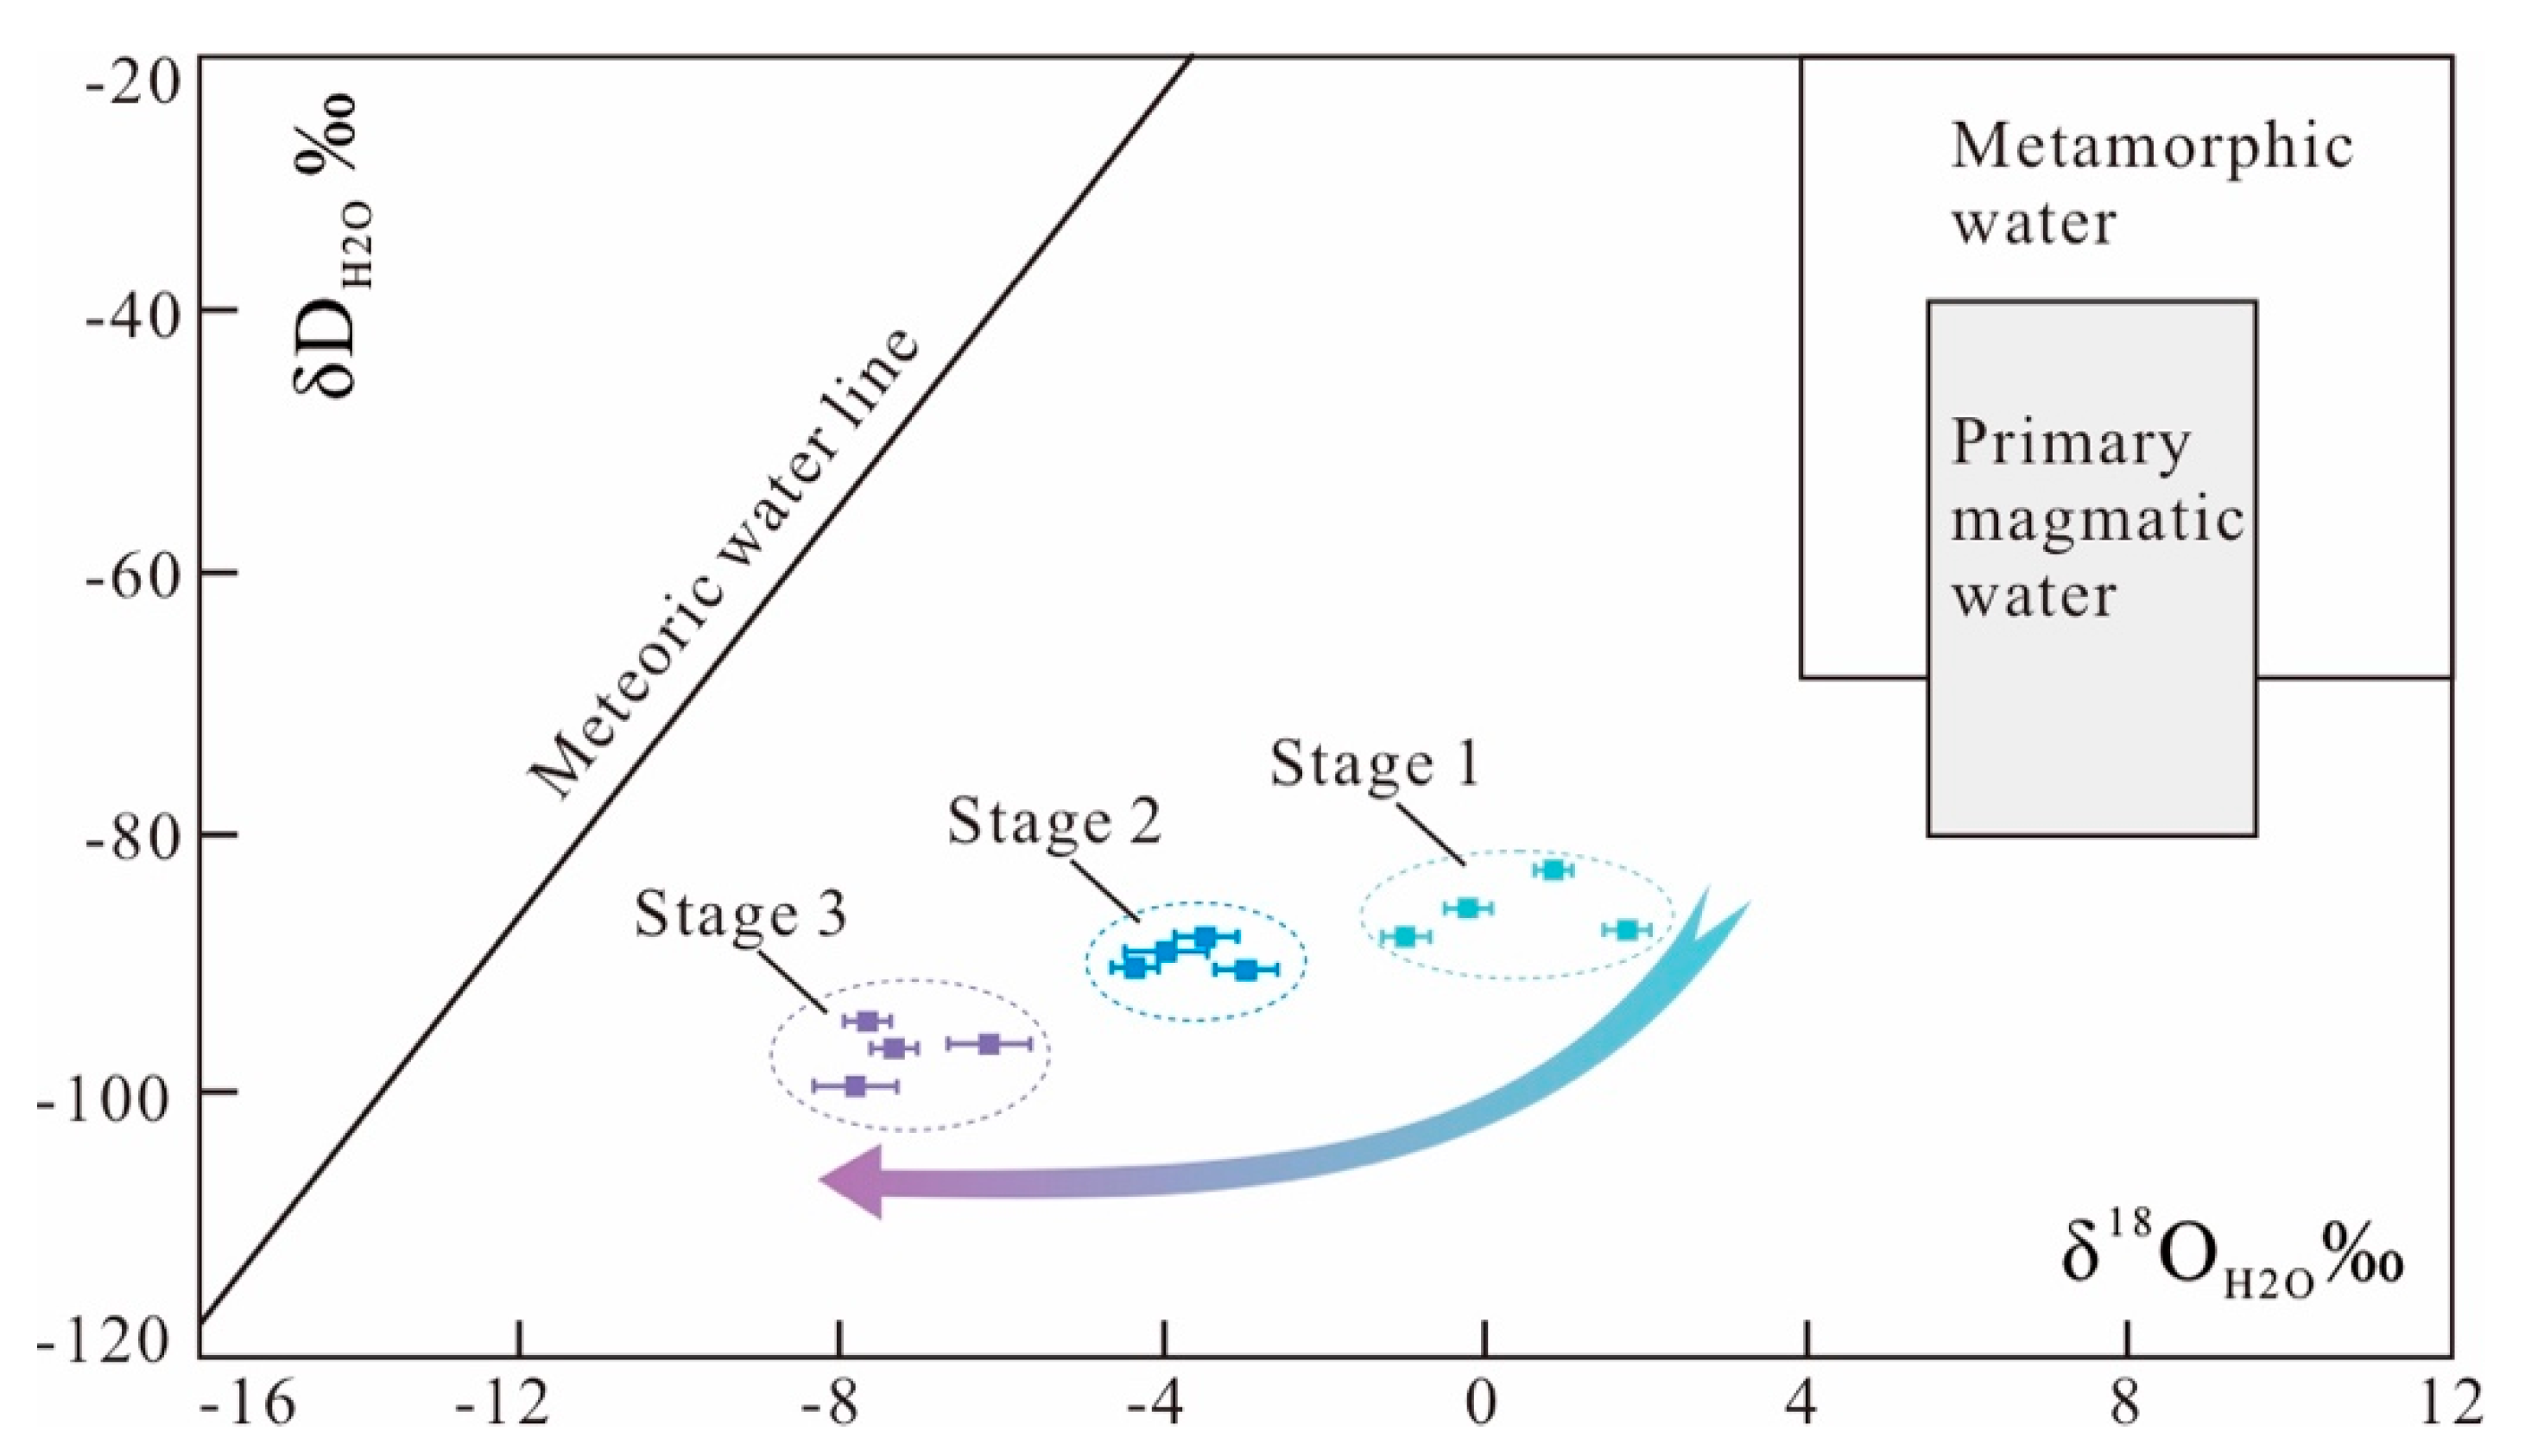
6.2. Fluid Sources and Evolution

The possibility that different fluids with different origins were present within the hydrothermal system can be assessed using FI and H−O−C isotopic data.
FIs identified in stage 1 quartz veins are LV-, VL-, and S-type with moderate trapping temperatures (221–251 °C) and scattered salinities (1.7–34.9 wt % NaCl equiv.). When plotted on the δDH2O vs. δ18OH2O diagram [35], the sample data fall between the magmatic water box and the meteoric water line (Figure 8), indicating a hybrid origin for the ore-forming fluids. Boiling FIAs most likely originated from the phase separation of magmatic water due to decompression, while LV-type FIs may represent heated meteoric water. In contrast, H–O isotopic data for the paragenetically younger stage 2 quartz samples define a trend towards the meteoric water line (Figure 8). This trend may reflect the increasing contribution of meteoric water over time. Only LV- and minor S-type FIs are observed in stage 2 quartz veins with comparatively low homogenization temperatures (173–220 °C). The absence of boiling FIAs suggests gradual cooling of the hydrothermal system and a stable pressure situation. S-type FIs may be inherited from an earlier stage [36], and remaining VL-type FIs may recondense into LV-type FIs [37]. Stage 3 sulfide–calcite–quartz veins dominantly host LV– and L-type FIs, which were trapped under low temperatures (145–172 °C) and low salinities (3.4–5.9 wt % NaCl equiv.). Samples plot adjacent to the meteoric water line on the δD vs. δ18O diagram (Figure 8), indicating a predominantly meteoric water source for the ore-forming fluids—which is further reinforced by the presence of monophase liquid FIs (L-type).
Carbon isotopic data for quartz in the Kuergasheng deposit are useful to determine the C source of the ore-forming fluids. Hydrothermal quartz in our samples has δ13CH2O values of −16.6 to −9.1‰. The large variation of δ13CH2O values reveals a hybrid origin of carbon (Figure 9), suggesting mixing between magmatic fluids and meteoric water circulating through sedimentary carbonate formations.
In summary, based on FI and H–O–C isotopic data, the ore-forming fluids that formed the Kuergasheng Pb–Zn deposit are inferred to have a hybrid origin [38], with an initial magmatic source, and a meteoric water source which became dominant in the late mineralization stage.

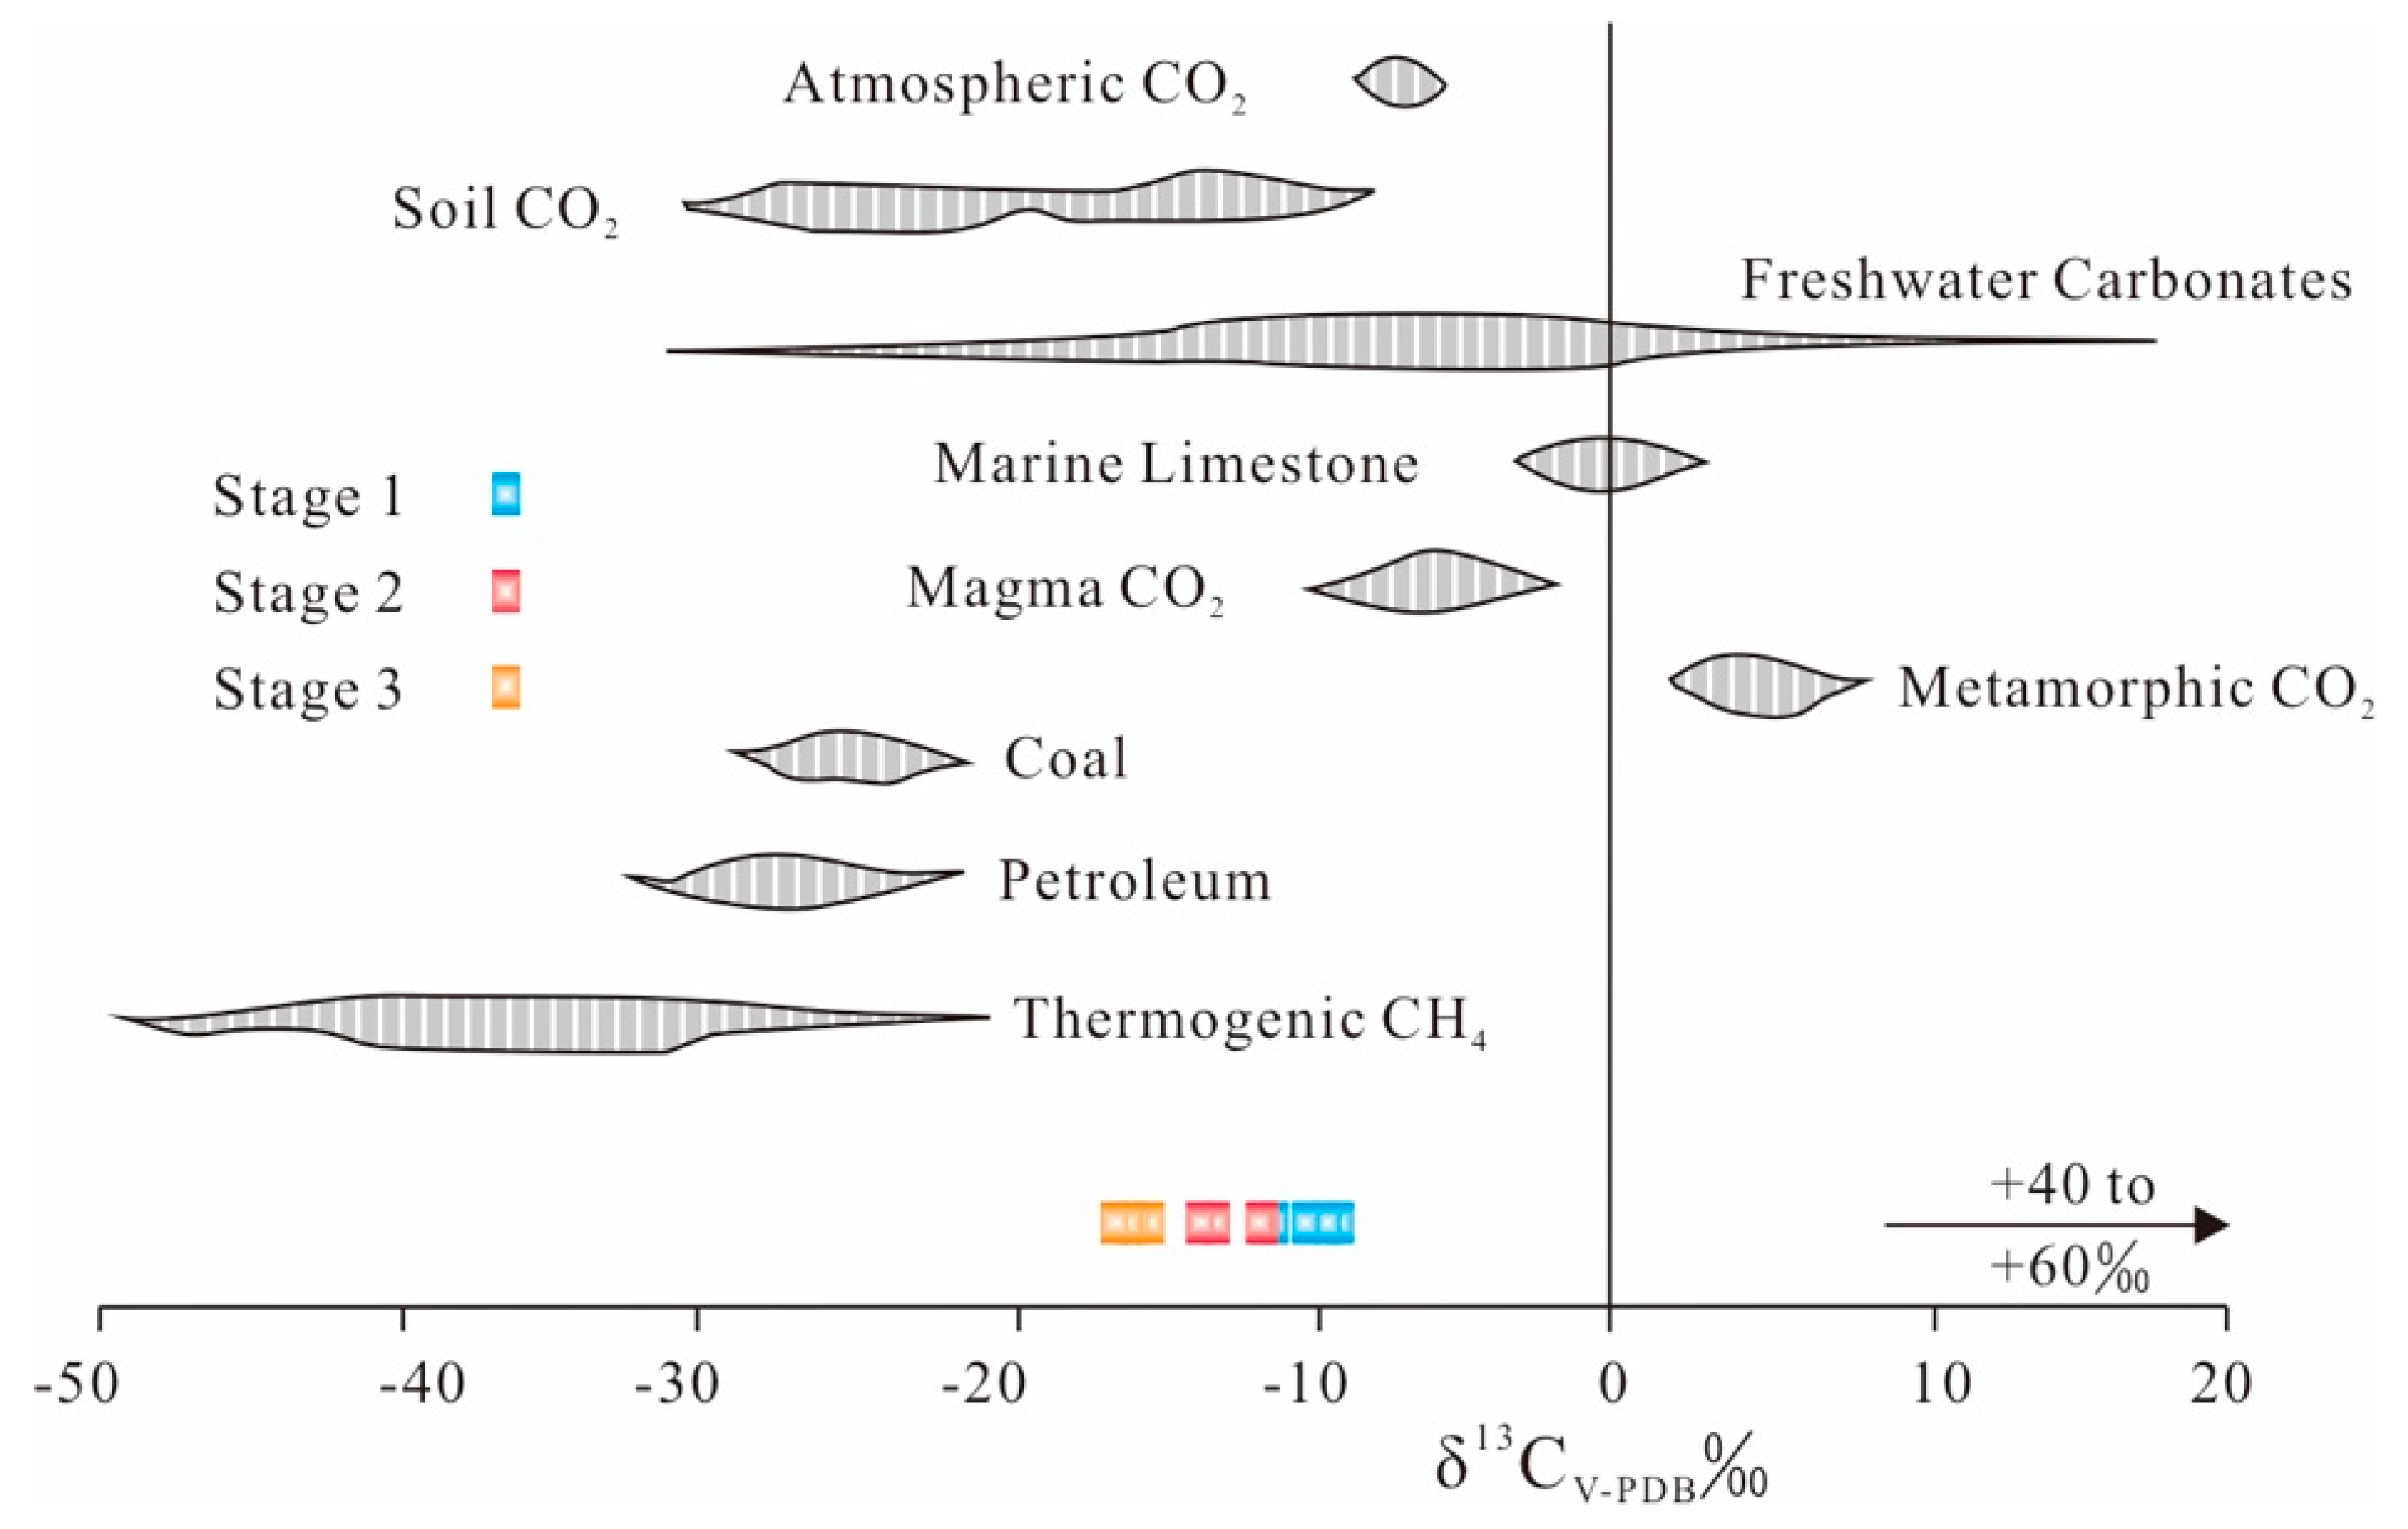
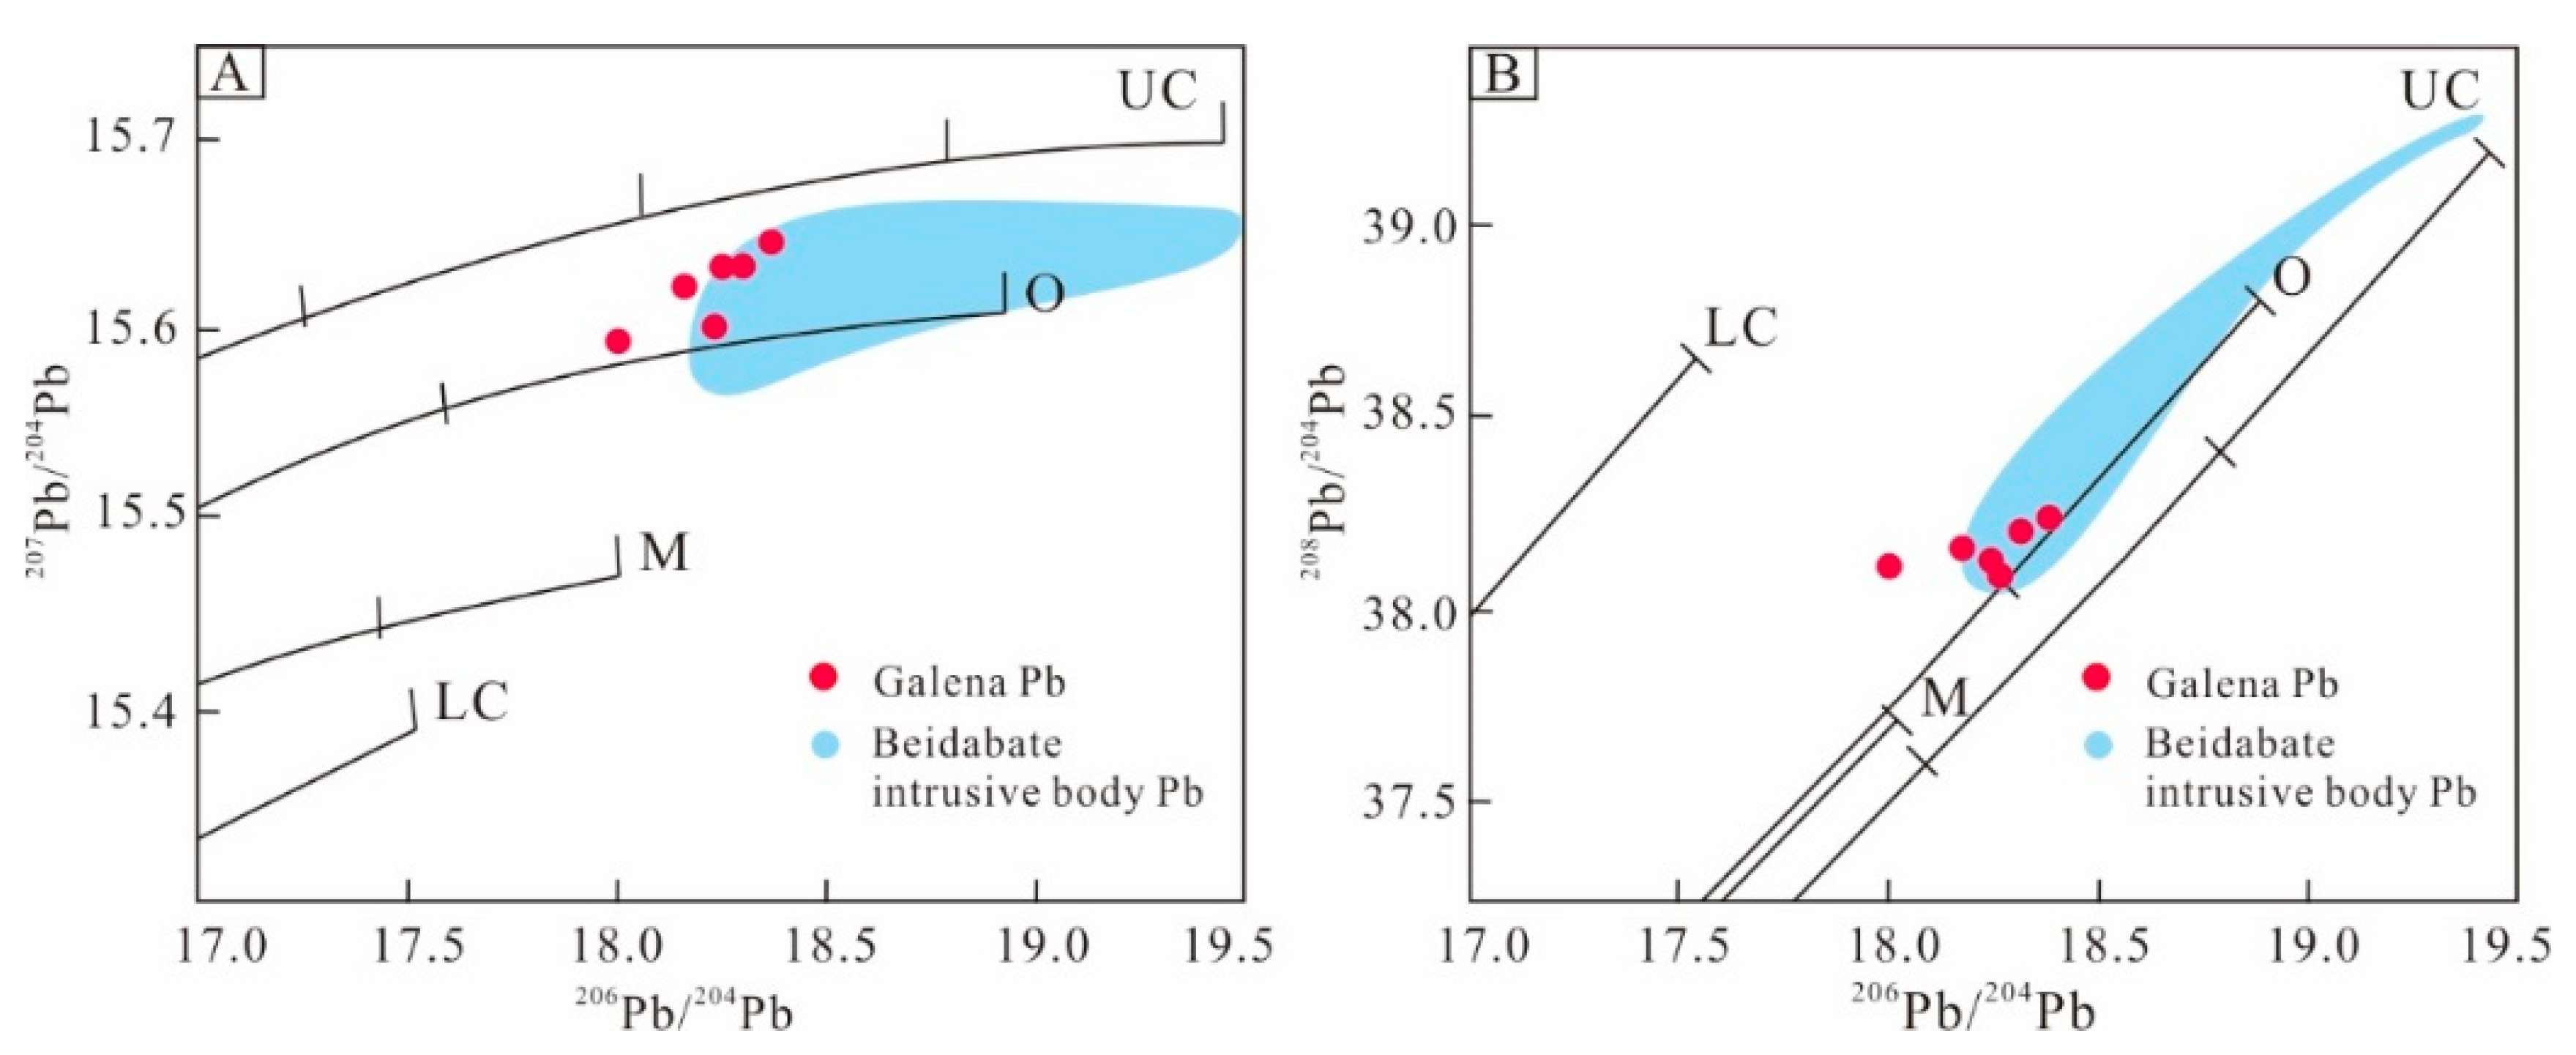
6.3. Sources of Ore Constituents

Sulfide minerals are present in many types of mineral deposits, and their S isotopic compositions can constrain fluid and metal sources, as well as ore-forming processes [39]. Ohmoto [40] pointed out that the S isotopic composition of a hydrothermal mineral is a function of the total S isotopic composition, oxygen fugacity, pH value, ionic strength, and temperature—i.e., δ34S = ƒ (δ34SΣs, ƒO2, pH, I, T). Oxidized phases are absent both in the galena–sphalerite–quartz assemblage (stage 2) and in the sulfide-poor–calcite–quartz assemblage (stage 3) observed in the Kuergasheng deposit. This lack of sulfate minerals indicates that sulfur was mainly present as reduced sulfur (H2S) in the hydrothermal fluids. δ34SH2S values are therefore consistent with fluid Σδ34S values. δ34S values for galena range from 5.6 to 6.9 ‰. Using the formula (A × 106/T2 = δ34Ssulfide − δ34SH2S, Agalena= −0.63) of Ohmoto and Goldhaber [41], equilibrium 34SH2S values were estimated to be in the range of 7.4 to 9.5‰. Such a range of δ34S is most likely related to the sulfur isotopic composition of acidic magmatic rocks [42], and is close to the sulfur isotopic composition of the Beidabate porphyry Cu–Mo deposit (4.9–7.9‰ [43]), located 7 km northeast of the Kuergasheng deposit. The Beidabate intrusive body may be an important source of S for ore deposit formation; however, we cannot overlook the contribution of sedimentary strata.
The Upper Devonian Tuosikuertawu Formation is the most important ore-bearing stratum in the region. Geochemical analyses [14,44] indicate that the rocks of the Tuosikuertawu Formation have high concentrations of ore-forming materials including Pb (20.4–61.6 ppm) and Zn (84.1–899.4 ppm) (Table 5). This sedimentary unit may also provide part of the ore-forming materials for Pb–Zn mineralization. On the other hand, the Beidabate intrusive body is most likely to provide a source of Cu (40.3–371.7 ppm) (Table 5).
Pb isotopic compositions can also constrain the source(s) of ore constituents [45,46,47]. Pb isotopic data for galena samples in the Kuergasheng Pb–Zn deposit show values of 18.002–18.273 for 206Pb/204Pb, 15.598–15.643 for 207Pb/204Pb, and 38.097–38.209 for 208Pb/204Pb. These values indicate that the samples are relatively rich in uranogenic Pb, and poor in thorogenic Pb. Pb isotopic data plot close to the orogenic growth line on both the uranogenic and thorogenic plots (Figure 10), which suggests that the formation of the deposit was closely related to orogenic activity [48,49]. We interpret these data to reflect a hybrid crustal–mantle source of lead. Data for the Beidabate intrusive body partially overlap the galena data of the Kuergasheng Pb–Zn deposit, which gives further evidence that Beidabate intrusive body may be a source of ore-forming material.
Thus, the ore-forming materials of the Kuergasheng deposit were possibly derived from both the Beidabate intrusive body and the Tuosikuertawu Formation.

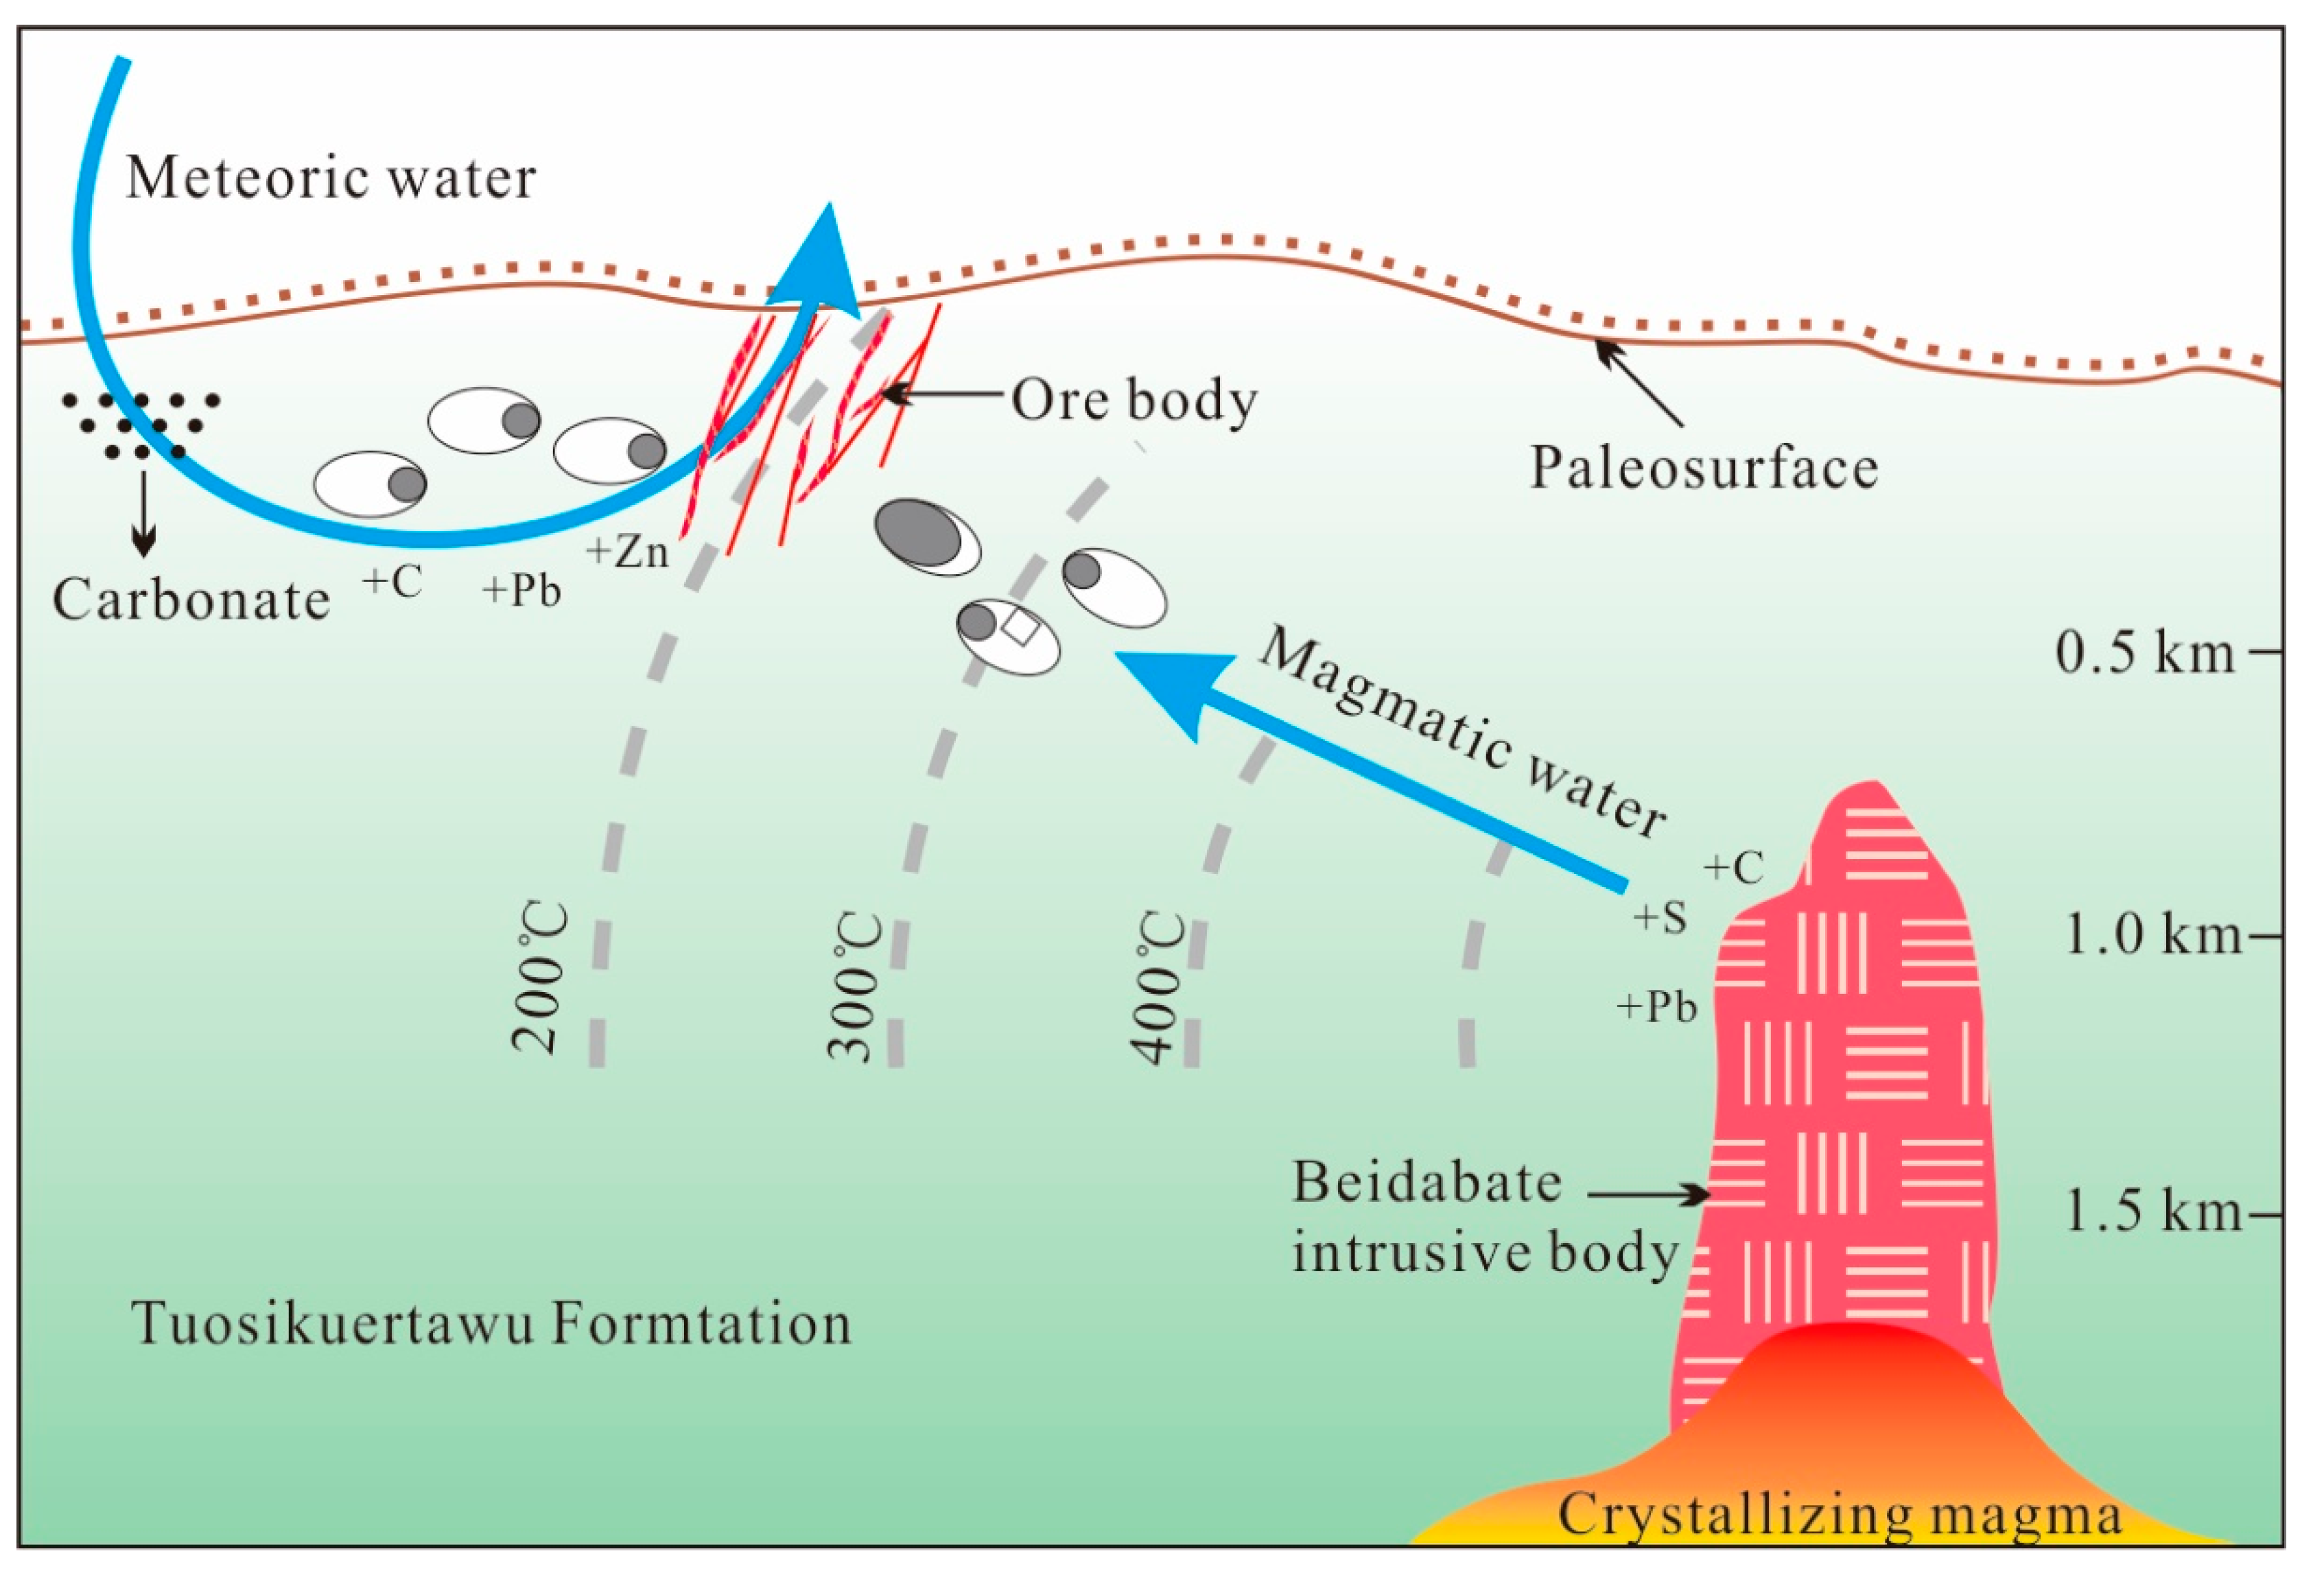
6.4. Genetic Model of the Kuergasheng Deposit

FI and isotope data need to be interpreted in the context of geological relationships, both at a regional and deposit scale, in order to develop a coherent genetic model (Figure 11).
Both the characteristics of the ore-forming fluid and the H–O–C isotopic data show that magmatic water contributed to early mineralization. S–Pb isotopic data also give evidence that part of the ore-forming materials was provided by the Beidabate intrusive body. As crystallization progressed in the magma chamber beneath Beidabate, the magma continuously exsolved metal-rich magmatic water, forming high temperature Cu–Mo mineralization within the porphyry. The high temperature magma heated and drove the meteoric water to circulate to shallower depths. Magmatic water continued to ascend and migrate to the periphery of the porphyry along the porosity network and joint fissures of wall rocks. The heated meteoric water continuously extracted Pb and Zn, among other metals, from the Tuosikuertawu Formation. When the magmatic water migrated to a large-scale fault, mixing with circulating meteoric water occurred. Instantaneous depressurization of the system would have then caused boiling of the ore-forming fluid and formed coexisting boiling FIAs and LV-type FIAs. Early pyrite–chalcopyrite–quartz veins (stage 1) formed during this process at a temperature of 237 ± 7 °C and depths of around ~0.4 km. NW–SE and NE–SW trending faults in the deposit provided channels for ore-forming fluids to circulate and spaces to host precipitation of ore-forming materials. With the crystallization and cooling of the porphyry and continuous input of cool meteoric water, the ore-forming fluid temperature decreased, destroying the stability of the Pb and Zn chloride complex and triggering the following reactions [50]
PbCln(n−2)−(aq) + 2H2S(g) + 1/2O2(g) = PbS2 + 2H+(aq) + H2O(l) + nCl(aq);
ZnCln(n−2)−(aq) + 2H2S(g) + 1/2O2(g) = ZnS2 + 2H+(aq) + H2O(l) + nCl(aq)
Galena–sphalerite–quartz (stage 2) and sulfide-poor–calcite–quartz (stage 3) veins formed at shallower depths at temperatures of 192 ± 9 °C and 156 ± 8 °C, where large-scale meteoric water input occurred, becoming widespread in the hydrothermal system. Such a porphyry–epithermal vein genetic model has been reported worldwide in recent years, as in the porphyry Cu–Au–Mo and epithermal Ag–Pb–Zn veins of Dexing in China, the porphyry Cu–Mo and epithermal Cu–Ag–Au veins of Rosario in Chile, and the porphyry Cu–Mo–Au veins of Nevados de Famatina and the epithermal Cu–Au veins of La Mejicana, both in Argentina.
The genesis of vein-type mineralization at the periphery of porphyries does not usually form in isolation. In fact, the area around the Beidabate intrusive body still has a high prospecting value.

7. Conclusions

(1) The ore-forming fluids of the Kuergasheng deposit were derived from magmatic fluid mixed with meteoric water which became dominant in the later stage.
(2) The ore-forming materials of the Kuergasheng deposit were derived from both the Beidabate intrusive body and the Upper Devonian Tuosikuertawu Formation.
(3) The Kuergasheng deposit is a typical epithermal Pb–Zn vein deposit, formed at the periphery of Beidabate intrusive body.

Author Contributions

Conceptualization: S.L.; Methodology: X.Z.; Doftware: L.G.; Validation: K.W.; Formal analysis: K.A.; Investigation: C.C.; Resources: C.C.; Data curation: S.L.; Writing—original draft preparation: S.L.; Writing—review and editing: K.W.; Visualization: S.L.; Supervision: F.X.; Project administration: S.L.; Funding acquisition: S.L. All authors have read and agreed to the published version of the manuscript.

Funding

This work was supported by the Natural Science Foundation of the Xinjiang Uygur Autonomous Region (Project no. 2020D01C075) and Doctoral Research Startup Fund of Xinjiang University (Project no. 620312389).

Acknowledgments

We are grateful to the staff of the Xinjiang Nonferrous Geological Exploration Bureau for assisting with fieldwork in the Kuergasheng Mine. We would also like to thank the managing editor and reviewers for their positive and constructive comments, which significantly improved this paper.

Conflicts of Interest

The authors declare that there is no conflict of interest regarding the publication of this paper.

References

  1. Coleman, R.G. Continental growth of Northwest China. Tectonics 1989, 8, 621–635. [Google Scholar] [CrossRef]
  2. Şengör, A.C.; Natal’in, B.A.; Burtman, V.S. Evolution of the Altaid tectonic collage and Palaeozoic crustal growth in Eurasia. Nature 1993, 364, 299–306. [Google Scholar] [CrossRef]
  3. Jahn, B.M.; Wu, F.Y.; Chen, B. Massive granitoid generation in Central Asia: Nd isotope evidence and implication for continental growth in the Phanerozoic. Episodes 2000, 23, 82–92. [Google Scholar] [CrossRef] [Green Version]
  4. Kovalenko, V.I.; Yarmolyuk, V.V.; Kovach, V.P.; Kotov, A.B.; Kozakov, I.K.; Salnikova, E.B.; Larin, A.M. Isotopic provinces, mechanism of generation and sources of the continental curst in the Central Asian mobile belt: Geological and isotopic evidence. J. Asian Earth Sci. 2004, 23, 605–627. [Google Scholar] [CrossRef]
  5. Xiao, W.J.; Zhang, L.C.; Qin, K.Z. Paleozoic accretionary and collisional tectonics of the eastern Tianshan (China): Implications for the continental growth of central Asia. Am. J. Sci. 2004, 304, 370–395. [Google Scholar] [CrossRef] [Green Version]
  6. Abzalov, M. Zarmitan granitoid–hosted gold deposit, Tianshan belt Uzbekistan. Econ. Geol. 2007, 102, 519–532. [Google Scholar] [CrossRef]
  7. Biske, Y.S.; Seltmann, R. Paleozoic Tian–Shan as a transitional region between the Rheic and Urals–Turkestan oceans. Gondwana Res. 2010, 17, 602–613. [Google Scholar] [CrossRef]
  8. Gao, J.; Long, L.L.; Klemd, R.; Qian, Q.; Liu, D.Y.; Xiong, X.M.; Su, W.; Liu, W.; Wang, Y.T.; Yang, F.Q. Tectonic evolution of the South Tianshan orogen and adjacent regions, NW China: Geochemical and age constraints of granitoid rocks. Int. J. Earth Sci. 2009, 98, 1221–1238. [Google Scholar] [CrossRef]
  9. Lin, W.; Faure, M.; Shi, Y.H.; Wang, Q.C.; Li, Z. Palaeozoic tectonics of the south–western Chinese Tianshan: New insights from a structural study of the high–pressure/low–temperature metamorphic belt. Int. J. Earth Sci. 2009, 98, 1259–1274. [Google Scholar] [CrossRef]
  10. Kröner, A.; Alexeiev, D.V.; Hegner, E.; Rojas–Agrmonte, Y.; Corini, M.; Chao, Y.; Wong, J.; Windley, B.F.; Liu DTretyakov, A.A. Zircon and muscovite ages, geochemistry, and Nd–Hf isotopes for the Aktyuz metamorphic terrane: Evidence for an Early Ordovician collisional belt in the northern Tianshan of Kyrgyzstan. Gondwana Res. 2012, 21, 901–927. [Google Scholar] [CrossRef]
  11. Xiao, W.J.; Windley, B.F.; Allen, M.; Han, C.M. Paleozoic multiple accretionary and collisional tectonics of the Chinese Tianshan orogenic collage. Gandwana Res. 2013, 23, 1316–1341. [Google Scholar] [CrossRef]
  12. Xue, C.; Chi, G.; Li, Z.; Dong, X.F. Geology, geochemistry and genesis of the Cretaceous and Paleocene sandstone– and conglomerate–hosted Uragen Zn–Pb deposit, Xinjiang, China: A review. Ore Geol. Rev. 2014, 63, 328–342. [Google Scholar] [CrossRef]
  13. Xue, C.J.; Zhao, X.B.; Mo, X.X.; Chen, Y.C.; Dong, L.H.; Gu, X.X.; Zhang, Z.C.; Bakhtiar, N.; Nikolay, P.; Li, Z.D.; et al. Tectonic–metallogenic evolution of Western Tianshan giant Au–Cu–Zn–Pb metallogenic belt and prospecting orientation. Acta Geol. Sin. 2014, 88, 2490–2531, (In Chinese with English Abstract). [Google Scholar]
  14. Dai, Y.L. Geological characteristics and genesis of Kuergashengbulake Pb–Zn deposit. Miner. Resour. Geol. 1994, 8, 326–329, (In Chinese with English Abstract). [Google Scholar]
  15. Liu, F.M. Geological characteristics and genesis of Kuergasheng Pb–Zn deposit. Xinjiang Nonferrous Met. 2007, 3, 7–9, (In Chinese with English Abstract). [Google Scholar]
  16. Duan, S.X.; Xue, C.J.; Li, Y.; Shi, H.G.; Jia, Z.Y. Geology, fluid inclusions and isotopic geochemistry of Kuergasheng lead–zinc deposit in western Tianshan, Xinjiang. Miner. Depos. 2012, 31, 1014–1024, (In Chinese with English Abstract). [Google Scholar]
  17. Yi, Q.A.; Di, X.C.; Bian XMa, Y.Z. Geological features of Kuergasheng Pb–Zn deposit in Bole, Xinjiang. Xinjiang Nonferrous Met. 2013, 4, 30–33, (In Chinese with English Abstract). [Google Scholar]
  18. Liu, C.; Xue, C.J.; Chi, G.X.; Zhao, X.B.; Li, Y. Geology, geochronology and geochemistry of the Dabate Cu–Mo deposit, northern Chinese Tien Shan: Implications for spatial separation of copper and molybdenum mineralization. Ore Geol. Rev. 2018, 92, 542–557. [Google Scholar] [CrossRef]
  19. Zhang, Z.H.; Wang, Z.L.; Zuo, G.C.; Liu, M.; Wang, L.S.; Wang, J.W. Ages and tectonic settings of the volcanic rocks in Dabate ore district in West Tianshan Mountains and their constraints on the porphyry-type mineralization. Acta Petrol. Sin. 2008, 82, 1494–1503, (In Chinese with English Abstract). [Google Scholar]
  20. Tang, G.J.; Wang, Q.; Wyman, D.A.; Sun, M.; Li, Z.X.; Zhao, Z.H.; Sun, W.D.; Jia, X.H.; Jiang, Z.Q. Geochronology and geochemistry of Late Paleozoic magmatic rocks in the Lamasu–Dabate area, northwestern Tianshan (west China): Evidence for a tectonic transition from arc to post–collisional setting. Lithos 2010, 119, 393–411. [Google Scholar] [CrossRef] [Green Version]
  21. Goldstein, R.H.; Reynolds, T.J. Systematics of fluid inclusions in diagenetic minerals. Soc. Sediment. Geol. Sepm Short Course 1994, 31, 1–199. [Google Scholar]
  22. Clayton, R.N.; Mayeda, T.K. The use of bromine pentafluoride in the extraction of oxygen from oxides and silicates for isotopic analysis. Geochim. Cosmochim. Acta 1963, 27, 43–52. [Google Scholar] [CrossRef]
  23. Robinson, B.W.; Kusakabe, M. Quantitative preparation of sulfur dioxide, for 34S/32S analyses, from sulfides by combustion with cuprous oxide. Anal. Chem. 1975, 47, 1179–1181. [Google Scholar] [CrossRef]
  24. Roedder, E. Fluid inclusions. Rev. Mineral. 1984, 12, 644. [Google Scholar]
  25. Hollister, L.S.; Burruss, R.C. Phase equilibria in fluid inclusions from the Khtada Lake metamorphic complex. Geochim. Cosmochim. Acta 1976, 40, 163–175. [Google Scholar] [CrossRef]
  26. Shepherd, T.J.; Rankin, A.H.; Alderton, D. A Practical Guide to Fluid Inclusion Studies; Blackie and Son: Glasgow, UK, 1985; p. 239. [Google Scholar]
  27. Goldstein, R.H. Petrographic analysis of fluid inclusions. In Fluid Inclusion: Analysis and Interpretation; Mineralogical Association of Canada: Ottawa, ON, Canada, 2003; Volume 32, pp. 9–53. [Google Scholar]
  28. Clayton, R.N.; O’Neil, J.R.; Mayeda, T.K. Oxygen isotope exchange between quartz and water. J. Geophys. Res. 1972, 77, 3057–3067. [Google Scholar] [CrossRef]
  29. Ramboz, C.; Pichavant, M.; Weisbrod, A. Fluid immiscibility in natural processes: Use and misuse of fluid inclusion data: II. Interpretation of fluid inclusion data in terms of immiscibility. Chem. Geol. 1982, 37, 1–27. [Google Scholar] [CrossRef]
  30. Li, S.D.; Zhang, X.B.; Gao, L.L. Ore genesis at the Jinchang gold–copper deposit in Heilongjiang Province, Northeastern China: Evidence from geology, fluid inclusions, and H–O–S isotopes. Minerals 2019, 9, 99. [Google Scholar] [CrossRef] [Green Version]
  31. Driesner, T.; Heinrich, C.A. The system H2O–NaCl. Part I: Correlation formulae for phase relations in temperature–pressure–composition space from 0 to 1000 °C, 0 to 5000 bar, and 0 to 1 XNaCl. Geochim. Cosmochim. Acta 2007, 71, 4880–4901. [Google Scholar] [CrossRef]
  32. Zhu, J.J.; Hu, R.; Richards, J.P.; Bi, X.; Zhong, H. Genesis and magmatic–hydrothermal evolution of the Yangla skarn Cu deposit, southwest China. Econ. Geol. 2015, 110, 631–652. [Google Scholar] [CrossRef]
  33. Hedenquist, J.W.; Richards, J.P. The influence of geochemical techniques on the development of genetic models for porphyry copper deposits. In Reviews in Economic Geology: Techniques in Hydrothermal Ore Deposits Geology; Richards, J.P., Larson, P.B., Eds.; Society of Economic Geologists, Inc.: Littleton, CO, USA, 1998; pp. 235–256. [Google Scholar]
  34. Siahcheshm, K.; Calagari, A.A.; Abedini, A. Hydrothermal evolution in the Maher–Abad porphyry Cu–Au deposit, SW Birjand, Eastern Iran: Evidence from fluid inclusions. Ore Geol. Rev. 2014, 58, 1–13. [Google Scholar] [CrossRef]
  35. Taylor, H. The application of oxygen and hydrogen isotope studies to problems of hydrothermal alteration and ore deposition. Econ. Geol. 1974, 69, 843–883. [Google Scholar] [CrossRef]
  36. Heinrich, C.A.; Driesner, T.; Stefánsson, A.; Seward, T.M. Magmatic vapor contraction and the transport of gold from the porphyry environment to epithermal ore deposits. Geology 2004, 32, 761–764. [Google Scholar] [CrossRef]
  37. Ulrich, T.; Gunther, D.; Heinrich, C.A. The evolution of a porphyry Cu–Au deposit, based on LA–ICP–MS analysis of fluid inclusions: Bajo de la Alumbrera, Argentina. Econ. Geol. 2002, 97, 1889–1920. [Google Scholar] [CrossRef]
  38. Clark, I.D.; Fritz, P. Environmental Isotopes in Hydrogeology; Lewis Publishers: New York, NY, USA, 1997; pp. 1–328. [Google Scholar]
  39. Rye, R.O.; Ohmoto, H. Sulfur and carbon isotopes and ore genesis: A review. Econ. Geol. 1974, 69, 826–842. [Google Scholar] [CrossRef]
  40. Ohmoto, H. Systematics of sulfur and carbon isotopes in hydrothermal ore deposits. Econ. Geol. 1972, 67, 551–578. [Google Scholar] [CrossRef]
  41. Ohmoto, H.; Goldhaber, M. Sulphur and carbon isotopes. In Geochemistry of Hydrothermal Ore Deposits; Barnes, H.L., Ed.; Wiley: New York, NY, USA, 1997; pp. 517–611. [Google Scholar]
  42. Zheng, Y.F. Stable Isotope Geochemistry; Science Press: Beijing, China, 2000; (In Chinese with English Abstract). [Google Scholar]
  43. Li, Y. Geological and Geochemical Characteristics and Genesis of Dabate Cu–Mo Deposit, Western Tianshan, Xinjiang. Master’s Thesis, China University of Geosciences, Beijing, China, 2012. (In Chinese with English Abstract). [Google Scholar]
  44. Yin, Y.Q.; Xie, X.; Wang, J.W.; Wang, Y.S.; Tian, W.; Liu, Y.H.; Liu, F.M. Geologic geochemistry characteristics of the Beidabate body in Wenquan County, Xinjiang. J. Guilin Univ. Technol. 2006, 26, 449–455, (In Chinese with English Abstract). [Google Scholar]
  45. Zartman, R.E.; Doe, B.R. Plumbotectonics–the Model. Tectonophysics 1981, 75, 135–162. [Google Scholar] [CrossRef]
  46. Bierlein, F.P.; McNaughton, N.J. Pb isotope fingerprinting of mesothermal gold deposits from central Victoria, Australia: Implications for ore genesis. Miner. Depos. 1998, 33, 633–638. [Google Scholar] [CrossRef]
  47. Qiu, Y.; McNaughton, N.J. Source of Pb in orogenic lode–gold mineralisation: Pb isotope constraints from deep crustal rocks from the southwestern Archaean Yilgarn Craton, Australia. Miner. Depos. 1999, 34, 366–381. [Google Scholar] [CrossRef]
  48. Stacey, J.S. Approximation of terrestrial lead isotope evolution by a two–stage model. Earth Planet. Sci. Lett. 1975, 26, 207–221. [Google Scholar] [CrossRef]
  49. Doe, B.R.; Zartman, R.E. Plumbotectonics, the Phanerozoic. In Geochemistry of Hydrothermal Ore Deposits, 2nd ed.; Barenes, H.L., Ed.; John Wiley: New York, NY, USA, 1979; pp. 509–567. [Google Scholar]
  50. Li, S.D.; Wang, K.Y.; Wang, Y.C.; Zhang, X.B.; Quan, H.Y. Genesis of the Bairendaba Ag–Zn–Pb deposit, Southern Great Xing’an Range, NE China: A fluid inclusion and stable isotope study. Geofluids 2017, 2017, 1206587. [Google Scholar] [CrossRef] [Green Version]
Figure 1. (A) Tectonic framework of the WTO (modified after Biske and Seltmann [7]); (B) Geological map of the Sayram Lake area (modified after Xue et al. [12]).
Minerals 10 00592 g001
Figure 2. Geological map of the Kuergasheng Pb–Zn deposit (modified after Liu et al. [15]).
Minerals 10 00592 g002
Figure 3. Photographs of ore veins from the Kuergasheng Pb–Zn deposit. (A) Pyrite–chalcopyrite–quartz vein with malachite; (B) Pyrite–chalcopyrite–quartz vein with porous structure; (C) Galena–sphalerite–quartz vein with wall rock breccia; (D) Galena–sphalerite–quartz vein with miarolitic structure; (E,F) Galena–sphalerite–quartz veins crosscutting pyrite–chalcopyrite–quartz veins; (G) Sulfide–poor–calcite–quartz veins; (H,I) Sulfide–poor–calcite–quartz veins crosscutting galena–sphalerite–quartz veins.
Minerals 10 00592 g003
Figure 4. Photomicrographs showing important mineral assemblages of the Kuergasheng Pb–Zn deposit. (A) Pyrite replaced by an aggregate of chalcopyrite and sphalerite; (B) Chalcopyrite replaced by sphalerite; (C) Poikilitic texture; (D) Reaction rim texture; (E) Sphalerite grows along fissures in galena. (F) Sphalerite with brown internal reflection color. Abbreviations: Py (pyrite); Ccp (chalcopyrite); Gn (galena); Sp (sphalerite).
Minerals 10 00592 g004
Figure 5. Mineral paragenesis of the Kuergasheng Pb–Zn deposit.
Minerals 10 00592 g005
Figure 6. Photomicrographs of FIAs in quartz from stages 1–3 of the Kuergasheng Pb–Zn deposit. (A) LV-type FIAs in sample KR–1; (B) LV-type FIA and VL-type FIA in sample KR–2; (C) Boiling FIA (S– and VL-type FIs) in sample KR–5; (D) Boiling FIA in sample KR–7; (E) LV-type FIAs in sample KR–19; (F) LV-type FIAs in sample KR–20; (G) LV-type FIAs in sample KR–30. Abbreviations: L (liquid phase), V (vapor phase), S (daughter mineral).
Minerals 10 00592 g006
Figure 7. (A) Homogenization temperature vs. salinity in the NaCl−H2O system for FIAs from stages 1−3 in the Kuergasheng Pb−Zn deposit; (B) Pressure estimates for FIs of the Kuergasheng Pb–Zn deposit. Isobars were calculated using the equations of Driesner and Heinrich [31].
Minerals 10 00592 g007
Figure 8. Diagram showing δDH2O vs. δ18OH2O, representing different stages of mineralization in the Kuergasheng Pb–Zn deposit. Fields showing primary magmatic, metamorphic, and meteoric waters are from Taylor [35].
Minerals 10 00592 g008
Figure 9. δ13C values of quartz and fluorite from the Kuergasheng Pb–Zn deposit compared with values from important geological reservoirs (data from Clark and Fritz [38]).
Minerals 10 00592 g009
Figure 10. Lead isotope compositions for sulfides in the Kuergasheng Pb–Zn deposit. (A) 207Pb/204Pb vs. 206Pb/204Pb plot. (B) 208Pb/204Pb vs. 206Pb/204Pb plot. The average growth curve is from Zartman and Doe [45]. Abbreviations: UC—upper crust; LC—lower crust; O—orogenic; M—mantle. Pb isoplot data of the Beidabate intrusive body are from Li [43].
Minerals 10 00592 g010
Figure 11. Genetic model diagram of the Kuergasheng Pb–Zn deposit depicting the evolution of the hydrothermal system.
Minerals 10 00592 g011
Table 1. Microthermometric data from FIAs in hydrothermal quartz of the Kuergasheng Pb–Zn deposit.
SampleHost MineralFIAFI TypeNumberGas–Liquid
Ratio
Tm (ice)
(°C)
Tm (NaCl)
(°C)
Salinity
(NaCl wt %)
Th
(°C)
KR–1Quartz from pyrite–
chalcopyrite–
quartz veins (stage 1)
FIA–1LV810−6.3 to −5.3 8.3–9.6 (9.0 ± 0.4)221–235 (228 ± 4)
FIA–2LV215−5.5 to −5.1 8.0–8.5 (8.3 ± 0.4)232–240 (234 ± 5)
KR–2FIA–3VL380−1.5 to −1.0 1.7–2.6 (2.2 ± 0.4)241–248 (245 ± 3)
FIA–4LV330−5.0 to −5.7 7.9–8.8 (2.5 ± 0.4)235–243 (239 ± 3)
KR–5FIA–5VL385−1.8 to −1.2 2.1–3.1 (9.0 ± 0.4)245–252 (248 ± 3)
S220 223–25433.1–34.9 (34.0 ± 0.9)242–254 (248 ± 6)
FIA–6LV715−4.7 to−3.8 6.2–7.4 (6.7 ± 0.4)235–246 (239 ± 4)
KR–7FIA–7VL490−1.8 to −1.0 1.7–3.1 (2.4 ± 0.5)238–249 (243 ± 4)
S315 226–24933.3–34.6 (33.9 ± 0.5)239–251 (246 ± 5)
KR–8FIA–8S620 215–23832.7–33.9 (33.3 ± 0.4)229–238 (234 ± 3)
FIA–9LV915−5.0 to −4.2 6.7–7.9 (7.4 ± 0.4)225–235 (231 ± 3)
KR–9FIA–10LV610−4.9 to −5.3 7.7–8.3 (8.1 ± 0.2)235–247 (240 ± 4)
FIA–11LV315−5.8 to −5.5 8.5–8.9 (8.1 ± 0.2)229–239 (234 ± 4)
KR–12Quartz from galena–
sphalerite–
quartz
(stage 2)
FIA–12LV510−4.8 to −3.9 6.3–7.6 (7.0 ± 0.5)182–194 (187 ± 4)
KR–15FIA–13LV610−5.0 to−4.2 6.7–7.9 (7.3 ± 0.4)196–207 (203 ± 4)
FIA–14S315 200–20531.9–32.1 (32.5 ± 0.3)209–220 (213 ± 5)
KR–16FIA–15LV615−4.5 to −3.1 5.1–7.2 (6.3 ± 0.7)183–191 (187 ± 2)
KR–19FIA–16LV820−4.9 to −4.1 6.6–7.7 (7.2 ± 0.3)182–196 (189 ± 5)
FIA–17LV415−4.3 to −3.5 5.7–6.9 (6.3 ± 0.4)179–189 (185 ± 3)
KR–20FIA–18LV515−4.9 to −3.6 5.9–7.7 (6.6 ± 0.5)194–206 (200 ± 4)
FIA–19LV410−4.2 to −3.5 5.7–6.7 (6.2 ± 0.4)189–203 (196 ± 5)
FIA–20LV210−3.8 to −3.6 5.9–6.2 (6.1 ± 0.2)185–190 (188 ± 3)
KR–22FIA–21LV815−4.7 to −3.5 5.7–7.4 (6.3 ± 0.6)183–199 (191 ± 5)
FIA–22LV910−4.2 to −3.2 5.3–6.7 (6.0 ± 0.5)173–189 (183 ± 5)
KR–23Quartz from sulfide-poor-
calcite–
quartz veins
(stage 3)
FIA–23LV215−3.3 to −3.0 5.3–5.4 (5.4 ± 0.1)168–171 (170 ± 5)
KR–25FIA–24LV1010−3.5 to −2.3 3.9–5.7 (4.7 ± 0.6)146–158 (150 ± 3)
FIA–25L6
KR–27FIA–26LV910−3.5 to −2.5 4.6–5.7 (4.8 ± 0.5)149–160 (155 ± 4)
FIA–27L8
KR–29FIA–28LV610−3.6 to −2.8 4.6–5.9 (5.2 ± 0.6)161–172 (168 ± 4)
KR–30FIA–29LV210−3.2 to −2.8 4.6–5.3 (5.0 ± 0.4)155–160 (158 ± 3)
FIA–30LV45−3.6 to −2.2 3.7–5.9 (4.6 ± 0.8)149–162 (154 ± 5)
FIA–31LV55−3.2 to −2.0 3.4–5.3 (4.6 ± 0.7)145–157 (150 ± 5)
L2
Abbreviations: FIA (fluid inclusion assemblage); LV, VL, S, and L (fluid inclusion types); Tm (ice) (final ice melting temperature); Tm (NaCl) (final halite crystal dissolving temperatures in the inclusions); Th (homogenization temperature).
Table 2. Oxygen, hydrogen, and carbon isotope data from hydrothermal quartz of the Kuergasheng Pb–Zn deposit.
SampleStageδ18Oqz (‰) SMOWδDH2O (‰) SMOWTh (°C)δ18OH2O (‰) SMOWδCH2O (‰) PDB
KR–2110.1−83.1242 ± 40.7 ± 0.2−9.1
KR–519.5−86.9243 ± 60.2 ± 0.3−11.5
KR–7110.9−85.6244 ± 51.7 ± 0.3−9.4
KR–918.5−87.4238 ± 5−1.0 ± 0.3−10.5
KR–1528.3−90.3206 ± 7−3.0 ± 0.4−13.9
KR–1928.1−90.1188 ± 5−4.4 ± 0.3−11.8
KR–2028.5−87.6196 ± 6−3.5 ± 0.4−13.2
KR–2228.6−88.5187 ± 7−4.0 ± 0.5−12.0
KR–2537.9−94.7150 ± 3−7.6 ± 0.3−16.0
KR–2737.8−96.5155 ± 4−7.3 ± 0.3−16.2
KR–2938.1−96.2168 ± 4−6.1 ± 0.5−15.5
KR–3037.6−99.2158 ± 3−7.7 ± 0.5−16.6
Table 3. Sulfur isotope data for galena from the Kuergasheng Pb–Zn deposit.
SampleMineralStageδ34SGn (‰) CDTδ34SH2S (‰) CDTTh (°C)
KR–12Galena25.67.4 ± 0.1187 ± 4
KR–16Galena26.58.3 ± 0.1187 ± 2
KR–19Galena267.8 ± 0.1189 ± 5
KR–20Galena26.17.7 ± 0.1200 ± 4
KR–25Galena36.69.4 ± 0.1150 ± 3
KR–27Galena36.99.5 ± 0.1155 ± 4
Table 4. Lead isotope data for galena from the Kuergasheng Pb–Zn deposit.
SampleMineralStage206Pb/204Pb207Pb/204Pb208Pb/204Pb
KR–12Galena218.25315.63238.097
KR–16Galena218.00215.59838.115
KR–19Galena218.24615.60238.149
KR–20Galena218.22115.61838.171
KR–25Galena318.26515.62838.199
KR–27Galena318.27315.64338.209
Table 5. Element abundance in lithologies of the Tuosikuertawu Formation and the Beidabate intrusive body.
Geological UnitLithologySampleCu (ppm)Pb (ppm)Zn (ppm)Cr (ppm)Ni (ppm)Co (ppm)V (ppm)
Tuosikuertawu
Formation
Medium
–fine grained sandstone
KB–1025.124.5210.354.622.110.080.7
KB–1826.132.2687.649.423.311.964.3
KB–2141.861.6529.163.629.813.585.9
Average31.039.4475.655.925.111.877.0
SiltstoneKB–425.220.590.149.025.310.466.6
KB–1524.020.4261.345.823.112.160.5
KB–1726.324.6137.849.723.810.868.6
KB–2667.923.0246.262.223.313.570.3
Average35.922.1183.851.723.811.766.5
Medium
–coarse grained sandstone
KB–232.730.7133.269.838.913.4117.7
KB–524.822.684.157.233.314.488.3
KB–1425.733.6474.446.020.710.062.8
KB–2880.121.9899.451.222.411.158.9
Average40.827.2397.856.128.812.281.9
Beidabate intrusive bodyC08–1274.76.923.026.32.82.510.7
B25–140.36.231.022.02.52.510.9
C7–2202.515.232.024.02.82.59.2
A2371.77.228.034.24.22.616.9
A12357.920.747.027.42.82.49.2
Average249.411.232.226.83.02.511.4
Clarke 30156070441295
Data from Dai [14] and Yin et al. [44].

