U-Pb, Ar-Ar, and Re-Os Geochronological Constraints on Multiple Magmatic–Hydrothermal Episodes at the Lake George Mine, Central New Brunswick


Abstract
1. Introduction
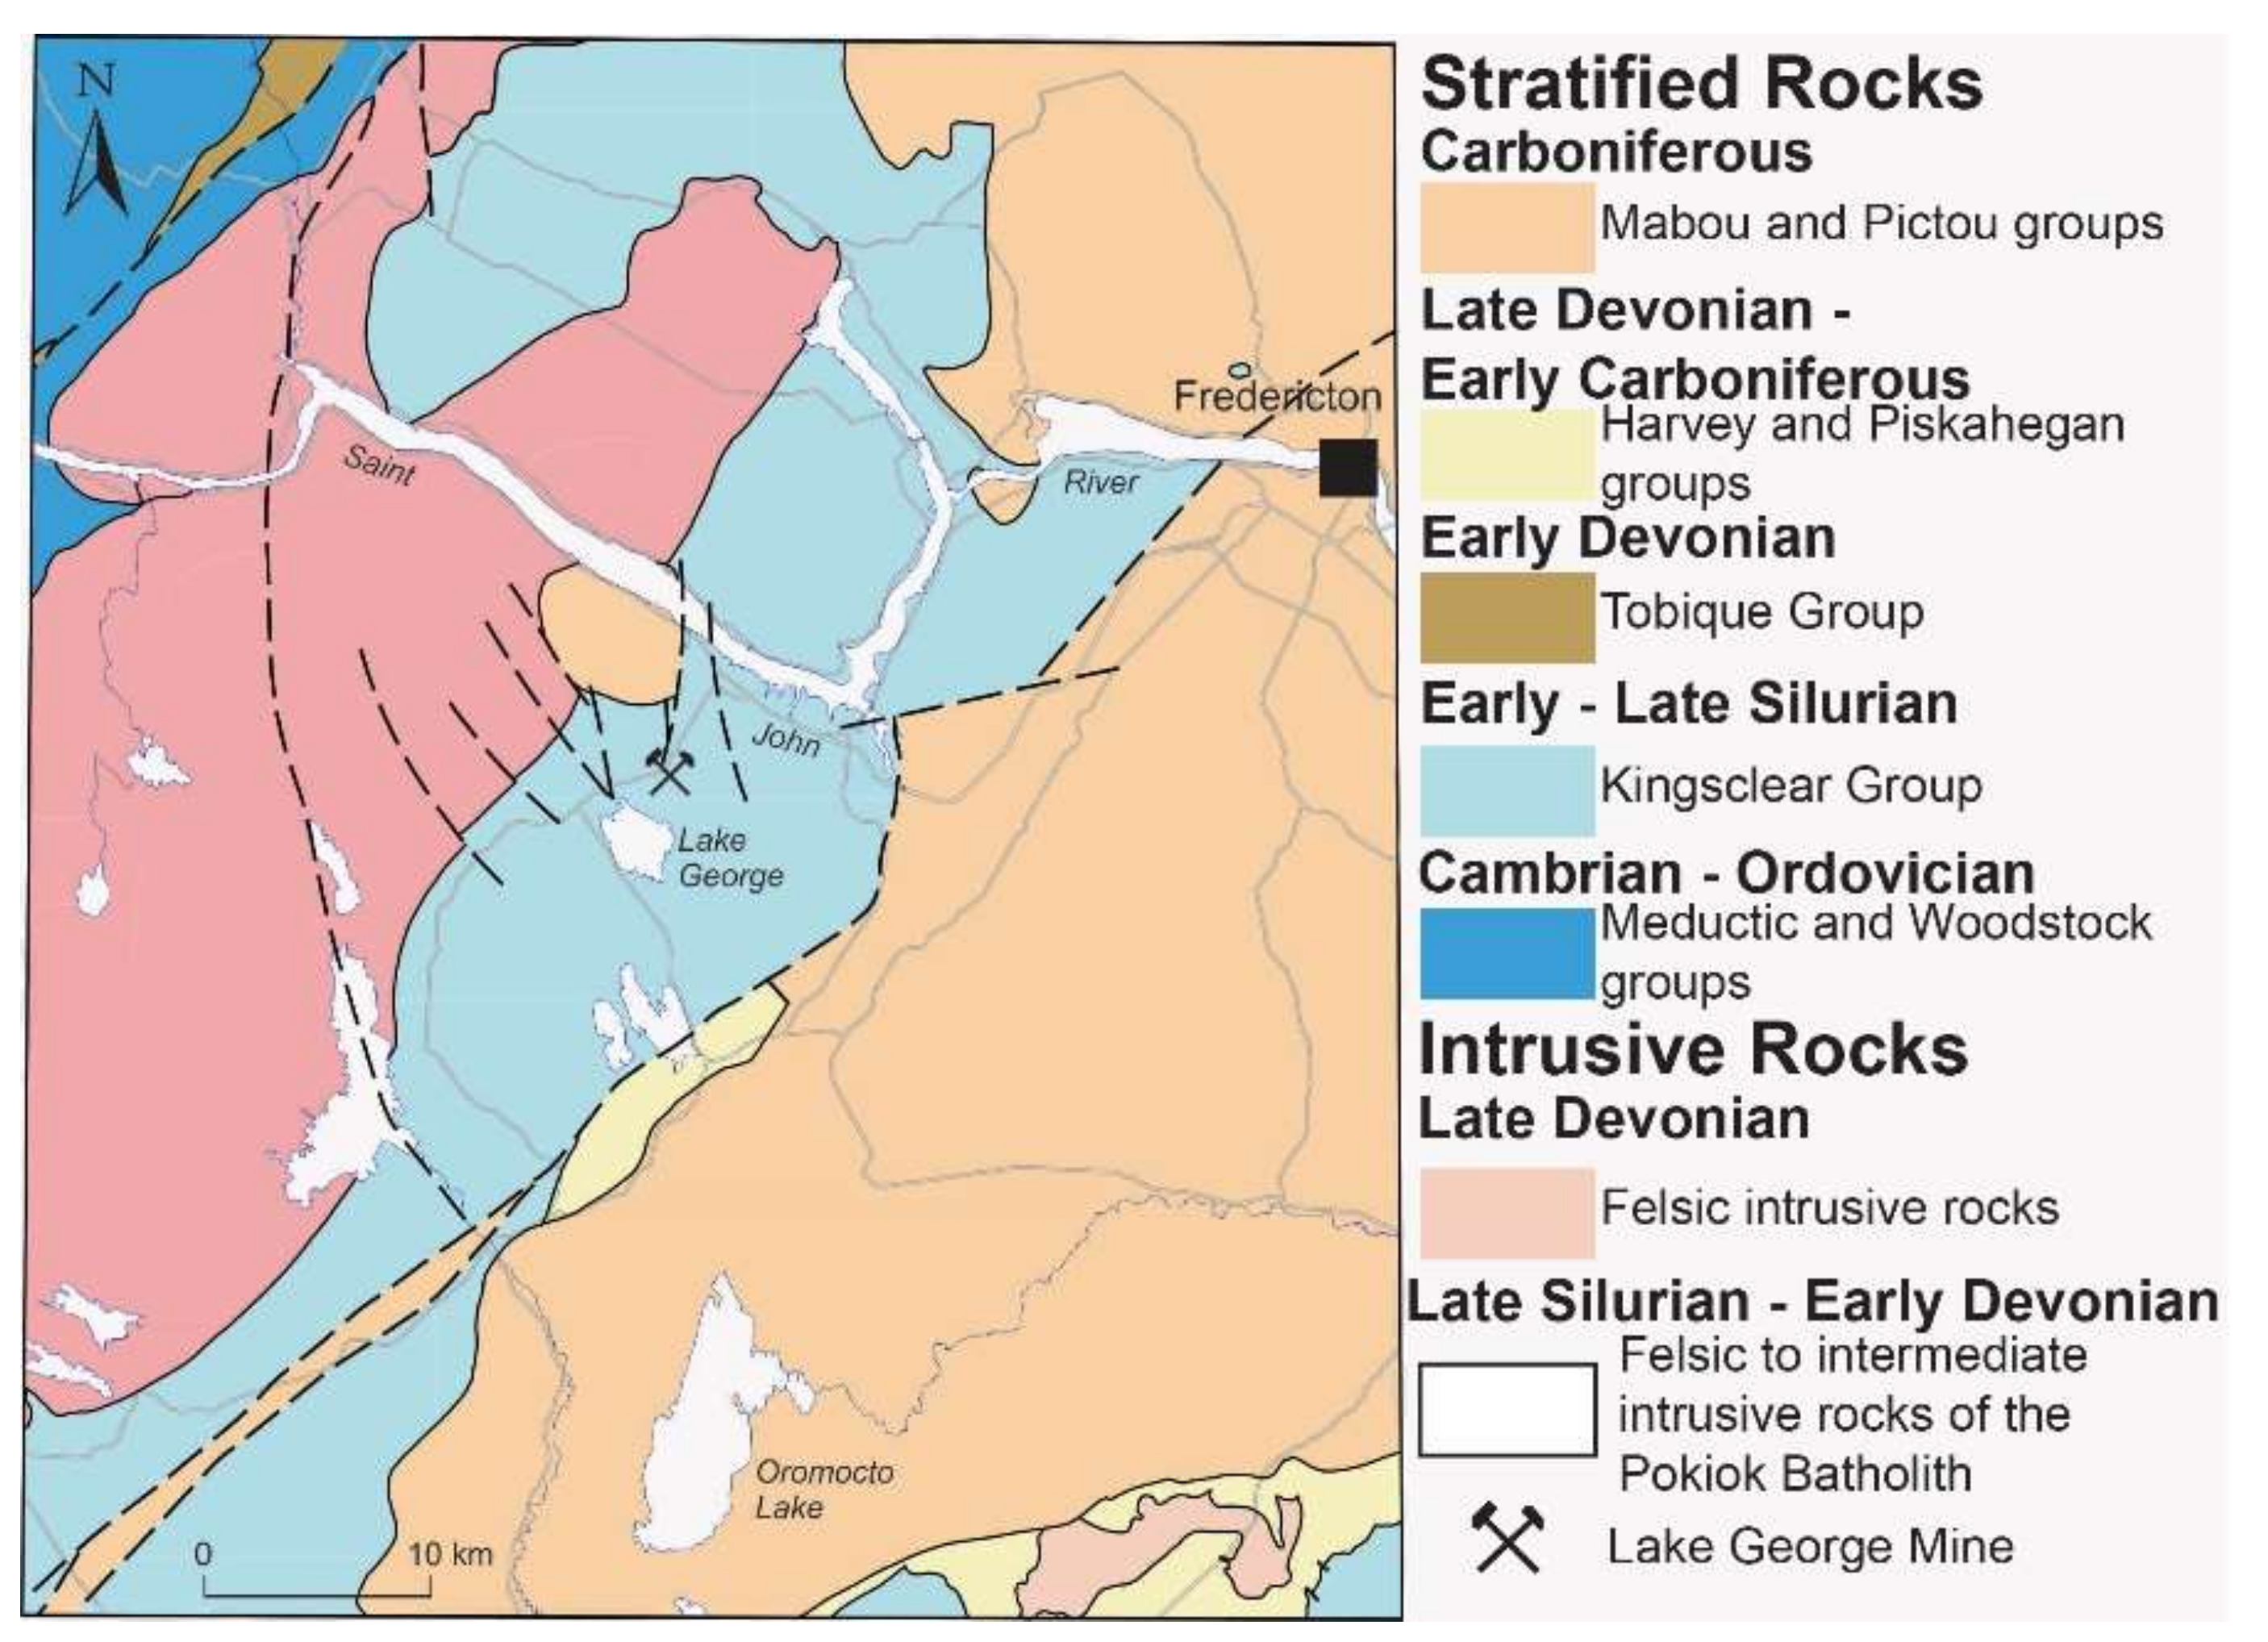
2. Regional Geology
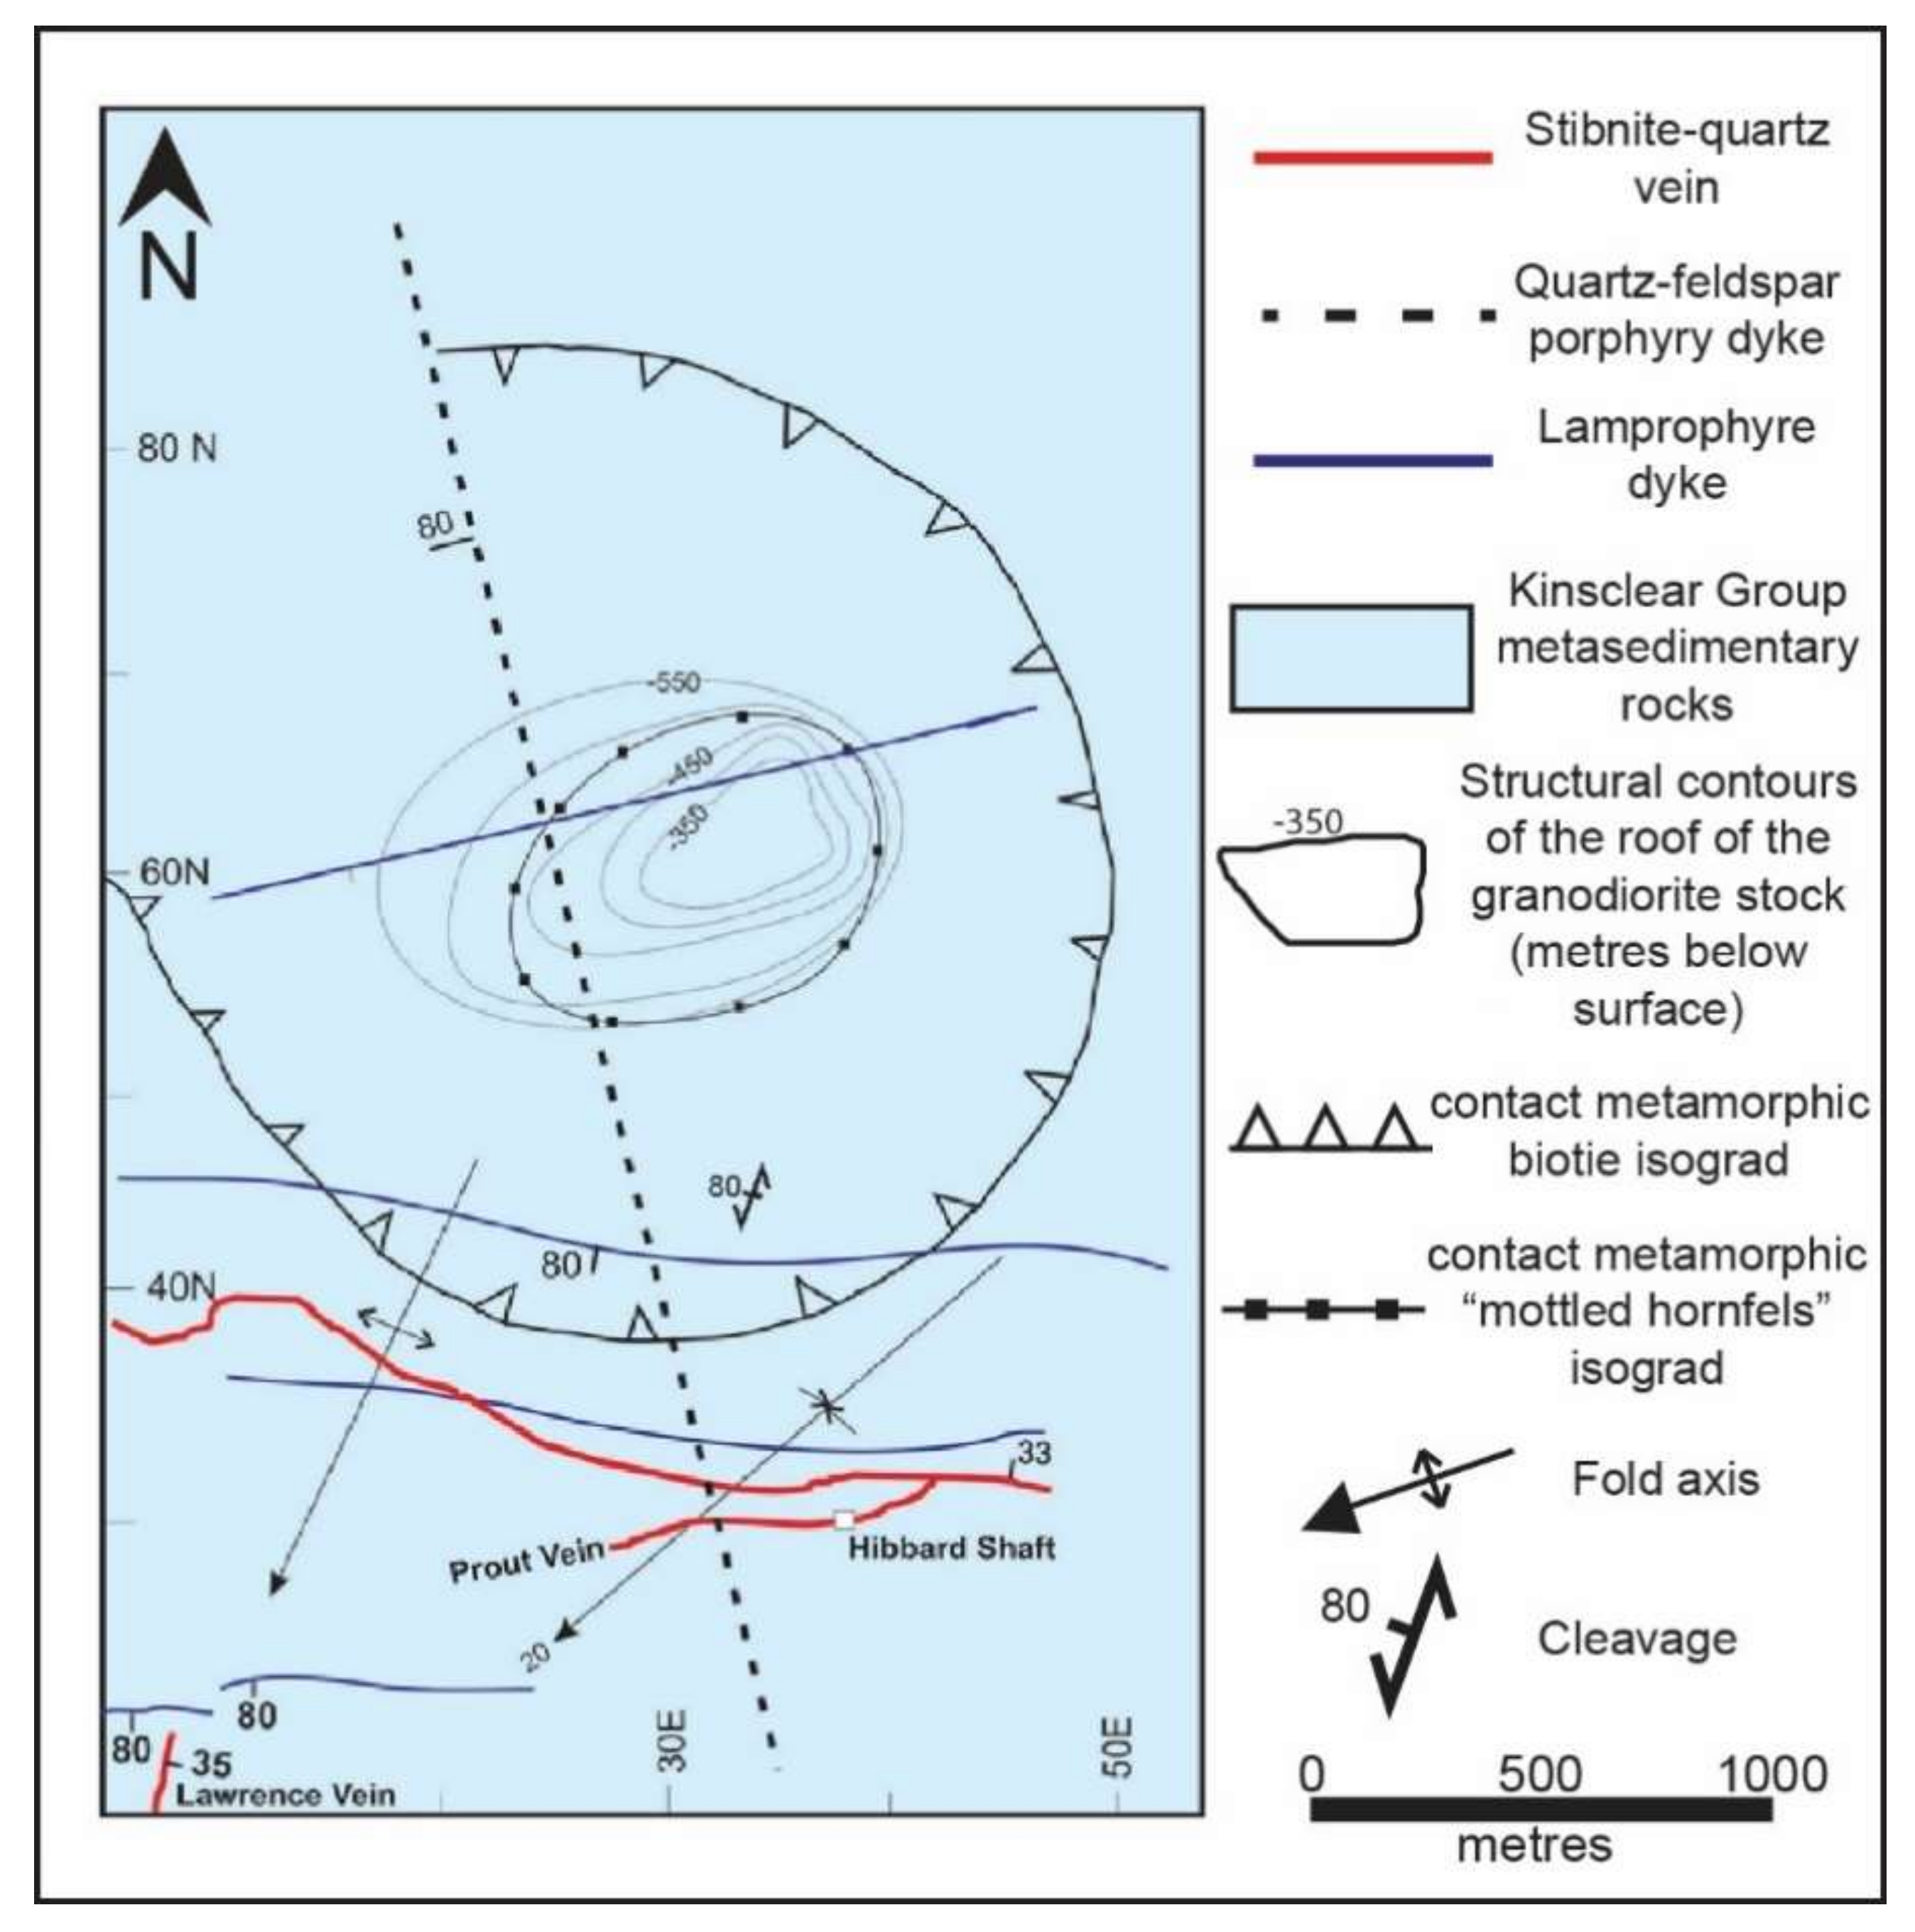
3. Mine Geology
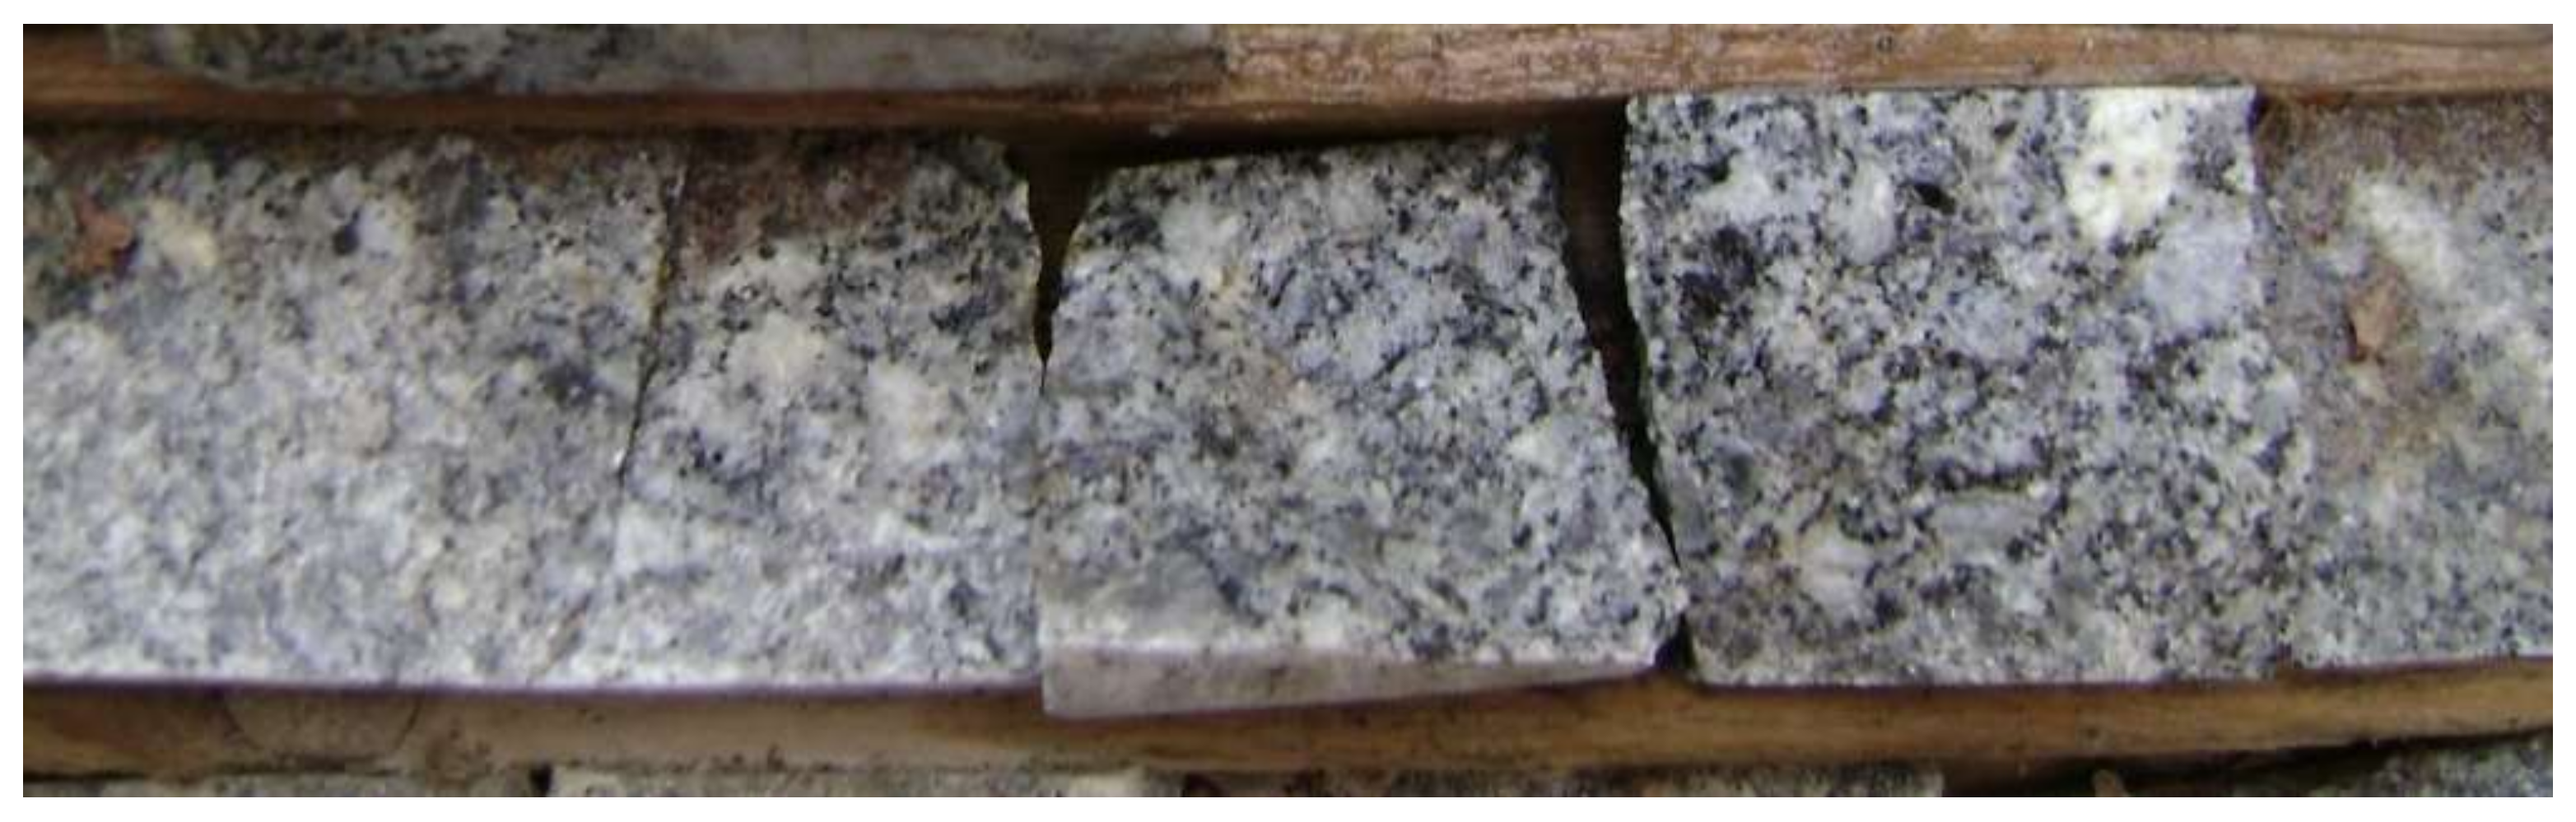
3.1. Lake George Granodiorite
3.2. Lamprophyre Dykes
3.3. QFP Dyke
4. Sampling
5. Analytical Methods
5.1. LA ICP-MS U-Pb Methodology
5.2. Re-Os Methodology
5.3. 40Ar/39Ar Methodology
6. Results
6.1. LA ICP-MS U-Pb Geochronology
6.1.1. Lake George Granodiorite
6.1.2. Lamprophyre Dykes
6.2. Re-Os Molybdenite (W-Mo Veins)
6.3. 40Ar/39Ar Geochronology
6.3.1. Lamprophyre Dyke (Phlogopite)
6.3.2. Au-Bearing Veins (Muscovite)
7. Discussion
7.1. Lake George Granodiorite
7.2. Lamprophyre Dyke
7.3. Au-Bearing Veins
7.3.1. LG-80-33-1848
7.3.2. 03-LG-1
7.3.3. LG-78-4-143.5
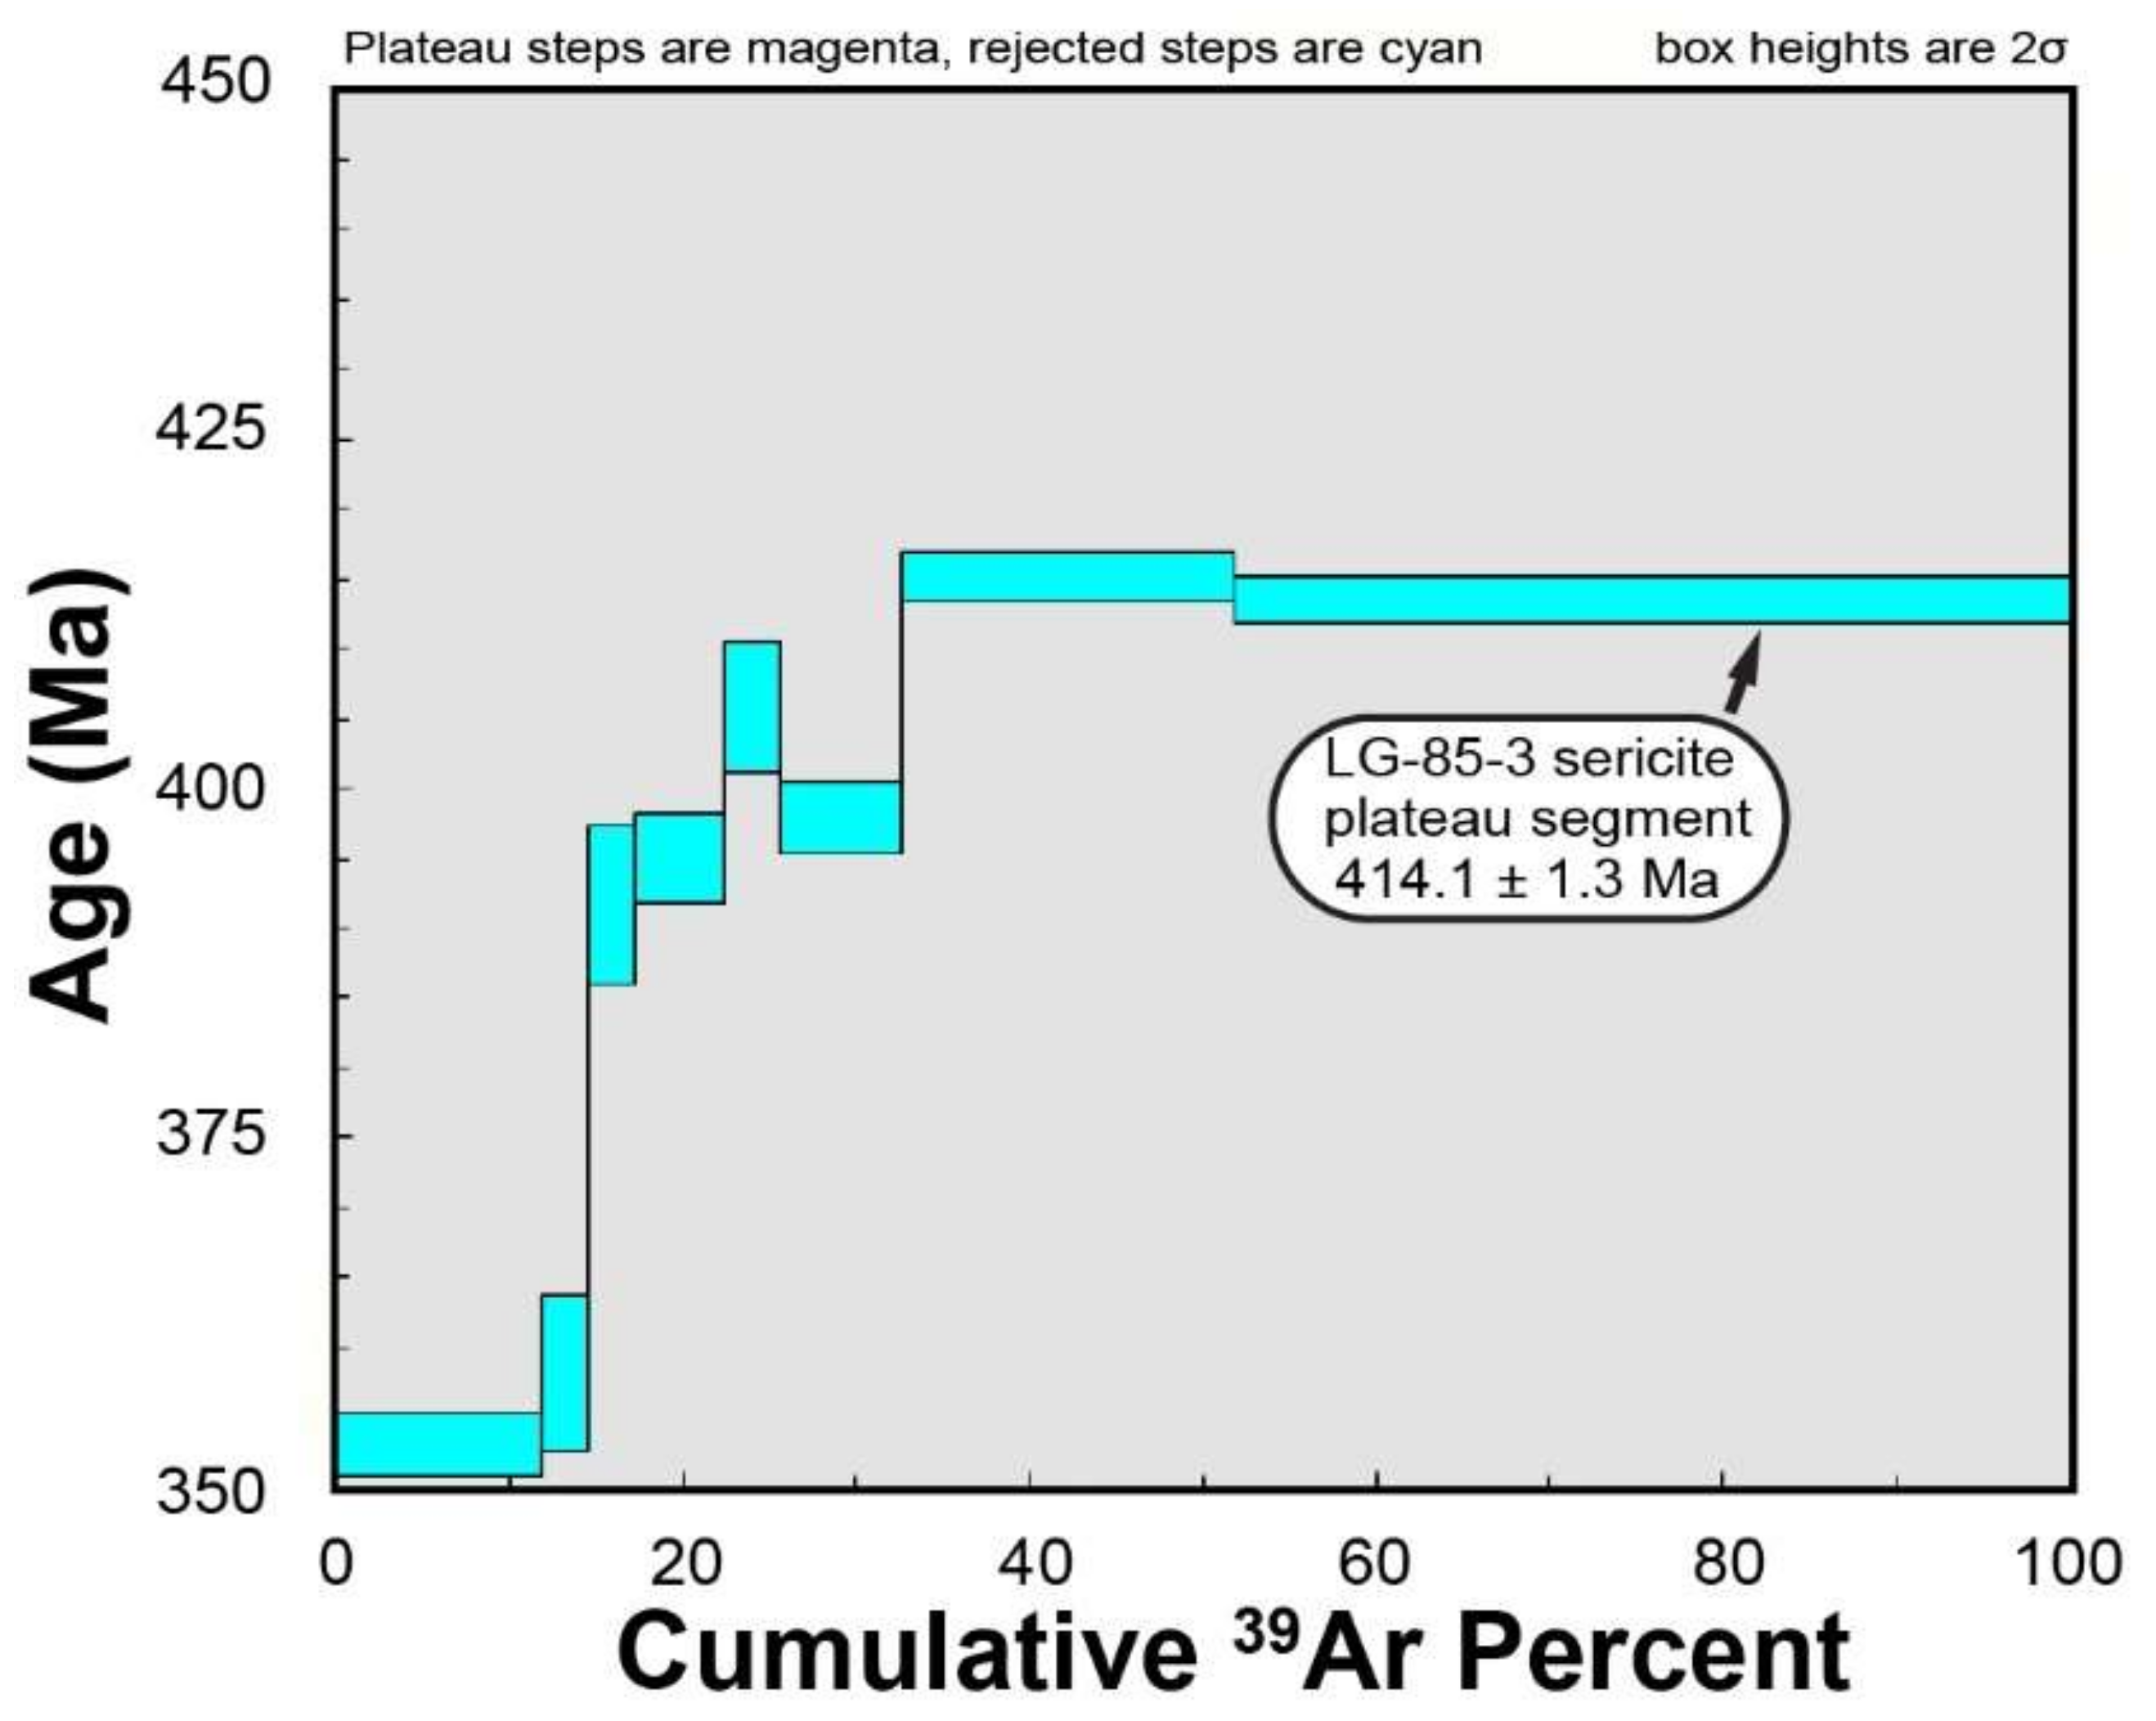
7.3.4. LG-85-3
8. Conclusions
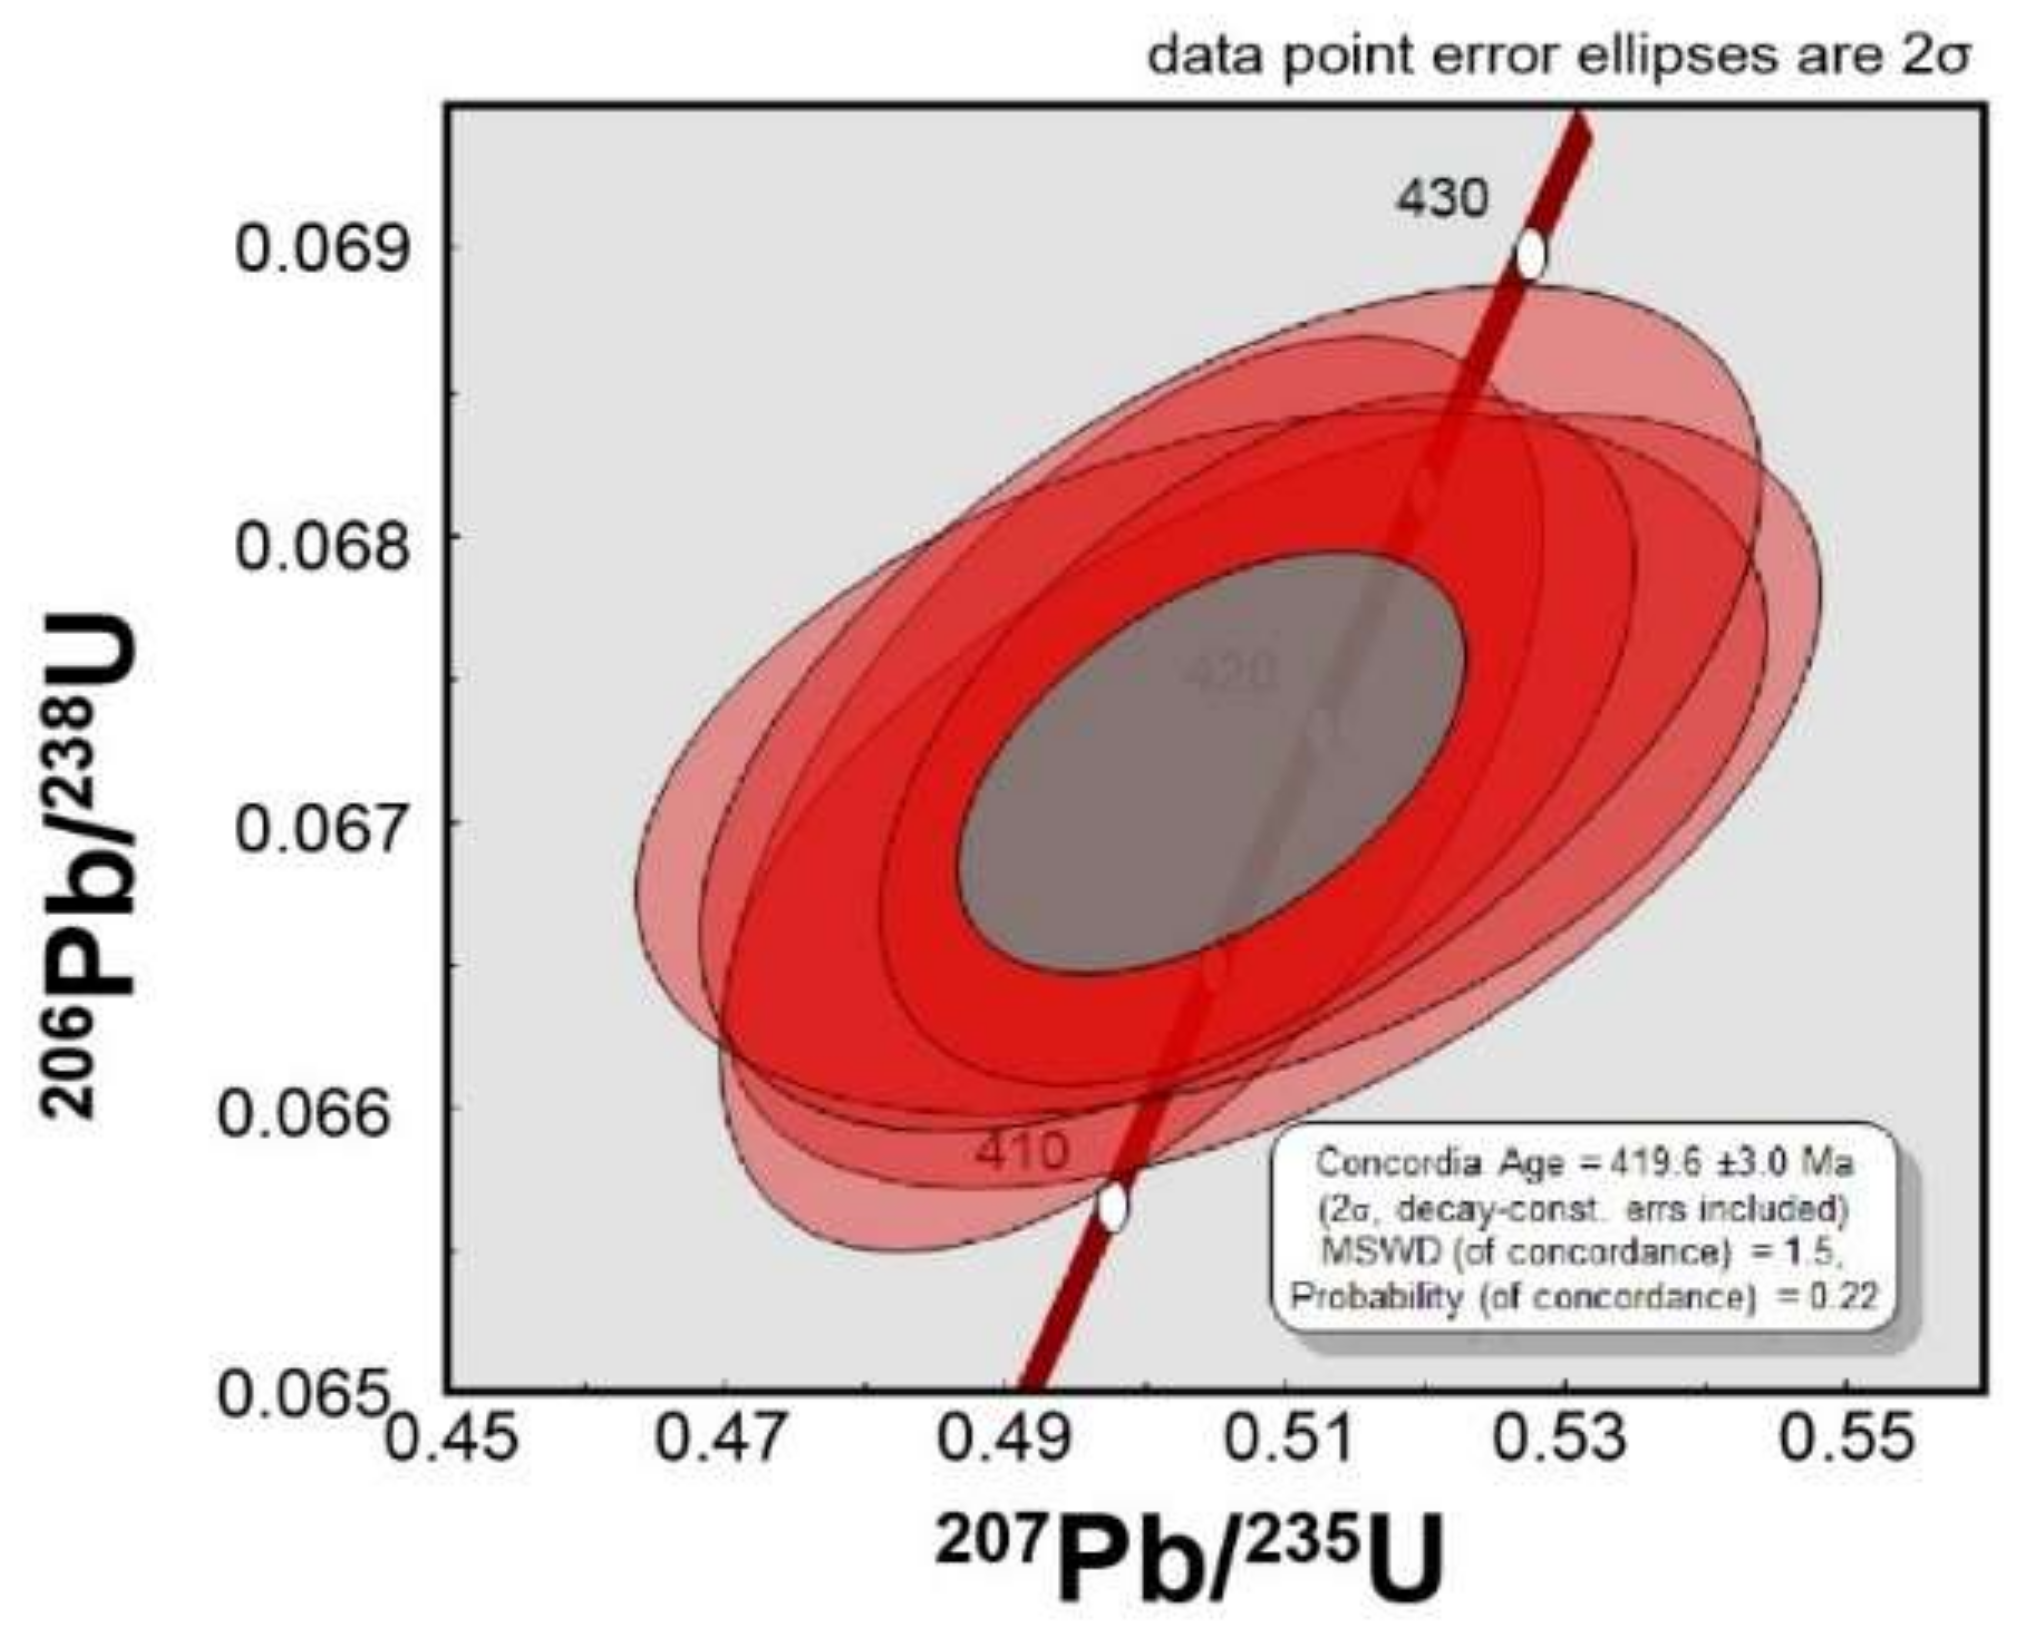
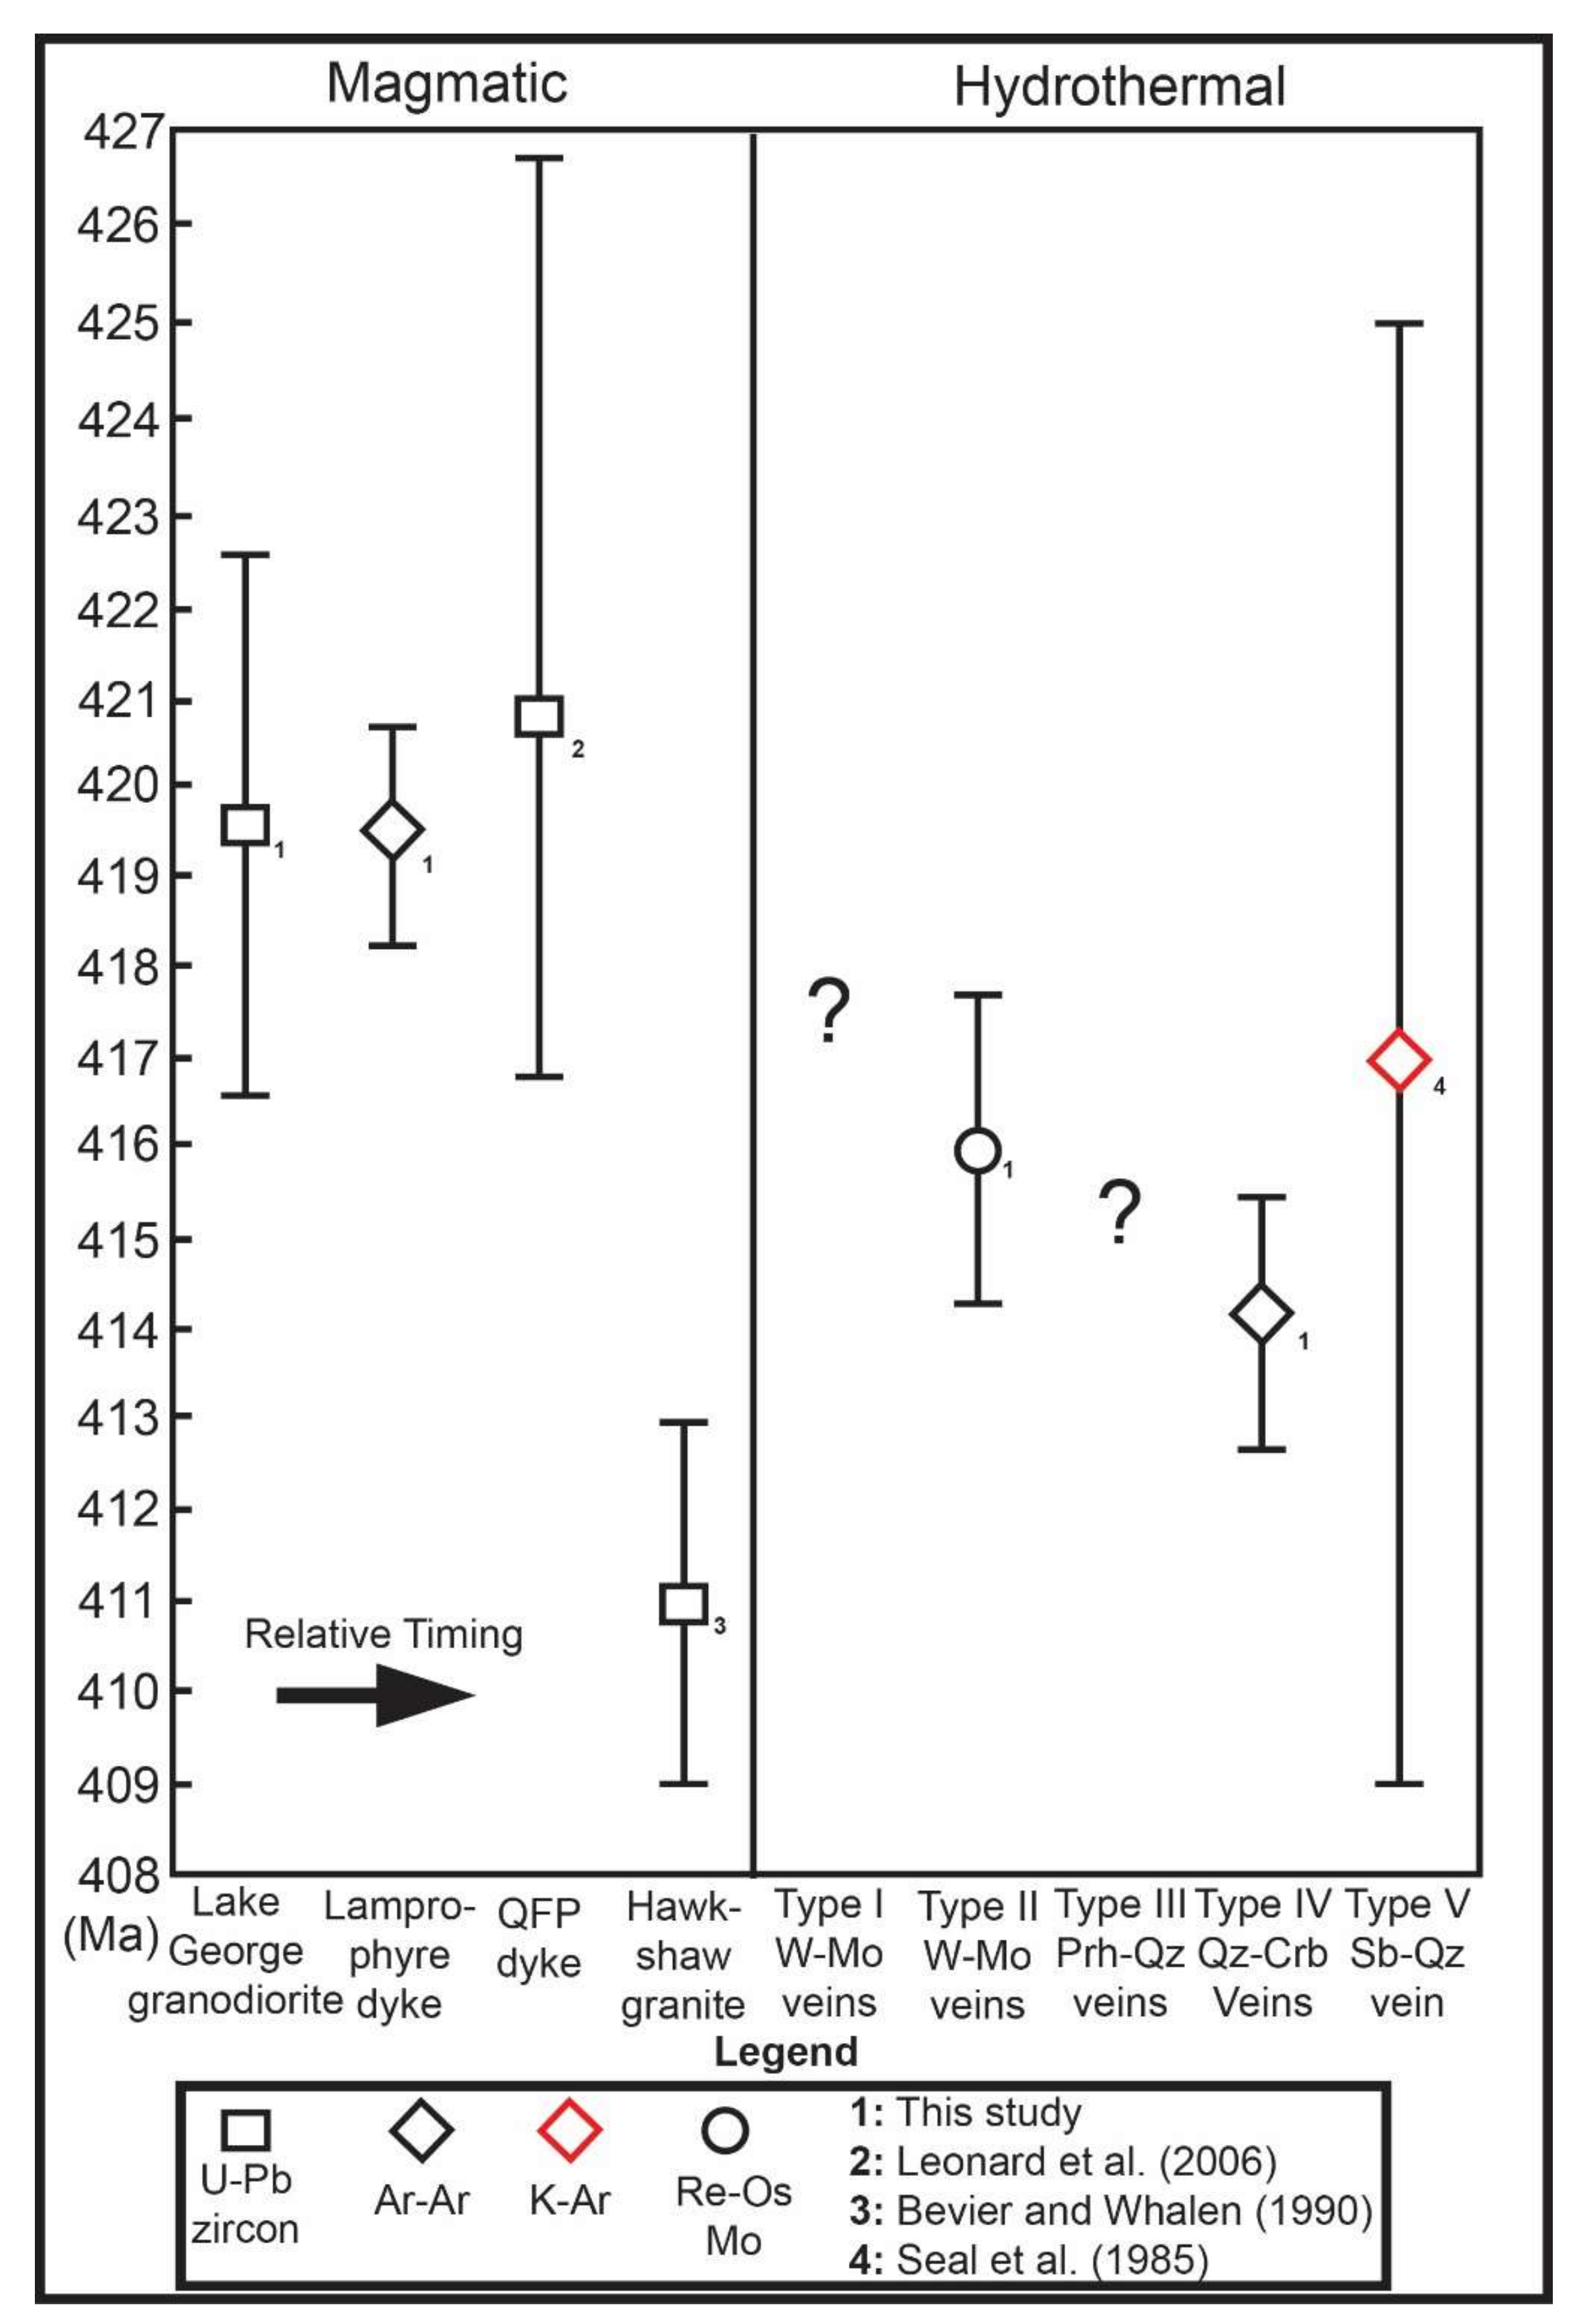
- LA ICP-MS analyses of zircon from the Lake George granodiorite produced a weighted mean 206Pb/238U date of 419.6 ± 3.0 Ma from 6 near-concordant zircon analyses. This age suggests that the Lake George Granodiorite is one of the oldest intrusions in the Pokiok Batholith and cannot be related to the nearby Hawkshaw Granite as previously proposed [23]. The Hartfield tonalite (415 ± 1 Ma, [20]) is the intrusion closest in age to the Lake George granodiorite. More recent work on the Hartfield tonalite suggests its age does overlap with the Lake George granodiorite (417 ± 2 Ma from zircon, [50]).
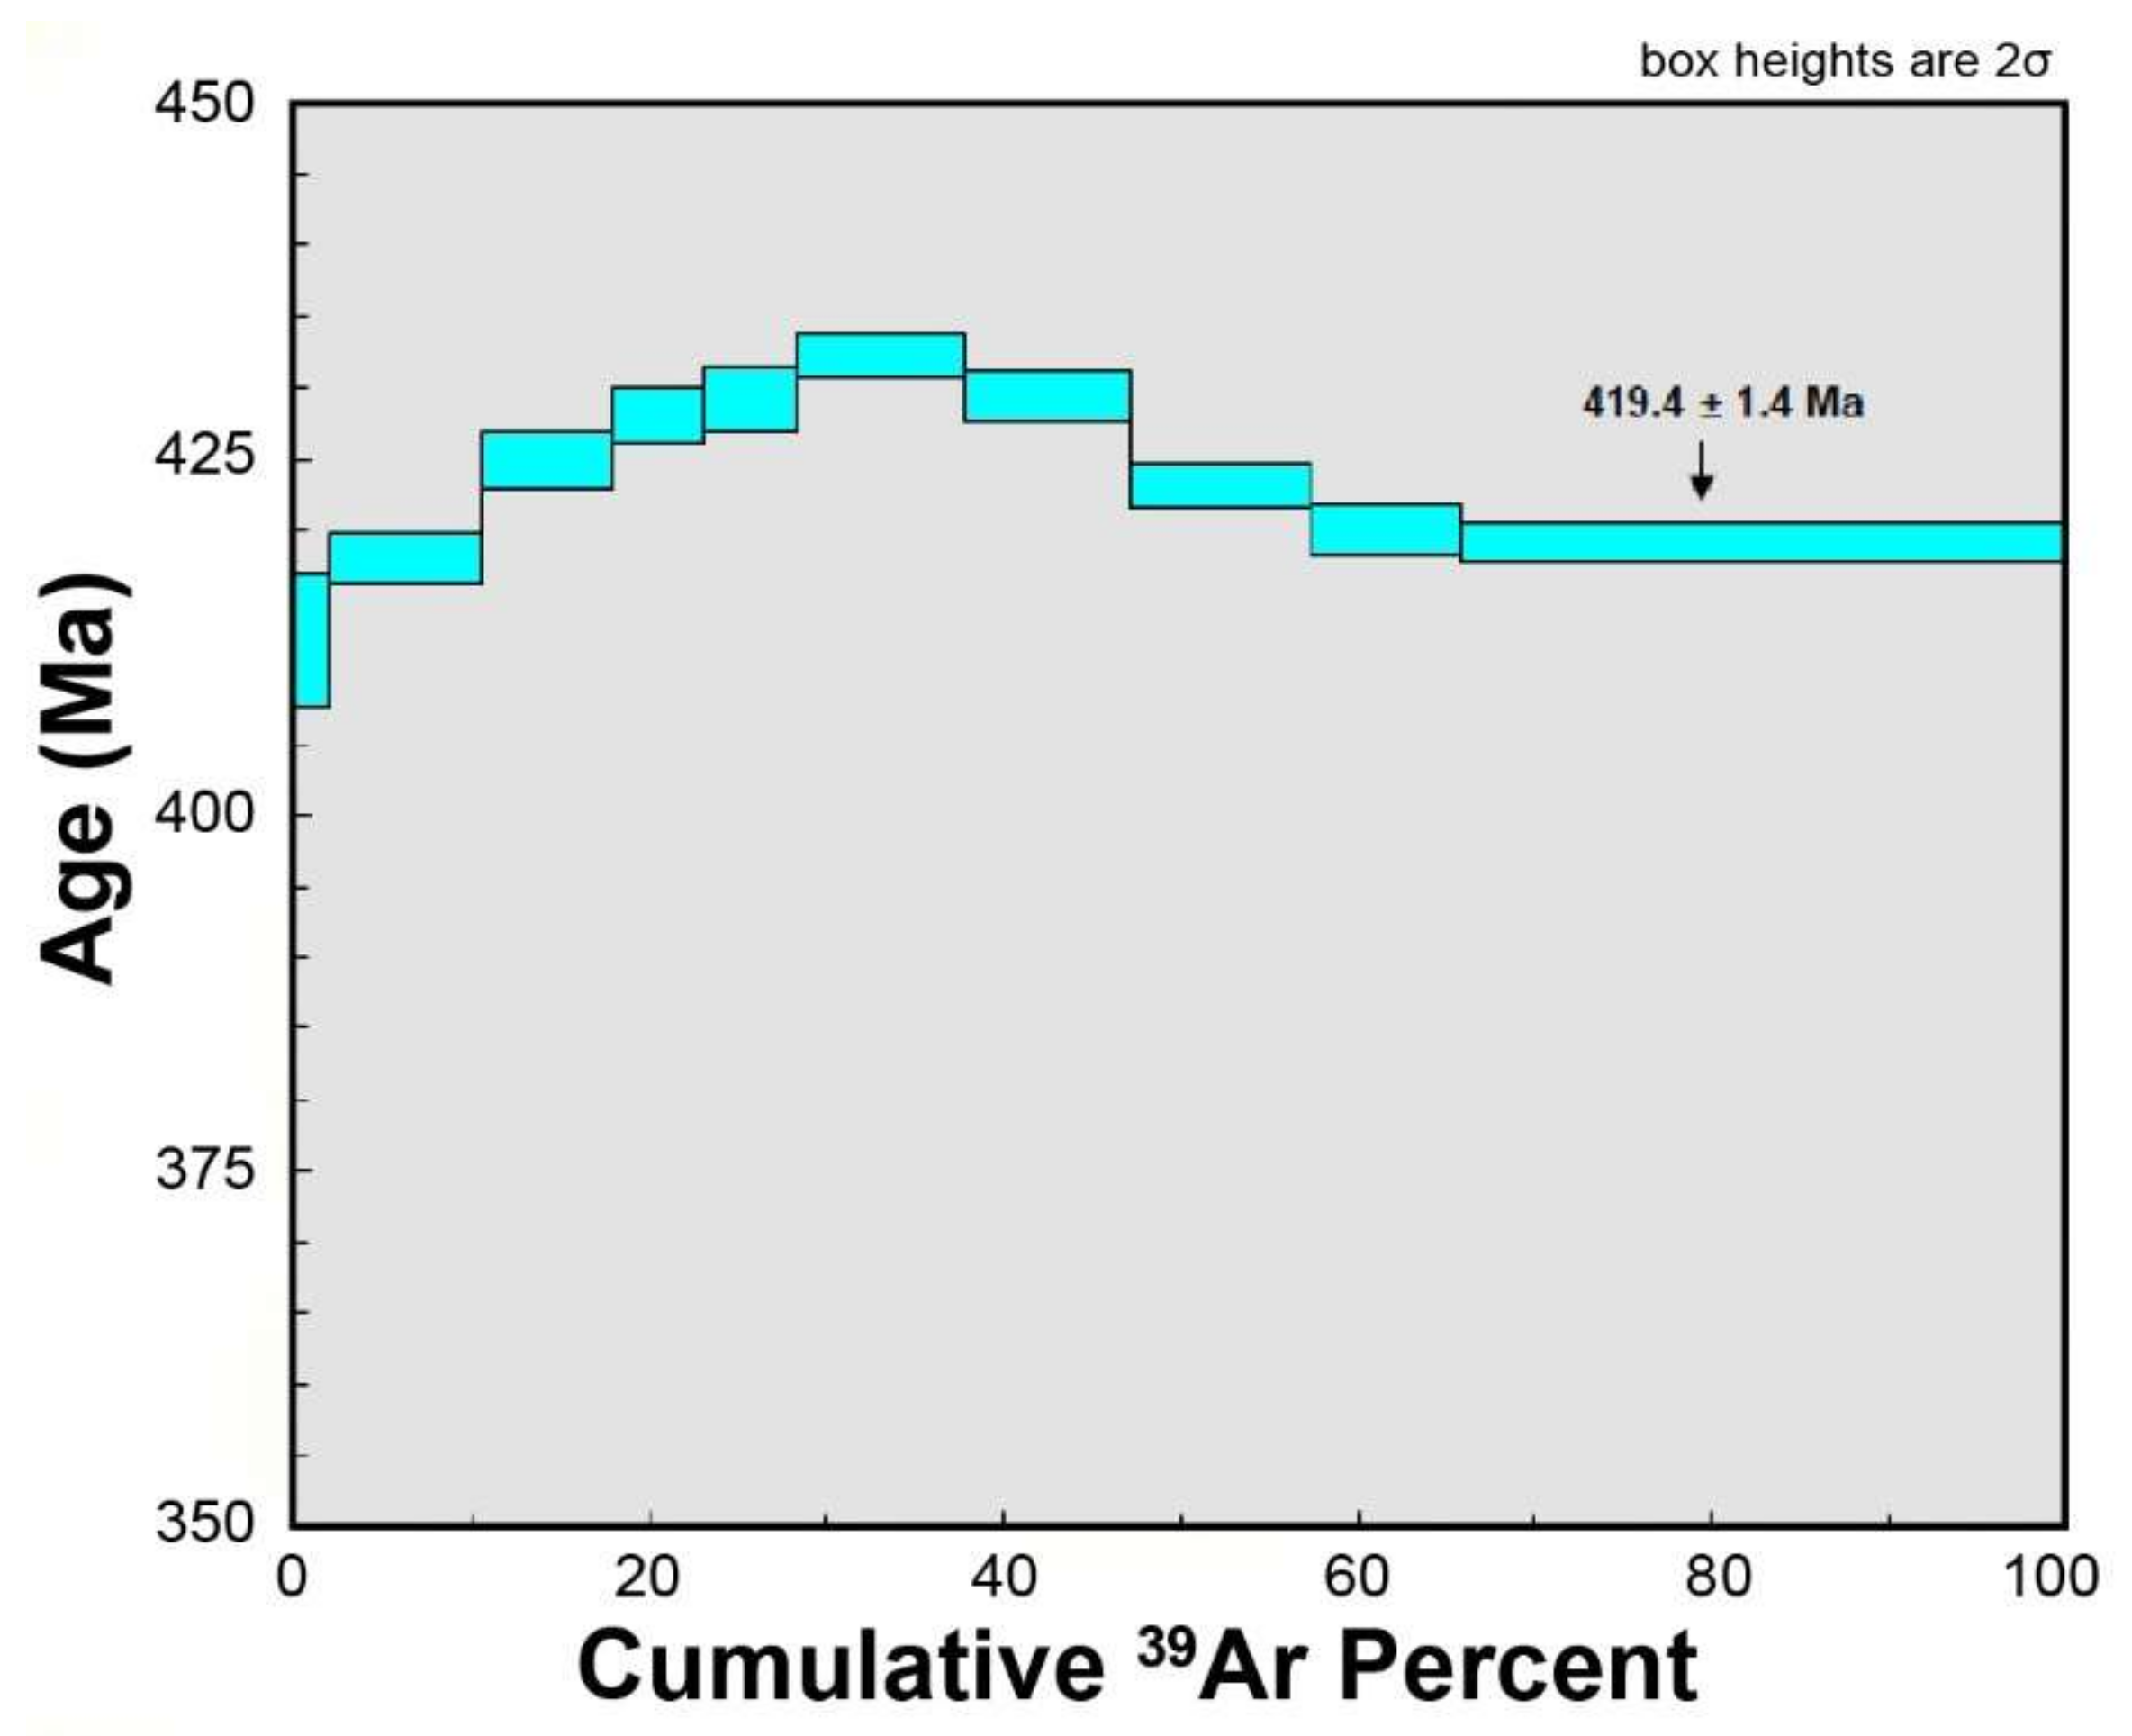
- LA ICP-MS analyses of titanite from the lamprophyre dyke produced an age that lacks the precision necessary to establish the absolute timing of its emplacement. 40Ar/39Ar geochronology of phlogopite from the lamprophyre dyke produced a high temperature plateau segment date of 419.4 ± 1.4 Ma. This date is in agreement with the observed cross-cutting relationships and is a reasonable preliminary age, likely representative of the true timing of emplacement of these calc-alkaline lamprophyre dykes.
- Analysis of two single molybdenite crystals using Re-Os geochronology from the Type II W-Mo veins yielded dates of 415.7 ± 1.7 Ma and 416.1 ± 1.7 Ma. These dates are in agreement with previously established cross-cutting relationships [6] and the geochronology of other magmatic hydrothermal events and are likely representative of the true age of emplacement of the Type II W-Mo veins.
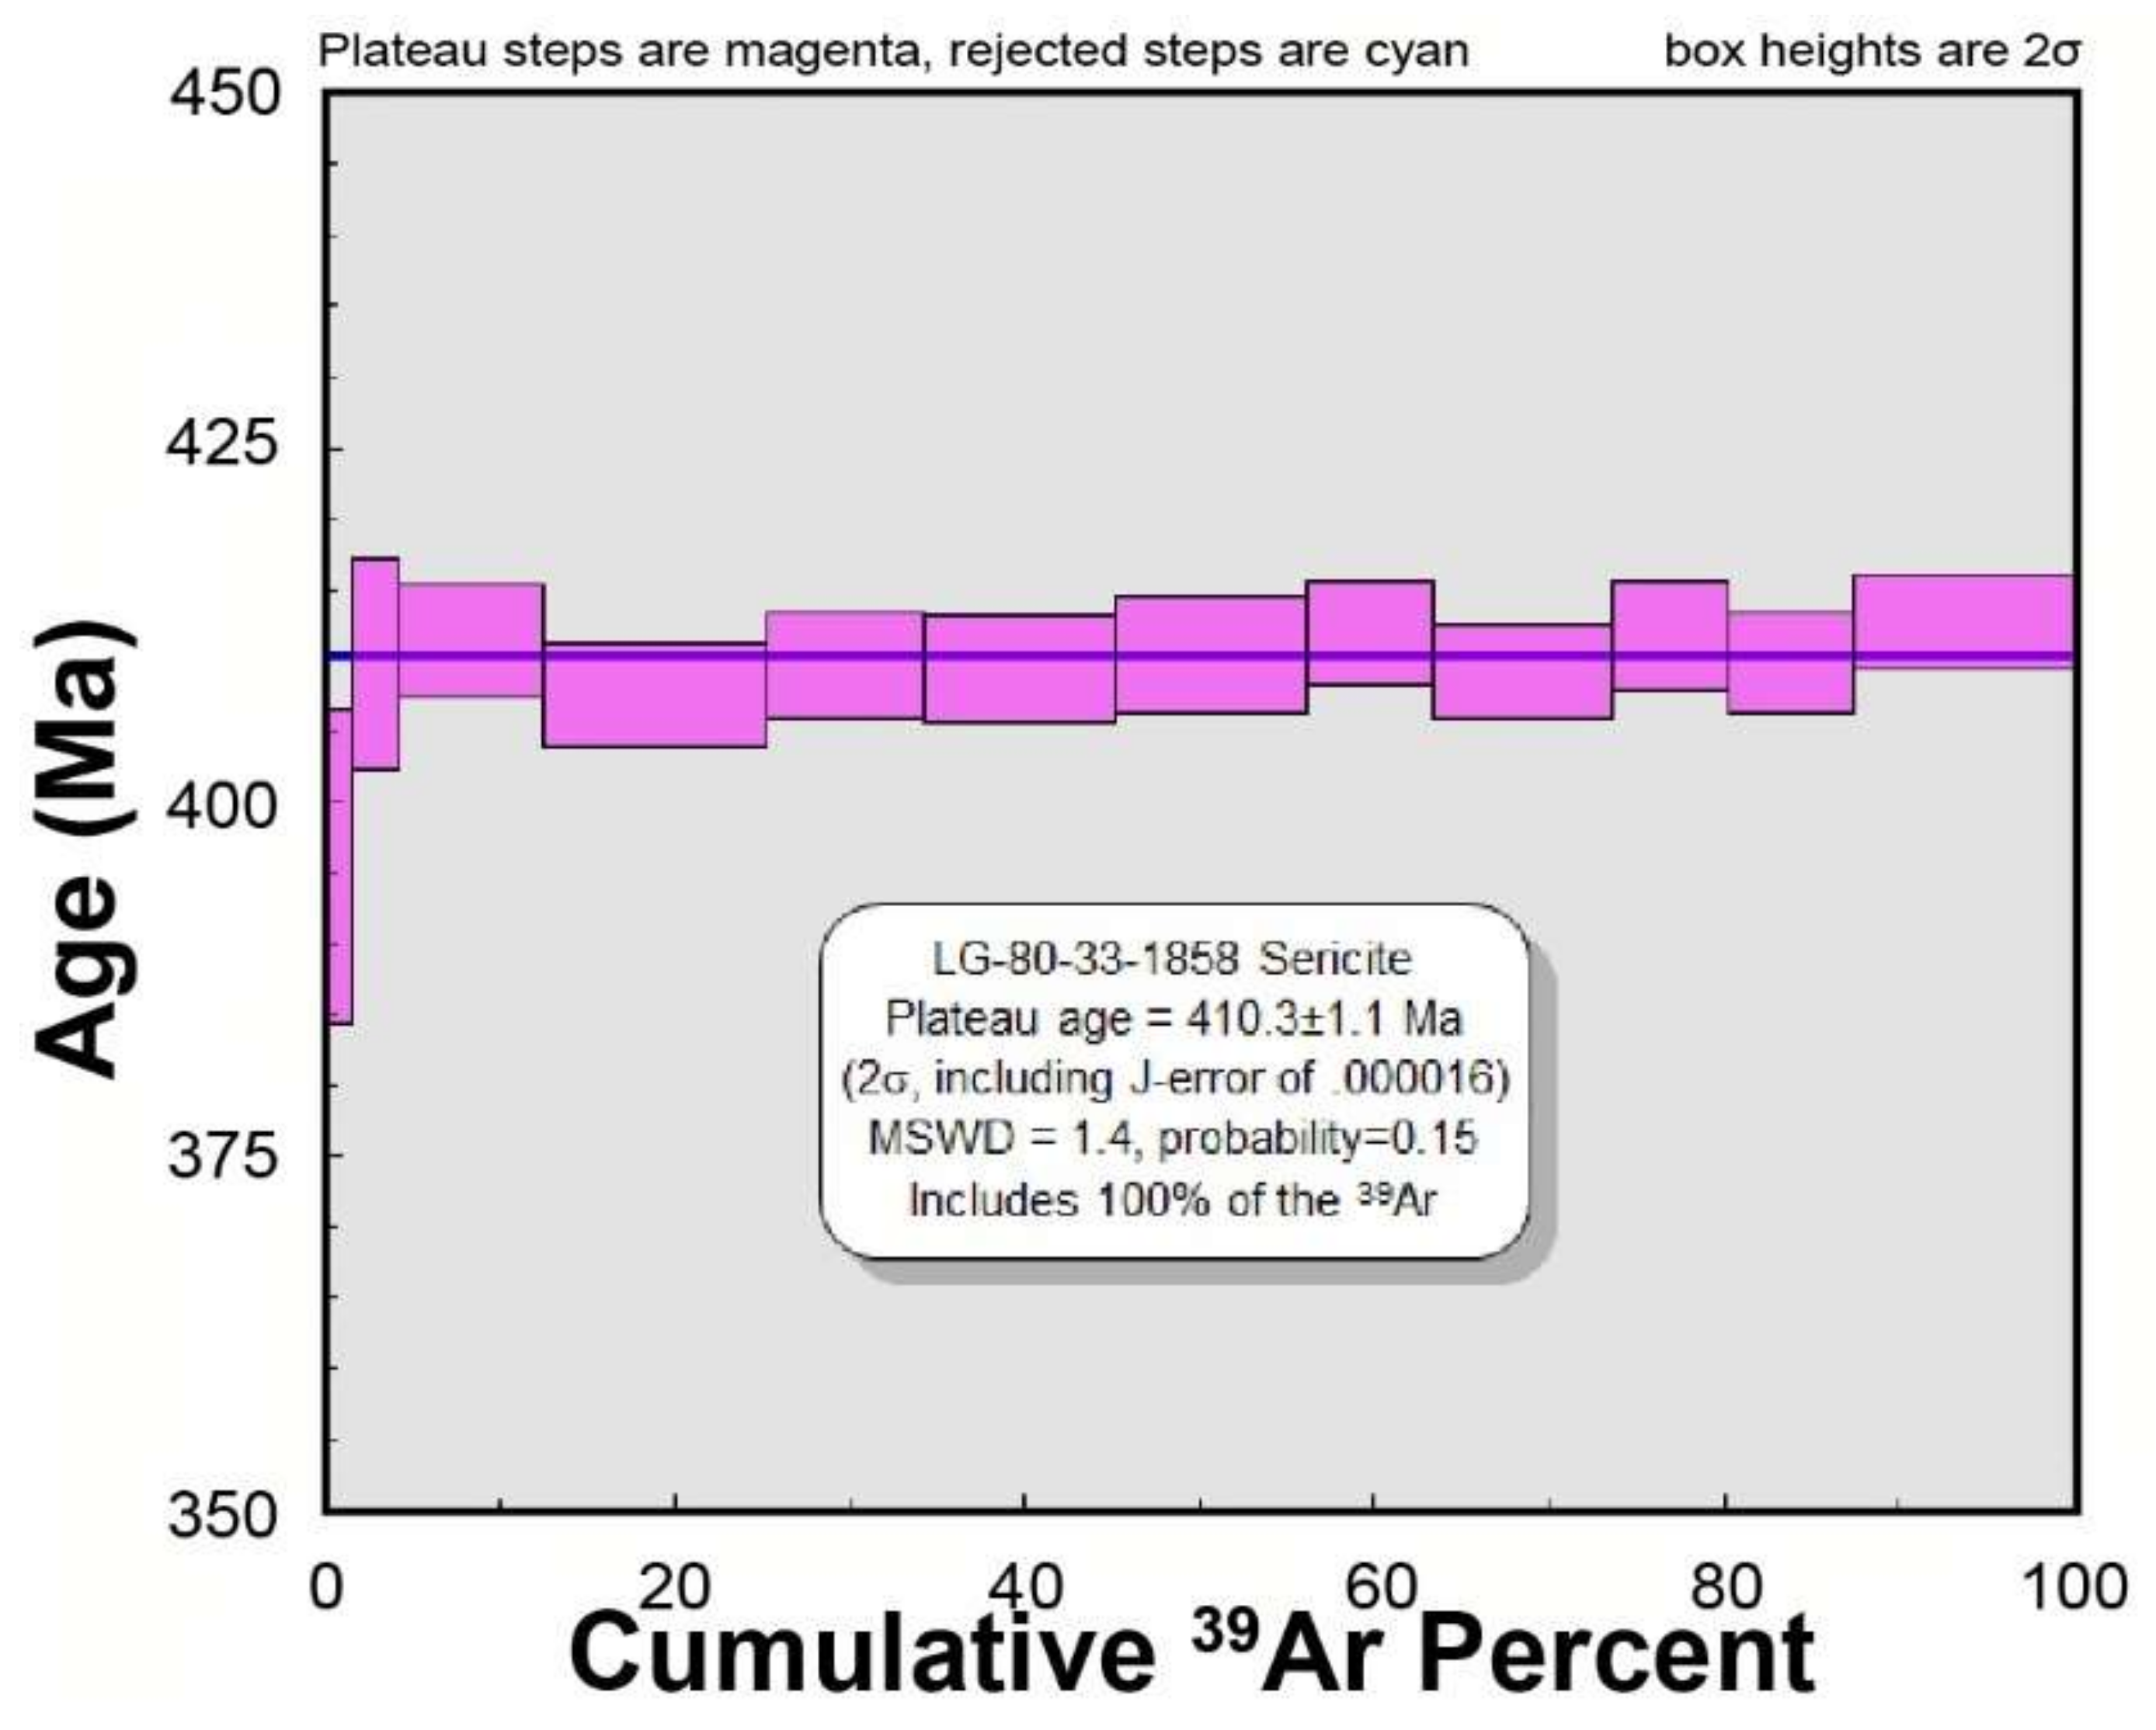
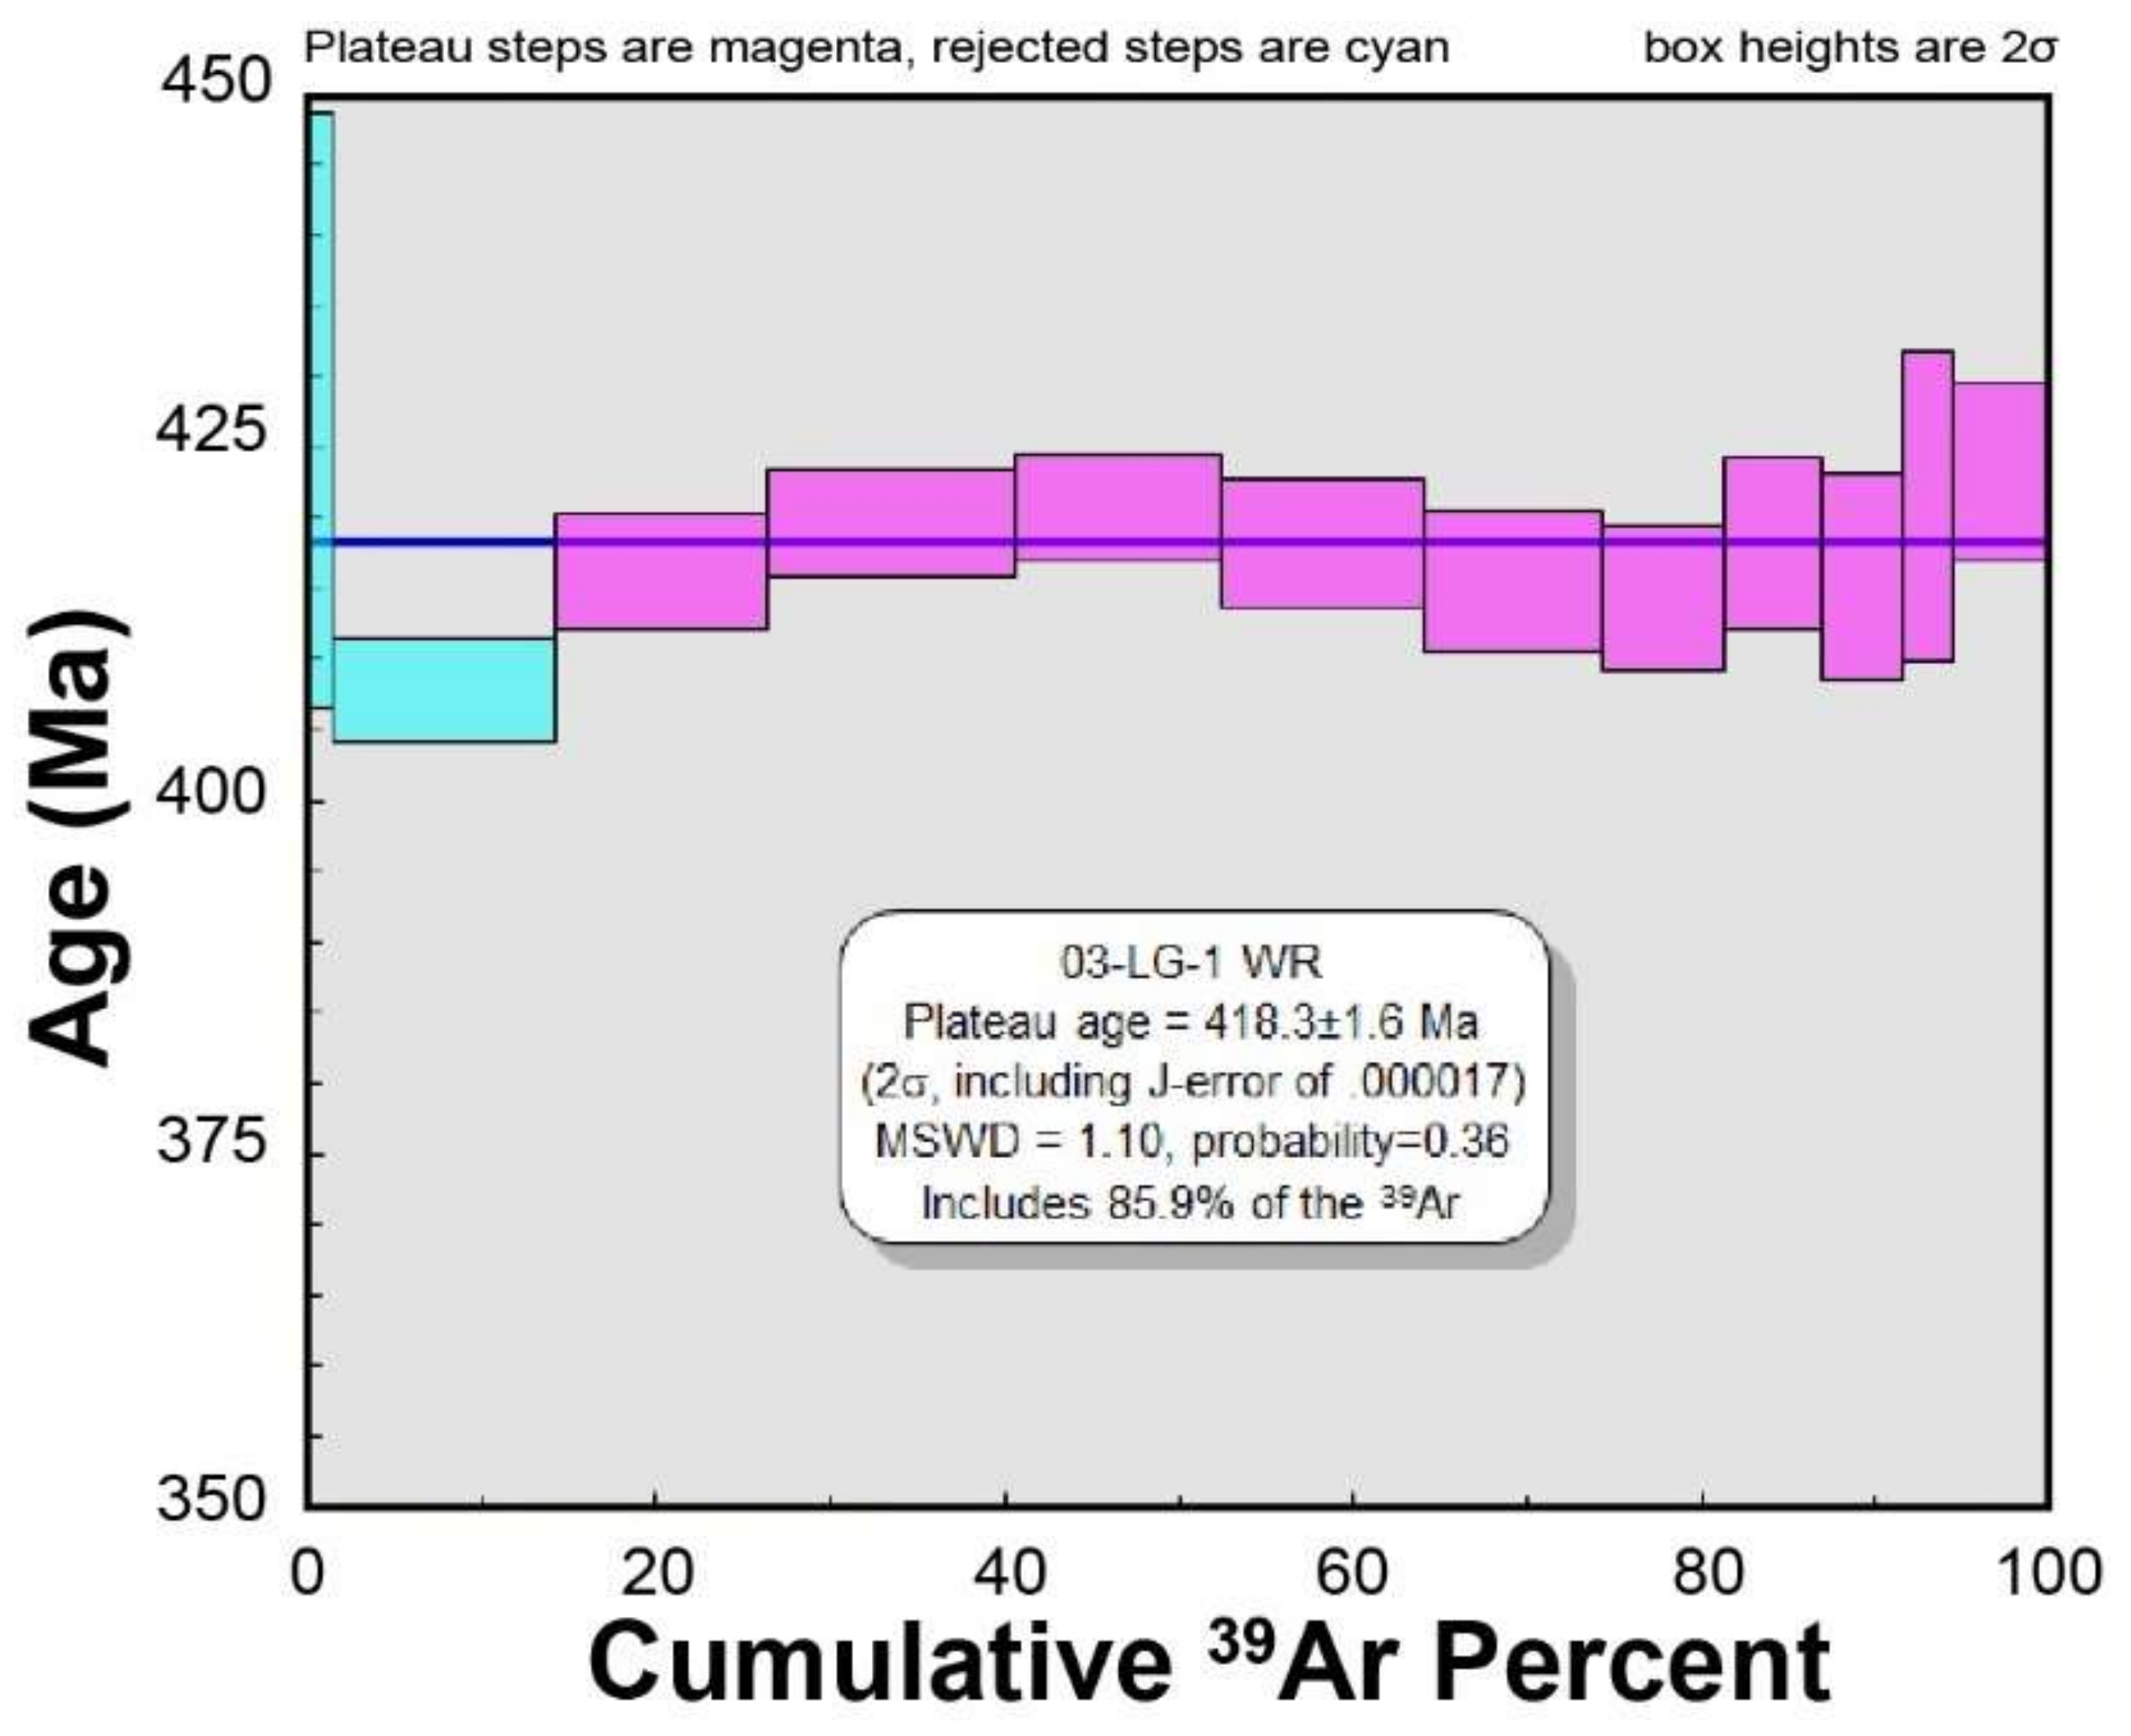
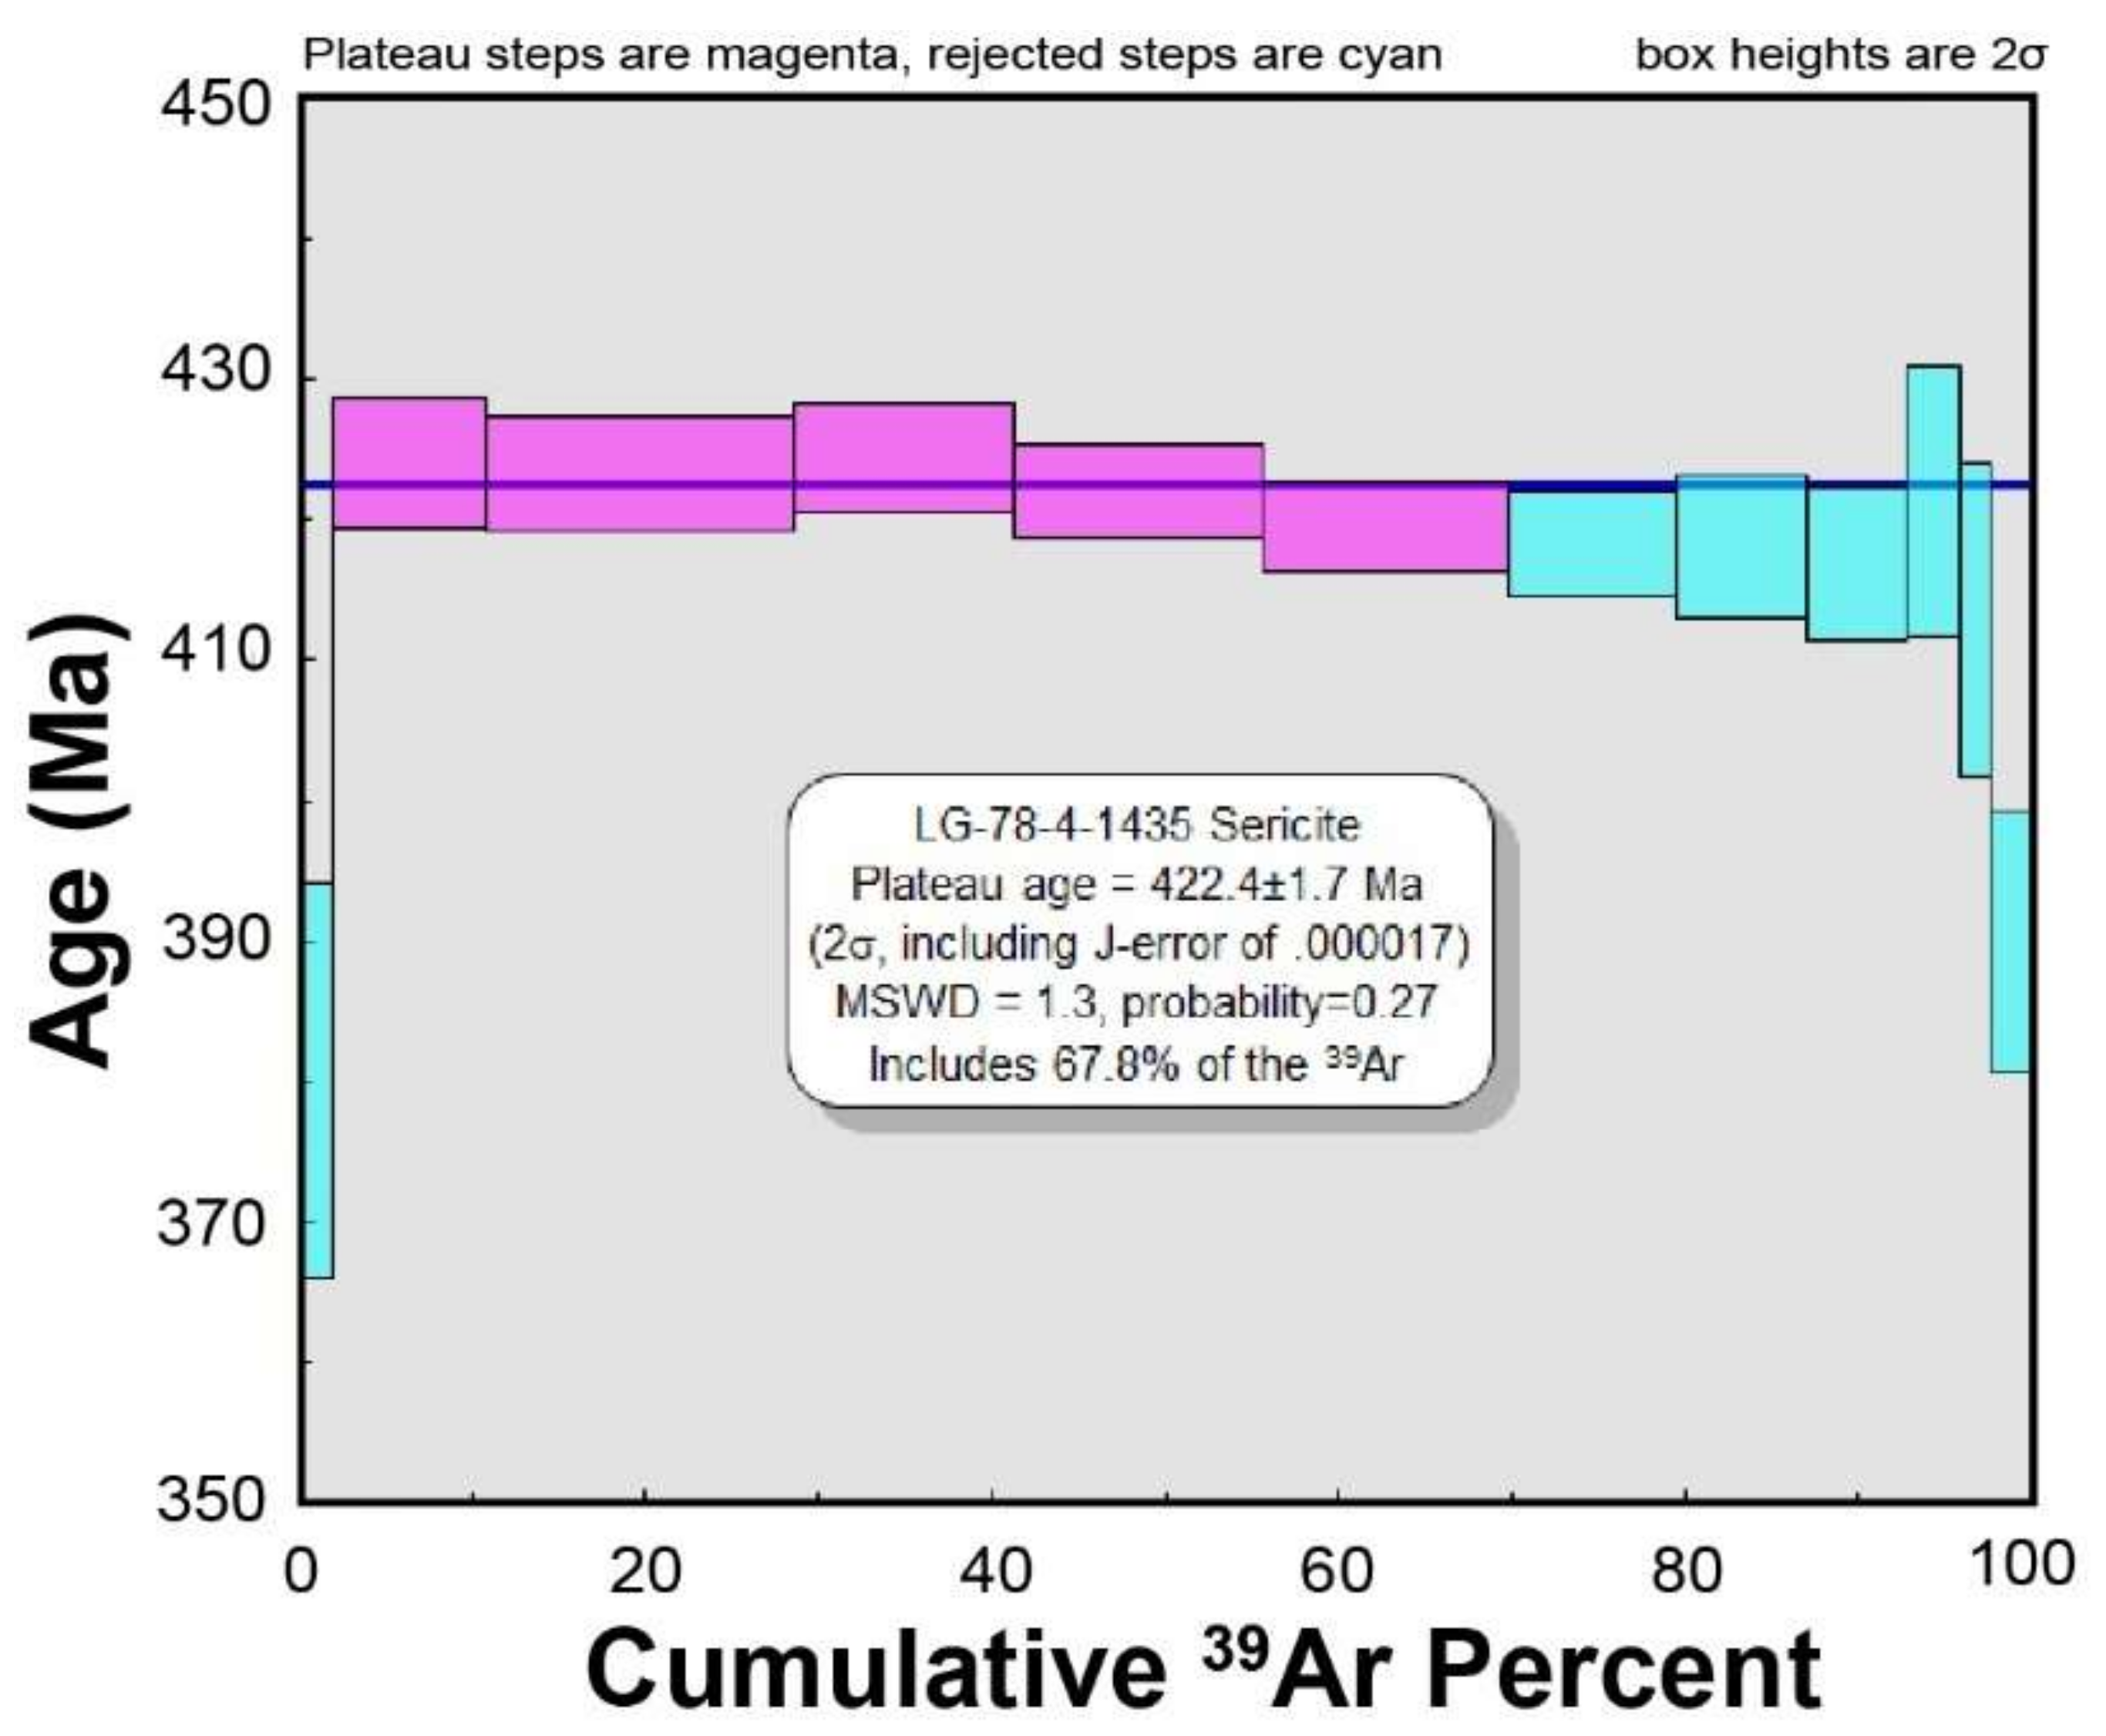
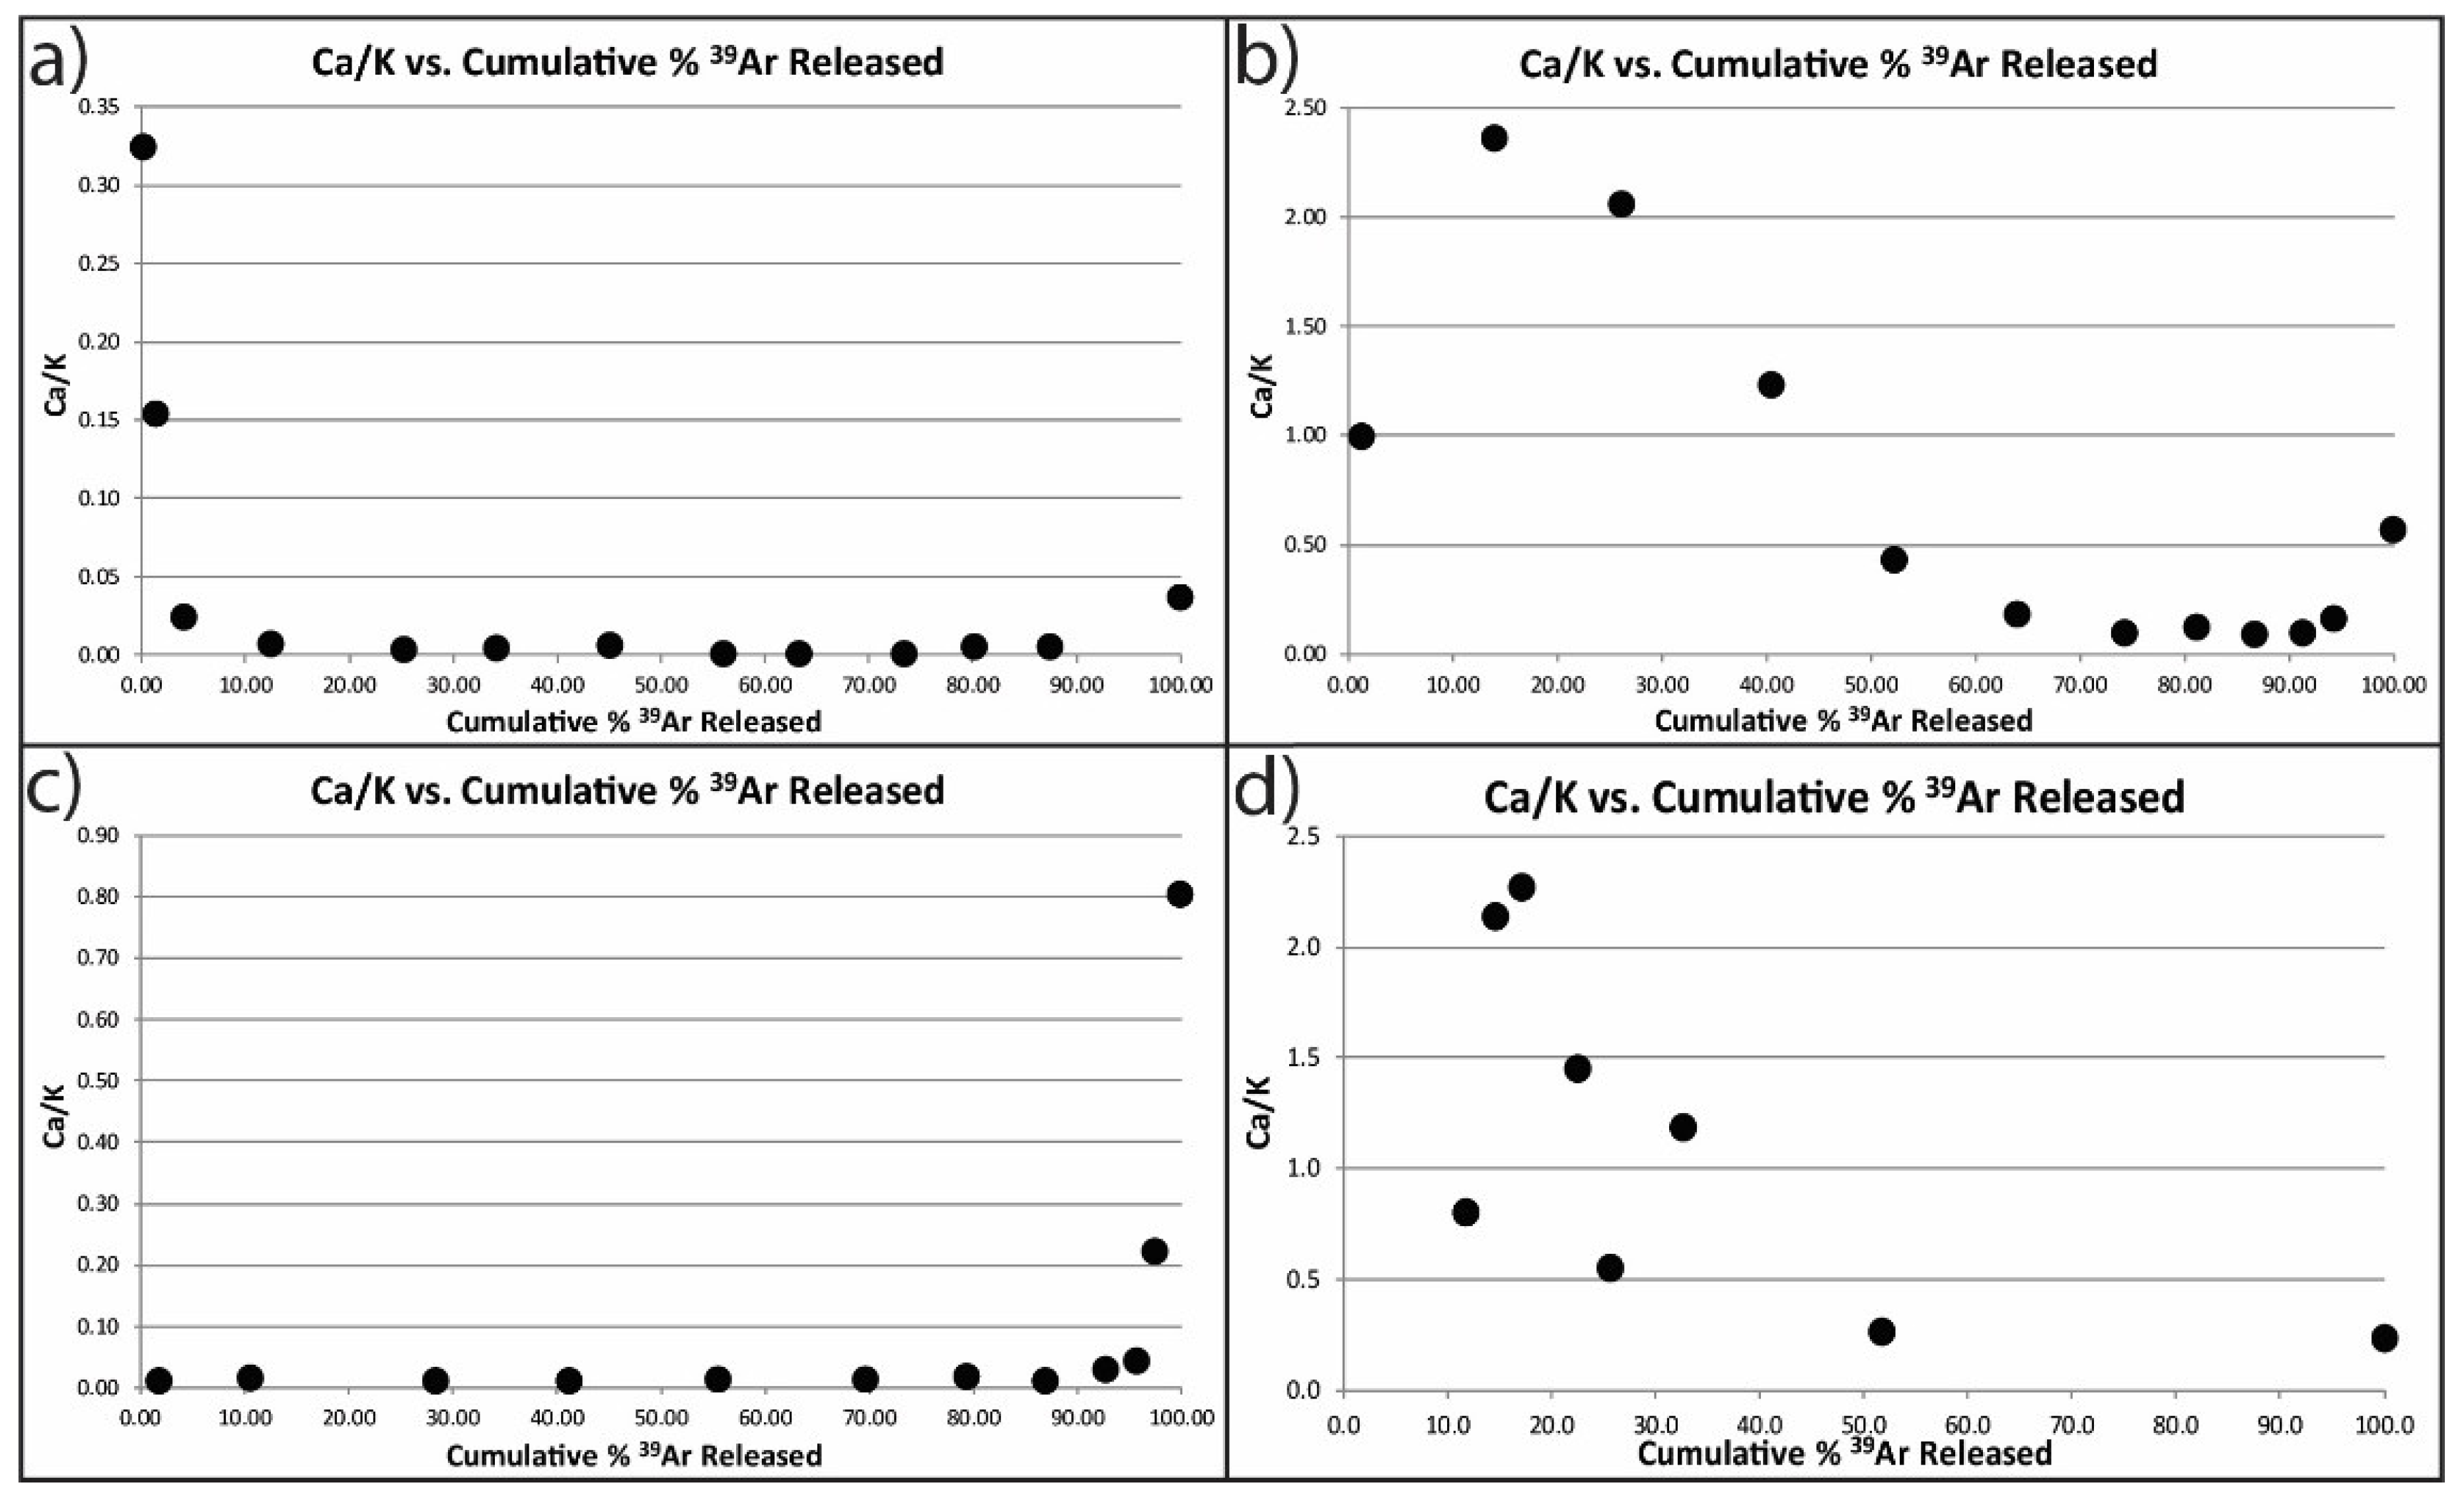
- 40Ar/39Ar geochronology of hydrothermal muscovite from the sericitic alteration envelopes that surround the Type IV gold-bearing quartz–carbonate veins was severely complicated by the very fine grain sizes of the muscovite analyzed as well as the contribution of 39Ar from mineral phases other than muscovite. The sample that generated a date most representative of the age of formation of the Type IV gold-bearing quartz–carbonate veins is sample LG-85-3, which yielded 40Ar/39Ar plateau segment date of 414.1 ± 1.3 Ma. This date is in agreement with the known cross-cutting relationships [6] as well as the other geochronology produced in this study.
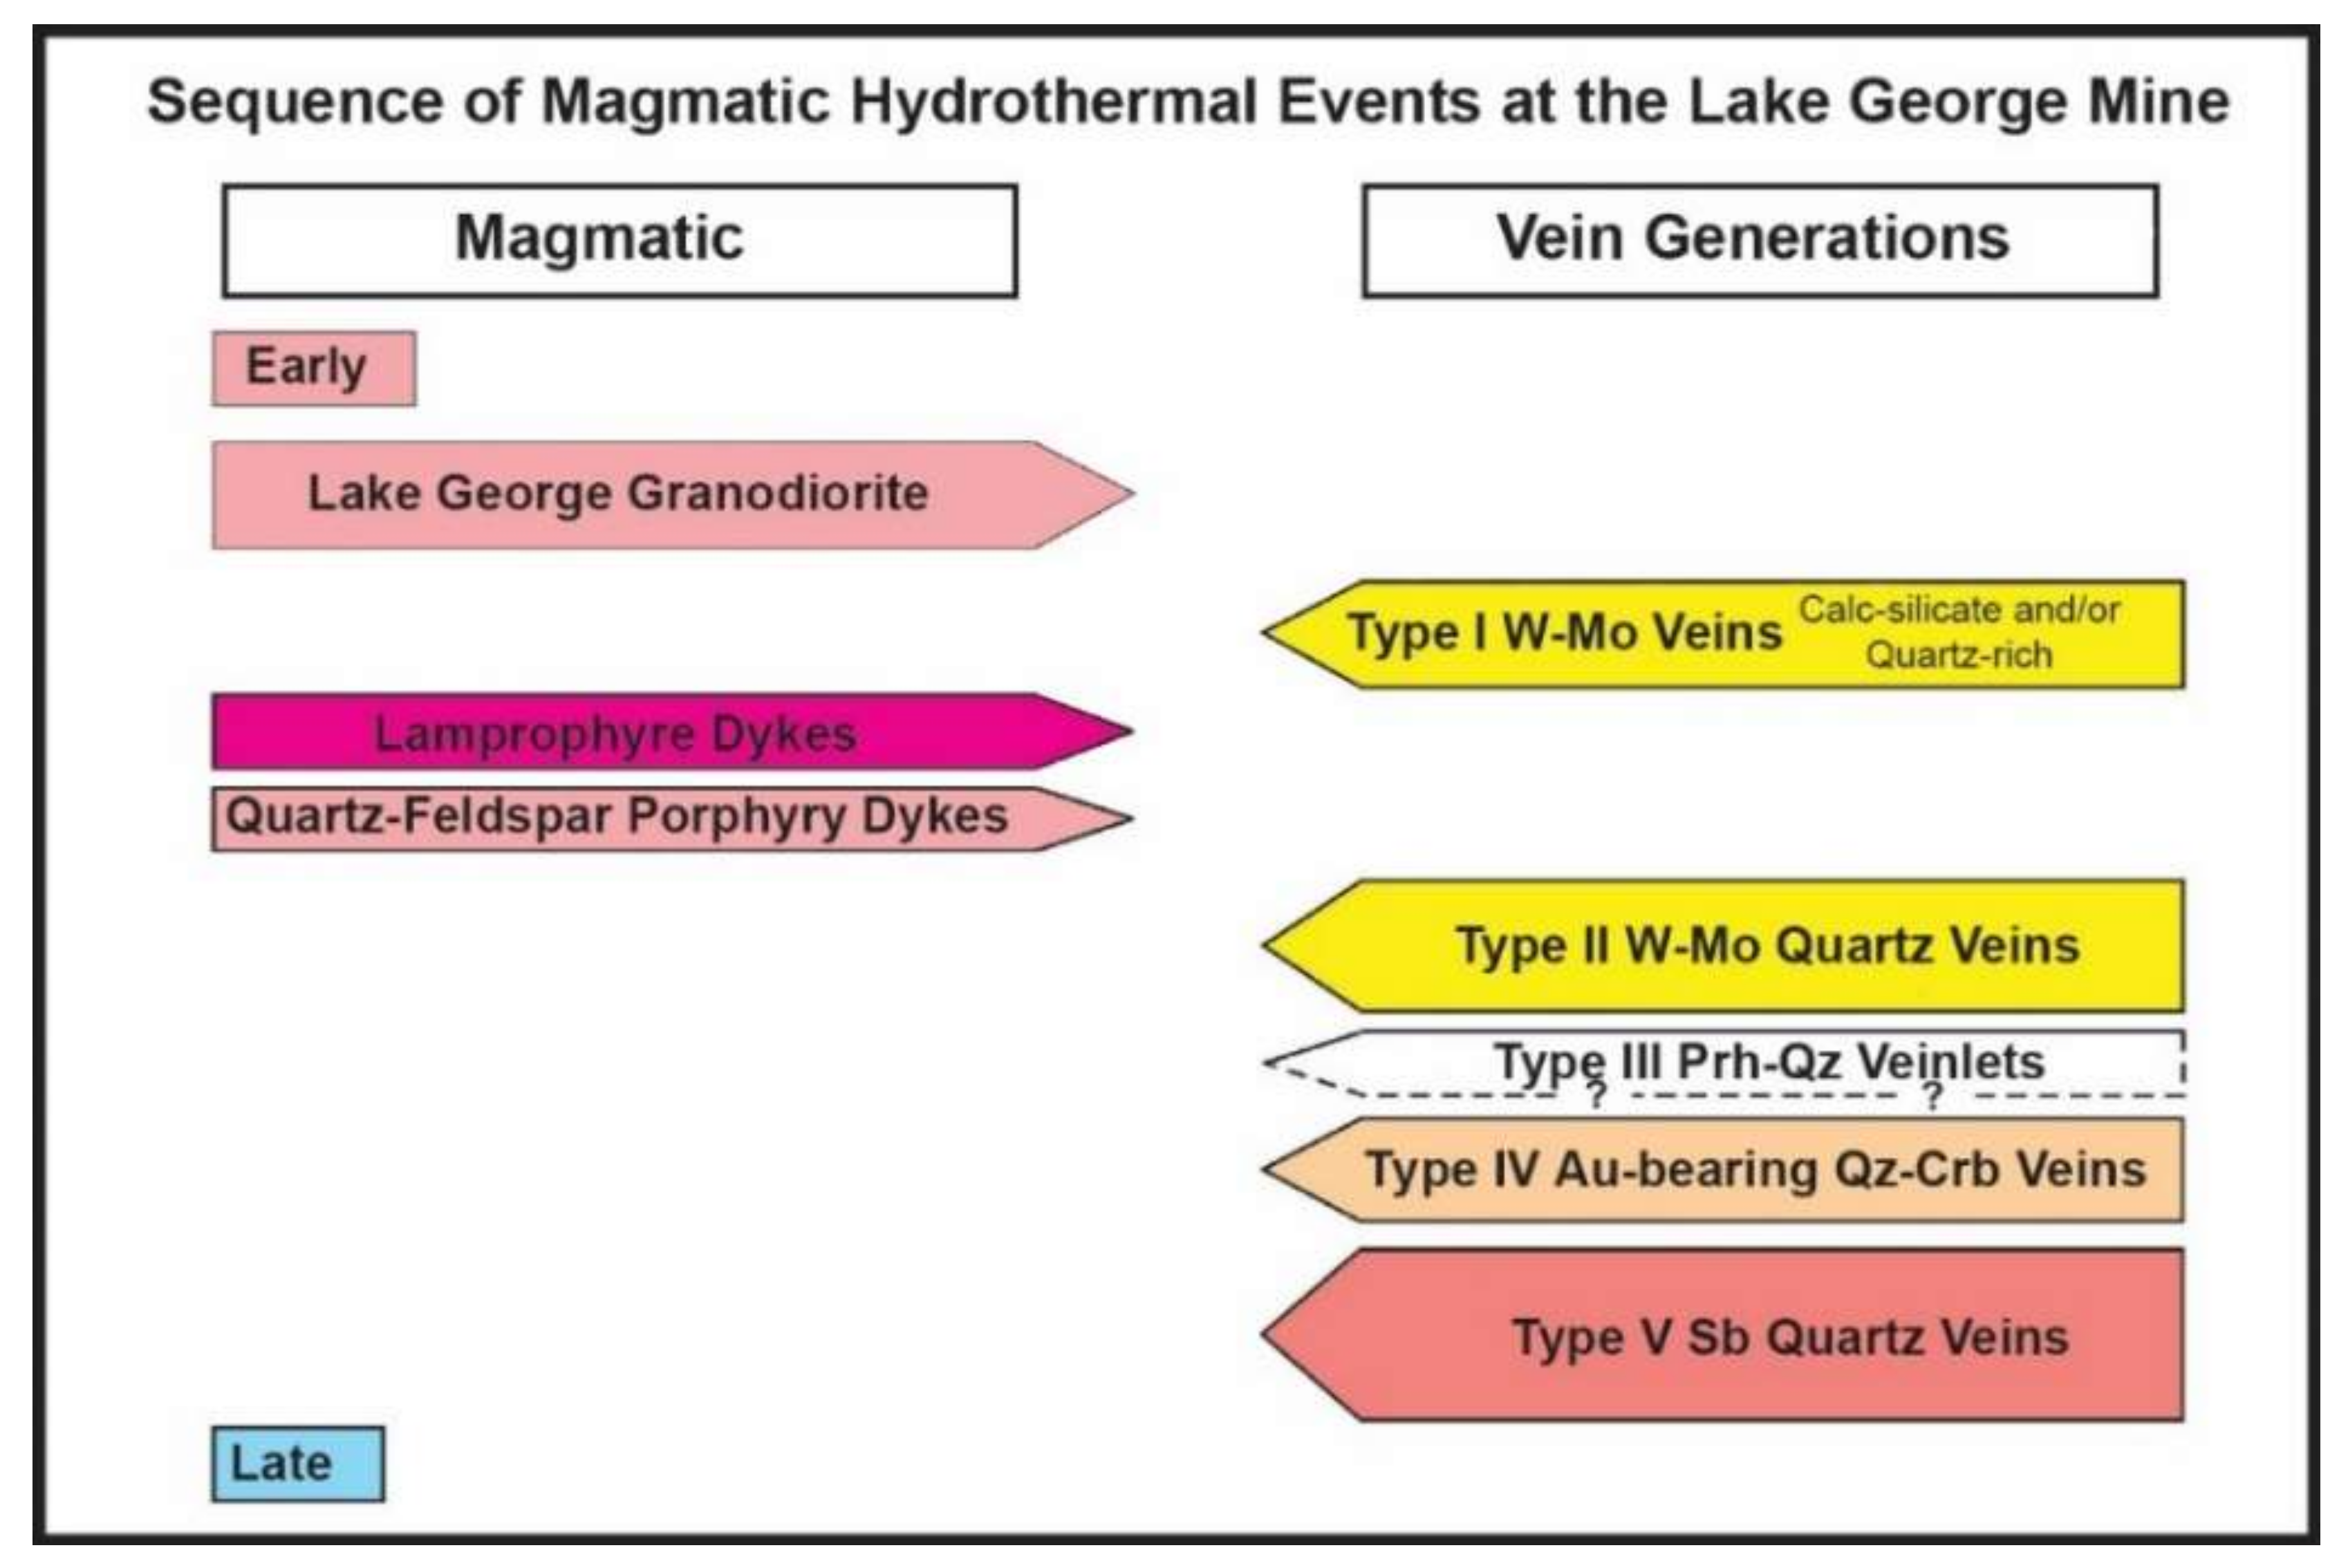
- We conclude that all mineralization occurred during a period between approximately 417 and 413 Ma, which followed the emplacement of the Lake George granodiorite, the lamprophyre dykes, and the QFP dykes (see Figure 24). To this point, this is the oldest mineralization identified, which is associated with the emplacement of the Pokiok Batholith.
Author Contributions
Funding
Acknowledgments
Conflicts of Interest
References
- Caron, A. Geology of the Pokiok Batholith Aureole, with Emphasis on the Lake George Mine, York County, New Brunswick; Geoscience Report 94-2; New Brunswick Department of Natural Resources and Energy, Minerals and Energy Division: Fredericton, NB, Canada, 1996; p. 91. [Google Scholar]
- Carroll, B.M.W. New Brunswick’s Mineral Industry, 1995; Mineral Resource Report 96-2; New Brunswick Department of Natural Resources and Energy, Minerals and Energy Division: Fredericton, NB, Canada, 1996; p. 137. [Google Scholar]
- Bourgoin, M. Lake George Antimony Project, Province of New Brunswick; National Instrument 43-101 Technical Report; MRB and Associates Geological Consultants: Val-d’Or, QC, Canada, 2014; p. 68. [Google Scholar]
- Scratch, R.B.; Watson, G.P.; Kerrich, R.; Hutchinson, R.W. Fracture-controlled antimony-quartz mineralization, Lake George Deposit, New Brunswick; mineralogy, geochemistry, alteration, and hydrothermal regimes. Econ. Geol. 1984, 79, 1159–1186. [Google Scholar] [CrossRef]
- Seal, R.; Clark, A.; Morrissy, C. Stockwork Tungsten (Scheelite)-Molybdenum mineralization, Lake George, Southwestern New Brunswick. Econ. Geol. 1987, 82, 1259–1282. [Google Scholar] [CrossRef]
- Seal, R.; Clark, A.; Morrissy, C. Lake George, southwestern New Brunswick: A Silurian, multi-stage, polymetallic (Sb-W-Mo Au-base metal) hydrothermal center. In Recent Advances in the Geology of Granite-Related-Mineral Deposits; Canadian Institute of Mining and Metallurgy: Montréal, QC, Canada, 1988; Volume 39, pp. 252–264. [Google Scholar]
- Seal, R.R.I.; Archibald, D.A.; Clark, A.H.; Farrar, E. K-Ar evidence for pre-Devonian orogeny, Lake George area, Fredericton Trough, SW New Brunswick. GAC-MAC Program Abstr. 1985, 10, 55. [Google Scholar]
- Leonard, P.R.R.; Lentz, D.R.; Poujol, M. Petrology, geochemistry, and U-Pb (zircon) age of the quartz-feldspar porphyry dyke at the Lake George antimony mine, New Brunswick: Implications for origin, emplacement process, and mineralization. Atl. Geol. 2006, 42, 13–39. [Google Scholar] [CrossRef][Green Version]
- McLeod, M.S.; Johnson, S.C.; Krogh, T.E. Archived U-Pb (zircon) dates from southern New Brunswick. Atl. Geol. 2003, 39, 209–225. [Google Scholar] [CrossRef]
- McKerrow, W.S.; Ziegler, A.M. The Lower Silurian paleogeography of New Brunswick and adjacent areas. J. Geol. 1971, 79, 635–646. [Google Scholar] [CrossRef]
- Van Staal, C.R.; Wilson, R.A.; Rogers, N.; Fyffe, L.R.; Langton, J.P.; McCutcheon, S.; McNicoll, V.; Ravenhurst, C.E. Geology and tectonic history of the Bathurst Supergroup, Bathurst Mining Camp, and its relationships to coeval rocks in southeastern New Brunswick and adjacent Maine-a synthesis. Econ. Geol. Mon. 2002, 11, 1–28. [Google Scholar]
- Irrinki, R.R. Geology of Rocky, Sisters and Clearwater Brooks-Todd Mountain Region, Map-Areas L-14, L-15, L-16 (Parts of 21 J/10, 21 J/15) York and Northumberland Counties; Map Report 81-7; Department of Natural Resources, Mineral Resources Branch: Fredericton, NB, Canada, 1981; p. 30. [Google Scholar]
- Poole, W.H. Geology, Hayesville, New Brunswick; Map 6-1963; Geological Survey of Canada: Ottawa, ON, Canada, 1963. [Google Scholar]
- Anderson, F.D.; Poole, W.H. Geology of Woodstock-Fredericton, York, Carleton, Sunbury, and Northumberland counties, New Brunswick; Map 37-1959; Geological Survey of Canada: Ottawa, ON, Canada, 1959. [Google Scholar]
- Ruitenberg, A.A.; Ludman, A. Stratigraphy and tectonic setting of early Paleozoic sedimentary rocks of the Wirral–Big Lake area, southwestern New Brunswick and southeastern Maine. Can. J. Earth Sci. 1978, 15, 22–32. [Google Scholar] [CrossRef]
- Fyffe, L.R. Geology of the Flume Ridge-Kedron Stream map areas, New Brunswick. In Project Summaries for 1991, Sixteenth Annual Review of Activities; New Brunswick Department of Natural Resources and Energy: Fredericton, NB, Canada, 1991; p. 91. [Google Scholar]
- Cumming, L. Report on Graptolite from Mactaquac, New Brunswick, Collected by D.A. Gordon, University of New Brunswick; Internal Palaeontological Report; Geological Survey of Canada: Ottawa, ON, Canada, 1966; p. 4. [Google Scholar]
- Fyffe, L.R.; Johnson, S.C.; van Staal, C.R. A review of Proterozoic to Early Paleozoic lithotectonic terranes in New Brunswick, Canada and their tectonic evolution during Penobscot, Taconic, Salinic and Acadian orogenesis. Atl. Geol. 2011, 47, 211–248. [Google Scholar] [CrossRef]
- Ruitenberg, A.; McCutcheon, S. Acadian and Hercynian structural evolution of southern New Brunswick. Geol. Assoc. Can. Spec. Pap. 1982, 24, 131–148. [Google Scholar]
- Bevier, M.L.; Whalen, J.B. Tectonic significance of Silurian magmatism in the Canadian Appalachians. Geology 1990, 18, 411–414. [Google Scholar] [CrossRef]
- Beal, K.L.; Lentz, D.R. Aquamarine beryl from Zealand Station, Canada: A mineralogical and stable isotope study. J. Geosci. 2010, 55, 57–67. [Google Scholar] [CrossRef]
- Yang, X.; Lentz, D.R.; Hall, D.C.; Chi, G. PPetrology of the Lake George Granodiorite Stock, New Brunswick: Implications for Crystallization Conditions, Volatile Exsolution, and W-Mo-Au-Sb Mineralization; Current Research 2002-E14; Geological Survey of Canada: Ottawa, ON, Canada, 2002; p. 12. [Google Scholar]
- Yang, X.; Lentz, D.; Chi, G. Petrochemistry of Lake George Granodiorite Stock and Related Gold Mineralization, York County New Brunswick; Current Research 2002-D7; Geological Survey of Canada: Ottawa, ON, Canada, 2002; p. 10. [Google Scholar]
- Whalen, J.B. Geology, Petrography, and Geochemistry of Appalachian Granites in New Brunswick and Gaspésie, Quebec; Bulletin 436; Geological Survey of Canada: Ottawa, ON, Canada, 1993; p. 130. [Google Scholar] [CrossRef]
- Lentz, D.R.; Thorne, K.G.; Yang, X.; Adams, M. Shoshonitic lamprophyre dykes at the Lake George antimony deposit, New Brunswick: Petrochemical characteristics and implications for gold mineralization. In Current Research 2001; Carroll, B.M.W., Ed.; New Brunswick Department of Natural Resources and Energy: Fredericton, NB, Canada, 2002; pp. 41–54. [Google Scholar]
- Le Maitre, R.W.; Bateman, P.; Dudek, A.; Keller, J. A Classification of Igneous Rocks and Glossary of Terms; Blackwell: Oxford, UK, 1989. [Google Scholar]
- Pearce, J.A.; Harris, N.B.; Tindle, A.G. Trace element discrimination diagrams for the tectonic interpretation of granitic rocks. J. Petrol. 1984, 25, 956–983. [Google Scholar] [CrossRef]
- Lentz, D.R. Multi-Element Instrumental Neutron Activation Analysis of Drill Core from the Lake George Mine, York County, New Brunswick; Open File 2003-1; New Brunswick Department of Natural Resources and Energy, Minerals Policy and Planning Division: Fredericton, NB, Canada, 2003; p. 22.
- Morrissy, C.J. Gold Assessment at the Lake George Mine, York County, New Brunswick; Open File Report 91-1; New Brunswick Department of Natural Resources and Energy, Mineral Resources: Fredericton, NB, Canada, 1991; p. 22.
- McFarlane, C.R.M.; Luo, Y. U-Pb Geochronology Using 193 nm Excimer LA-ICP-MS Optimized for In Situ Accessory Mineral Dating in Thin Se-ctions. Geosci. Can. 2012, 39, 158–172. [Google Scholar]
- Black, L.P.; Kamo, S.L.; Allen, C.M.; Aleinikoff, J.N.; Davis, D.W.; Korsch, R.J.; Foudoulis, C. TEMORA 1: A new zircon standard for Phanerozoic U–Pb geochronology. Chem. Geol. 2003, 200, 155–170. [Google Scholar] [CrossRef]
- Kinny, P.D.; McNaughton, N.; Fanning, C.M.; Maas, R. 518 Ma sphene (titanite) from the Khan pegmatite, Namibia, southwest Africa: A potential ionmicroprobe standard. In Eighth International Conference on Geochronology, Cosmochronology and Isotope Geology; US Geological Survey: Denver, CO, USA, 1994; p. 171. [Google Scholar]
- Paton, C.; Hellstrom, J.; Paul, B.; Woodhead, J.; Hergt, J. Iolite: Freeware for the Visualisation and Processing of Mass Spectrometric Data. J. Anal. At. Spectrom. 2011, 26, 2508–2518. [Google Scholar] [CrossRef]
- Ludwig, K. Manual for Isoplot 3.7. Berkeley Geochronology Center Special Publication; Berkeley Geochronology Center: Berkeley, CA, USA, 2008; Volume 4, p. 77. [Google Scholar]
- Selby, D.; Creaser, R.A. Macroscale NTIMS and microscale LA-MC-ICP-MS Re-Os isotopic analysis of molybdenite: Testing spatial restrictions for reliable Re-Os age determinations, and implications for the decoupling of Re and Os within molybdenite. Geochim. Cosmochim. Acta 2004, 68, 3897–3908. [Google Scholar] [CrossRef]
- Markey, R.; Stein, H.J.; Hannah, J.L.; Zimmerman, A.; Selby, D.; Creaser, R.A. Standardizing Re–Os geochronology: A new molybdenite reference material (Henderson, USA) and the stoichiometry of Os salts. Chem. Geol. 2007, 244, 74–87. [Google Scholar] [CrossRef]
- Markey, R.; Stein, H.; Morgan, J. Highly precise Re–Os dating for molybdenite using alkaline fusion and NTIMS. Talanta 1998, 45, 935–946. [Google Scholar] [CrossRef]
- Renne, P.R.; Mundil, R.; Balco, G.; Min, K.; Ludwig, K.R. Joint determination of 40K decay constants and 40Ar∗/40K for the Fish Canyon sanidine standard, and improved accuracy for 40Ar/39Ar geochronology. Geochim. Cosmochim. Acta 2010, 74, 5349–5367. [Google Scholar] [CrossRef]
- Dupuis, N.; Braid, J.; Murphy, J.B.; Shail, R.; Archibald, D.; Nance, R.D. 40Ar/39Ar phlogopite geochronology of lamprophyre dykes in Cornwall, UK: New age constraints on Early Permian post-collisional magmatism in the Rhenohercynian Zone, SW England. J. Geol. Soc. 2015, 172, 566–575. [Google Scholar] [CrossRef]
- Heaman, L.M. The application of U–Pb geochronology to mafic, ultramafic and alkaline rocks: An evaluation of three mineral standards. Chem. Geol. 2009, 261, 43–52. [Google Scholar] [CrossRef]
- Kinny, P.D. Users Guide to U-Th-Pb Dating of Titanite, Perovskite, Monazite and Baddeleyite Using the W.A. SHRIMP; Curtin University of Technology: Perth, WA, Australia, 1997; p. 21. [Google Scholar]
- Turner, G.; Cadogan, P.H. Possible effects of 39Ar recoil in 40Ar-39Ar dating. In Proceedings of the Fifth Lunar Science Conference, Houston, TX, USA, 18–22 March 1974; Volume 2, pp. 1601–1615. [Google Scholar]
- Guo, F.; Fan, W.; Wang, Y.; Zhang, M. Origin of early Cretaceous calc-alkaline lamprophyres from the Sulu orogen in eastern China: Implications for enrichment processes beneath continental collisional belt. Lithos 2004, 78, 291–305. [Google Scholar] [CrossRef]
- Rock, N.M.; Groves, D.I.; Perring, C.S.; Golding, S.D. Gold, lamprophyres, and porphyries: What does their association mean. Econ. Geol. Monogr. 1989, 6, 609–625. [Google Scholar]
- Di Vincenzo, G.; Viti, C.; Rocchi, S. The effect of chlorite interlayering on 40Ar–39Ar biotite dating: An 40Ar–39Ar laser-probe and TEM investigations of variably chloritised biotites. Contrib. Mineral. Petrol. 2003, 145, 643–658. [Google Scholar] [CrossRef]
- Lo, C.-H.; Onstott, T.C. 39Ar recoil artifacts in chloritized biotite. Geochim. Cosmochim. Acta 1989, 53, 2697–2711. [Google Scholar]
- Allaz, J.; Engi, M.; Berger, A.; Villa, I.M. The effects of retrograde reactions and of diffusion on 40Ar–39Ar ages of micas. J. Petrol. 2011, 52, 691–716. [Google Scholar] [CrossRef]
- Bratzdrum, C.; Grapes, R.; Gieré, R. Late-stage hydrothermal alteration and heteromorphism of calc–alkaline lamprophyre dykes in Late Jurassic Granite, Southeast China. Lithos 2009, 113, 820–830. [Google Scholar] [CrossRef]
- McDougall, I.; Harrison, T.M. Geochronology and Thermochronology by the 40Ar/39Ar Method; Oxford Monographs on Geology and Geophysics; Oxford University Press: Oxford, UK, 1988; p. 212. [Google Scholar]
- McFarlane, C.R. Constraining cooling histories of the Pokiok Batholith, New Brunswick, Canada, using combined zircon, allanite, titanite, and apatite U-Pb geochronology from the Hartfield tonalite. In Atlantic Geology, Proceedings of the Atlantic Geoscience Society Abstracts 42nd Annual Colloquium and General Meeting, Truro, NS, Canada, 5–6 February 2016; Atlantic Geoscience Society: Wolfville, NS, Canada, 2016; Volume 52. [Google Scholar] [CrossRef]


| Sample | Duration (s) | %Pb* | %Disc | 207Pb/235U | 2σ | 206Pb/238U | 2σ | Err. Corr. | U (ppm) | Th (ppm) |
|---|---|---|---|---|---|---|---|---|---|---|
| z6.1 | 7.8 | 95.9 | 70.7 | 0.639 | 0.014 | 0.0574 | 0.0012 | 0.8261 | 3950 | 3400 |
| z1.1 | 15.9 | 99.3 | 39.8 | 0.461 | 0.009 | 0.0561 | 0.0007 | 0.4627 | 2513 | 1009 |
| z6.3 | 4.6 | 97.8 | 52.9 | 0.572 | 0.012 | 0.0631 | 0.0010 | 0.6654 | 4518 | 3122 |
| z5.2 | 10.1 | 97.2 | 56.3 | 0.678 | 0.012 | 0.0685 | 0.0010 | 0.3340 | 3299 | 808 |
| z1.4 | 10.7 | 98.9 | 38.5 | 0.587 | 0.023 | 0.0679 | 0.0013 | 0.8395 | 2020 | 858 |
| z2.2c | 17.2 | 96.7 | 61.3 | 0.734 | 0.016 | 0.0693 | 0.0010 | 0.7430 | 1364 | 586 |
| z2.1r | 13.4 | 98.9 | 42.3 | 0.602 | 0.019 | 0.0682 | 0.0010 | 0.7799 | 2170 | 1285 |
| z1.3 | 11.5 | 99.3 | 34.8 | 0.578 | 0.013 | 0.0683 | 0.0013 | 0.6965 | 1469 | 833 |
| z3.1 | 7.8 | 95.1 | 68.9 | 0.901 | 0.020 | 0.0727 | 0.0011 | 0.0715 | 1238 | 300 |
| z2.3r | 16.1 | 98.5 | 42.4 | 0.703 | 0.012 | 0.0767 | 0.0011 | 0.1882 | 1100 | 511 |
| z1.2 | 20.2 | 99.1 | 31.8 | 0.700 | 0.015 | 0.0802 | 0.0012 | 0.5105 | 755 | 497 |
| Sample | Duration(s) | 207Pb/235U | 2σ | 206Pb/238U | 2σ | Err. Corr. | 206Pb/238U Age (Ma) | 2σ |
|---|---|---|---|---|---|---|---|---|
| 78-21-9.3 | 29.6 | 0.55 | 0.11 | 0.0760 | 0.003 | 0.58 | 472 | 21 |
| 78-21-1.1 | 28.0 | 0.46 | 0.16 | 0.0734 | 0.004 | 0.56 | 457 | 22 |
| 80-12-3.1 | 28.6 | 0.56 | 0.35 | 0.0780 | 0.005 | 0.88 | 484 | 30 |
| 80-12-16.1 | 29.8 | 0.23 | 0.22 | 0.0722 | 0.005 | 0.78 | 449 | 30 |
| 80-12-20.2 | 12.4 | 0.53 | 0.19 | 0.0729 | 0.004 | 0.70 | 454 | 26 |
| Sample | Duration(s) | 207Pb/235U | 2σ | 206Pb/238U | 2σ | Err. Corr. | 206Pb/238U Age (Ma) | 2σ |
|---|---|---|---|---|---|---|---|---|
| 78-21-3.1 | 20.8 | 0.50 | 0.10 | 0.0710 | 0.003 | 0.38 | 442 | 19 |
| 78-21-9.1 | 29.1 | 0.49 | 0.07 | 0.0690 | 0.003 | 0.57 | 430 | 18 |
| 80-12-10.1 | 13.5 | 0.46 | 0.08 | 0.0666 | 0.003 | 0.32 | 416 | 17 |
| 80-12-12.1 | 28.4 | 0.51 | 0.19 | 0.0706 | 0.004 | 0.74 | 440 | 26 |
| 80-12-19.1 | 29.5 | 0.32 | 0.31 | 0.0700 | 0.006 | 0.89 | 436 | 34 |
| 78-21-4.1 | 7.6 | 0.48 | 0.36 | 0.0706 | 0.006 | 0.81 | 440 | 35 |
| 80-12-12.2 | 29.6 | 0.57 | 0.21 | 0.0722 | 0.005 | 0.78 | 449 | 29 |
| 80-12-13.1 | 27.0 | 0.51 | 0.18 | 0.0707 | 0.004 | 0.72 | 441 | 22 |
| 80-12-18.1 | 29.5 | 0.39 | 0.19 | 0.0707 | 0.004 | 0.74 | 440 | 25 |
| 80-12-ep1.2 | 25.7 | 0.44 | 0.22 | 0.0667 | 0.005 | 0.79 | 416 | 28 |
| 80-12-17.1 | 23.5 | 0.55 | 0.27 | 0.0701 | 0.006 | 0.85 | 437 | 36 |
| 80-12-ep1.1 | 20.7 | 0.38 | 0.27 | 0.0682 | 0.005 | 0.74 | 425 | 29 |
| 80-12-1.2 | 16.0 | 0.44 | 0.22 | 0.0706 | 0.004 | 0.69 | 440 | 22 |
| 80-12-11.1 | 28.9 | 0.55 | 0.19 | 0.0704 | 0.004 | 0.69 | 439 | 23 |
| 80-12-4.1 | 29.2 | 0.44 | 0.20 | 0.0695 | 0.005 | 0.62 | 433 | 30 |
| 80-12-16.2 | 29.5 | 0.36 | 0.35 | 0.0703 | 0.006 | 0.84 | 438 | 37 |
| 80-12-20.1 | 10.5 | 0.54 | 0.18 | 0.0719 | 0.005 | 0.54 | 448 | 27 |
| 80-12-1.1 | 25.8 | 0.34 | 0.33 | 0.0717 | 0.006 | 0.84 | 446 | 36 |
| Sample | Duration(s) | 207Pb/235U | 2σ | 206Pb/238U | 2σ | Err. Corr. | 206Pb/238U Age (Ma) | 2σ |
|---|---|---|---|---|---|---|---|---|
| 80-12-14.1 | 30.8 | 0.54 | 0.15 | 0.0669 | 0.004 | 0.61 | 417 | 26 |
| 80-12-13.2 | 29.5 | 0.54 | 0.11 | 0.0683 | 0.003 | 0.70 | 426 | 18 |
| 78-21-5.1 | 23.3 | 0.49 | 0.08 | 0.0644 | 0.003 | 0.37 | 403 | 15 |
| 78-21-6.1 | 4.8 | 0.47 | 0.16 | 0.0648 | 0.004 | 0.67 | 405 | 24 |
| Sample | Location | Re (ppm) | ±2σ | 187Re (ppb) | ±2σ | 187Os (ppb) | ±2σ | Model Age (Ma) | ±2σ |
|---|---|---|---|---|---|---|---|---|---|
| KT-11-03 | DDH 81-27 | 41.29 | 0.11 | 25951 | 67 | 180.3 | 0.1 | 415.7 | 1.7 |
| KT-11-04 | DDH 80-15 | 41.37 | 0.11 | 26002 | 66 | 180.9 | 0.1 | 416.1 | 1.7 |
| Step No. | Power (%) | 40Ar/39Ar | ±1 σ | 40Ar*/39Ar(K) | ±1 σ | 40Ar* (%) | Cumulative 39Ar (%) | Age (Ma) | ±1 σ | Ca/K | ±1 σ |
|---|---|---|---|---|---|---|---|---|---|---|---|
| 1 | 0.8 | 28.656 | 0.687 | 27.061 | 4.765 | 94.4 | 0.07 | 337.21 | 54.17 | 0.41 | 0.18 |
| 2 | 1.5 | 34.104 | 0.105 | 33.813 | 0.214 | 99.1 | 1.86 | 412.38 | 2.34 | 0.70 | 0.03 |
| 3 | 2.3 | 34.637 | 0.065 | 34.350 | 0.082 | 99.2 | 10.58 | 418.23 | 0.89 | 0.18 | 0.01 |
| 4 | 2.6 | 35.107 | 0.076 | 34.983 | 0.090 | 99.6 | 17.91 | 425.09 | 0.97 | 0.05 | 0.00 |
| 5 | 2.8 | 35.365 | 0.065 | 35.272 | 0.092 | 99.7 | 23.10 | 428.22 | 0.99 | 0.06 | 0.00 |
| 6 | 3.0 | 35.418 | 0.080 | 35.381 | 0.102 | 99.9 | 28.34 | 429.40 | 1.11 | 0.08 | 0.00 |
| 7 | 3.2 | 35.747 | 0.060 | 35.667 | 0.074 | 99.8 | 37.92 | 432.48 | 0.79 | 0.22 | 0.01 |
| 8 | 3.5 | 35.495 | 0.067 | 35.390 | 0.083 | 99.7 | 47.04 | 429.49 | 0.89 | 0.19 | 0.01 |
| 9 | 3.8 | 34.907 | 0.055 | 34.815 | 0.074 | 99.7 | 57.41 | 423.27 | 0.80 | 0.22 | 0.01 |
| 10 | 4.0 | 34.643 | 0.063 | 34.525 | 0.080 | 99.7 | 65.90 | 420.12 | 0.87 | 0.23 | 0.01 |
| 11 | 4.3 | 34.484 | 0.050 | 34.454 | 0.063 | 99.9 | 100.00 | 419.36 | 0.68 | 0.49 | 0.02 |
| Step No. | Power (%) | 40Ar/39Ar | ±1 σ | 40Ar*/39Ar(K) | ±1 σ | 40Ar* (%) | Cumulative 39Ar (%) | Age (Ma) | ±1 σ | Ca/K | ±1 σ |
|---|---|---|---|---|---|---|---|---|---|---|---|
| 1 | 3.0 | 63.513 | 1.870 | 39.952 | 2.824 | 62.9 | 0.24 | 370.13 | 23.65 | 0.32 | 0.41 |
| 2 | 4.0 | 45.229 | 0.531 | 42.931 | 0.672 | 94.9 | 1.50 | 394.91 | 5.55 | 0.15 | 0.07 |
| 3 | 5.0 | 45.928 | 0.394 | 44.671 | 0.451 | 97.3 | 4.11 | 409.23 | 3.70 | 0.02 | 0.04 |
| 4 | 6.0 | 45.472 | 0.234 | 44.863 | 0.244 | 98.7 | 12.44 | 410.80 | 2.00 | 0.01 | 0.01 |
| 5 | 6.7 | 44.817 | 0.213 | 44.394 | 0.219 | 99.1 | 25.27 | 406.96 | 1.79 | 0.00 | 0.01 |
| 6 | 7.3 | 45.004 | 0.214 | 44.645 | 0.226 | 99.2 | 34.20 | 409.02 | 1.85 | 0.00 | 0.01 |
| 7 | 7.9 | 45.045 | 0.218 | 44.613 | 0.228 | 99.0 | 45.09 | 408.76 | 1.87 | 0.01 | 0.01 |
| 8 | 8.5 | 44.961 | 0.243 | 44.739 | 0.251 | 99.5 | 56.09 | 409.79 | 2.06 | 0.00 | 0.01 |
| 9 | 9.1 | 45.087 | 0.217 | 44.932 | 0.227 | 99.7 | 63.31 | 411.36 | 1.86 | 0.00 | 0.01 |
| 10 | 10.0 | 44.808 | 0.193 | 44.595 | 0.201 | 99.5 | 73.52 | 408.61 | 1.64 | 0.00 | 0.01 |
| 11 | 11.0 | 45.074 | 0.226 | 44.917 | 0.236 | 99.7 | 80.24 | 411.25 | 1.94 | 0.00 | 0.01 |
| 12 | 12.5 | 44.871 | 0.205 | 44.676 | 0.217 | 99.6 | 87.49 | 409.27 | 1.78 | 0.00 | 0.02 |
| 13 | 45.0 | 45.173 | 0.195 | 45.030 | 0.203 | 99.7 | 100.00 | 412.17 | 1.66 | 0.04 | 0.01 |
| Step No. | Power (%) | 40Ar/39Ar | ±1 σ | 40Ar*/39Ar(K) | ±1 σ | 40Ar* (%) | Cumulative 39Ar (%) | Age (Ma) | ±1 σ | Ca/K | ±1σ |
|---|---|---|---|---|---|---|---|---|---|---|---|
| 1 | 3.0 | 54.417 | 0.967 | 46.786 | 1.295 | 85.9 | 1.43 | 424.75 | 10.47 | 1.00 | 0.18 |
| 2 | 4.0 | 45.834 | 0.185 | 44.379 | 0.223 | 96.7 | 14.13 | 405.17 | 1.82 | 2.36 | 0.12 |
| 3 | 4.7 | 46.083 | 0.230 | 45.390 | 0.256 | 98.4 | 26.26 | 413.43 | 2.08 | 2.06 | 0.11 |
| 4 | 5.4 | 46.242 | 0.211 | 45.815 | 0.234 | 99.0 | 40.55 | 416.88 | 1.90 | 1.23 | 0.07 |
| 5 | 6.1 | 46.368 | 0.215 | 45.946 | 0.233 | 99.1 | 52.39 | 417.94 | 1.89 | 0.43 | 0.04 |
| 6 | 6.7 | 46.096 | 0.256 | 45.644 | 0.274 | 99.0 | 64.09 | 415.49 | 2.23 | 0.18 | 0.02 |
| 7 | 7.3 | 45.797 | 0.284 | 45.317 | 0.305 | 98.9 | 74.36 | 412.83 | 2.49 | 0.10 | 0.02 |
| 8 | 7.9 | 45.828 | 0.270 | 45.163 | 0.313 | 98.5 | 81.26 | 411.57 | 2.55 | 0.12 | 0.04 |
| 9 | 8.5 | 46.262 | 0.318 | 45.645 | 0.373 | 98.7 | 86.84 | 415.50 | 3.03 | 0.09 | 0.04 |
| 10 | 9.5 | 46.385 | 0.387 | 45.359 | 0.442 | 97.8 | 91.41 | 413.17 | 3.60 | 0.10 | 0.06 |
| 11 | 11.5 | 47.157 | 0.586 | 45.967 | 0.672 | 97.5 | 94.37 | 418.11 | 5.46 | 0.16 | 0.08 |
| 12 | 45.0 | 47.991 | 0.335 | 46.262 | 0.390 | 96.4 | 100.00 | 420.51 | 3.16 | 0.57 | 0.07 |
| Step No. | Power (%) | 40Ar/39Ar | ±1 σ | 40Ar*/39Ar(K) | ±1 σ | 40Ar* (%) | Cumulative 39Ar (%) | Age (Ma) | ±1 σ | Ca/K | ±1 σ |
|---|---|---|---|---|---|---|---|---|---|---|---|
| 1 | 3.0 | 55.925 | 0.712 | 41.033 | 0.843 | 73.4 | 1.95 | 378.26 | 7.01 | 0.01 | 0.08 |
| 2 | 4.0 | 48.148 | 0.271 | 46.378 | 0.286 | 96.3 | 10.71 | 422.17 | 2.32 | 0.01 | 0.02 |
| 3 | 5.0 | 46.726 | 0.236 | 46.285 | 0.248 | 99.1 | 28.43 | 421.42 | 2.02 | 0.01 | 0.02 |
| 4 | 5.6 | 46.701 | 0.229 | 46.420 | 0.237 | 99.4 | 41.29 | 422.51 | 1.92 | 0.01 | 0.02 |
| 5 | 6.2 | 46.402 | 0.194 | 46.135 | 0.203 | 99.4 | 55.57 | 420.20 | 1.65 | 0.01 | 0.01 |
| 6 | 6.8 | 46.061 | 0.183 | 45.819 | 0.194 | 99.5 | 69.74 | 417.63 | 1.58 | 0.01 | 0.01 |
| 7 | 7.4 | 45.984 | 0.221 | 45.665 | 0.233 | 99.3 | 79.49 | 416.38 | 1.90 | 0.02 | 0.02 |
| 8 | 8.0 | 46.071 | 0.289 | 45.644 | 0.307 | 99.1 | 87.07 | 416.21 | 2.50 | 0.01 | 0.02 |
| 9 | 8.8 | 45.964 | 0.305 | 45.475 | 0.331 | 98.9 | 92.84 | 414.83 | 2.70 | 0.03 | 0.03 |
| 10 | 9.6 | 46.483 | 0.515 | 46.022 | 0.589 | 99.0 | 95.75 | 419.28 | 4.79 | 0.04 | 0.06 |
| 11 | 11.5 | 45.804 | 0.552 | 44.994 | 0.685 | 98.2 | 97.56 | 410.91 | 5.59 | 0.22 | 0.10 |
| 12 | 45.0 | 43.689 | 0.441 | 42.214 | 0.558 | 96.6 | 100.00 | 388.06 | 4.62 | 0.80 | 0.10 |
| Step No. | Power (%) | 40Ar/39Ar | ±1 σ | 40Ar*/39Ar(K) | ±1 σ | 40Ar* (%) | Cumulative 39Ar (%) | Age (Ma) | ±1 σ | Ca/K | ±1 σ |
|---|---|---|---|---|---|---|---|---|---|---|---|
| 1 | 0.8 | 29.968 | 0.067 | 28.531 | 0.095 | 95.2 | 11.74 | 353.29 | 1.07 | 0.80 | 0.33 |
| 2 | 1.5 | 30.363 | 0.086 | 28.989 | 0.248 | 95.4 | 14.56 | 358.43 | 2.79 | 2.14 | 0.91 |
| 3 | 2.0 | 32.630 | 0.093 | 31.989 | 0.256 | 97.9 | 17.21 | 391.77 | 2.82 | 2.27 | 0.96 |
| 4 | 2.8 | 32.742 | 0.080 | 32.304 | 0.147 | 98.6 | 22.48 | 395.24 | 1.61 | 1.45 | 0.61 |
| 5 | 3.2 | 33.443 | 0.091 | 33.285 | 0.212 | 99.5 | 25.64 | 405.98 | 2.31 | 0.55 | 0.26 |
| 6 | 3.8 | 32.985 | 0.077 | 32.565 | 0.120 | 98.7 | 32.68 | 398.10 | 1.32 | 1.19 | 0.50 |
| 7 | 4.0 | 34.253 | 0.074 | 34.133 | 0.080 | 99.6 | 51.79 | 415.22 | 0.87 | 0.26 | 0.11 |
| 8 | 4.3 | 34.282 | 0.071 | 33.987 | 0.073 | 99.1 | 100.00 | 413.64 | 0.79 | 0.23 | 0.10 |
© 2020 by the authors. Licensee MDPI, Basel, Switzerland. This article is an open access article distributed under the terms and conditions of the Creative Commons Attribution (CC BY) license (http://creativecommons.org/licenses/by/4.0/).
Share and Cite
Lentz, C.; Thorne, K.; McFarlane, C.R.M.; Archibald, D.A. U-Pb, Ar-Ar, and Re-Os Geochronological Constraints on Multiple Magmatic–Hydrothermal Episodes at the Lake George Mine, Central New Brunswick. Minerals 2020, 10, 566. https://doi.org/10.3390/min10060566
Lentz C, Thorne K, McFarlane CRM, Archibald DA. U-Pb, Ar-Ar, and Re-Os Geochronological Constraints on Multiple Magmatic–Hydrothermal Episodes at the Lake George Mine, Central New Brunswick. Minerals. 2020; 10(6):566. https://doi.org/10.3390/min10060566
Chicago/Turabian StyleLentz, Carlin, Kathleen Thorne, Christopher R. M. McFarlane, and Douglas A. Archibald. 2020. "U-Pb, Ar-Ar, and Re-Os Geochronological Constraints on Multiple Magmatic–Hydrothermal Episodes at the Lake George Mine, Central New Brunswick" Minerals 10, no. 6: 566. https://doi.org/10.3390/min10060566
APA StyleLentz, C., Thorne, K., McFarlane, C. R. M., & Archibald, D. A. (2020). U-Pb, Ar-Ar, and Re-Os Geochronological Constraints on Multiple Magmatic–Hydrothermal Episodes at the Lake George Mine, Central New Brunswick. Minerals, 10(6), 566. https://doi.org/10.3390/min10060566