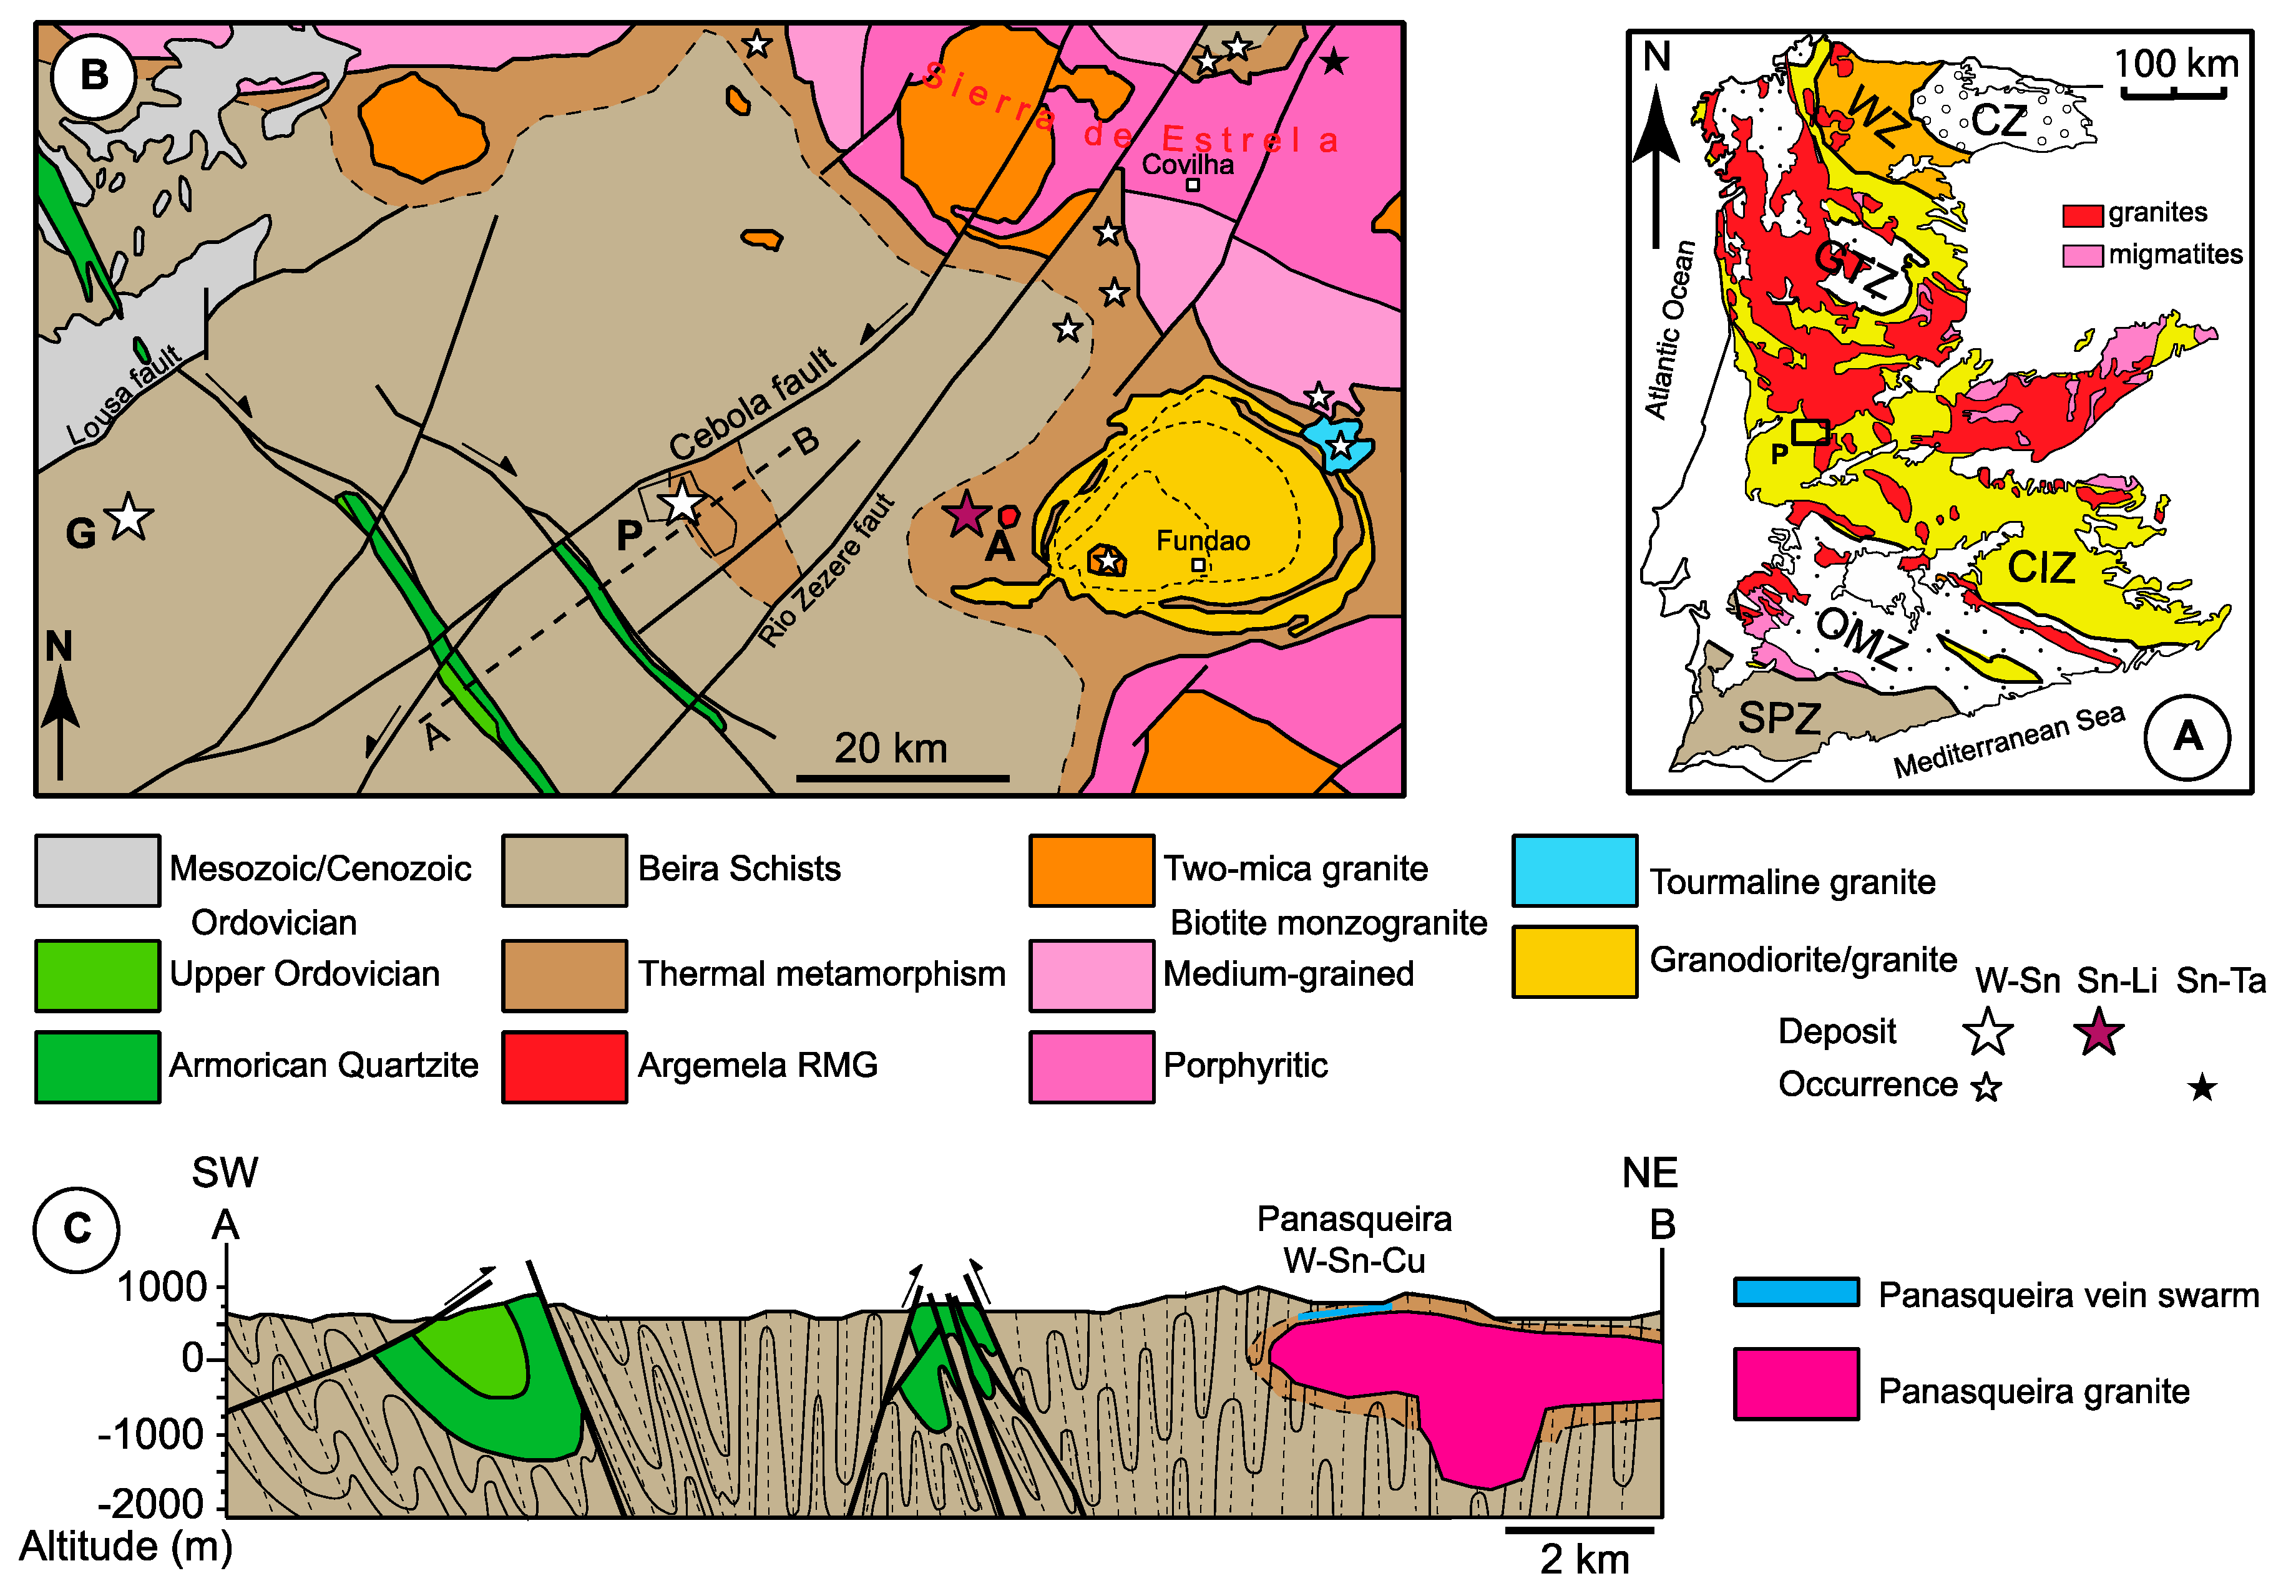
Figure 1.
Geological setting of the Panasqueira deposit. (
A) The regional setting, with the main lithotectonic units (simplified from [
20]): SPZ (South Portuguese Zone), GTZ (Galicia-Tras-os-Montes Zone), OMZ (Ossa Morena Zone), CZ (Cantabrian Zone) allochthonous units; CIZ (Central Iberian Zone), WZ (Western Asturian-Leon Zone) autochthonous units. P: location of Figure B. (
B) Geologic map of the Panasqueira area (located in Figure A) adapted from [
12,
13,
14,
15]. A: Argemela; G: Gois; P: Panasqueira. Line A–B: section of Figure C. (
C) A-B geologic cross-section, simplified from [
15].
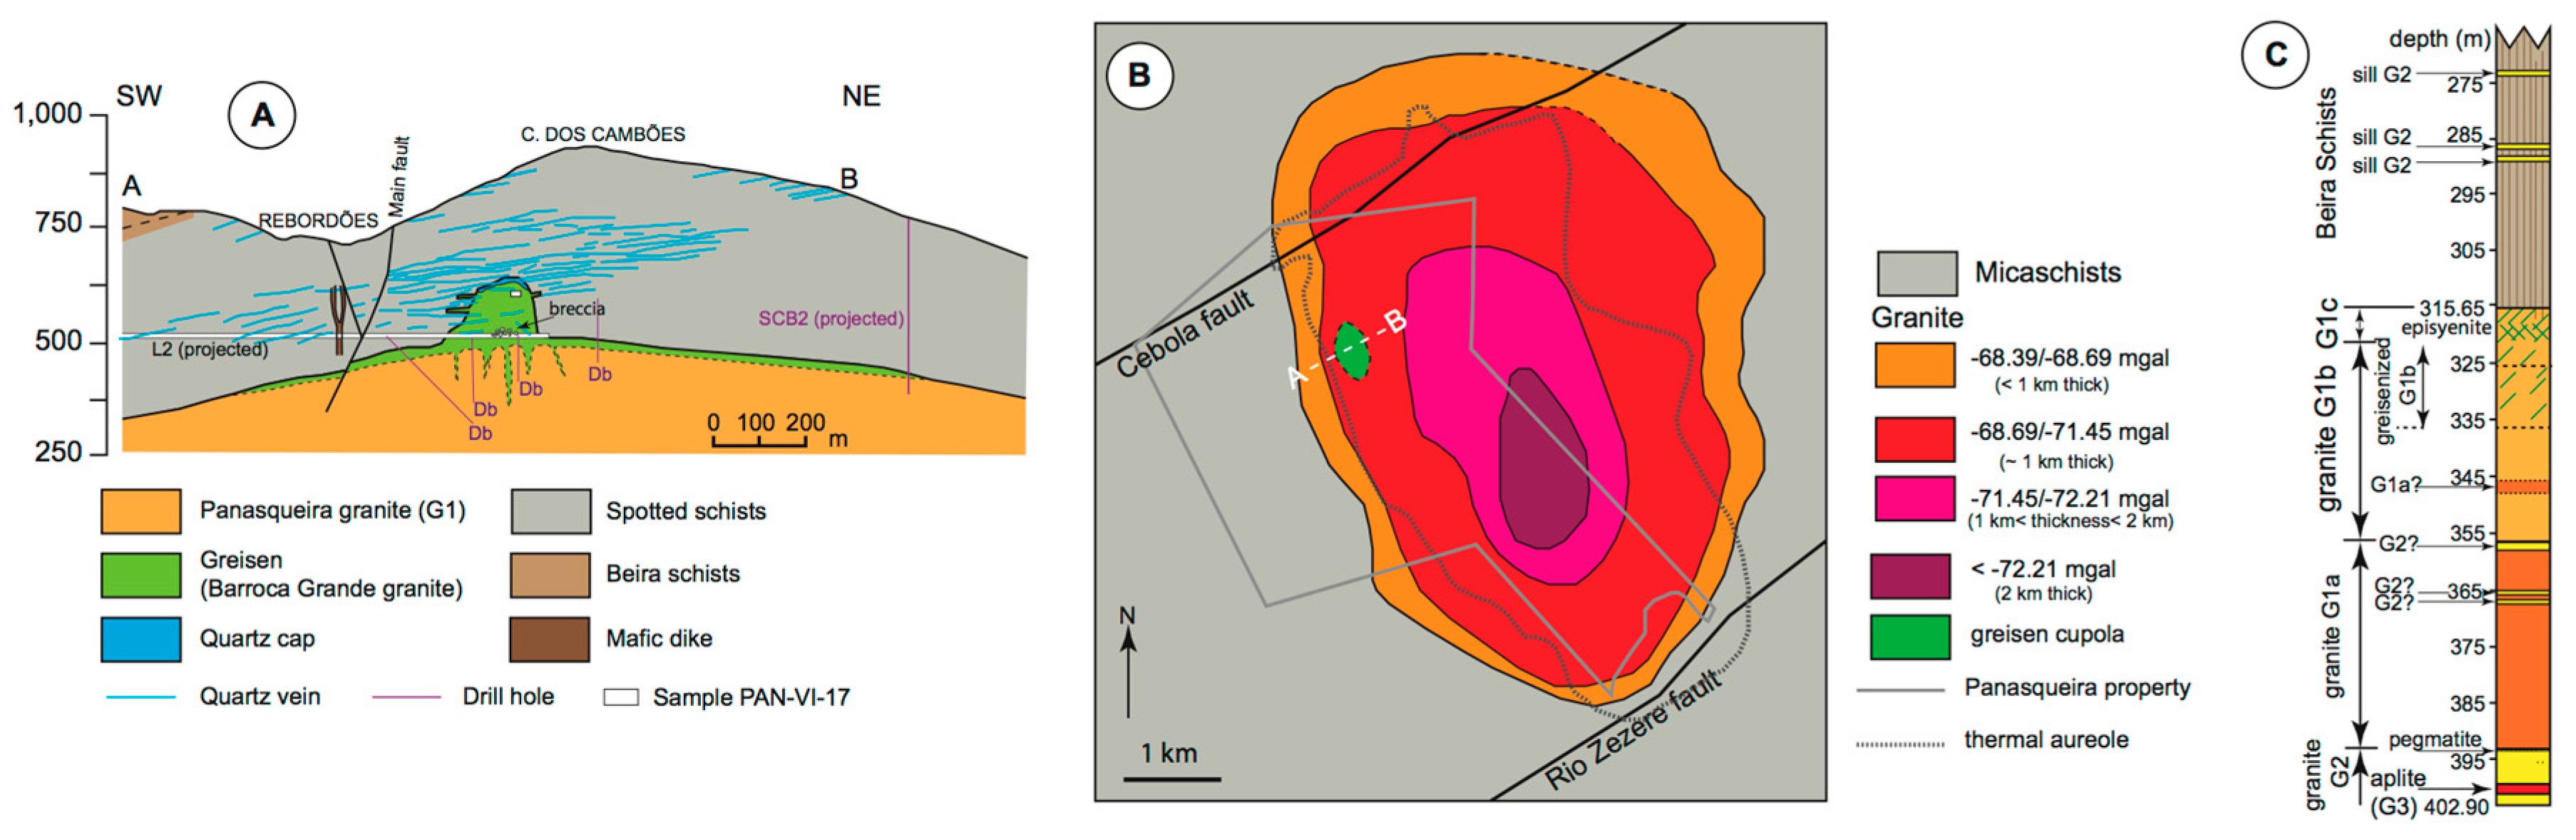
Figure 2.
Panasqueira granite architecture. (
A) The accepted petrography of the upper granite body, according to [
11,
12]. Section A–B is located in Figure B. Location of the old drill holes, as well as the recent SCB2 hole and new L2 gallery, are indicated. The vertical greisen roots are drawn as proposed by [
12], but without any observational base (no intersection by the figured drill holes). (
B) Gravimetric data interpretation of the shape of the granite body, according to [
34]. (
C) Synthetic petrographic profile of the SCB2 drill-hole.
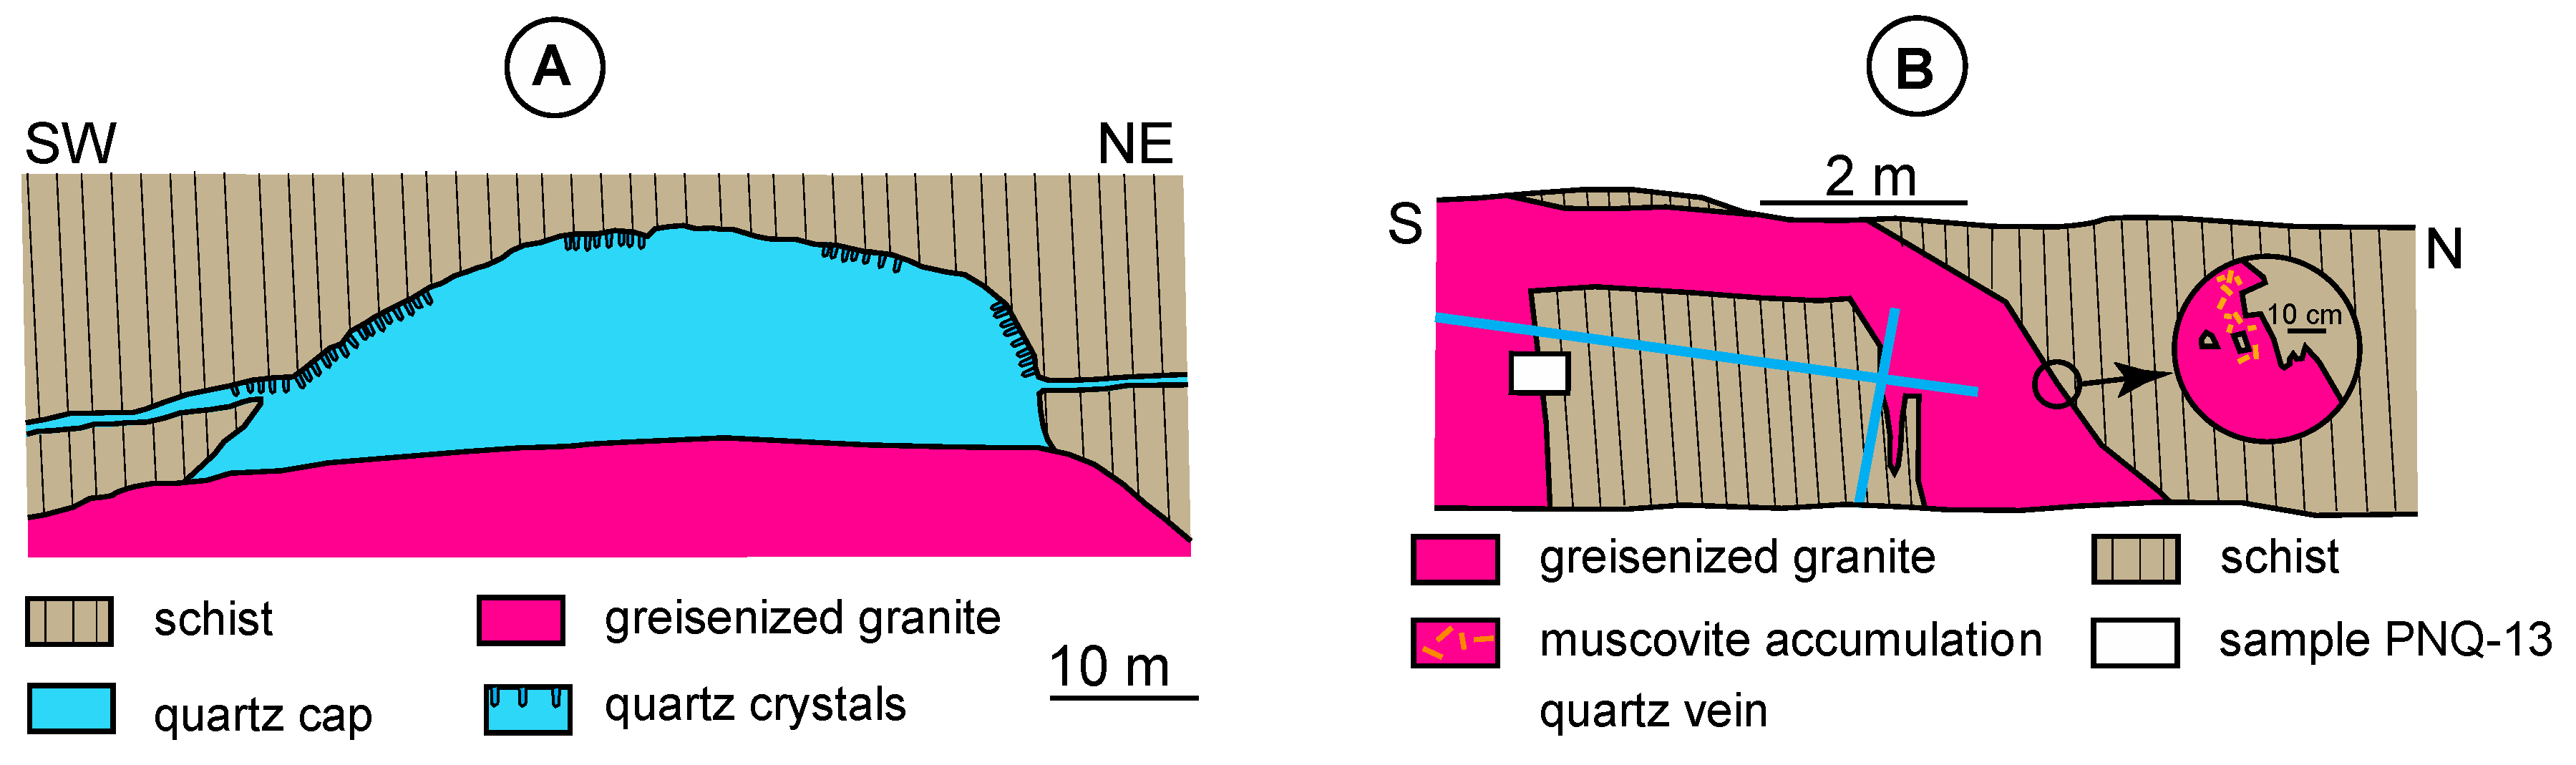
Figure 3.
Details of the greisen cupola. (
A) Quartz cap at the top of the greisen cupola (redrawn and interpreted from [
11]). The big quartz crystals are inferred from the original description of [
11], having not been drawn by them. (
B) Sketch of the (greisenised) G4 granite intrusive contact at the L2 level (observations at the L2 level-2018).
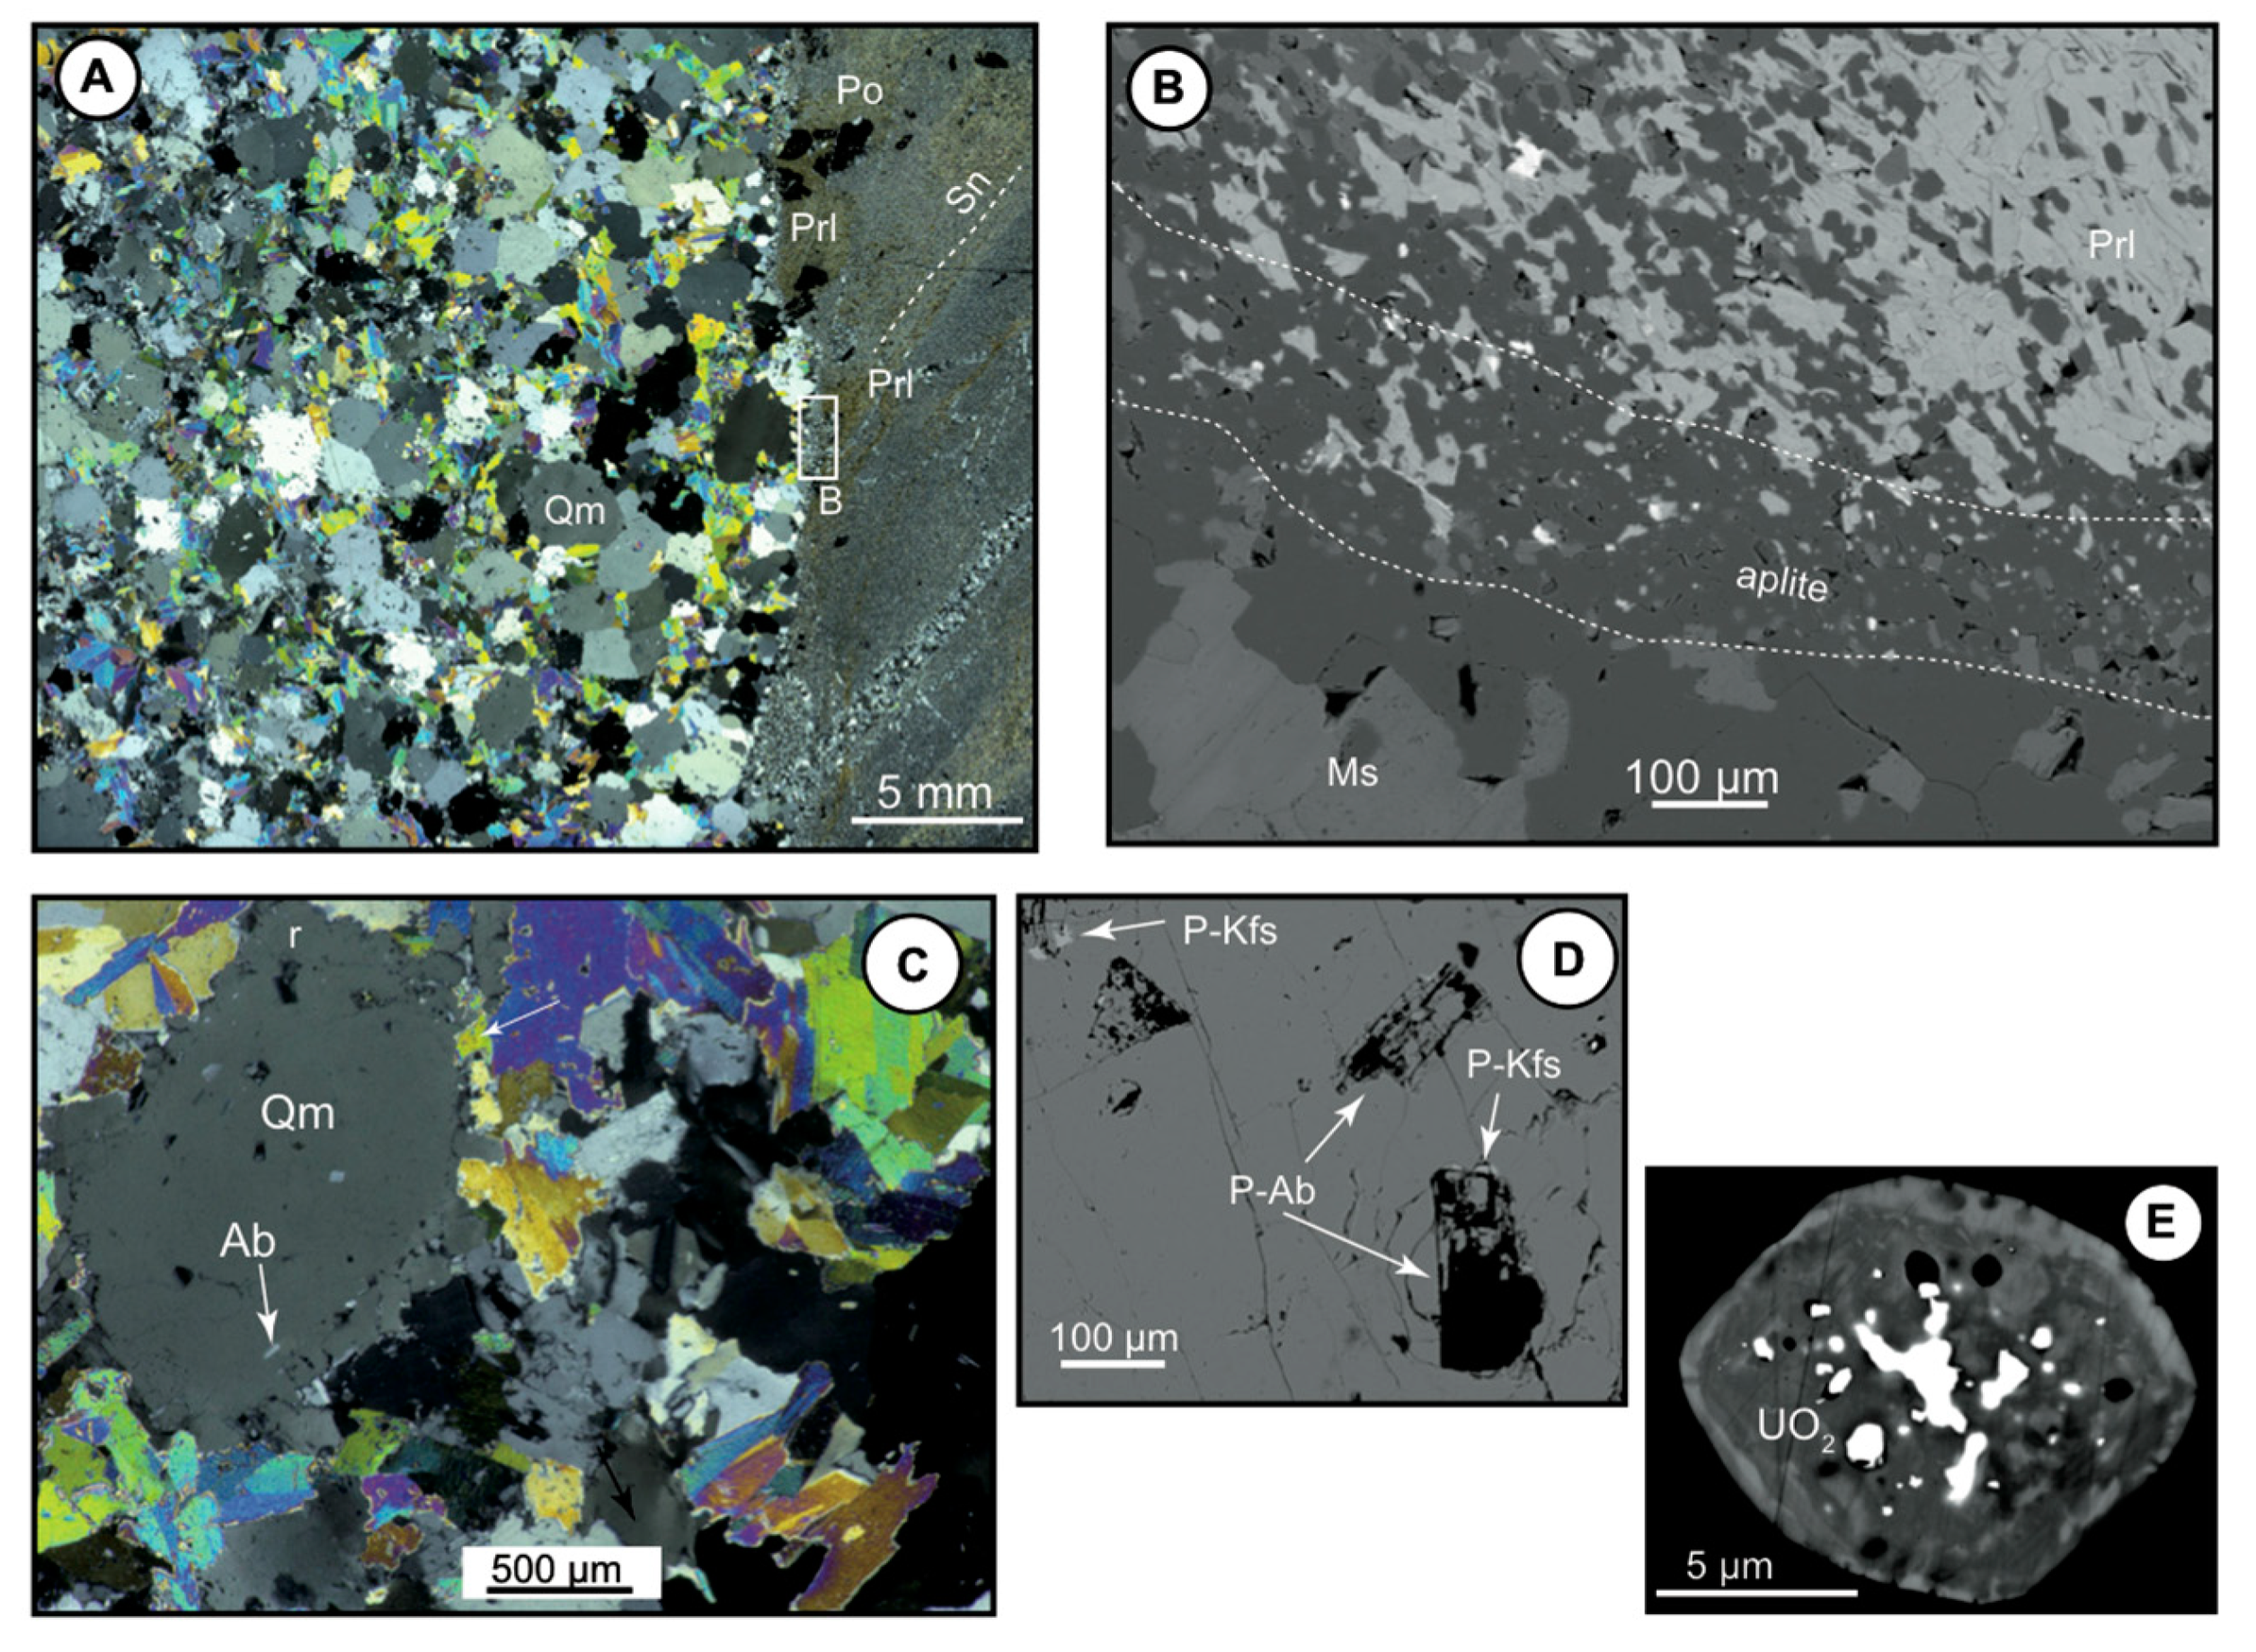
Figure 4.
Photomicrographs and SEM-BSE images of the greisen cupola at the L2 level. (A) Granite (greisenised)/wallrock contact (cross-polarized light, sample PNQ-13a). Starting from the contact, protolithionite (Prl) is invading the wall rock, thanks to the schistosity (Sn); Po: pyrrhotite. (B) SEM-BSE image of the granite-schist contact (located in A). A thin aplite rim is intercalated at the contact. Together with quartz and albite, it contains minute inclusions of muscovite, protolithionite, and rutile (bright spots). (C) Relic embryonic snowball quartz in the greisenised G4 granite (sample PNQ-13a, cross-polarized light). The small included albite (Ab) in the magmatic quartz (Qm) defines the “snowball” texture. Note the secondary quartz expansions (r) around the magmatic quartz, and the interplay of muscovite and this rim (arrow). (D) SEM-BSE image of included P-enriched albite (P-Ab) and Kfs (P-Kfs) in the magmatic quartz (sample PNQ-19a). (E) Zoned zircon in the muscovite at the L2 level (BSE, sample PNQ-17a). Note the numerous uraninite inclusions. The rim is depleted in Hf and U-rich. Note the great difference with the G1 zircon (Figure 10D).

Figure 5.
Photomicrographs and SEM-BSE images of albite habit in the greisenised G4 granite (L2 level) (cross-polarized light, sample PNQ-19a). (A) Overall view of the greisen. The rock mainly consists of quartz and muscovite (Ms), with albite ghosts overprinted by quartz (arrows). Qm relic snowball quartz. (B) Skeletal topaz included in quartz. (C–G) Lace-shaped ghosts of albite crystals invaded by quartz. Ab: albite, Toz: topaz.
Figure 6.
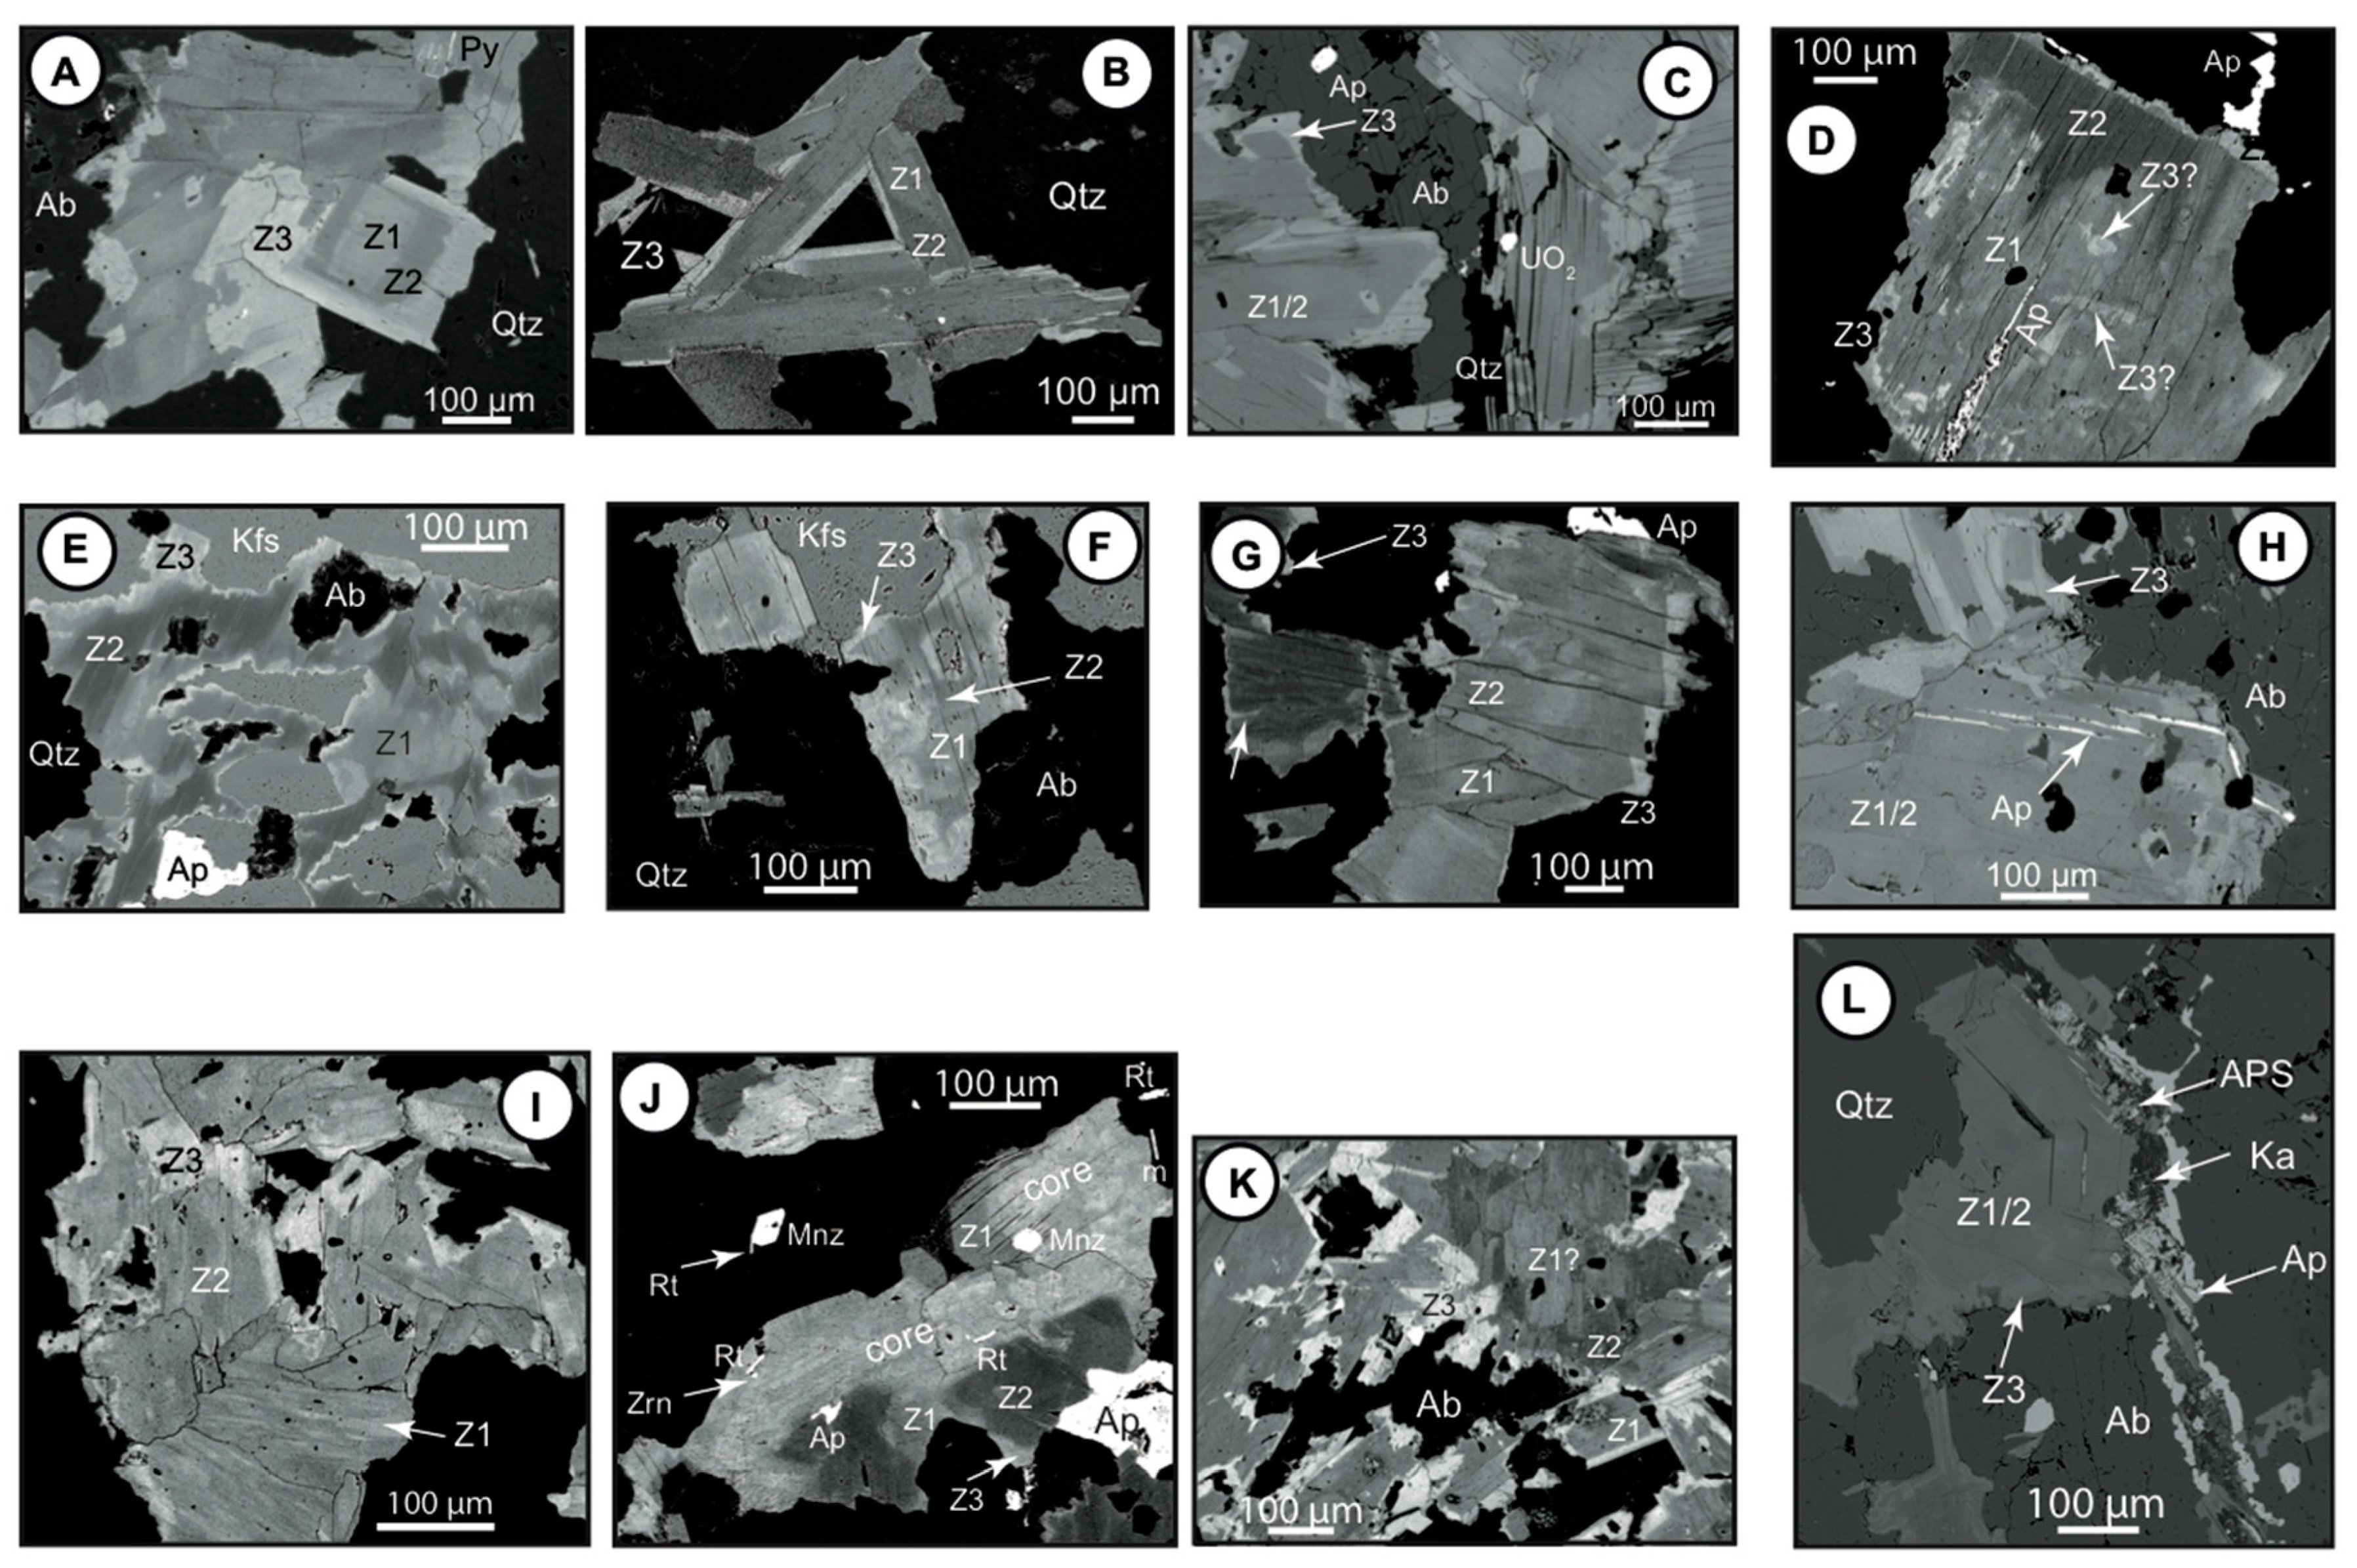
SEM-BSE images of muscovite zoning. The zoning pattern consists of three zones with a grey core (Z1), a darker first rim (Z2), and a bright second rim (Z3). Ab albite, Ap apatite, APS alumina-phosphate-sulfate, Kfs K-feldspar, Rt rutile, Mnz monazite, Qtz quartz, Zrn zircon.
A to
C: muscovite from the greisenised G4 granite. (
A) L2 level (sample PNQ-19a). A clear succession of the three zones (Z1 to Z3) is visible, although patchy zoning features are also evident. (
B) L0 level (sample PAN-VI-17a2-1). The Z1 to Z3 succession is well seen. (
C) L2 level, contact with the wall rock (sample PNQ-13a). Privileged Z3 development occurs along the muscovite/albite boundary. Note the uraninite inclusion. (
D,
E) Muscovite in granites from the G1 suite. (
D) Muscovite strips in the Kfs from the porphyritic granite G1a (sample PAN16-6). Patchy zoning with clear superimposition of Z2 onto Z1. (
E) Greisenised G1b granite (sample PAN16-4a). Note the ingress of Z3 onto the patchy Z1/2 assemblage. (
F) Altered G2 granite (sample PAN16-8). Note the concentric Z1 to Z3 pattern. Arrow: Z3 invasive along cleavage. (
G) Altered leucomicrogranite (aplite) G3 (sample PAN16-9). Note the conspicuous Z3 rim and the residual character of the Z1 zone within the main Z2 zone. (
H,
I) Possible relicts of an altered magmatic Li-mica. (
H) In some crystals from the greisenised G1b granite (sample PAN16-3b), the existence of a bright “core”, with rutile inclusions, may be tentatively interpreted as resulting from the replacement of a pre-existing Ms0-rutile assemblage developed at the expense of a pristine protolithionite; m is molybdenite. (
I) Some bright areas in the core of muscovite from the greisenised G4 granite (sample PNQ-13a) may be tentatively interpreted as relicts from a pre-existing Li-mica (Z1?). (
J–L) Muscovite-apatite relationships. (
J) Altered G2 granite (sample PAN16-8). Note the invasive character of the Z3 zone and the presence of late apatite along the cleavage. Small Fe-rich patches inside Z1 (Z3?) are possible ghosts of an earlier Li-mica. (
K) Patchy zoning in the muscovite from the greisenised G4 granite near the wall-rock boundary (sample PNQ-13a). The Z3 zone is encroaching the earlier muscovite. Note the clear overprinting by apatite (Ap). (
L) Microcracks filled with apatite are encroaching the zoned muscovite and the albite in the altered G2 granite. Apatite is replaced by an APS-kaolinite (Ka) assemblage (see
Figure 7).
Figure 6.
SEM-BSE images of muscovite zoning. The zoning pattern consists of three zones with a grey core (Z1), a darker first rim (Z2), and a bright second rim (Z3). Ab albite, Ap apatite, APS alumina-phosphate-sulfate, Kfs K-feldspar, Rt rutile, Mnz monazite, Qtz quartz, Zrn zircon.
A to
C: muscovite from the greisenised G4 granite. (
A) L2 level (sample PNQ-19a). A clear succession of the three zones (Z1 to Z3) is visible, although patchy zoning features are also evident. (
B) L0 level (sample PAN-VI-17a2-1). The Z1 to Z3 succession is well seen. (
C) L2 level, contact with the wall rock (sample PNQ-13a). Privileged Z3 development occurs along the muscovite/albite boundary. Note the uraninite inclusion. (
D,
E) Muscovite in granites from the G1 suite. (
D) Muscovite strips in the Kfs from the porphyritic granite G1a (sample PAN16-6). Patchy zoning with clear superimposition of Z2 onto Z1. (
E) Greisenised G1b granite (sample PAN16-4a). Note the ingress of Z3 onto the patchy Z1/2 assemblage. (
F) Altered G2 granite (sample PAN16-8). Note the concentric Z1 to Z3 pattern. Arrow: Z3 invasive along cleavage. (
G) Altered leucomicrogranite (aplite) G3 (sample PAN16-9). Note the conspicuous Z3 rim and the residual character of the Z1 zone within the main Z2 zone. (
H,
I) Possible relicts of an altered magmatic Li-mica. (
H) In some crystals from the greisenised G1b granite (sample PAN16-3b), the existence of a bright “core”, with rutile inclusions, may be tentatively interpreted as resulting from the replacement of a pre-existing Ms0-rutile assemblage developed at the expense of a pristine protolithionite; m is molybdenite. (
I) Some bright areas in the core of muscovite from the greisenised G4 granite (sample PNQ-13a) may be tentatively interpreted as relicts from a pre-existing Li-mica (Z1?). (
J–L) Muscovite-apatite relationships. (
J) Altered G2 granite (sample PAN16-8). Note the invasive character of the Z3 zone and the presence of late apatite along the cleavage. Small Fe-rich patches inside Z1 (Z3?) are possible ghosts of an earlier Li-mica. (
K) Patchy zoning in the muscovite from the greisenised G4 granite near the wall-rock boundary (sample PNQ-13a). The Z3 zone is encroaching the earlier muscovite. Note the clear overprinting by apatite (Ap). (
L) Microcracks filled with apatite are encroaching the zoned muscovite and the albite in the altered G2 granite. Apatite is replaced by an APS-kaolinite (Ka) assemblage (see
Figure 7).

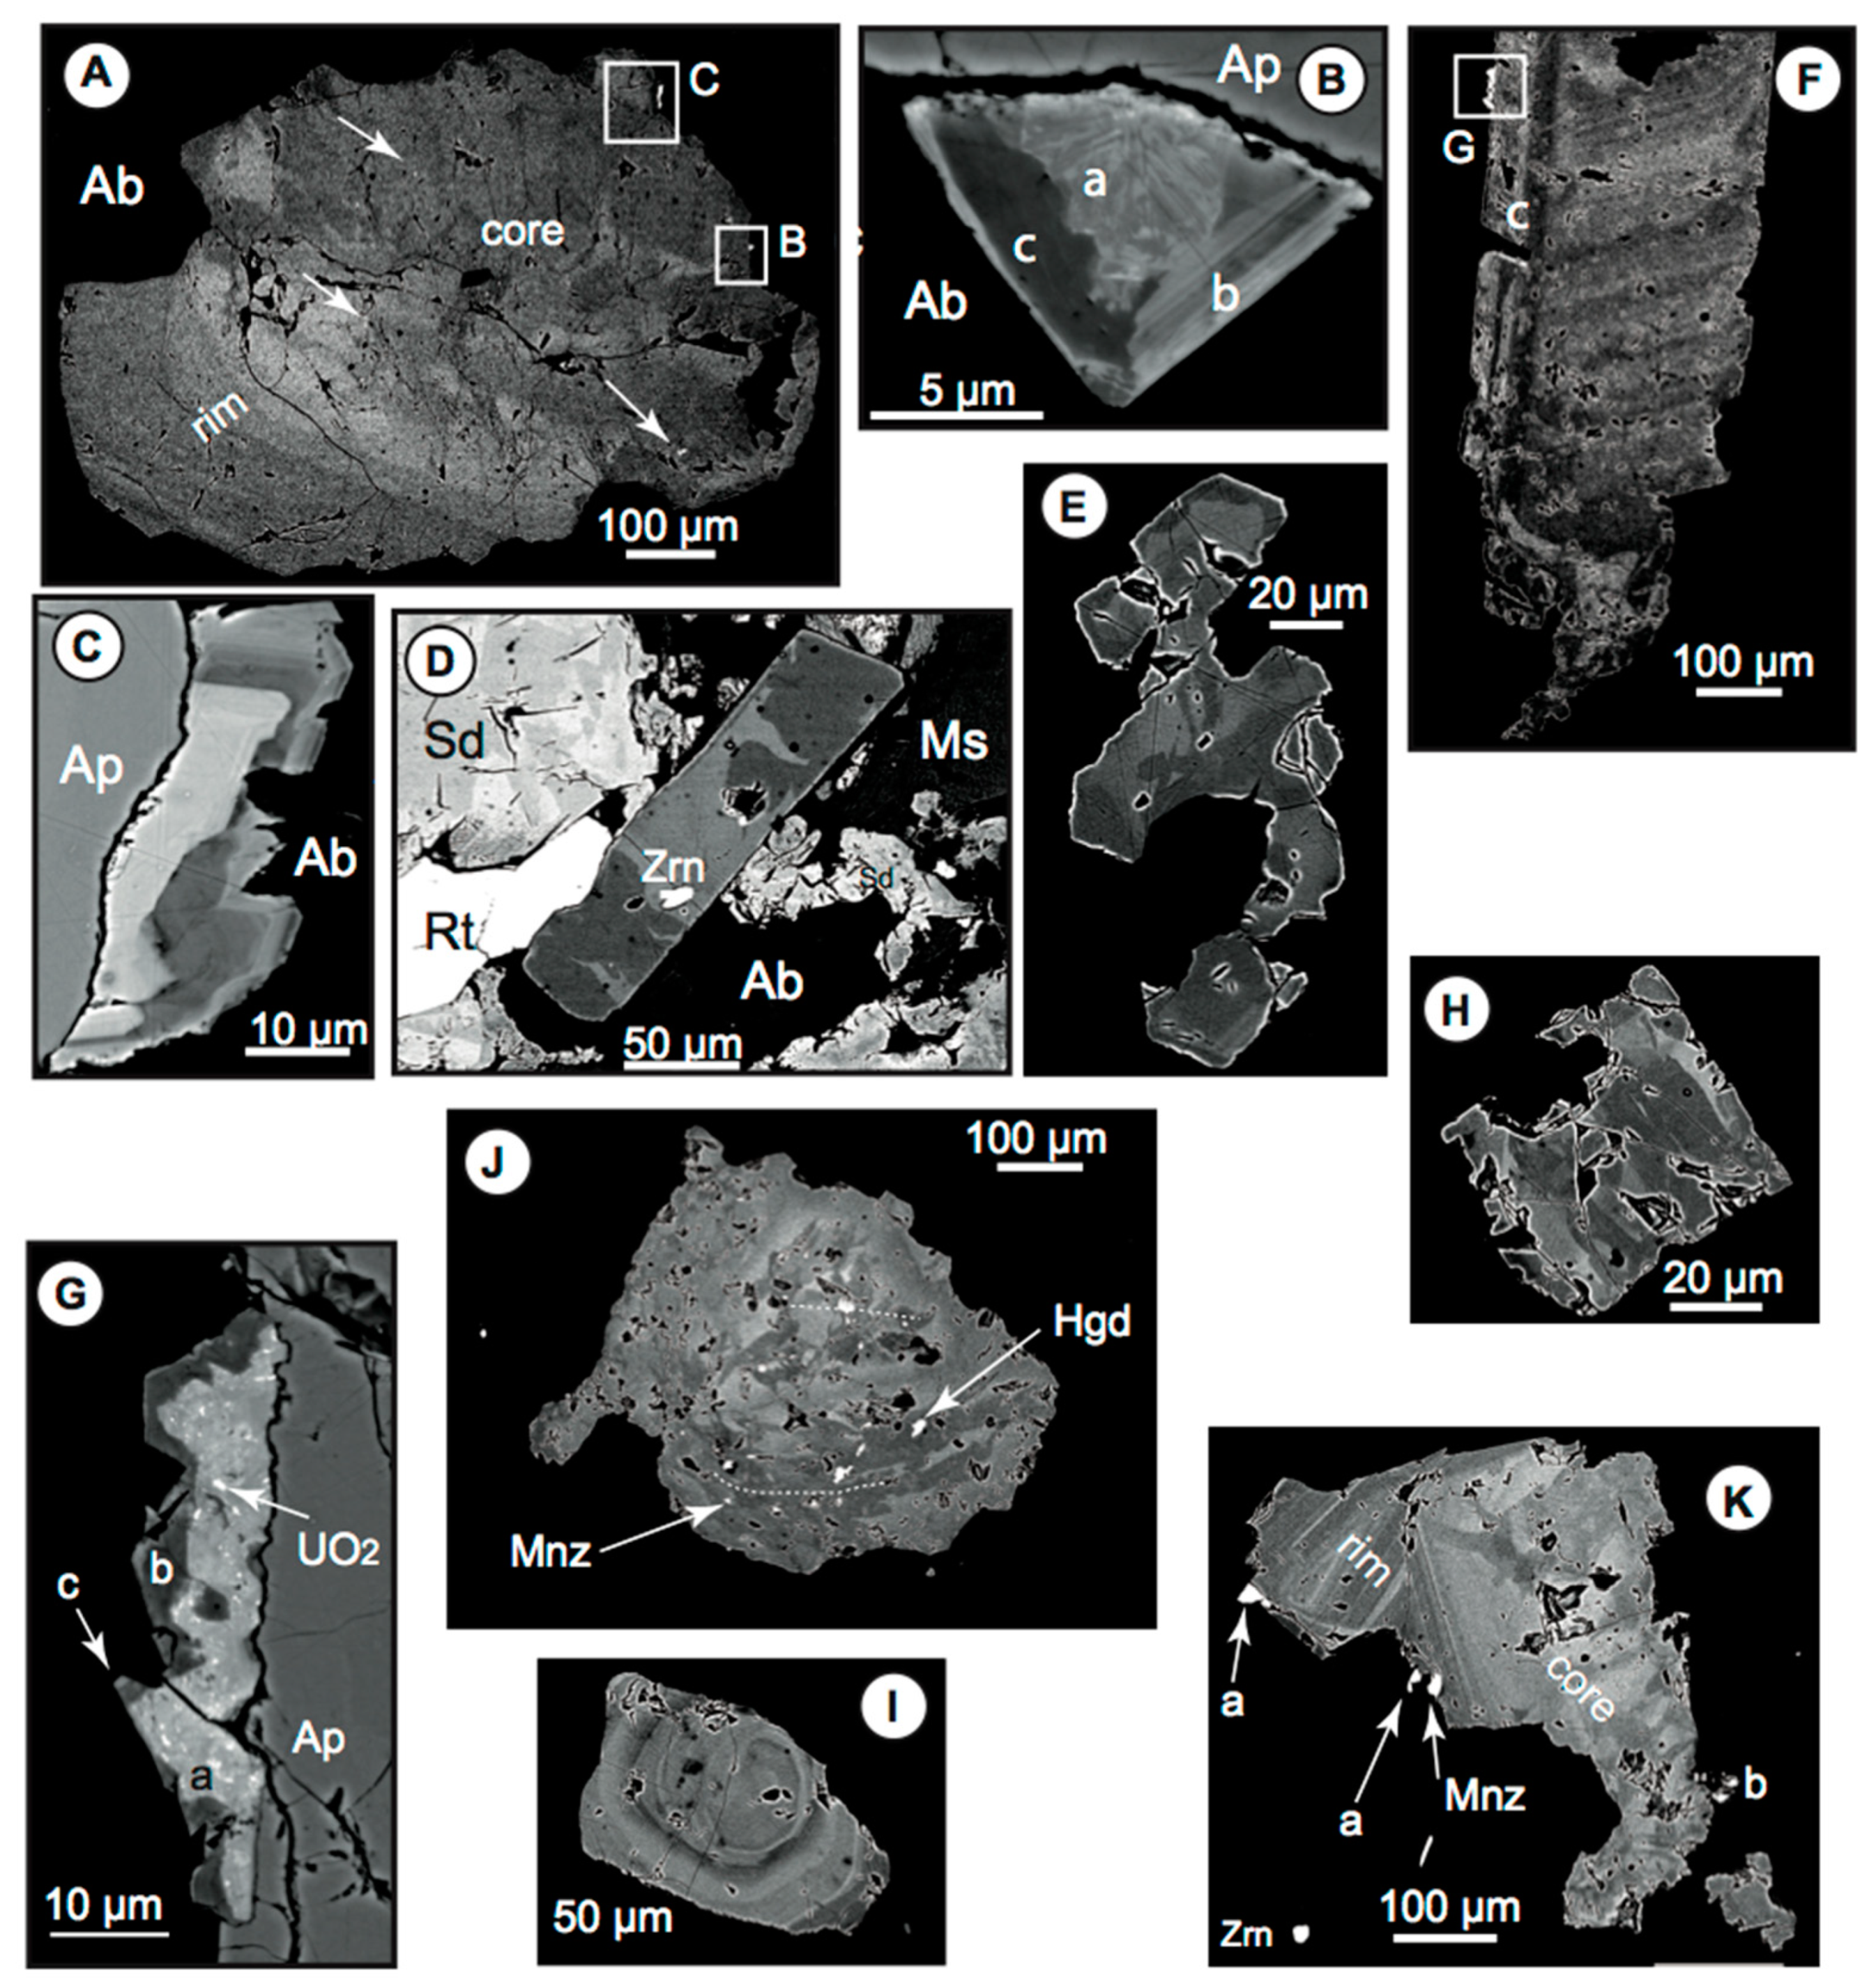
Figure 7.
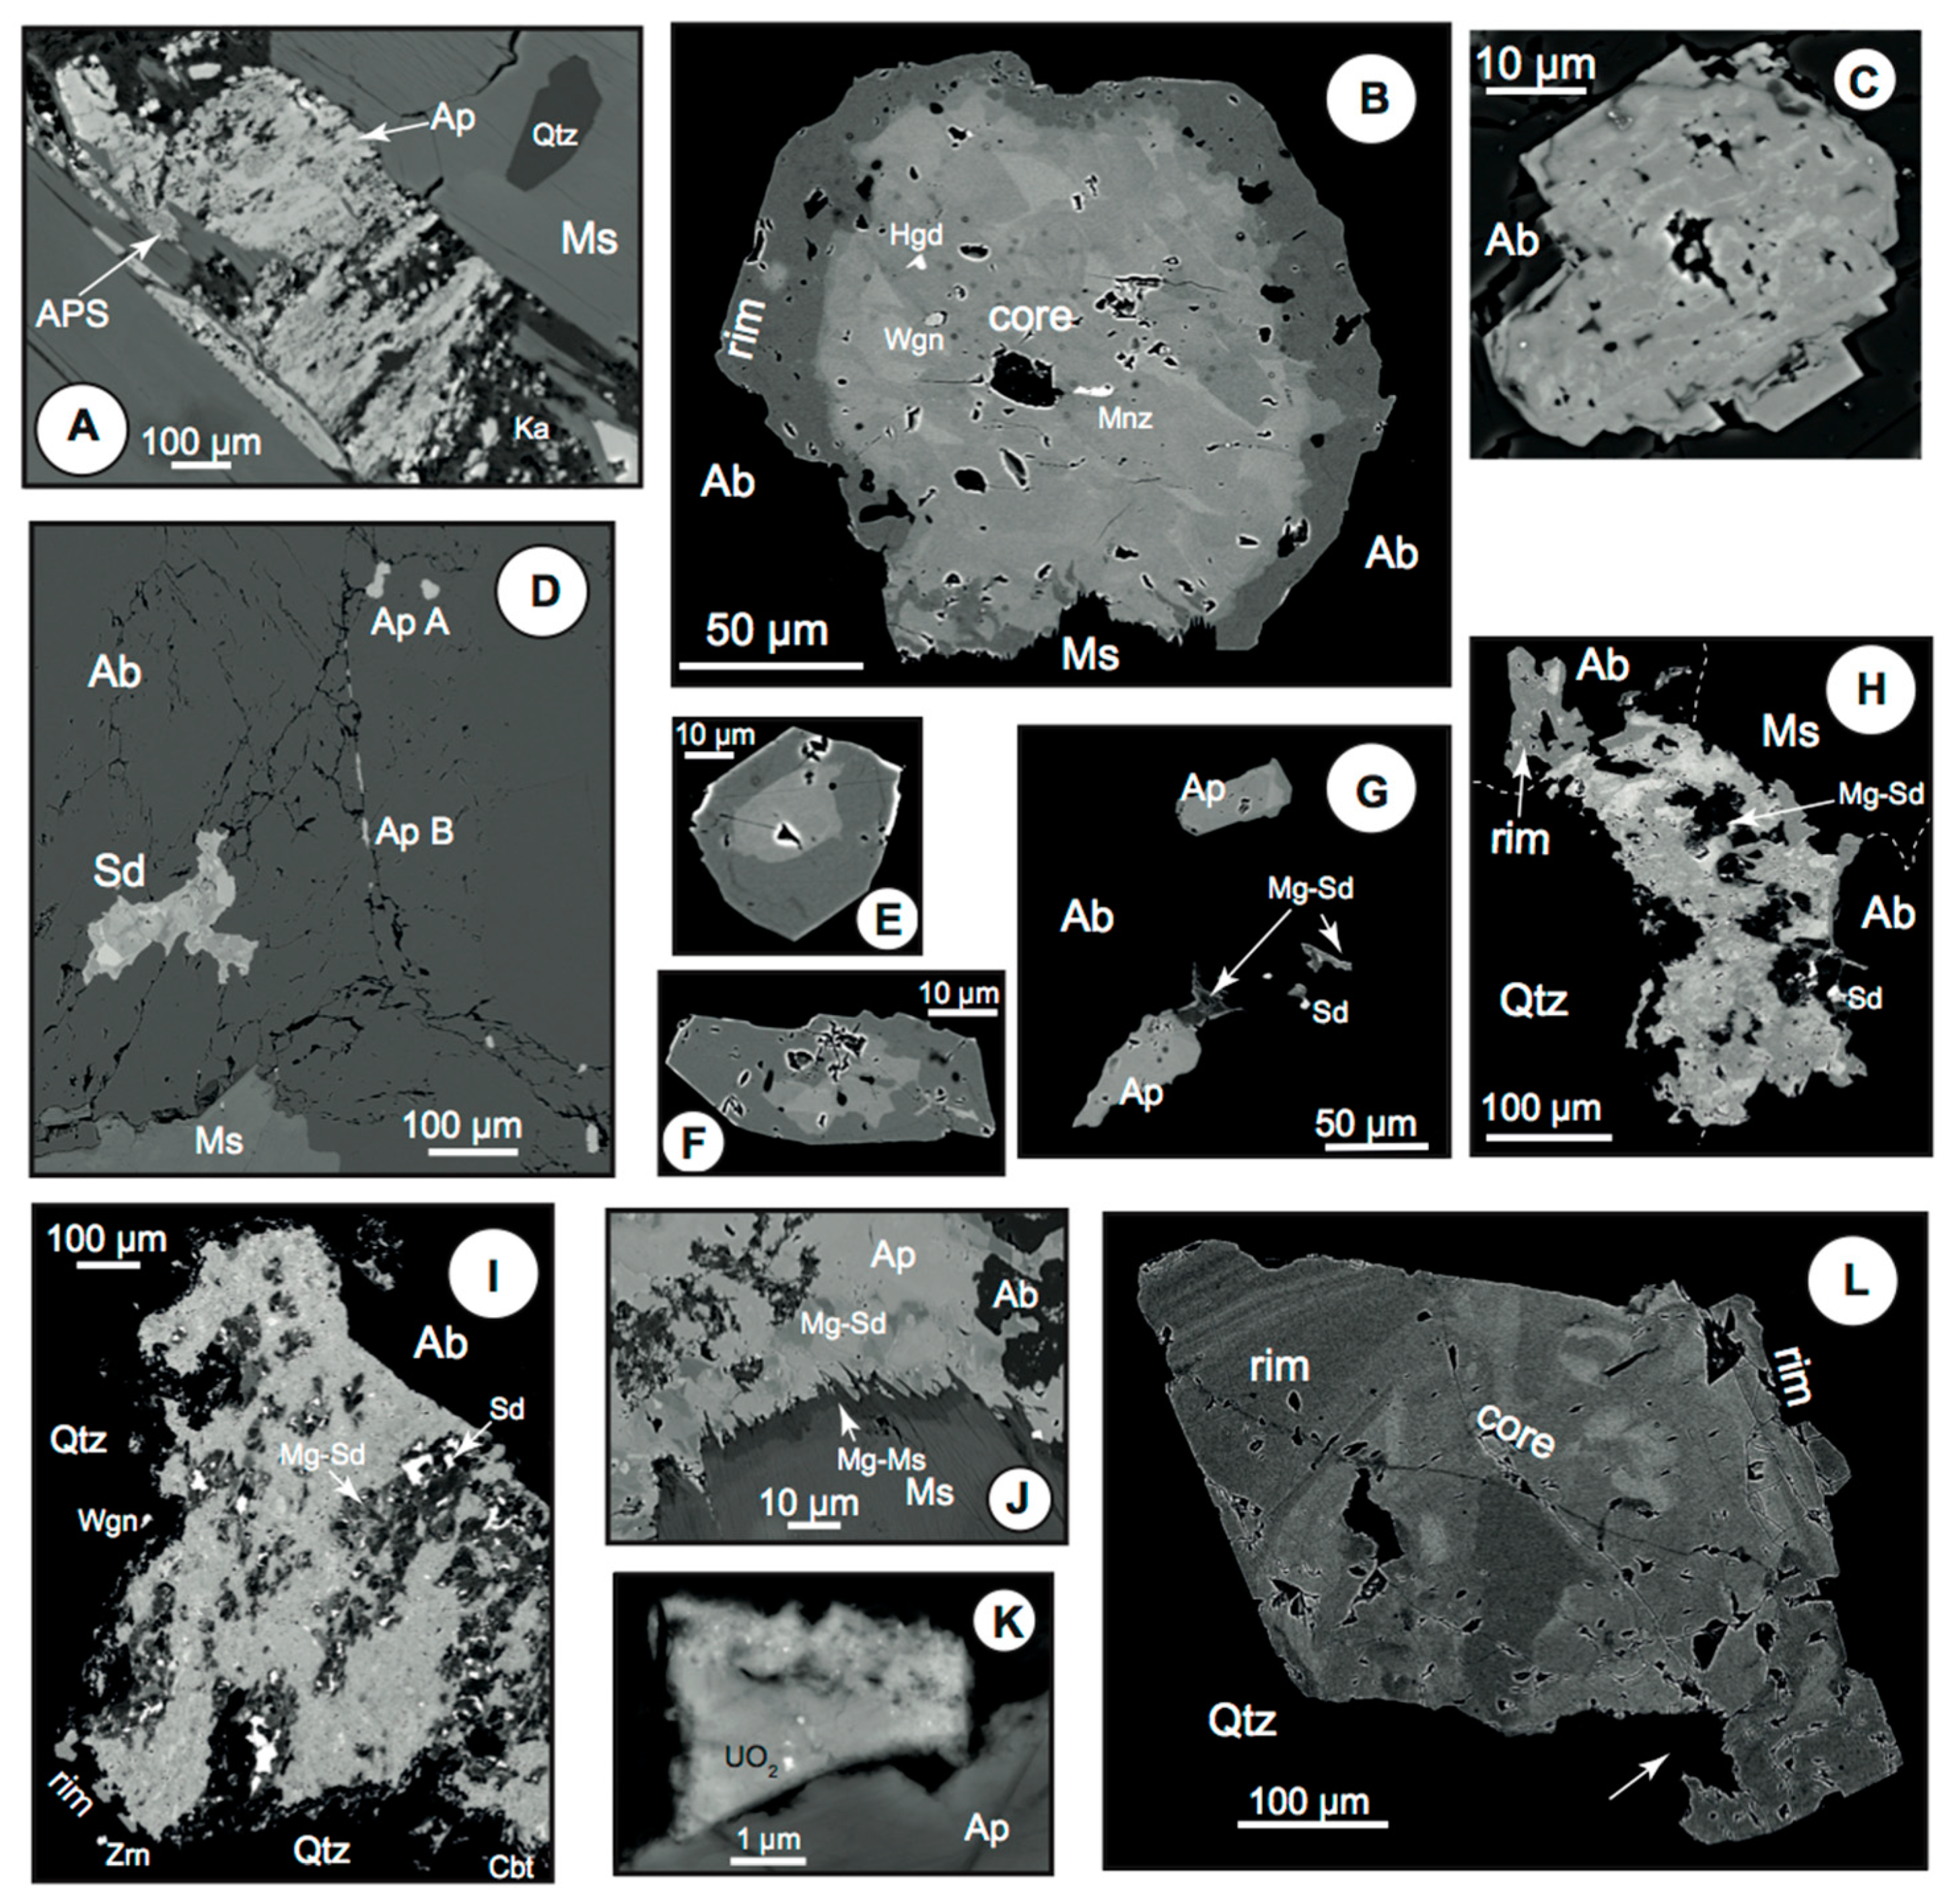
SEM-BSE images of apatite in the G2, G3, and G4 granites (BSE images). Ab albite, Ap apatite, APS alumina-phosphate-sulfate, Cbt columbite-tantalite, Ms muscovite, Hgd hagendorfite, Ka kaolinite, Mnz monazite, Qtz quartz, Sd siderite, Wgn wagnerite, Zrn zircon. (
A) In G2, a transformation of microfissural apatite into an APS-kaolinite assemblage (detail of E in
Figure 6). (
B) Zoned apatite in G2 granite (sample PAN-16-8), with a patchy zoned core and a rim. Note the various phosphate micro-inclusions in the core, and the ragged contact with muscovite. (
C) Small euhedral Sr-APS crystal included in albite (G2 granite, sample PAN-16-8). The bright internal zones and overgrowth correspond to an increase in the S content. (
D) Siderite-apatite association in albite from the G3 leuco-microgranite (sample PAN-16-9). Two types of apatite are present: small zoned euhedral crystals (Ap A), like in
E or
F, and small homogenous elongated prisms, with external rims in Ap A, apparently following a microcrack in the hosting albite (Ap B). Siderite is zoned, according to variable Mg contents, with the brightest areas being pure Fe-end member. (
E,
F) Examples of zoned apatite included in albite (G2 granite, sample PAN-16-8). (
G) Another example of an apatite-siderite association in albite (G2 granite, sample PAN-16-8). (
H,
I) Two zoned apatite crystals in the leuco-microgranite G3 (sample PAN-16-9), with a patchy core and a discontinuous homogenous rim. Note the strong corrosion by internal siderite (Mg-Sd and pure siderite), and the contrast in the boundary habit depending on the host, the boundary being ragged at the quartz contact, with a halo of minute apatite specks, and quite regular at the albite contact. (
J) In G3, a denticulate contact between apatite and the Mg-rich fringe of a muscovite crystal (sample PAN-16-9). (
K) In the greisenised G4 granite, overgrowth on apatite of an APS (goyazite-florencite solid solution), with uraninite nano-inclusions (sample PNQ-19a). (
L) A large crystal of apatite in the greisenised G4 granite (sample PNQ-19a), with a patchy zoned core and a rim displaying a conspicuous OZ. Note the locally contorted boundary (arrow), similar to some apatite habit in greisenised granite G1b (Figure 14). The small zircon crystals (1–5 µm, up to 10–20 µm), included in muscovite or in quartz, are homogenous, or well zoned, with a Hf-rich core (up to 5.3 wt% Hf, Hf# 0.06) and a rim with a lower Hf content (3.2 wt% Hf, Hf# 0.04), but richer in U (up to 2.6 wt% U in the rim, versus 0.6 wt% U in the core).
Figure 7.
SEM-BSE images of apatite in the G2, G3, and G4 granites (BSE images). Ab albite, Ap apatite, APS alumina-phosphate-sulfate, Cbt columbite-tantalite, Ms muscovite, Hgd hagendorfite, Ka kaolinite, Mnz monazite, Qtz quartz, Sd siderite, Wgn wagnerite, Zrn zircon. (
A) In G2, a transformation of microfissural apatite into an APS-kaolinite assemblage (detail of E in
Figure 6). (
B) Zoned apatite in G2 granite (sample PAN-16-8), with a patchy zoned core and a rim. Note the various phosphate micro-inclusions in the core, and the ragged contact with muscovite. (
C) Small euhedral Sr-APS crystal included in albite (G2 granite, sample PAN-16-8). The bright internal zones and overgrowth correspond to an increase in the S content. (
D) Siderite-apatite association in albite from the G3 leuco-microgranite (sample PAN-16-9). Two types of apatite are present: small zoned euhedral crystals (Ap A), like in
E or
F, and small homogenous elongated prisms, with external rims in Ap A, apparently following a microcrack in the hosting albite (Ap B). Siderite is zoned, according to variable Mg contents, with the brightest areas being pure Fe-end member. (
E,
F) Examples of zoned apatite included in albite (G2 granite, sample PAN-16-8). (
G) Another example of an apatite-siderite association in albite (G2 granite, sample PAN-16-8). (
H,
I) Two zoned apatite crystals in the leuco-microgranite G3 (sample PAN-16-9), with a patchy core and a discontinuous homogenous rim. Note the strong corrosion by internal siderite (Mg-Sd and pure siderite), and the contrast in the boundary habit depending on the host, the boundary being ragged at the quartz contact, with a halo of minute apatite specks, and quite regular at the albite contact. (
J) In G3, a denticulate contact between apatite and the Mg-rich fringe of a muscovite crystal (sample PAN-16-9). (
K) In the greisenised G4 granite, overgrowth on apatite of an APS (goyazite-florencite solid solution), with uraninite nano-inclusions (sample PNQ-19a). (
L) A large crystal of apatite in the greisenised G4 granite (sample PNQ-19a), with a patchy zoned core and a rim displaying a conspicuous OZ. Note the locally contorted boundary (arrow), similar to some apatite habit in greisenised granite G1b (Figure 14). The small zircon crystals (1–5 µm, up to 10–20 µm), included in muscovite or in quartz, are homogenous, or well zoned, with a Hf-rich core (up to 5.3 wt% Hf, Hf# 0.06) and a rim with a lower Hf content (3.2 wt% Hf, Hf# 0.04), but richer in U (up to 2.6 wt% U in the rim, versus 0.6 wt% U in the core).

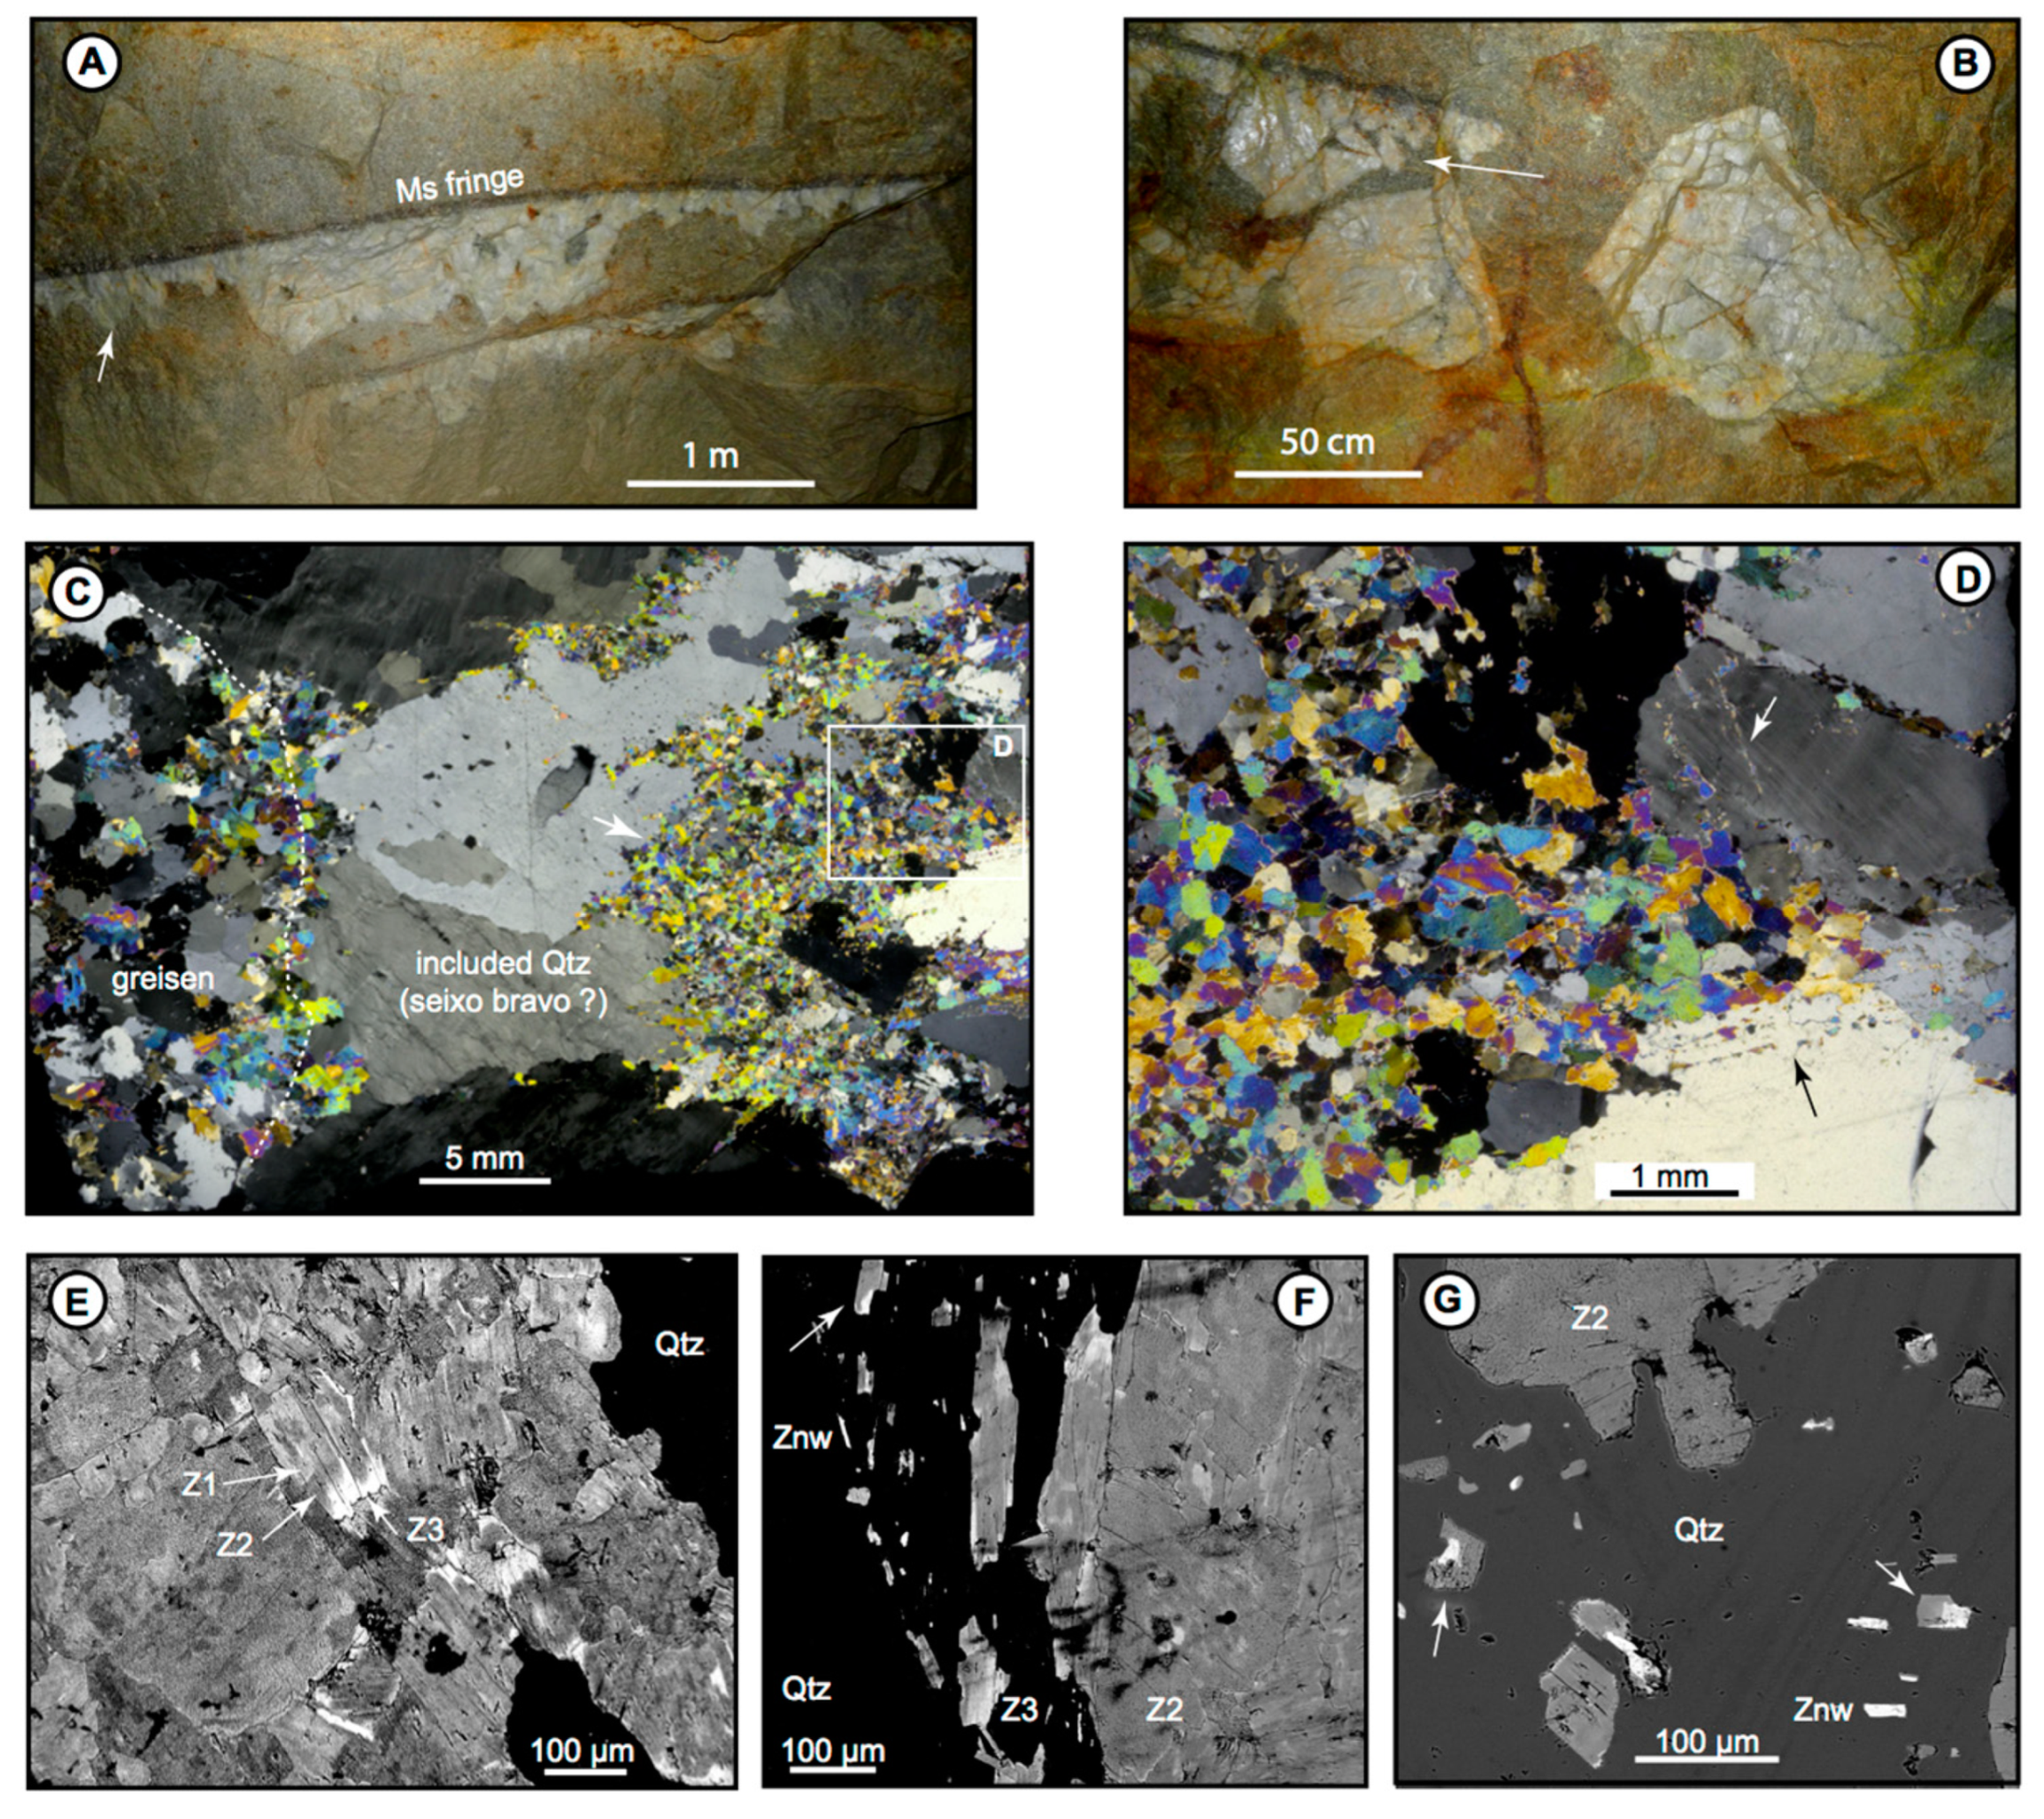
Figure 8.
Quartz vein enclaves in the greisenised G4 granite from the greisen cupola (L2 level). (A) Photograph of dilacerated quartz vein enclaves; note the muscovite fringe and the euhedral quartz growing in the “greisen” matrix (arrow) (underground work, L2). (B) Idem; note the infiltration of the magmatic matrix into the vein (arrow). (C) Photomicrograph of a detail of the “greisen” contact to the included quartz (cross-polarized light, sample PNQ-21a). Insert shows the location of (D). Note the plastic deformation in the included quartz (seixo bravo?); the superimposition of the “greisen” to quartz enclave boundary; and the development of muscovite (“episyenite”) within the included quartz. (D) Detail of (C). Note the trails of tiny muscovite flakes into the deformed quartz (arrows). (E) to (G) SEM-BSE images of the muscovite-quartz contact around the muscovite in (D). (E) Zoning in the muscovite: a succession of a clear core (Z1), a darker rim (Z2), making the bulk of the aggregate, and a sporadic bright fringe (Z3). (F) Start of a muscovite trail in the quartz. Note the presence of tiny zinnwaldite crystals (Znw), accompanying the small muscovite flakes, and that the latter is growing at the expense of Znw (arrow). (G) Halo of tiny Znw crystals (replaced by muscovite: arrows) around the main muscovite aggregate.

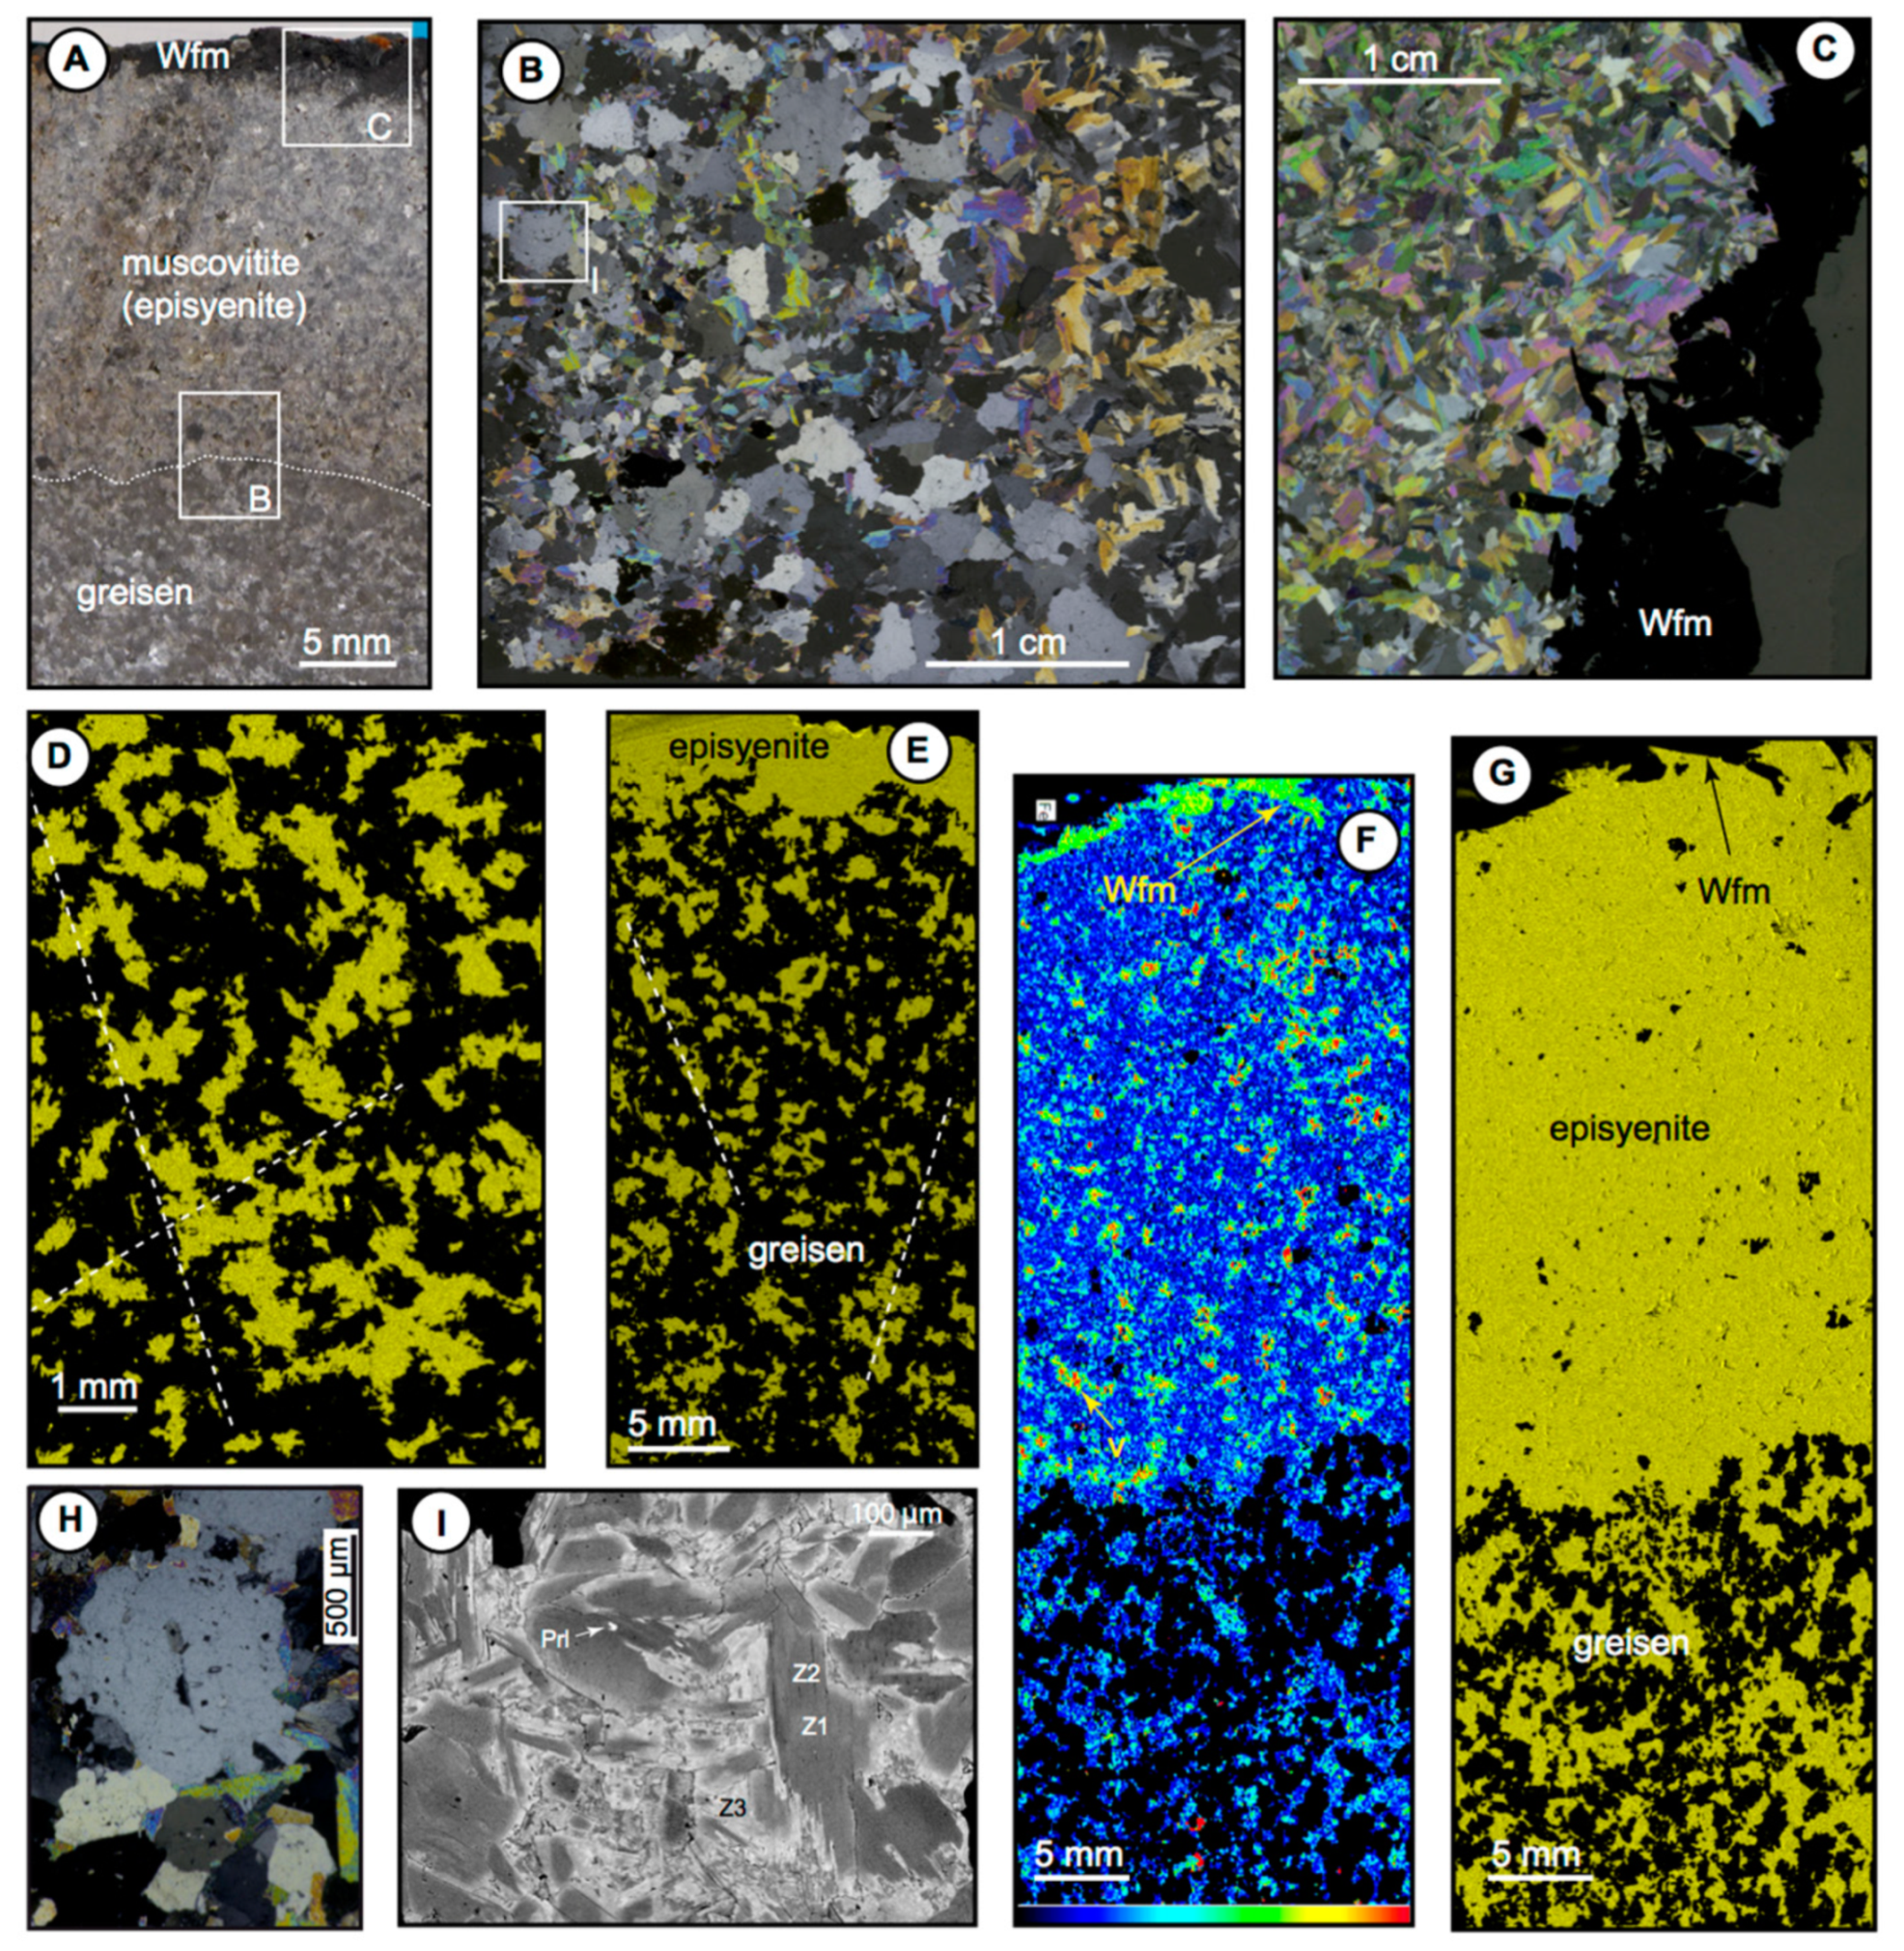
Figure 9.
Muscovite and muscovite (“episyenite”) in the greisen cupola, at the L0 (A–C, F–H, sample PAN-VI-17), and the L2 (D,E,I) levels. (A) Overview photograph of the sample, showing the joining of a muscovite-only rock on to a greisen. Note the wolframite (Wfm) fringe in the muscovite. (B) Overview photomicrograph of the greisen/muscovite contact (cross-polarized light). (C) Overview photomicrographs of the muscovite and the wolframite rim (cross-polarized light). (D) False-colored µXRF map (K∙K) of the greisen (sample PNQ-19), imaging the muscovite-quartz assemblage. Note the complicated, lace-shaped morphology of the muscovite flakes and the preferential elongation of the muscovite aggregates along with privileged directions (dotted lines). (E) False-colored µXRF map (K∙K) of a contact “greisen”-episyenite (sample PNQ-17a). Note the quite sharp “front of episyenitisation” and the apparent preferential orientations of the muscovite aggregates. (F–G) False-colored µXRF maps of the greisen/episyenite contact in sample PAN-VI-17 from the L0 level. Note the intimate association between muscovite and wolframite crystals (wolframite pseudo-vein), and the development of micro-vugs in the episyenite body. (F) Fe∙K map; whatever the location, “greisen” or episyenite, most of the muscovite displays the same iron content, i.e., there is no appearance of compositional zoning, although the Fe-rich fringes are more developed in the episyenite body. (G) K∙K map; note the quite sharp “front of episyenitisation”. (H) Photomicrograph of relic magmatic quartz in the L0 greisen (sample PAN-VI-17). Note the embryonic snowball texture. (I) SEM-BSE image of compositional and patchy zoning in a muscovite aggregate (“greisenisation”) from the G1a granite (sample PAN16-4a). The crystals display a three-zoned texture, with a grey core (Z1), a darker first rim (Z2), and a bright second rim (Z3). Note the Z3 rims and the protolithionite (Prl) relicts in one muscovite core.

Figure 10.
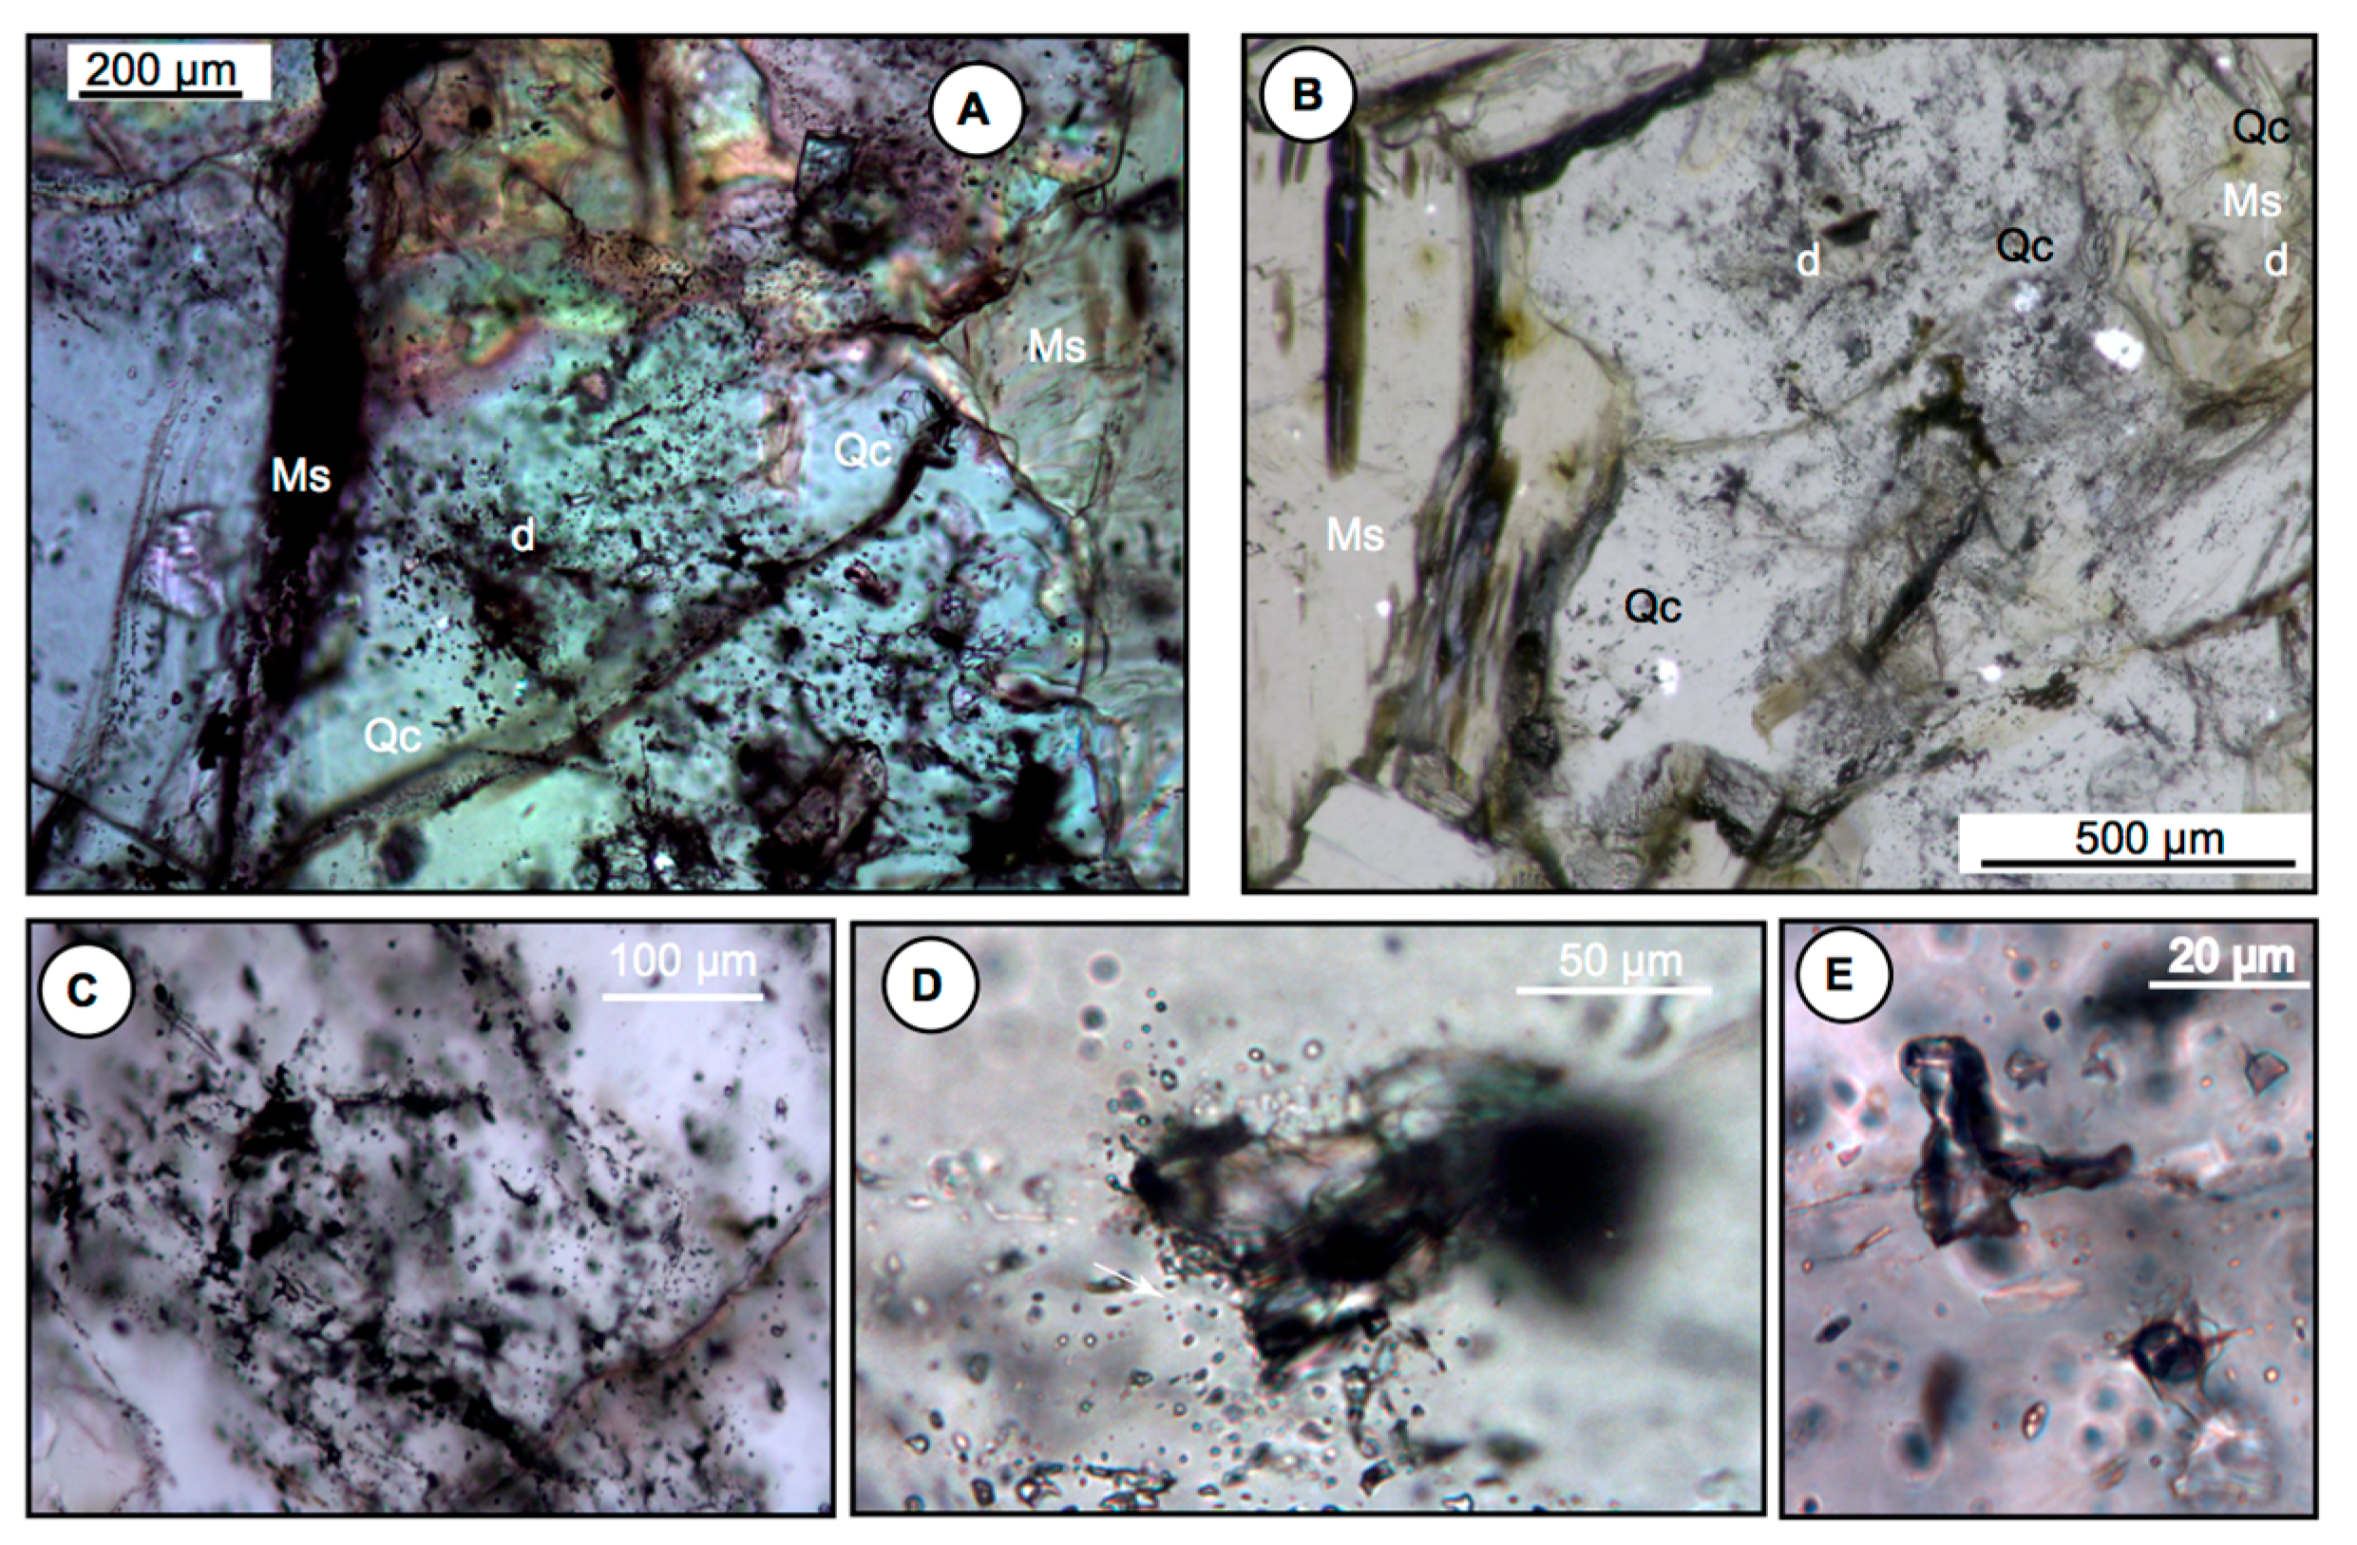
Photomicrographs of fluid inclusion (FI) evidence for an early silicification event in the greisenised G4 granite (level L1, sample PAN-XV-4, plane-polarized light). (A) Existence of a halo of clear quartz (Qc) around the package of decrepitated FIs (d). (B) Clear quartz halo (Qc) isolates the decrepitated FI packages (d) from the surrounding muscovite (Ms). (C) Detail of a set of decrepitated FI. (D) A large decrepitated FI with a halo of newly formed satellites (arrow). (E) Stretched FIs.
Figure 10.
Photomicrographs of fluid inclusion (FI) evidence for an early silicification event in the greisenised G4 granite (level L1, sample PAN-XV-4, plane-polarized light). (A) Existence of a halo of clear quartz (Qc) around the package of decrepitated FIs (d). (B) Clear quartz halo (Qc) isolates the decrepitated FI packages (d) from the surrounding muscovite (Ms). (C) Detail of a set of decrepitated FI. (D) A large decrepitated FI with a halo of newly formed satellites (arrow). (E) Stretched FIs.
Figure 11.
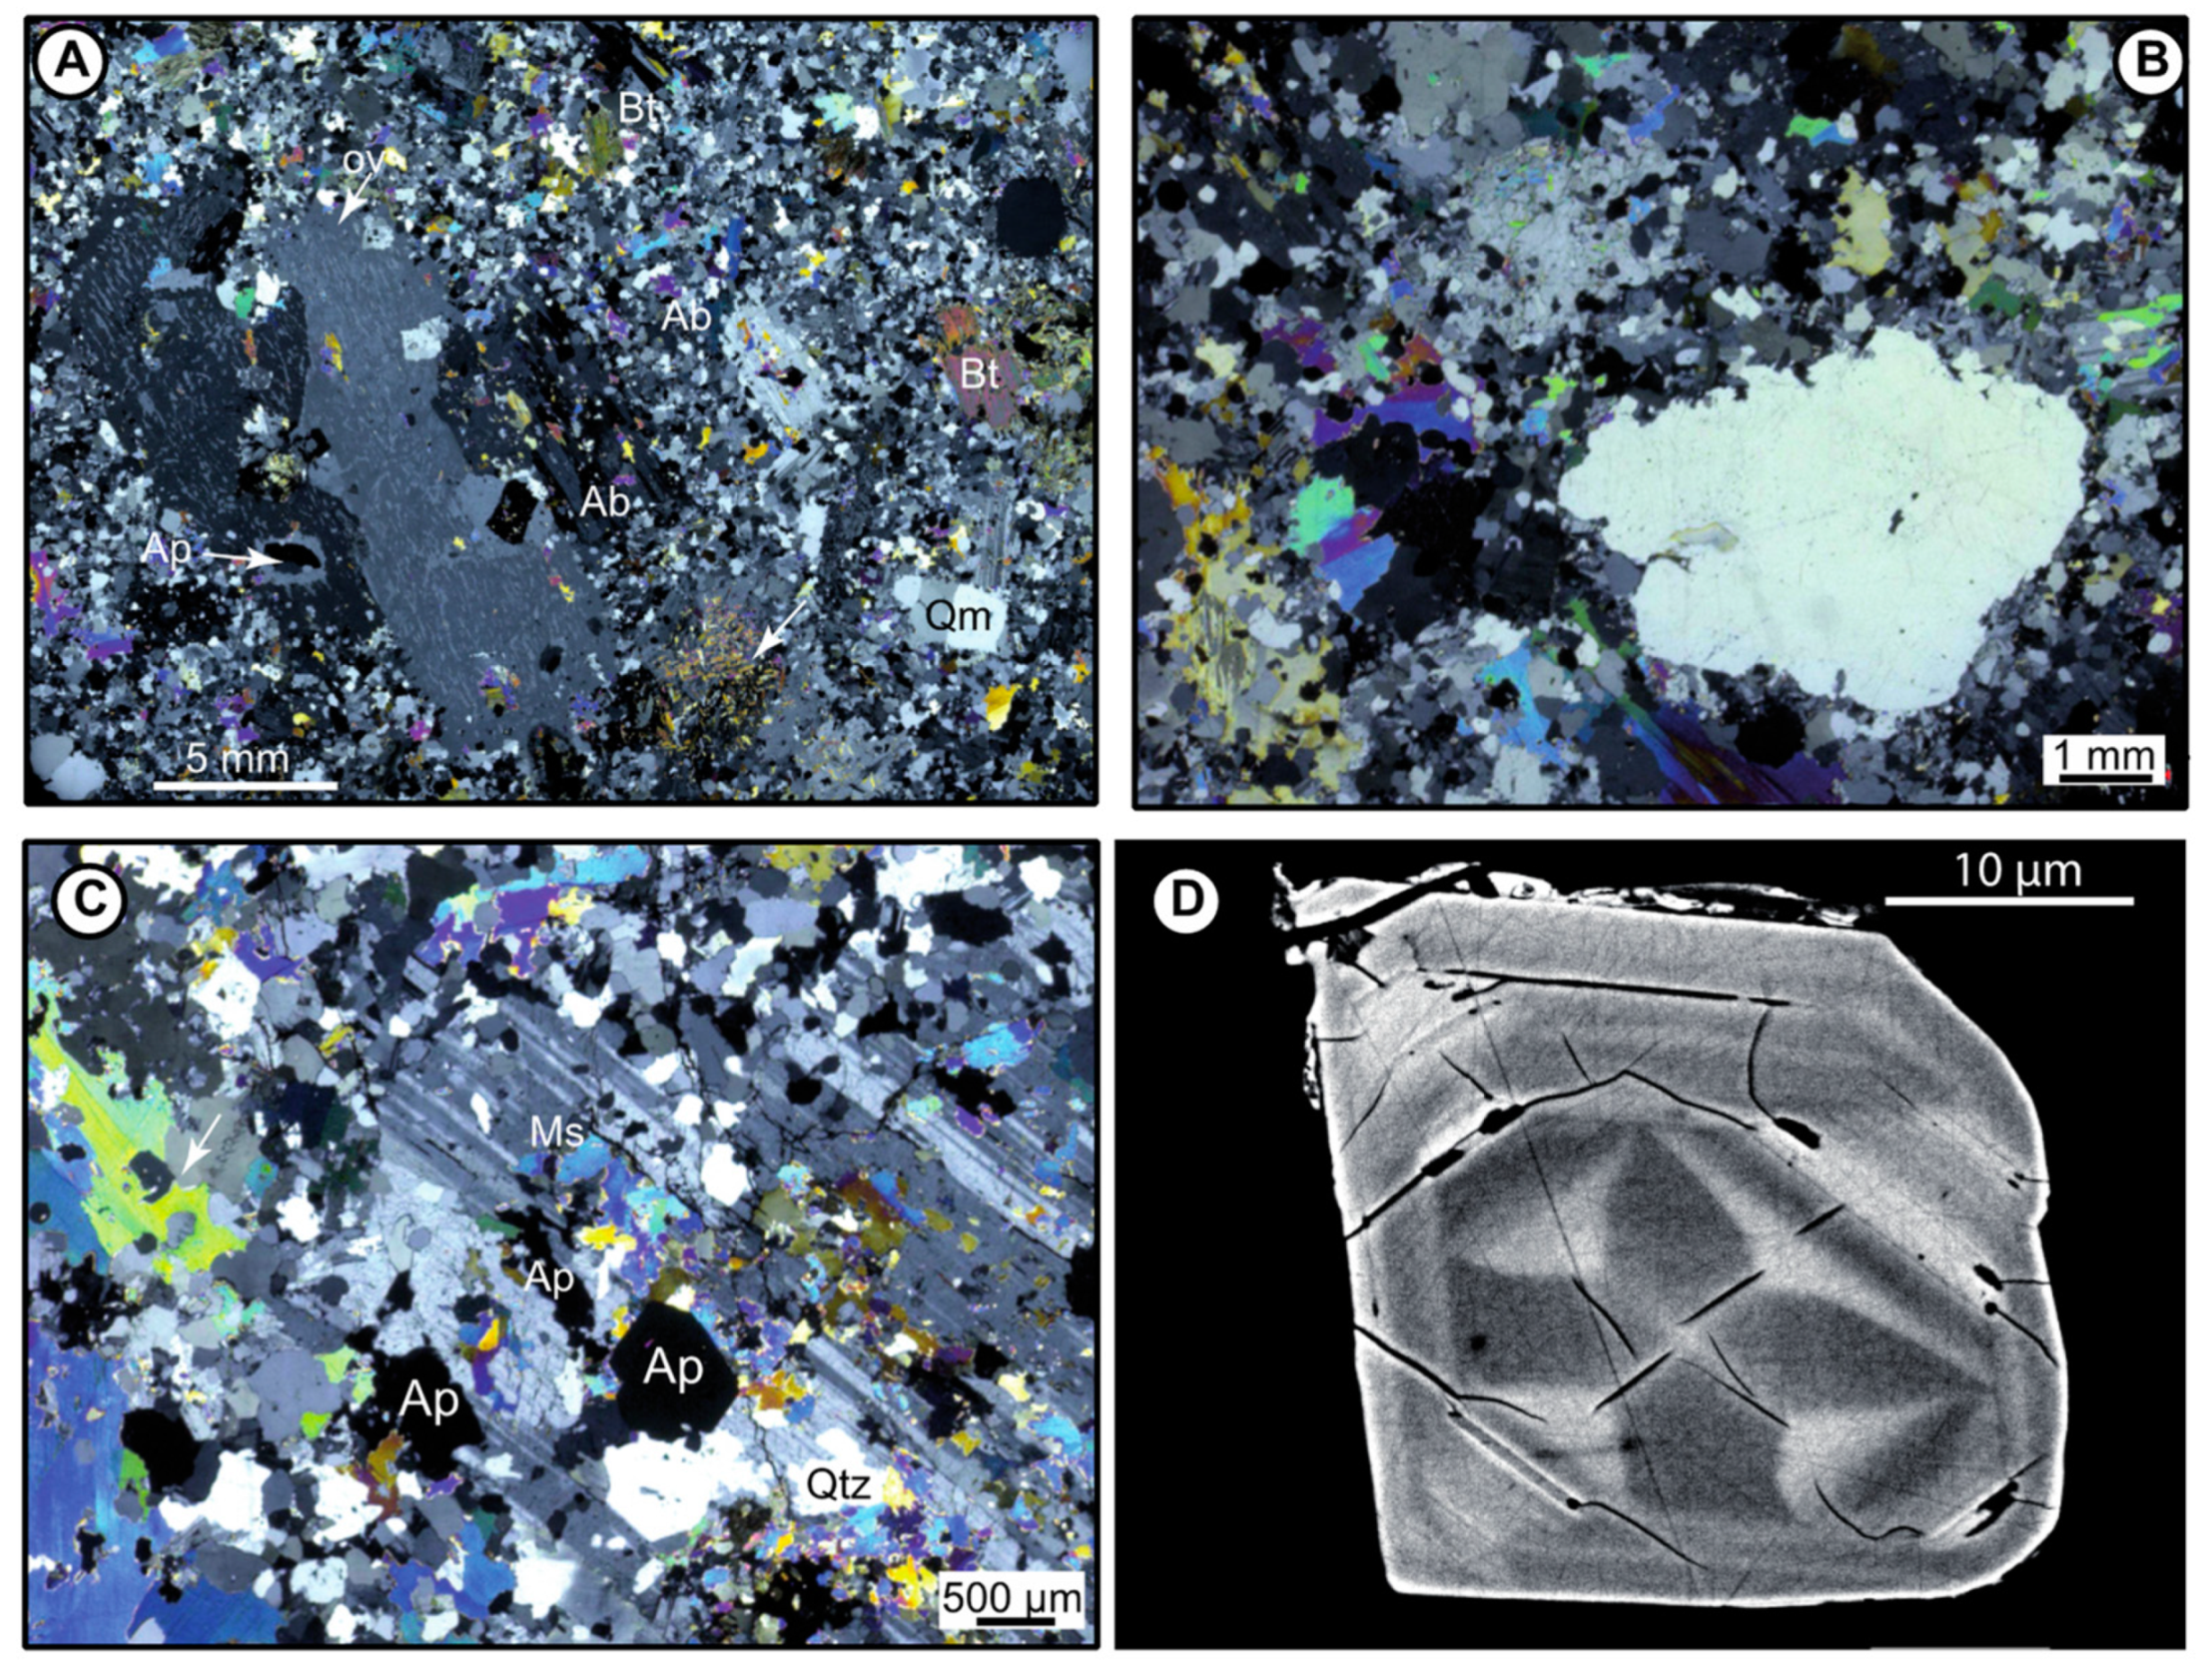
G1 granite unit from the SCB2 drill hole. (A) Photomicrograph global view of the two mica G1 texture (cross-polarized light, sample PAN-16-5a). Megacrysts (Kfs, Ab, Bt, quartz Qm) are embedded in a fine-grained matrix. Note the perthites in the Kfs and the broad albite rim around the apatite (Ap), included in the Kfs. A rim devoid of perthites (OV) is noticeable in the Kfs. Note also the muscovite canvas in some albite megacrysts (arrow). (B) Detail of magmatic quartz in G1, showing lace-shaped overgrowths (r) (microphotograph in cross-polarized light, sample PAN-16-6). Note the amoeboid shape of muscovite crystals. (C) Development of patchy quartz (Qtz), muscovite (Ms), and apatite (Ap) in a G1 albite megacryst. Note the independency between quartz and muscovite. The large muscovite flakes display amoeboid shapes (arrow) (microphotograph in cross-polarized light, sample PAN-16-6). (D) SEM-BSE image of zoned zircon included in G1 biotite. Note the spectacular sector zoning. Variations in Hf contents mainly control the compositional zoning pattern.
Figure 11.
G1 granite unit from the SCB2 drill hole. (A) Photomicrograph global view of the two mica G1 texture (cross-polarized light, sample PAN-16-5a). Megacrysts (Kfs, Ab, Bt, quartz Qm) are embedded in a fine-grained matrix. Note the perthites in the Kfs and the broad albite rim around the apatite (Ap), included in the Kfs. A rim devoid of perthites (OV) is noticeable in the Kfs. Note also the muscovite canvas in some albite megacrysts (arrow). (B) Detail of magmatic quartz in G1, showing lace-shaped overgrowths (r) (microphotograph in cross-polarized light, sample PAN-16-6). Note the amoeboid shape of muscovite crystals. (C) Development of patchy quartz (Qtz), muscovite (Ms), and apatite (Ap) in a G1 albite megacryst. Note the independency between quartz and muscovite. The large muscovite flakes display amoeboid shapes (arrow) (microphotograph in cross-polarized light, sample PAN-16-6). (D) SEM-BSE image of zoned zircon included in G1 biotite. Note the spectacular sector zoning. Variations in Hf contents mainly control the compositional zoning pattern.

Figure 12.
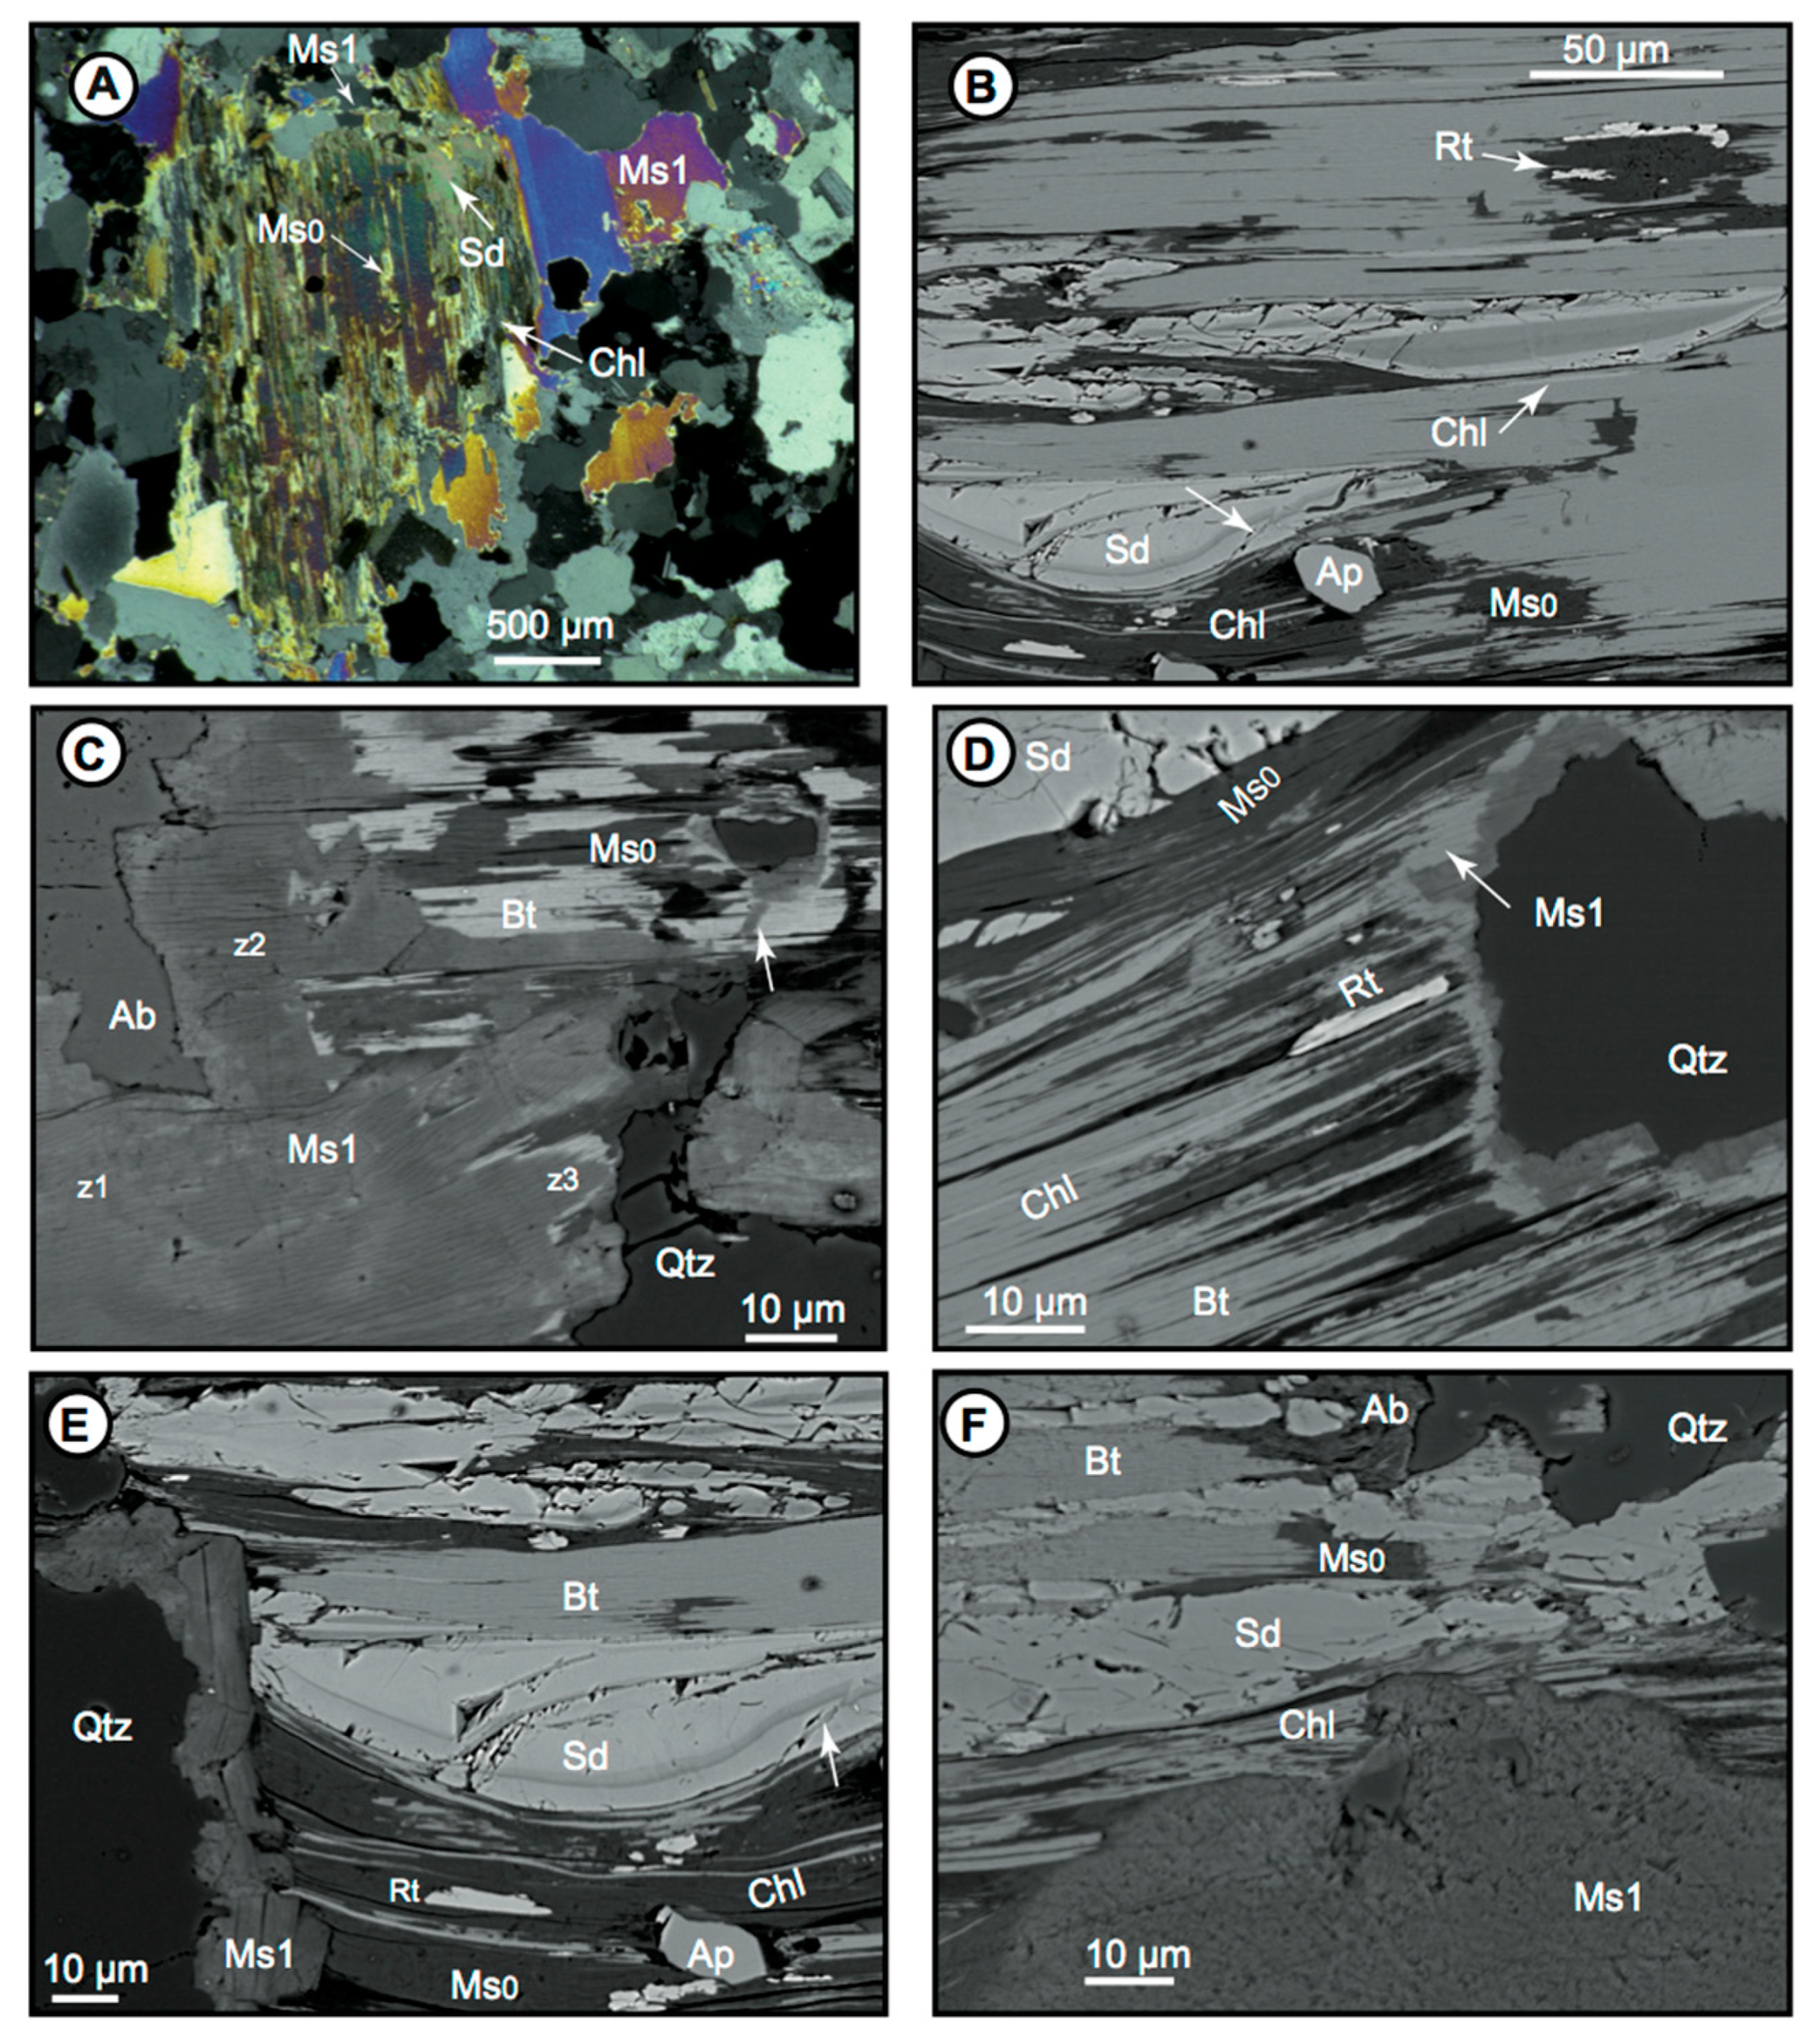
Alteration assemblages in G1 biotite (sample PAN-16-5). Ap apatite, Bt Biotite (protolithionite), Chl chlorite, Ms0-Ms1 muscovite, Rt rutile, Sd siderite. (
A) Microphotograph in cross-polarized light, (
B–
F) SEM-BSE images. (
A) Overview of altered biotite. Note the muscovite microcrack (Ms1) issued from a large Ms1 flake. (
B) Alteration assemblage. Patchy muscovite (Ms0) is the earlier phase, overprinted by siderite and chlorite. Siderite is overprinted by chlorite (arrow). Note the intimate association between rutile and muscovite Ms0. (
C) Relationships between a flake of muscovite (Ms1) and the altered biotite (Bt-Ms0 assemblage). Ms1 dilacerates the altered biotite; note in particular the Ms1 microcrack (arrow). Z1-3: zoning of the Ms1 (see
Figure 10). (
D) Overprinting of the Ms0-Chl assemblage by Ms1 developed at a quartz interface. (
E) Overprinting of the Ms0-Chl-Sd alteration assemblage by an Ms1 microcrack at a quartz-biotite interface. Chlorite overprints siderite (arrow). (
F) Obliteration of an Ms0-Chl alteration assemblage by an Ms1 flake.
Figure 12.
Alteration assemblages in G1 biotite (sample PAN-16-5). Ap apatite, Bt Biotite (protolithionite), Chl chlorite, Ms0-Ms1 muscovite, Rt rutile, Sd siderite. (
A) Microphotograph in cross-polarized light, (
B–
F) SEM-BSE images. (
A) Overview of altered biotite. Note the muscovite microcrack (Ms1) issued from a large Ms1 flake. (
B) Alteration assemblage. Patchy muscovite (Ms0) is the earlier phase, overprinted by siderite and chlorite. Siderite is overprinted by chlorite (arrow). Note the intimate association between rutile and muscovite Ms0. (
C) Relationships between a flake of muscovite (Ms1) and the altered biotite (Bt-Ms0 assemblage). Ms1 dilacerates the altered biotite; note in particular the Ms1 microcrack (arrow). Z1-3: zoning of the Ms1 (see
Figure 10). (
D) Overprinting of the Ms0-Chl assemblage by Ms1 developed at a quartz interface. (
E) Overprinting of the Ms0-Chl-Sd alteration assemblage by an Ms1 microcrack at a quartz-biotite interface. Chlorite overprints siderite (arrow). (
F) Obliteration of an Ms0-Chl alteration assemblage by an Ms1 flake.

Figure 13.
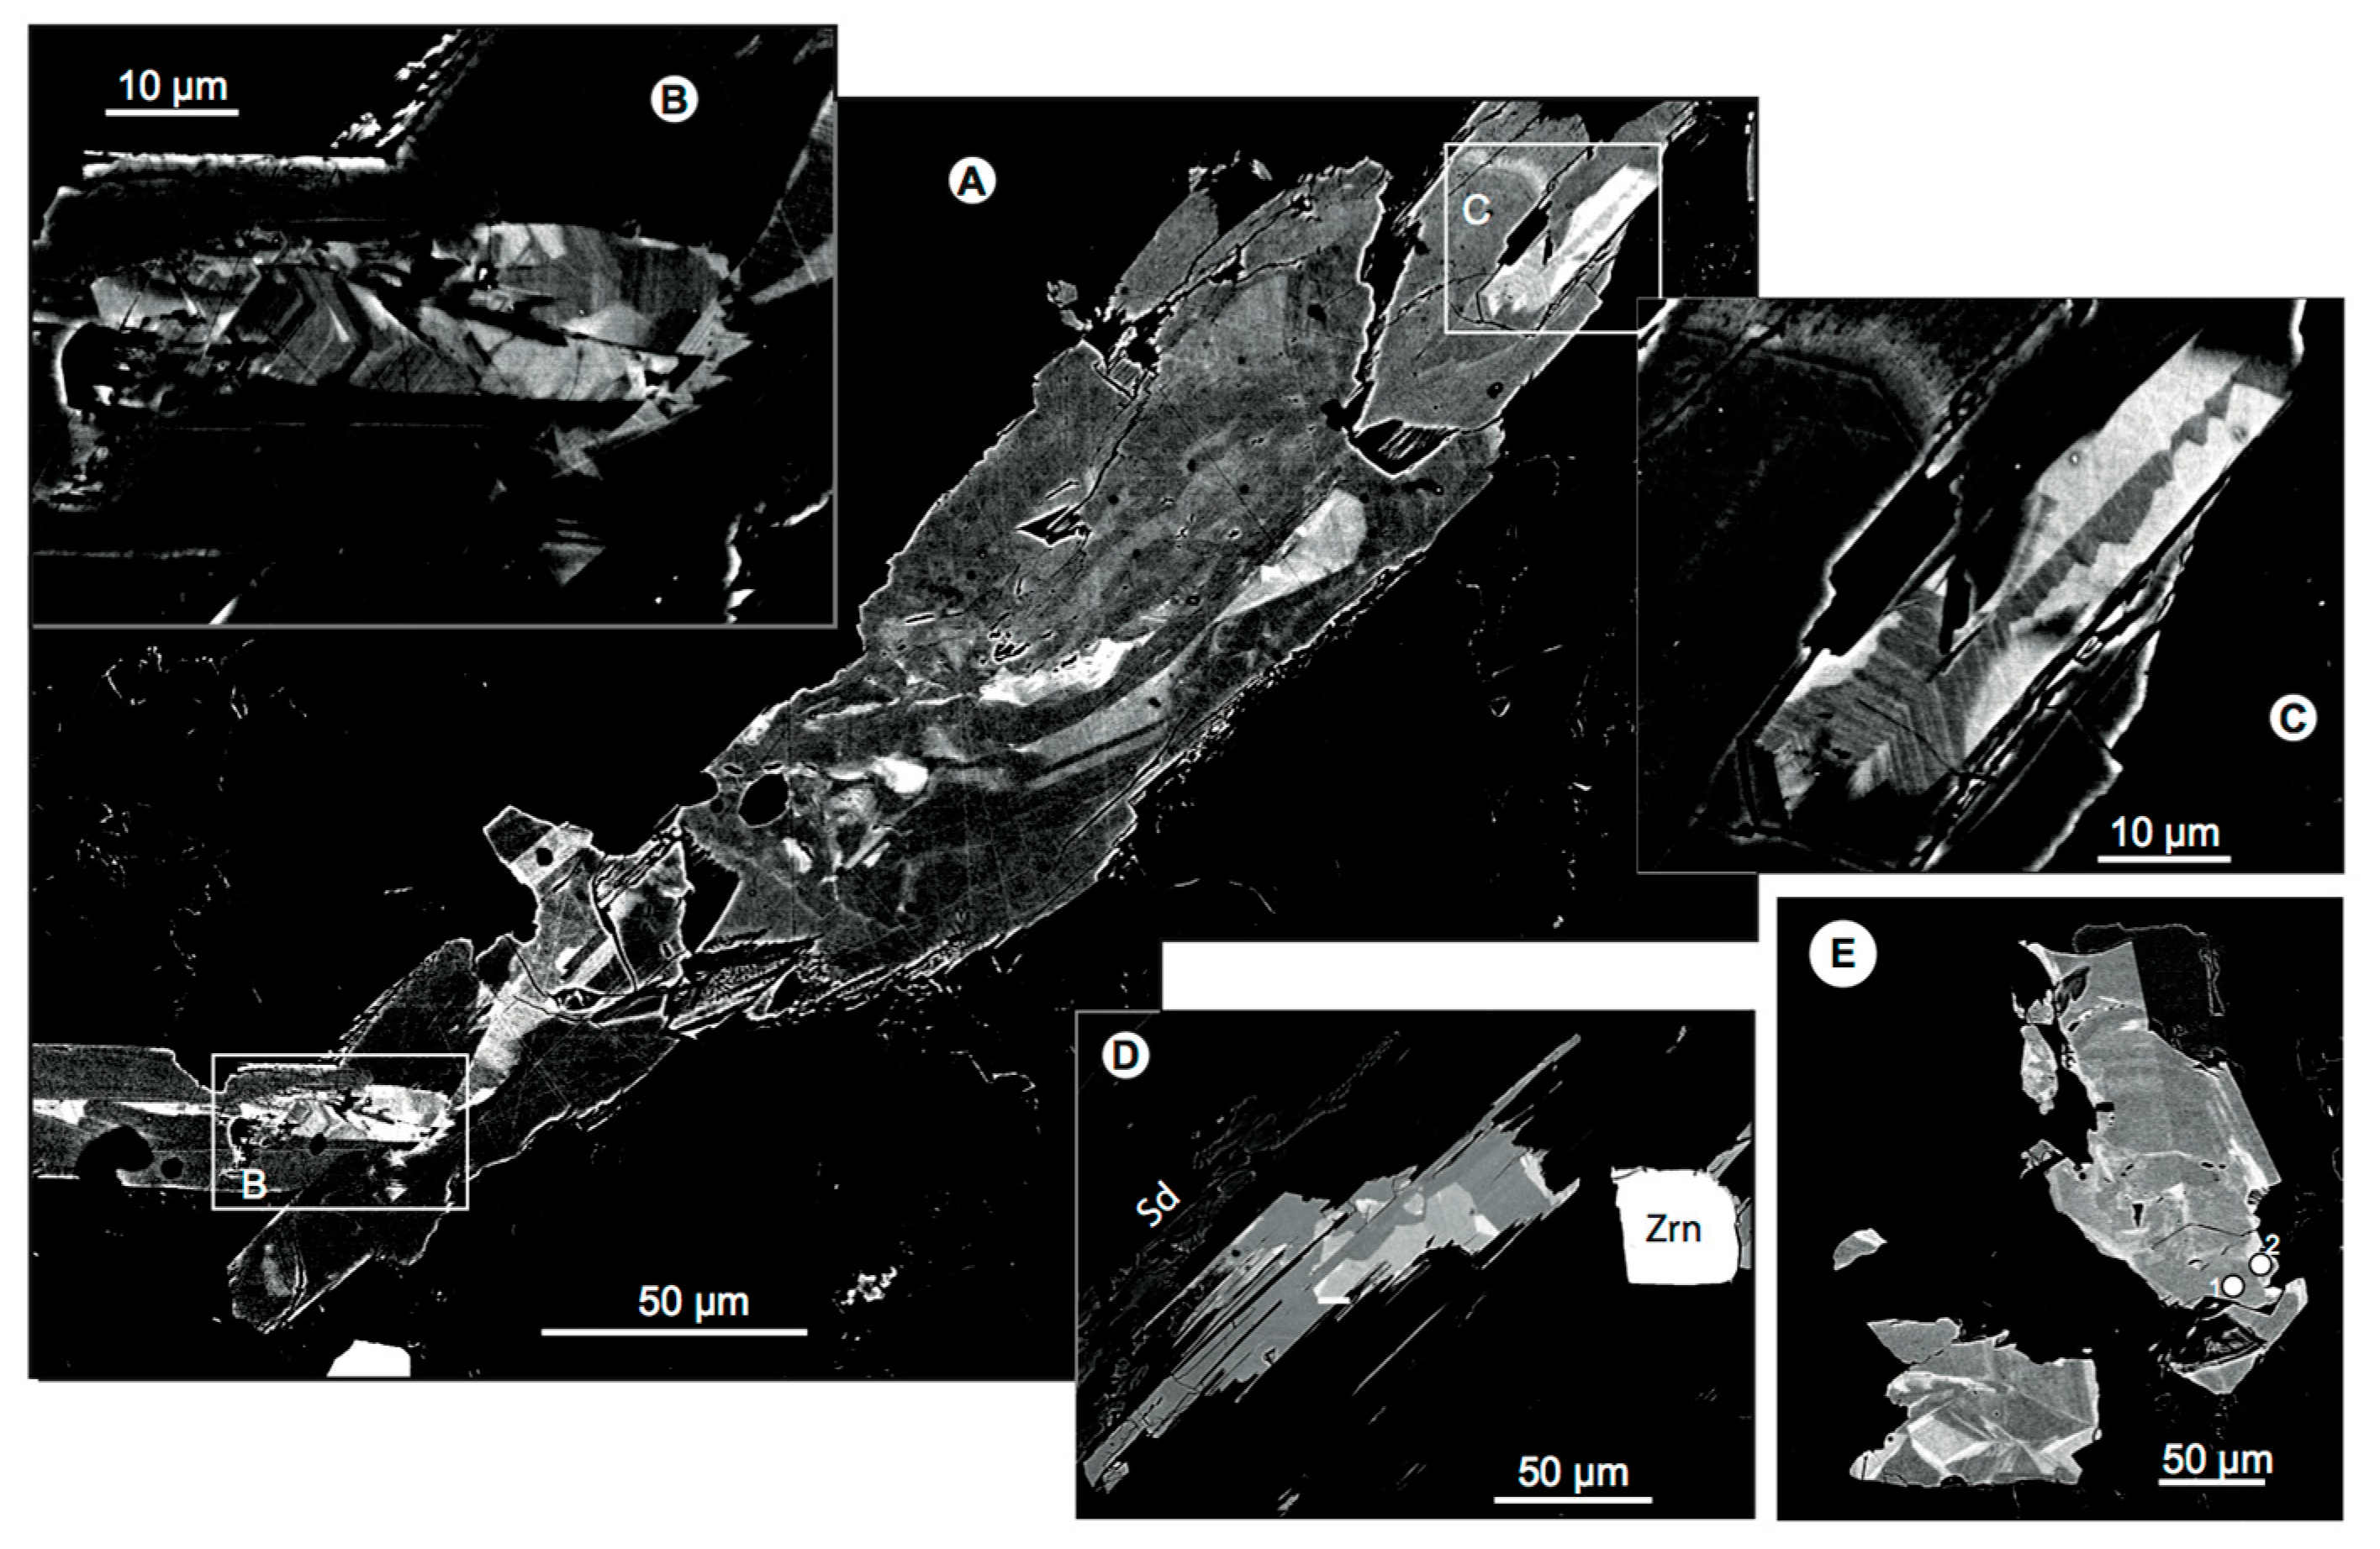
Sector zoning in the rutile form from the G1 suite, SEM-BSE images. Note the combination of oscillatory and sector zoning and that prismatic forms are characterized by low endowments in rare metals. (A–C) Large crystal from sample PAN-16-5b, showing small prisms incorporated in a larger prismatic crystal. (A) Overview. (B,C) details of the smaller prisms. (D) Another crystal from the same sample. (E) Rutile crystals from the G1a unit (sample PAN16-4). Note the similarity with the G1 rutile.
Figure 13.
Sector zoning in the rutile form from the G1 suite, SEM-BSE images. Note the combination of oscillatory and sector zoning and that prismatic forms are characterized by low endowments in rare metals. (A–C) Large crystal from sample PAN-16-5b, showing small prisms incorporated in a larger prismatic crystal. (A) Overview. (B,C) details of the smaller prisms. (D) Another crystal from the same sample. (E) Rutile crystals from the G1a unit (sample PAN16-4). Note the similarity with the G1 rutile.
Figure 14.
Apatite in granites of the G1 suite in the SCB2 drill-hole (SEM-BSE images). (
A–C) Largely zoned apatite embedded in an albite aureole within a perthitic Kfs from the G1a granite (sample PAN-16-5b, see
Figure 10). (
A) Overview of the crystal, showing a core with inclusions of uraninite, monazite, and Al–Fe–Mn phosphate (arrows), which is corroded/surrounded by a rim with oscillatory zoning (OZ). (
B) Overgrowth of an alumina-phosphate-sulfate (APS) assemblage; a: fibrous solid solution goyazite-florencite, b: metal-poor sector of a sector zoned crystal, formed by goyazite, c: metal-rich sector, formed by a solid solution goyazite-florencite (OZ is due to variations in Sr and LREE contents). (
C) Overgrowth of zoned siderite, marked by Mg variations. (
D) A patchy zoned crystal within an alteration assemblage at the expense of a protolithionite (granite G1a, sample PAN-16-5b). (
E) Chain of small patchy zoned crystals embedded in an albite crystal included in Kfs (granite G1a, sample PAN-16-6). (
F) A complexly zoned crystal with an APS overgrowth (
G) (granite G1b, sample PAN-16-4a). (
G) Detail of (
F), showing the APS overgrowth on the apatite; a and c: solid solution goyazite-florencite, b: goyazite; note the numerous uraninite micro-inclusions in a. (
H) Patchy zoned crystal included in muscovite (granite G1c, sample PAN-16-3a). (
I) Small zoned crystal (OZ) in the G1c unit (sample PAN-16-4b). (
J) Large zoned crystal in the G1c unit (sample PAN-16-3b); a patchy core is dotted by micro-inclusions of monazite (Mnz) and hagendorfite (Hgd), with Hgd concentrated in a central domain (dashed line separation). (
K) Large zoned crystal, included in an albite phenocryst invaded by quartz and muscovite (granite G1c, sample PAN-16-3b); a patchy core is surrounded by a zoned rim (OZ). Overgrowth of monazite (Mnz) and APS in the rim, and the core free of inclusions; a: solid solution goyazite-florencite; b: APS succession and uraninite inclusions as in (
G).

Figure 15.
“Greisenisation” in the granites from the SCP2 drill-hole (microphotographs cross-polarized light, sample PAN16-4b). (A) Partially “greisenised” G1a granite. A strip of a quartz-muscovite assemblage (II) is superimposed on the equigranular albite granite (I). Note the abundance of muscovite in the granite. (B) Replacement of a G1a albite megacryst by amoeboid muscovite (sample PAN16-4b). (C) Overview of the fully greisenised G1b granite (sample PAN16-3a). Note the preservation of magmatic quartz (Qm). (D) Detail of the greisen, showing the relic lace-shaped albite within the quartz (arrow) (sample PAN16-3a).
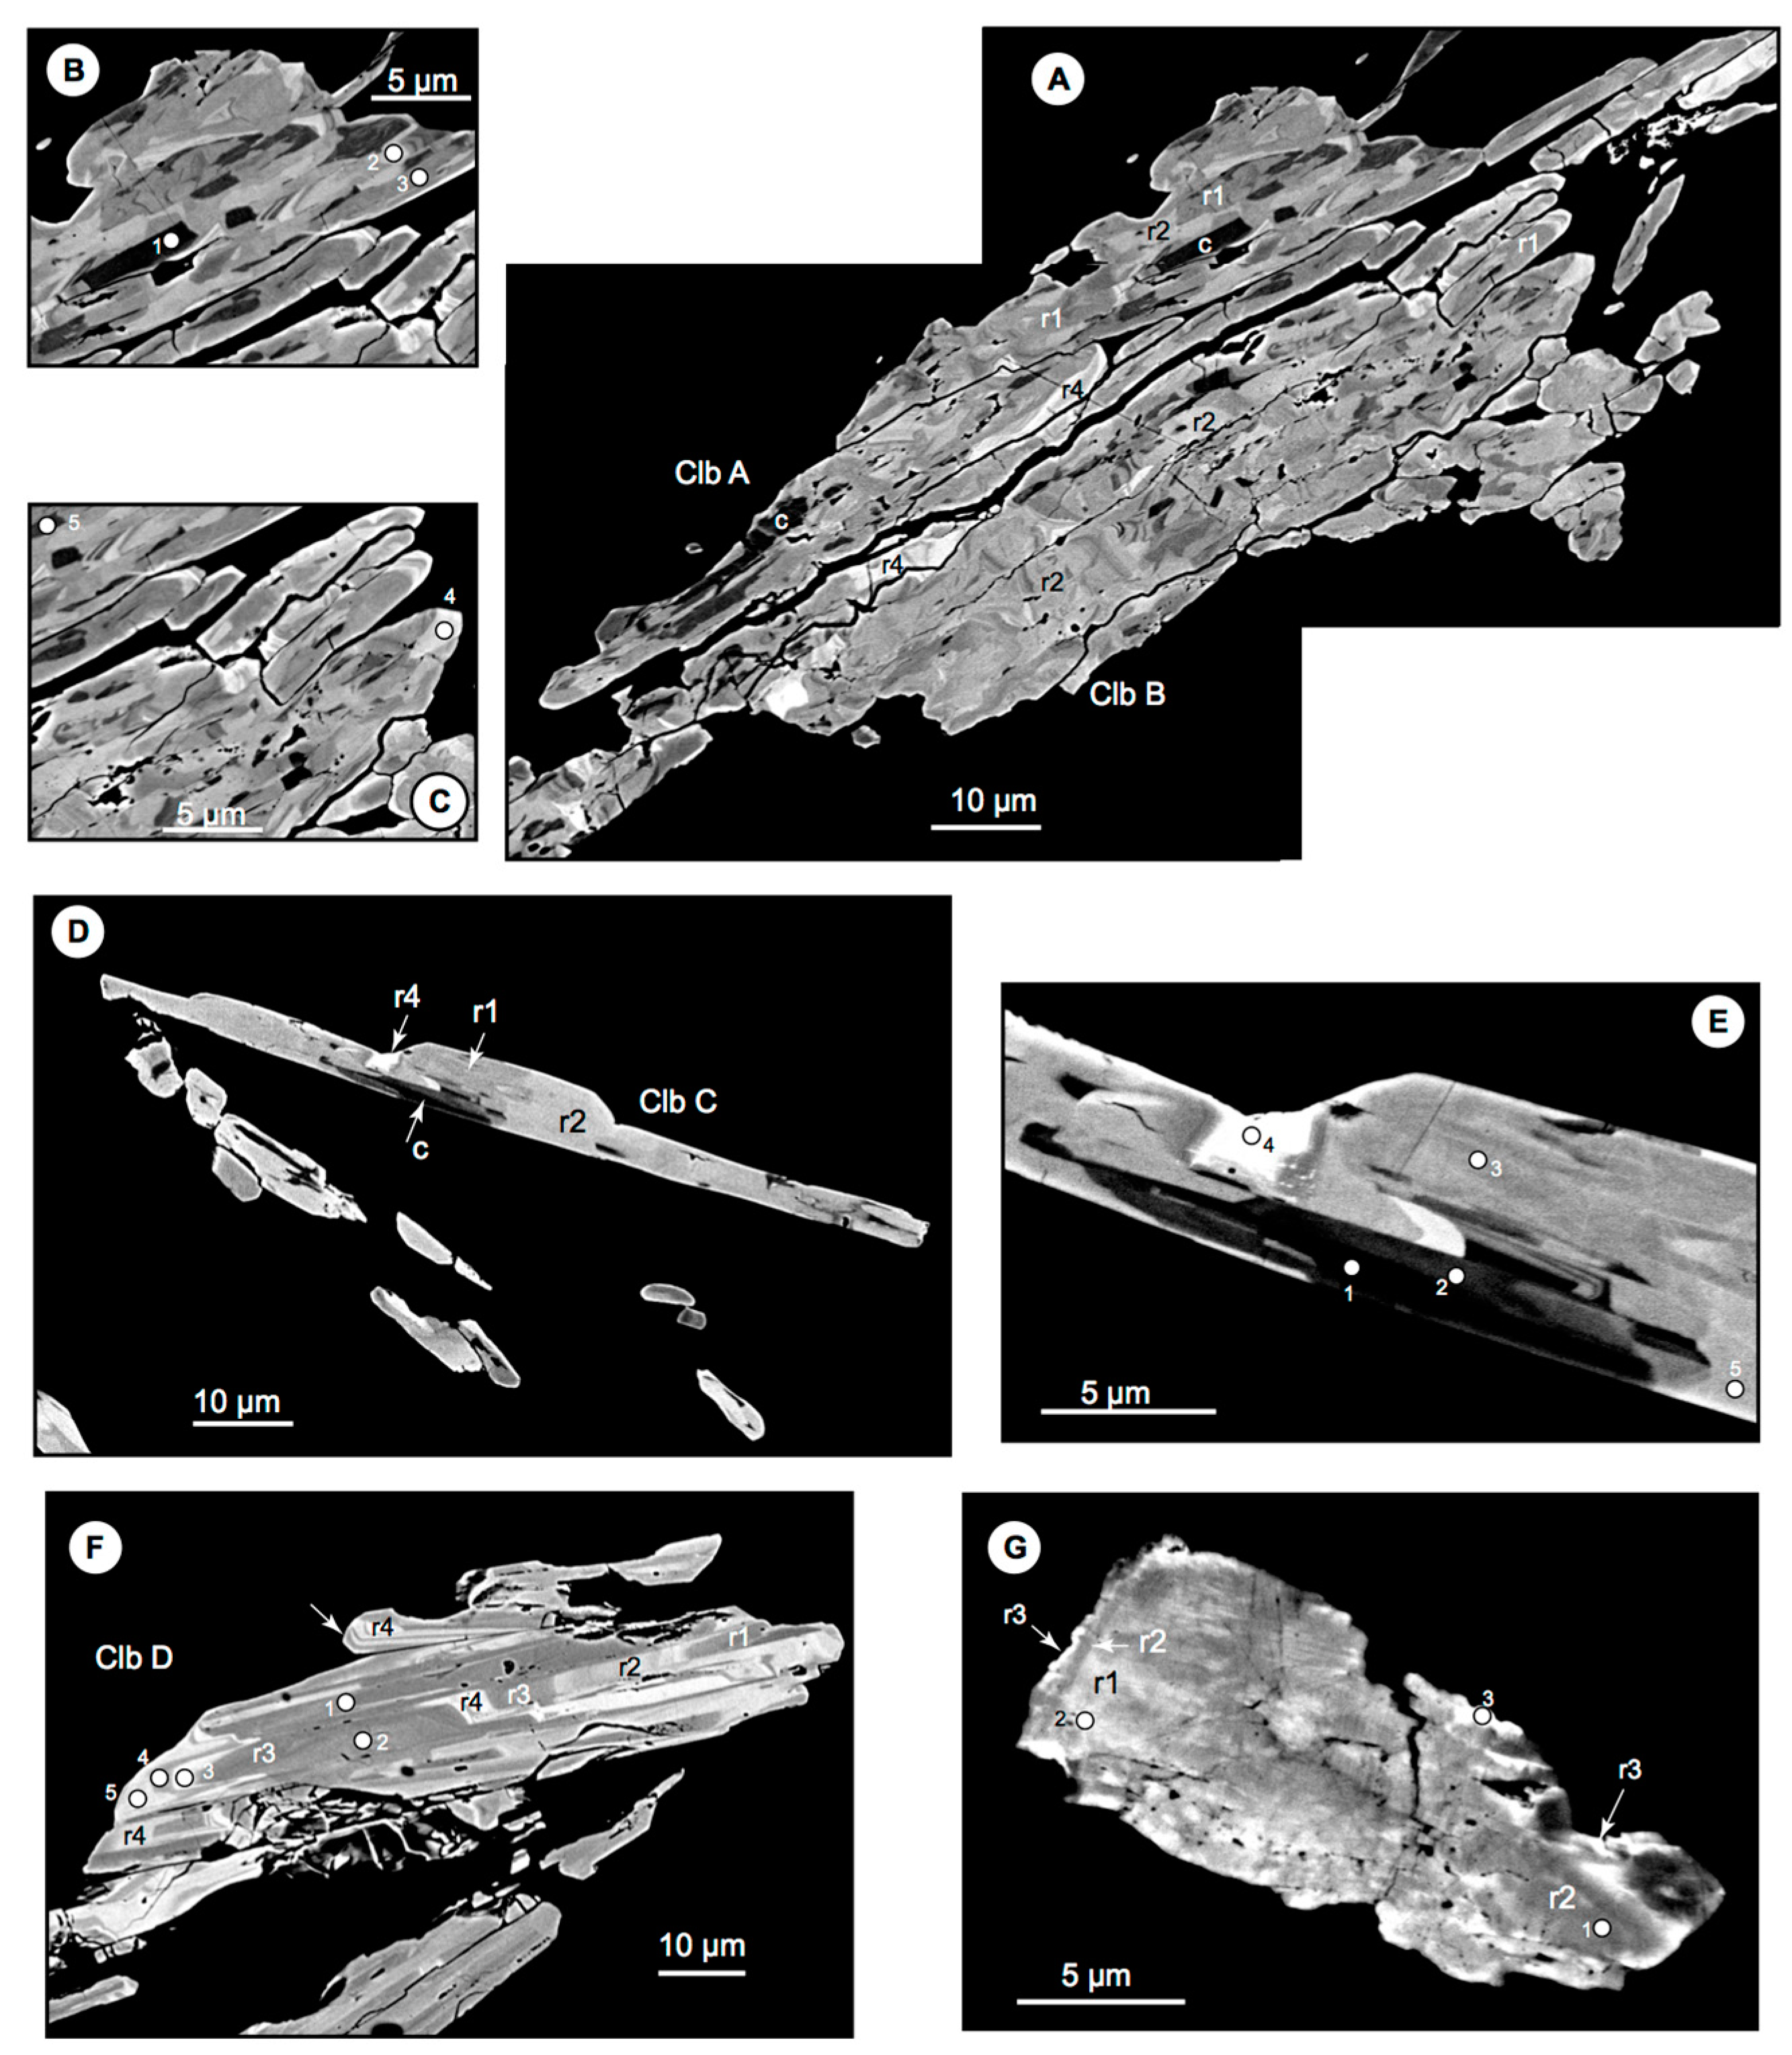
Figure 16.
SEM-BSE images of the columbite-tantalite (Clb) from the G2 and G3 granite units: c core, r1 to r4 rims (see text). (
A–
F) G2 unit (sample PAN-16-8). (
A) Two adjoined prisms: Clb A with numerous prismatic dark core sections and the almost full replacement of r1 by r2; by contrast, Clb B is devoid of dark cores, but with the aggregation of r2-r3 sub-units. (
B,
C) details of (
A), showing the position of analyzed spots (
Table S3). (
D) Acicular Clb prism, displaying replacement of r1 by r2. Note the absence of r3. (
E) Detail of (
D), showing the emplacement of analyzed spots. (
F) Blocky Clb prism with spectacular OZ in r2 and r4 and up to three alternating clear/dark zones in r4 (arrow). The r1 to r4 succession is seen in one of the aggregated prisms. The location of the analyzed spots is indicated. (
G) Columbite-tantalite from the aplite unit (sample PAN-16-9); r1 to r3 is the proposed succession order. The location of the analyzed spots is shown.
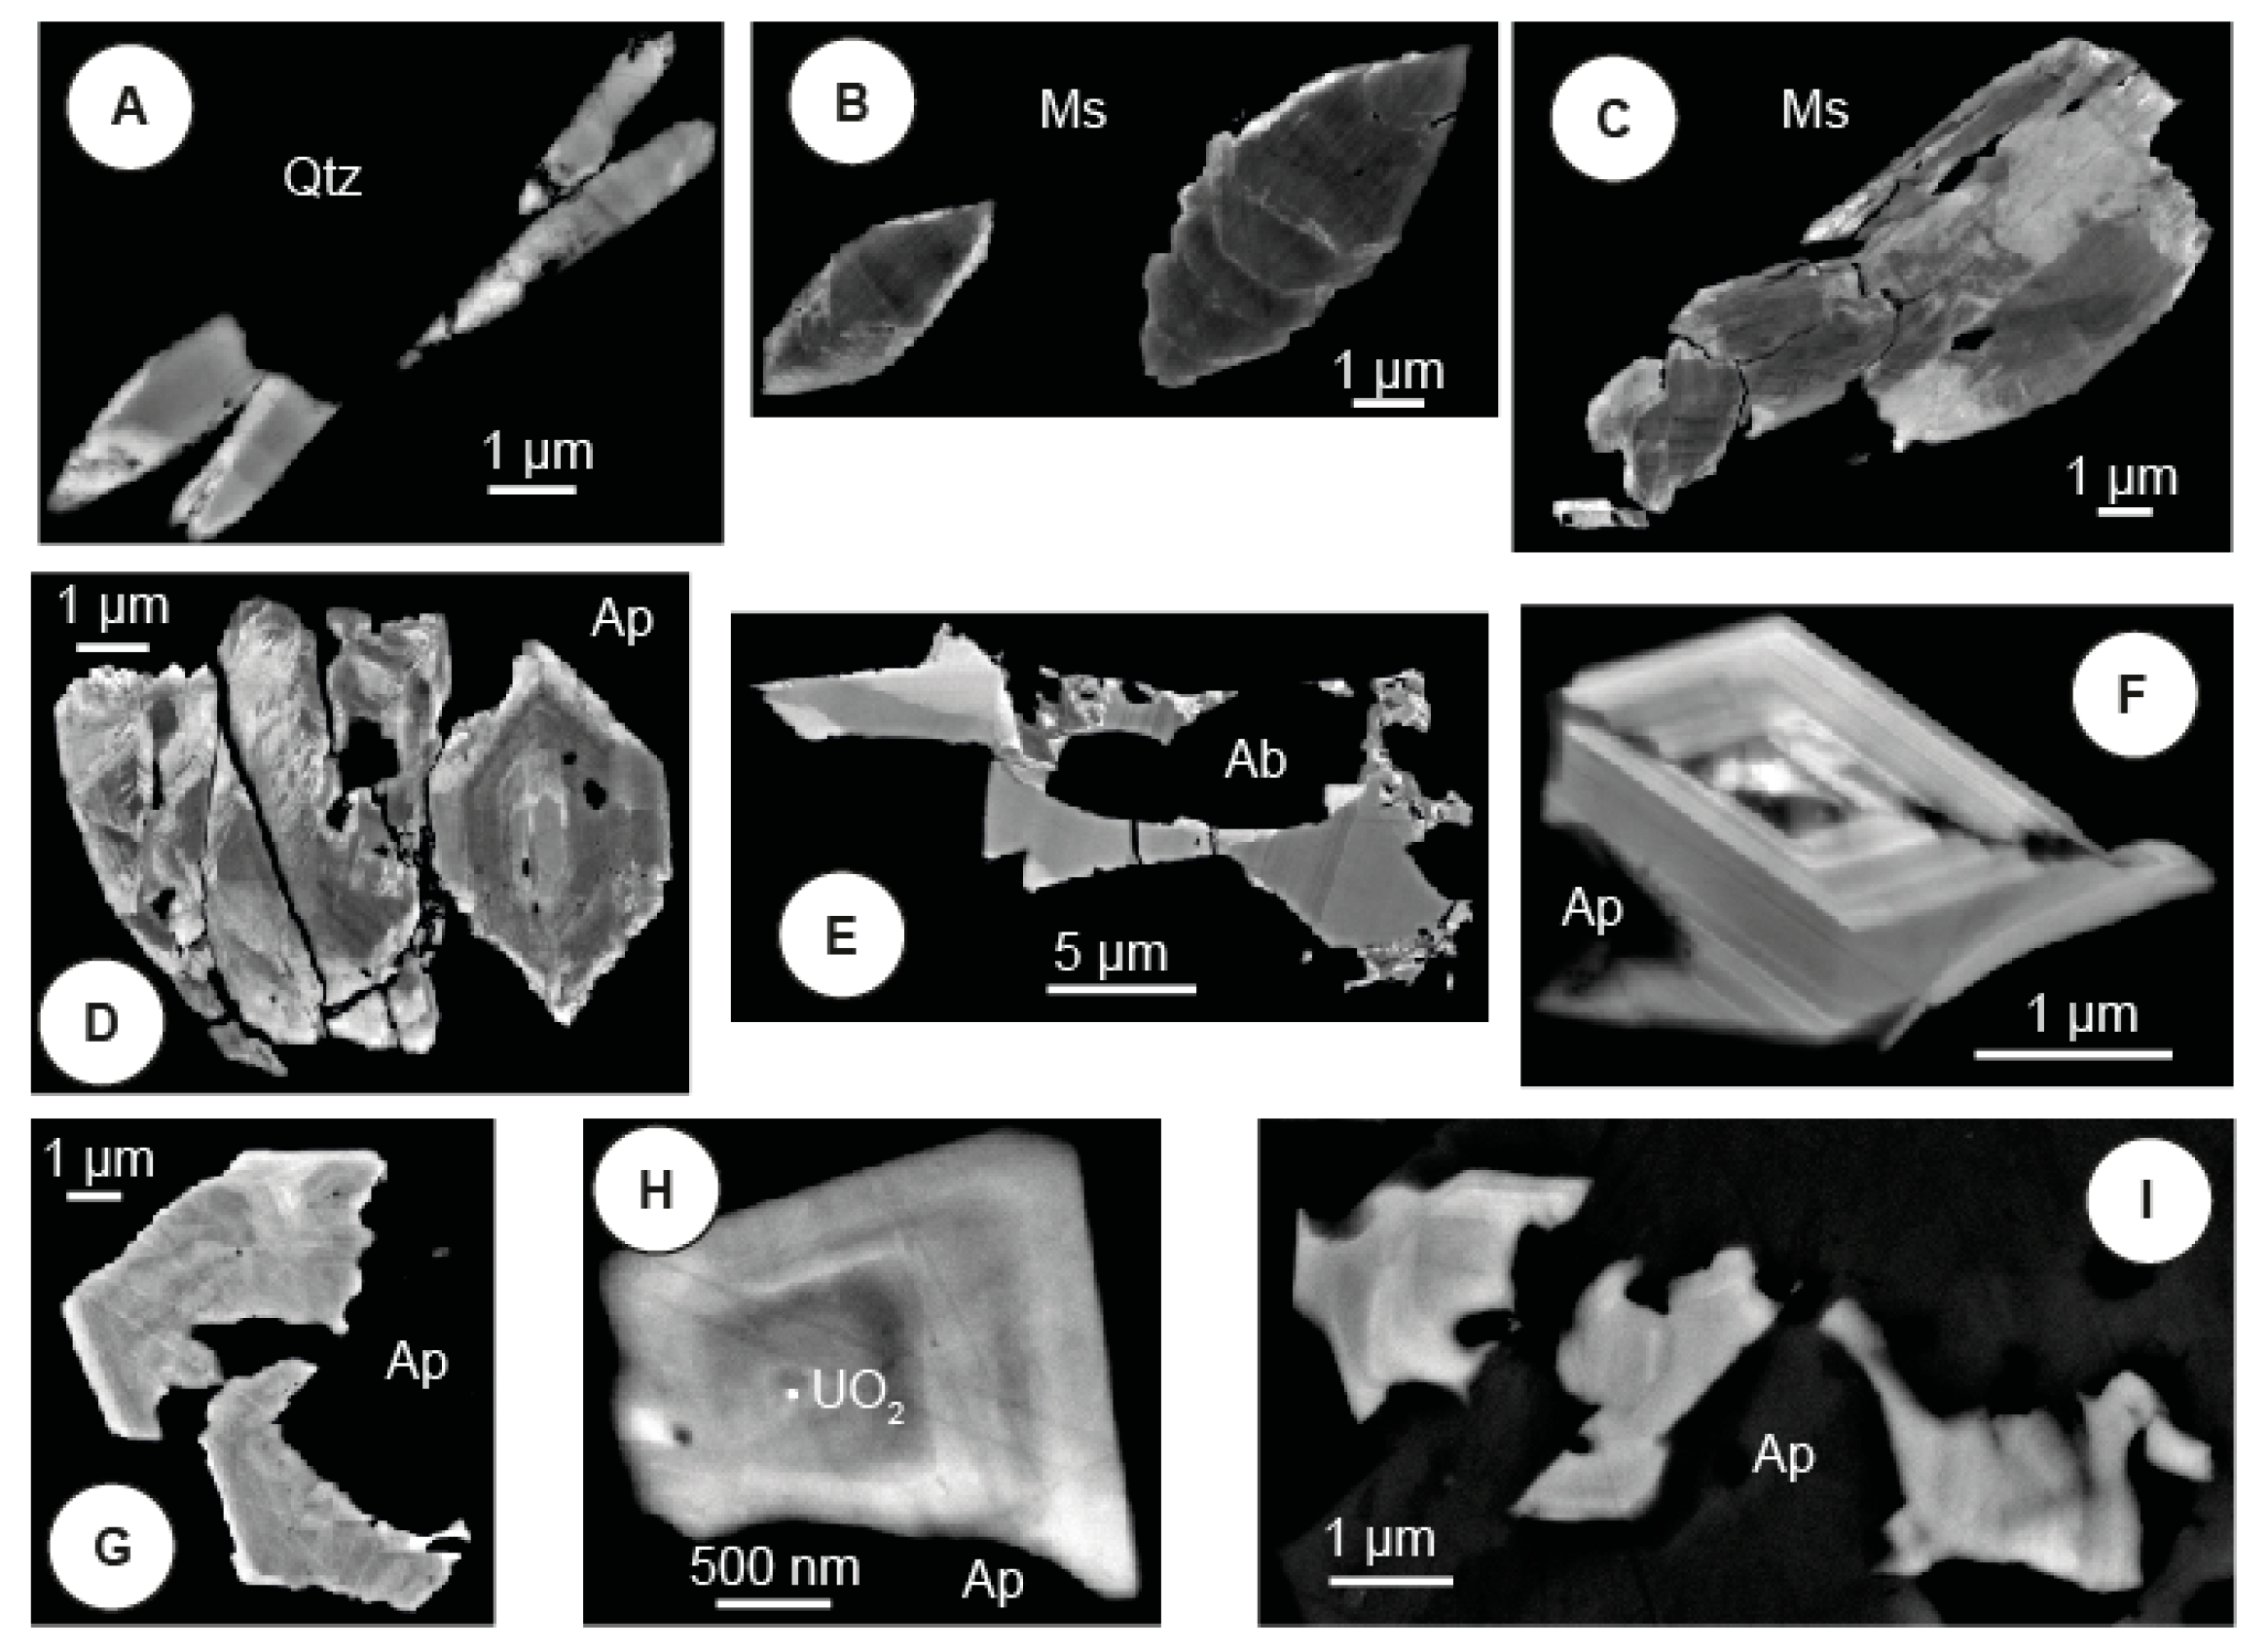
Figure 17.
Nb–Ta–W oxides in the G3 micro-leucogranite (sample PAN-16-9) (SEM-BSE images). (A–E) Columbite-tantalite/wolframo-ixiolite. (A) Small acicular prisms hosted in quartz (Qtz). Note the OZ and the bright W-rich ixiolite overgrowths. (B) Small blocky crystals hosted in muscovite (Ms). Note the conspicuous OZ. (C) Blocky prisms in muscovite. Note the importance of the W-rich ixiolite overgrowths. (D) Oscillatory zoned crystals hosted in apatite. Note the bright W-rich ixiolite overgrowth and ingress into the OZ crystals. (E) The crystal is interstitial in a magmatic albite aggregate. (F–I) Nb-rich rutile. Note the bright Ta-rich overgrowth in (G) and the nano-inclusion of uraninite in the core of the oscillatory zoned crystal in (H).
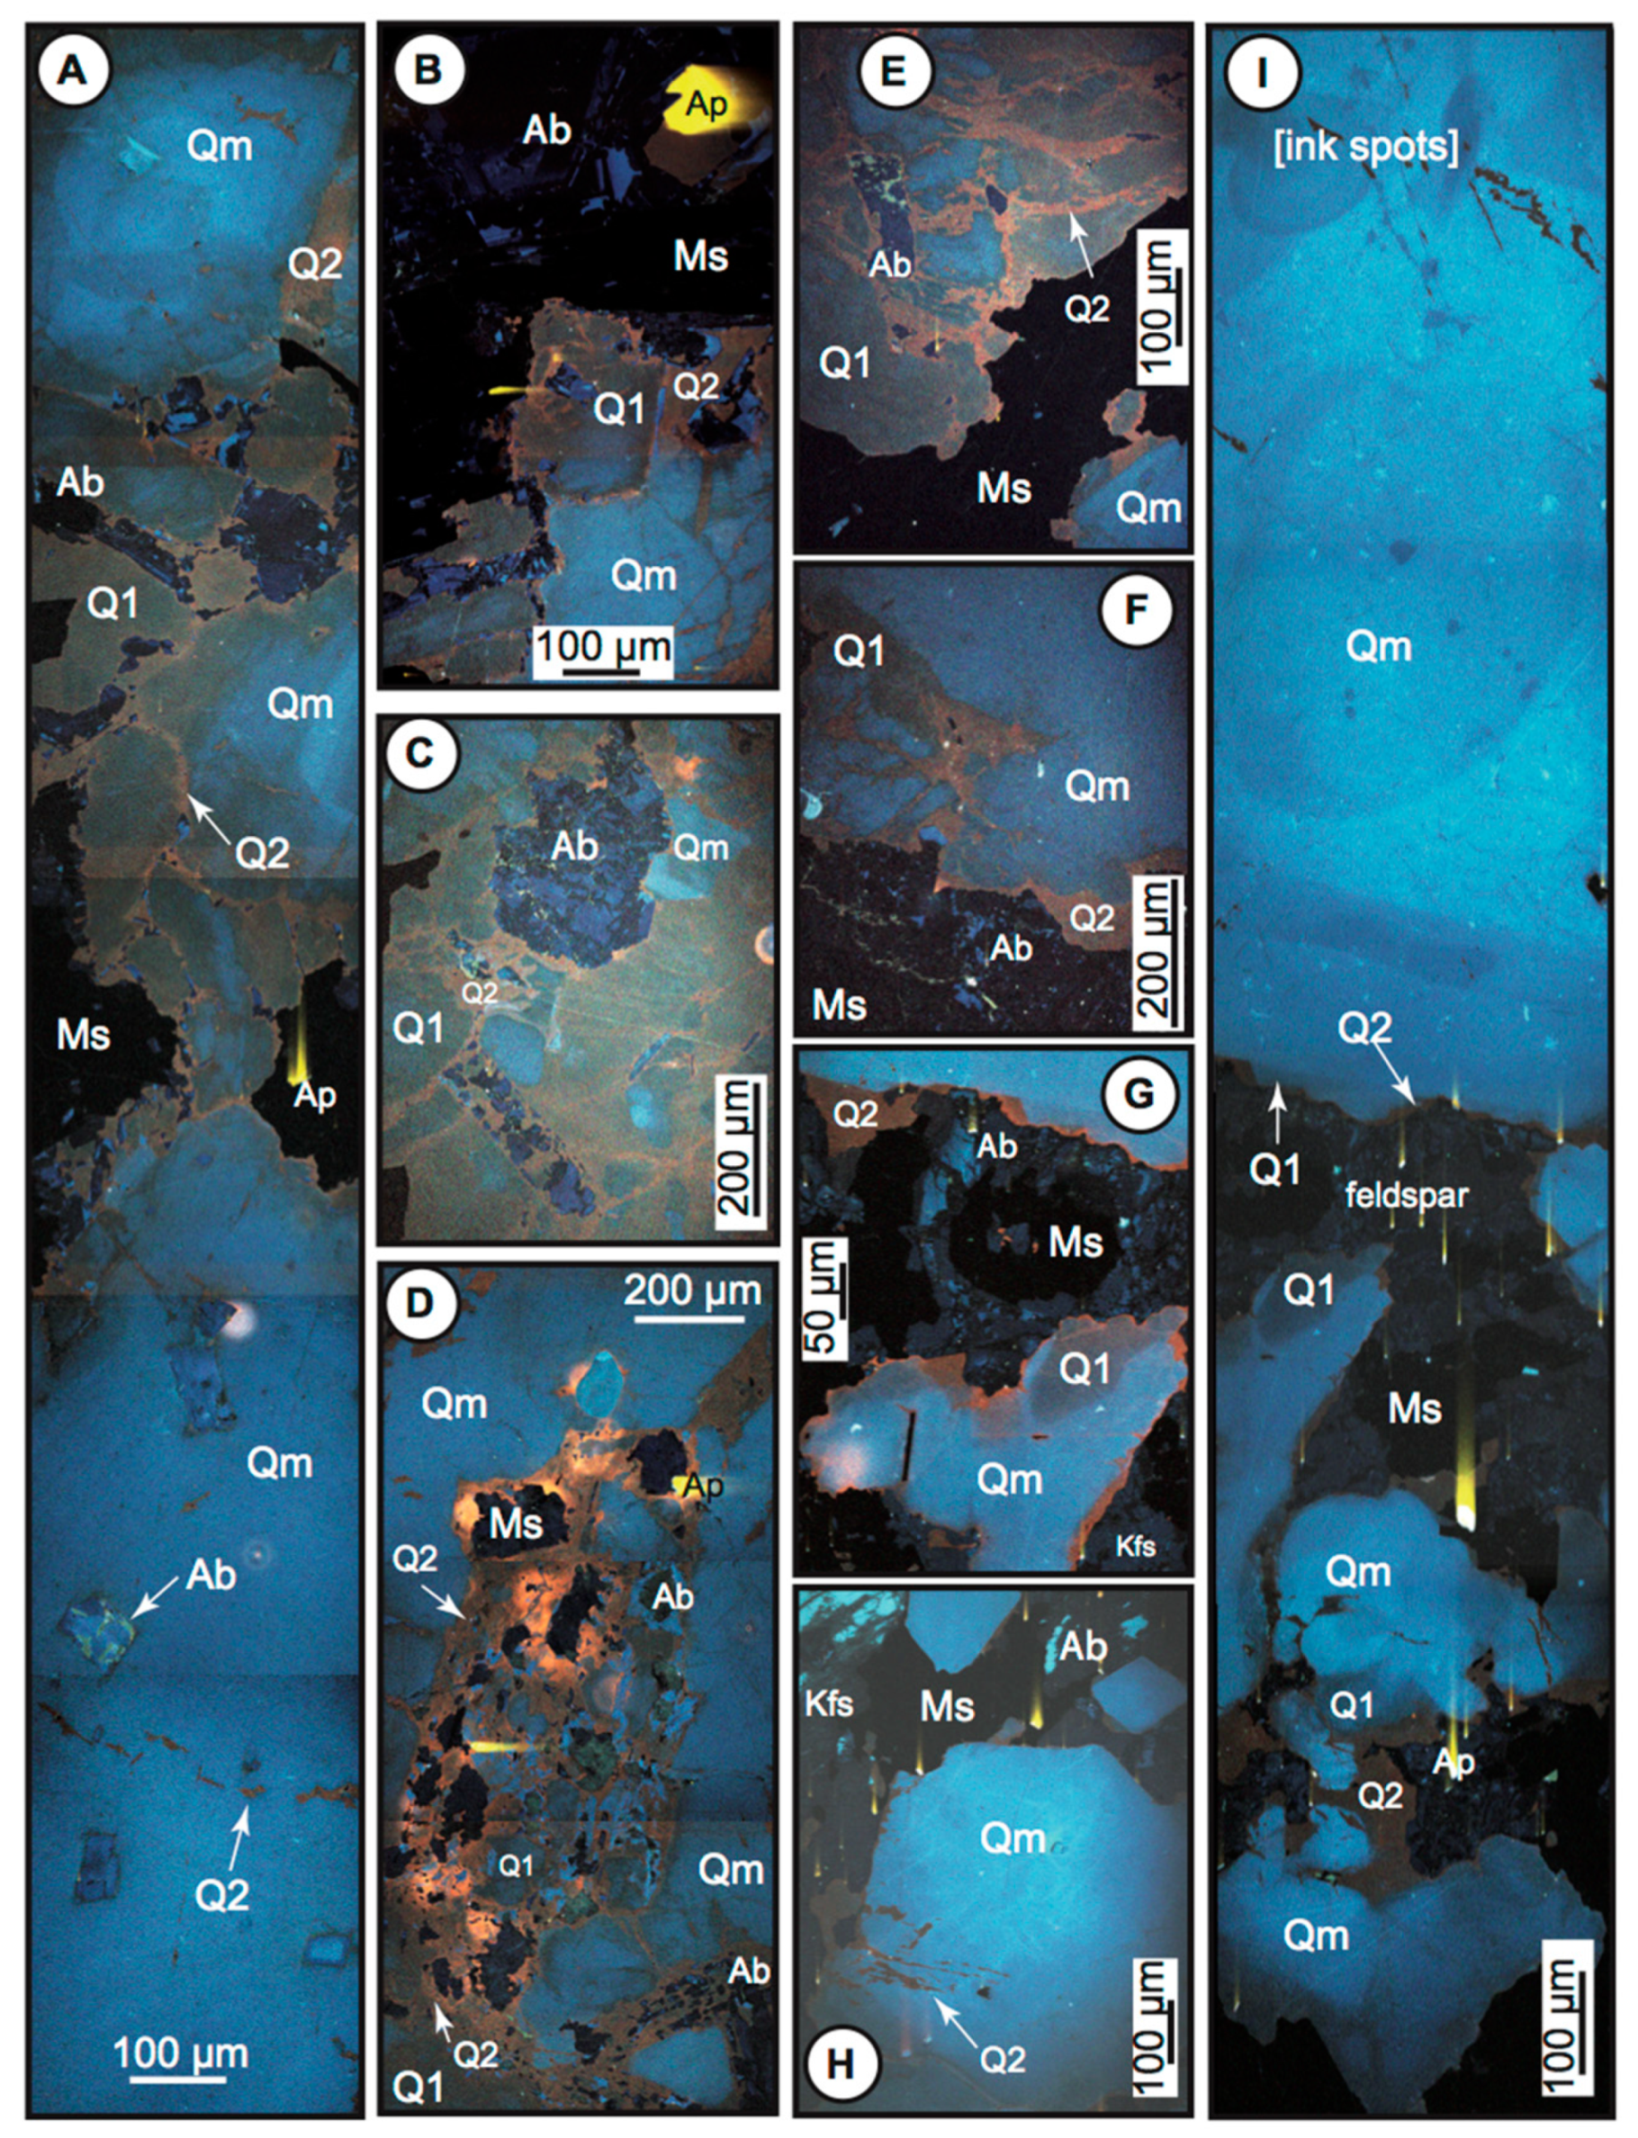
Figure 18.
Quartz texture revealed by cathodoluminescence (CL, RBG synthetic images). Three luminescence levels discriminate quartz types: blue luminescent quartz (Qm), brownish luminescent quartz (Q1), reddish luminescent quartz (Q2). (A–E) Greisenised granite from the L2 level. (A) Profile through the contact between a magmatic quartz phenocryst (bottom) and the surrounding quartz-muscovite-albite matrix (sample PNQ-13a). The matrix is constituted of brownish Q1 quartz, crisscrossed by Q2 veinlets. (B) Quartz-albite-muscovite of the greisen (sample PNQ-13a). Blue Qm is surrounded by brownish Q1, and both are crisscrossed by Q2. The latter is fringing the muscovite. (C) Quartz-albite-muscovite matrix of the greisen (sample PNQ-19a). Cores of blue Qm are isolated within a Q1 matrix, with crisscrossing Q2 veinlets. Albite is corroded and invaded by both Q1 and Q2. (D) Quartz-albite-muscovite matrix (Q1 and Q2) in contact with blue Qm (sample PNQ-19a). (E) Quartz-albite matrix and muscovite lath (sample PNQ-19a). Q1 surrounds Qm cores, and Q2 veinlets crisscross both. (F) quartz phenocryst border in a granite G2 from the SCB2 drill hole (sample PAN16-8). Q1 and Q2 dilacerate the blue magmatic quartz Qm. (G–I) porphyritic granite G1 from the SCB2 drill hole. (G) Quartz-feldspar-muscovite matrix of the porphyritic granite (sample PAN16-7a). Quartz is mostly formed by blue luminescent Qm, associated with minor Q1, and fringed by reddish luminescent Q2. (H) Zoned magmatic quartz grain included in a perthitic K-feldspar megacryst (sample PAN16-5b). Note the Q2 expansions into the K-feldspar and as microcracks within the magmatic quartz. (I) Profile from a zoned quartz phenocryst to the quartz-muscovite-albite-Kfs matrix (sample PAN16-7a). The great majority of the quartz consists of blue (magmatic) Qm, with tiny and discontinuous fringes of Q1 and Q2.

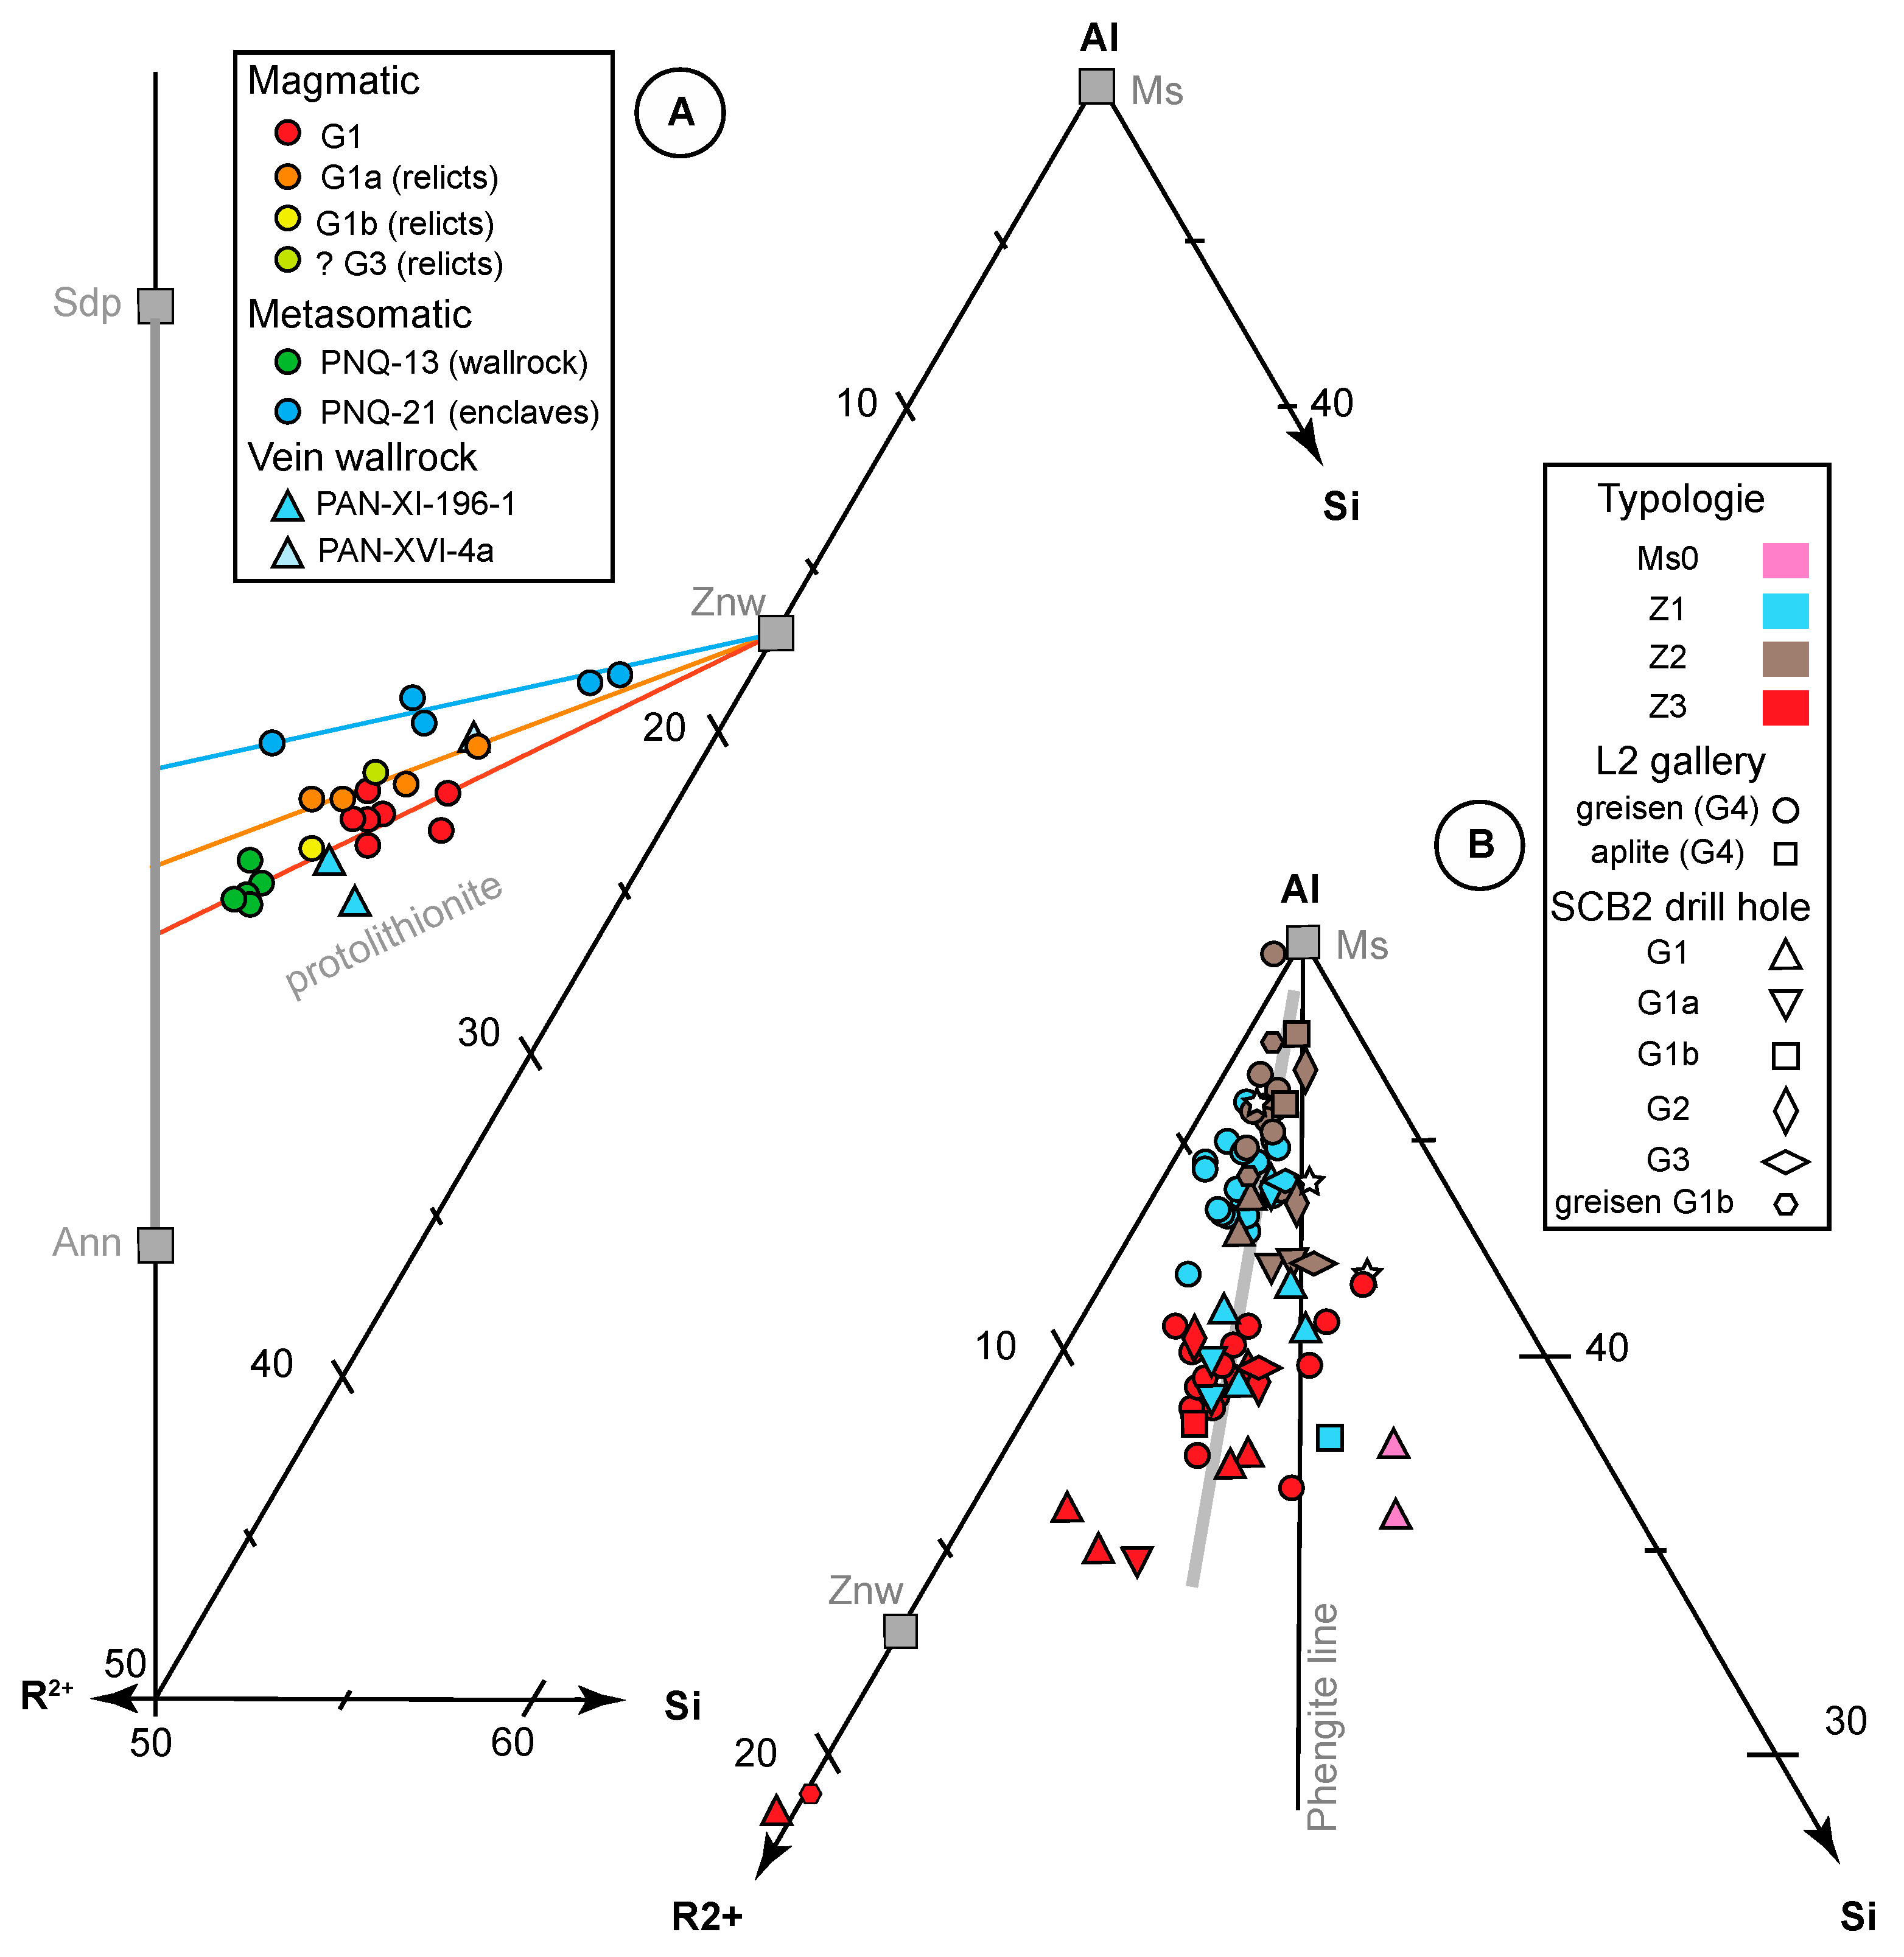
Figure 19.
Mica chemistry in the Al-R
2+-Si diagram [
51]. (
A) Trioctahedral micas; (
B) Dioctahedral micas. Ms = muscovite, Sdp = siderophyllite, Ann = annite; Znw = zinnwaldite. Legend of symbols, see text.
Figure 19.
Mica chemistry in the Al-R
2+-Si diagram [
51]. (
A) Trioctahedral micas; (
B) Dioctahedral micas. Ms = muscovite, Sdp = siderophyllite, Ann = annite; Znw = zinnwaldite. Legend of symbols, see text.
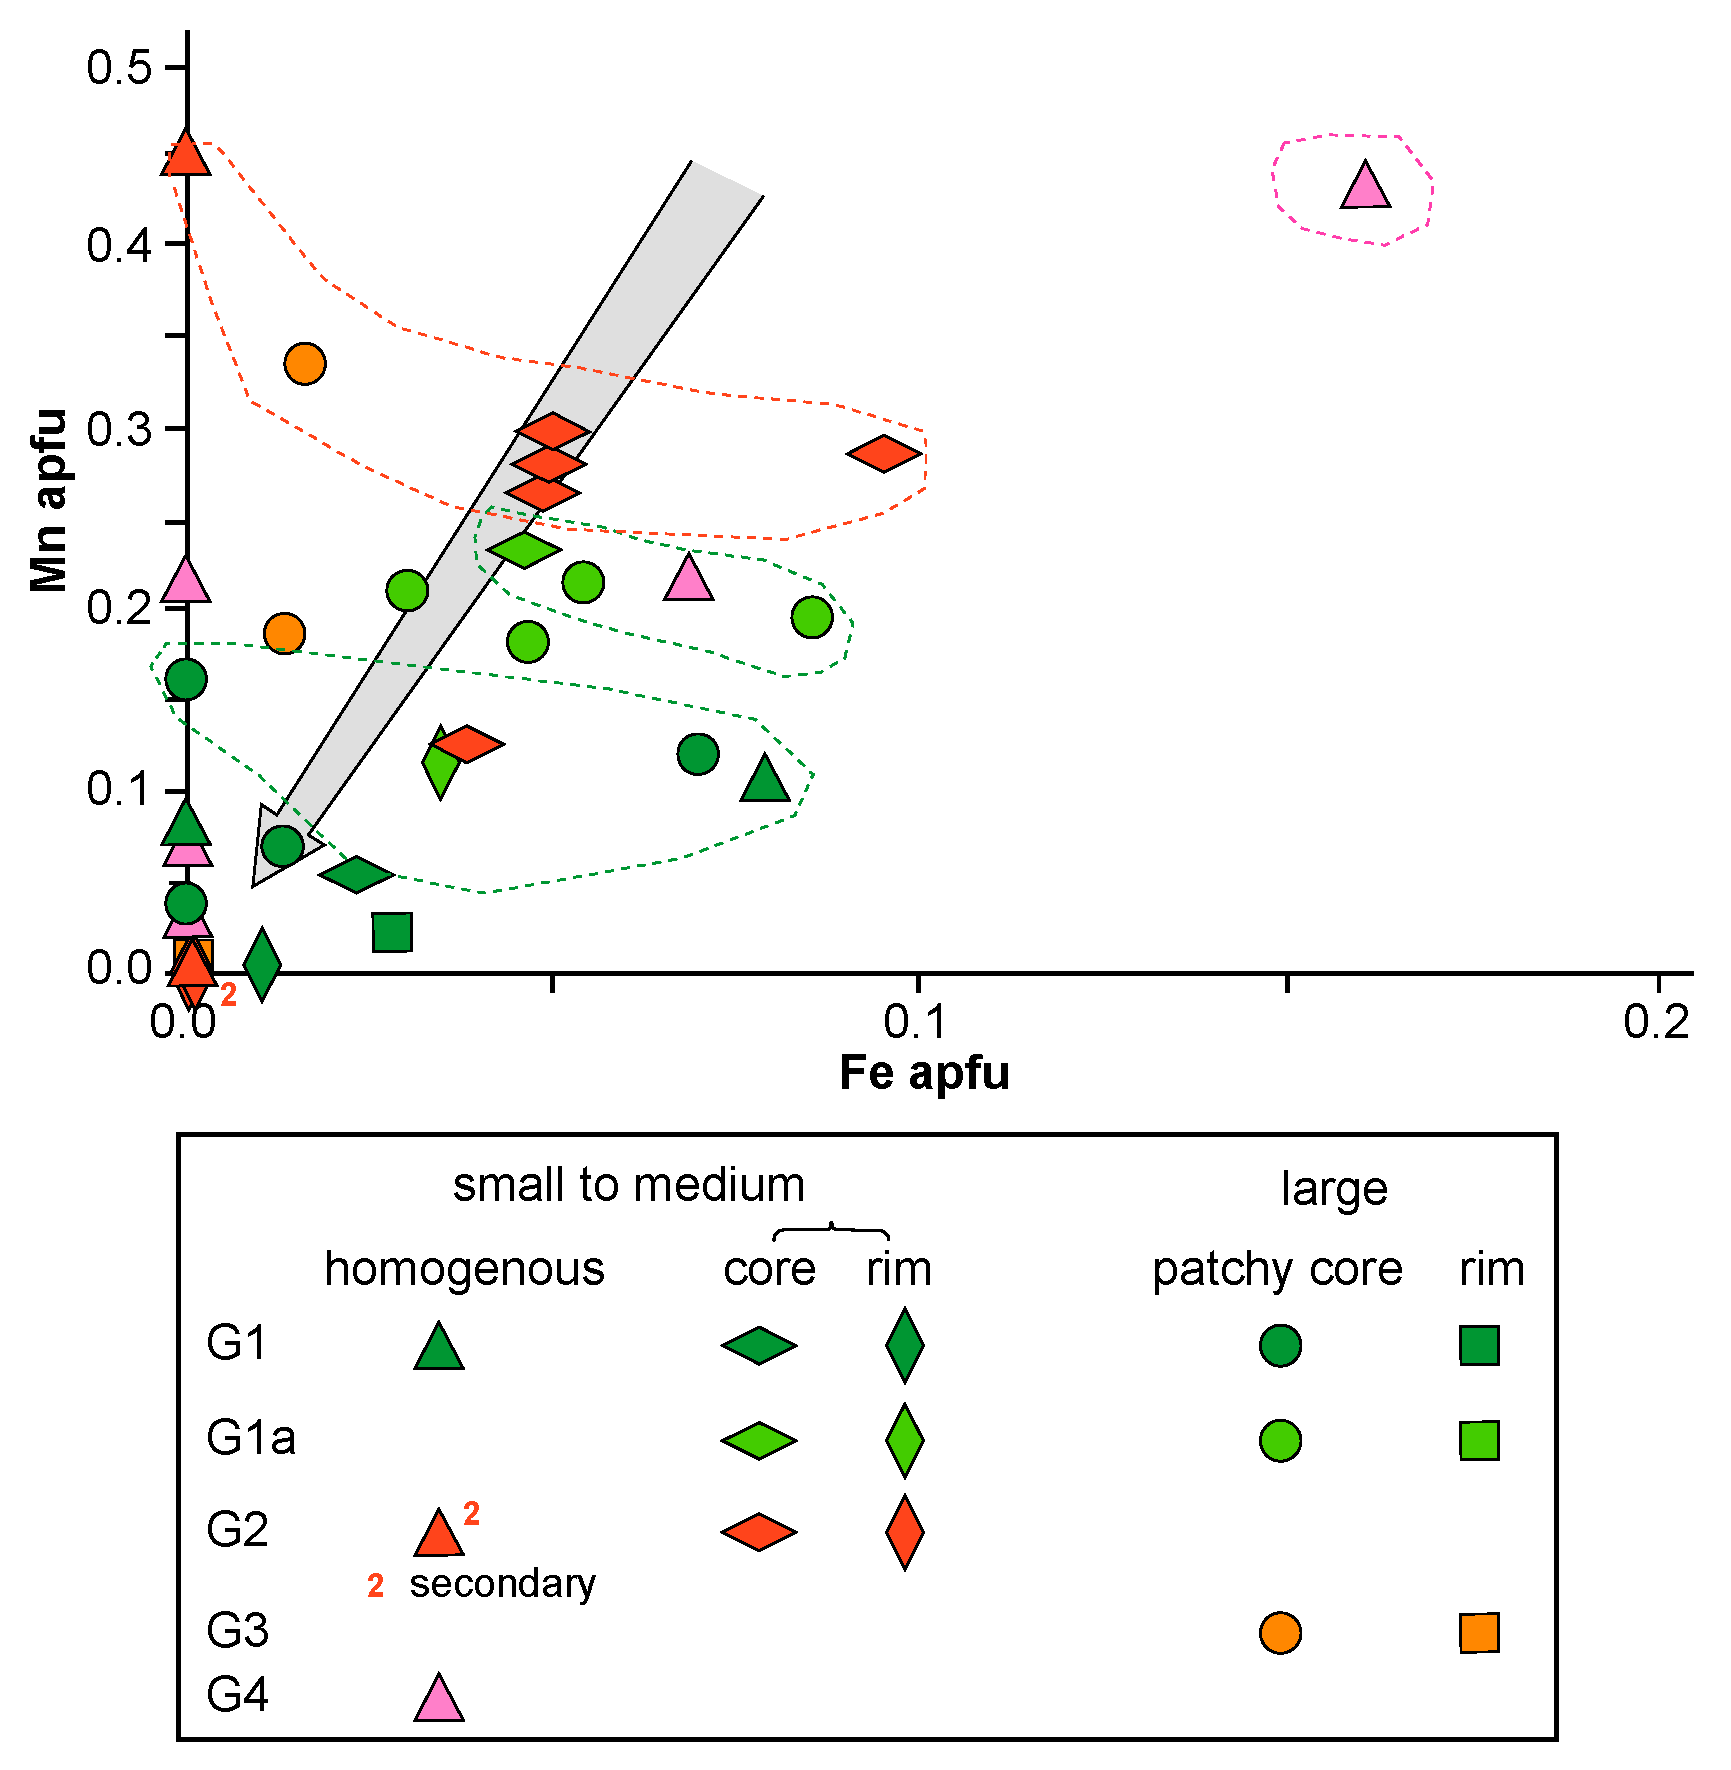
Figure 20.
Mn vs. Fe diagram for Panasqueira apatite. Zoning is due to limited variations in the iron and manganese contents, with a tendency to decrease from cores to rim in the crystals. The dashed lines domains correspond to interpreted magmatic fields (pink: G4; red: G2-G3; light green G1a; green: G1). The grey arrow materializes the overall trend of subsolidus reworking towards compositions closer and closer to the pure F-apatite end-member. See the text for explanations.
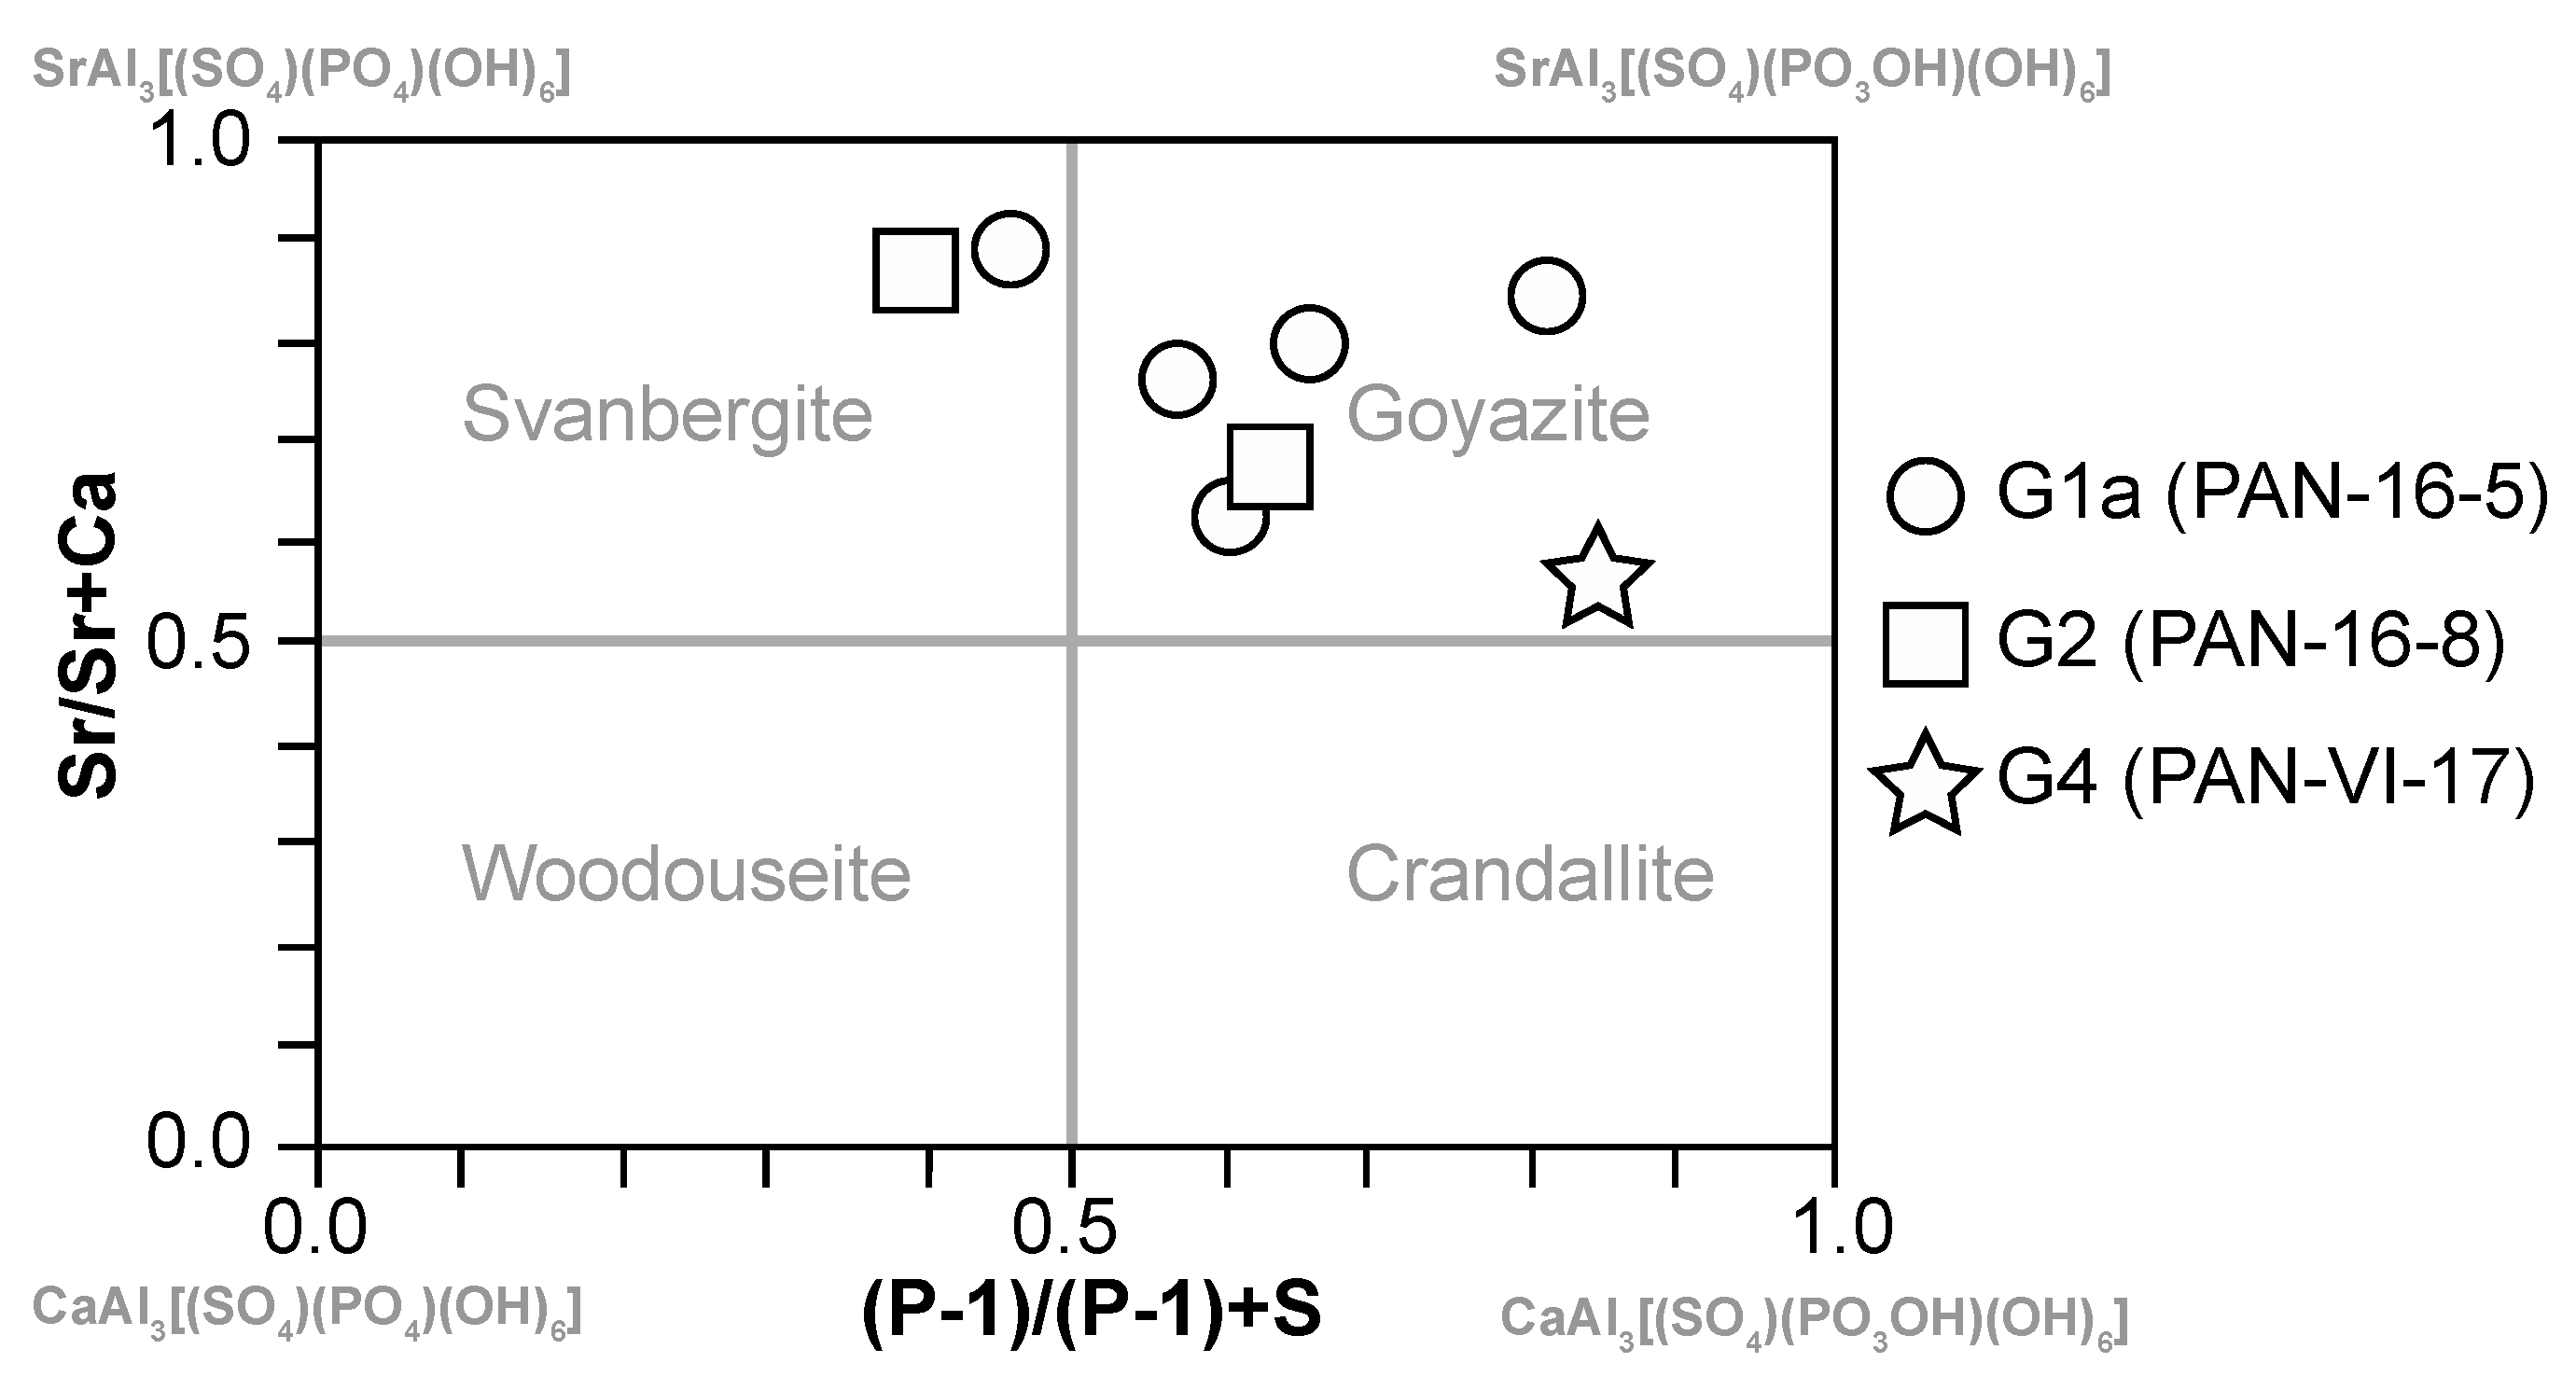
Figure 21.
Characterization of the alumina-phosphate-sulfates (APS) associated with apatite in Panasqueira granites (following Salama 2014). The quadrilateral S/Sr + Ca versus (P-1)/(P-1) + S diagram of the beudantite and crandallite group minerals shows that Panasqueira APS is a svanbergite/goyazite solid solution (with minor woodhouseite and crandallite components).
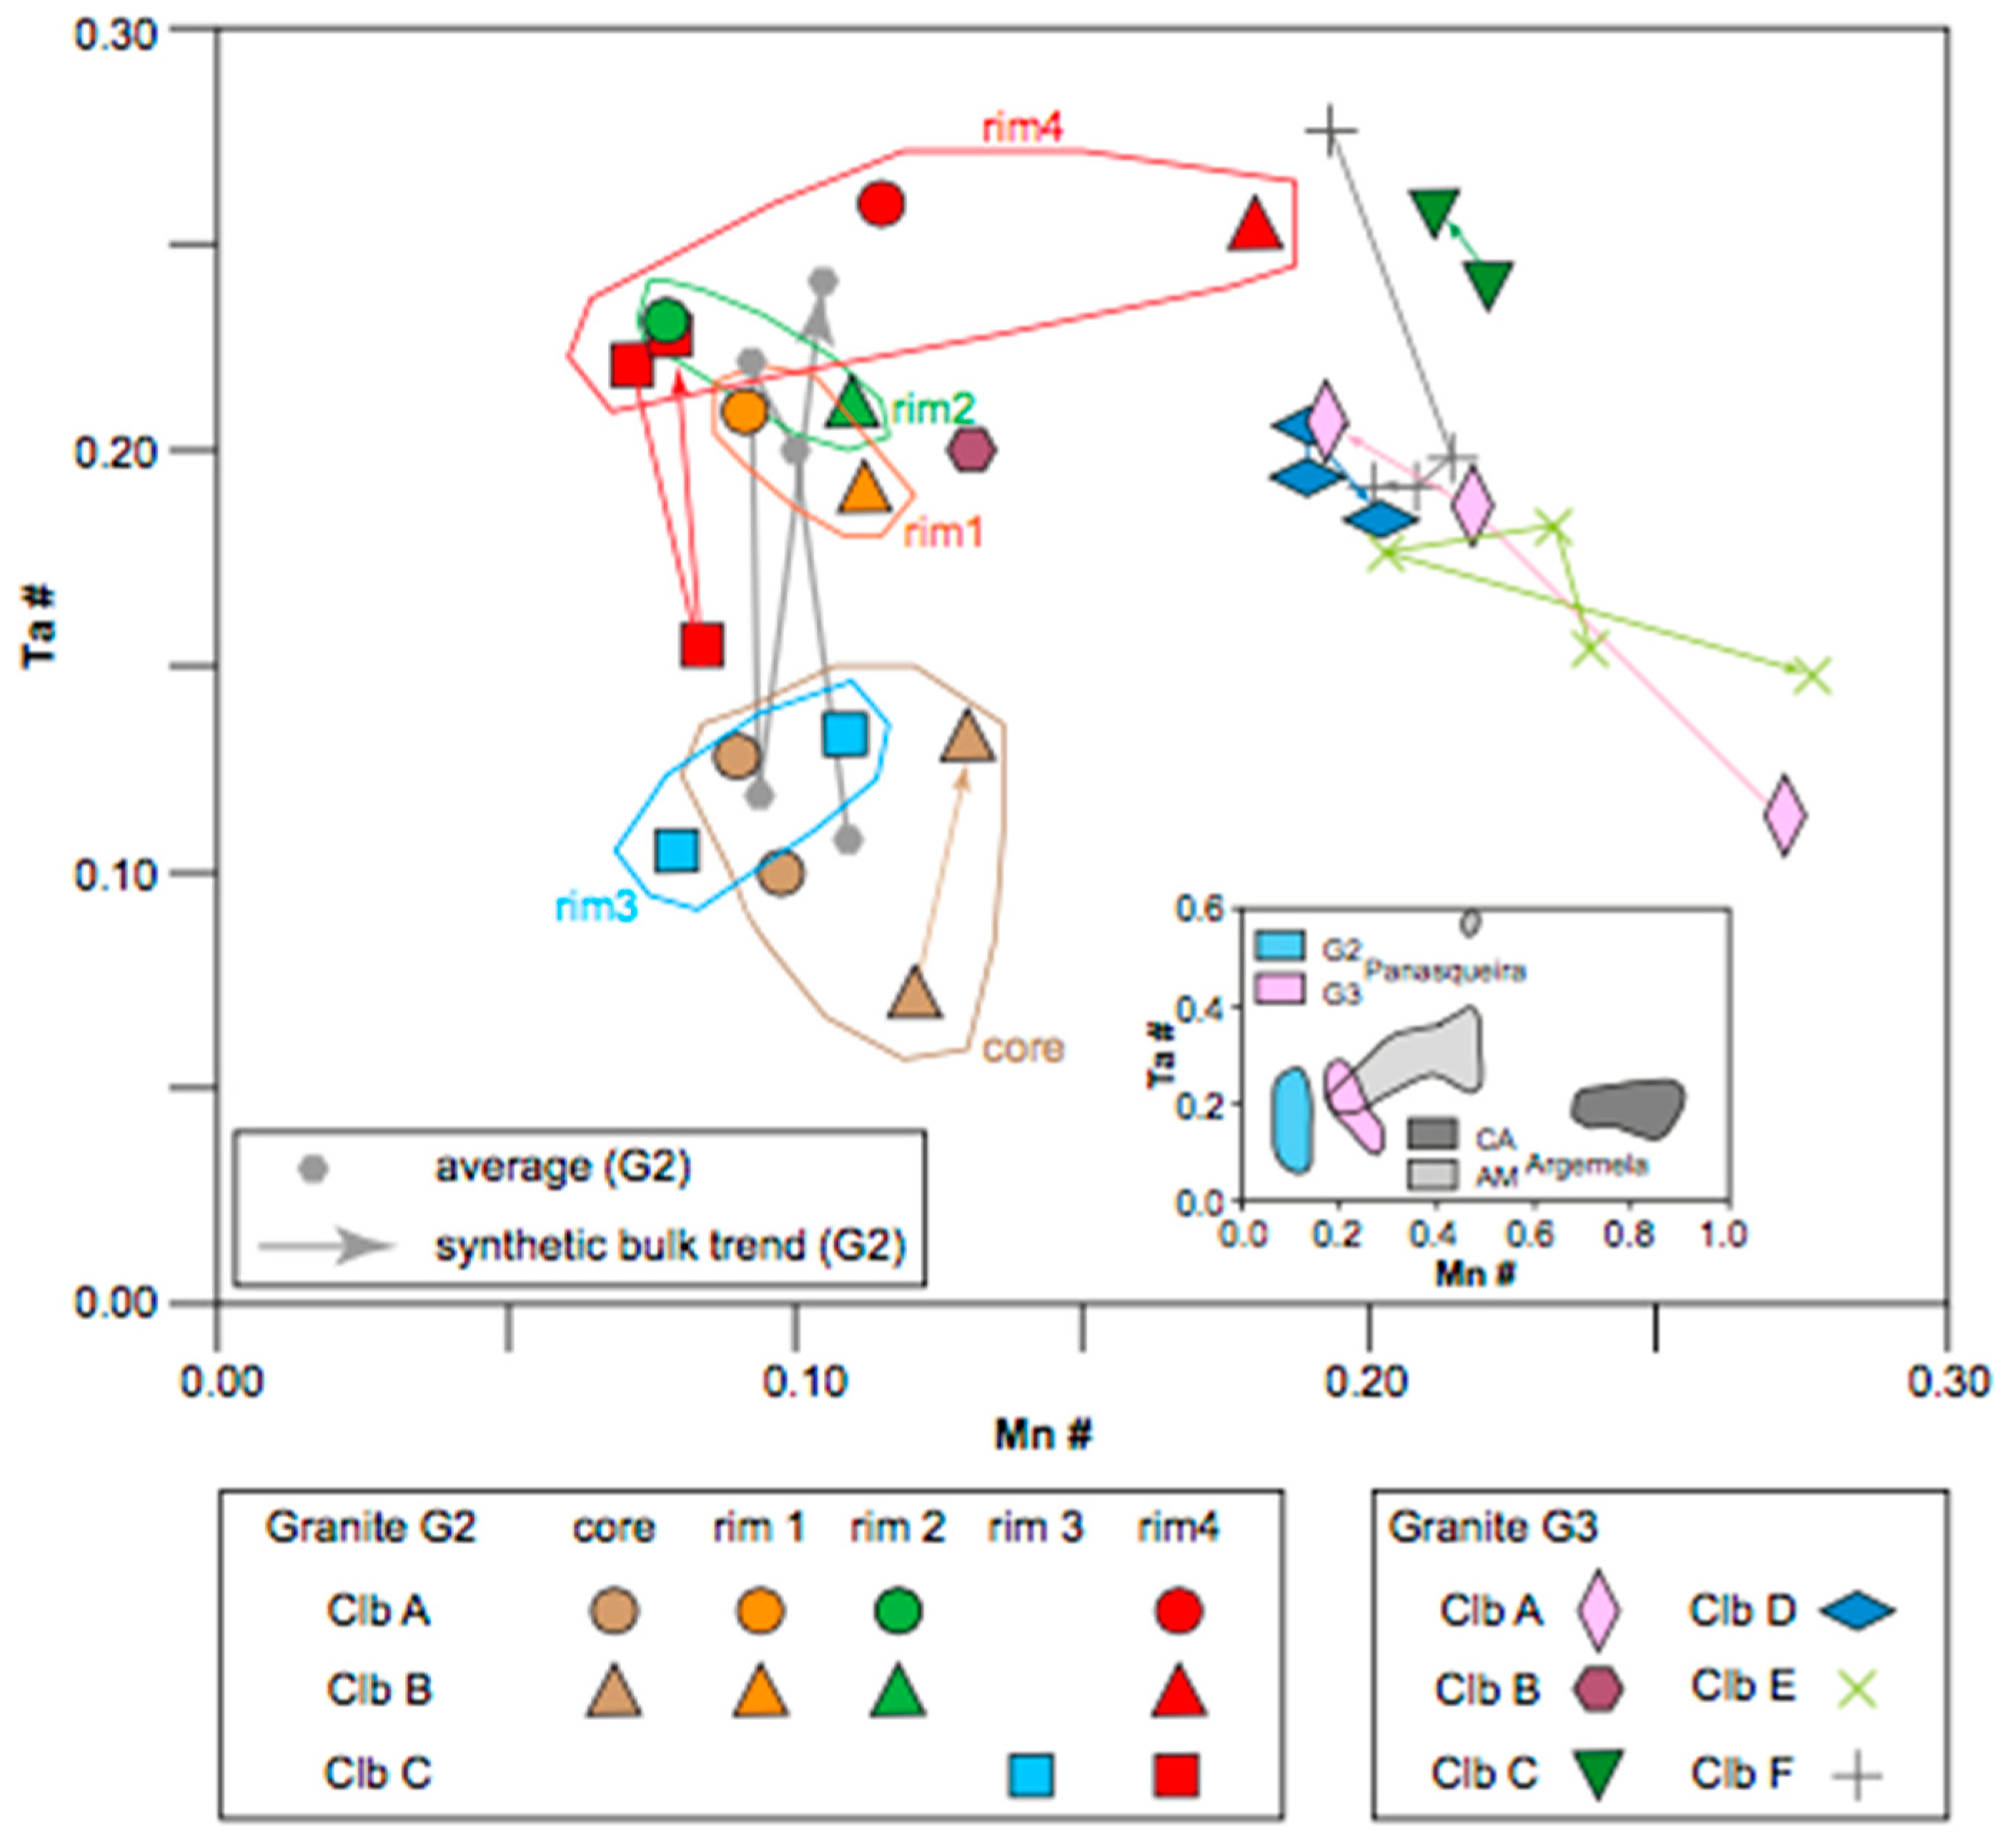
Figure 22.
Panasqueira columbite-tantalite in the Ta/Ta + Nb (=Ta#) vs. Mn/Fe + Mn (=Mn#) classification diagram. Inset: comparison with the magmatic columbite-tantalite from the nearby Argemela RMG (CT1 [
55]: CA, Cabeço de Argemela cupola; AM, Argemela Mine RMG, and dike).
Figure 22.
Panasqueira columbite-tantalite in the Ta/Ta + Nb (=Ta#) vs. Mn/Fe + Mn (=Mn#) classification diagram. Inset: comparison with the magmatic columbite-tantalite from the nearby Argemela RMG (CT1 [
55]: CA, Cabeço de Argemela cupola; AM, Argemela Mine RMG, and dike).
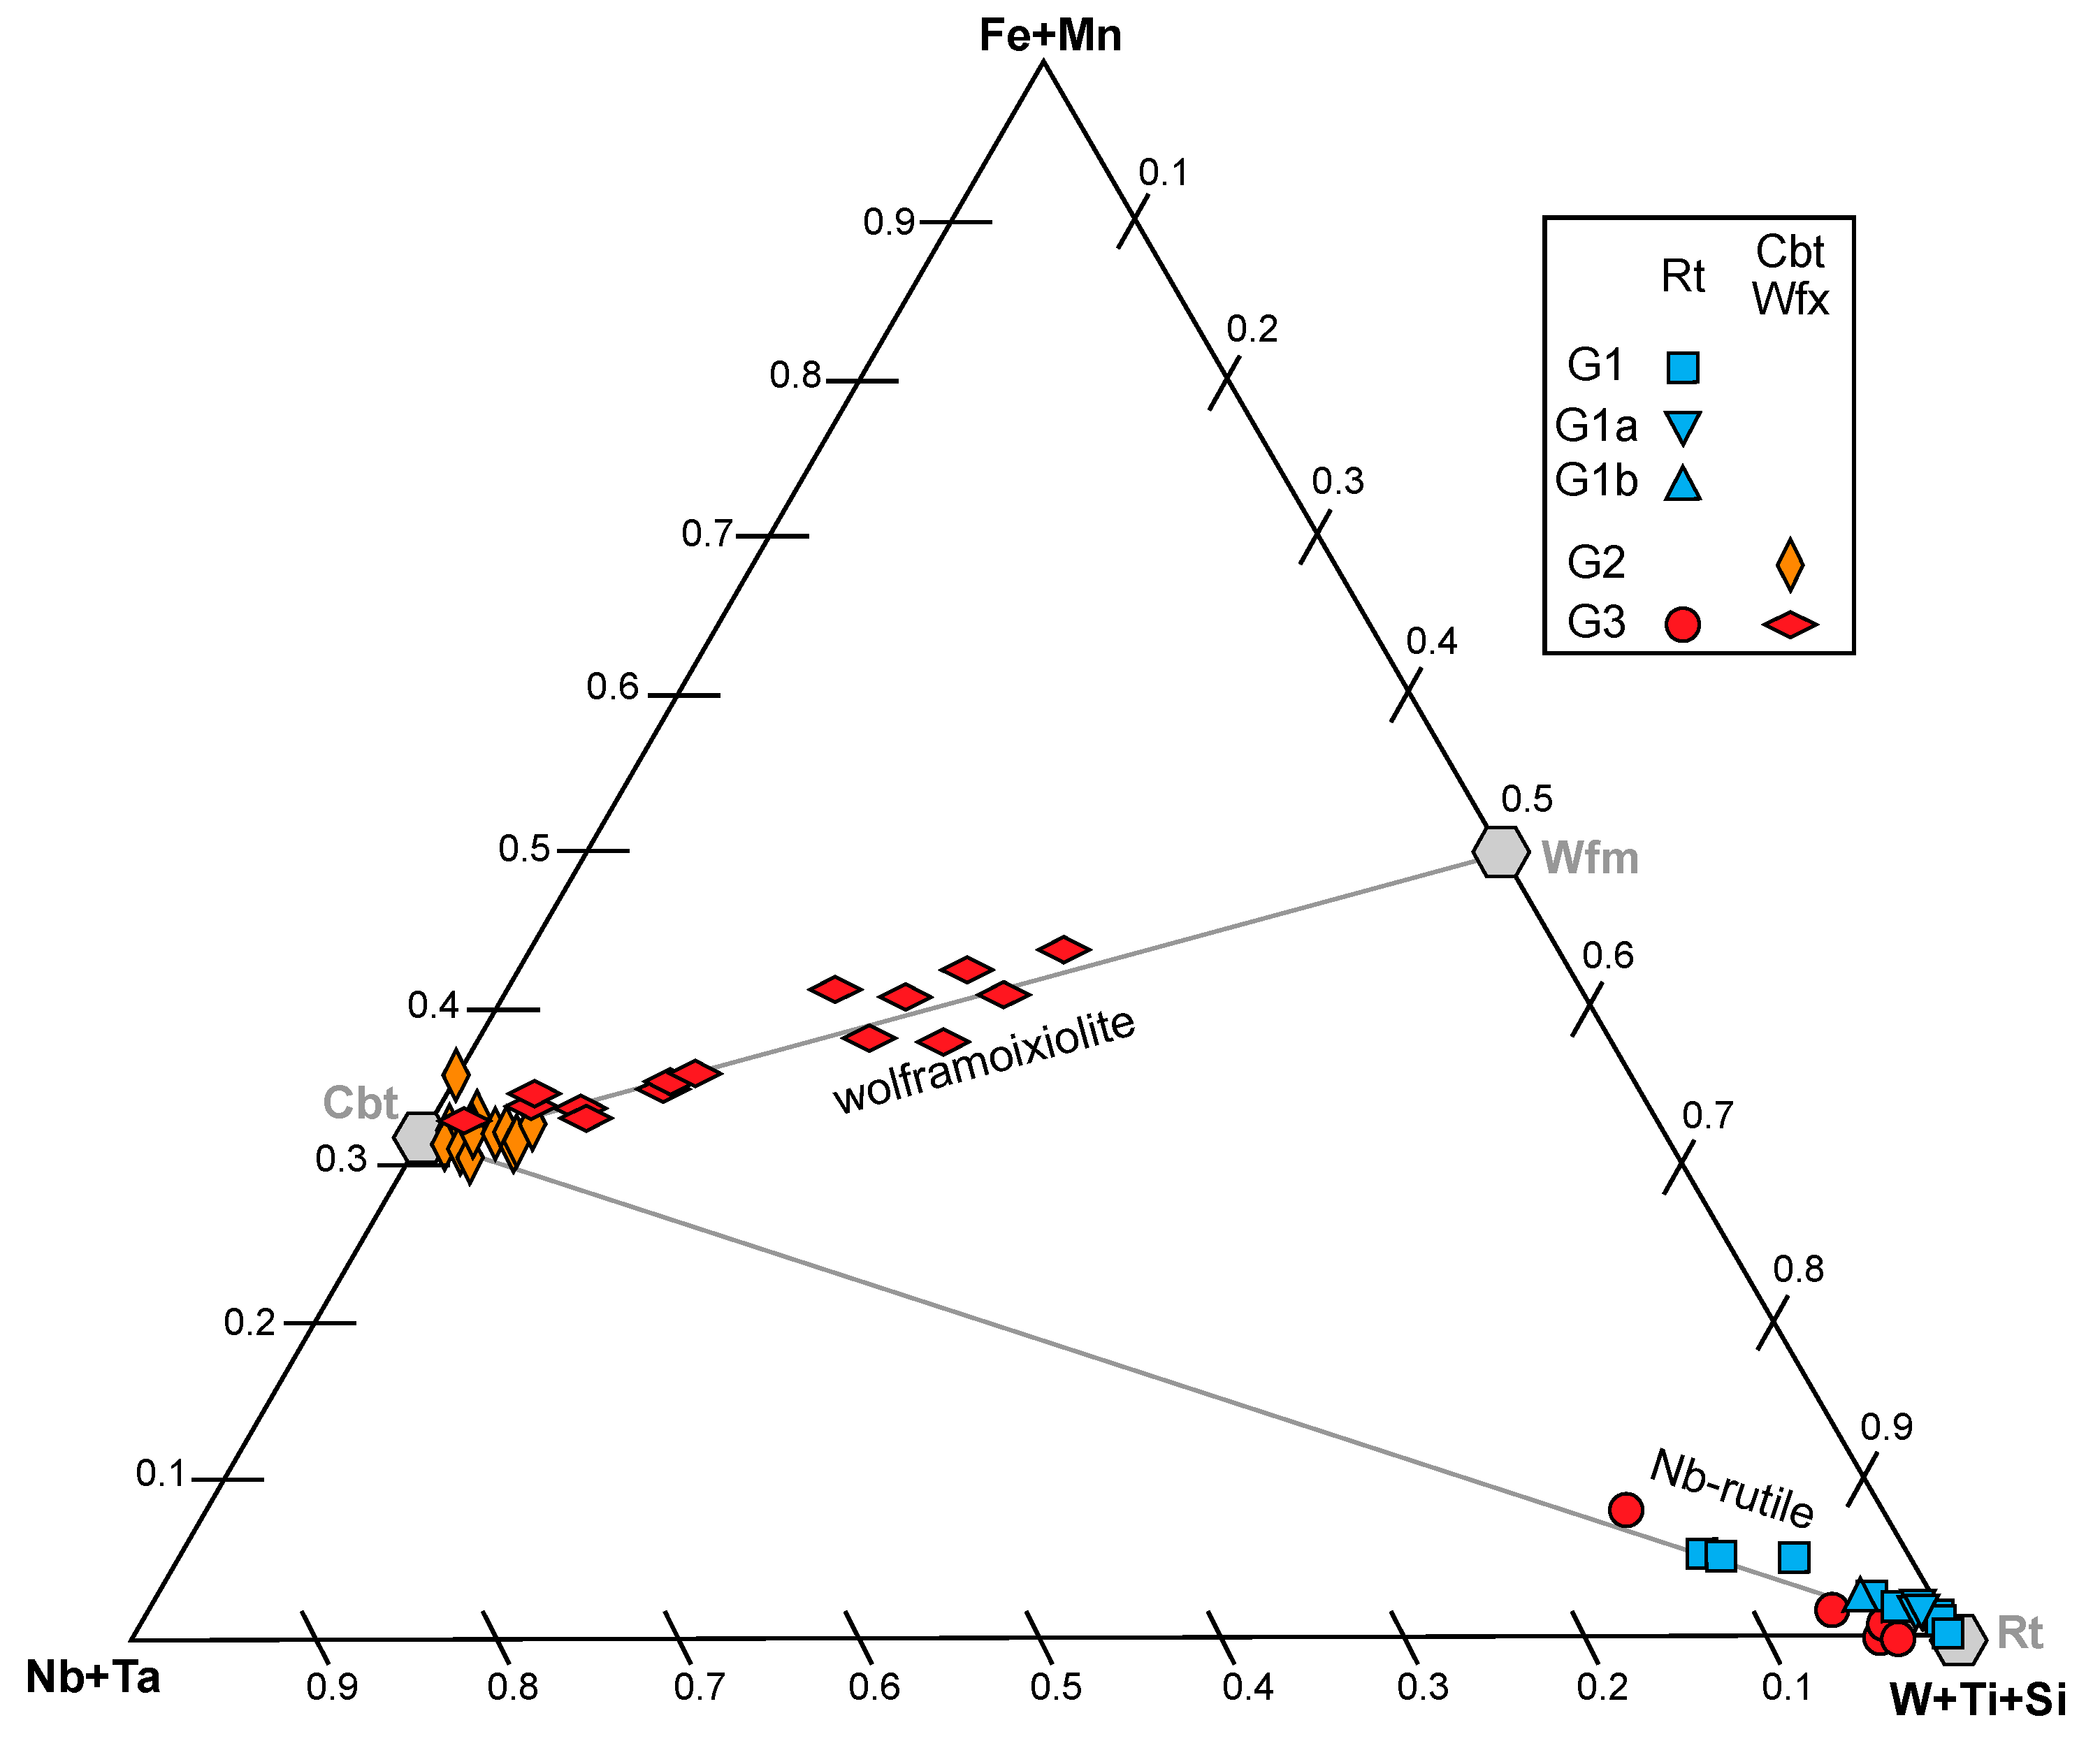
Figure 23.
Panasqueira colombite-tantalite, wolframo-ixiolite, and rutile compositions in the Nb + Ta/Fe + Mn/W + Ti + Si triangular diagram.
Figure 23.
Panasqueira colombite-tantalite, wolframo-ixiolite, and rutile compositions in the Nb + Ta/Fe + Mn/W + Ti + Si triangular diagram.
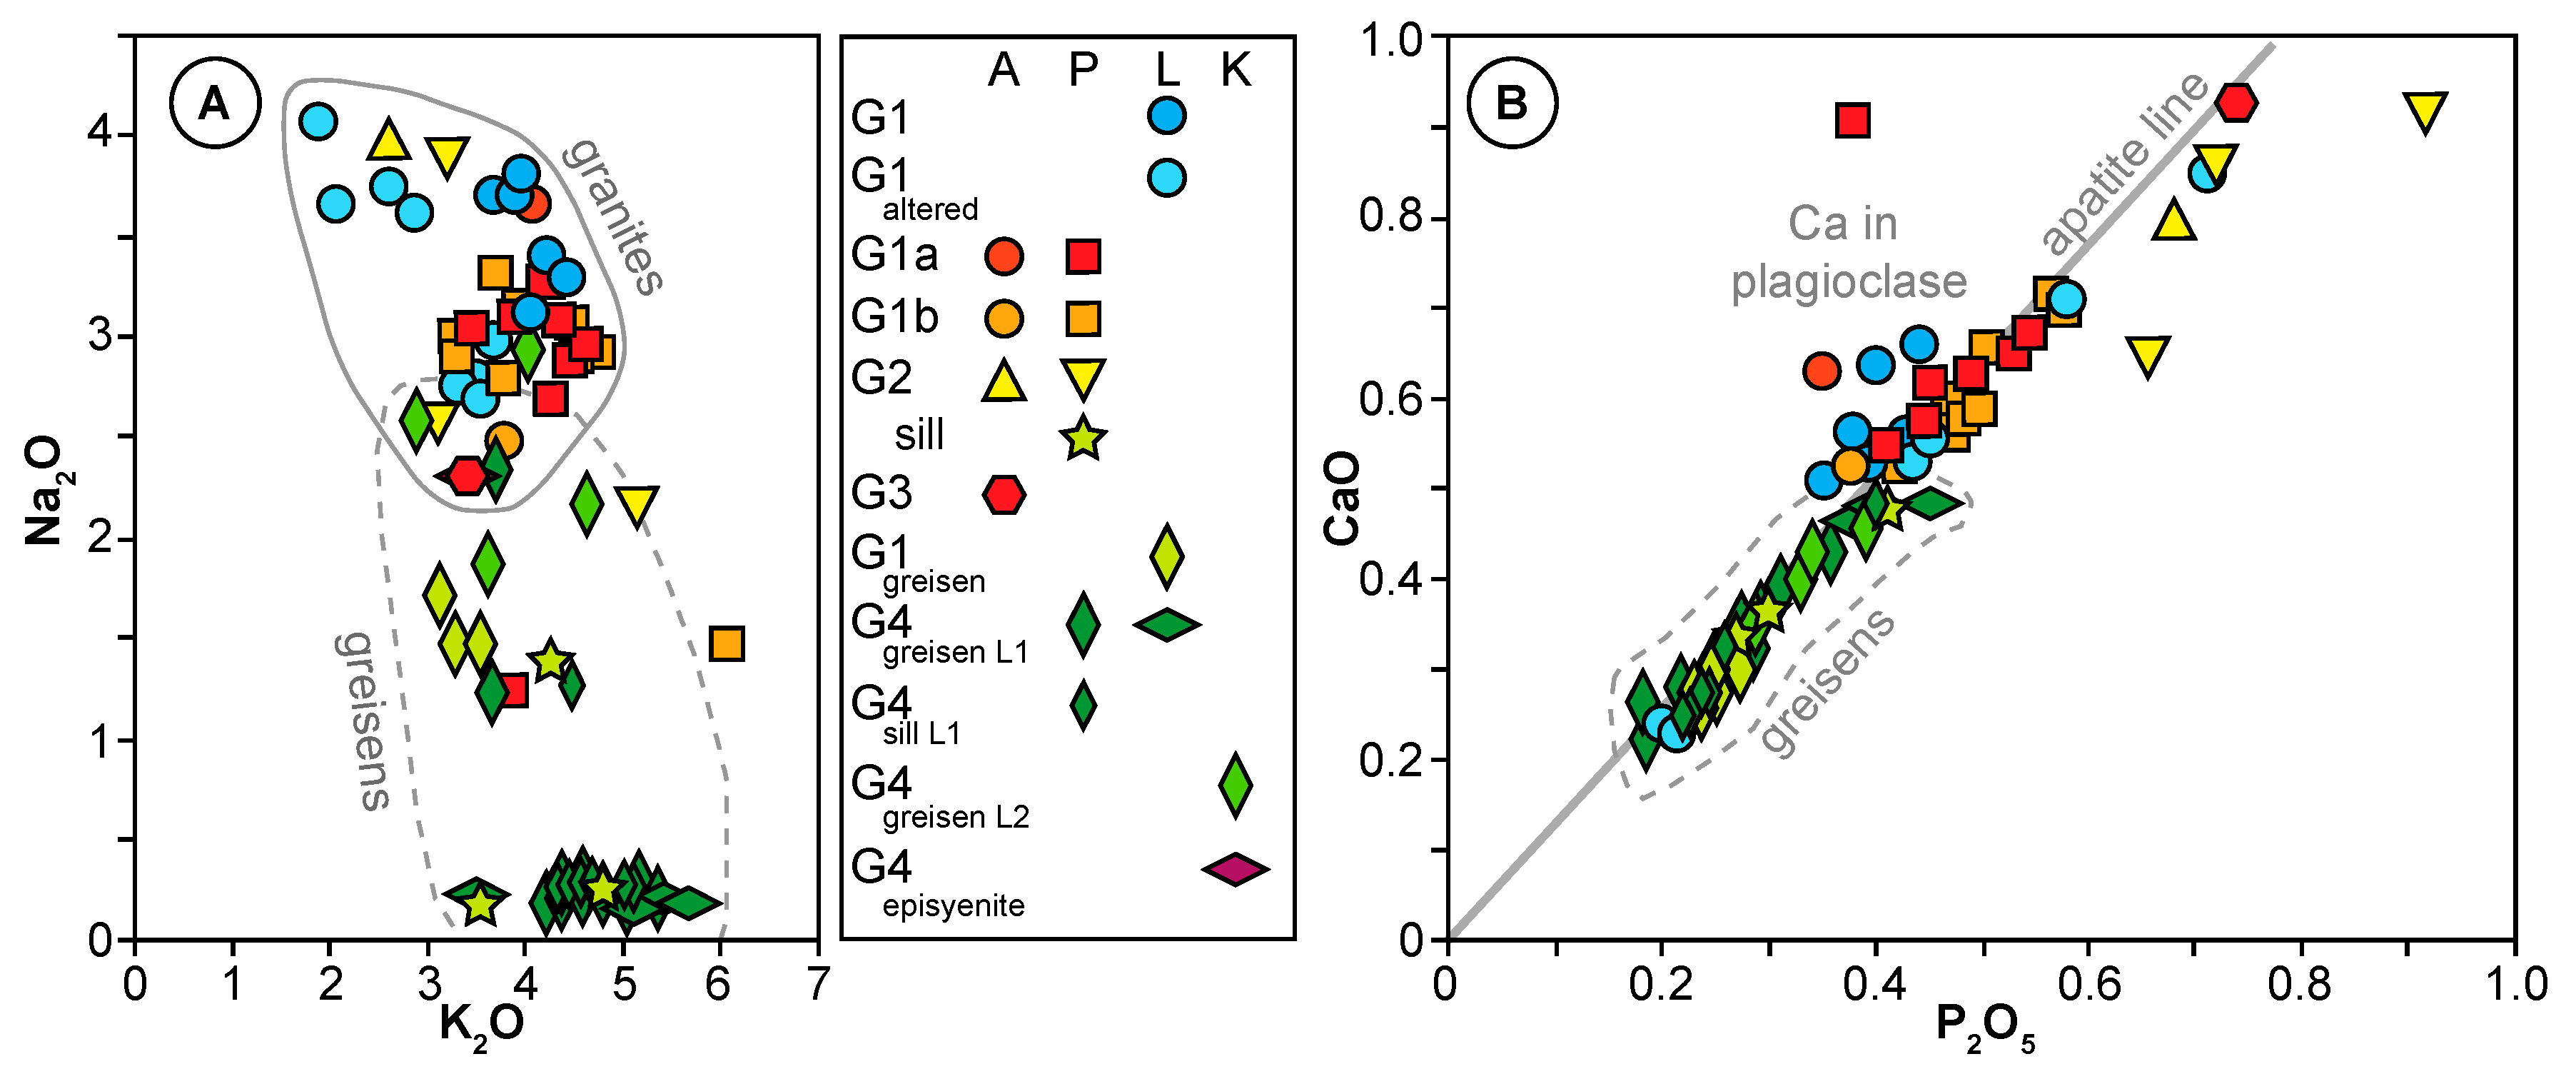
Figure 24.
Major element geochemistry of the Panasqueira granite suite. (
A) Na
2O vs. K
2O diagram, showing the sodium leaching in the greisens. (
B) CaO vs. P
2O
5 diagram, showing that calcium is essentially sequestered in apatite. Note that there is less apatite in greisens than in granites. A: [
17], P [
16], L [
15], K [
18].
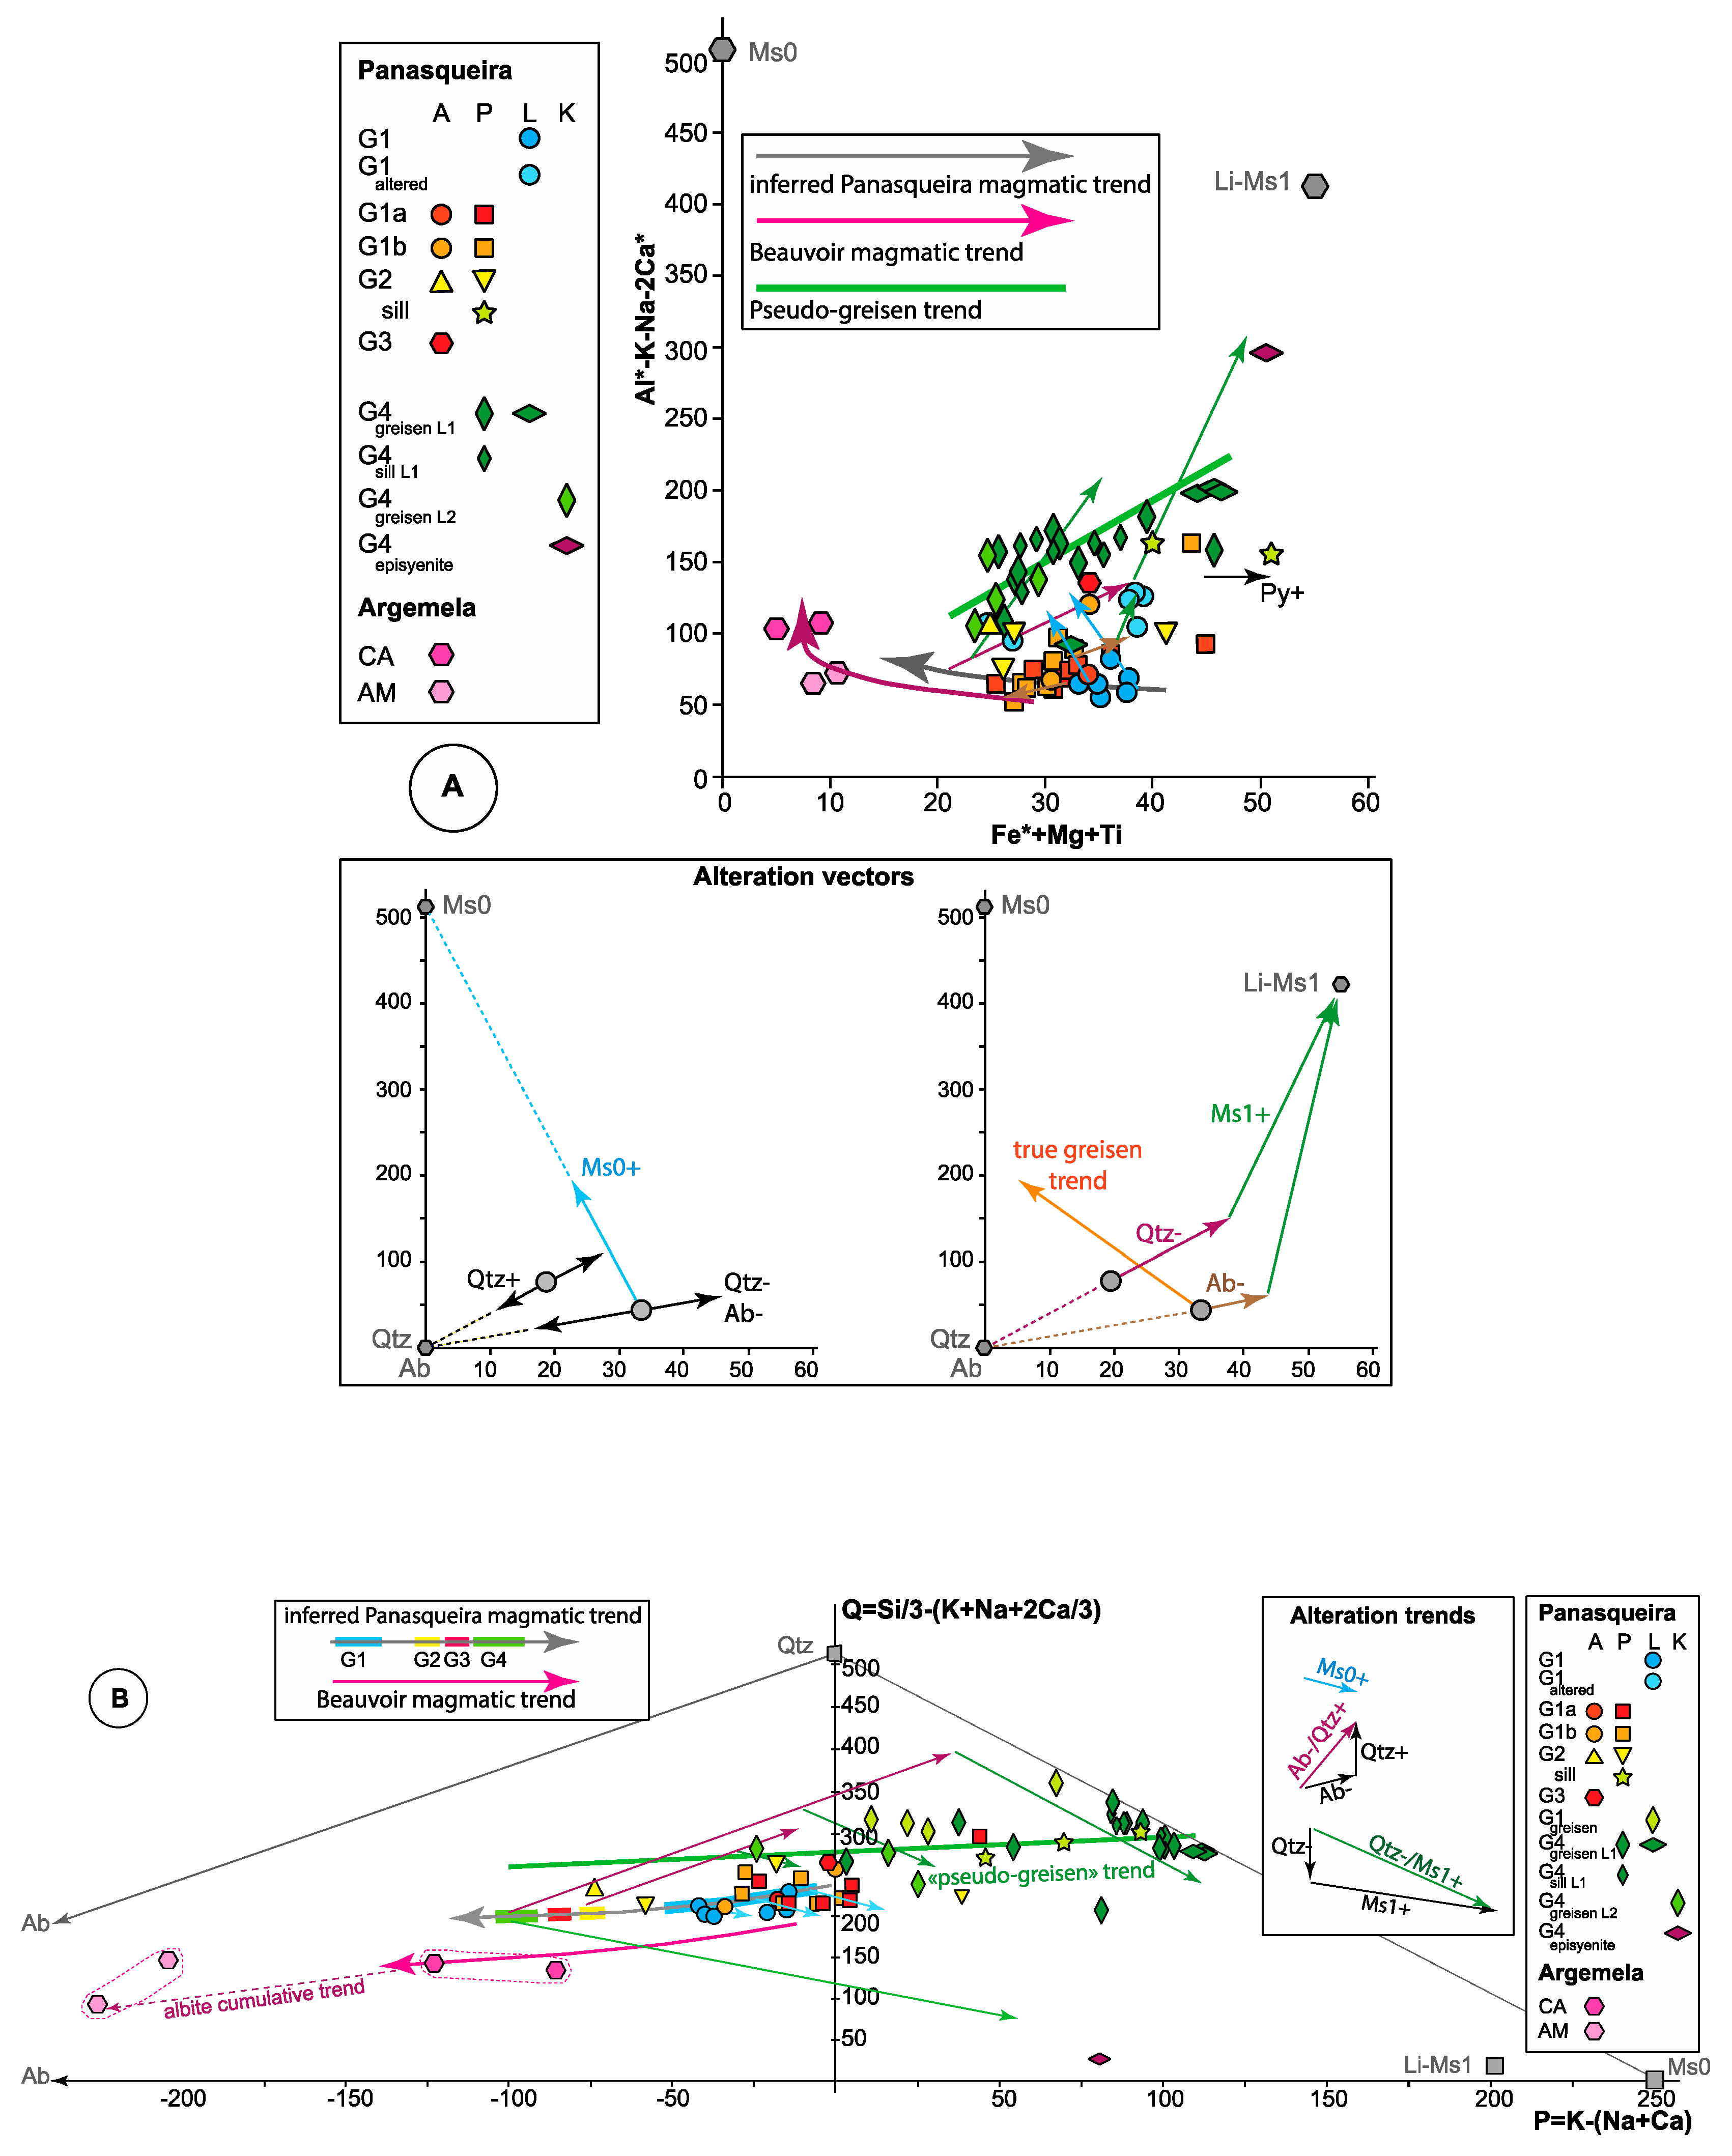
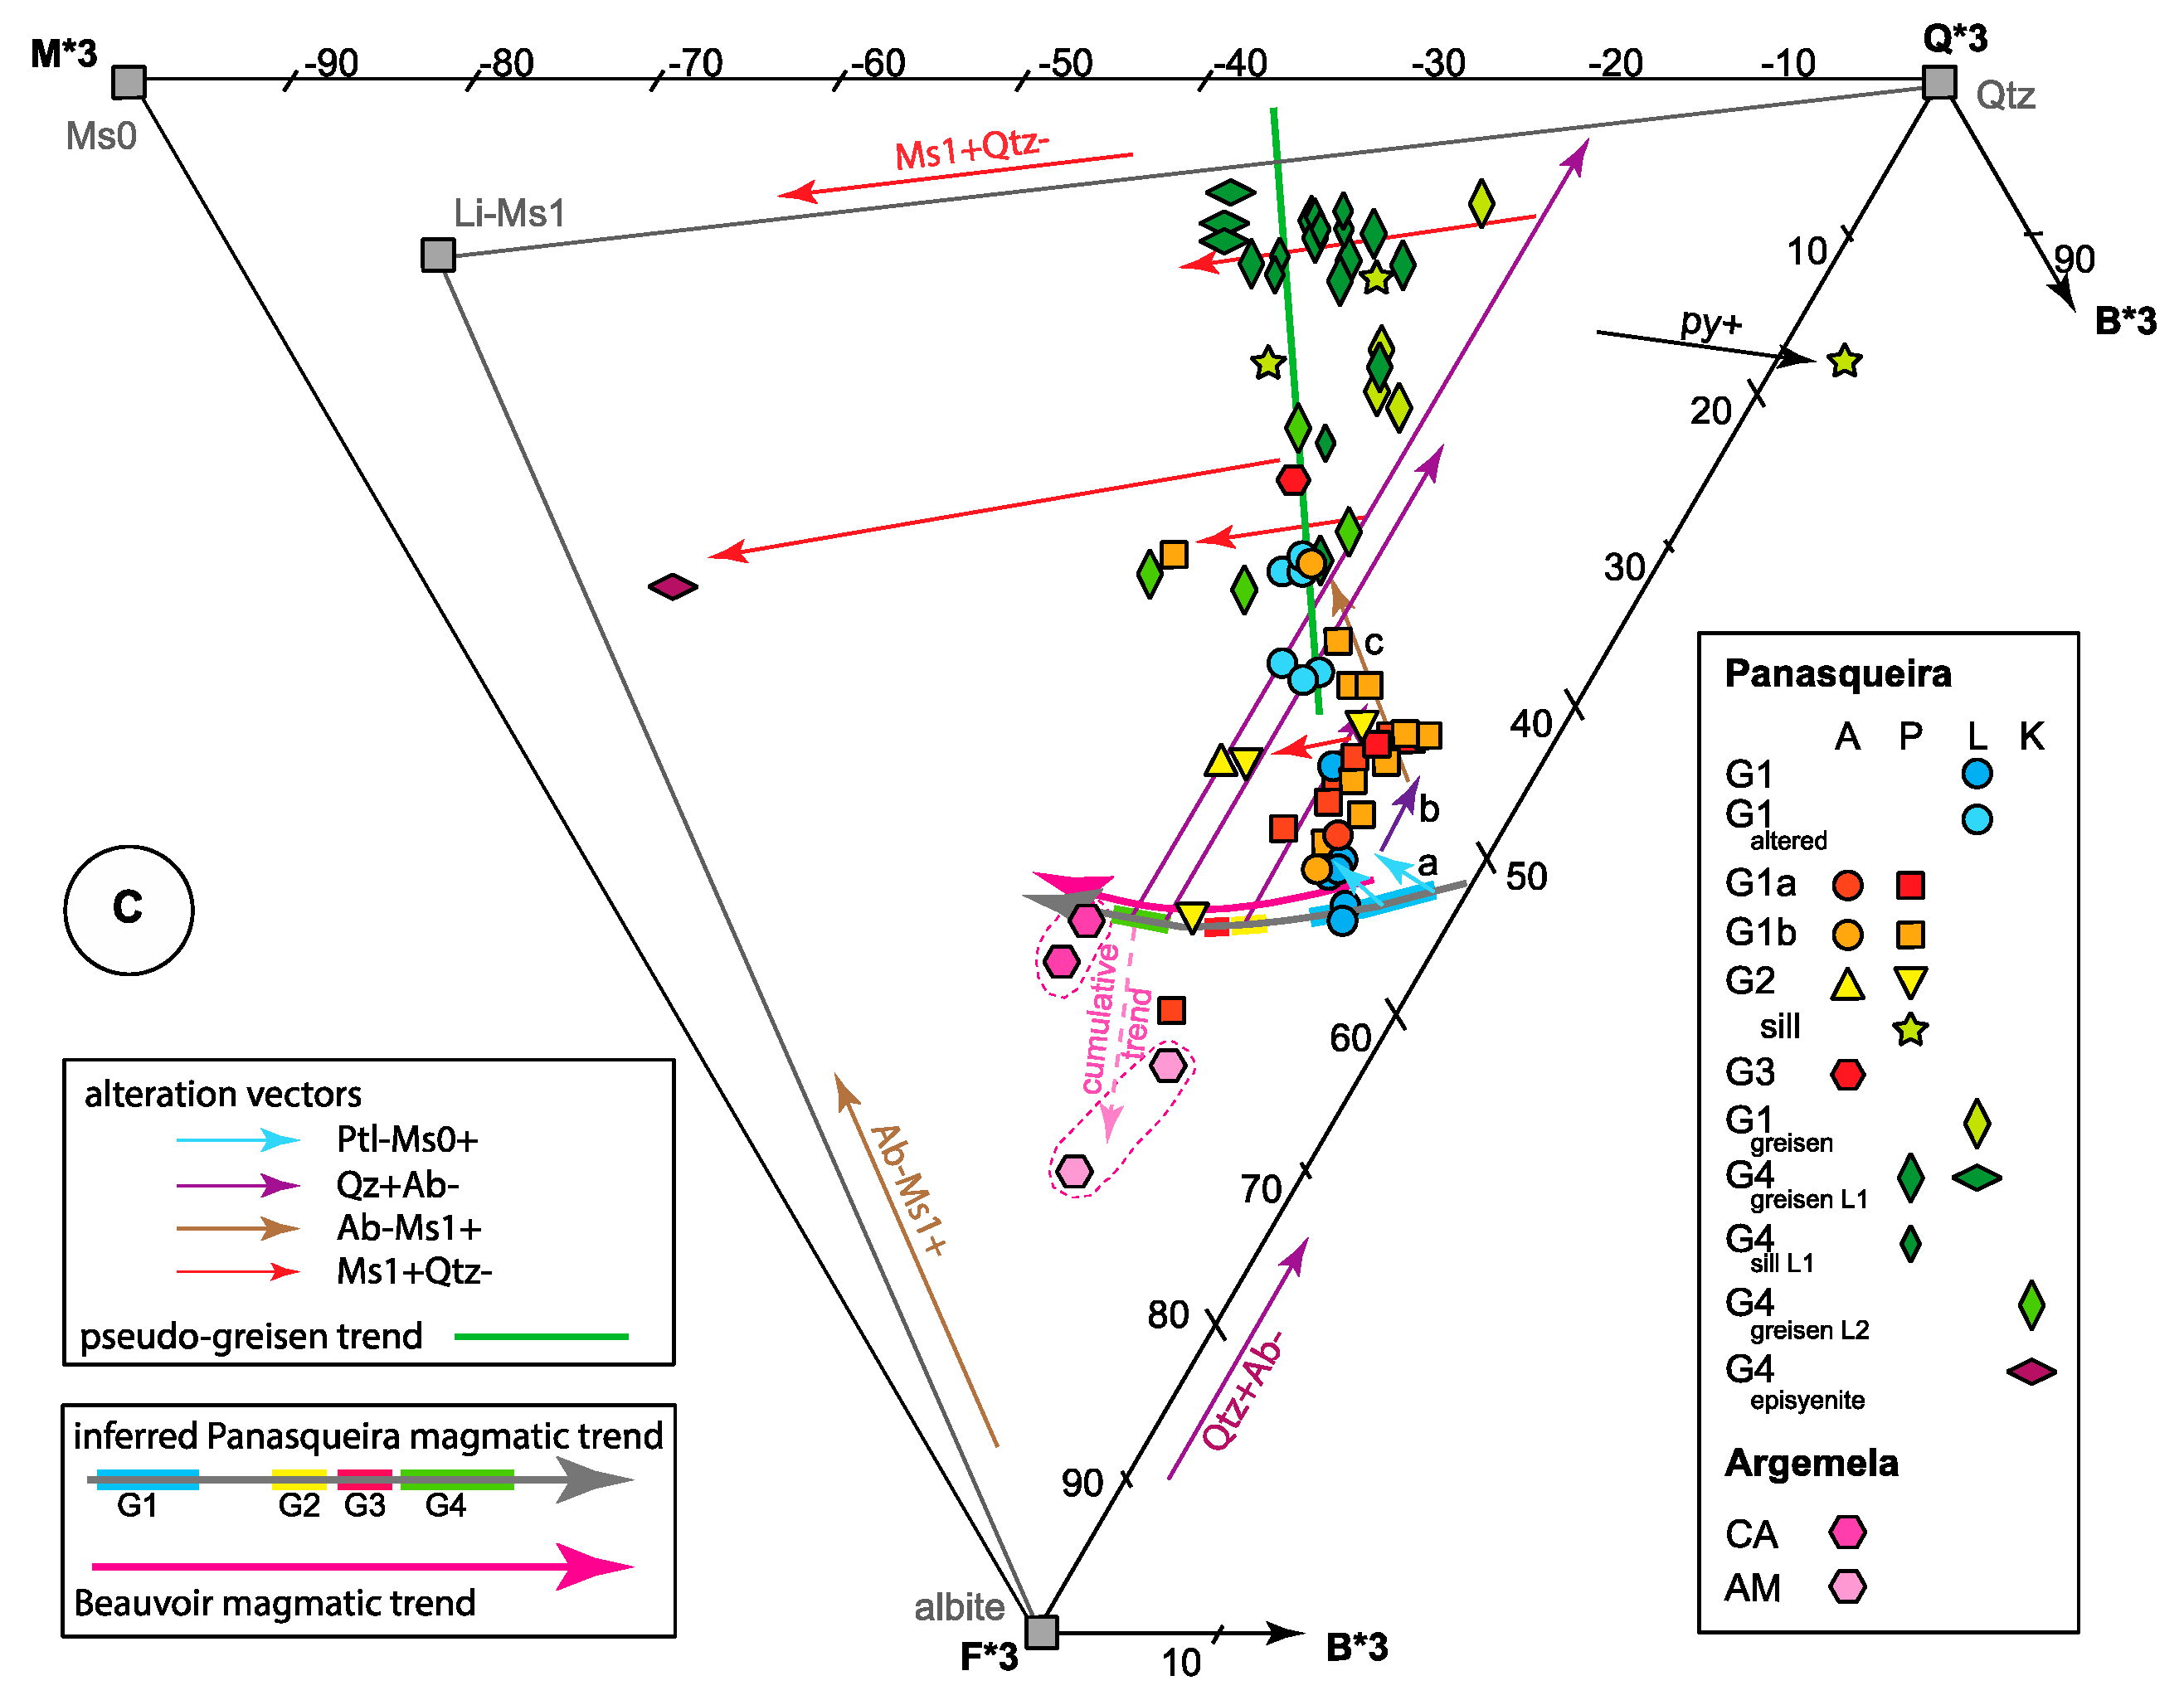
Figure 25.
Disentangling magmatic and alteration trends of the Panasqueira granites and greisens in the appropriate chemical-mineralogical diagrams. The nearby Argemela RMG and the Beauvoir RMG trend are plotted in the same diagrams as a reference. Data from [
15,
16,
17,
18,
57,
58]. Inserts: definition of alteration vectors. Ms0: early muscovite; Li-Ms1: main muscovite; Ms0+ vector: alteration vector corresponding to the early muscovitisation (Ms0 growth); Ms1+ vector: alteration vector corresponding to main muscovitisation (Ms1 growth); Qtz+: alteration vector corresponding to quartzification; Qtz-: alteration vector corresponding to quartz dissolution: Ab-: alteration vector corresponding to albite dissolution. For the construction of all diagrams, the parameters are corrected to take into account both the calcium excess in apatite (for AB and QP diagrams) and the iron excess due to the presence of sulfur (for all diagrams), at least when sulfur analyses are at hand (see
Table S2). Such iron excess is still visible for some analyses plotted in the different diagrams, where it is signaled by a “pyrite +” vector. (
A) Interpretation of the Panasqueira granites and greisens compositions in the A-B diagram (see
File S1 for explanations). In this diagram, where quartz and the feldspars project at the origin, the A parameter is set to represent peraluminosity, whereas the B parameter corresponds to the mafic components. In this diagram, it is much easier to check the effects of muscovite on the alteration trends. It appears that the succession of quartzification and muscovitisation in the G2-G4 suite conducts to a bulk alteration trend, nearly orthogonal to the real greizenisation trends (pseudo-greisen trend), whereas in the G1 suite, the effects of the early muscovitisation (Ms0) are predominant. Inversing the alteration trends allows us to reconstruct a pristine Panasqueira magmatic trend, which appears to be very similar to those of typical RMG of the Beauvoir type. (
B) Interpretation of the Panasqueira granites and greisens compositions in a QP diagram (see
File S1 for explanations). In this diagram, it is particularly evident that the G1 suite is poorly affected by the alterations affecting the G2-G4 suite. Owing to the limited effects of early muscovitisation, the G1 suite still displays a magmatic evolution trend very similar to the less evolved part of the Beauvoir RMG trend. Inversing the process in the greisens allows a prolongation of the trend towards the G2-G4 sequence. (
suite) (
C) Interpretation of the Panasqueira granites and greisens compositions in the Q*3B*3F*3 diagram. In this double triangular diagram, with parameters Q*3 expressing quartz, and F*3, the feldspars, B*3 opposes mafic minerals (the positive values), and peraluminous components (the negative values, expressed as M*3) (see
File S1 for explanations). In this diagram, in the G1 suite, the albite transformation into Li-Ms1 and a limited quartzification become sensitive, both alterations having succeeded in the early muscovitisation (Ms0) (the a-b-c sequence in the diagram). As a consequence, the corresponding alteration trends are aggregated, with the pseudo-greisen trend still prevailing in the G2-G4 suite. Inversing the process allows us to reconstruct the Panasqueira magmatic trend, which, here as in A and B, appears similar to the classical Beauvoir trend.


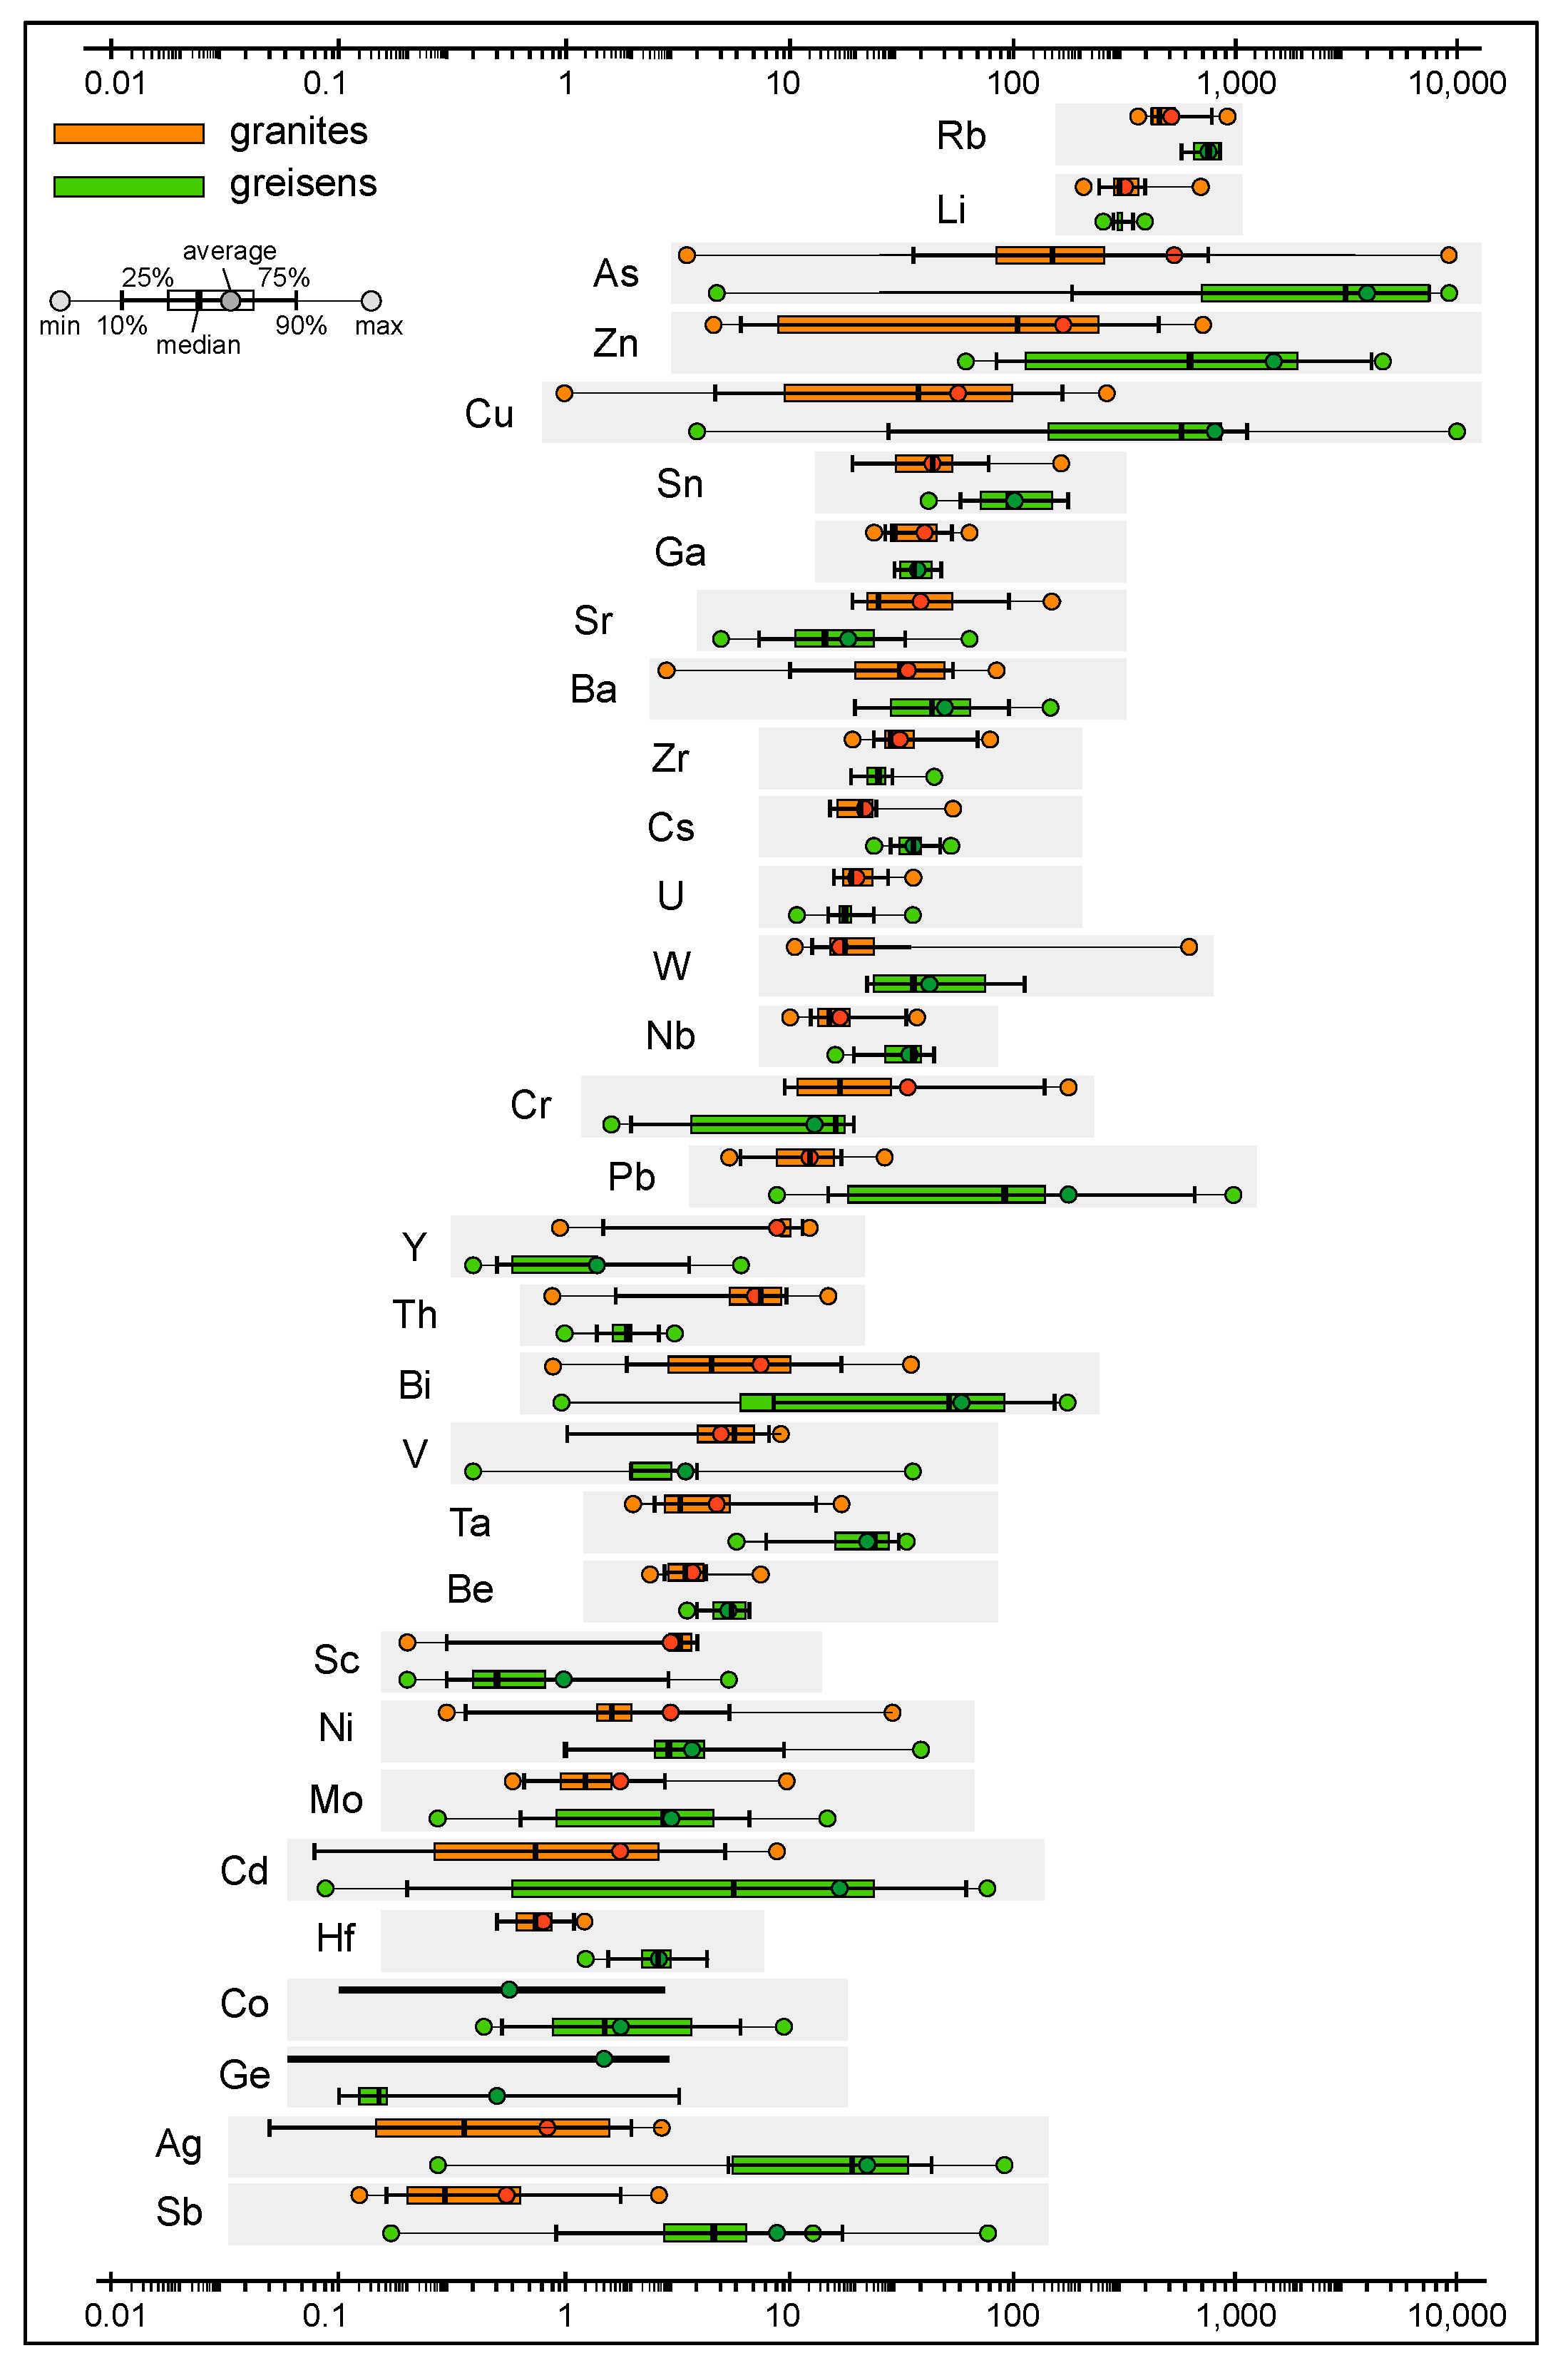
Figure 26.
Box-plot of minor and trace element distribution in the Panasqueira granites and greisens (in ppm, log. scale).
Figure 26.
Box-plot of minor and trace element distribution in the Panasqueira granites and greisens (in ppm, log. scale).
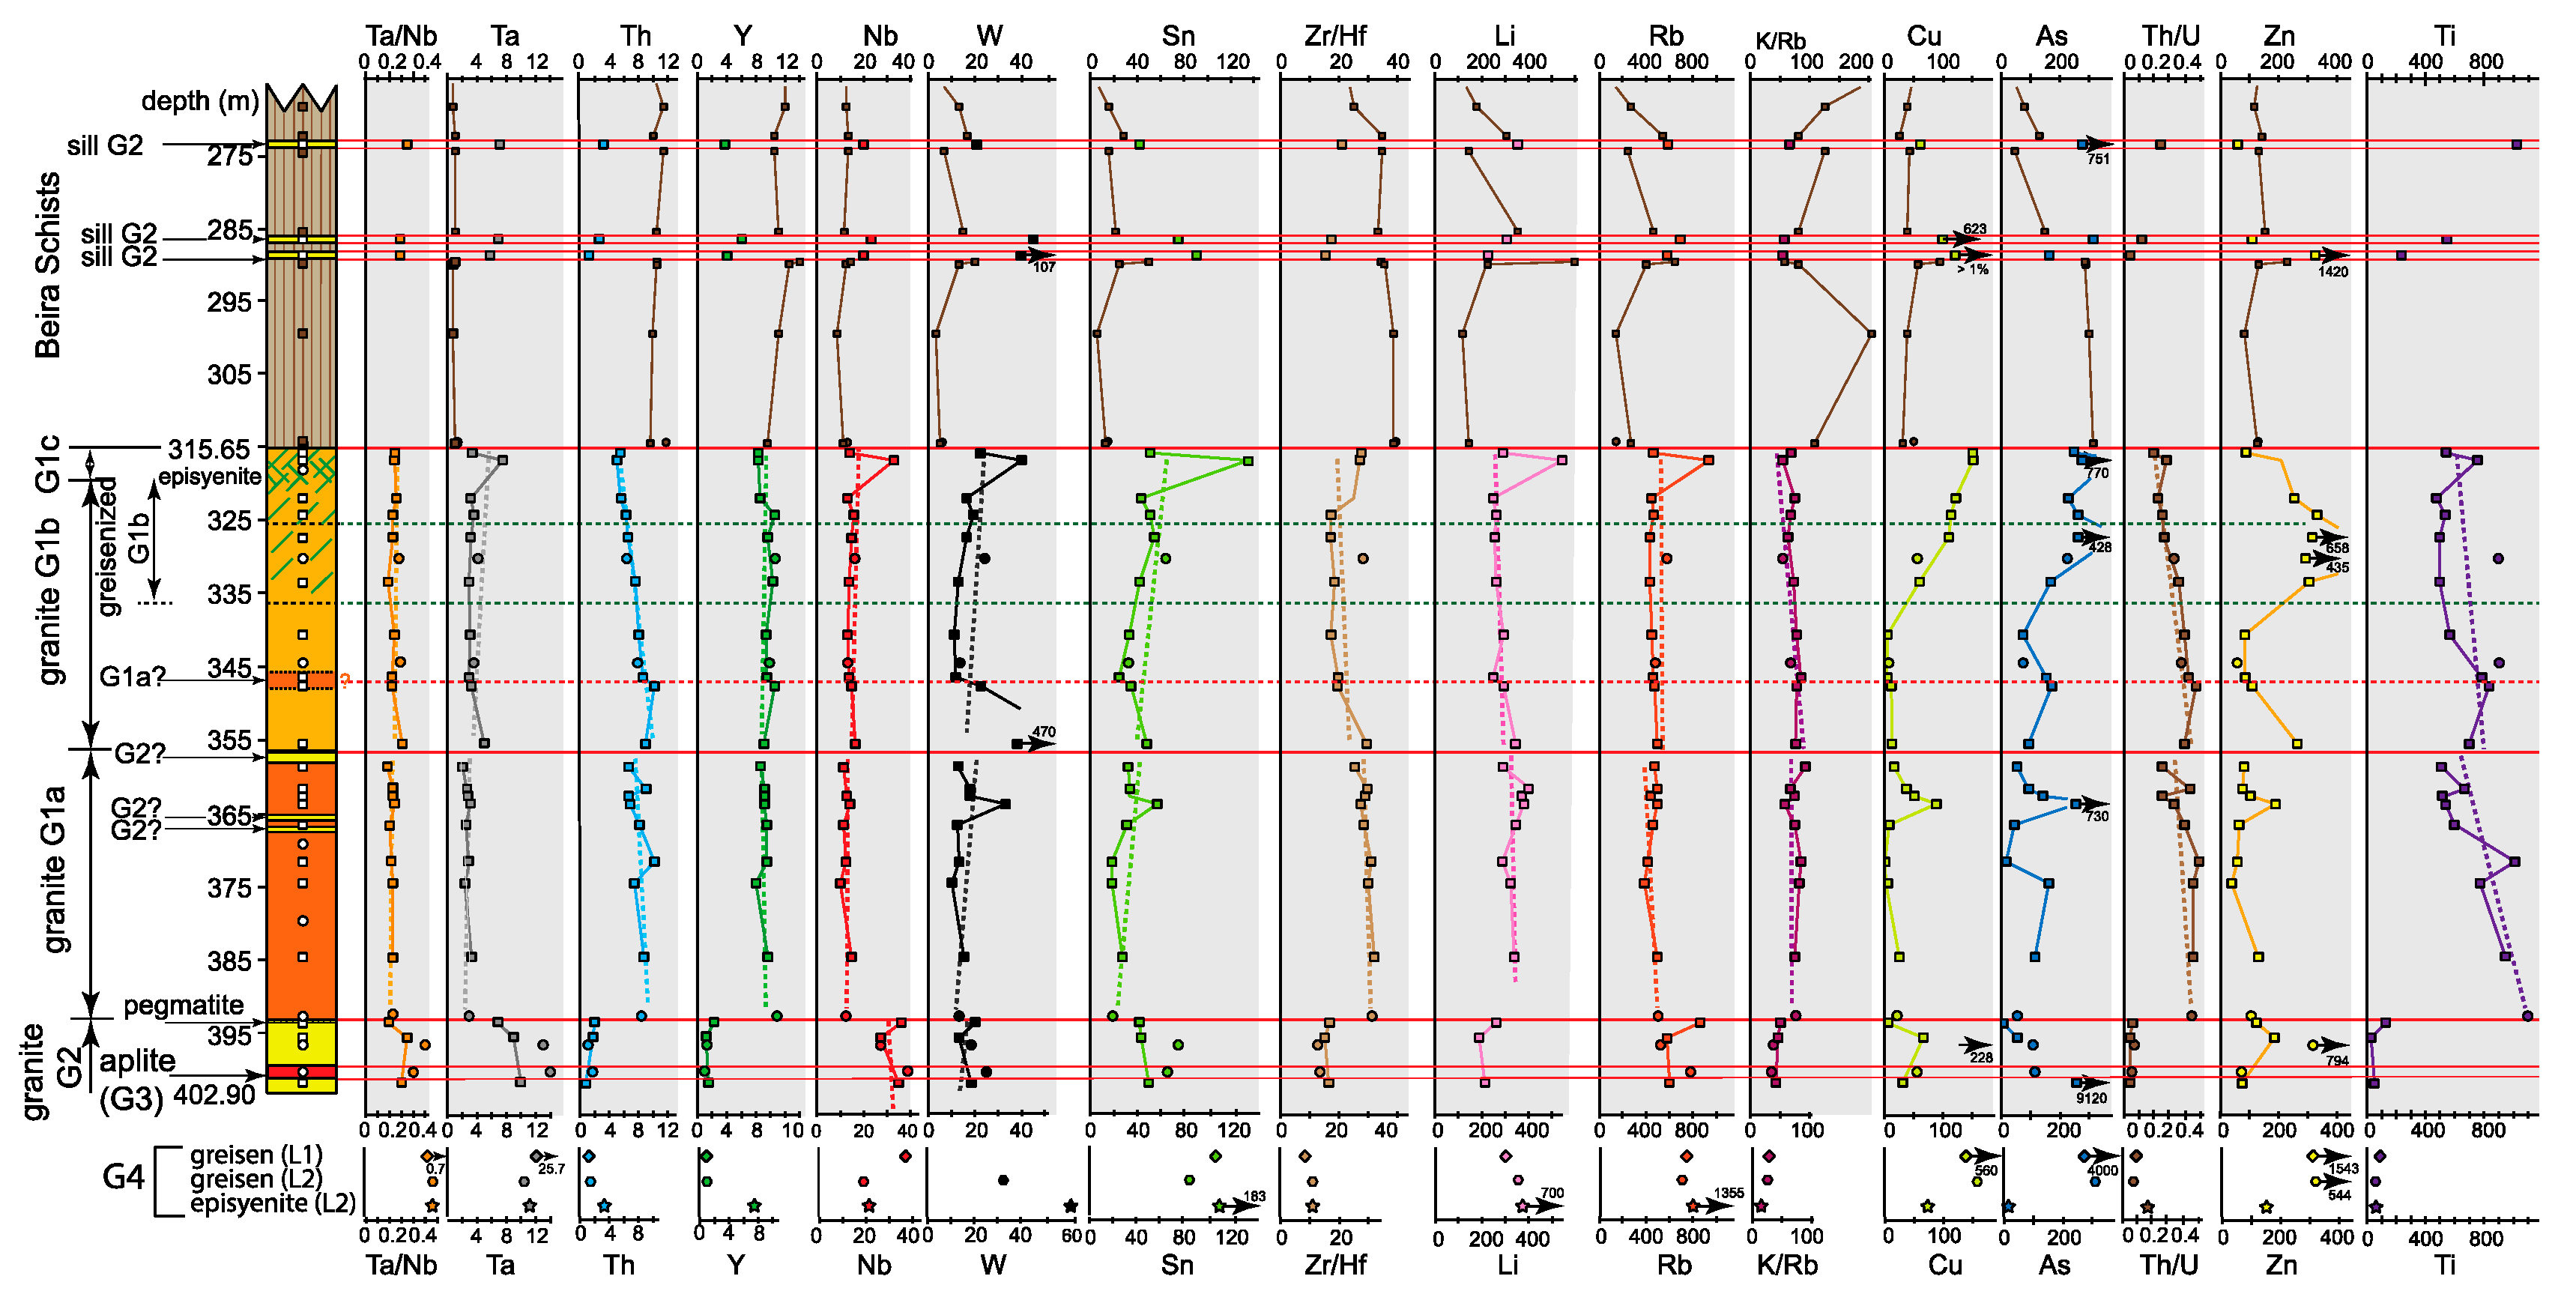
Figure 27.
The SCB2 drill hole: trace element profiles. Data come from [
16,
17]; comparison with the G4 cupola composition: data from [
18,
56] (
Table S5).
Figure 27.
The SCB2 drill hole: trace element profiles. Data come from [
16,
17]; comparison with the G4 cupola composition: data from [
18,
56] (
Table S5).
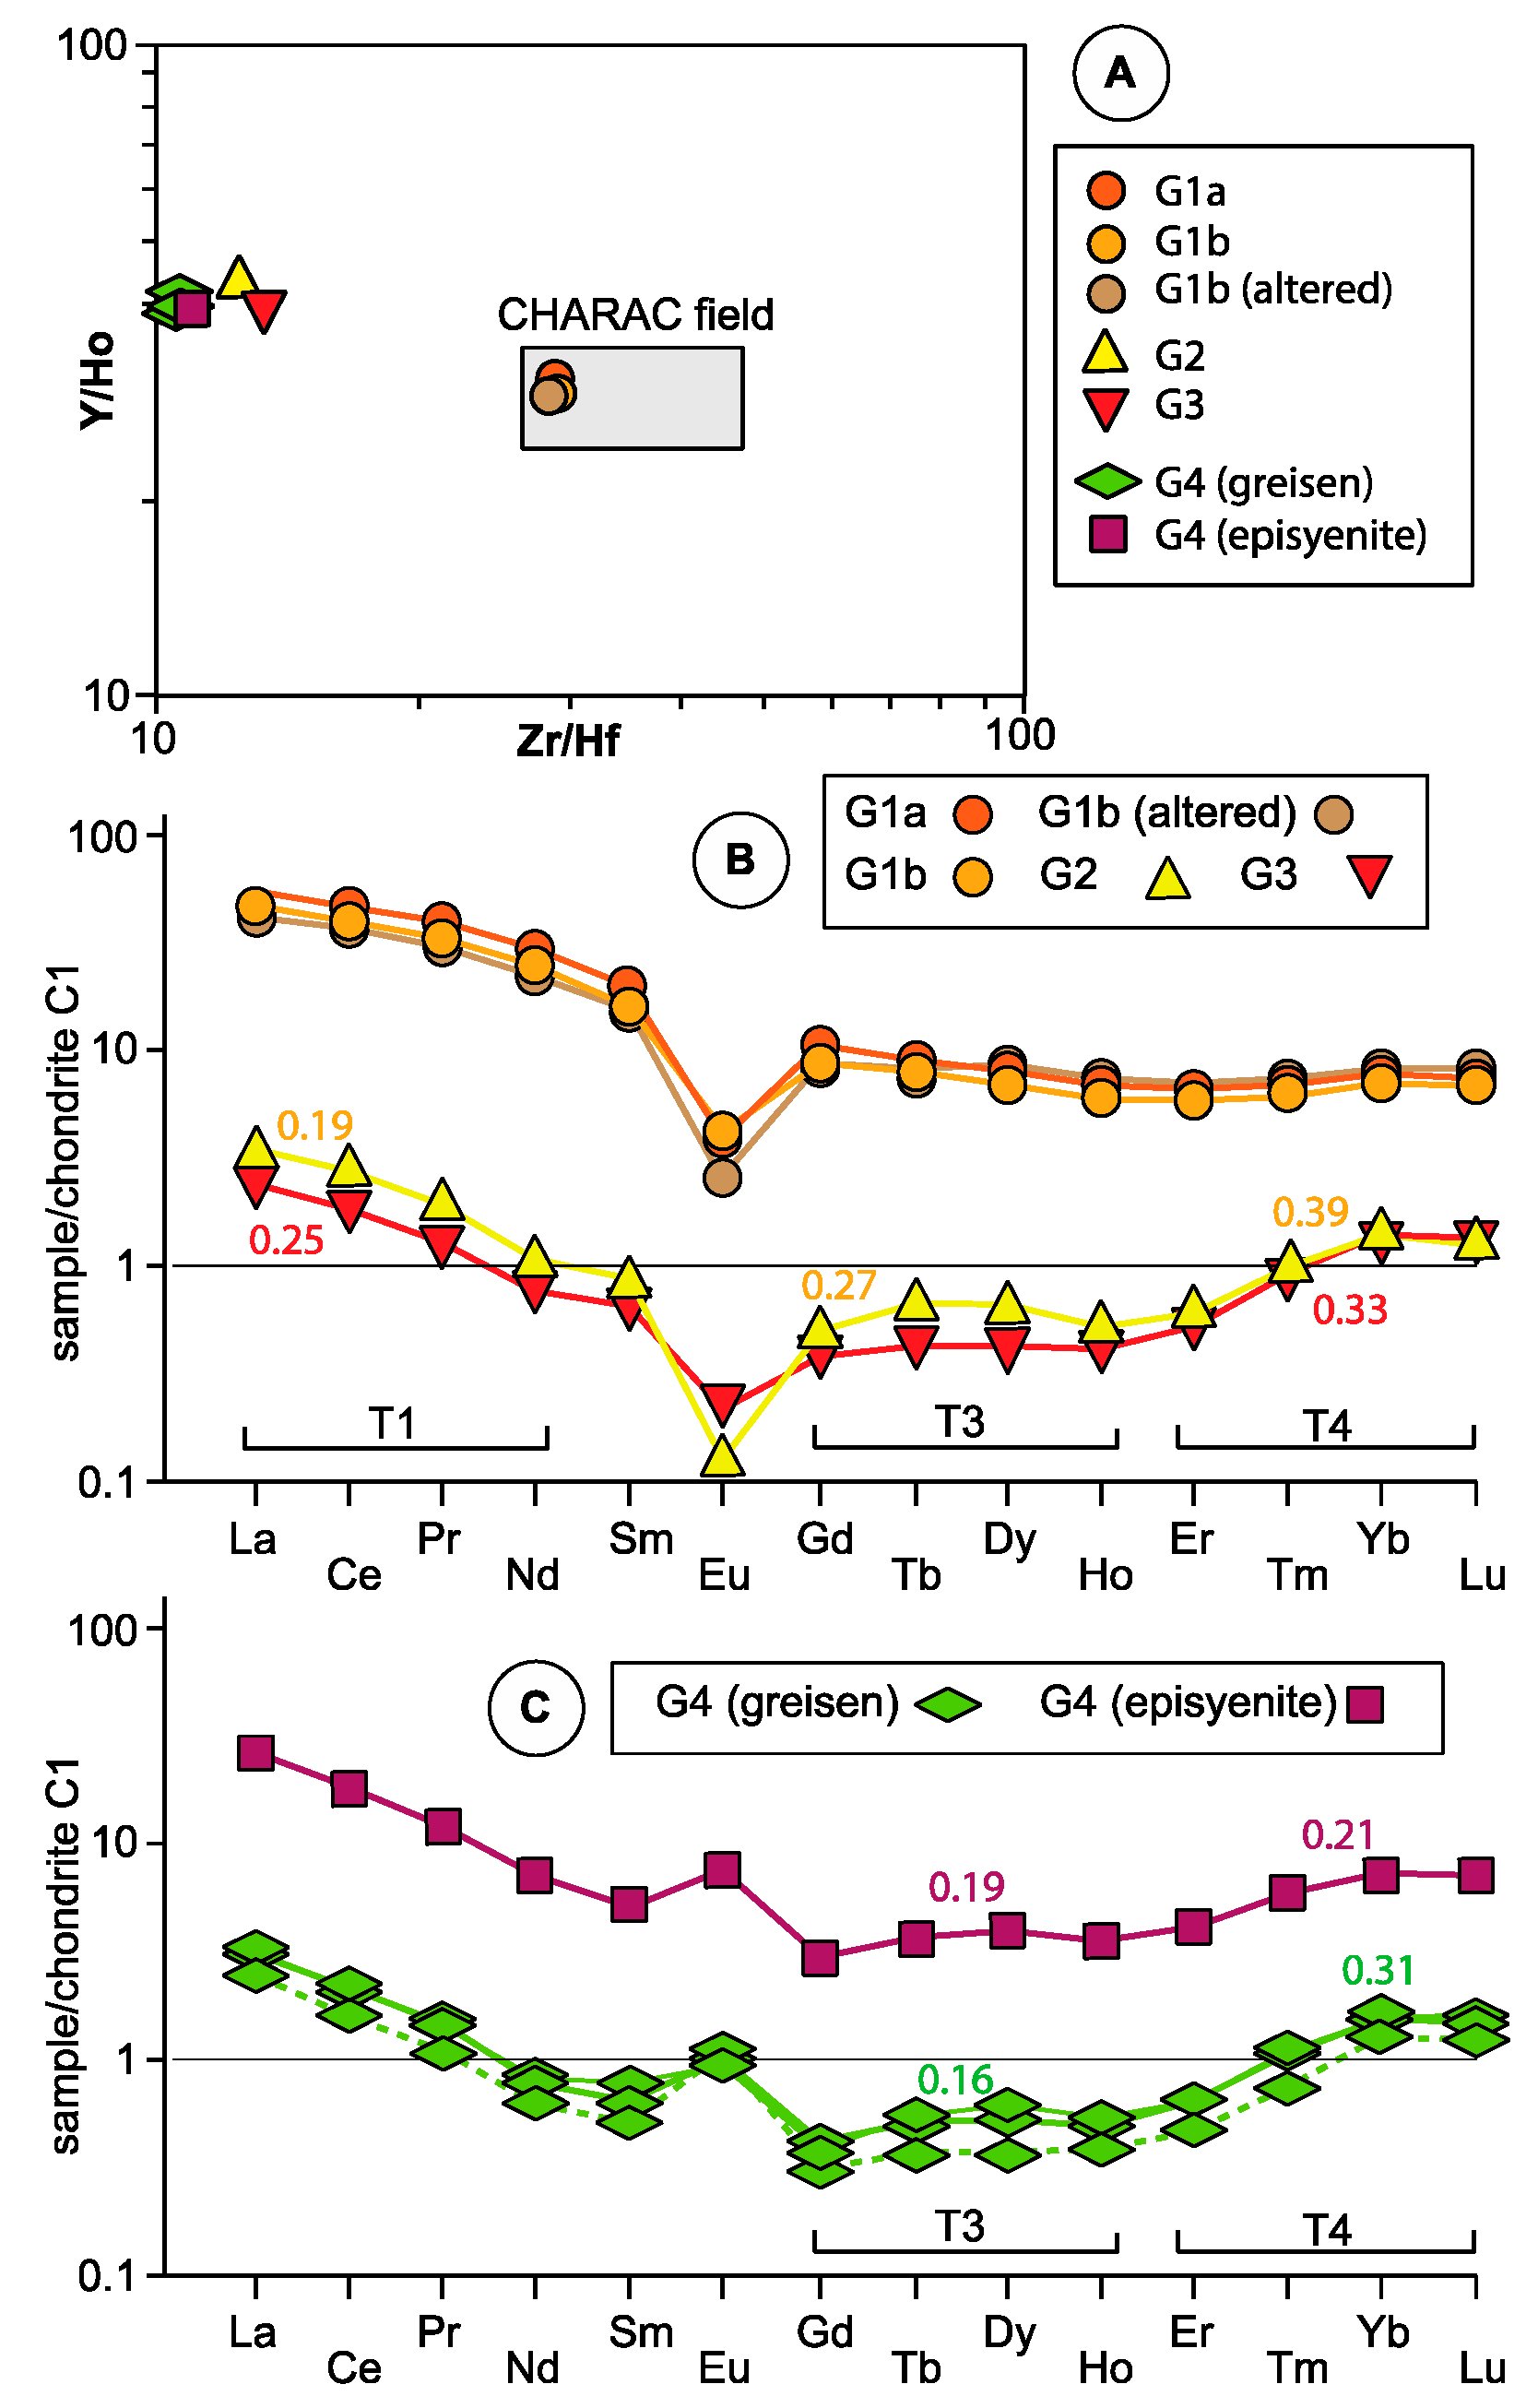
Figure 28.
Patterns of RE variations (normalization to C1 chondrite [
59]. Tetrad effect parameters Ti (i = I, II, III) are calculated following [
60]; the effect is thought significant for Ti ≥ 0.2.
Figure 28.
Patterns of RE variations (normalization to C1 chondrite [
59]. Tetrad effect parameters Ti (i = I, II, III) are calculated following [
60]; the effect is thought significant for Ti ≥ 0.2.
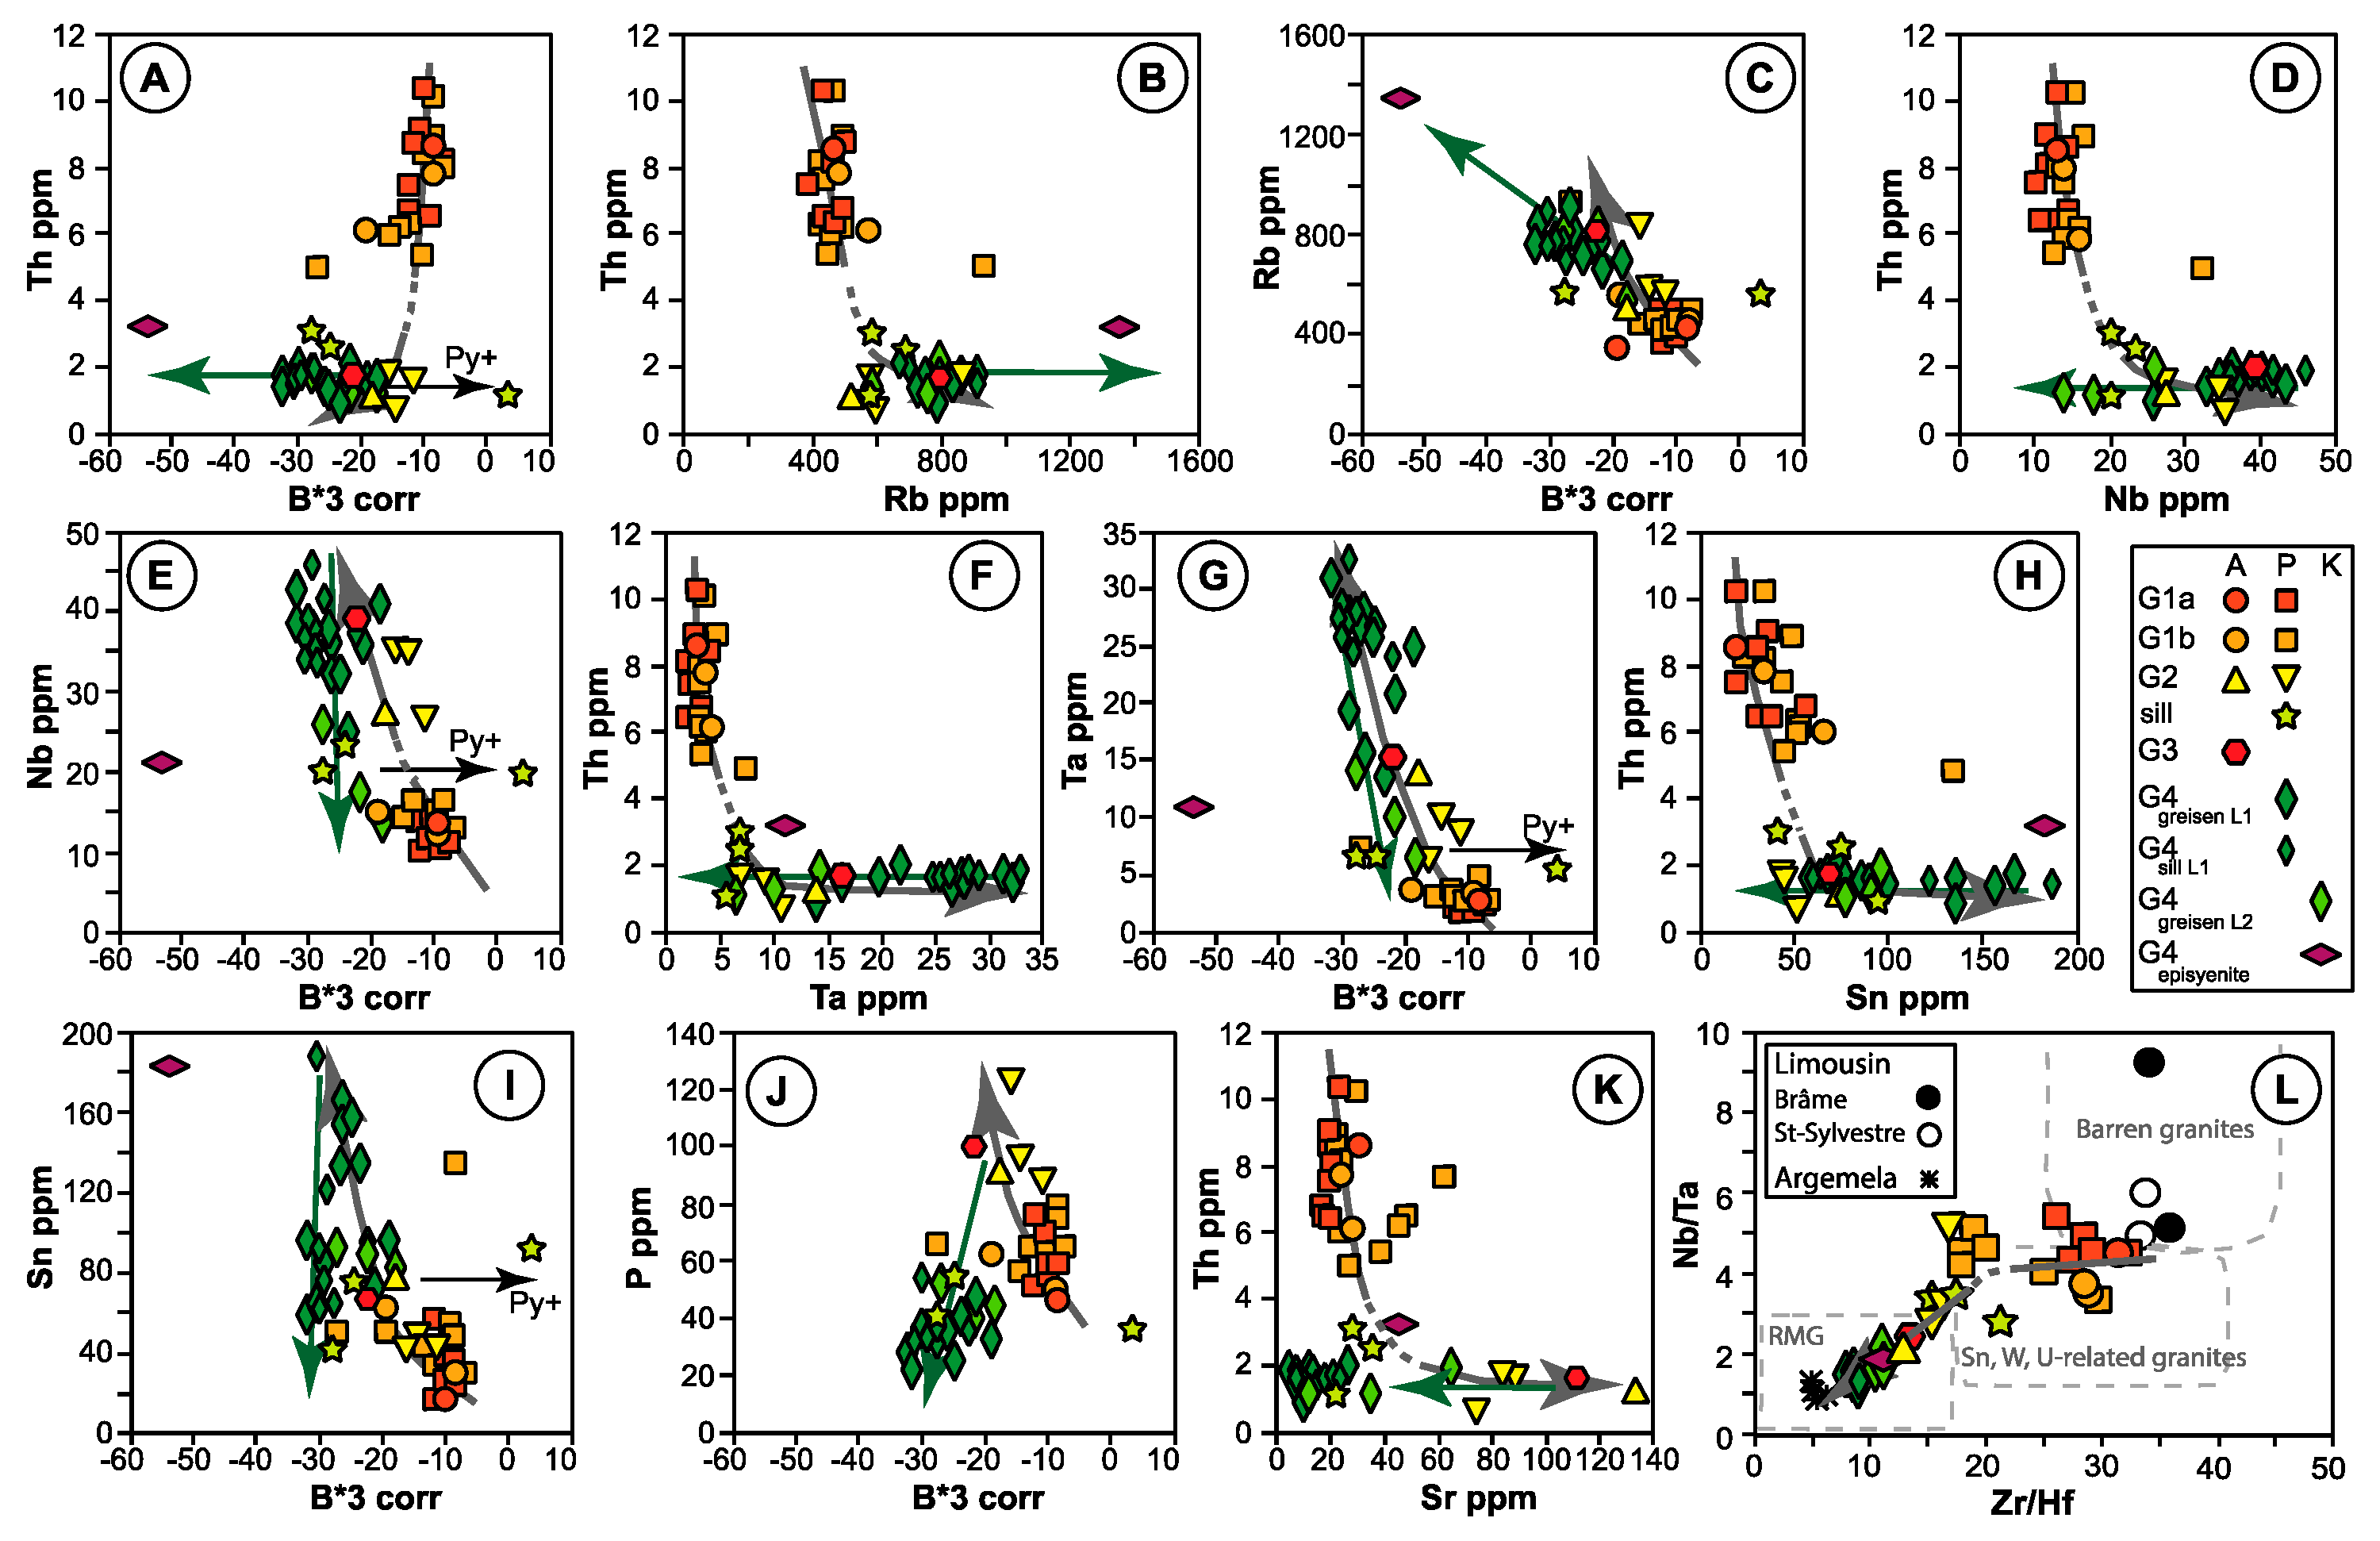
Figure 29.
Disentangling magmatic and alteration trends in the Panasqueira suite using trace elements (
Table S4). Trace element variations are potential markers of the magmatic fractionation: inert element Th, B*3 parameter (from the Q*3B*3F*3 diagram in
Figure 25C), and Nb/Ta and Zr/Hf ratios. Estimated trends: grey arrow, magmatic fractionation trend, green arrow, a hydrothermal trend in the greisenised facies. (
A) Th vs. B*3 diagram, demonstrating that it is effectively possible to disentangle magmatic and alteration trends using these parameters. (
B,
C) Th vs. Rb (B) and Rb vs. B*3 (C) diagrams, showing that greisens are characterized by an increase in Rb contents beyond the values reached in the fractionation process. (
D,
E) Th vs. Nb (D) and Nb vs. B*3 (E) diagrams, demonstrating that greisens are characterized by decreasing contents from the high values reached through the fractionation process. (
F,
G) Th vs. Ta (F) and Ta vs. B*3 (G) diagrams, showing that Ta behaved as Nb in both fractionation and greisenisation processes. (
H,
I) Th vs. Sn (H) and Sn vs. B*3 (I) diagrams, showing the same evolutions as Nb and Ta. (
J) P vs. B*3 diagram, showing that P (as apatite, see
Figure 24), although effectively concentrated throughout the fractionation process, has very efficiently leached out the more evolved facies by the alteration process. (
K) Th vs. Sr diagram, showing that Sr (being mainly sequestered into apatite) behaves just as P. (
L) Nb/Ta vs. Zr/Hf diagram, very efficiently displaying the full fractionation sequence of the Panasqueira suite (G1a-G1b-G2-G3-G4). Comparison with reference granites shows that G4 is a true RMG (very similar to the nearby Argemela RMG).


 ,
, 


