Abstract
Eastern Tianshan hosts a number of porphyry Cu deposits. However, these mainly formed in the Jueluotage Belt, in the middle part of Eastern Tianshan. The Tonggou porphyry Cu mineralization is an exception to this, since it is located in the Bogda Orogenic Belt, north of Eastern Tianshan. We obtained new zircon U-Pb ages, whole-rock geochemical data, zircon Hf isotope data, and zircon trace element compositions. LA-ICP-MS zircon U-Pb dating indicates a crystallization age of 302.2–303.0 Ma for the Tonggou mineralized granodiorite (TMG), which suggests that the Tonggou porphyry Cu mineralization formed in the Late Carboniferous period. εHf (t) data (1.8–14.1) for TMG suggests it was sourced from juvenile crustal melts, mixed with some mantle materials. TMG displays low ΣREE, compatible elements (Ba, Sr, Zr, and Hf), Zr/Hf and Nb/Ta ratios, as well as clearly negative Eu anomalies in whole rocks analyses. In addition, TMG is enriched in P, Hf and Th/U ratios in zircon, and has lower crystallization temperatures (734 to 735 °C) than the Daheyan barren granodiorite (DBG) (753 to 802 °C). Whole rock and zircon geochemical analyses show that the TMG was formed by fractional crystallization to a greater extent than the DBG in the Bogda Orogenic Belt. Moreover, zircon grains of the TMG show high Ce4+/Ce3+ ratios (159–286), which are consistent with related values from large porphyry deposits of the Central Asian Orogenic Belt (CAOB). High Ce4+/Ce3+ ratios reflect oxidizing magmas as a result of fractional crystallization, which indicates that the Tonggou deposit has potential to host a large porphyry Cu deposit.
1. Introduction
Porphyry Cu systems provide ~75% of global copper production and a set amount of co- or by-product Mo, Au, Pb and Zn [1,2]. Porphyry Cu is one of the most important metallogenic systems, and has attracted the attention of many economic geologists [3,4,5,6]. These systems always form in association with magmatism at subduction and collision setting [6,7,8]. The high water content and the oxidation state of magmas in these settings lead to mobilizing metals such as Cu partitioned into exsolved hydrothermal fluids and reprecipitated upon cooling to form porphyry Cu deposits [9,10]. Higher oxygen fugacity favors the transport of metals and S from the mantle to shallow crustal levels, the former being an important factor that restricts the formation of porphyry deposits [1,4,6,10]. In addition, the fertility of magmas is always connected with a high water content, since the latter determines whether a magmatic–hydrothermal system will form or not [11].
Estimates for initial water content in primary arc magmas typically range from 1 to 3 wt.% H2O [12]. However, fractional crystallization can increase water content by ~4 wt.% H2O [9]. Intrusions associated with porphyry Cu deposits worldwide are typically highly fractionated [13]. Thus, fractional crystallization can also be an indicator of the potential of any given intrusion for porphyry deposit formation [9,14]. Evidence for fractional crystallization can be found in Zr/Hf, Nb/Ta, and REE values in whole rock [15,16], as well as in high P and Hf values and high Th/U ratios in zircon [17,18,19,20,21].
Zircon is one of the most common accessory minerals and the most abundant in the majority of intermediate-to-felsic intrusions [22]. It is an exceptionally robust mineral that retains its primary chemical characteristics and provides information on oxygen fugacity of parental magmas. Recent studies of porphyry copper deposits include trace element analyses of zircon to constrain the oxidation conditions of magmas, especially since elevated Ce/CeN* and Eu/EuN* values are both useful as indicators of oxidizing magmatic conditions [23,24,25]. Moreover, the Ce4+/Ce3+ ratio in zircon has been proposed as a potential tool to identify redox conditions, which may be useful for exploration vectoring of porphyry Cu deposits [26,27,28,29,30,31,32,33,34].
Eastern Tianshan has a number of porphyry Cu deposits, mainly located in the Jueluotage Belt [35,36,37]. However, porphyry Cu mineralization has been discovered in the Tonggou deposit, which is the first porphyry Cu mineralization found in the Bogda Orogenic Belt. This study presents zircon U-Pb ages, whole-rock geochemical analyses, zircon Hf isotopes and trace element data for the Tonggou mineralized granodiorite (TMG) and Daheyan barren intrusions (DBG) of the Bogda Orogenic Belt. We use the U-Pb age of TMG to define the timing of porphyry Cu mineralization at Tonggou. In addition, we examine the Ce4+/Ce3+ ratio in zircon and compare fractionation with geochemistry data from the TMG and TMG. This allows us to assess the effectiveness of whole rock and zircon geochemistry as a pathfinder for porphyry copper deposits.
2. Geological Setting
Eastern Tianshan is located in the eastern part of the Chinese Tianshan Belt, bordered by the Junggar Block to the north and the Precambrian Tarim Block to the south (Figure 1, [38]). In Paleozoic to Triassic times, this belt witnessed the evolution and closure of the Paleo-Asian Ocean [39,40,41,42], and experienced multiple subduction, collision, and mineralization events [43]. The area of Eastern Tianshan can be divided from north to south into the Bogda-Harlik Orogenic Belt, the Jueluotage Belt, and the Central Tianshan massif [44]. The Jueluotage Belt, located between the Bogda-Harlik Orogenic Belt and the Central Tianshan massif, is comprised of Paleozoic marine sedimentary rocks and felsic to mafic volcanic rocks, as well as late Paleozoic felsic and mafic-ultramafic intrusions [45]. The Central Tianshan massif, located south of the Jueluotage Belt, mainly consists of basement Precambrian gneiss [46].
The Bogda-Harlik Orogenic Belt, situated north of the Turpan-Hami basin, consists of Devonian-Permian volcanic rocks, sedimentary rocks, granitoids, and mafic-ultramafic complexes [47]. Compared to the Harlik Belt in the east or the Jueluotage Belt in the south, the intermediate-to-felsic intrusions occur sporadically in the Bogda Orogenic Belt (Figure 1b). Based on their zircon U-Pb ages, intermediate-to-felsic intrusions in the Bogda Orogenic Belt mostly formed in the Late Carboniferous [48,49,50,51] and Early Permian [52,53]. Late Carboniferous intermediate-to-felsic intrusions consist of diorite, syenogranite, granodiorite and granite [50,51]. Early Permian intermediate-to-felsic intrusions include diorite, monzogranite and granite [53].
Several epithermal gold deposits are hosted in the Harlik Belt [54]. However, mineralization in the Bogda Orogenic Belt is characterized by a series of Cu polymetallic vein deposits, such as the Tonggou, Weicaogou, and Miao’ergou deposits (Figure 1c, [55]). In addition, porphyry Cu mineralization has been discovered at the Tonggou deposit [56]. Re-Os and U-Pb isotopic ages indicate that the Tonggou porphyry and vein Cu polymetallic mineralizations both formed in the Late Carboniferous period (302–303 Ma, [55], this study).

Figure 1.
(a) Schematic geologic map of the Central Asian Orogenic Belt (CAOB); (b) geological map of Eastern Tianshan [38]; (c) geological map of the mineralized district in the Tonggou-Miao’ergou area [57].
3. Ore Deposit
The Tonggou deposit is located 44 km southeast of Urumqi, and belongs to the Bogda Orogenic Belt (Figure 1c). Both porphyry Cu and vein Cu–Zn mineralization occurs at the Tonggou deposit. Porphyry Cu mineralization is associated with TMG that was emplaced into the Early Carboniferous Qijiaojng Formation. The disseminated and stockwork veins of Cu mineralization occur at the top or contact zone of TMG (Figure 2a,b). The porphyry Cu mineralization is accompanied by potassic and propylitic alteration (Figure 2c). The mineral assemblages of the ore bodies mainly include pyrite, magnetite, hematite, and chalcopyrite (Figure 2d–f). Hematite–magnetite intergrowths were found in Tonggou porphyry mineralization, which suggests that Tonggou deposit formed under oxidizing conditions. The aforementioned TMG was sampled for the present study.
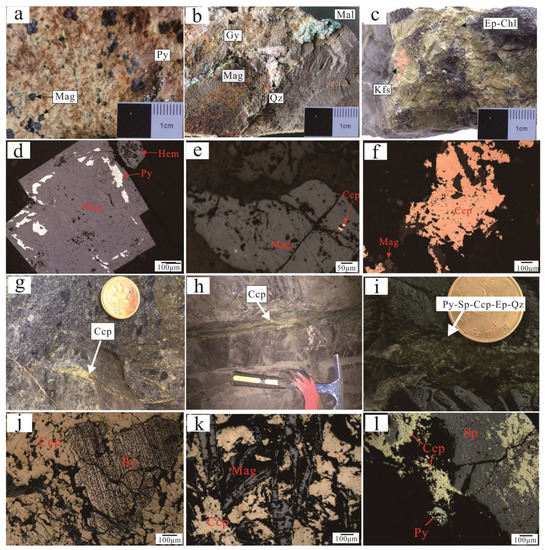
Figure 2.
Photographs showing the ore from the Tonggou porphyry and vein mineralization. (a) disseminated pyrite and magnetite occurring in Tonggou mineralized granodiorite (TMG); (b) stockwork magnetite–malachite–quartz vein from porphyry mineralization; (c) potassic and propylitic alteration from porphyry mineralization; (d) early pyrite replaced by magnetite showing a metasomatic relict texture from porphyry mineralization; (e) disseminated chalcopyrite occurring in magnetite from porphyry mineralization; (f) allotriomorphic magnetite and chalcopyrite from porphyry mineralization; (g) chalcopyrite veinlets from vein mineralization; (h) sulfide ore vein from vein mineralization; (i) pyrite–chalcopyrite–sphalerite–epidote–quartz assemblages from vein mineralization; (j) euhedral pyrite replaced by allotriomorphic chalcopyrite from vein mineralization; (k) allotriomorphic chalcopyrite and leaf-shaped magnetite; (l) allotriomorphic pyrite, chalcopyrite and sphalerite from vein mineralization; Abbreviations: Mag = Magnetite, Py = Pyrite, Ccp = chalcopyrite, Sp = Sphalerite, Gy = Gypsum, Qz = Quartz; Chl = chlorite; Ep = epidote; Kfs = K-feldspar.
Vein Cu–Zn mineralization occurs in the Qijiaojing Formation as veinlet, stratiform, lenticular, and vein-shaped ore bodies, the shape and size are fault-controlled (Figure 2g,h). Vein mineralization contains 36 economic ore bodies, which are currently sources of Cu and Zn [55]. Vein Cu–Zn ore is associated with propylitic alteration (Figure 2i). The mineral assemblages of the ore bodies mainly include pyrite, magnetite, chalcopyrite, and sphalerite (Figure 2j–l), with minor amounts of hematite, galena, and bornite.
4. Methods
4.1. Sample Preparation
We collected TMG and DBG samples from the Tonggou deposit and Daheyan area, respectively. The TMG displays a medium- to fine-grained texture, a massive structure (Figure 3a), and contains quartz (15%), plagioclase (67%), alkali-feldspar (10%, including orthoclase and perthite), hornblende (5%) and biotite (3%) (Figure 3b). Due to hydrothermal alteration, plagioclase has undergone epidotization, and hornblende and biotite are chloritized. On the other hand, the DBG commonly shows a subhedral and allotriomorphic texture, as well as a massive structure (Figure 3c). It consists of quartz (10%), plagioclase (77%), alkali-feldspar (6%, including orthoclase and perthites), chlorite (4%) and biotite (2%) (Figure 3d).
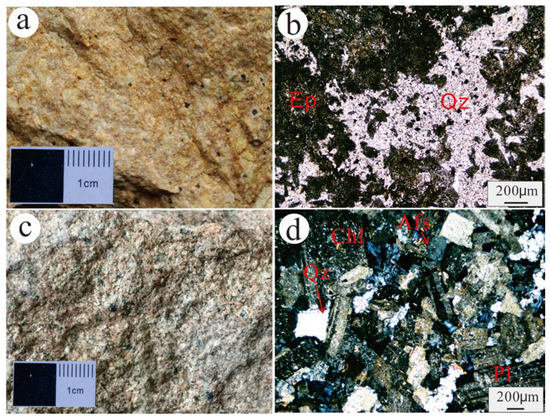
Figure 3.
Representative photographs of the intrusions in hand specimen and thin-section. (a,b) Granodiorite from the Tonggou deposit; (c,d) granodiorite from the Daheyan area.
4.2. Analytical Methods
Zircon U-Pb ages were determined for granodiorite sample from the Tonggou deposit. The samples were crushed, zircon grains were extracted, and cathodoluminescence (CL) images were generated at the Faith Geological Service Company, Langfang, Hebei province, China. U-Pb-Hf isotopic and trace element analyses of the zircons were performed at Wuhan Samplesolution Analytical Technology Co., Ltd., Wuhan, China. Zircon grains were mounted on epoxy blocks and polished to expose grain centers. CL images are shown in Figure 4. U-Pb dating, Hf isotopic and trace element analyses of zircons were obtained using an Agilent 7700e inductively coupled plasma (ICP) mass spectrometer (MS) and a GeolasPro laser ablation system. 206Pb/238U ratios were calculated by ICPMSDataCal [58,59], while concordia diagrams and weighted mean calculations were made using Isoplot 3.0 [60]. In order to better control analytical uncertainty and to assure instrument stability, an internal standard zircon GJ-1 (603 ± 3 Ma) and external standard zircon 91500 (1064 ± 4 Ma) were carried out for twice and once before and after every six analyses of unknown samples, respectively. Uncertainties are quoted at 1σ for individual U-Pb dating and trace element analyses and at 2σ (with 95% confidence level) for Hf isotopic analyses, respectively.
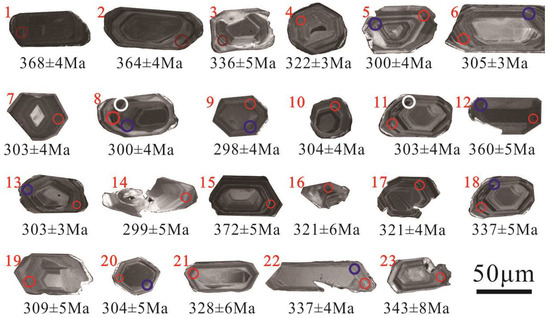
Figure 4.
Cathodoluminescence (CL) images of zircon from Tonggou mineralization granodiorite (TMG), showing analytical spots and corresponding ages. Red circles represent analytical spots of U-Pb dating, blue circles represent analytical spots of Hf isotope, white represents analytical spots of trace elements.
The major and rare earth element compositions of four TMG samples were measured and analyzed at ALS Minerals-ALS Chemex, Guangzhou, China. The samples were crushed in a steel jaw crusher and then powdered to 200 mesh in an agate mill. Major-element compositions were analyzed using ME-XRF06 X. Trace element compositions were analyzed using ICP–AES and ICP–MS (ME-MS61 and ME-MS81), respectively. The analytical results for the Chinese standard GDW07104 indicated that the analytical precision was better than 5% for major elements and 10% for trace elements and REEs [61].
5. Results
5.1. Zircon LA-ICP-MS U-Pb Ages
Zircons from the TMG exhibit oscillatory or planar zoning under CL and have Th/U ratios ranging from 0.39 to 2.00, consistent with a magmatic origin [62]. U-Pb dating results for 23 zircons, collected from TMG (sample TG1), are listed in Table 1. The 206Pb/238U ages can be divided into two sets. One group has 206Pb/238U ages ranging from 298 to 305 Ma, and ten analyses plots of Tera–Wasserburg concordia intercept ages at 303.0 ± 3.3 Ma (MSWD = 0.53; Figure 5a), with a mean of 302.2 ± 2.5 Ma (MSWD = 0.38; Figure 5b); this represents the crystallization age (302.2–303.0 Ma) of the TMG. In addition, other samples have 206Pb/238U ages ranging from 309 to 372 Ma, which represent the crystallization age of zircons captured or entrained from the wall rock during magma ascent. Moreover, the U-Pb age of the TMG is consistent with that of the DBG [51], and both are associated with Late Carboniferous magmatism.

Table 1.
LA-ICP-MS U-Pb data on zircons from the Granodiorite.
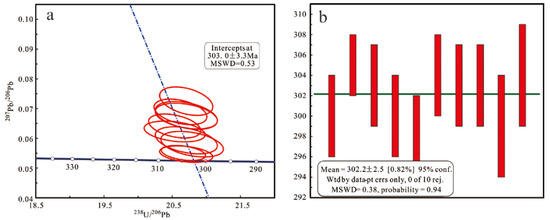
Figure 5.
(a) Zircon concordia diagram for granodiorite samples from Tonggou deposit; (b) weighting diagram for granodiorite samples from Tonggou deposit.
5.2. Whole-Rock Geochemistry
Samples of TMG show high SiO2 (68.58–70.85; Table 2), low K2O and Na2O contents due to epidotization and chloritization (molar K2O/Al2O3 and Na2O/Al2O3 < 0.01; Chlorite-Carbonate-Pyrite Index > 95) [63,64]; this is consistent with geological evidences of Tonggou porphyry Cu mineralization (Figure 3c). The Zr/TiO2 vs. Nb/Y content of most samples in the fields of granodiorite is shown on a discrimination diagram for the TMG (Figure 6).
Table 2.
Major (%) and trace element (ppm) data for the Tonggou granodiorite.
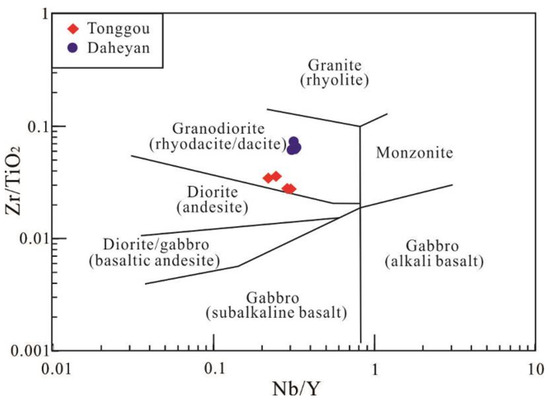
Figure 6.
Zr/TiO2 vs. Nb/Y of Tonggou and Daheyan samples following the classification in the literature [65,66]. Partial data for Daheyan granodiorite cited from [51].
TMG samples display a narrow range of ΣREE values (89.41–102.06 ppm), LREE values vary from 75.96 to 89.22, and HREE values range from 12.84 to 13.47. The samples of TMG are enriched in LREE and depleted in HREE (LREE/HREE = 5.64–6.95; (La/Yb)N = 5.24–9.82), and show weak negative Eu anomalies (Eu/EuN* = 0.76–1.02) on the chondrite-normalized REE diagram (Figure 7a; Table 2). The primitive-mantle-normalized trace-element diagram indicates that the TMG is enriched in incompatible elements (e.g., Th, U, and Zr) and some LILEs (e.g., Sr), as well as depleted in HFSEs (e.g., Ta, Nb and Ti) (Figure 7b).
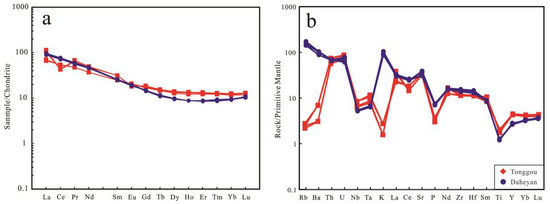
Figure 7.
(a) Chondrite-normalized REE pattern; (b) primitive-mantle-normalized spider diagrams from whole rocks analyses. Chondrite and primitive mantle values used for normalization are from [67,68], respectively. Partial data for Daheyan granodiorite cited from [51].
5.3. Hf Isotopes
In situ Hf isotopic compositions of zircon from the TMG are listed in Table 3. The nine analyses obtained from samples of the TMG show 176Hf/177Hf ratios of 0.2826–0.2830, and have εHf(t) values varying from +1.9 to +14.1 (with an average of 8.6). The corresponding TDM1 is ca. 375–870 Ma, whereas the TDM2 is ca.414–1189 Ma.
Table 3.
Zircon Lu-Hf isotopic data from the TMG.
5.4. Trace Elements in Zircon
Minor and trace-element concentrations in zircon from TMG are listed in Table 4, and chondrite-normalized REE patterns are shown in Figure 8. Zircon grains commonly contain minute inclusions of REE-bearing minerals (e.g., apatite, titanite, monazite, and allanite), which may yield higher LREE and lower Ce4+/Ce3+ values than their true concentrations in zircon. For this reason, zircon grains for LA-ICP-MS analysis were carefully examined with CL to make sure that they contained no inclusions. In addition, the possible presence of such inclusions was monitored by measuring Sr, Th, Al, and P content during LA-ICP-MS analysis; when spikes of these elements were encountered, the analysis was discarded. In this study, we select valid data from zircon analyses which have very low P, Ca, Sr, and Al (Table 4).
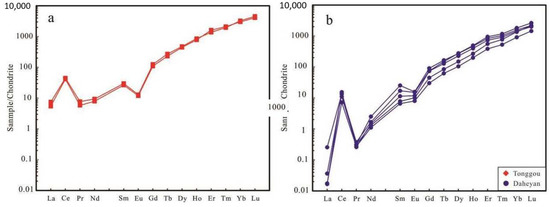
Figure 8.
(a) Chondrite-normalized REE pattern diagram from zircon for Tonggou mineralized granodiorite samples; (b) chondrite-normalized REE pattern diagram from zircon for Daheyan barren granodiorite samples [67].
TMG zircons show a narrow range of ΣREE values (1162–1196 ppm), and are enriched in HREE and depleted in LREE. These samples show obviously negative Eu anomalies (Eu/EuN* = 0.21–0.22) on the chondrite-normalized REE diagram (Figure 8a; Table 4). DBG zircons show low ΣREE values (322–695 ppm), and are also enriched in HREE and depleted in LREE. The samples show weakly negative Eu anomalies (Eu/EuN* = 0.33–0.57) on the chondrite-normalized REE diagram (Figure 8b; Table 4).
The calculation of Ce4+/Ce3+ ratios requires an estimation of the concentration of Ce3+ and Ce4+. The concentration of Ce3+ is commonly based on La and Pr values with the assumption that the normalized values of La, Ce3+, and Pr plot along a smooth curve. However, the concentrations of La and Pr are very low in zircon, close to the detection limits of LA-ICP-MS (Table 3), we employed the calculation method proposed by [26], which used the concentrations of REE from Nd to Lu. The concentration of Ce4+ is commonly based on the Hf and U values with the assumption that the normalized values of Hf, Ce4+, and U plot along a smooth curve as well [69]. Due to the fact that P contents of the TMG and DBG are low, <0.2 wt% (Table 2, [51]), the effects of apatite and monazite on whole-rock compositions should be small. Thus, the compositions of whole-rock samples are assumed to represent those of the parental melt for calculation of Ce4+/Ce3+ ratios. The calculated Ce4+/Ce3+ ratios for Tonggou and Daheyan intrusions vary from 159 to 286, and from 72 to 138 (Table 4), respectively. In addition, since La and Pr are very low in zircon, the classic method to quantify a Ce anomaly incurs criticism. Thus, we employed the calculation method proposed by [25]; the calculated Ce/Ce* values for TMG and DBG vary from 227 to 234, and from 397 to 544 (Table 4), respectively.
6. Discussion
6.1. Timing of Tonggou Porphyry Cu Mineralization
The LA-ICP-MS zircon U-Pb age for TMG varies from 302.2 to 303.0 Ma, which represents Tonggou porphyry mineralization. Thus, Tonggou porphyry Cu mineralized age is consistent with vein Cu–Zn mineralized age [55], the similarity in ages of porphyry and vein mineralization in the Tonggou deposit indicate that vein Cu polymetallic mineralization is closely associated with porphyry Cu mineralization in temporal and spatial terms. Furthermore, similar U-Pb ages have been reported for Daheyan intrusions in Bogda Orogenic Belt [43]. Whereas, the time of Tonggou porphyry Cu mineralization differs from porphyry Cu mineralization in the Jueluotage Belt (e.g., Tuwu, Yandong, and Fuxing deposits [35,70,71]). Thus, the Late Carboniferous period was a time of significant magmatism and porphyry Cu mineralization in Eastern Tianshan.
6.2. Source of Magmas and Petrogenesis
Zircon εHf (t) values from TMG range from 1.8 to 14.1 with a wide range of values (Table 4), indicating that the primary magma of the TMG was derived from multiple sources. On the εHf (t) vs. age diagram, all samples from TMG and DBG plot between the depleted mantle and CHUR reference line (Figure 9), suggesting that the TMG and DBG were mainly derived from crustal melting with some contribution from mantle-derived materials. Early Carboniferous-Devonian zircon xenocrysts in the TMG and DBG both show positive ϵHf (t) values, suggesting that Devonian juvenile crustal rocks possibly existed in the basement of the Bogda Orogenic Belt. Moreover, two-stage Hf model ages (TDM2) of the TMG and DBG correspond to 427−872 Ma and 414−1189 Ma [51], respectively. These values are younger than those of basement rocks in the Cathaysia Block (1.8–2.2 Ga) [72], also indicating that these granodiorites were both mainly derived from a juvenile crustal source and some mixed mantle materials.
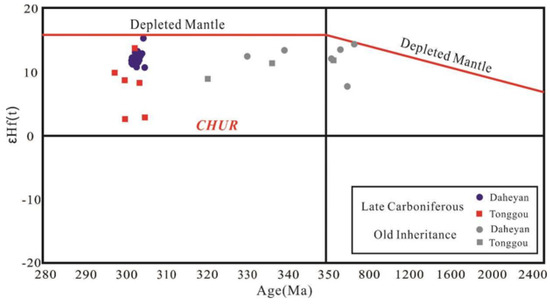
Figure 9.
Zircon U-Pb ages vs. εHf(t) plots for Tonggou and Daheyan samples. Partial data for Daheyan granodiorite cited from [51].
The TMG is characteristically enriched in SiO2 and Sr, but the values of Y (19.8−21.0) and Yb (1.98−2.15) are obviously higher than the related values of adakitic rocks [73]. The Sr/Y vs. Y of samples plot in the fields of non-adakite on a discrimination diagram for the TMG (Figure 10a). However, the DBG is enriched in SiO2 (≥68.14) and Al2O3 (≥15.54) and depleted in Y (≤12.9) and Yb (≤1.64). The Sr/Y vs. Y of samples are plot in the fields of adakite on a discrimination diagram for the DBG (Figure 10a), which suggests that DBG is adakite. Generally, adakitic rocks have higher initial contents of Cu, which is essential for porphyry Cu mineralization [74,75]. Porphyry Cu mineralization has only been discovered in the top of TMG, it was not discovered in DBG. Thus, there are two possible reasons for the fact that porphyry Cu mineralization has not been discovered in DBG. 1) The porphyry Cu mineralization may have formed at the top of the Daheyan granodiorite, but was later eroded away, being consistent with the large area of DBG. 2) Although the DBG had a high initial Cu value, porphyry Cu mineralization may have not formed due to other factors (such as water content, fractional crystallization, and the magma oxidation state).
Table 4.
Trace Element Abundance (in ppm), Ce4+/Ce3+ and Eu Anomalies in Zircon, and Ti-in-Zircon Temperature.
Table 4.
Trace Element Abundance (in ppm), Ce4+/Ce3+ and Eu Anomalies in Zircon, and Ti-in-Zircon Temperature.
| Analysis | TG1-8 | TG1-11 | D03-6 | D03-7 | D03-8 | D03-16 | D03-21 | Analysis | TG1-8 | TG1-11 | D03-6 | D03-7 | D03-8 | D03-16 | D03-21 |
|---|---|---|---|---|---|---|---|---|---|---|---|---|---|---|---|
| Tonggou, Granodiorite | Daheyan, Granodiorite | Tonggou, Granodiorite | Daheyan, Granodiorite | ||||||||||||
| Al | 57.0 | 18.2 | 1.9 | 1.4 | 13.9 | 4.7 | 7.6 | Tm | 53.8 | 49.8 | 23.3 | 19.7 | 29.9 | 13.4 | 26.3 |
| P | 547 | 576 | 341 | 267 | 555 | 229 | 323 | Yb | 513 | 557 | 243 | 230 | 309 | 155 | 267 |
| Ti | 6.60 | 6.63 | 10.16 | 8.07 | 13.16 | 9.56 | 12.44 | Lu | 103 | 115 | 51 | 55 | 67 | 37 | 56 |
| Sr | 5.10 | 1.63 | 0.08 | 0.20 | 0.31 | 0.11 | 0.14 | Th | 252 | 229 | 42 | 48 | 48 | 53 | 51 |
| Y | 1528 | 1605 | 746 | 557 | 941 | 389 | 866 | U | 371 | 366 | 70 | 103 | 89 | 103 | 70 |
| La | 1.296 | 1.770 | 0.004 | 0.000 | 0.061 | 0.004 | 0.009 | Zr | 489,886 | 487,745 | 494,258 | 494,658 | 494,103 | 487,071 | 485,058 |
| Ce | 25.5 | 27.4 | 9.5 | 6.8 | 8.3 | 4.4 | 8.2 | Hf | 10,182 | 10,703 | 9670 | 9634 | 9786 | 9106 | 10,023 |
| Pr | 0.56 | 0.74 | 0.02 | 0.03 | 0.04 | 0.03 | 0.03 | Ta | 1.36 | 1.54 | 0.26 | 0.28 | 0.20 | 0.18 | 0.24 |
| Nd | 3.69 | 4.37 | 0.69 | 0.61 | 0.78 | 0.52 | 1.17 | Nb | 3.50 | 3.81 | 0.67 | 0.53 | 0.68 | 0.20 | 0.44 |
| Sm | 4.06 | 4.59 | 1.75 | 1.20 | 2.62 | 1.01 | 3.89 | ΣREE | 1162 | 1196 | 552 | 472 | 695 | 322 | 624 |
| Eu | 0.69 | 0.75 | 0.69 | 0.59 | 0.88 | 0.46 | 0.92 | LREE/HREE | 0.034 | 0.032 | 0.020 | 0.023 | 0.023 | 0.020 | 0.019 |
| Gd | 22.5 | 25.9 | 15.2 | 9.3 | 15.4 | 6.2 | 18.7 | Eu/EuN* | 0.22 | 0.21 | 0.41 | 0.54 | 0.43 | 0.57 | 0.33 |
| Tb | 8.64 | 10.15 | 4.81 | 3.17 | 5.55 | 2.32 | 6.18 | Ce4+/Ce3+ | 159 | 286 | 138 | 134 | 121 | 106 | 72 |
| Dy | 113.3 | 121.3 | 57.9 | 38.1 | 70.5 | 26.6 | 69.5 | T(°C) | 734 | 735 | 775 | 753 | 802 | 769 | 796 |
| Ho | 44.3 | 48.8 | 22.5 | 15.2 | 28.1 | 11.3 | 26.5 | Ce/CeN* | 227 | 234 | 400 | 397 | 475 | 544 | 399 |
| Er | 268.0 | 228.0 | 121.0 | 92.1 | 157.0 | 64.0 | 139.0 | △NNO | −0.02 | −0.22 | 2.21 | 3.84 | 2.43 | 4.21 | 1.16 |
Note: Ti-in-zircon temperatures are calculated using the equation proposed by [76]; the activities of SiO2 and Ti are set to 1 and 0.75, respectively.
6.3. Fractional Crystallization of Magmas
Due to alteration of epidote, chlorite, and kaolinite, some major elements in samples from the TMG have suffered large compositional variations. However, fractional crystallization of granitic magma can be identified by its REE and trace elements compositions in whole rocks and zircon. Compared to the DBG, the TMG has lower ΣREE values, LREE/HREE ratios (Table 2), and clearly negative Eu anomalies (Table 2) in whole rocks. With decreasing ΣREE values, LREE/HREE ratios typically decrease (Figure 10b), indicating that fractional crystallization was more evident in the TMG [16,77,78]. Furthermore, TMG is more depleted in compatible elements (e.g., Ba ≤ 49.8 ppm, Sr ≤ 774 ppm, Zr ≤ 137 ppm, and Hf ≤ 3.7 ppm) compared to granodiorite from DBG in whole rocks (Figure 7; [51]), which indicates that TMG is of a more fractionated nature [16,79]. In addition, Zr/Hf and Nb/Ta ratios in whole rocks decrease significantly in the TMG (Table 4, Figure 10c), which is also regarded as a sign of fractional crystallization [15,80,81].
According to Zr/Hf ratios in zircon, granites can be classified into three types: common granites (Zr/Hf > 55), moderately evolved granites (25 < Zr/Hf < 55), and highly evolved granites (Zr/Hf < 25) [82]. Zircon Zr/Hf ratios from the TMG and DBG vary from 45.8 to 47.9 and 43.7 to 54.3 (Table 4), respectively. The TMG and DBG both belong to moderately evolved granites. Furthermore, highly fractionated granites are characteristically enriched in P and Hf in zircon [17,83,84], and the TMG has higher P and Hf values in zircon than DBG. On the Zr/Hf vs. P diagram for zircon, P values typically increase with decreasing Zr/Hf ratios (Figure 10d), and the TMG has a more obviously fractionated trend compared with Daheyan granodiorite.
A more important issue is that the crystallization temperature of granites decreases with fractional crystallization [85]. We evaluated the crystallization temperatures of the TMG and DBG based on the Ti-in-zircon thermometer; the calculated temperatures for TMG and DBG vary from 734 to 735 °C and 753 to 802 °C, respectively [73]. With decreasing Zr/Hf ratios, crystallization temperatures typically decrease (Figure 10e), and the TMG becomes a more highly evolved unit (Figure 10e). Moreover, the zircon Th/U ratio may increase along with temperature due to fractionation (Figure 10f; [25]). TMG experienced a higher degree of fractional crystallization than the DBG.

Figure 10.
Geochemical characteristics of the Tonggou and Daheyan samples, which record a high degree of fractionation. (a) Sr/Y vs. Y in whole rocks [86]; (b) ΣREE vs. LREE/HREE in whole rocks; (c) Zr/Hf vs. Nb/Ta in whole rocks; (d) Zr/Hf vs. P in zircon; (e) Zr/Hf vs. T in zircon; (f) Zr/Hf vs. Th/U in zircon. Partial data for Daheyan granodiorite cited from [51]. Partial melting curves are calculated for accumulated fractional melting of lower crust, with starting values from [87]. ADR = island andesite-dacite-rhyolite.
6.4. Oxidation Conditions of Magmas
Eu and Ce anomalies in zircons have been proposed to reflect oxidation conditions in magmas that form porphyry deposits [23,24,25]. Zircons from TMG and DBG both have high Ce/CeN* values (Table 4), indicating that they both show an elevated oxidation state [25]. The high oxygen fugacity of Tonggou granodiorite is also verified by the widespread presence of magnetite and hematite.
However, Eu and Ce anomalies in zircons from TMG are lower than related values of DBG (Table 4), which indicates that DBG may form in a higher oxidation condition than TMG. In addition, Eu anomalies (Eu/EuN* < 0.22) in zircon from TMG are similar to tonalite porphyry from Tuwu-Yandong deposit in Eastern Tianshan, these zircons of tonalite porphyry have low Eu/EuN* ratios, <0.4 [30]. Low calculated Eu/EuN* values in zircons from TMG and Tuwu-Yandong tonalite porphyry may be explained by removal Eu by plagioclase crystallization, resulting in larger negative Eu anomalies in zircon with time [30,88].
6.5. Implications for Porphyry Cu Mineralization
Ce4+/Ce3+ ratios in zircons have been used to indicate the potential of porphyry Cu mineralization; zircons in ore-bearing intrusions always show high Ce4+/Ce3+ ratios [26,30,89,90,91]. Shen [30] considers that mineralized intrusions associated with the large-to-intermediate porphyry deposits have higher Ce4+/Ce3+ ratios than 120 in zircons. There is therefore a correlation between the Ce4+/Ce3+ ratio in zircon and the potential of an intrusion to produce a large porphyry deposit.
In this study, the calculated Ce4+/Ce3+ ratios for TMG are similar to related values of large-to-intermediate porphyry deposits at the CAOB, indicating that TMG has a potential to form large-to-intermediate porphyry Cu deposits. To further evaluate the relationship between the Ce4+/Ce3+ ratios and porphyry Cu mineralization, we also examined the Ce4+/Ce3+ ratios in zircon from DBG. However, Ce4+/Ce3+ ratios of DBG are lower than the related values of TMG and intermediate- to-large porphyry deposits at the CAOB. Zircon Ce4+/Ce3+ ratios are affected by not only oxygen fugacity but also the melt compositions and the temperature at which zircon crystallized [30]. There is a possible reason for low Ce4+/Ce3+ ratios in zircons from DBG samples: although DBG formed at a higher magmatic oxidation state than TMG, DBG has higher crystallization temperature, experienced a lower degree of fractional crystallization than TMG.
In addition, we plotted the Ce4+/Ce3+ values of our samples on the Ce4+/Ce3+ vs. 104/T diagram for granitoids, TMG and DBG both plot between the magnetite–hematite (MH) buffer and Ni–NiO (NNO) buffer (Figure 11). The oxygen fugacity of the magmas lower than the hematite–magnetite buffer, which is favorable for porphyry copper deposits since it can provide ferrous iron in the porphyry Cu system [75]. Moreover, sample of TMG plots in to corresponding range for large porphyry deposit, this suggests that the Tonggou deposit is likely to host a large porphyry Cu deposit.
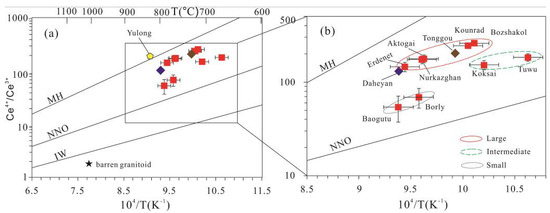
Figure 11.
(a) Average Ce4+/Ce3+ vs. 104/T for porphyry Cu deposits of the CAOB; (b) amplifying average Ce4+/Ce3+ vs. 104/T diagram. Temperatures were calculated using the Ti-in-zircon thermometer [73]. Partial data for porphyry Cu deposits of the CAOB cited from [30]. Curves for oxygen fugacity buffers include magnetite–hematite (MH), Ni–Ni oxide (NNO), and Fe–wustite (IW) buffers.
7. Conclusions
(1) The zircon U-Pb age of the Tonggou granodiorite is 302.2 ± 2.5 Ma, which indicates that porphyry Cu mineralization of the Tonggou deposit was associated with Late Carboniferous magmatism.
(2) TMG shows low ΣREE values (89–102 ppm) in whole rocks, high P (547–576 ppm) and moderate Zr/Hf ratios (45.8–47.9) in zircon, and has a low crystallization temperature (734–735 °C); this suggests that the Tonggou mineralized granodiorite experienced more fractional crystallization than the Daheyan barren granodiorite.
(3) Ce/CeN* values (>227) in zircons from TMG show a high magmatic oxidation state, whereas, they are lower than related values (397–544) of DBG. Low Eu/EuN* (<2.2) in zircon grains of TMG can be explained by removal Eu by plagioclase crystallization.
(4) Ce4+/Ce3+ ratios (159–286) for the TMG approach those of large-to-intermediate porphyry deposits at the CAOB. The high Ce4+/Ce3+ ratios reflect oxidizing magmas produced by fractional crystallization, indicating that TMG has the potential to form a large porphyry Cu deposit.
Author Contributions
Conceptualization, X.-B.Z.; Methodology, F.-M.C.; Software, S.-D.L. and S.-S.W.; Validation, X.-B.Z.; Formal Analysis, X.-B.Z.; Investigation, C.C. and X.-B.Z.; Resources, X.-B.Z.; Data Curation, X.-B.Z.; Writing—Original Draft Preparation, X.-B.Z.; Writing—Review and Editing, H.-Y.Q. and K.-Y.W.; Visualization, X.-B.Z. and S.-D.L.; Supervision, F.-M.C.; Project Administration, X.-B.Z.; Funding Acquisition, X.-B.Z. All authors have read and agreed to the published version of the manuscript.
Funding
This research was supported by the Natural Science Foundation of Xinjiang Province, China (Grant No. 2018D01C042).
Acknowledgments
We would like to thank the staff of the Wuhan Samplesolution Analytical Technology Co., Ltd. for LA-ICP-MS zircon U-Pb dating and Hf isotope and trace element analysis. We also thank the staff of the ALS Laboratory Group for whole-rock geochemical analyses.
Conflicts of Interest
The authors declare no conflict of interest.
References
- Sillitoe, R.H. Porphyry copper systems. Econ. Geol. 2010, 105, 3–41. [Google Scholar] [CrossRef]
- Sun, W.D.; Huang, R.F.; Li, H.; Hu, Y.B.; Zhang, C.C.; Sun, S.J.; Ling, M.X. Porphyry deposits and oxidized magmas. Ore Geol. Rev. 2015, 65, 97–131. [Google Scholar] [CrossRef]
- Zarasvandi, A.; Rezaei, M.; Raith, J.G.; Pourkaseb, H.; Asadi, S.; Saed, M.; Lentz, D.R. Metal endowment reflected in chemical composition of silicates and sulfides of mineralized porphyry copper systems, Urumieh-Dokhtar magmatic arc, Iran. Geochim. Cosmochim. Acta 2018, 223, 36–59. [Google Scholar] [CrossRef]
- Richards, J.P. Tectono-magmatic precursors for porphyry Cu-(Mo-Au) deposit formation. Econ. Geol. 2003, 98, 1515–1533. [Google Scholar] [CrossRef]
- Sillitoe, R.H. Why no porphyry copper deposits in Japan and South Korea. Resour. Geol. 2018, 68, 107–125. [Google Scholar] [CrossRef]
- Cooke, D.R.; Hollings, P.; Walshe, J.L. Giant porphyry deposits: Characteristics, distribution, and tectonic controls. Econ. Geol. 2005, 100, 801–818. [Google Scholar] [CrossRef]
- Richards, J.P. Tectonic, magmatic, and metallogenic evolution of the Tethyan orogen: From subduction to collision. Ore Geol. Rev. 2015, 70, 323–345. [Google Scholar] [CrossRef]
- Hou, Z.Q.; Yang, Z.M.; Lu, Y.; Kemp, A.; Zheng, Y.; Li, Q.; Duan, L. A genetic linkage between subduction- and collision-related porphyry Cu deposits in continental collision zones. Geology 2015, 43, 247–250. [Google Scholar] [CrossRef]
- Richards, J.P. High Sr/Y arc magmas and porphyry Cu ± Mo ± Au deposits: Just add water. Econ. Geol. 2011, 106, 1075–1081. [Google Scholar] [CrossRef]
- Hattori, K.H.; Keith, J.D. Contribution of mafic melt to porphyry copper mineralization: Evidence from Mount Pinatubo, Philippines, and Bingham Canyon, Utah, USA. Miner. Depos. 2001, 36, 799–806. [Google Scholar] [CrossRef]
- Hou, Z.Q.; Yang, Z.M.; Wang, R.; Zheng, Y.C. Further discussion on porphyry Cu-Mo-Au deposit formation in main-land China. Earth Sci. Front. 2020. [Google Scholar] [CrossRef]
- Sobolev, A.; Chaussidon, M. H2O concentrations in primary melts from supra-subduction zones and mid-ocean ridges: Implications for H2O storage and recycling in the mantle. Earth Planet. Sci. Lett. 1996, 137, 45–55. [Google Scholar] [CrossRef]
- Richards, J.P.; Kerrich, R. Adakite-like rocks: Their diverse origins and questionable role in metallogenesis. Econ. Geol. 2007, 102, 537–576. [Google Scholar] [CrossRef]
- Coldwell, B.; Adam, J.; Rushmer, T.; Macpherson, C.G. Evolution of the East Philippine arc: Experimental constraints on magmatic phase relations and adakitic melt formation. Contrib. Mineral. Petrol. 2011, 162, 835–848. [Google Scholar] [CrossRef]
- Ballouard, C.; Poujol, M.; Boulvais, P.; Branquet, Y.; Tartèse, R.; Vigneresse, J.L. Nb-Ta fractionation in peraluminous granites: A marker of the magmatic-hydrothermal transition. Geology 2016, 44, 231–234. [Google Scholar] [CrossRef]
- Gelman, S.E.; Deering, C.D.; Bachmann, O.; Huber, C.; Gutiérrez, F.J. Identifying the crystal graveyards remaining after large silicic eruptions. Earth Planet. Sci. Lett. 2014, 403, 299–306. [Google Scholar] [CrossRef]
- Chudík, P.; Uher, P.; Kohút, M.; Bačík, P. Accessory columbite to tantalite, tapiolite and zircon: Products of extreme fractionationin highly peraluminous pegmatitic granite from the Považský Inovec Mountains, Western Carpathians, Slovakia. J. Geosci. 2008, 53, 323–334. [Google Scholar] [CrossRef]
- Belousova, E.; Griffin, W.; O’Reilly, S.Y.; Fisher, N.I. Igneous zircon: Trace element composition as an indicator of source rock type. Contrib. Mineral. Petrol. 2002, 143, 602–622. [Google Scholar] [CrossRef]
- Kirkland, C.L.; Smithies, R.H.; Taylor, R.J.M.; Evans, N.; McDonald, B. Zircon Th/U ratios in magmatic environs. Lithos 2015, 212–215, 397–414. [Google Scholar] [CrossRef]
- Large, S.J.E.; von Quadt, A.; Wotzlaw, J.F.; Guillong, M.; Heinrich, C.A. Magma evolution leading to porphyry Au-Cu mineralization at the Ok Tedi deposit, Papua New Guinea: Trace element geochemistry and high-precision geochronology of igneous zircon. Econ. Geol. 2018, 113, 39–61. [Google Scholar] [CrossRef]
- Lee, R.G.; Bryne, K.; D’Angelo, M.D.; Hart, C.J.R.; Hollings, P.; Gleeson, S.A.; Alfaro, M. Using zircon trace element composition to assess porphyry copper potential of the Guichon Creek batholith and Highland Valley Copper deposit, south-central British Columbia. Miner. Depos. 2020. [Google Scholar] [CrossRef]
- Cherniak, D.J.; Watson, E.B.; Hanchar, J.M. Rare-earth diffusion in zircon. Chem. Geol. 1997, 134, 289–301. [Google Scholar] [CrossRef]
- Loader, M.A.; Wilkinson, J.J.; Armstrong, R.N. The effect of titanite crystallisation on Eu and Ce anomalies in zircon and its implications for the assessment of porphyry Cu deposit fertility. Earth Planet. Sci. Lett. 2017, 472, 107–119. [Google Scholar] [CrossRef]
- Lu, Y.; Loucks, R.R.; Fiorentini, M.; Mccuaig, T.C.; Evans, N.J.; Yang, Z.M.; Hou, Z.Q.; Kirkland, C.L.; Parra-avila, L.A.; Kobussen, A. Zircon compositions as a pathfinder for porphyry Cu ± Mo ± Au deposits. Econ. Geol. 2016, 19, 329–347. [Google Scholar]
- Zhong, S.; Seltmann, R.; Qu, H.; Song, Y. Characterization of the zircon Ce anomaly for estimation of oxidation state of magmas: A revised Ce/Ce* method. Miner. Petrol. 2019, 113, 755–763. [Google Scholar] [CrossRef]
- Ballard, J.R.; Palin, J.M.; Campbell, I.H. Relative oxidation states of magmas inferred from Ce“IV”/Ce“III” in zircon: Application to porphyry copper deposits of Northern Chile. Contrib. Mineral. Petrol. 2002, 144, 347–364. [Google Scholar] [CrossRef]
- Banik, T.J.; Coble, M.A.; Miller, C.F. Porphyry Cu formation in the middle Jurassic Yerington batholith, Nevada, USA: Constraints from laser Raman, trace element, U-Pb age, and oxygen isotope analyses of zircon. Geosphere 2017, 13, 1113–1132. [Google Scholar] [CrossRef]
- Kobylinski, C.H.; Hattori, K.; Smith, S.W.; Plouffe, A. Protracted magmatism and mineralized hydrothermal activity at the gibraltar porphyry copper-molybdenum deposit, British Columbia. Econ. Geol. 2020. [Google Scholar] [CrossRef]
- Dilles, J.H.; Kent, A.J.R.; Wooden, J.L.; Tosdal, R.M.; Koleszar, A.; Lee, R.G.; Farmer, L.P. Zircon compositional evidence for sulfur-degassing from ore-forming arc magmas. Econ. Geol. 2015, 110, 241–251. [Google Scholar] [CrossRef]
- Shen, P.; Hattori, K.; Pan, H.D.; Jackson, S.; Seitmuratova, E. Oxidation condition and metal fertility of granitic magmas: Zircon trace-element data from porphyry Cu deposits in the Central Asian orogenic belt. Econ. Geol. 2015, 110, 1861–1878. [Google Scholar] [CrossRef]
- Smythe, D.J.; Brenan, J.M. Magmatic oxygen fugacity estimated using zircon-melt partitioning of cerium. Earth Planet. Sci. Lett. 2016, 453, 260–266. [Google Scholar] [CrossRef]
- Zhang, C.C.; Sun, W.D.; Wang, J.T.; Zhang, L.P.; Sun, S.J.; Wu, K. Oxygen fugacity and porphyry mineralization: A zircon perspective of Dexing porphyry Cu deposit, China. Geochim. Cosmochim. Acta 2017, 206, 343–363. [Google Scholar] [CrossRef]
- Cao, M.J.; Qin, K.Z.; Li, G.; Evans, N.J.; McInnes, B.I.; Li, J.; Zhao, J. Oxidation state inherited from the magma source and implications for mineralization: Late Jurassic to Early Cretaceous granitoids, Central Lhasa subterrane, Tibet. Miner. Depos. 2018, 53, 299–309. [Google Scholar] [CrossRef]
- Rezeau, H.; Moritz, R.; Wotzlaw, J.F. Zircon petrochronology of the Meghri-Ordubad Pluton, Lesser Caucasus: Fingerprinting igneous processes and implications for the exploration of porphyry Cu-Mo deposits. Econ. Geol. 2019, 114, 1365–1388. [Google Scholar] [CrossRef]
- Wang, Y.F.; Chen, H.Y.; Baker, M.J.; Han, J.S.; Xiao, B.; Yang, J.T.; Jourdan, F. Multiple mineralization events of the Paleozoic Tuwu porphyry copper deposit, Eastern Tianshan: Evidence from geology, fluid inclusions, sulfur isotopes, and geochronology. Miner. Depos. 2019, 54, 1053–1076. [Google Scholar] [CrossRef]
- Wang, Y.H.; Zhang, F.F.; Liu, J.J.; Que, C.Y. Genesis of the Fuxing porphyry Cu deposit in Eastern Tianshan, China: Evidence from fluid inclusions and C–H–O–S–Pb isotope systematics. Ore Geol. Rev. 2016, 79, 46–61. [Google Scholar] [CrossRef]
- Han, C.M.; Xiao, W.J.; Wan, B.; Ao, S.J.; Zhang, J.E.; Song, D.F.; Zhang, Z.Y.; Wang, Z.M. Late Palaeozoic-Mesozoic endogenetic metallogenic series and geodynamic evolution in the East Tianshan mountains. Acta Petrol. Sin. 2018, 34, 1914–1932. [Google Scholar]
- Wang, J.B.; Wang, Y.W.; He, Z.H. Ore deposits as a guide to the tectonic evolution in the East Tianshan mountains NW China. Geol. China 2006, 33, 461–469. (In Chinese) [Google Scholar]
- Allen, M.B.; Windley, B.F.; Zhang, C. Paleozoic collisional tectonics and magmatism of the Chinese Tien Shan, Central Asia. Tectonophysics 1993, 220, 89–115. [Google Scholar] [CrossRef]
- Carroll, A.R.; Graham, S.A.; Hendrix, M.S.; Ying, D.; Zhou, D. Late Paleozoic tectonic amalgamation of northwestern China: Sedimentary record of the Northern Tarim, Northwestern Turpan, and Southern Junggar basins. Geol. Soc. Am. Bull. 1995, 107, 571–594. [Google Scholar] [CrossRef]
- Wu, F.Y.; Sun, D.Y.; Ge, W.C.; Zhang, Y.B.; Grant, M.L.; Wilde, S.A.; Jahn, B.M. Geochronology of the Phanerozoic granitoids in Northeastern China. J. Asian Earth Sci. 2011, 41, 1–30. [Google Scholar] [CrossRef]
- Xu, B.; Charvet, J.; Chen, Y.; Zhao, P.; Shi, G. Middle Paleozoic convergent orogenic belts in Western Inner Mongolia (China): Framework, kinematics, geochronology and implications for tectonic evolution of the Central Asian orogenic belt. Gondwana Res. 2012, 23, 1342–1364. [Google Scholar] [CrossRef]
- Xiao, W.J.; Zhang, L.C.; Qin, K.Z.; Sun, S.; Li, J.L. Paleozoic accretionary and collisional tectonics of the Eastern Tianshan (China): Implications for the continental growth of Central Asia. Am. J. Sci. 2004, 304, 370–395. [Google Scholar] [CrossRef]
- Wu, Y.S.; Chen, Y.J.; Zhou, K.F. Mo deposits in Northwest China: Geology, geochemistry, geochronology and tectonic setting. Ore Geol. Rev. 2016, 81, 641–671. [Google Scholar] [CrossRef]
- BGMRXUAR (Bureau of Geology and Mineral Resources of Xinjiang Uygur Autonomous Region). Regional Geology of Xinjiang Uygur Autonomous Region; Geological Publishing House: Beijing, China, 1993; pp. 1–841. (In Chinese) [Google Scholar]
- Xiao, Q.H.; Qin, K.Z.; Xu, Y.X.; San, J.Z.; Ma, Z.L.; Sun, H.; Tang, D.M. A discussion on geological characteristics of Hongxingshan Pb-Zn (Ag) deposit in Central Tianshan massif, eastern Xinjiang, with reference to regional metallogenesis. Miner. Depos. 2009, 28, 120–132. [Google Scholar]
- Ma, X.H.; Chen, B.; Wang, C.; Yan, X.L. Early Paleozoic subduction of the Paleo-Asian Ocean: Zircon U-Pb geochronological, geochemical and Sr-Nd isotopic evidence from the Harlik pluton, Xinjiang. Acta Petrol. Sin. 2015, 31, 89–104. (In Chinese) [Google Scholar]
- Han, B.F.; Guo, Z.J.; Zhang, Z.C.; Zhang, L.; Chen, J.F.; Song, B. Age, geochemistry, and tectonic implications of a Late Paleozoic stitching pluton in the North Tian Shan suture zone, Western China. Geol. Soc. Am. Bull. 2010, 122, 627–640. [Google Scholar] [CrossRef]
- Wang, C.; Chen, B.; Ma, X.H.; Yan, X.L. Petrogenesis of early and late Paleozoic plutons in Sanchakou area of East Tianshan and their implications for evolution of Kangur Suture Zone. J. Earth Sci. Environ. 2015, 37, 52–70. (In Chinese) [Google Scholar]
- Lei, W.; Guo, J.F.; Ma, J.; Xiao, L.; Li, X.C.; Liu, J.; Li, Y. Lithogeochemistry and LA-ICP-MS zircon U-Pb age and its tectonic significance of Sujishan A-type granite pluton, Eastern Bogda Mountains. Geol. J. China Univ. 2016, 22, 231–241. (In Chinese) [Google Scholar]
- Zhang, X.B.; Chai, F.M.; Chen, C.; Quan, H.Y.; Gong, X.P. Geochronology, geochemistry and tectonic implications of late Carboniferous Daheyan intrusions from the Bogda Mountains, Eastern Tianshan. Geol. Mag. 2020, 157, 289–306. [Google Scholar]
- Gu, L.X.; Hu, S.X.; Yu, C.S.; Li, H.Y.; Xiao, X.J.; Yan, Z.F. Carboniferous volcanites in the Bogda Mountains of eastern Tianshan: Their tectonic implications. Acta Petrol. Sin. 2000, 16, 305–316. (In Chinese) [Google Scholar]
- Yuan, C.; Sun, M.; Wilde, S.; Xiao, W.; Xu, Y.; Long, X.; Zhao, G. Post-collisional plutons in the Balikun area, East Chinese Tianshan: Evolving magmatism in response to extension and slab break-off. Lithos 2010, 119, 269–288. [Google Scholar] [CrossRef]
- Li, P.; Li, Q.; Zhu, Z.; Chen, C.; Liu, X. The study on fluid inclusions and stable isotopes of suoerbasitao gold deposit in the Eastern Tianshan Mountain, NW China. Acta Geol. Sin. 2014, 88, 757–758. [Google Scholar] [CrossRef]
- Zhang, X.B.; Chen, C.; Xia, F.; Gao, L.L.; Quan, H.Y. Metallogenesis and hydrothermal evolution of the Tonggou Cu deposit in the Eastern Tianshan: Evidence from fluid inclusions, H-O-S isotopes, and Re-Os geochronology. Geosci. Front. 2019, 10, 2301–2312. [Google Scholar] [CrossRef]
- Zhang, X.B. The research progress of Tonggou porphyry-vein Cu deposit in Eastern Tianshan. In The Abstract Books of 9th National Colloquium Metallogenic Theory and Prospecting Methods; Acta Mineralogica Sinica: Guiyang, China, 2019; p. 291. (In Chinese) [Google Scholar]
- NGPXGEICMGB (No.704 Geological Party, Xinjiang Geological Exploration Institute of China Metallurgical Geology Bureau). 1: 10000 Detailed Investigation Report of Cu Multi-Metal Belt; XGEICMGB: Chaiwopu, China, 1975; pp. 1–175. (In Chinese) [Google Scholar]
- Liu, Y.S.; Hu, Z.C.; Gao, S.; Günther, D.; Xu, J.; Gao, C.G.; Chen, H. In situ analysis of major and trace elements of anhydrous minerals by LA-ICP-MS without applying an internal standard. Chem. Geol. 2008, 257, 34–43. [Google Scholar] [CrossRef]
- Liu, Y.S.; Hu, Z.C.; Zong, K.Q.; Gao, C.G.; Shan, G. Reappraisement and refinement of zircon U-Pb isotope and trace element analyses by LA-ICPMS. Sci. Bull. 2010, 55, 1535–1546. [Google Scholar] [CrossRef]
- Ludwig, K.R. ISOPLOT 3.0: A Geochronological Toolkit for Microsoft Excel; Special Publication; Berkeley Geochronology Center: Berkeley, CA, USA, 2003; pp. 1–70. [Google Scholar]
- Yang, H.; Ge, W.C.; Zhao, G.C.; Dong, Y.; Xu, W.L.; Ji, Z.; Yu, J.J. Late Triassic intrusive complex in the Jidong region, Jiamusi-Khanka Block, NE China: Geochemistry, zircon U-Pb ages, Lu-Hf isotopes, and implications for magma mingling and mixing. Lithos 2015, 224–225, 143–159. [Google Scholar] [CrossRef]
- Hoskin, P.W.O.; Black, L.P. Metamorphic zircon formation by solidstate recrystallization of protolith igneous zircon. J. Metamorph. Geol. 2000, 18, 423–439. [Google Scholar] [CrossRef]
- Davies, J.F.; Whitehead, R.E. Alkali/Alumina molar ratio trends in altered granitoid rocks hosting porphyry and related deposits. Explor. Min. Geol. 2010, 19, 13–22. [Google Scholar] [CrossRef]
- Nicholas, C.W.; Garry, J.D. Possible submarine advanced argillic alteration at the basin lake prospect, western Tasmania, Australia. Econ. Geol. 2004, 99, 987–1002. [Google Scholar]
- Winchester, J.; Floyd, P. Geochemical discrimination of different magma series and their differentiation products using immobile elements. Chem. Geol. 1977, 20, 325–343. [Google Scholar] [CrossRef]
- Vry, V.H.; Wilkinson, J.J.; Seguel, J.; Millán, J. Multistage intrusion, brecciation, and veining at El Teniente, Chile: Evolution of a nested porphyry system. Econ. Geol. 2010, 105, 119–153. [Google Scholar] [CrossRef]
- Boynton, W.V. Geochemistry of the rare earth elements: Meteorite studies. In Rare Earth Element Geochemistry; Henderson, P., Ed.; Elsevier: Amsterdam, The Netherlands, 1984; pp. 63–114. [Google Scholar]
- Sun, S.S.; McDonough, W.F. Chemical and isotopic systematics of oceanic basalts: Implications for mantle composition and processes. In Magmatism in Ocean Basins; Saunders, A.D., Norry, M.J., Eds.; Special Publication; Geological Society of London: London, UK, 1989; Volume 32, pp. 313–345. [Google Scholar]
- Blundy, J.; Wood, B. Prediction of crystal-melt partition coeffcients from elastic moduli. Nature 1994, 372, 452–454. [Google Scholar] [CrossRef]
- Wang, Y.F.; Chen, H.Y.; Xiao, B.; Han, J.S.; Fang, J.; Yang, J.T. Overpinting mineralization in the Paleozoic Yandong porphyry copper deposit, eastern Tianshan, NW China―Evidence from geology, fluid inclusion and geochronology. Ore Geol. Rev. 2018, 100, 148–167. [Google Scholar] [CrossRef]
- Wang, Y.H.; Zhang, F.F.; Liu, J.J.; Que, C.Y. Carboniferous magmatism and mineralization in the area of the Fuxing Cu deposit, Eastern Tianshan, China: Evidence from zircon U-Pb ages, petrogeochemistry, and Sr-Nd-Hf-O isotopic compositions. Gondwana Res. 2016, 34, 109–128. [Google Scholar] [CrossRef]
- Chen, J.F.; Guo, X.S.; Tang, J.F.; Zou, T.X. Nd isotopic model ages: Implications of the growth of the continental crust of southeastern China. J. Nanjing Univ. 1999, 35, 649–658. (In Chinese) [Google Scholar]
- Defant, M.J.; Drummond, M.S. Derivation of some modern arc magmas by melting of young subducted lithosphere. Nature 1990, 347, 662–665. [Google Scholar] [CrossRef]
- Sun, W.; Zhang, H.; Ling, M.X.; Ding, X.; Chung, S.L.; Zhou, J.B.; Yang, X.Y.; Fan, W.M. The genetic association of adakites and Cu-Au ore deposits. Int. Geol. Rev. 2011, 53, 691–703. [Google Scholar] [CrossRef]
- Sun, W.D.; Liang, H.Y.; Ling, M.X.; Zhan, M.Z.; Ding, X.; Zhang, H.; Yang, X.Y.; Li, Y.L.; Ireland, T.R.; Wei, Q.R.; et al. The link between reduced porphyry copper deposits and oxidized magmas. Geochim. Cosmochim. Acta 2013, 103, 263–275. [Google Scholar] [CrossRef]
- Ferry, J.M.; Watson, E.B. New thermodynamic models and revised calibrations for the Ti-in-zircon and Zr-in-rutile thermometers. Contrib. Mineral. Petrol. 2007, 154, 429–437. [Google Scholar] [CrossRef]
- Miller, C.F.; Mittlefehldt, D.W. Depletion of light rare-earth element in felsic magmas. Geology 1982, 10, 129–133. [Google Scholar] [CrossRef]
- Miller, C.F.; Mittlefehldt, D.W. Extreme fractionationin felsic magma chambers: A product of liquid-state diffusion or fractional crystallization? Earth Planet. Sci. Lett. 1984, 68, 151–158. [Google Scholar] [CrossRef]
- Lee, C.T.A.; Morton, D.M. High silica granites: Terminal porosity and crystal settling in shallow magma chambers. Earth Planet. Sci. Lett. 2015, 409, 23–31. [Google Scholar] [CrossRef]
- Pérez-Soba, C.; Villaseca, C. Petrogenesis of highly fractionated I-type peraluminous granites: La Pedriza pluton (Spanish Central System). Geol. Acta 2010, 8, 131–149. [Google Scholar]
- Wu, F.Y.; Liu, X.C.; Liu, Z.C.; Wang, R.C.; Xie, L.; Wang, J.M.; Ji, W.Q.; Yang, L.; Liu, C.; Khanal, G.P.; et al. Highly fractionated Himalayan leucogranites and associated rare-metal mineralization. Lithos 2020, 352–353, 1–24. [Google Scholar] [CrossRef]
- Breiter, K.; Lamarão, C.N.; Borges, R.M.K.; Dall’Agnol, R. Chemical characteristics of zircon from A-type granites and comparison to zircon of S-type granites. Lithos 2014, 192–195, 208–225. [Google Scholar] [CrossRef]
- Wang, X.; Griffin, W.L.; Chen, J. Hf contents and Zr/Hf ratios in granitic zircons. Geochem. J. 2010, 44, 65–72. [Google Scholar] [CrossRef]
- Cerný, P.; Teertstra, D.K.; Chapman, R.; Selway, J.B.; Hawthorne, F.C.; Ferreira, K.; Chackowsky, L.E.; Wang, X.J.; Meintzer, R.E. Extreme fractionation and deformation of the leucogranite-pegmatite suite at Red Cross Lake, Manitoba, Canada. IV. Mineralogy. Can. Mineral. 2012, 50, 1839–1875. [Google Scholar] [CrossRef]
- Sun, W.D.; Ling, M.X.; Chung, S.L.; Ding, X.; Yang, X.Y.; Liang, H.Y.; Fan, W.M.; Goldfarb, R.; Yin, Q.Z. Geochemical constraints on adakites of different origins and copper mineralization. J. Geol. 2012, 120, 105–120. [Google Scholar] [CrossRef]
- Rudnick, R.L.; Fountain, D.M. Nature and composition of the continental crust: A lower crustal perspective. Rev. Geophys. 1995, 33, 267–309. [Google Scholar] [CrossRef]
- Mohammadi, N.; Lentz, D.R.; Chris, R.M.; McFarlane, B.C. Geochemistry of the highly evolved Sn-W-Mo-bearing Mount Douglas Granite, New Brunswick, Canada: Implications for origin and mineralization. Ore Geol. Rev. 2020, 117, 103266. [Google Scholar] [CrossRef]
- Lee, R.G.; Dilles, J.H.; Tosdal, R.M.; Wooden, J.L.; Mazdab, F.K. Magmatic evolution of granodiorite intrusions at the El Salvador porphyry copper deposit, Chile, based on trace element composition and U/Pb age of zircons. Econ. Geol. 2017, 112, 245–273. [Google Scholar] [CrossRef]
- Chelle-Michou, C.; Chiaradia, M.; Ovtcharova, M.; Ulianov, A.; Wotzlaw, J.F. Zircon petrochronology reveals the temporal link between porphyry systems and the magmatic evolution of their hidden plutonic roots (the Eocene Coroccohuayco deposit, Peru). Lithos 2014, 198–199, 129–140. [Google Scholar] [CrossRef]
- Han, Y.G.; Zhang, S.H.; Pirajno, F.; Zhou, X.W.; Zhao, G.C.; Qü, W.J.; Liu, S.H.; Zhang, J.M.; Liang, H.B.; Yang, K. U-Pb and Re-Os isotopic systematics and zircon Ce4+/Ce3+ ratios in the Shiyaogou Mo deposit in eastern Qinling, central China: Insights into the oxidation state of granitoids and Mo (Au) mineralization. Ore Geol. Rev. 2013, 55, 29–47. [Google Scholar] [CrossRef]
- Qiu, J.T.; Yu, X.Q.; Santosh, M.; Zhang, D.H.; Chen, S.Q.; Li, P.J. Geochronology and magmatic oxygen fugacity of the Tongcun molybdenum deposit, northwest Zhejiang, SE China. Miner. Depos. 2013, 48, 545–556. [Google Scholar] [CrossRef]
© 2020 by the authors. Licensee MDPI, Basel, Switzerland. This article is an open access article distributed under the terms and conditions of the Creative Commons Attribution (CC BY) license (http://creativecommons.org/licenses/by/4.0/).