Article

New Insight into the Genetic Mechanism of Shear Zone Type Gold Deposits from Muping-Rushan Metallogenic Belt (Jiaodong Peninsula of Eastern China)

1
Key Laboratory of Computational Geodynamics, College of Earth and Planetary Sciences, University of Chinese Academy of Sciences, Beijing 100049, China
2
School of Resource and Environment, Henan Polytechnic University, Jiaozuo 454000, China
*
Author to whom correspondence should be addressed.
Minerals 2019, 9(12), 775; https://doi.org/10.3390/min9120775
Submission received: 30 October 2019 / Revised: 10 December 2019 / Accepted: 10 December 2019 / Published: 12 December 2019

Abstract

:
Most gold deposits are genetically controlled by shear zones, which are called shear zone type gold deposits (SZTGD). A better understanding of kinematics of shear zones and its constraint on the ore-forming process is critical to reveal the genetic mechanism of the SZTGD and favorable to mineral exploration. By conducting detailed structural analysis including field and microscopic observations and electron backscatter diffraction (EBSD) and fractal dimension analysis in the Muping-Rushan shear zone (MR) as well as several gold deposits, the kinematic characteristics of the MR are well recognized and the metallogenic process of the SZTGD are discussed. The main conclusions are as follows: (1) petrology, geometry, kinematics, macro- and micro-structures imply that the MR has experienced a progressive shearing history exhumed via middle crust to subsurface level under the NW-SE extensional regime from late Jurassic to early Cretaceous; (2) in the MR, gold may precipitate both in the brittle fractures at middle crust level and brittle deformation part at shallow crust level during the stress-chemical process and (3) comparison of gold deposits between the MR and other areas show that the SZTGD has a uniform metallogenic mechanism, which is from (multi-stage) pluton emplacement, hydrothermal fluid action, shearing action, brittle fracturing, sudden reduction of fluid pressure, flash vaporization to (gold) mineralization.

Graphical Abstract

1. Introduction

Shear zones are one type of strain localization structures [1], which are widely developed in various structural environments. As weak zones in regions, shear zones are always concentrated for intense magma activities, fluid actions and metamorphism, hence provide favorable transport channels and precipitation spaces for ore-forming elements, e.g., Au, Ag, Cu, Pb, Zn, W, Sn and Mo [2,3,4,5,6,7]. Many gold deposits are host in, or spatially associated with first- and second-order shear zones [8,9,10,11,12,13,14,15], which we call the shear zone type gold deposits (SZTGD). In the SZTGD, the formation, transport and precipitation of gold are strictly controlled by shearing activities [16,17]. This kind of gold deposit has a wide distribution in the world, e.g., Abitibi greenstone belt in Canada, the Norseman-Wiluna greenstone belt in west Australia and Jiaodong Peninsula in China [18,19,20]. A better understanding of the mineralization process in the SZTGD is indispensable to the evolution history of the Earth and gold exploration.
Although previous studies about kinematics and dynamics of shear zones and the relationship between shear zones and gold mineralization have been made great progress [18,21,22,23,24], there still have some questions remain further consideration. On one hand, field works show that most gold ores are localized in shear zones. Even in the same shear zone, the distribution of ore bodies is not homogenous for everywhere (such as Jiaodong Peninsula, see [15,25]). It is suggested from these facts that different parts in the same shear zone have different abilities to make gold precipitate. In addition, previous studies about the ore-host rock environment, gold-ore occurrence conditions, metallogenic characteristics, the nature and origin of ore-forming fluids and the deformation of ore-controlling shear zones show that magma activation, shearing activities, preferential fluid transportation and the gold remobilization and concentration, are as the same-order processes that act in cyclic synchronicity to generate gold mineralization [26]. Therefore, the consideration of the mineralization process from the whole geological process needs more attention. To unveil the genetic mechanism of SZTGD, the best way is to investigate widely local structures developed during gold mineralization covering as many deposits as possible to get enough data and make regional comparison. From this view, this study chooses Jiaodong Peninsula as a unique opportunity to better understand this type of metallogenetic framework. As the most important gold resource in China, the Jiaodong Peninsula has more than 4000 tons of gold reserves [27,28]. Most of the gold deposits in this area are proved to be formed at 120 ± 10 Ma, which is at the peak of lithospheric delamination and craton destruction at Mesozoic [15,29]. During this period, multi-stage magma events, active fluid actions and intensive shearing activities play important roles on gold mineralization, which are a benefit for the study of the SZTGD. There are three important metallogenic belts in Jiaodong Peninsula, one of which is Muping-Rushan located in the east of Jiaodong [26]. The mineralization of quartz-vein is the main type of gold deposit in this belt. Besides, constraints of shearing activities on gold mineralization are informed by the occurrence of most ore bodies [25,28,30]. These features provide further information for understanding the genesis of the SZTGD.
In this study, we choose the Muping-Rushan metallogenic belt as a study target and present detailed structural studies both at macro and micro scales to characterize the shearing activity in the Muping-Rushan shear zone (MR) and its constraint on gold formation. Based on these results and combining with previous studies of gold deposits all over the world, this paper improves the genetic mechanism of the SZTGD from macroscopic shearing activities to physical-chemical process intrinsically.

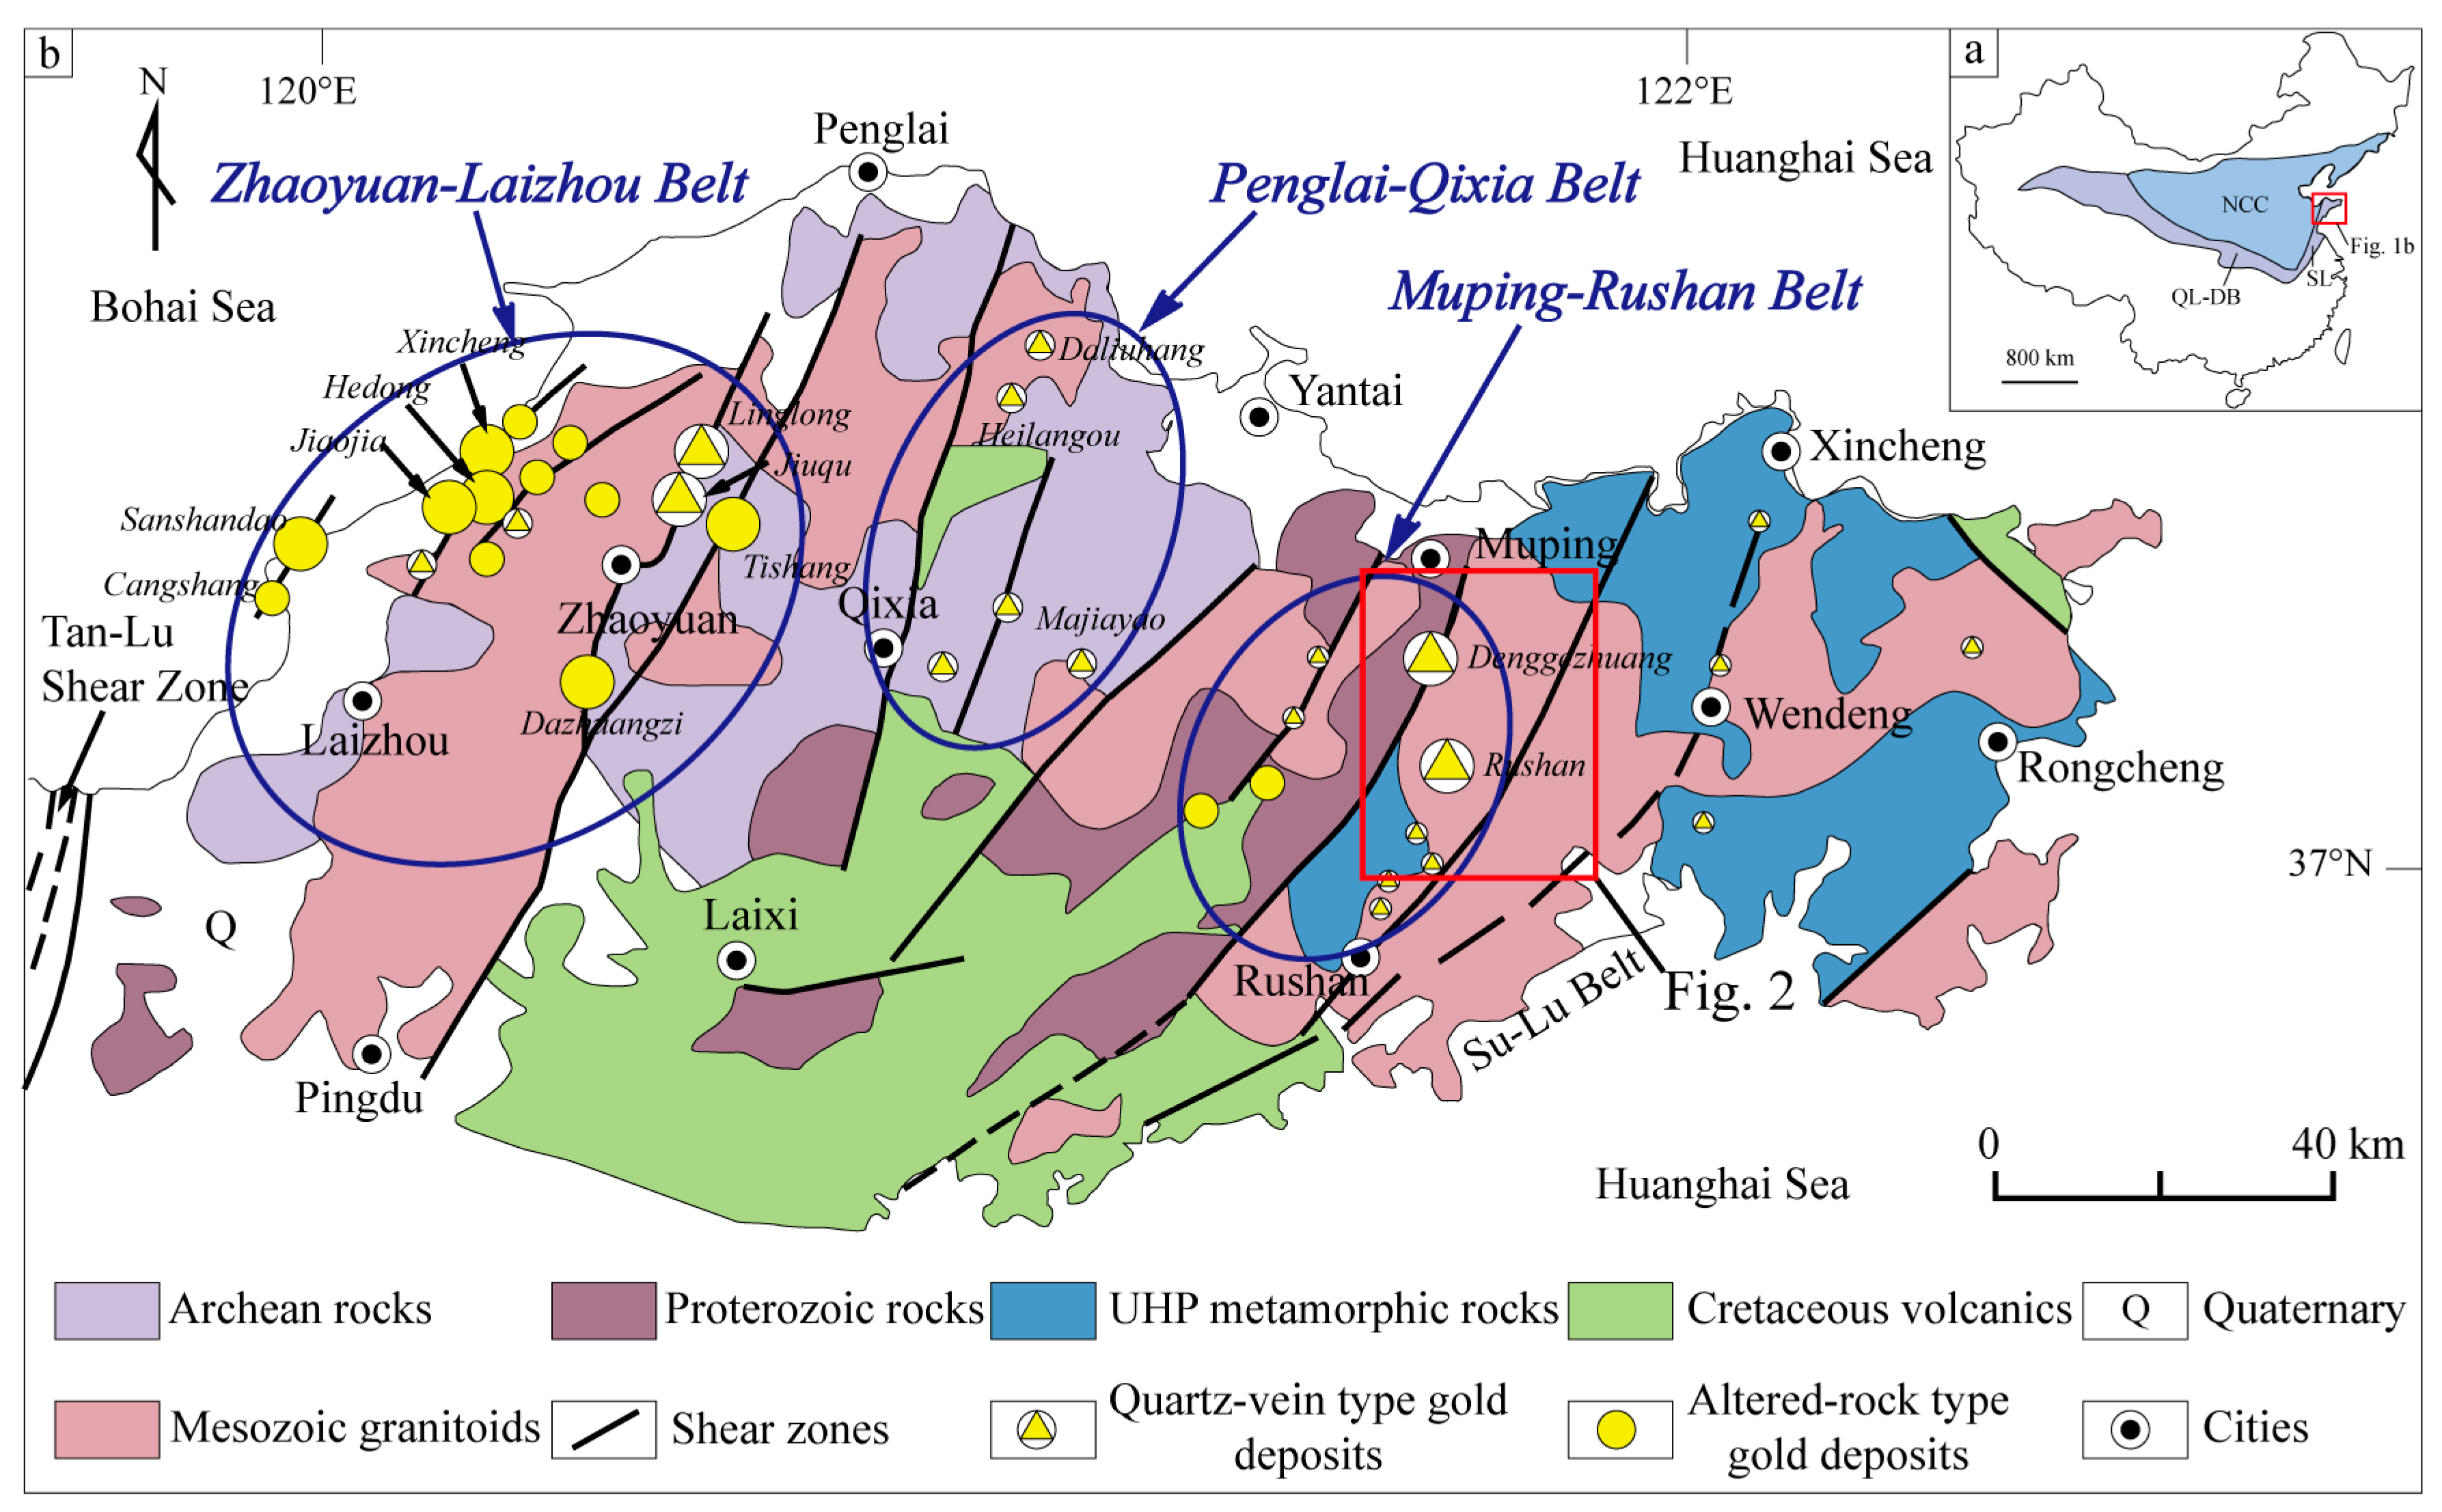
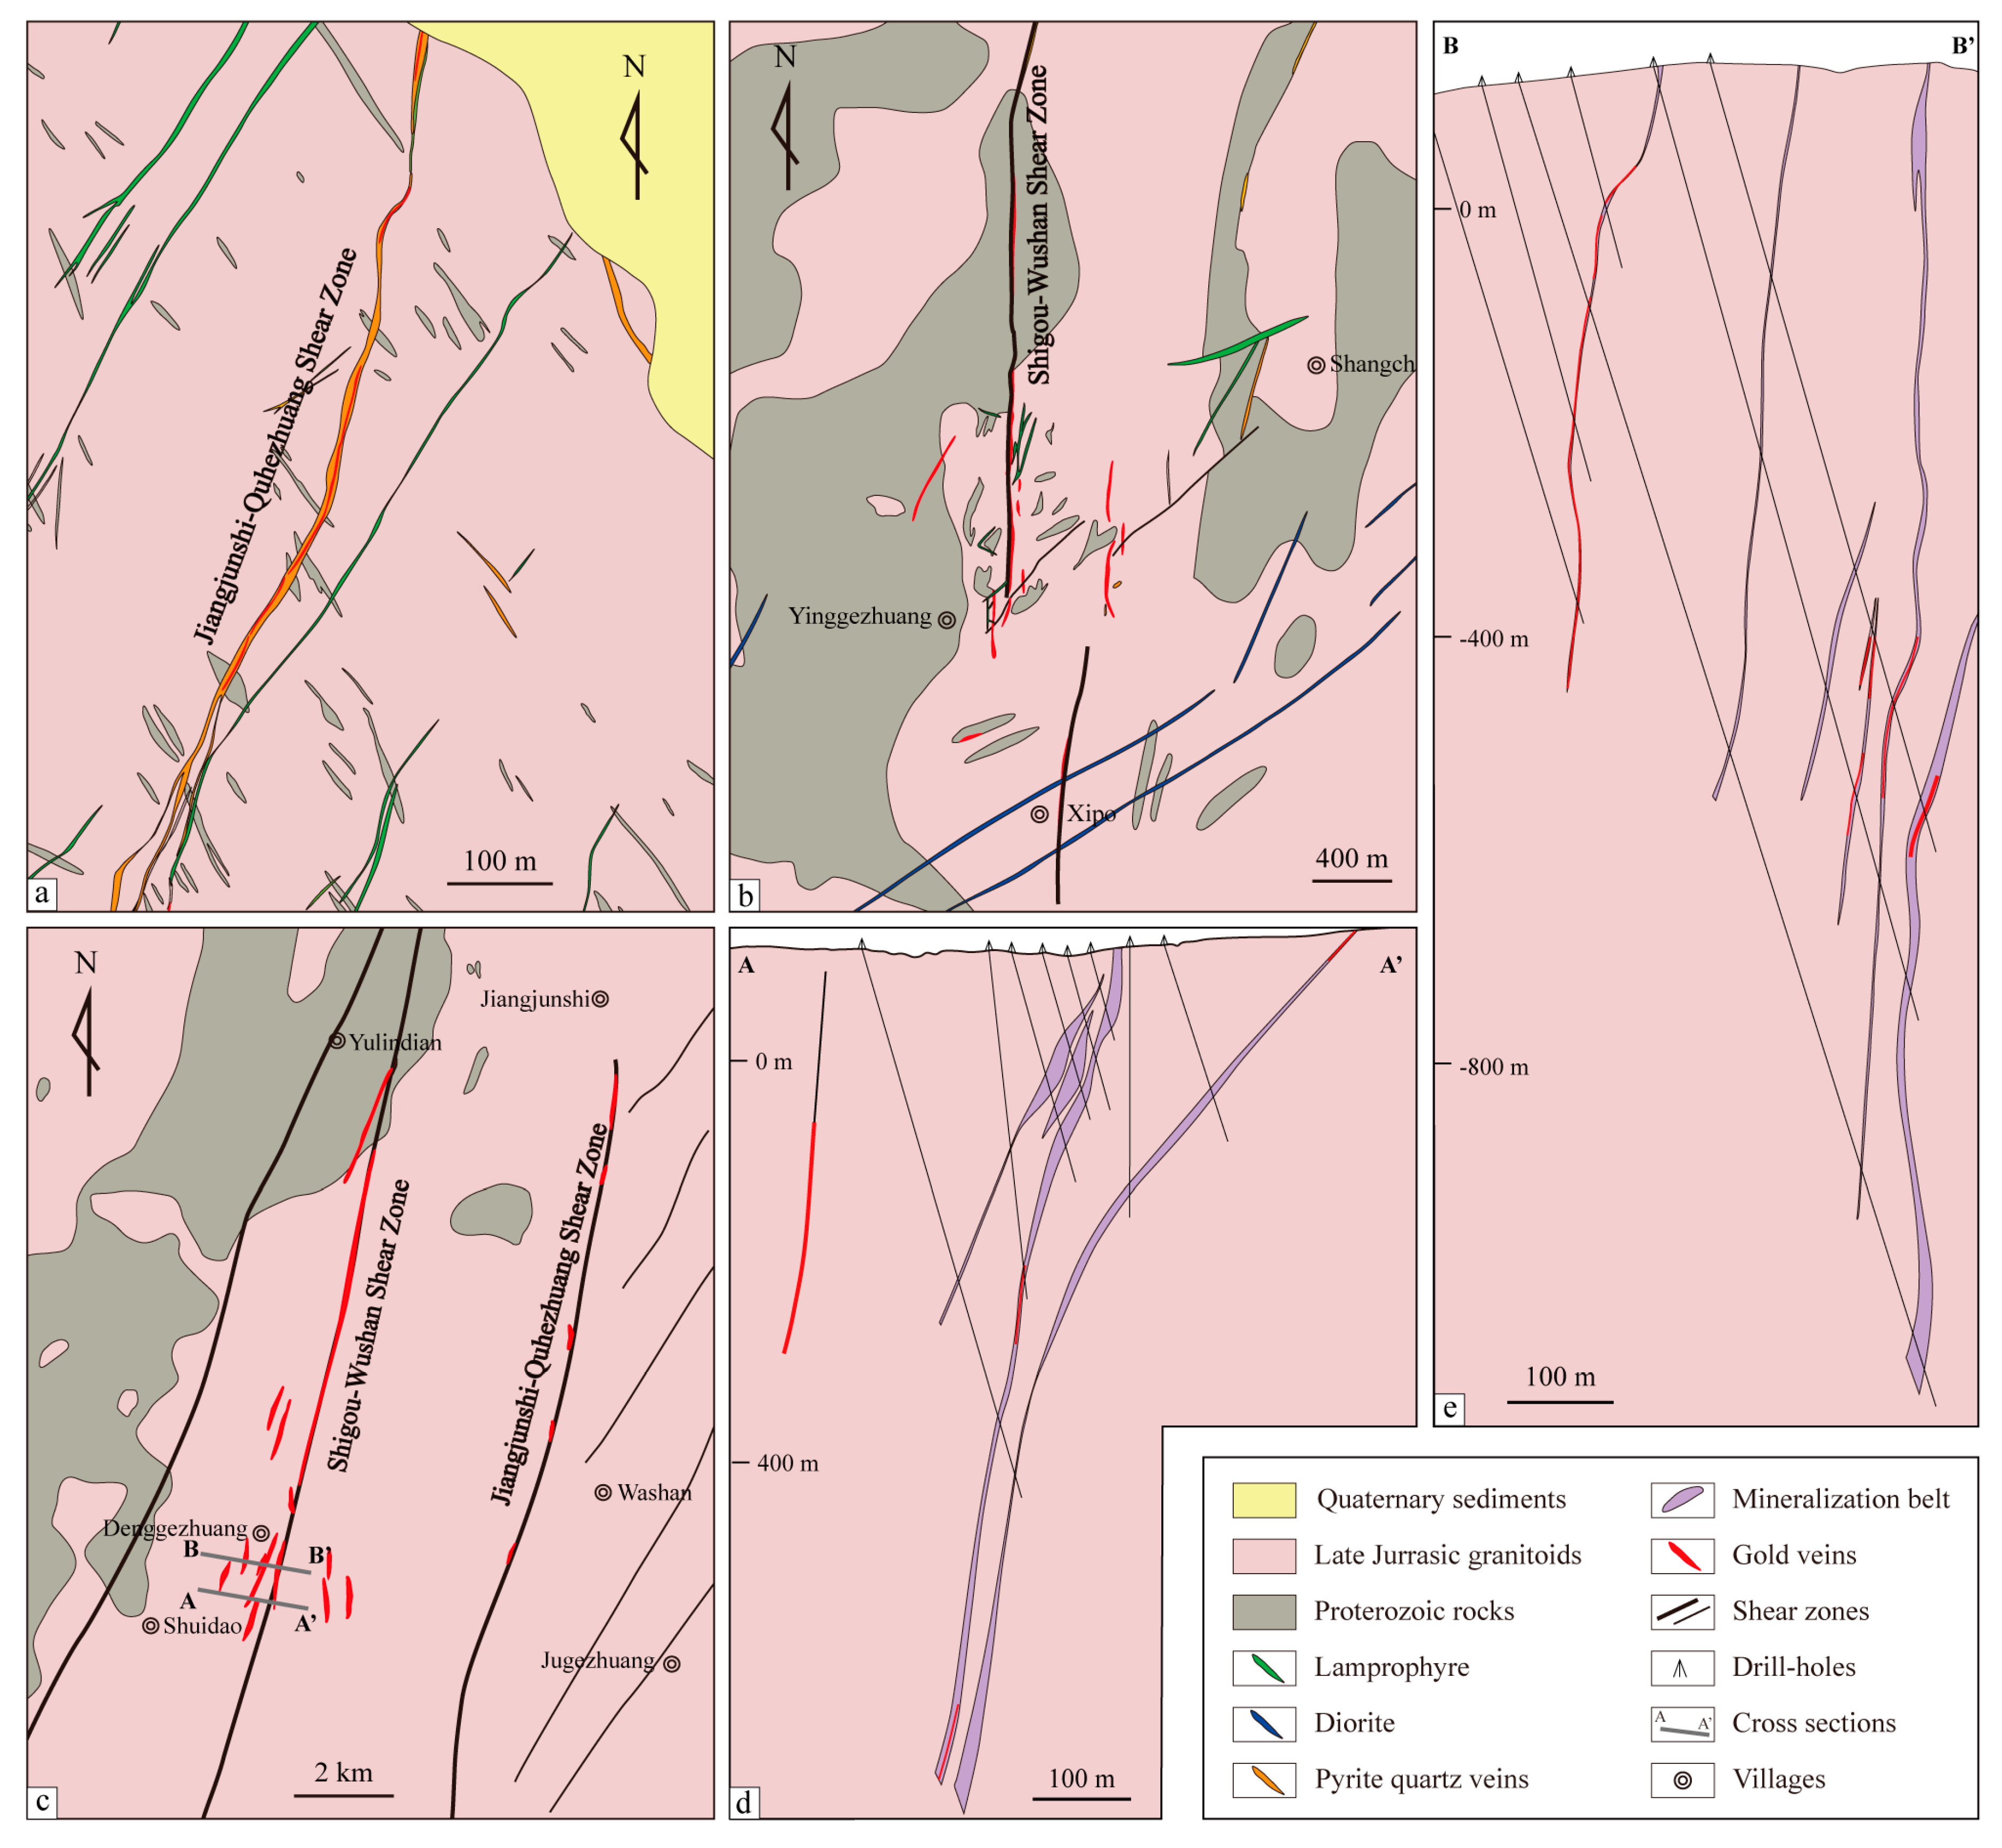
2. Geological Setting

The Jiaodong Peninsula is located at the southeastern part of the North China Craton (NCC) and bounded by Tan-Lu shear zone in the west, Pacific Plate in the east and Su-Lu ultrahigh pressure metamorphic belt in the south (Figure 1). It consists of Precambrian metamorphic basement and numerous Mesozoic intrusive and volcanic rocks [29,31], which are considered as part of the lithotectonic unit of the Paleoproterozoic Jiao-Liao-Ji orogen and served as the hanging-wall of the Triassic continental subduction zone [32]. The Precambrian basement comprises the Archean Jiaodong Group including metamorphic volcanic sedimentary rocks and tonalite-trondhjemite-granodiorite (TTG) gneisses, the Paleoproterozoic Jingshan and Fenzishan Group including metamorphic clastic rocks and metamorphosed chemical sediments, and the Meso-Neoproterozoic Penglai Group including metamorphic sedimentary rocks, respectively [33]. Mesozoic volcanic rocks formed at 110–108 Ma are mainly distributed in the Jiaolai basin and commonly referred to as the Qingshan Formation [34,35]. Widespread Mesozoic granitoid rocks are exposed in the Jiaodong Peninsula, comprising the Linglong granitoids (160–150 Ma), the Kunyushan granitoids (160–155 Ma), the Guojialing granitoids (132–126 Ma) and the Weideshan granitoids (118–108 Ma) [36,37,38,39,40]. These granitic rocks are suggested to be generated by the subduction of the Pacific Plate and the upwelling of asthenosphere [41,42,43]. Mafic to felsic dykes are also commonly distributed in Jiaodong Peninsula, e.g., dolerite, lamprophyre, diorite (porphyry), granodiorite, granitic porphyries and syenite. Most of them are emplaced at 125–110 Ma [32,44,45,46], and a few at 95–87 Ma [47]. The regional ore-controlling structures in Jiaodong Peninsula are NE-NNE-striking shear zones developed in the Mesozoic granitoids or along the contact zone between Precambrian metamorphic basement and Mesozoic granitoids [15]. These shear zones are considered as the minor structures of Tan-Lu shear zone [48], and most of them went through the switch from late Jurassic transpression to early Cretaceous extension [15,49].
Muping-Rushan metallogenic belt marks the eastern part of Jiaodong Peninsula. Exposed rocks of this region comprise the Archean Jiaodong Group, the Paleoproterozoic Jingshan Group and widespread Mesozoic granitoid plutons (Figure 1). Evidence from petrological, geochemical and isotopic data suggests two major periods of magmatism during the Mesozoic. The late Jurassic Kunyushan granitoids, emplaced in 160–155 Ma, are interpreted as originating from partial melting of thickening crust [51]. The early Cretaceous Sanfoshan granitoids intruded the Kunyushan granitoids in 115–111 Ma and were formed by crust-mantle interaction during the lithosphere thinning [52]. At late Cretaceous (110–100 Ma), these two kinds of granitoids were intruded by numerous mafic dykes and pyroxene diorite stocks that originated from a rich lithospheric mantle contemporaneously with the granites [53].
Gold deposits in this belt develop along NE-NNE-striking shear zones (Figure 2). From north to south, many large gold deposits developed there including Denggezhuang, Jinniushan, Rushan, Yinggezhuang and Sanjia. The main mineralization type is quartz-vein type gold deposits, and the individual ore vein is usually 40–350 m in length, 1–10 m in thickness and extends 40–70 m even kilometers in length [26]. Zircon U-Pb and K-feldspar 40Ar/39Ar constrain the age of mineralization for Denggezhuang deposit at 120 ± 3.6 Ma and 123 ± 0.53 Ma, respectively [51,54]. Zircon U-Pb and Sericite 40Ar/39Ar dating show 117 ± 3 Ma and 129 Ma of Rushan gold deposit, respectively [54,55]. Besides, K-feldspar 40Ar/39Ar dating shows 111.24 ± 0.39 Ma of Yinggezhuang gold deposit [56]. These results were consistent with the regional gold metallogenic events (120 ± 10 Ma), which suggest gold mineralization was formed in Mesozoic under the condition of tectonic regime transition, strong thinning of lithosphere, activation of a series of detachment shear zones and metamorphic core complexes (MCCs) and large scale metallogeny [15,26,54].
The Muping-Rushan shear zone (MR) is considered as the second-order fracture of strike-slipping Tan-Lu fault, which is a crust scale fault along the East China continental margin (ECCM) and experienced a transition from sinistral at Late Jurassic to normal faulting at Early Cretaceous [58]. The MR is mainly located along the boundary between the Paleoproterozoic metamorphic rocks and the Kunyushan pluton and comprises four NNE-striking shear zones including Qinghushan-Tangjiagou (QT), Shigou-Wushan (SW), Jiangjunshi-Quhezhuang (JQ) and Gekou (GK) shear zones from west to east [52]. This study focused on the first three shear zones due to their close relationship with gold mineralization. Field works show that these shear zones mostly strike NE about 0–15° and dip SE with an angle around 65–85°, locally dip NW [57]. Most of them are considered as normal faults with the brittle deformation regime [15,52,57].

3. New Structural Insights

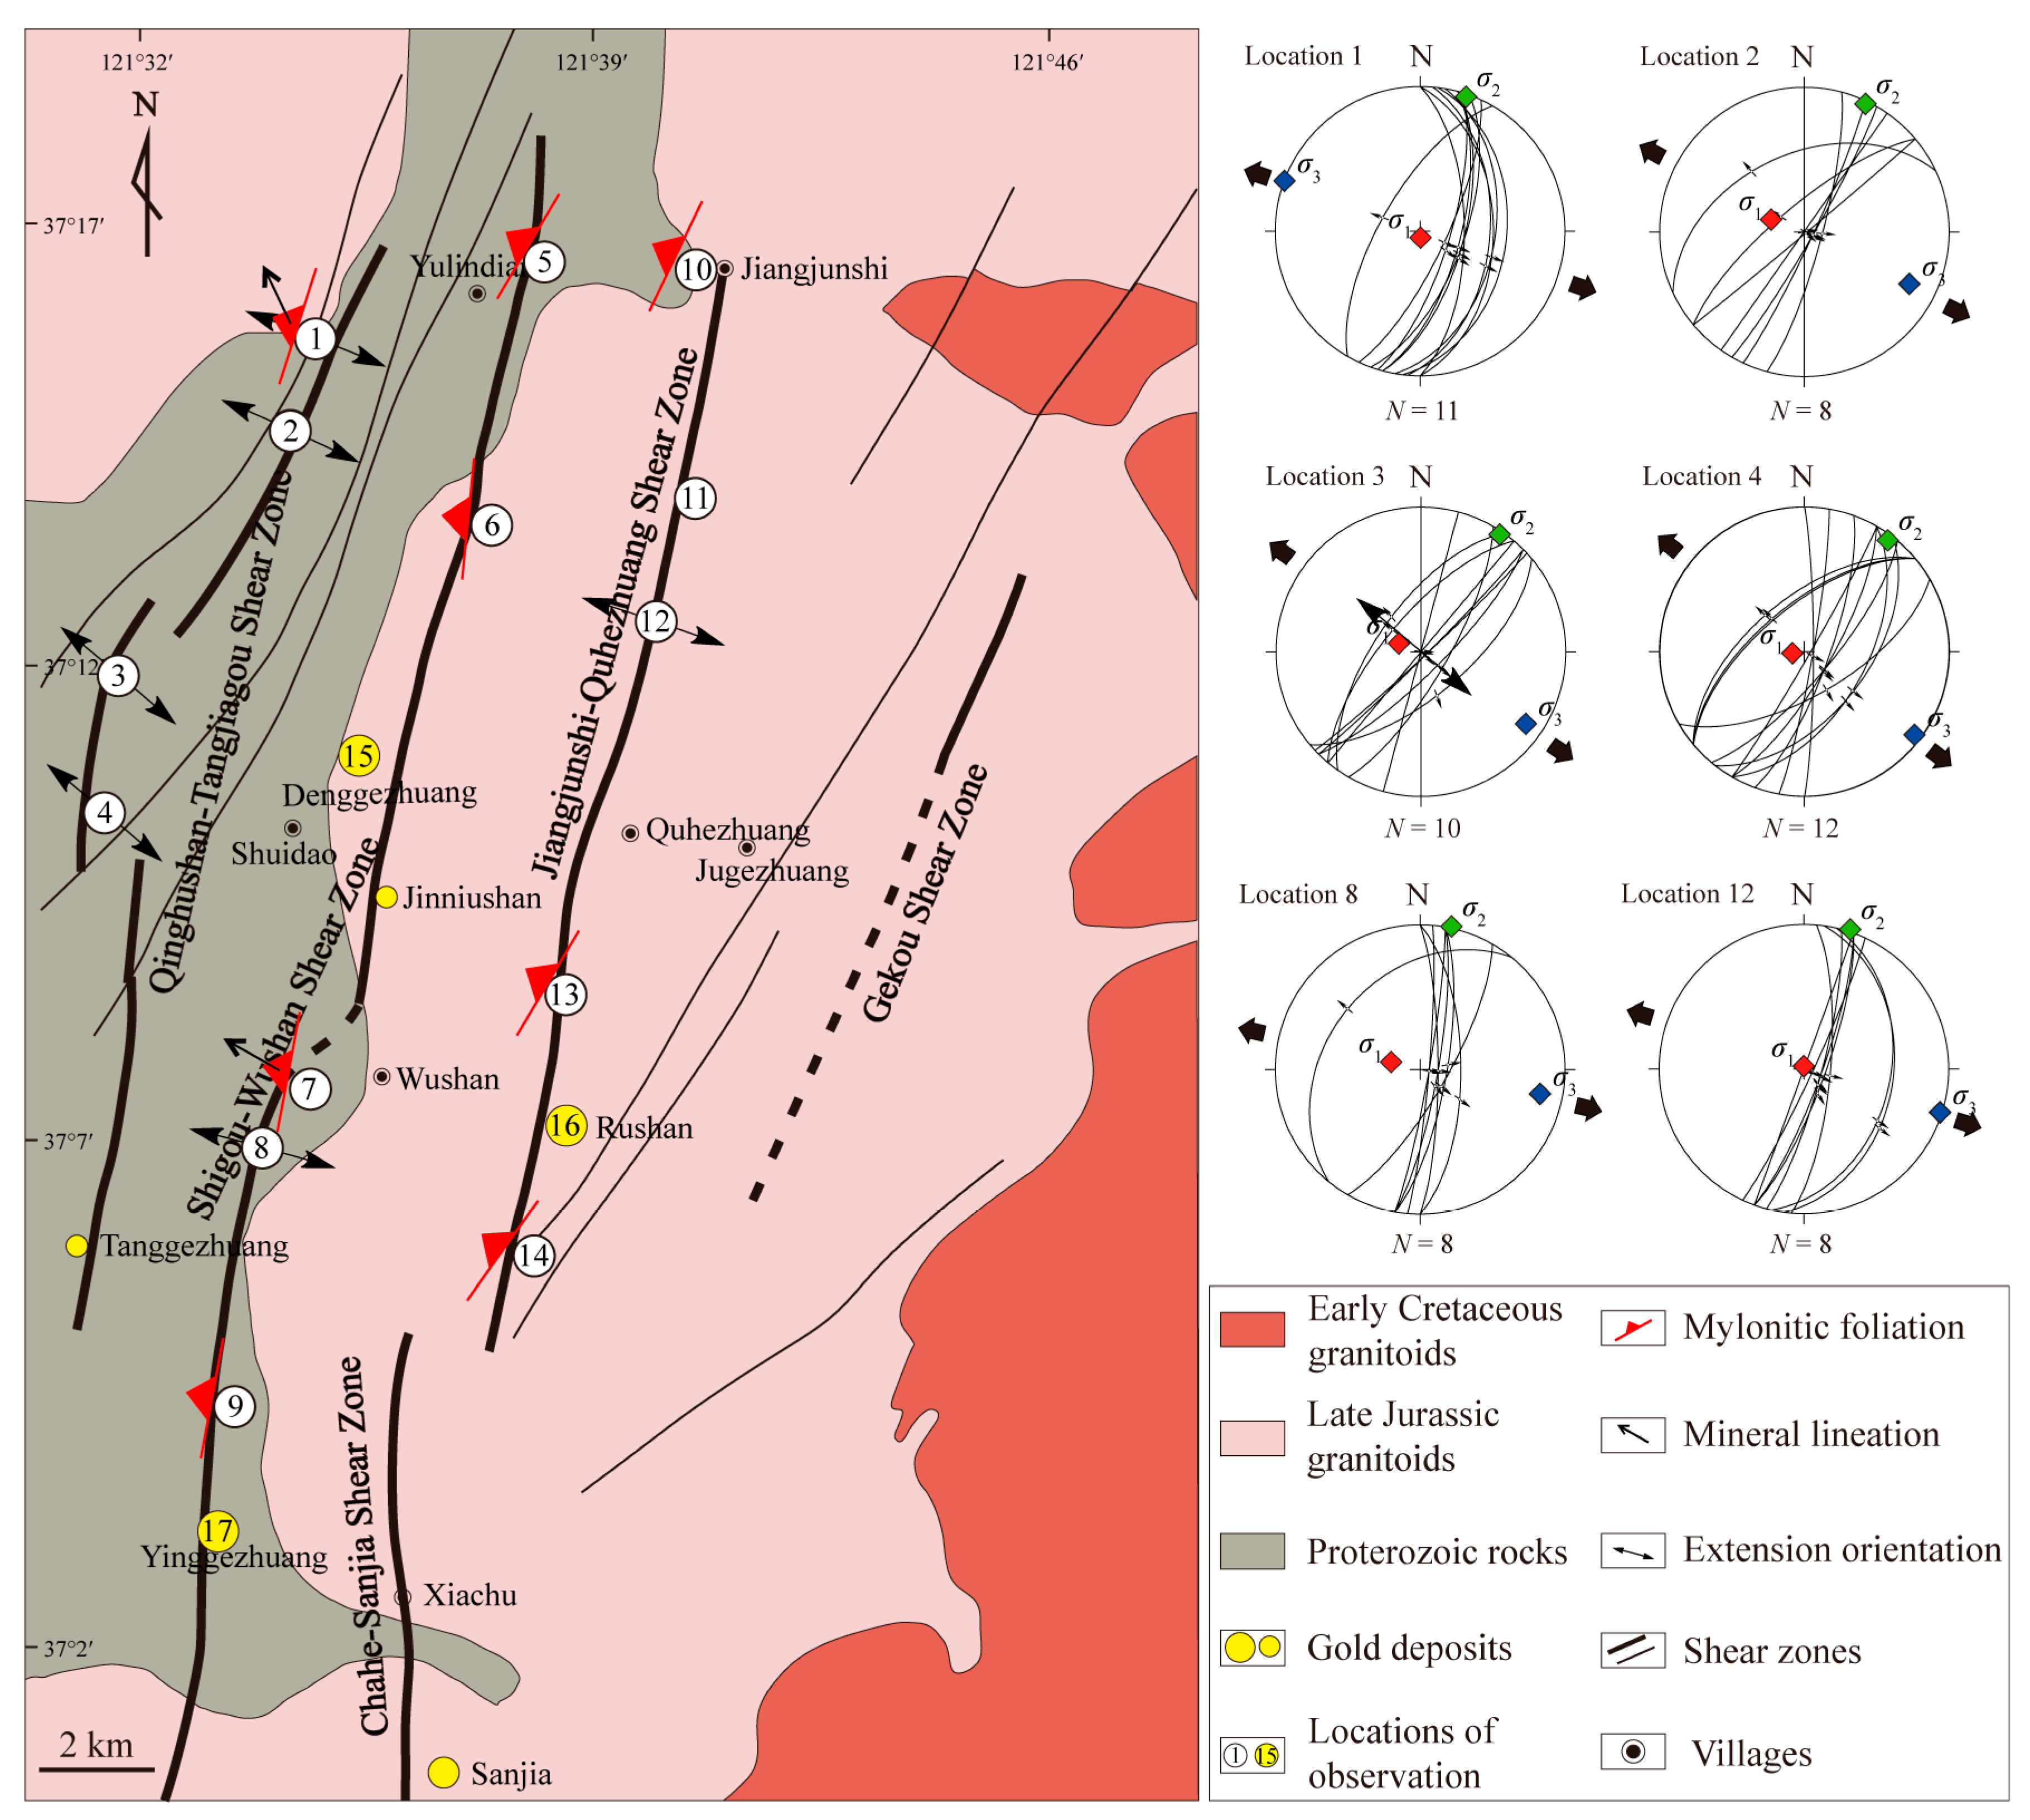
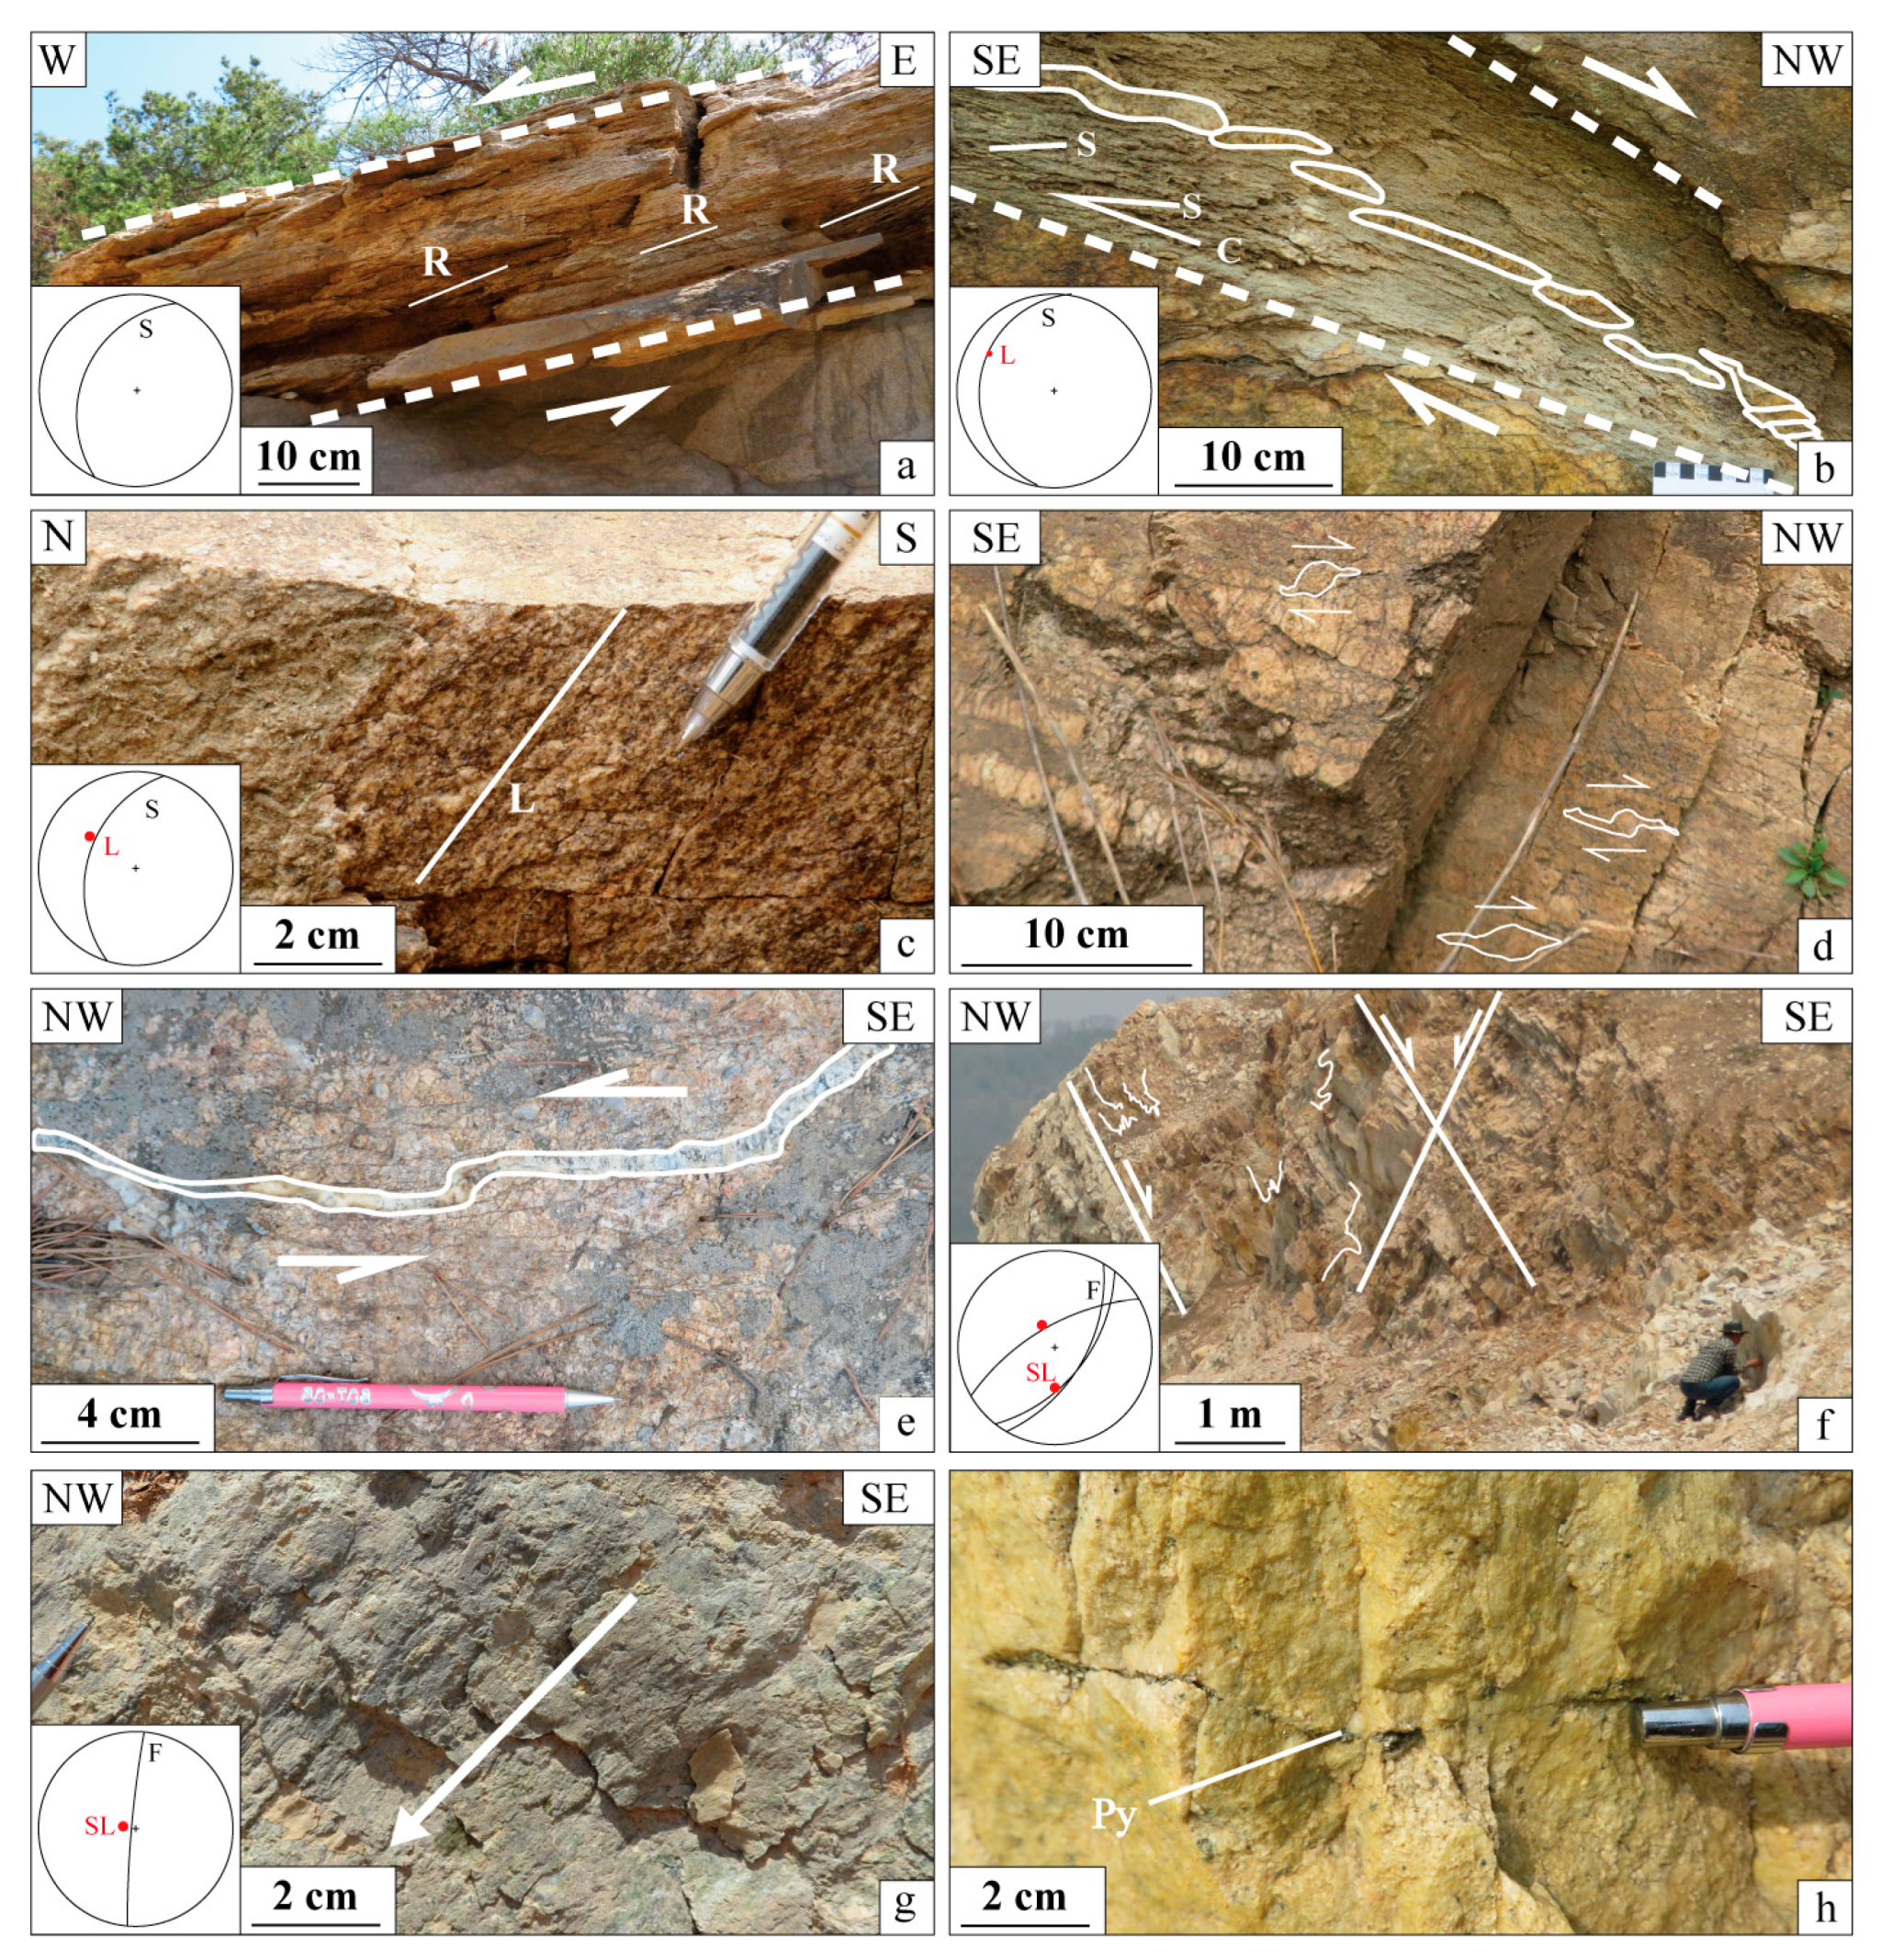
3.1. Ductile Deformation of the MR

Owing to the strong weathering and cultivation on the surface, there are lack of high-quality outcrops and well-documented deformation. However, we tracked along the MR and found some good outcrops. Evidence for ductile deformation in the MR is preserved by kinematic indicators involving S-C fabrics, sigmoidal porphyroid structures, domino structures and asymmetric folds (Figure 3).
There is a narrow shear zone about 30 cm wide in location 10 (Figure 2) above the weakly gneissic granite (Figure 3a). The thin-banded mylonitic foliation formed by feldspar and quartz aggregates dips to the NW about 295° with a dip angle around 30°. The lineation of the mylonite and the hanging-wall are uneasy to observe in the field due to strong erosion. Another well-documented outcrop was found in the middle part of the MR with the ductile formation (near location 7 in Figure 2). The sub-horizontal (about 15°) thin-banded mylonite was intruded by felsic veins exhibiting domino structure (Figure 3b). The lineation formed by elongated quartz bands can be observed on the foliation surface and plunges towards 300° with plunge angles between 12 and 15°. The combination of the lineation and the domino structure of felsic veins also suggest the top-to-the-NW sense of shear. In another outcrop (location 1 in Figure 2), the gneissic foliation formed by feldspar, quartz and biotite dips to the NW about 287° with a dip angle around 37° and the lineation plunges towards 305° on the foliation surface (Figure 3c). Aggregates including quartz and feldspar exhibit sigmoidal shapes, indicating a top-to-the-NW sense of shear (Figure 3d). Some asymmetric folds in calcite veins with fibers perpendicular to oblique to the vein walls also show the same shear sense, as illustrated in Figure 3e.

3.2. Brittle Deformation of the MR

Different types of brittle structures are well-documented in the MR including fault gouge, fractures, veins, slickensides, small and large-scale faults (Figure 3a,f–h). R fractures inside the shear zone provide evidence for the top-to-the-NW slip direction (Figure 3a). Most brittle faults strike NE-NNE with ubiquitous high dip angle at 65–85°, dipping NW or SE (Figure 2 and Figure 3f,g). Some faults may crosscut early folded veins (Figure 3f). The fault gouge is made of yellow-colored fine grains and pyrite always presents in the cracks near these faults (Figure 3h). Striations are common on the fault surface, indicating the characteristic of normal slip-direction with fault steps (Figure 3g).
The principle extension direction was determined for the development of the MR by using fault-slip data. Following the calculation method proposed by [59,60], the principal stress orientations (σ1, σ2 and σ3) were inverted from the measured fault-slip datasets, using software SG2PS developed by [61]. From this technique we can constrain the principle extension direction (σ3) recorded on the study faults, although it is still in debate [49]. All the average angular difference (ANG) between predicted and actual striations are less than 25°, which suggests that the calculated stress orientations are reliable [62]. Calculating results (Figure 2) show that the principle extension direction is consistent with the development of the brittle faults in the MR, which is under NW-SE extension. It should be noted that the extension direction of normal faults is also consistent with that indicated by mineral elongation lineation in the MR, suggesting that both ductile shear zones and brittle faults in the MR developed under a consistent stress field.

4. Microscopic Observations and Deformation Conditions

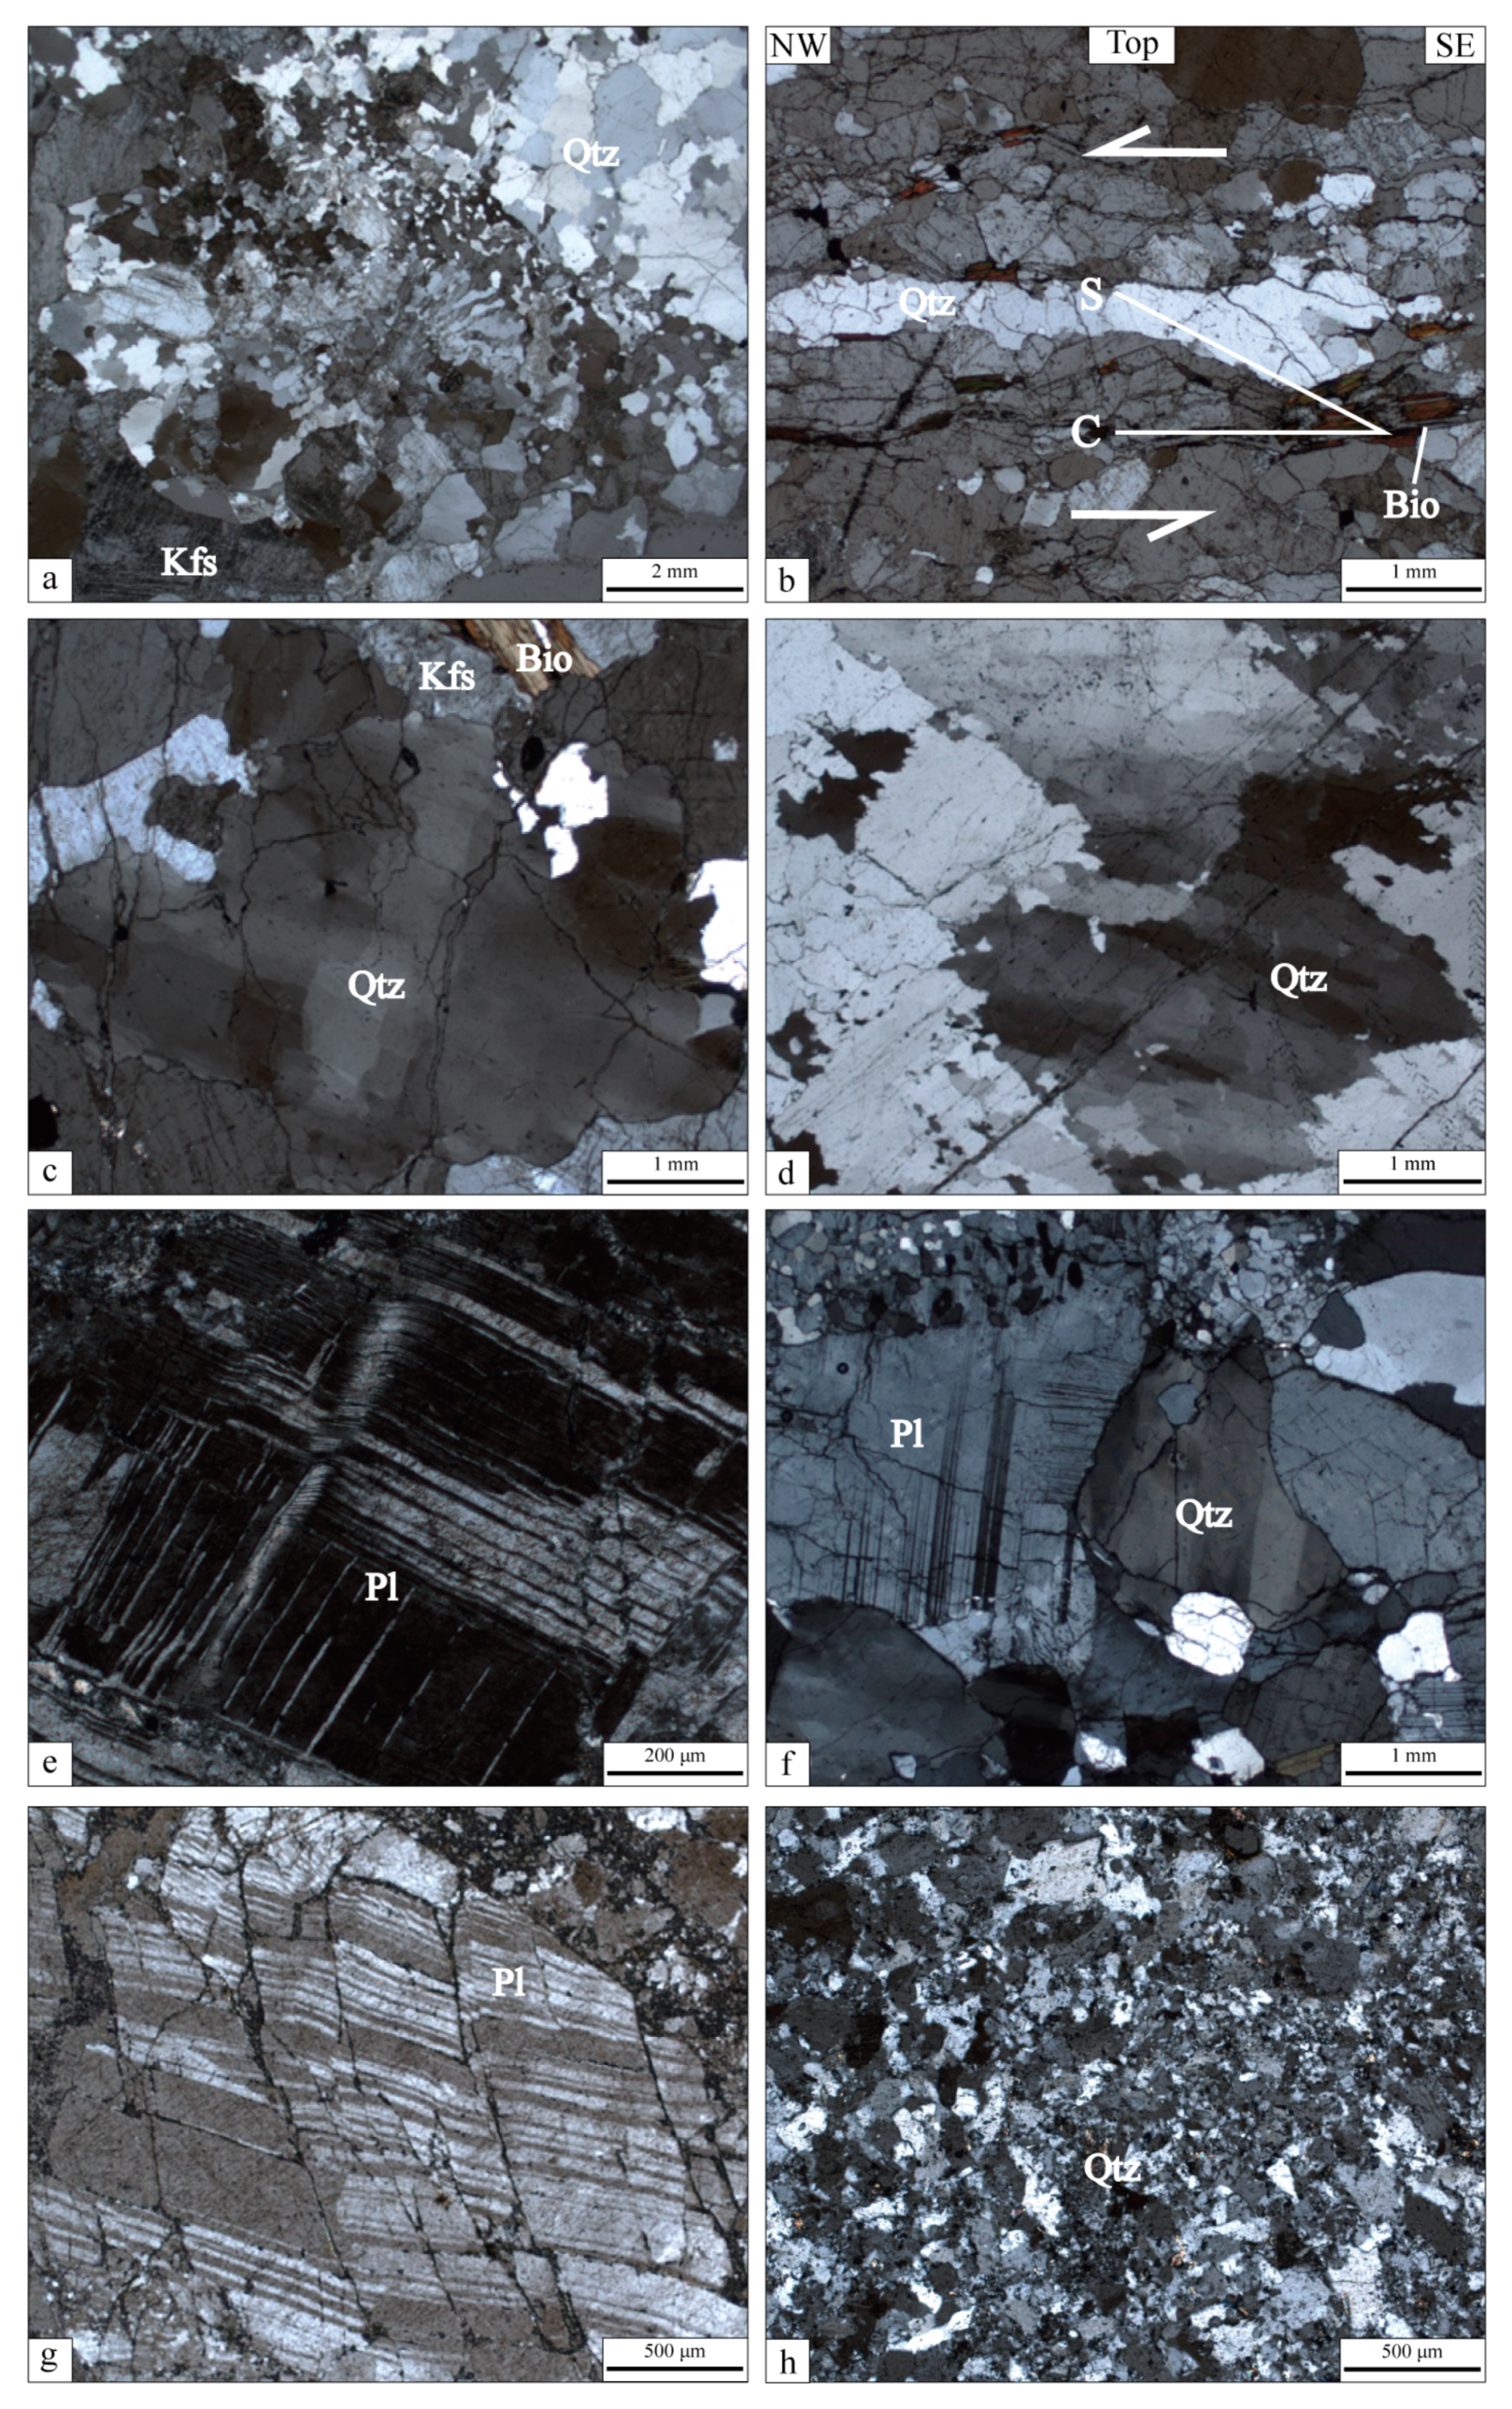
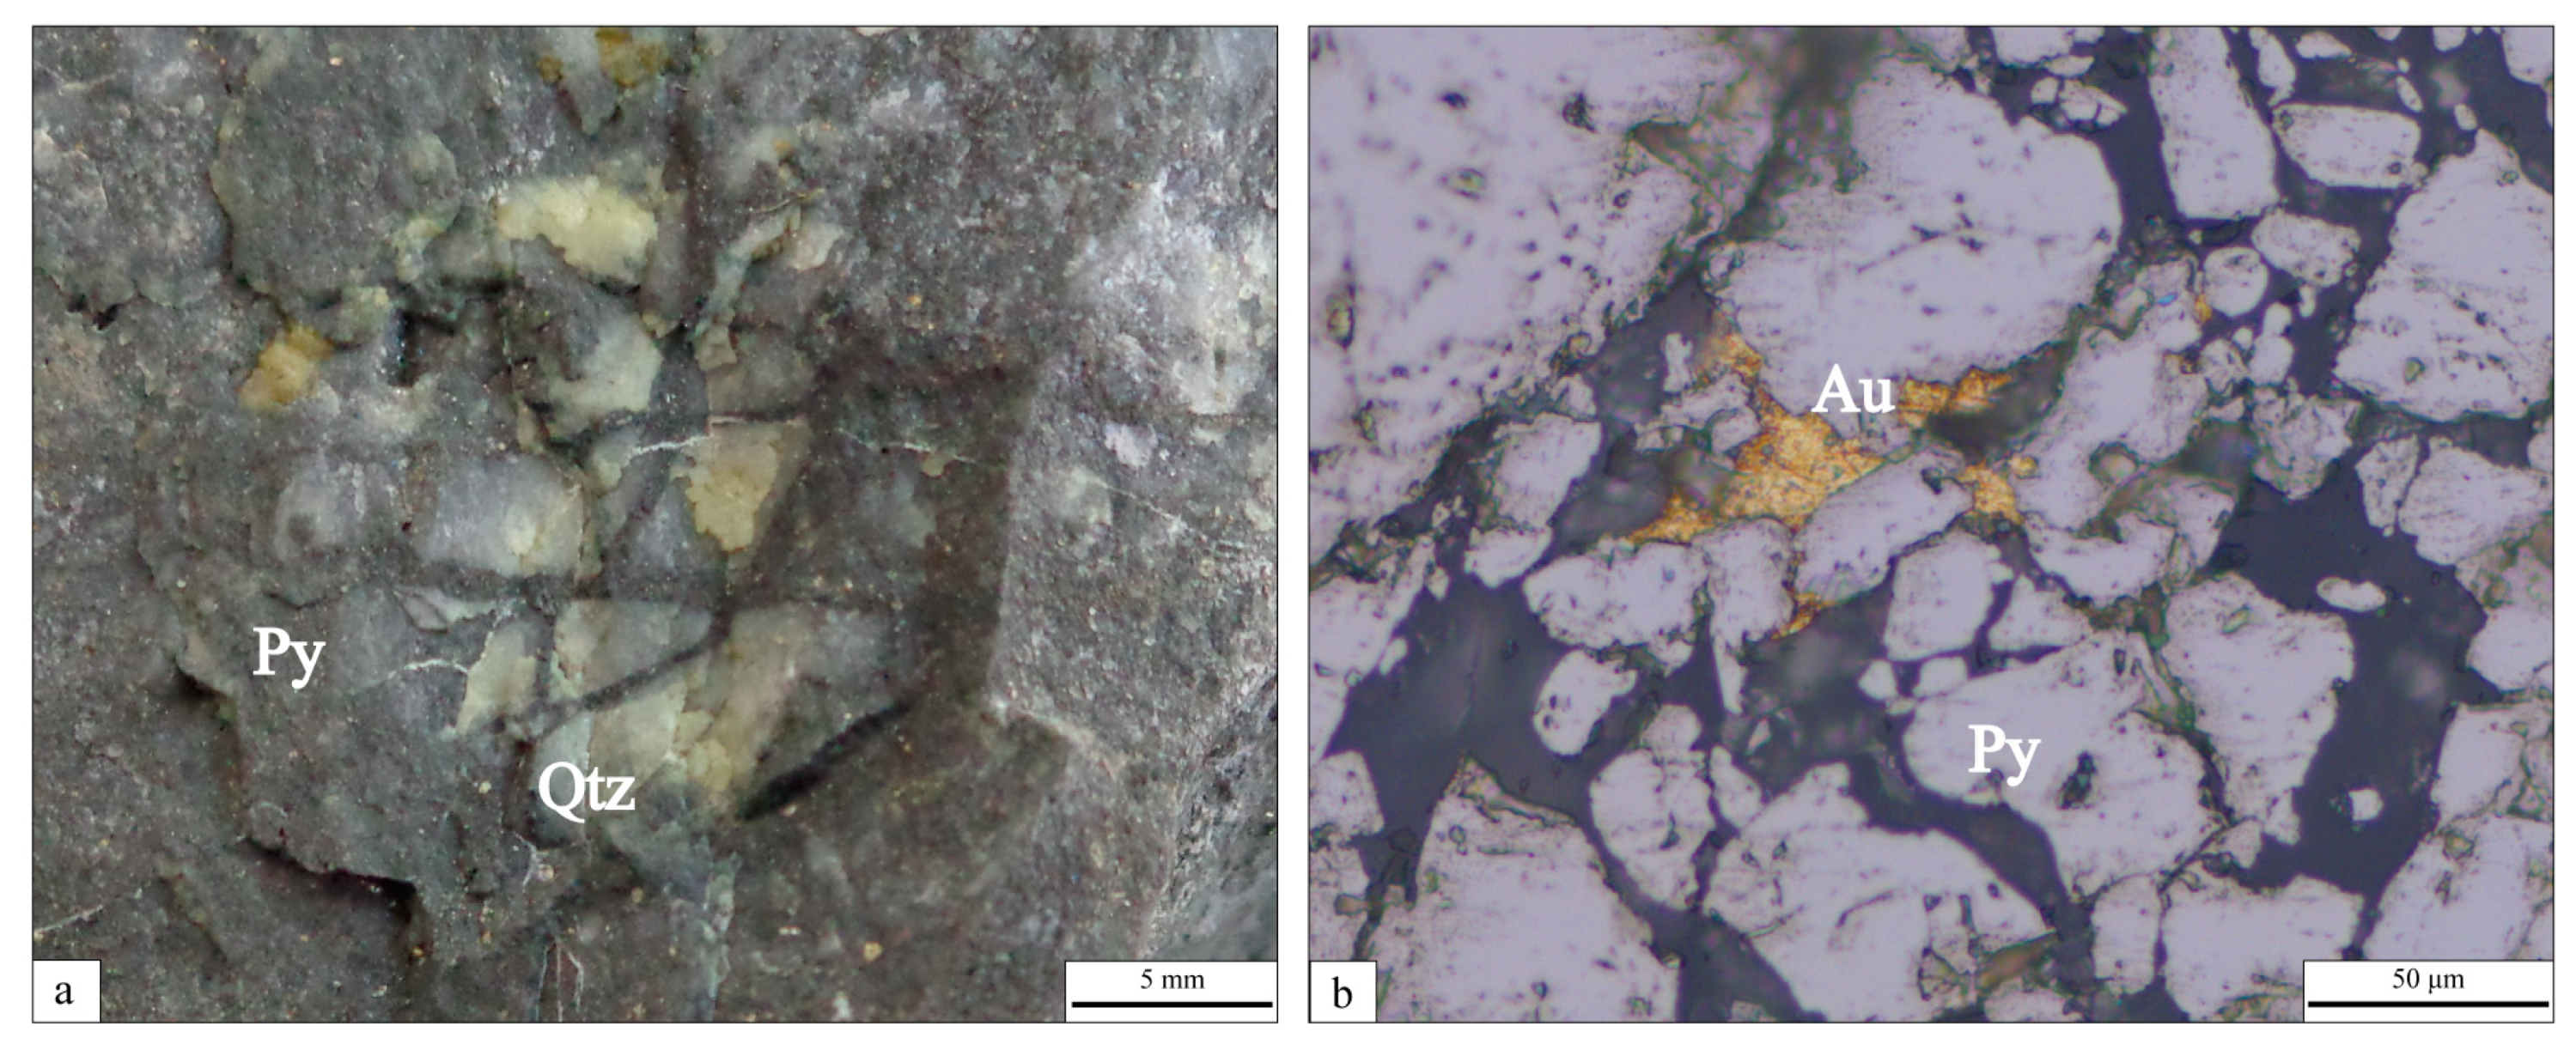
4.1. Microscopic Observations in the MR

The rock deformation mechanisms (e.g., ductile and brittle deformation) and conditions (e.g., temperature) can be identified by the microstructural features of deformed minerals (especially for quartz and feldspar) [63,64]. Deformed samples from the MR were used for the microscopic observation. In order to get better information about the deformation style and the kinematics of shear zones, several samples were chosen to approximate the principal section XZ of the finite strain ellipsoid so that the thin sections were cut perpendicular to the foliation and parallel to the lineation.
In the thin sections, both high- and low-temperature deformation microstructures of minerals were observed. In the granitic mylonite, myrmekitic textures were present along the boundary between K-feldspar and quartz (Figure 4a). In the gneissic mylonite, quartz shows dynamic recrystallization with GBM (Figure 4b). Additionally, S-C fabrics formed by elongated quartz band and oriented biotite indicate a top-to-the-NW shear sense. Chessboard subgrains were also present in some quartz grains (Figure 4c). These characters suggest high temperature deformation (500–600 °C) [63]. Microstructures of the medium temperature (400–500 °C) deformation were abundant in collected samples. For example, deformation twins were common in plagioclase (Figure 4e–g) and some twins in the crystal were bent (Figure 4e). Quartz grains display ribbon-shaped subgrain rotation recrystallization (Figure 4d). The typical low temperature (<400 °C) deformation microstructures included belt extinction (Figure 4f) of quartz, intracrystalline cracks (Figure 4g) and cataclastic textures (Figure 4h).

4.2. EBSD Analysis

The electron backscatter diffraction (EBSD) analysis is widely used in the study of quartz crystallographic preferred orientations (CPOs), deformation mechanism, dislocation and slip system, pressure and temperature conditions of crystals [64,65,66,67]. The CPOs of quartz c-axis are consistent with the dominant slip system under different conditions, which can provide further information about the deformation of shear zones [63].
The EBSD analysis was performed on a FEI Quanta 450 field emission gun scanning electron microscope coupled with an Oxford Instruments HKL Nordlys II EBSD detector at the State Key Laboratory of Geological Processes and Mineral Resources, China University of Geosciences, Wuhan. XZ sections for EBSD mapping were chemical-mechanical polished with a 0.05 μm colloidal silica solution for about two hours. Analytical conditions were operated at 15 kV accelerating voltage and working distance of 25 mm. Samples were tilted at 70° and a step size between 2 and 5 μm was used for EBSD mapping. All collected data (Figure 5) was processed using the HKL Channel 5 software package and all pore figures were presented with an equal area, lower hemisphere projection. Grain boundary maps of quartz were used for the fractal analysis with a subgrain definition of 10 degrees misorientation [68,69].
Results of the quartz c-axis fabrics from the MR mainly displayed point maximas (Figure 5). Fabrics in samples 1030 and 3021 consisted of a maxima close to the Y-axis, as a result of the prism <a> slip under high temperature (500–650 °C). Maximas in sample 2917 were distributed between the Y-axis and base circle, indicative of the rhomb <a> slip under medium temperature (400–500 °C). The quartz c-axis fabrics in sample 2810 and 3019 show Z maxima, which is compatible with low-temperature basal <a> slip (300–400 °C). What is more, the CPOs of quartz c-axis in sample 2914 and 2916 show complex transitions, e.g., from Y maxima to maximas between the Y-axis and base circle in sample 2914, and from maximas between the Y-axis and base circle to Z maxima, respectively. These CPO patterns were attributed to deformation superposition during the progressive shearing of the MR, which was consistent with the microscopic observations. Remarkably, these asymmetric CPOs of quartz c-axis are common during non-coaxial progressive deformation, and angles between the X-axis and the tilt direction of the CPOs indicate the top-to-the-NW sense of shear [70,71,72].

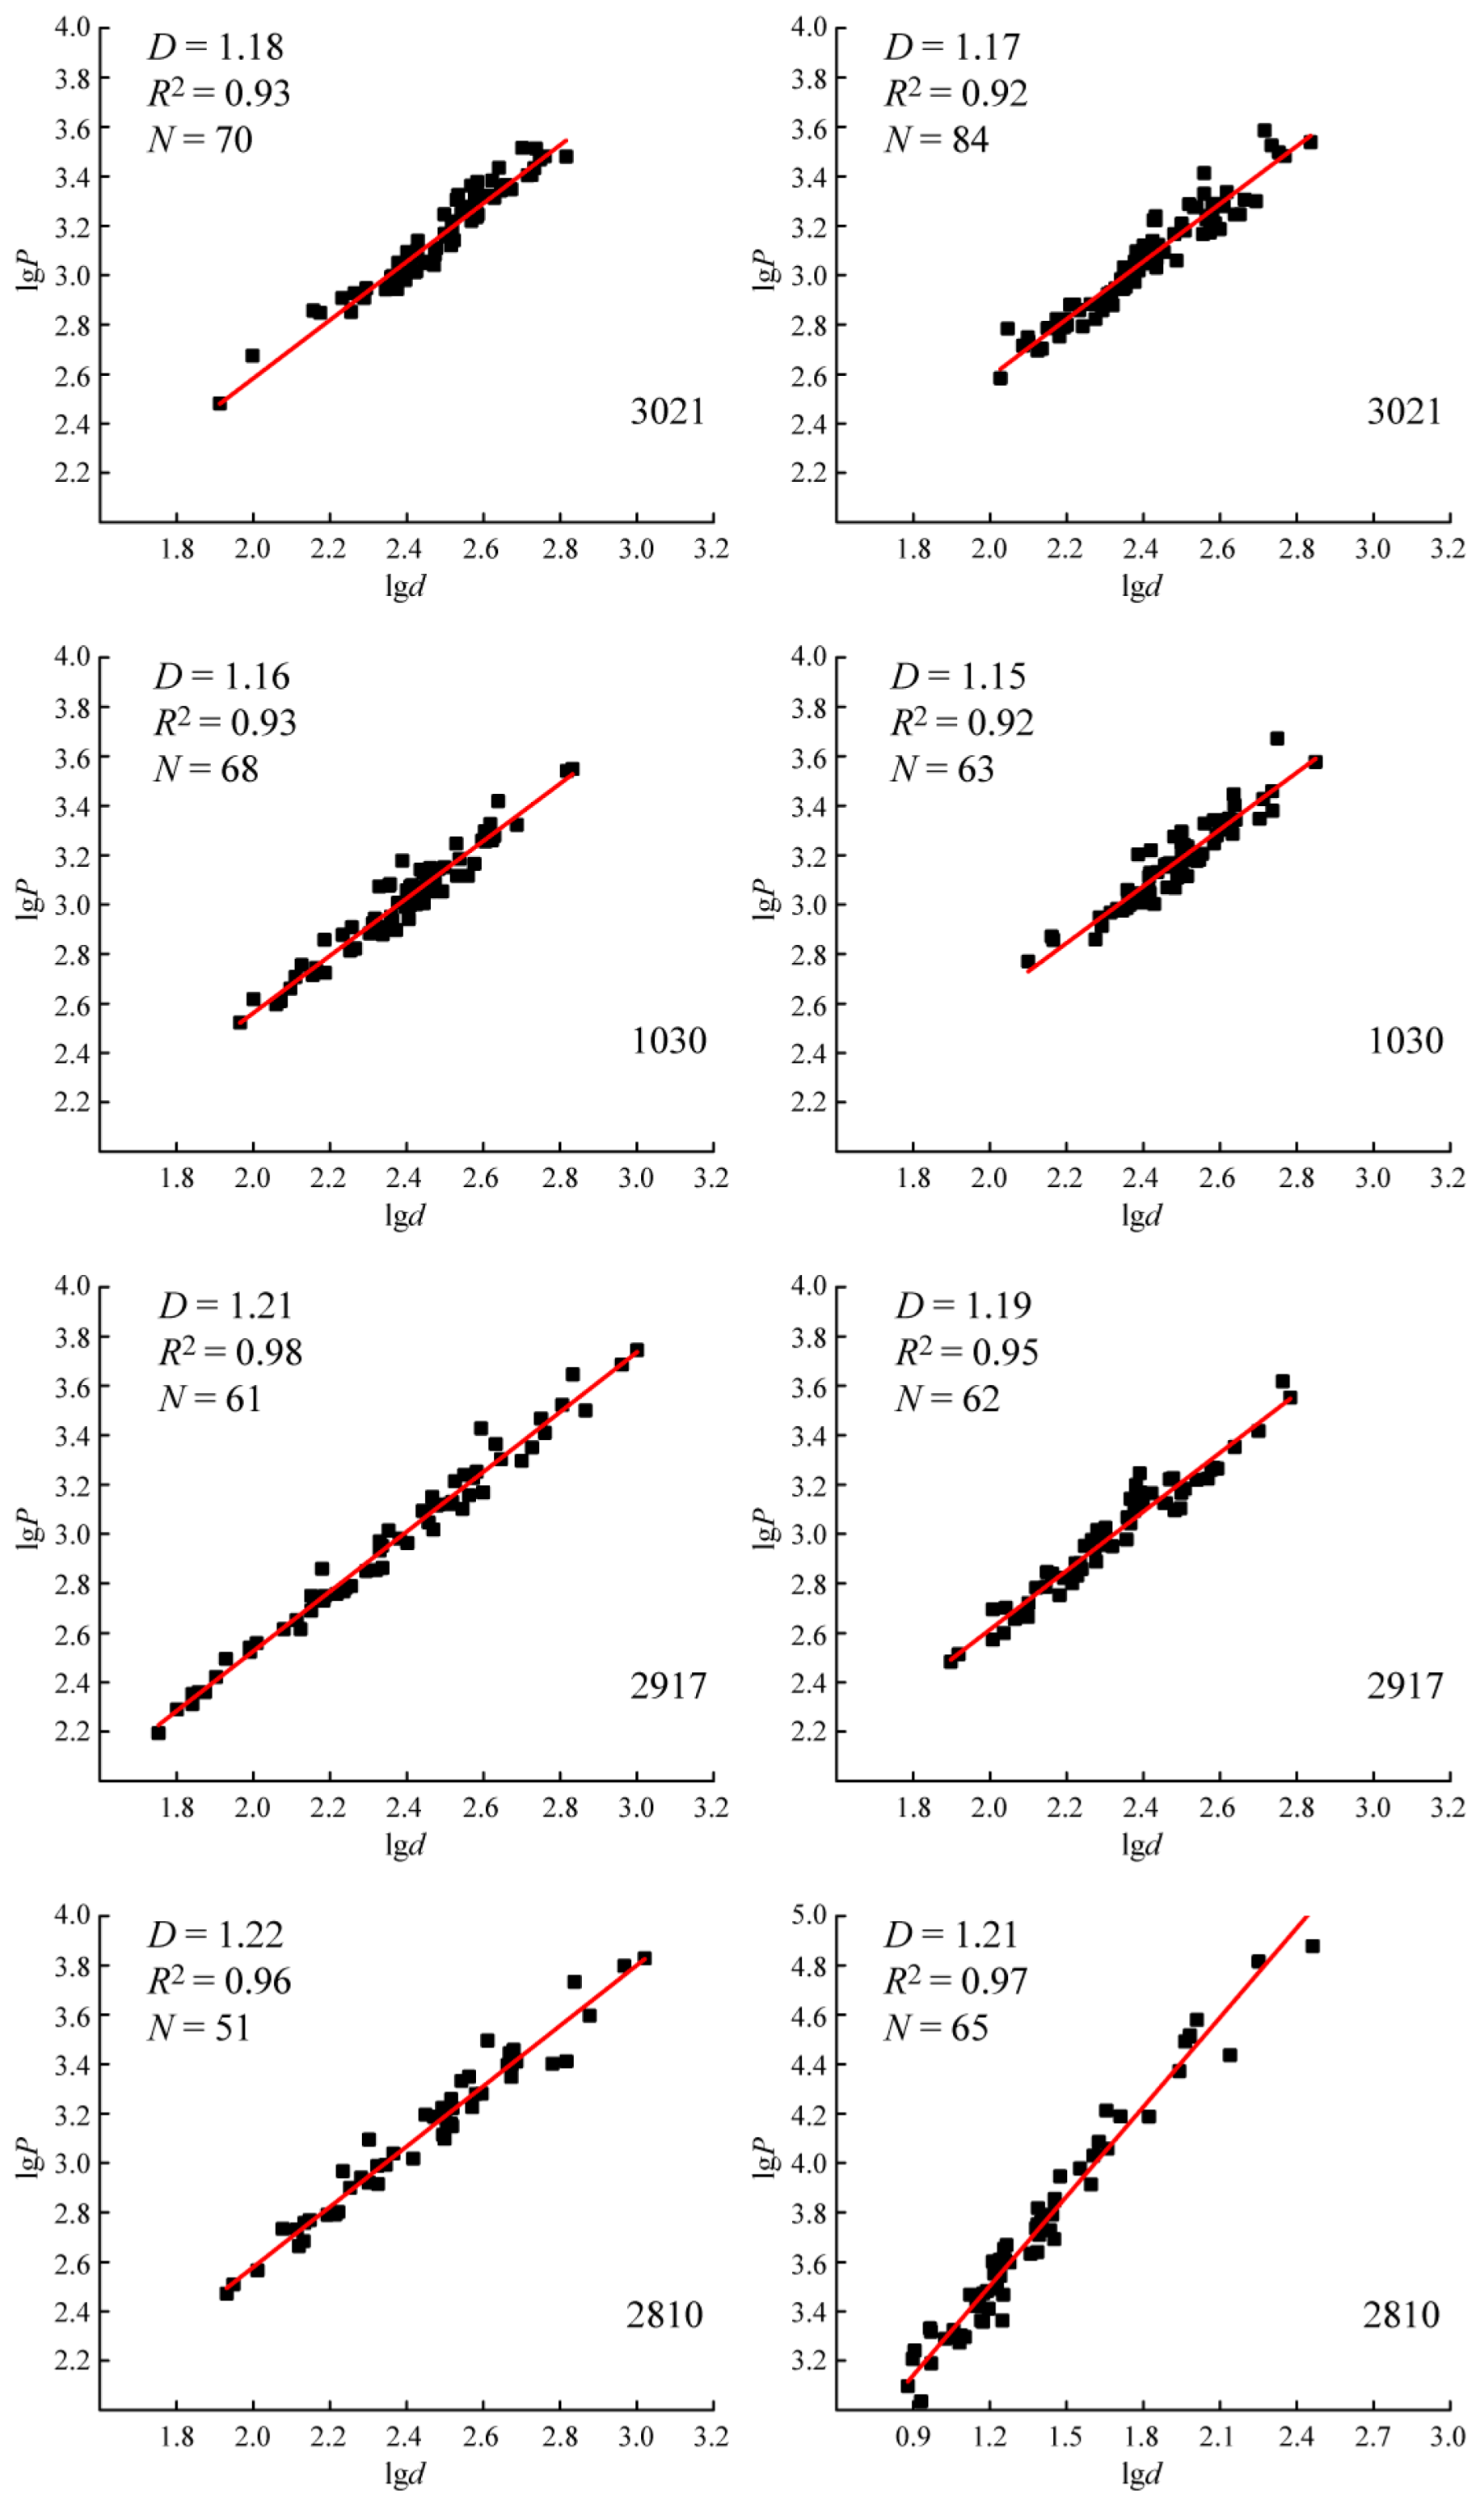
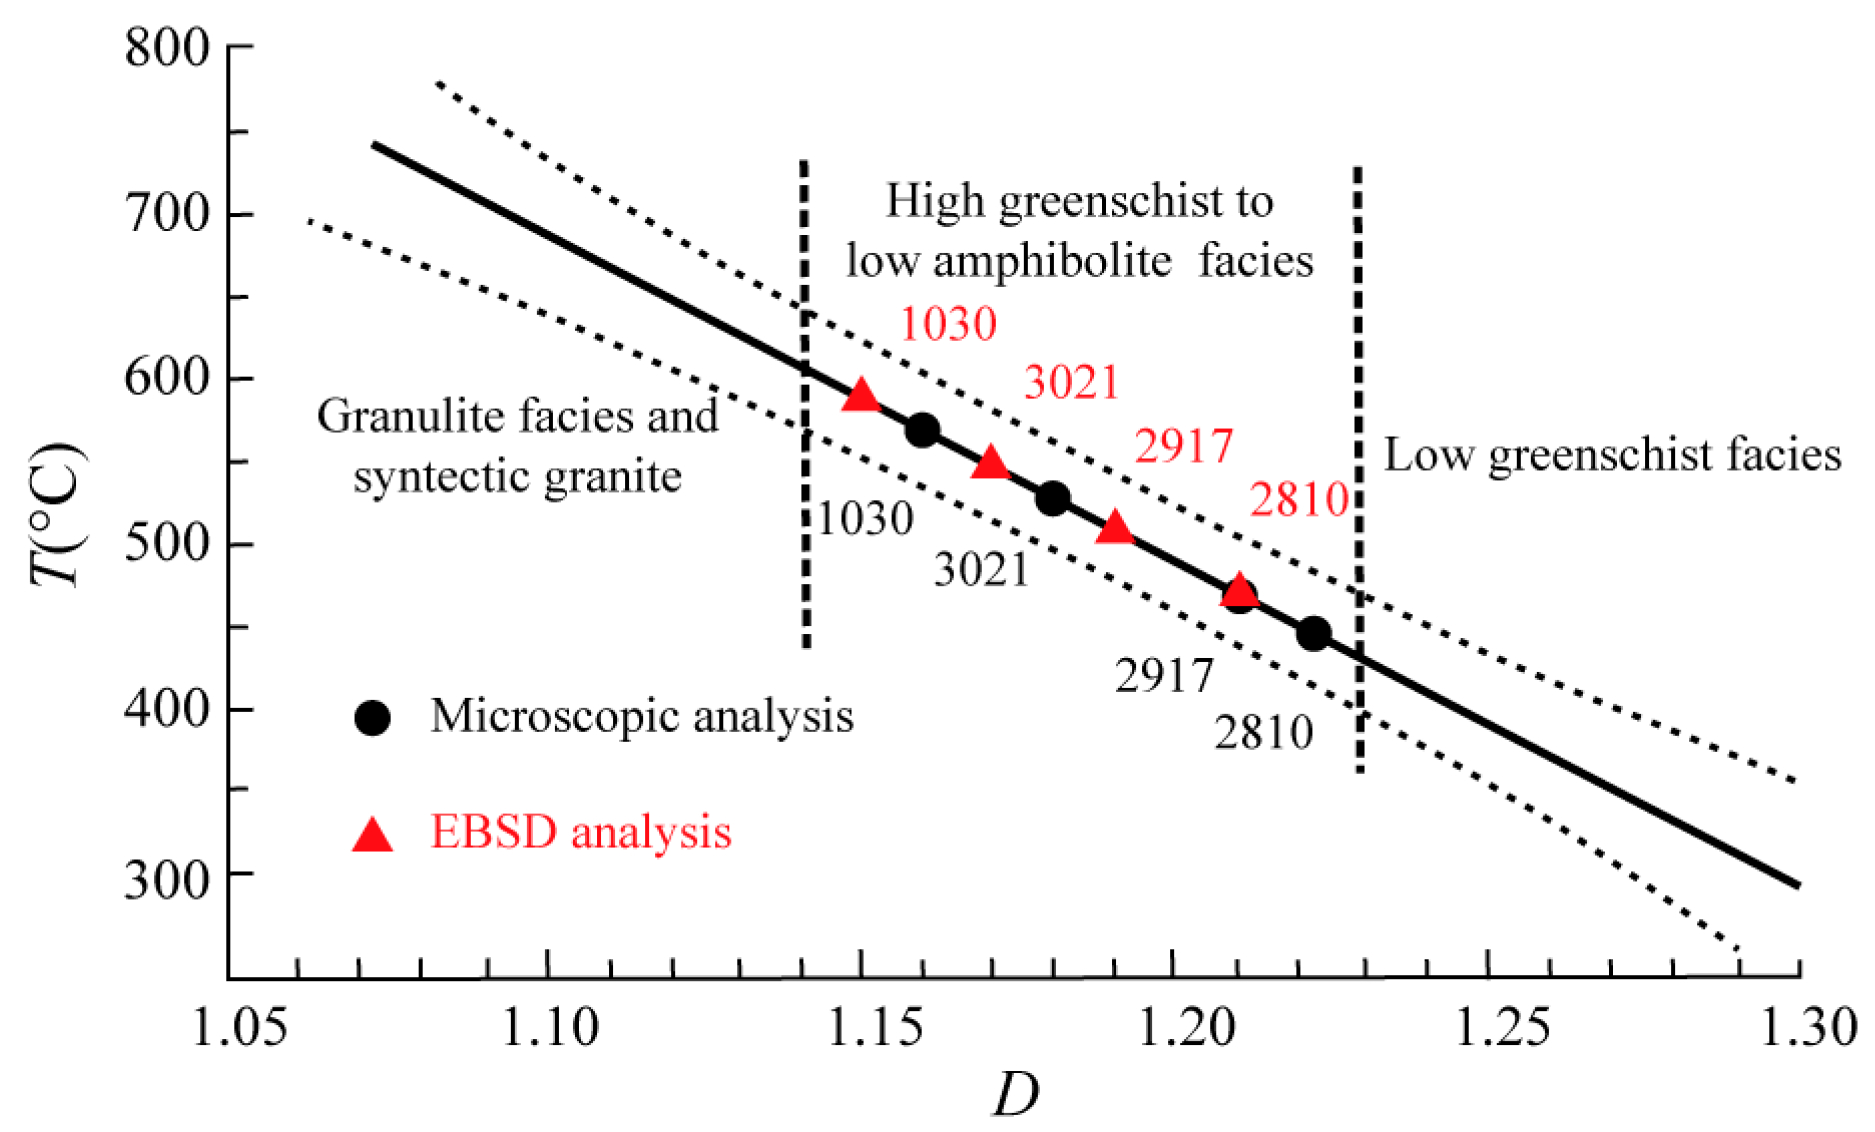
4.3. Fractal Analysis of Dynamically Recrystallized Quartz Grains

A better understanding of the deformation temperature and strain ratio is critical to the evolution history and kinematics of shear zones. Despite EBSD analysis, fractal analysis of dynamically recrystallized quartz grains is proved as an effective method to get the physical conditions of shear zones [73,74,75]. In a simple sense, the grain boundary (perimeter) and grain size (calculated as diameter of equivalent circle) of recrystallized quartz have a statistically linear correlation in two dimensions, and the slope represents fractal dimensions D. The D-value decreases with increasing temperature during formation of shear zones. So, on a statistical basis, D can be applied as a geothermometer for shear zones [76,77,78].
Four mylonite samples from the main shear zones of the study area are employed to do the analysis. All quartz grains have recrystallized boundaries with sub-grains rotation mechanism. Photos from microscopic analysis and grain boundary maps from EBSD analysis were used for the dense area of recrystallization, respectively. Next use drawing software to do the vectorization and count the actual perimeter P and area A for each deformed grain (more than 50 grains). The area A is used to calculate the diameter d of circle having the same area. Then by plotting lgP on the vertical axis and lgd on the horizontal axis, the fractal dimension D is represented as the slope of a least-squares fitted line. The range of D is 1 ≤ D ≤ 2 for two-dimensional analysis.
The fractal analysis results of the MR are shown in Table 1 and Figure 6. The correlation coefficient revealed a value more than 0.9, and D was in the range of 1.15–1.22, which indicate the boundary shape for the measured grain size was self-similar statistically. Comparing the Kural thermometer [73] and the relationship diagram between fractal dimension and deformation temperature (Figure 7), it was obvious that the deformation temperature was in the range of 400–600 °C, corresponding to the metamorphic condition from high greenschist facies to low amphibolite facies. Among them, the deformation temperature of data from the EBSD analysis were much higher than microscopic data, which might suggest that the EBSD data could give a much more accurate classification (Figure 6 and Figure 7).

5. Deposit Geology

Most gold deposits, e.g., Rushan, Denggezhuang and Yinggezhuang deposits, are distributed along the NNE-striking MR (Figure 1). Several large-scale gold veins were identified in the Rushan deposit located in the main shear zone (Figure 8a). While some other veins in the Denggezhuang and Yinggezhuang deposits were located in the secondary shear zones (Figure 8b,c). Moreover, section maps from drill-holes show that auriferous parts were located in the occurrence-change portion in a whole quartz vein, especially in the dip-turn-to-gentle positions (Figure 8d,e). The gold-quartz veins were characterized by strong silicification and sulfidation, together with sericitization and K-feldspar wallrock alteration (Figure 9a,b). In the middle of veins, quartz was fractured into breccia surrounded by disseminated sulfides, e.g., pyrite (Figure 9a). There were many small-scale auriferous veins near the main shear zone (Figure 9b) and the occurrence analysis from the limited data suggests that they were subsidiary fractures, including R and T fractures (Figure 9g,h).
Microscopic observations show that ore minerals for these deposits include pyrite, chalcopyrite and native gold and most of them experienced strong fracturing (Figure 9c,d). Native gold is mainly preserved at open and healed fractures in pyrite (Figure 9c,d). Ductile deformation microstructures at medium temperature are abundant in the wallrocks close to ore bodies (Figure 9e,f), e.g., ribbon-shaped subgrain rotation recrystallization in quartz and deformation twins in plagioclase. Other evidence from the fluid inclusion research of ore bodies indicate the depositing temperature of 170–324 °C and pressure of 92–269 MPa [38,53].

6. Discussion

6.1. Geological Characteristics of the MR

It has been widely proposed that NCC has undergone large-scale lithosphere thinning in the extensional regime since late Mesozoic [29,67,79]. A series of NE-NNE-striking detachment shear zones and MCCs have been identified in Jiaodong Peninsula during this period, e.g., the Linglong MCC [80], the Wulian MCC [81], the Queshan MCC [67] and the Kunyushan MCC [15]. In this study, the MR was located at the western part the Kunyushan MCC (Figure 1b). It is well-known that the exhumation of MCCs is usually accompanied by the intrusion of plutons and ductile deformation along detachment shear zones. However, previous studies largely focused on the high-angle normal faults in the MR and considered them as a part of the hanging-wall of the detachment shear zone [82]. Evidence of ductile deformation and evolution history in the MR has been lacking until now.
Our detailed analysis from field and microscopic observations reveal that the MR has experienced progressive shearing. Given the lack of direct age data for the detachment shearing in the MR, it is need to combine the age data of intrusion for the Kunyushan and Sanfoshan plutons and the contact relationship between the plutons and shear zones to accurately constrain the exhumation of the MCC. Based on the structural analysis and previous dating results, the evolution of the MR is constructed into two stages: early stage high-temperature ductile shearing and late stage low-temperature brittle deformation.
(1) In late Jurassic (160–155 Ma), magmatism in the Muping-Rushan area started its activity and the Kunyushan pluton emplaced. During this period, the ductile detachment shear zone (the MR) of the Kunyushan MCC was initiated between the pluton and Precambrian basement under the top-to-the-NW sense of extension (Figure 10a). S-C fabrics, asymmetric folds and sigmoidal porphyroid structures were well developed in this shear zone. Evidence from microscopic deformation fabrics shows high temperature condition (500–600 °C). Given 33 °C/km as the geothermal gradient [77], the corresponding depth of shearing was in the range of 15–18 km, which belongs to the middle crust [3].
(2) From late Jurassic to early Cretaceous, the MR was progressively exhumed via middle crust to subsurface level in a NW-SE extensional regime (Figure 10b). A series of brittle faults superimposed on the MR. Domino structures, conjugate fractures, slickensides and steps are abundant in the shear zone and minerals experienced middle-to-low temperature deformation and commonly show cataclastic texture. At the late period of early Cretaceous (115–111 Ma), the second stage emplacement began its activity, forming Sanfoshan pluton.
The kinematic characters of the MR are consistent with other regional shear zones in Jiaodong Peninsula during early Cretaceous, e.g., the Zhaoyuan-Pingdu shear zone in the northwest part of Jiaodong Peninsula [30,83] and the Queshan shear zone in the earth part of Jiaodong Peninsula [67]. Macro and micro observations show that these NE-NNE-striking shear zones experienced NW-SE extension during gold mineralization. It has been widely proposed that the westward subduction, roll-back and trench retreat of the Paleo-Pacific plate (the Izanagi plate) gave rise to tectonics of Jiaodong Peninsula while these shear zones were active [15,29]. Dehydration of the subducted slab, partial melting of the mantle and the following intense magmatism play important roles in the activities of these shear zones and gold mineralization.

6.2. Relationship Between the MR and Gold Mineralization

Previous studies have revealed that the gold mineralization is coeval with structural activities in Jiaodong deposits indicating the coupled behavior between them [15,29]. However, the relationship between ore bodies and shear zones in the MR still need further study. Combining with previous researches and our study, it is suggested that most gold deposits are located in the brittle deformation part of the MR. More detailed observations indicate that ore bodies are concentrated in occurrence change portions of shear zones, e.g., the striking-turning portions in the geological maps and the dip turn-to-gentle positions in the sectional maps (Figure 8). Among them, a part of gold ore bodies are located in the secondary fractures of the MR, which belong to R and T fractures (Figure 9g,h). Others are formed in the main shear zones with brittle fractures and cataclasite (Figure 9a). It should be noticed that wallrocks close to ore bodies generally experienced medium-temperature ductile deformation (Figure 9e,f), while the ore bodies show brittle deformation (Figure 9c,d). Given these geological settings of the MR, there are two possible reasons for gold mineralization.
(1) At middle crust level, the development of ductile deformation of the MR makes it more permeable (Figure 10a). Therefore, the shear zone is more likely acting as a deep channel promoting the migration of ore-forming fluids, which were derived from cooling magma or mantle degassing during the period of craton destruction [29]. The fluid pressure was gradually accumulated at the stress concentration parts due to ductile deformation [84].
(2) At upper crust level, brittle deformation promoted the quick migration of fluids (Figure 10b). When they arrived at the occurrence change portions, the higher normal stress prevented the slip of shear zones, resulting in the stress concentration and the formation of high-pressure fluids [19].
The occurrence of high-pressure fluids in these two processes above can not only decrease rock strength [85], but also accelerate the strain rate [5]. Under high strain rate, brittle fractures (e.g., R and T fractures and cataclasite in the MR) occurred and decreased the fluid pressure rapidly causing flash vaporization. This process plays an important role to the physical-chemical state of the fluid, e.g., the solubility of quartz would decrease suddenly resulting in co-precipitation of silica with gold [86]. With the development of the MR, this process worked as a circulation and gradually caused gold accumulation in the shear zone.

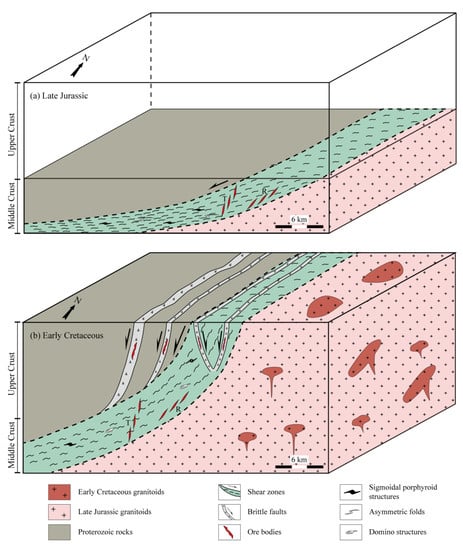
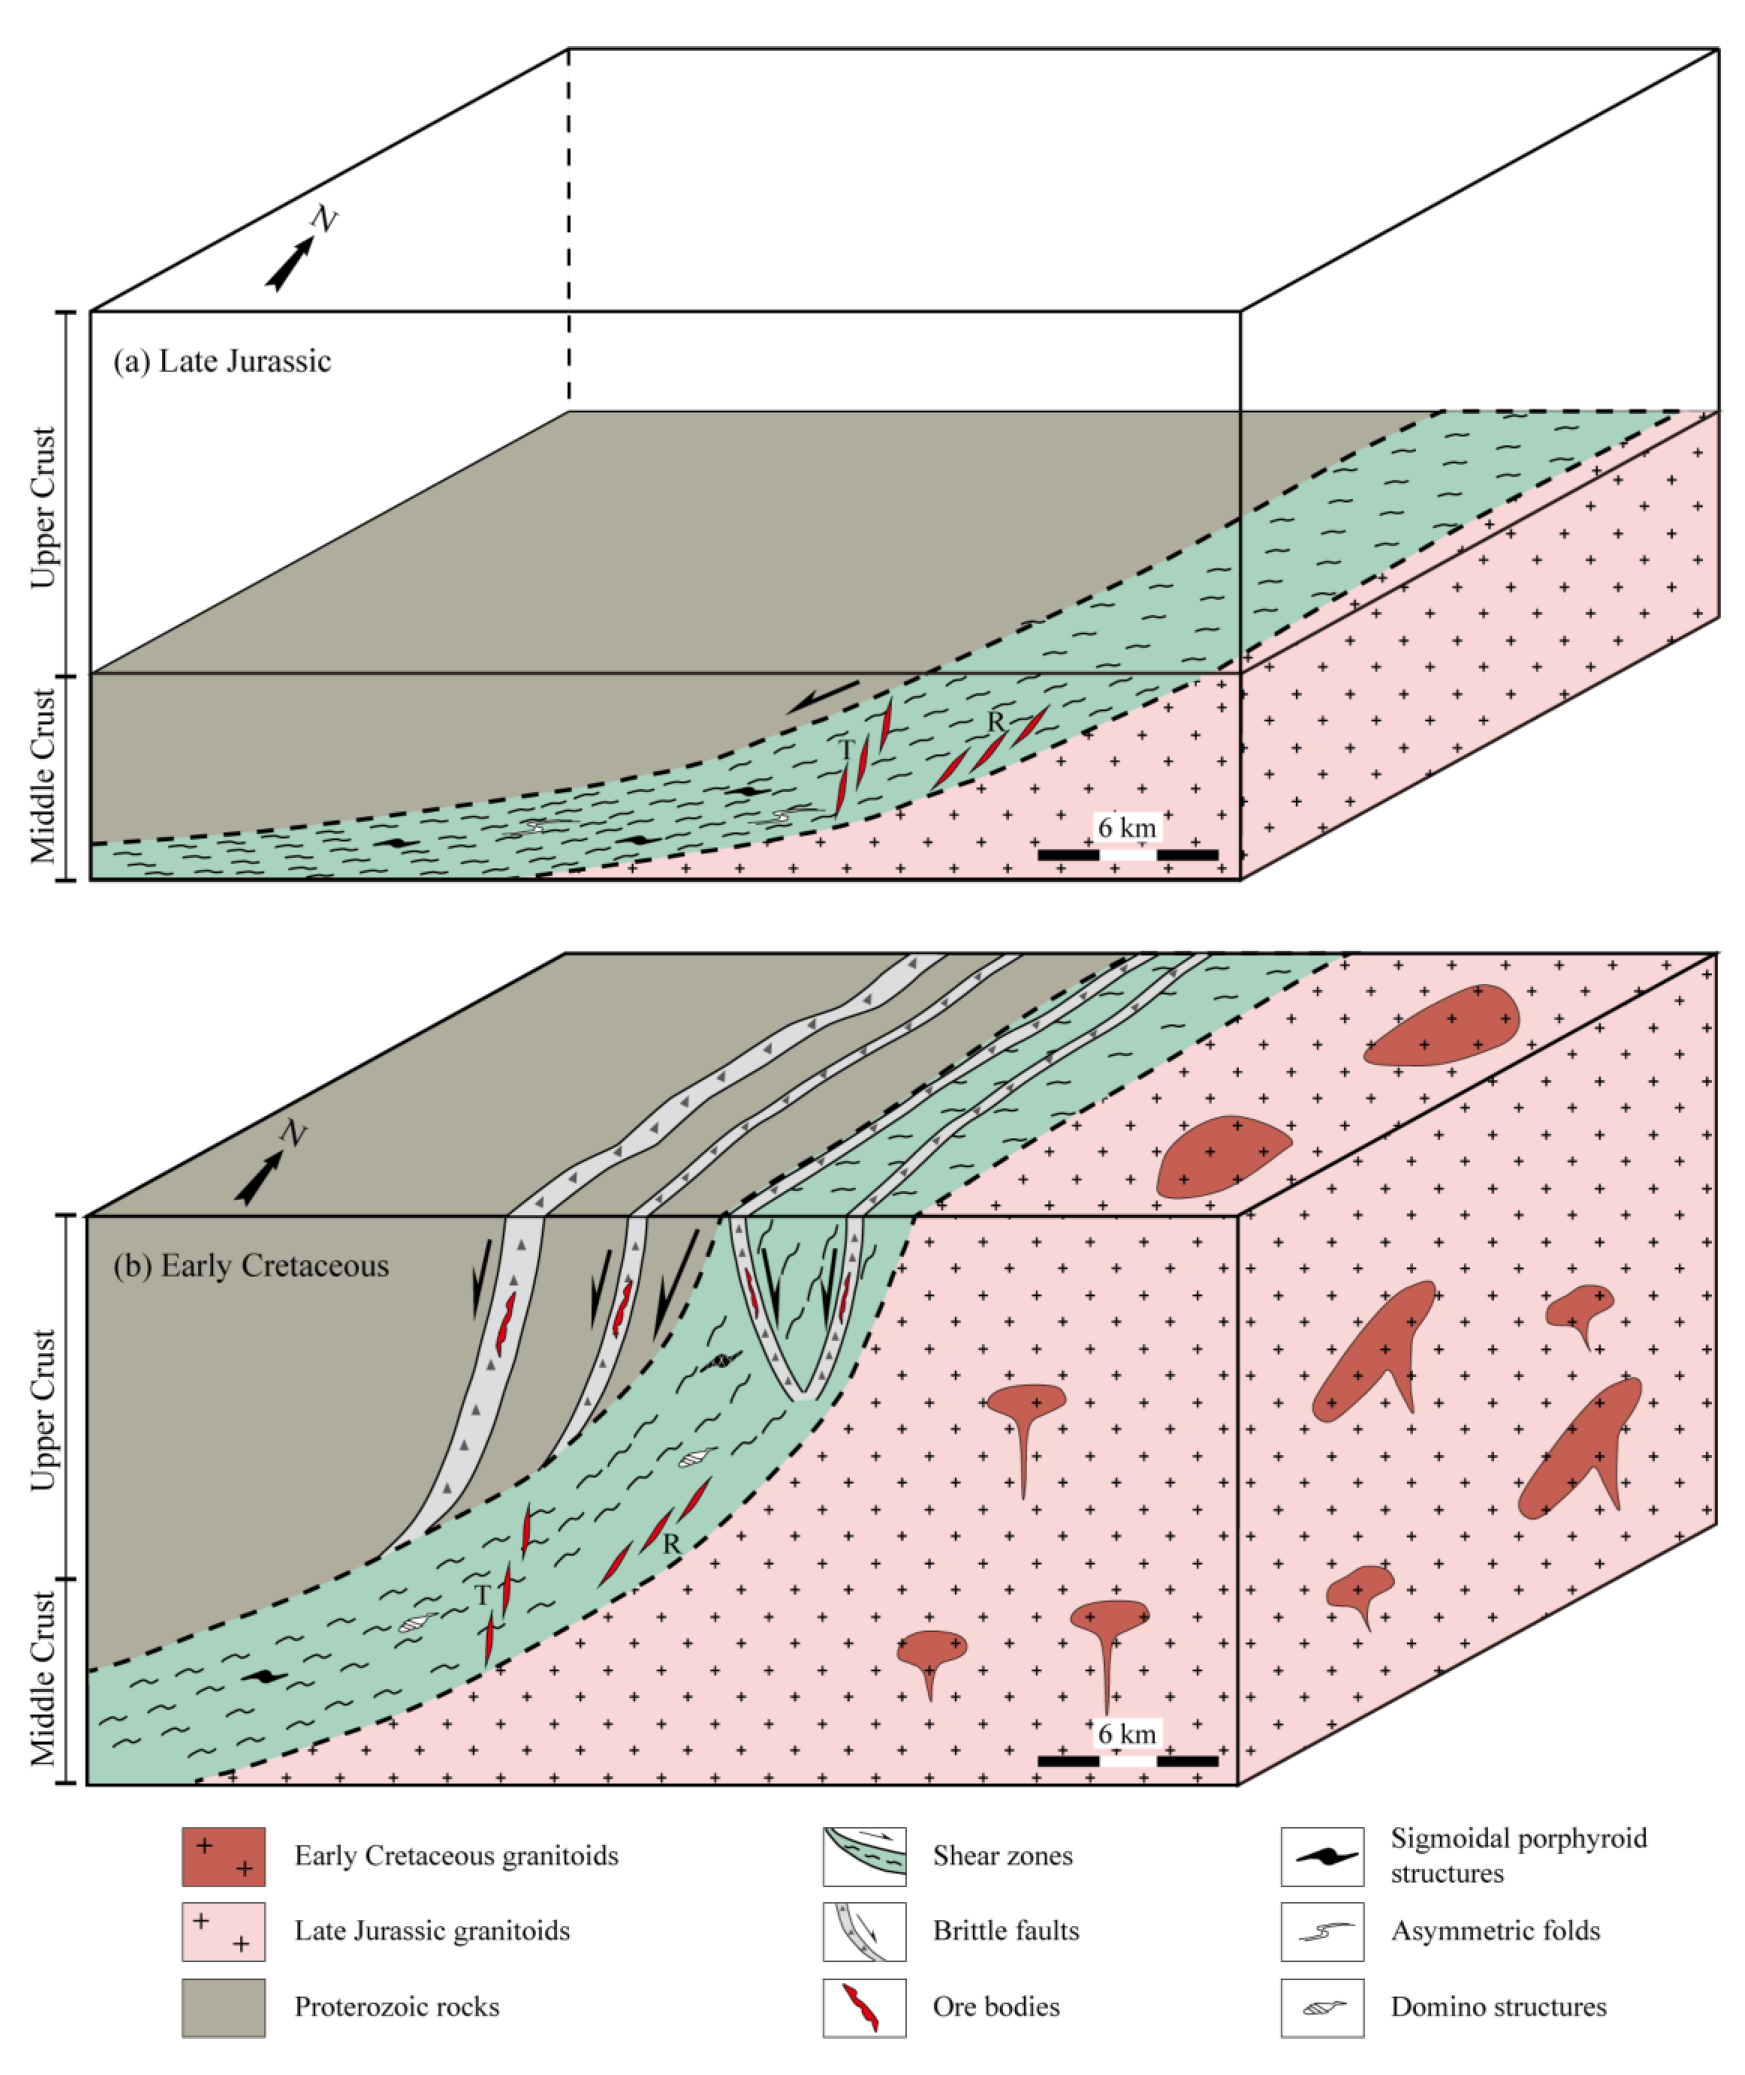
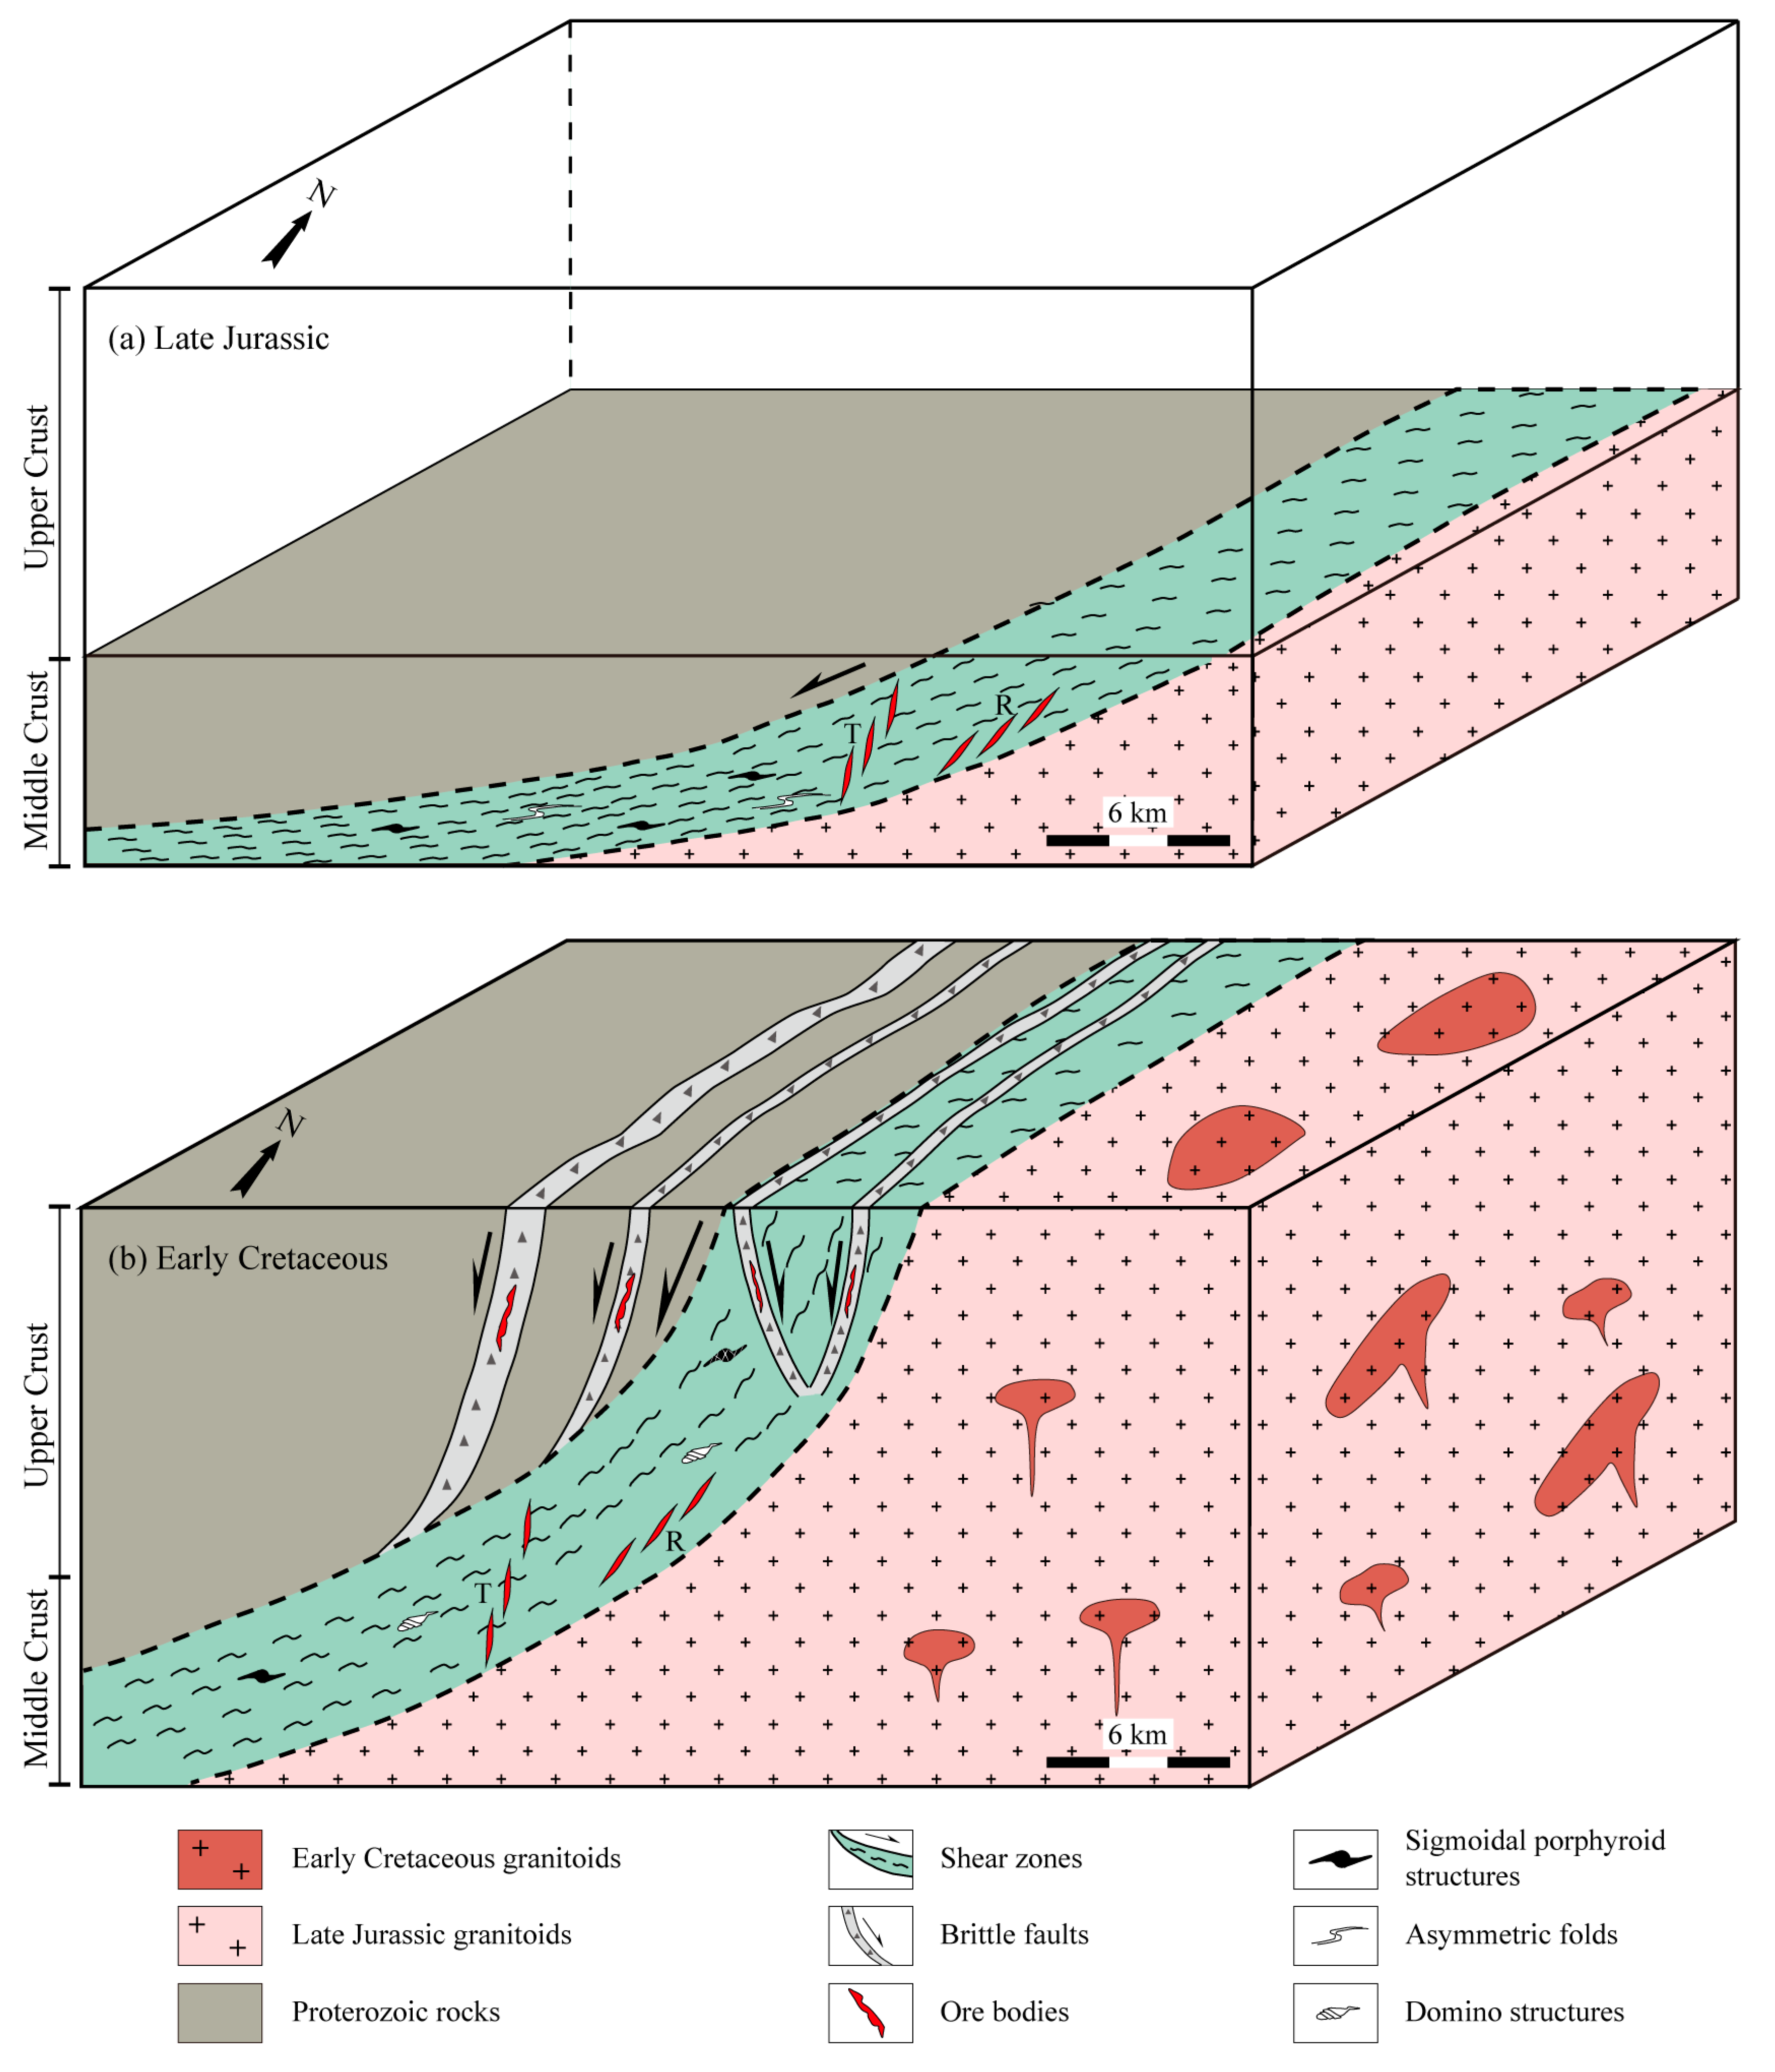
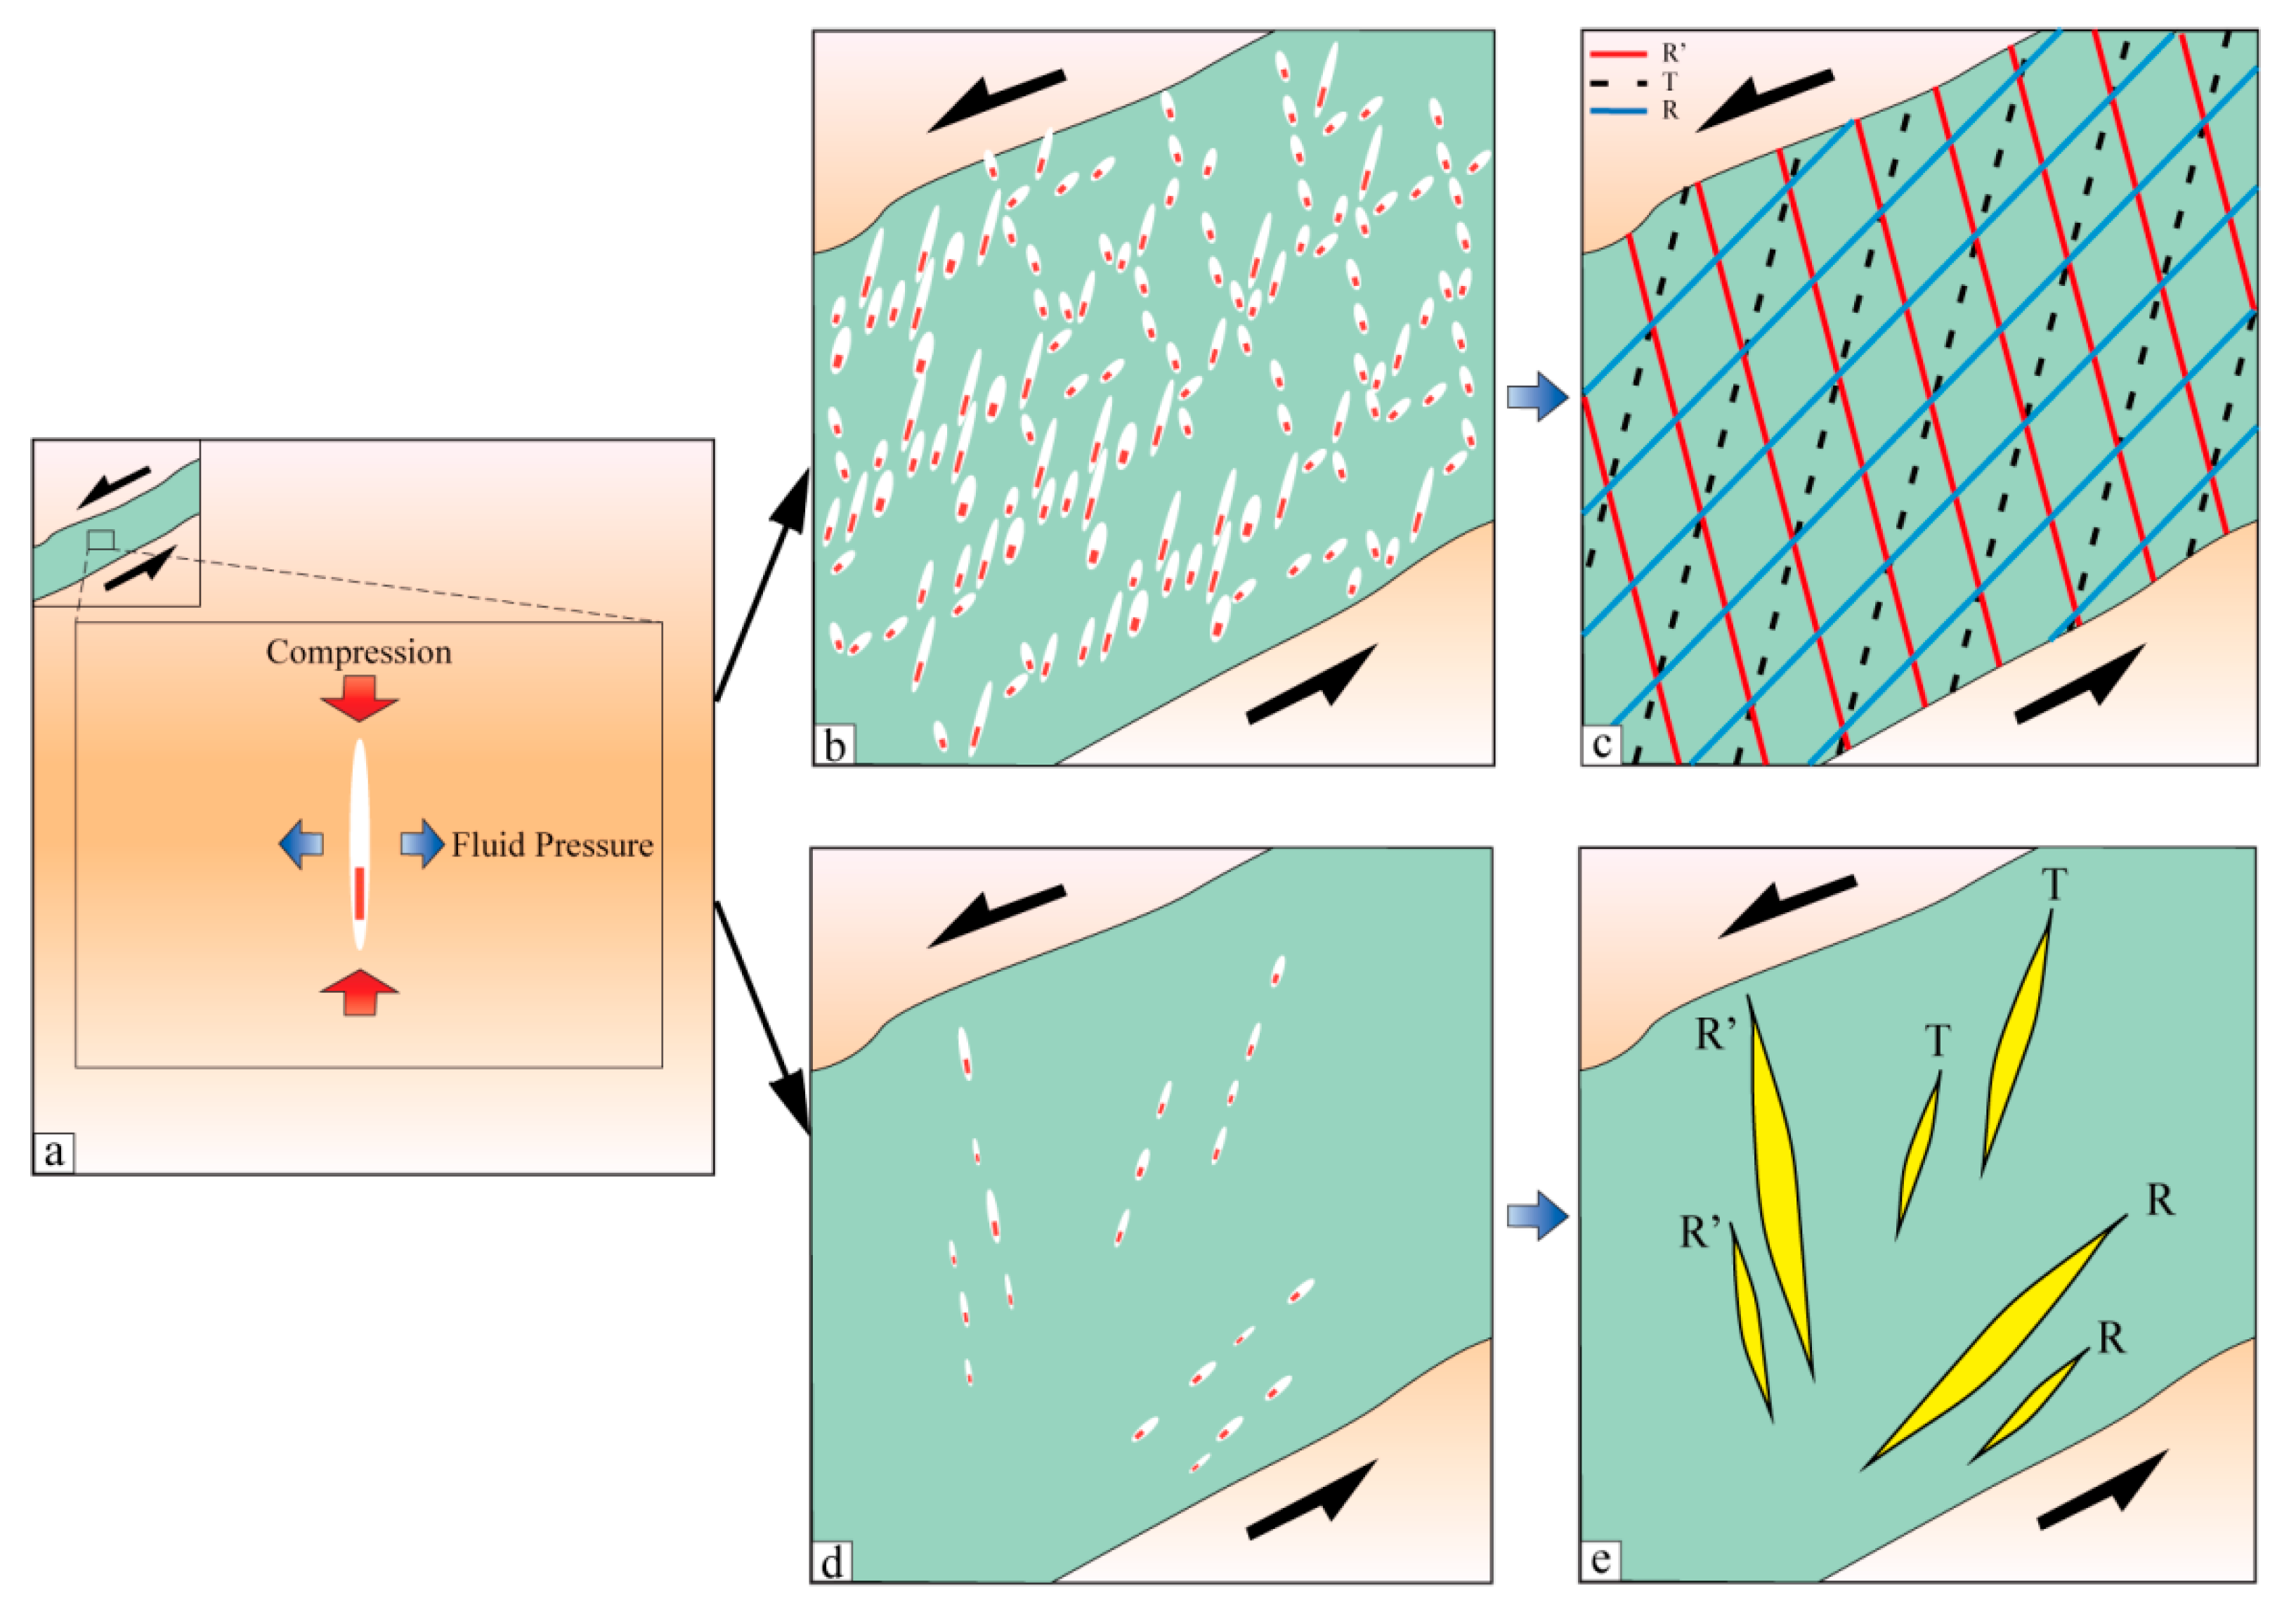
6.3. Implication to the Genetic Mechanism of the Shear Zone Type Gold Deposits

6.3.1. Comparison to other Gold Deposits

Comparing the features of gold deposits both in Jiaodong Peninsula and all over the world, Goldfarb and Groves proposed the famous model of orogenic gold deposits and considered Jiaodong Peninsula as a typical example of this type of deposits [10,48,87,88]. Based on the definition in the literatures above, the typical orogenic gold deposits are formed in the orogenic process, including subduction and collision. According to the previous study, gold deposits in Jiaodong Peninsula were formed in the background of arc and back-arc extension during the subduction of Pacific Plate, which caused the destruction of North China Craton. From this view, someone also called it as the decratonic gold deposits and all shear zones were developed in the arc setting [29,89]. Considering all the characteristics above, there has been continuing debate on the genesis of gold deposits in Jiaodong Peninsula in accordance with the tectonic background. However, all models have one common feature that shear zones play important roles in the mineralization process. So, this paper prefers emphasizing the controlling effect of shear zones on gold mineralization, rather than the tectonic background. It is suggested that the term of shear zone type gold deposits is more appropriate.
As an essential economic source, the genetic of SZTGD has long been a major concern. Previous studies show that SZTGD can be developed in different structural environments, e.g., normal, thrust and strike-slip shearing. For the normal and strike-slip shearing, e.g., deposits in Jiaodong Peninsula, gold mineralization are dominant by the synchronous structure-magma-fluid activities [26,90]. Combining with our previous study [19] and this paper, most gold bodies are host in the main shear zones or secondary fractures although they belong to different mineralization type. For altered-rock type gold deposits, e.g., Jiaojia deposit in Zhaoyuan-Laizhou belt, gold ores are distributed both in the main shear zones with strong alteration, and secondary quartz veins recognized as R, T and R’ fractures. For vein type gold deposits, e.g., Linglong deposit in Zhaoyuan-Laizhou belt and Denggezhuang and Rushan deposits in the Muping-Rushan belt, ore bodies are hosted in the main shear zones with strong breccia and cataclastic deformation, as well as secondary fractures. Another significant character is that all the gold bodies are located in the occurrence change portions of shear zones. As for thrust shearing, e.g., Abitibi greenstone belt in Canada and Norseman-Wiluna greenstone belt in west Australia, these sub-horizontal and extensional veins are recognized as T and R fractures, respectively [19]. Meanwhile, gold veins are distributed at the steeper portions of thrust shear zones. Moreover, the significant factor influencing gold precipitation causes widespread consideration. A fluid inclusion study shows that deposits from different structural environments are commonly formed in middle-temperature conditions (200–350 °C) [11,29,31,38]. Experimental researches show that gold solubility does not change much in this range [91]. In contrast, fluid pressure shows fluctuation in general and plays an important role in gold mineralization [15,86].
All the evidence above indicate that SZTGD are formed by a united genetic mechanism, which is called as the stress-chemical process from stress concentration, brittle fracturing, sudden reduction of fluid pressure, flash vaporization to gold precipitation [19]. Additionally, both vein-type and altered-rock type gold deposits may have a unified formation process. As an important mineralization type, altered-rock type gold deposits are widely distributed in shear zones, especially in Jiaodong Peninsula. According to our investigation for the typical altered-rock type deposits in Sanshandao, rocks were broken into breccia at fault center (Figure 11a) and visible gold generally distributed along the boundary of breccia (Figure 11b). In some cases clasts of reworked cataclasite were cemented by fluid actions.
Based on these distribution features above and the stress-chemical process, gold mineralization of these two types is genetically resulted from the stress concentration in shear zones. Firstly, microfractures occurred with the formation of high-pressure fluids at stress concentration parts (Figure 12a). Under the continuous effect of stress-chemical process, a cloud of microfractures grew (Figure 12b). When the density of these cracks reached a critical value, rocks were broken into cataclasite, which allowed shear displacement to occur and fluids fully contacted with wallrocks (Figure 12c). In this condition, altered-rock type gold deposits might occur in shear zones. Otherwise, if the density of these cracks did not exceed a critical value (Figure 12d) and fractures were filled by quartz or other minerals, vein-type ones perhaps occurred (Figure 12e).

6.3.2. Genetic Mechanism for SZTGD

During the stress-chemical process, the coupling relationship among magma, fluids and shear zones plays an essential role in gold mineralization and determines special mineralization portions in shear zones. Extensive magmatism and multi-stage pluton emplacement can provide not only metallogenic material but also heat, which are beneficial for fluid activities. In Jiaodong Peninsula, the long-lasting magmatism is widely distributed and provides favorable conditions for gold mineralization [15,26]. Fluids derived from magmatism or metamorphic dehydration can make gold activate from wallrocks and migrate in forms of complexes, e.g., Au(HS)2 along shear zones, especially crust-scale ones. Meanwhile, fluid action has an essential influence on rock deformation mechanism. The occurrence of high-pressure fluids facilitates the development of brittle fractures at different structural levels, including ductile, ductile-brittle and brittle shear zones. In this study, gold deposits in the MR (China) are probably hosted both in the brittle fractures at middle crust level (ductile deformation) and brittle deformation part at shallow crust level, while some deposits are distributed in ductile part (e.g., the Sigma Mine, Val d’Or, Canada, see [11]). Finally, rapid pressure drop occur in these fractures and gold begin to precipitate during the stress-chemical process. Considering shear-zone activity has a long-lived characteristic with consistent kinematics, later gold re-concentrations processes can occur along the shear-zones, associated with later activations without magmatic supply, increasing the tonnage.
From these processes above, we suggest that shear zones are the bonds connecting all activities together. That is the reason why most gold deposits host in shear zones. According to this metallogenic model, the stress concentration portions in shear zones are favorable areas for gold mines, and we may explore new deposits at deep ductile deformation part in the MR.

7. Conclusions

(1) Petrology, geometry, kinematics, macro- and micro-structures imply that the MR had experienced a top-to-the-NW sense of extensional activity from late Jurassic to early Cretaceous. It had a progressive shearing history exhumed via middle crust to subsurface level.
(2) In the MR, gold might precipitate both in the brittle fractures at the middle crust level and brittle deformation part at the shallow crust level during the stress-chemical process.
(3) Comparison of gold deposits between the MR and other areas show that shear zone type gold deposits had a uniform metallogenic mechanism, which is from (multi-stage) pluton emplacement, hydrothermal fluid action, shearing action, brittle fracturing, sudden reduction of fluid pressure, flash vaporization to (gold) mineralization.

Author Contributions

Conceptualization, N.C. and Q.H.; methodology, N.C.; software, N.C.; formal analysis, N.C.; investigation, N.C., M.S., M.H., F.Y. and H.L.; writing—original draft preparation, N.C.; writing—review and editing, N.C., Q.L. and Q.H.; supervision, Q.H.; project administration, Q.H.; funding acquisition, Q.H.

Funding

This research was funded by the National Key R&D Program of China, grant number 2016YFC0600401.

Acknowledgments

Special thanks are paid to leaders, experts and relevant technicians from Shandong Gold Group Co., Ltd. for their enthusiastic guidance and helps. We thank Huafeng Zhang at China University of Geosciences (Beijing) for their help of field work, as well as Quanren Yan, Qianqian Guo, and Li Deng at University of Chinese Academy of Sciences for their help to improve the manuscript. We also thank Junyu Li at China University of Geosciences (Wuhan) for his help in EBSD analysis. The UCAS Joint PhD Training Program is also thanked for the funding. We gratefully thank the constructive suggestions of three reviewers and kind help of Minerals editor.

Conflicts of Interest

The authors declare no conflict of interest.

References

  1. Fossen, H. Structural Geology, 2nd ed.; Cambridge University Press: New York, NY, USA, 2016; pp. 25–254. [Google Scholar]
  2. Deng, J.; Zhai, Y.S.; Yang, L.Q.; Fang, Y.; Yan, W.D. On ore-forming system of shear zone tectonics. Geoscience 1998, 12, 493–500. [Google Scholar]
  3. Liu, J.L. Strain localization and strain weakening in the continental middle crust. Acta Petrol. Sin. 2017, 33, 1653–1666. [Google Scholar]
  4. Robert, F.; Kelly, W.C. Ore-forming fluids in Archean gold-bearing quartz veins at the Sigma Mine, Abitibi greenstone belt, Quebec, Canada. Econ. Geol. 1987, 82, 1464–1482. [Google Scholar] [CrossRef]
  5. Song, C.; Wei, W.; Hou, Q.L.; Liu, Q.; Zhang, H.Y.; Wu, S.C.; Zhu, H.F.; Li, H. Geological characteristics of the Laoshan’ao shear zone and its relationship with the Xiangdong tungsten deposit, Chaling, eastern Hunan Province. Acta Petrol. Sin. 2016, 32, 1571–1580. [Google Scholar]
  6. Spencer, J.E.; Welty, J.W. Possible controls of base-and precious-metal mineralization associated with Tertiary detachment faults in the Lower Colorado River Trough, Arizona and California. Geology 1986, 14, 195. [Google Scholar] [CrossRef]
  7. Wei, W.; Song, C.; Hou, Q.L.; Chen, Y.; Faure, M.; Yan, Q.R.; Liu, Q.; Sun, J.F.; Zhu, H.F. The Late Jurassic extensional event in the central part of the South China Block–evidence from the Laoshan’ao shear zone and Xiangdong Tungsten deposit (Hunan, SE China). Int. Geol. Rev. 2018, 60, 1644–1664. [Google Scholar] [CrossRef]
  8. Dirks, P.H.G.M.; Charlesworth, E.G.; Munyai, M.R.; Wormald, R. Stress analysis, post-orogenic extension and 3.01 Ga gold mineralisation in the Barberton Greenstone Belt, South Africa. Precambrian Res. 2013, 226, 157–184. [Google Scholar] [CrossRef]
  9. Groves, D.I. The crustal continuum model for late-Archaean lode-gold deposits of the Yilgarn Block, Western Australia. Miner. Depos. 1993, 28, 366–374. [Google Scholar] [CrossRef]
  10. Groves, D.I.; Goldfarb, R.J.; Gebre-Mariam, M.; Hagemann, S.G.; Robert, F. Orogenic gold deposits: A proposed classification in the context of their crustal distribution and relationship to other gold deposit types. Ore Geol. Rev. 1998, 13, 7–27. [Google Scholar] [CrossRef]
  11. Olivo, G.R.; Chang, F.; Kyser, T.K. Formation of the auriferous and barren North Dipper Veins in the Sigma Mine, Val d’Or, Canada: Constraints from structural, mineralogical, fluid Inclusion, and isotopic data. Econ. Geol. 2006, 101, 607–631. [Google Scholar] [CrossRef]
  12. Olivo, G.R.; Williams-Jones, A.E. Genesis of the auriferous C quartz-tourmaline vein of the Siscoe mine, Val d’Or district, Abitibi subprovince, Canada: Structural, mineralogical and fluid inclusion constraints. Econ. Geol. 2002, 97, 929–947. [Google Scholar] [CrossRef]
  13. Rezeau, H.; Moritz, R.; Beaudoin, G. Formation of Archean batholith-hosted gold veins at the Lac Herbin deposit, Val-d’Or district, Canada: Mineralogical and fluid inclusion constraints. Miner. Depos. 2017, 52, 421–442. [Google Scholar] [CrossRef]
  14. Sanislav, I.V.; Brayshaw, M.; Kolling, S.L.; Dirks, P.H.G.M.; Cook, Y.A.; Blenkinsop, T.G. The structural history and mineralization controls of the world-class Geita Hill gold deposit, Geita Greenstone Belt, Tanzania. Miner. Depos. 2017, 52, 257–279. [Google Scholar] [CrossRef] [Green Version]
  15. Yang, L.Q.; Deng, J.; Wang, Z.L.; Zhang, L.; Guo, L.N.; Song, M.C.; Zheng, X.L. Mesozoic and metallogenic system of the Jiaodong gold province, eastern China. Acta Petrol. Sin. 2014, 30, 2447–2467. [Google Scholar]
  16. Chen, B.L.; Dong, F.X.; Li, Z.J. Ore-forming model of ductile shear zone type gold deposits. Geol. Rev. 1999, 45, 186–192. [Google Scholar]
  17. Wang, Y.T.; Mao, J.W.; Li, X.F.; Yang, F.Q. Gold mineralization related to the shear zone. Earth Sci. Front. 2004, 11, 393–400. [Google Scholar]
  18. Boullier, A.M.; Robert, F. Palaeoseismic events recorded in Archaean gold-quartz vein networks, Val d’Or, Abitibi, Quebec, Canada. J. Struct. Geol. 1992, 14, 161–179. [Google Scholar] [CrossRef]
  19. Cheng, N.N.; Liu, Q.; Hou, Q.L.; Wei, W.; Shi, M.Y.; He, M.; Guo, Q.Q. Discussions on the stress-chemical process of gold precipitation and metallogenic mechanism in shear zone type gold deposits. Acta Petrol. Sin. 2018, 34, 2165–2180. [Google Scholar]
  20. Nguyen, P.T.; Harris, L.B.; Powell, C.M.; Cox, S.F. Fault-valve behaviour in optimally oriented shear zones: An example at the Revenge gold mine, Kambalda, Western Australia. J. Struct. Geol. 1998, 20, 1625–1640. [Google Scholar] [CrossRef]
  21. Groves, D.I.; Phillips, G.N.; Ho, S.E.; Houstoun, S.M.; Standing, C.A. Craton-scale distribution of greenstone gold deposits: Predictive capacity of the metamorphic model. Econ. Geol. 1988, 83, 2045–2058. [Google Scholar] [CrossRef]
  22. Hodgson, C.J. The structure of shear-related, vein-type gold deposits: A review. Ore Geol. Rev. 1989, 4, 231–273. [Google Scholar] [CrossRef]
  23. Lister, G.S.; Snoke, A.W. S-C mylonites. J. Struct. Geol. 1984, 6, 617–638. [Google Scholar] [CrossRef]
  24. Sibson, R.H.; Robert, F.; Poulsen, K.H. High-angle reverse faults, fluid-pressure cycling, and mesothermal gold-quartz deposits. Geology 1988, 16, 551–555. [Google Scholar] [CrossRef]
  25. Song, M.C.; Yi, P.H.; Xu, J.X.; Cui, S.X.; Shen, K.; Jiang, H.L.; Yuan, W.H.; Wang, H.J. A step metallogenetic model for gold deposits in the northwestern Shandong Peninsula, China. Sci. China Earth Sci. 2012, 42, 992–1000. [Google Scholar] [CrossRef]
  26. Fan, H.R.; Hu, F.F.; Yang, J.H.; Shen, K.; Zhai, M.G. Fluid evolution and large scale gold metallogeny during Mesozoic tectonic transition in the eastern Shandong Province. Acta Petrol. Sin. 2005, 21, 1317–1328. [Google Scholar]
  27. Deng, J.; Wang, Q.F. Gold mineralization in China: Metallogenic provinces, deposit types and tectonic framework. Gondwana Res. 2016, 36, 219–274. [Google Scholar] [CrossRef]
  28. Song, M.C.; Li, S.Z.; Santosh, M.; Zhao, S.; Yu, S.; Yi, P.H.; Cui, S.X.; Lv, G.X.; Xu, J.X.; Song, Y.X. Types, characteristics and metallogenesis of gold deposits in the Jiaodong Peninsula, Eastern North China Craton. Ore Geol. Rev. 2015, 65, 612–625. [Google Scholar] [CrossRef]
  29. Zhu, R.X.; Fan, H.R.; Li, J.W.; Meng, Q.R.; Li, S.R.; Zeng, Q.D. Decratonic gold deposits. Sci. China Earth Sci. 2015, 58, 1523–1537. [Google Scholar] [CrossRef]
  30. Lü, G.X.; Li, H.K.; Ding, Z.J.; Han, F.F.; Li, B.H. Hydrothermal alteration metallogenesis in the determination zone of a "magmatic core complex" upheaval-detachment structure, Jiaodong. Geoscience 2016, 30, 247–262. [Google Scholar]
  31. Wen, B.J.; Fan, H.R.; Santosh, M.; Hu, F.F.; Pirajno, F.; Yang, K.F. Genesis of two different types of gold mineralization in the Linglong gold field, China: Constrains from geology, fluid inclusions and stable isotope. Ore Geol. Rev. 2015, 65, 643–658. [Google Scholar] [CrossRef]
  32. Tan, J.; Wei, J.H.; Guo, L.L.; Zhang, K.Q.; Yao, C.L.; Lu, J.P.; Li, H.M. LA-ICP-MS zircon U-Pb dating and phenocryst EPMA of dikes, Guocheng, Jiaodong Peninsula: Implications for North China Craton lithosphere evolution. Sci. China Earth Sci. 2008, 51, 1483–1500. [Google Scholar] [CrossRef]
  33. Yang, Z.F.; Xu, J.K.; Zhao, L.S. Regional Crust Evolution and Geochemistry of Gold Mineralization in Jiaodong Peninsula; Geological Publishing House: Beijing, China, 1998; pp. 1–157. [Google Scholar]
  34. Li, J.W.; Paulo, V.; Zhou, M.F.; Fu, Z.X.; Qian, M.C. Geochronology of the Pengjiakuang and Rushan gold deposits, eastern Jiaodong gold province, northeastern China: Implications for regional mineralization and geodynamic setting. Econ. Geol. 2006, 101, 1023–1038. [Google Scholar]
  35. Qiu, J.S.; Wang, D.Z.; Luo, Q.H.; Liu, H. 40Ar/39Ar dating for volcanic rocks of Qingshan formation in Jiaolai Basin, Eastern Shandong province: A Case study of the Fenlingshan volcanic apparatus in Wulian county. Geo. J. China Univ. 2001, 7, 351–355. [Google Scholar]
  36. Goss, S.C.; Wilde, S.A.; Wu, F.Y.; Yang, J.H. The age, isotopic signature and significance of the youngest Mesozoic granitoids in the Jiaodong Terrane, Shandong Province, North China Craton. Lithos 2010, 120, 309–326. [Google Scholar] [CrossRef]
  37. Guo, J.H.; Chen, F.K.; Zhang, X.M.; Siebel, W.; Zhai, M.G. Evolution of syn- to post-collisional magmatism from north Sulu UHP belt, eastern China: Zircon U-Pb geochronology. Acta Petrol. Sin. 2005, 21, 1281–1301. [Google Scholar]
  38. Hu, F.F.; Fan, H.; Yang, K.F.; Shen, K.; Zhai, M.G.; Jin, C.W. Fluid inclusions in the Denggezhuang lode gold deposit at Muping, Jiaodong Peninsula. Acta Petrol. Sin. 2007, 23, 2155–2164. [Google Scholar]
  39. Li, H.K.; Li, D.P.; Geng, K.; Guo, B.K.; Zhuo, C.Y.; Liang, T.T. The Mesozoic magmaticactivities framwork in Jiaodong Area: SHRIMP chronology recording of single particle zircon. Acta Geol. Sin. 2017, 91, 163–179. [Google Scholar] [CrossRef] [Green Version]
  40. Yu, X.F.; Li, H.K.; Shan, W. Study on coupling between Yanshannian tectonic thermal events and gold mineralization in Jiaodong ore concentrating area in Shandong Province. Acta Geol. Sin. 2012, 86, 1946–1956. [Google Scholar]
  41. Lin, B.L.; Li, B.L. Geochemistry, U-Pb dating Lu-Hf isotopic analysis and gological significance of Linglong granite in Jiaodong Peninsula. J. Chengdu Univ. Technol. (Sci. Technol. Ed.) 2013, 40, 147–160. [Google Scholar]
  42. Wang, Z.L.; Zhao, R.X.; Zhang, Q.; Lu, H.W.; Li, J.L.; Cheng, W. Magma mixing for the high Ba-Sr Guojialing-type granitoids in Northest Jiaodong Peninsula: Constraints from petrogeochemistry and Sr-Nd isotopes. Acta Petrol. Sin. 2014, 30, 2595–2608. [Google Scholar]
  43. Yang, Q.Y.; Santosh, M.; Shen, J.F.; Li, S.R. Juvenile vs. recycled crust in NE China: Zircon U–Pb geochronology, Hf isotope and an integrated model for Mesozoic gold mineralization in the Jiaodong Peninsula. Gondwana Res. 2014, 25, 1445–1468. [Google Scholar] [CrossRef]
  44. Liu, S.; Hu, R.; Gao, S.; Feng, C.; Yu, B.; Feng, G.; Qi, Y.; Wang, T.; Coulson, I.M. Petrogenesis of Late Mesozoic mafic dykes in the Jiaodong Peninsula, eastern North China Craton and implications for the foundering of lower crust. Lithos 2009, 113, 621–639. [Google Scholar] [CrossRef]
  45. Ma, L.; Jiang, S.Y.; Hofmann, A.W.; Dai, B.Z.; Hou, M.L.; Zhao, K.D.; Chen, L.H.; Li, J.W.; Jiang, Y.H. Lithospheric and asthenospheric sources of lamprophyres in the Jiaodong Peninsula: A consequence of rapid lithospheric thinning beneath the North China Craton? Geochim. Cosmochim. Acta 2014, 124, 250–271. [Google Scholar] [CrossRef]
  46. Yang, J.H.; Zhu, M.F.; Liu, W.; Zhai, M.G. Geochemistry and petrogenesis of Guojialing granodiorites from the northwestern Jiaodong Peninsula, eastern China. Acta Petrol. Sin. 2003, 19, 692–700. [Google Scholar]
  47. Li, X.C. Hydrothermal Alteration Associated with Mesozoic Granite-Hosted Gold Mineralization at the Sanshandao Deposit, Jiaodong Gold Province, China. Master’s Thesis, Institute of Geology and Geophysics, Chinese Acedemy of Sciences, Beijing, China, 2012. [Google Scholar]
  48. Goldfarb, R.J.; Groves, D.I.; Gardoll, S. Orogenic gold and geologic time: A global synthesis. Ore Geol. Rev. 2001, 18, 1–75. [Google Scholar] [CrossRef]
  49. Zhu, G.; Chen, Y.; Jiang, D.Z.; Lin, S.Z. Rapid change from compression to extension in the North China Craton during the Early Cretaceous: Evidence from the Yunmengshan metamorphic core complex. Tectonophysics 2015, 656, 91–110. [Google Scholar] [CrossRef]
  50. Fan, H.R.; Zhai, M.G.; Xie, Y.H.; Yang, J.H. Ore-forming fluids associated with granite-hosted gold mineralization at the Sanshandao deposit, Jiaodong gold province, China. Miner. Depos. 2003, 38, 739–750. [Google Scholar] [CrossRef]
  51. Xue, J.L.; Pang, Z.S.; Li, S.R.; Chen, H.; Sun, H.Y.; Tao, W.; Yao, L.; Zhang, Y.Q. The genesis of Denggezhuang gold deposit in Jiaodong: Constraints from multigeological chronology and isotope system. Acta Petrol. Sin. 2019, 35, 1532–1550. [Google Scholar]
  52. Li, X.F.; Liu, J.C.; Zhang, X.R.; Yu, H. Structural features and metallogenic prognosis of Muping-Rushan gold ore belt. Gold Sci. Technol. 2013, 21, 10–15. [Google Scholar]
  53. Hu, F.F. Magmatism, Ore Fluid Evolution and Gold Mineralization of the Kunyushan Area in the Jiaodong Peninsula during the Mesozoic Tectonic Regime Inversion in Eastern China. Ph.D. Thesis, Institute of Geology and Geophysics, Chinese Acedemy of Sciences, Beijing, China, 2006. [Google Scholar]
  54. Hu, F.F.; Fan, H.R.; Yang, J.H.; Wang, F.; Zhai, M.G. The 40Ar/39Ar dating age of sericite from altered rocks in the Rushan lode gold deposit, Jiaodong Peninsula and its constraints on the gold mineralization. Bull. Miner. Petrol. Geochem. 2006, 25, 109–114. [Google Scholar]
  55. Hu, F.F.; Fan, H.R.; Yang, J.H.; Wan, Y.S.; Liu, D.Y.; Zhai, M.G.; Jin, C.W. The mineralization age in the Rushan lode gold deposit: Determination by SHRIMP U-Pb dating for hydrothermal zircon. Sci. Bull. 2004, 49, 1191–1198. [Google Scholar] [CrossRef]
  56. Xue, J.L. Mineralization and Metallogenic Prognosis of Gold Deposits in Muping-Rushan Gold Belt, Jiaodong Peninsula. Ph.D. Thesis, China University of Geosciences, Beijing, China, 2013. [Google Scholar]
  57. Li, X.F.; Liu, J.C.; Yu, H.; Gao, P.; Zhang, X.; Cheng, H. The geological characteristics and prospecting criteria of Yinggezhuang gold deposit, Jiaodong. Gold Sci. Technol. 2010, 18, 99–112. [Google Scholar]
  58. Zhu, G.; Niu, M.; Xie, C.; Wang, Y. Sinistral to Normal Faulting along the Tan-Lu Fault Zone: Evidence for Geodynamic Switching of the East China Continental Margin. J. Geol. 2010, 118, 277–293. [Google Scholar] [CrossRef]
  59. Angelier, J. Determination of the mean principal directions of stresses for a given fault population. Tectonophysics 1979, 56, T17–T26. [Google Scholar] [CrossRef]
  60. Angelier, J. Tectonic analysis of fault slip data sets. J. Geophys. Res. Solid Earth 1984, 89, 5835–5848. [Google Scholar] [CrossRef]
  61. Sasvári, Á.; Baharev, A. SG2PS (structural geology to postscript converter): A graphical solution for brittle structural data evaluation and paleostress calculation. Comput. Geosci. 2014, 66, 81–93. [Google Scholar]
  62. Angelier, J. Fault Slip Analysis and Paleostress Reconstruction; Pergamon Press: New York, NY, USA, 1994; pp. 53–100. [Google Scholar]
  63. Passchier, C.W.; Trouw, R.A.J. Microtectonics; Springer: Berlin/Heidelberg, Germany, 2005; pp. 1–366. [Google Scholar]
  64. Wu, W.B.; Liu, J.L.; Zhang, L.S.; Qi, Y.C.; Ling, C.Y. Characterizing a middle to upper crustal shear zone: Microstructures, quartz c-axis fabrics, deformation temperatures and flow vorticity analysis of the northern Ailao Shan-Red River shear zone. J. Asian Earth Sci. 2016, 139, 95–114. [Google Scholar] [CrossRef]
  65. Huang, X.M.; Zhang, J.J.; Xu, Z.Q. The application of EBSD in the study of crustal structural deformation. Acta Geol. Sin. 2016, 90, 1130–1145. [Google Scholar]
  66. Liu, J.L.; Cao, S.Y.; Zou, Y.X.; Song, Z.J. EBSD analysis of rock fabrics and its application. Geol. Bull. China 2008, 27, 1638–1645. [Google Scholar]
  67. Xia, Z.M.; Liu, J.L.; Jinlong, N.I.; Zhang, T.T.; Shi, X.M.; Yun, W.U. Structure, evolution and regional tectonic implications of the Queshan metamorphic core complex in eastern Jiaodong Peninsula of China. Sci. China Earth Sci. 2016, 59, 997–1013. [Google Scholar] [CrossRef]
  68. Halfpenny, A.; Prior, D.J.; Wheeler, J. Electron backscatter diffraction analysis to determine the mechanisms that operated during dynamic recrystallisation of quartz-rich rocks. J. Struct. Geol. 2012, 36, 2–15. [Google Scholar] [CrossRef]
  69. White, S. Geological significance of recovery and recrystallization processes in quartz. Tectonophysice 1977, 39, 143–170. [Google Scholar] [CrossRef]
  70. Heilbronner, R.; Tullis, J. Evolution of c axis pole figures and grain size during dynamic recrystallization: Results from experimentally sheared quartzite. J. Geophys. Res. Solid Earth 2006, 111, 1–19. [Google Scholar] [CrossRef]
  71. Xia, H.R.; Liu, J.L. The crystallographic preferred orientation of quartz and its applications. Geol. Bull. China 2011, 30, 58–70. [Google Scholar]
  72. Zheng, Y.D.; Wang, T.; Zhang, J.J. Theory and practice of kinematic vorticity (Wk). Earth Sci. Front. 2008, 15, 209–220. [Google Scholar]
  73. Kruhl, J.H.; Nega, M. The fractal shape of sutured quartz grain boundaries: Application as a geothermometer. Geol. Rundsch. 1996, 85, 38–43. [Google Scholar] [CrossRef]
  74. Kruhl, J.H.; Nega, M.; Milla, H.E. The Fractal Shape of Grain Boundary Sutures: Reality, Model and Application as a Geothermometer. 1995; pp. 31–32. Available online: https://www.researchgate.net/publication/312450687_The_fractal_shape_of_grain_boundary_sutures_Reality_model_and_application_as_a_geothermometer (accessed on 12 December 2019).
  75. Takahashi, M.; Nagahama, H.; Masuda, T.; Fujimura, A.; Rutter, E.H.; Boriani, A.; Brodie, K.H.; Burlini, L.; Treagus, S.H. Fractal analysis of experimentally, dynamically recrystallized quartz grains and its possible application as a strain rate meter. J. Struct. Geol. 1998, 20, 269–275. [Google Scholar] [CrossRef]
  76. Li, J.; Liu, Y.J.; Li, W.M.; Jin, W.; Liang, C.Y.; Wen, Q.B.; Zhang, Y.Y. Structural deformation and rheology of granitic gneiss from the North China Craton Basement-An example from the Sierbao area in western Liaoning Province. Geotecton. Metallog. 2016, 40, 891–907. [Google Scholar]
  77. Liang, C.Y.; Liu, Y.J.; Meng, J.Y.; Wen, Q.B.; Li, W.M.; Zhao, Y.L.; Mi, X.N.; Zhang, L. Strain and fractal analysis of dynamically recrystallized quartz grains and rehological parameter estimation of Shulan ductile shear zone. Earth Sci. J. China Univ. Geosci. 2015, 40, 115–129. [Google Scholar]
  78. Zhang, B.; Zhang, J.J.; Guo, L. Fractal analysis of dynamically recrystallized quartz grains and estimation of mainly rheological parameters of the Ranba ductile shear zone, northern Himalaya dome belt. Chin. J. Geol. 2006, 41, 158–169. [Google Scholar]
  79. Liu, J.L.; Davis, G.A.; Ji, M.; Guan, H.M.; Bai, X.D. Crustal detachment and destruction of the North China craton: Constraints from Late Mesozoic extensional structures. Earth Sci. Front. 2008, 15, 72–81. [Google Scholar] [CrossRef]
  80. Charles, N.; Gumiaux, C.; Augier, R.; Chen, Y.; Zhu, R.X.; Lin, W. Metamorphic core complexes vs. synkinematic plutons in continental extension setting: Insights from key structures (Shandong Province, eastern China). J. Asian Earth Sci. 2011, 40, 261–278. [Google Scholar] [CrossRef] [Green Version]
  81. Ni, J.L.; Liu, J.L.; Tang, X.L.; Yang, H.B.; Xia, Z.M.; Guo, Q.J. The Wulian metamorphic core complex: A newly discovered metamorphic core complex along the Sulu orogenic belt, eastern China. J. Earth Sci. 2013, 24, 297–313. [Google Scholar] [CrossRef]
  82. Yang, X.A.; Zhao, G.C.; Song, Y.B.; Tian, F.; Dong, H.W.; Gao, J.W. Characteristics of ore-controlling detachment fault and future prospecting in the Muping-Rushan metallogenic belt, eastern Shandong Province. Geotecton. Metallog. 2011, 35, 339–347. [Google Scholar]
  83. Lin, S.Z.; Zhu, G.; Yan, L.J.; Jiang, Q.Q.; Zhao, T. Discussion on uplifting mechanism of the Linglong Batholith in eastern Shandong. Geol. Rev. 2013, 59, 832–844. [Google Scholar]
  84. Kolb, J. The role of fluids in partitioning brittle deformation and ductile creep in auriferous shear zones between 500 and 700 °C. Tectonophysics 2008, 446, 1–15. [Google Scholar] [CrossRef]
  85. Phillips, W.J. Hydraulic fracturing and mineralization. J. Geol. Soc. 1972, 128, 337–359. [Google Scholar] [CrossRef]
  86. Weatherley, D.K.; Henley, R.W. Flash vaporization during earthquakes evidenced by gold deposits. Nat. Geosci. 2013, 6, 294–298. [Google Scholar] [CrossRef]
  87. Goldfarb, R.J.; Groves, D.I. Orogenic gold: Common or evolving fluid and metal sources through time. Lithos 2015, 233, 2–26. [Google Scholar] [CrossRef]
  88. Groves, D.I.; Santosh, M. The giant Jiaodong gold province: The key to a unified model for orogenic gold deposits? Geol. Front. 2016, 7, 409–417. [Google Scholar] [CrossRef] [Green Version]
  89. Wu, F.Y.; Wang, J.G.; Liu, C.Z.; Liu, T.; Zhang, C.; Ji, W.Q. Intra-oceanic arc: Its formation and evolution. Acta Petrol. Sin. 2019, 35, 1–15. [Google Scholar]
  90. Cai, Y.C.; Fan, H.R.; Santosh, M.; Hu, F.F.; Yang, K.F.; Li, X.H. Decratonic gold mineralization: Evidence from the Shangzhuang gold deposit, eastern North China Craton. Gondwana Res. 2018, 54, 1–22. [Google Scholar] [CrossRef]
  91. Benning, L.G.; Seward, T.M. Hydrosulphide complexing of Au (I) in hydrothermal solutions from 150–400 °C and 500–1500 bar. Geochim. Cosmochim. Acta 1996, 60, 1849–1871. [Google Scholar] [CrossRef]
Figure 1. Geological map of Jiaodong Peninsula. (a) The location of Jiaodong Peninsula in China; QL-DB, SL and NCC represent Qinling-Dabie orogenic belt, Su-Lu orogenic belt and North China Craton, respectively; (b) the distribution of Precambrian basement, ultrahigh pressure (UHP) metamorphic rocks, Mesozoic granitoids, Cretaceous volcanics and three gold metallogenic belts in Jiaodong Peninsula (modified after [50]).
Minerals 09 00775 g001
Figure 2. Simplified geological map of the Muping-Rushan metallogenic belt. Explanations for each location of observation are in the text. Inserting stereograms are stress orientations computed from fault-slip data for the Muping-Rushan shear zone (MR; equal-angle projections, lower hemisphere; modified after [57]).
Minerals 09 00775 g002
Figure 3. Field observations of ductile and brittle deformation in the MR. Some photos have inset lower hemisphere, equal-angle stereoplots showing the orientations of foliation (S), lineation (L), fault plane (F) and slickenline (SL). (a) Ductile deformation with R fractures (location 10); (b) ductile deformation with sub-horizontal mylonites and domino structure of felsic veins (location 7); (c) lineation on the surface of mylonitic foliation (location 1); (d) the sigmoidal shape of the foliation indicating a top-to-the-NW shear sense (location 1); (e) asymmetric fold in calcite veins indicating a top-to-the-NW shear sense (location 14); (f) conjugate normal faults crosscutting early folded veins (location 4); (g) slickenlines and related brittle kinematic indicators pointing to a top-to-the-NW normal slip-direction (location 9) and (h) pyrite (Py) filled in the fractures (location 4).
Minerals 09 00775 g003
Figure 4. Microscopic observations of the MR (cross-polarized light). (a) Myrmekitic texture in K-feldspar (location 10); (b) S-C fabrics constituted by elongated quartz band and oriented biotite (location 7); (c) chessboard subgrains in quartz (near location 10); (d) ribbon-shaped subgrain rotation recrystallization in quartz (near location 1); (e) deformation twins of plagioclase (location 11); (f) deformation twins in plagioclase and belt extinction in quartz (location 10); (g) intracrystalline cracks in the plagioclase (location 11) and (h) cataclastic quartz (location 14). Bio—biotite; Kfs—K-feldspar; Qtz—quartz; Pl—plagioclase.
Minerals 09 00775 g004
Figure 5. Quartz c-axis fabrics and corresponding microscopic photos of samples collected from the MR. Sample 2810—location 10; sample 2914—location 5; sample 2916—location 6; sample 3019—location 9; sample 3021—location 14; sample 1030—location 7; sample 2917—location 13.
Minerals 09 00775 g005
Figure 6. Double log plot of perimeter-diameter of dynamically recrystallized quartz grains. Data on the left side derive from microscopic analysis and the right side from electron backscatter diffraction (EBSD) analysis, respectively.
Minerals 09 00775 g006
Figure 7. Relationship between fractal dimension and deformation temperature (after [73]).
Minerals 09 00775 g007
Figure 8. Geological maps and cross sections of gold deposits. (a) Rushan gold deposit; (b) Yinggezhuang gold deposit and (ce) Denggezhuang gold deposit. See Figure 2 for deposit locations.
Minerals 09 00775 g008
Figure 9. Observations of gold deposits in the MR. (a) Gold ores in Denggezhuang deposit; (b) gold veins in Rushan deposit; (c) native gold in the healed fracture of pyrite in Yinggezhuang deposit (reflected light); (d) native gold in the open fracture of pyrite in Rushan deposit (reflected light); (e) ribbon-shaped subgrain rotation recrystallization of quartz in Rushan deposit (cross-polarized light); (f) deformation twins of plagioclase in Denggezhuang deposit (cross-polarized light); (g) equal-angle lower hemisphere projection of gold veins and the main shear zone (the red line, data collected from Rushan deposit close to the location of Figure 9a) and (h) rose diagram showing dip angles between veins and the main shear zone (the red line, data from Figure 9g). Au—gold; Cal—calcite; Ccp—Chalcopyrite; Pl—plagioclase; Py—pyrite; Qtz—quartz; Ser—sericite.
Minerals 09 00775 g009
Figure 10. Diagrams showing the detachment structure of the MR. (a) Pluton emplacement and ductile deformation at Late Jurassic and (b) brittle deformation at early Cretaceous.
Minerals 09 00775 g010
Figure 11. Photos of ore bodies in Sanshandao gold deposit. (a) Brecciated ore bodies and (b) gold distributing along the boundary of fractured pyrite (reflected light). Au—gold; Qtz—quartz; Py—pyrite.
Minerals 09 00775 g011
Figure 12. The development of different type of gold mineralization in shear zones. (a) Microfractures and gold mineralization from stress concentration; (b) growing of a cloud of microfractures; (c) formation of the altered-rock type gold deposit; (d) growing of rare microstructures and (e) formation of the vein-type gold deposit.
Minerals 09 00775 g012
Table 1. Fractal characteristics of dynamically recrystallized quartz grain boundary from mylonites in the MR. See Figure 2 and Figure 5 for sample locations. DS—data source; SN—sample number; Q—quantity; DD—diameter distribution; AD—average diameter; PD—perimeter distribution; AP—average perimeter; D—fractal dimension; R2—correlation coefficient.
DSSNQDD (μm)AD (μm)PD (μm)AP (μm)DR2
Microscopic Analysis30217081.67–656.08322.40301.66–3286.991560.351.180.93
10306889.60–658.94261.61337.22–3579.351195.341.160.93
29176155.67–985.64282.04158.22–5617.831296.591.210.98
28105184.17–1035.33326.61299.27–6825.531751.291.220.96
EBSD Analysis302184106.16–687.44279.33379.32–3451.801319.811.170.92
103063126.15–711.97320.56588.41–3799.841602.981.150.92
29176479.12–603.82230.17303.59–3539.501146.471.190.95
2810697.15–287.6235.461600.04–75,606.369407.821.210.97

