Mineralogical and Chemical Characteristics of Slags from the Pyrometallurgical Extraction of Zinc and Lead

Abstract
:1. Introduction
2. Materials and Methods
3. Results
3.1. Chemical Composition
3.1.1. Major Chemical Constituents
3.1.2. Trace Elements
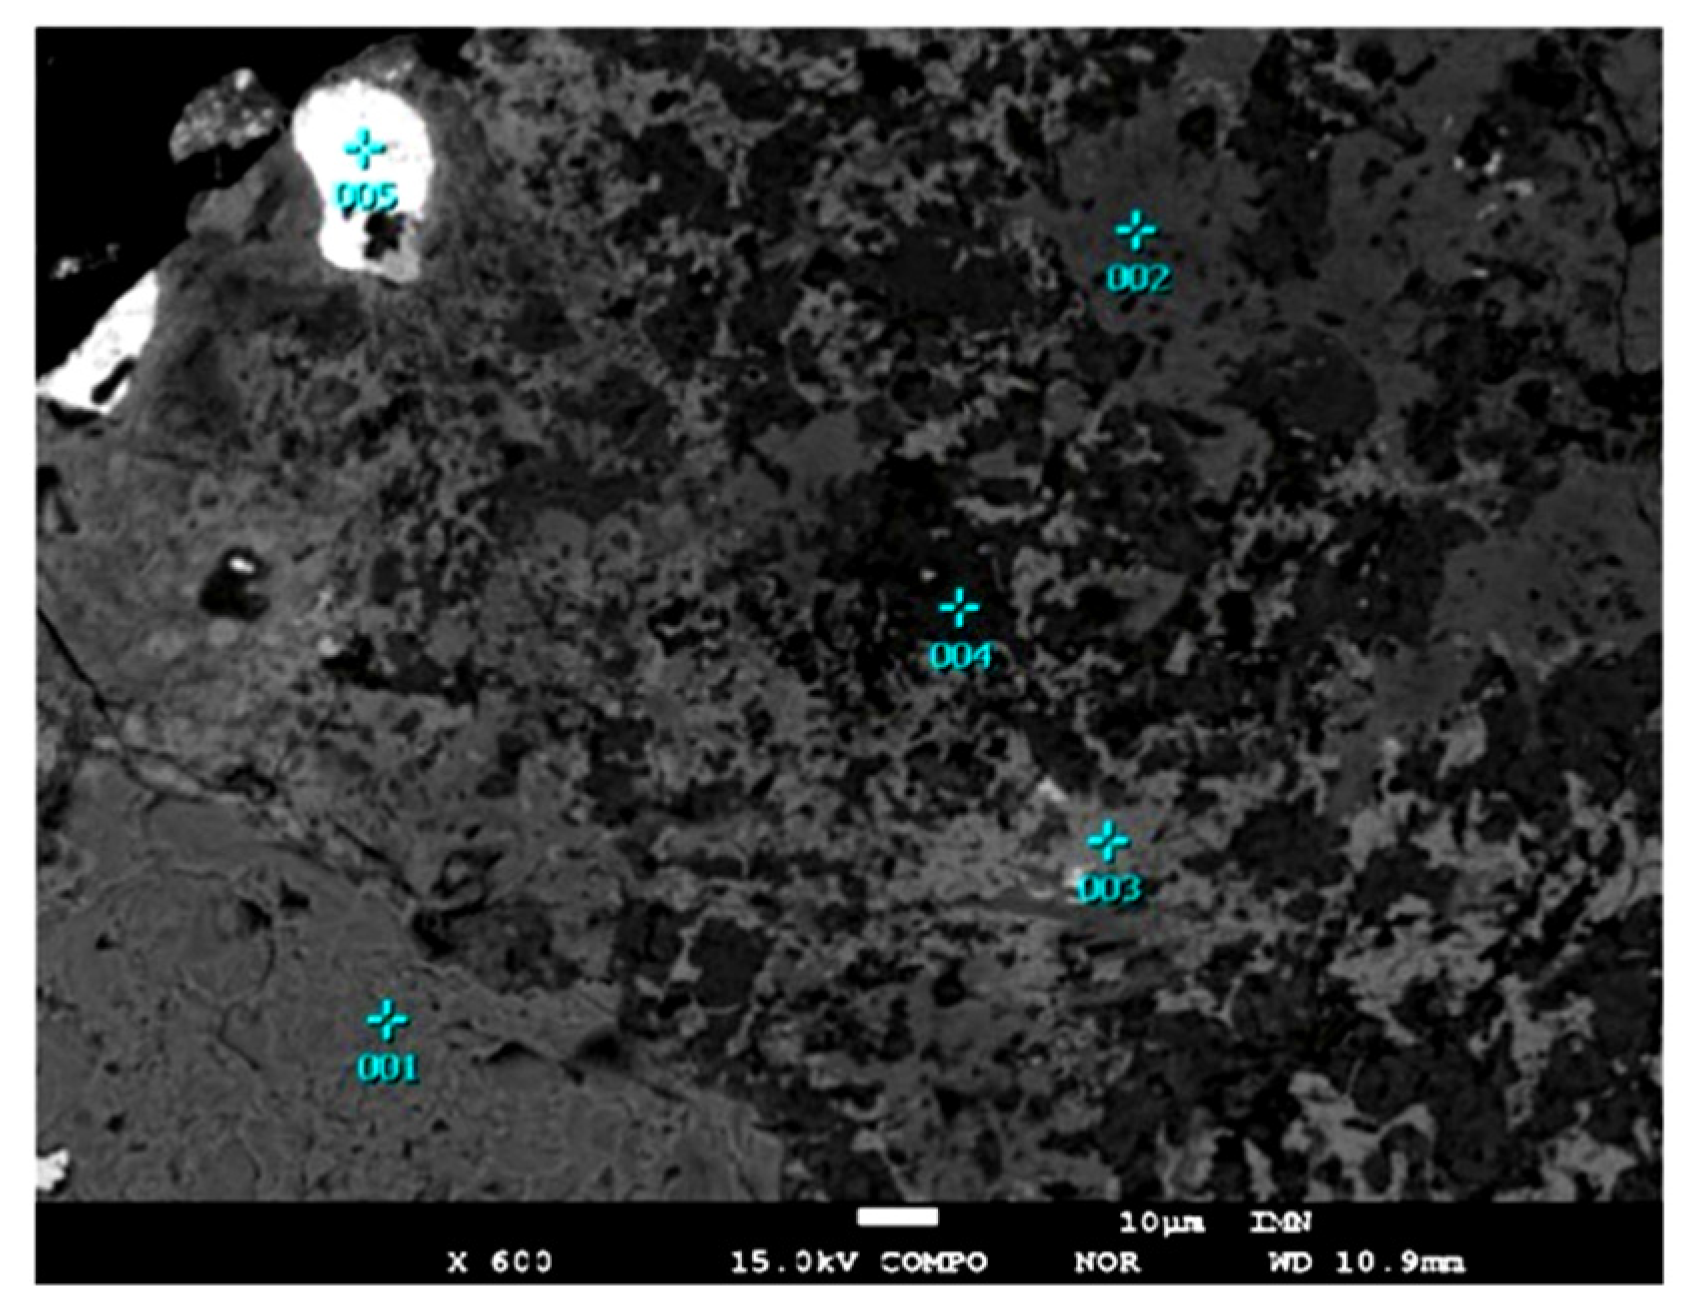
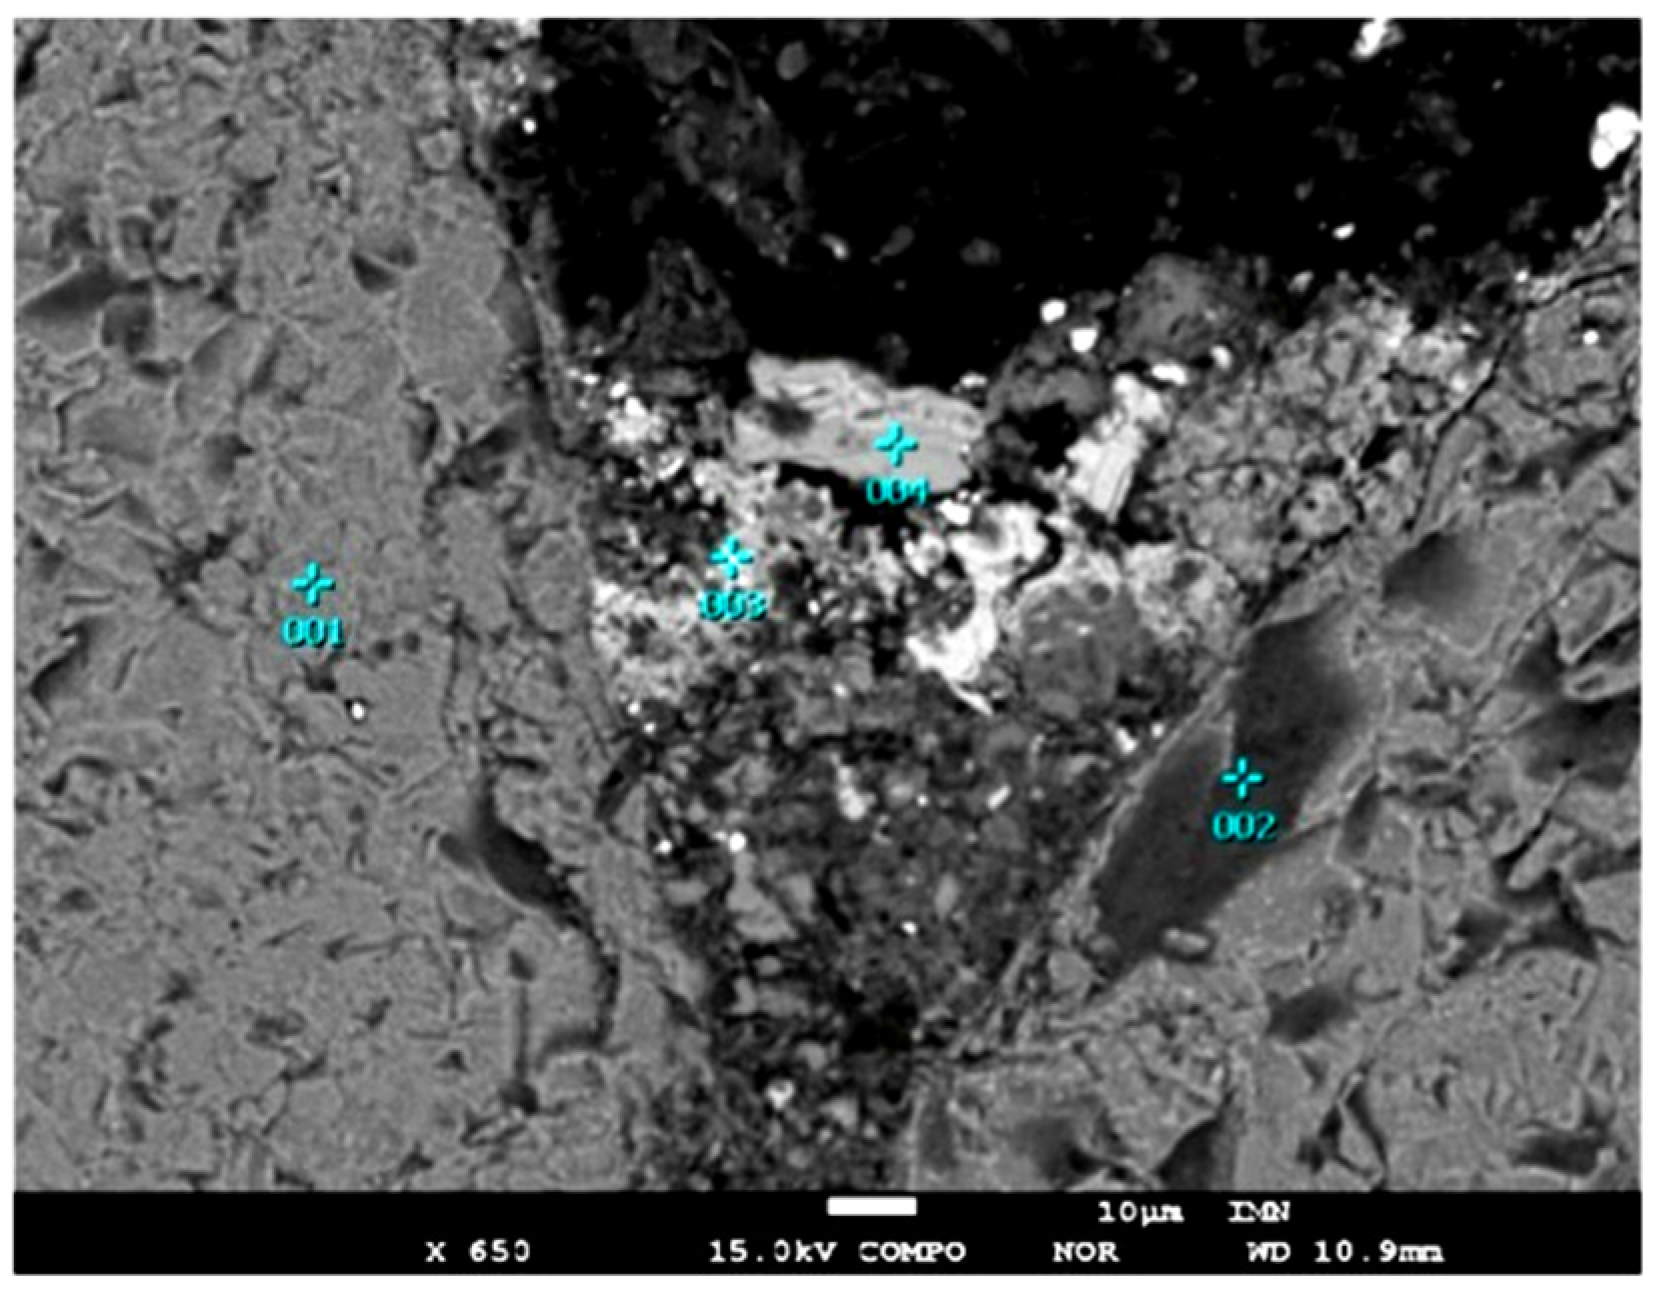
3.2. Phase Composition
3.2.1. Major Phase Constituents
- –
- silicates—kirschsteinite CaFeSiO4, willemite Zn2SiO4,
- –
- sulphates and hydrated sulphates—anglesite PbSO4, gypsum CaSO4·2H2O, ktenasiteZnCu4(SO4)2(OH)6·6H2O, namuvite Zn4(SO4)(OH)6·4H2O, tochilinite Fe2+5–6(Mg,Fe2+)5S6(OH)10,
- –
- nitrates—gerhardtite Cu2(NO3)(OH)3,
- –
- sulphides and metals—sphalerite ZnS, metallic Pb,
- –
- oxides and hydroxides—goethite FeO(OH), wustite FeO,
- –
- glass.
- –
- –
- –
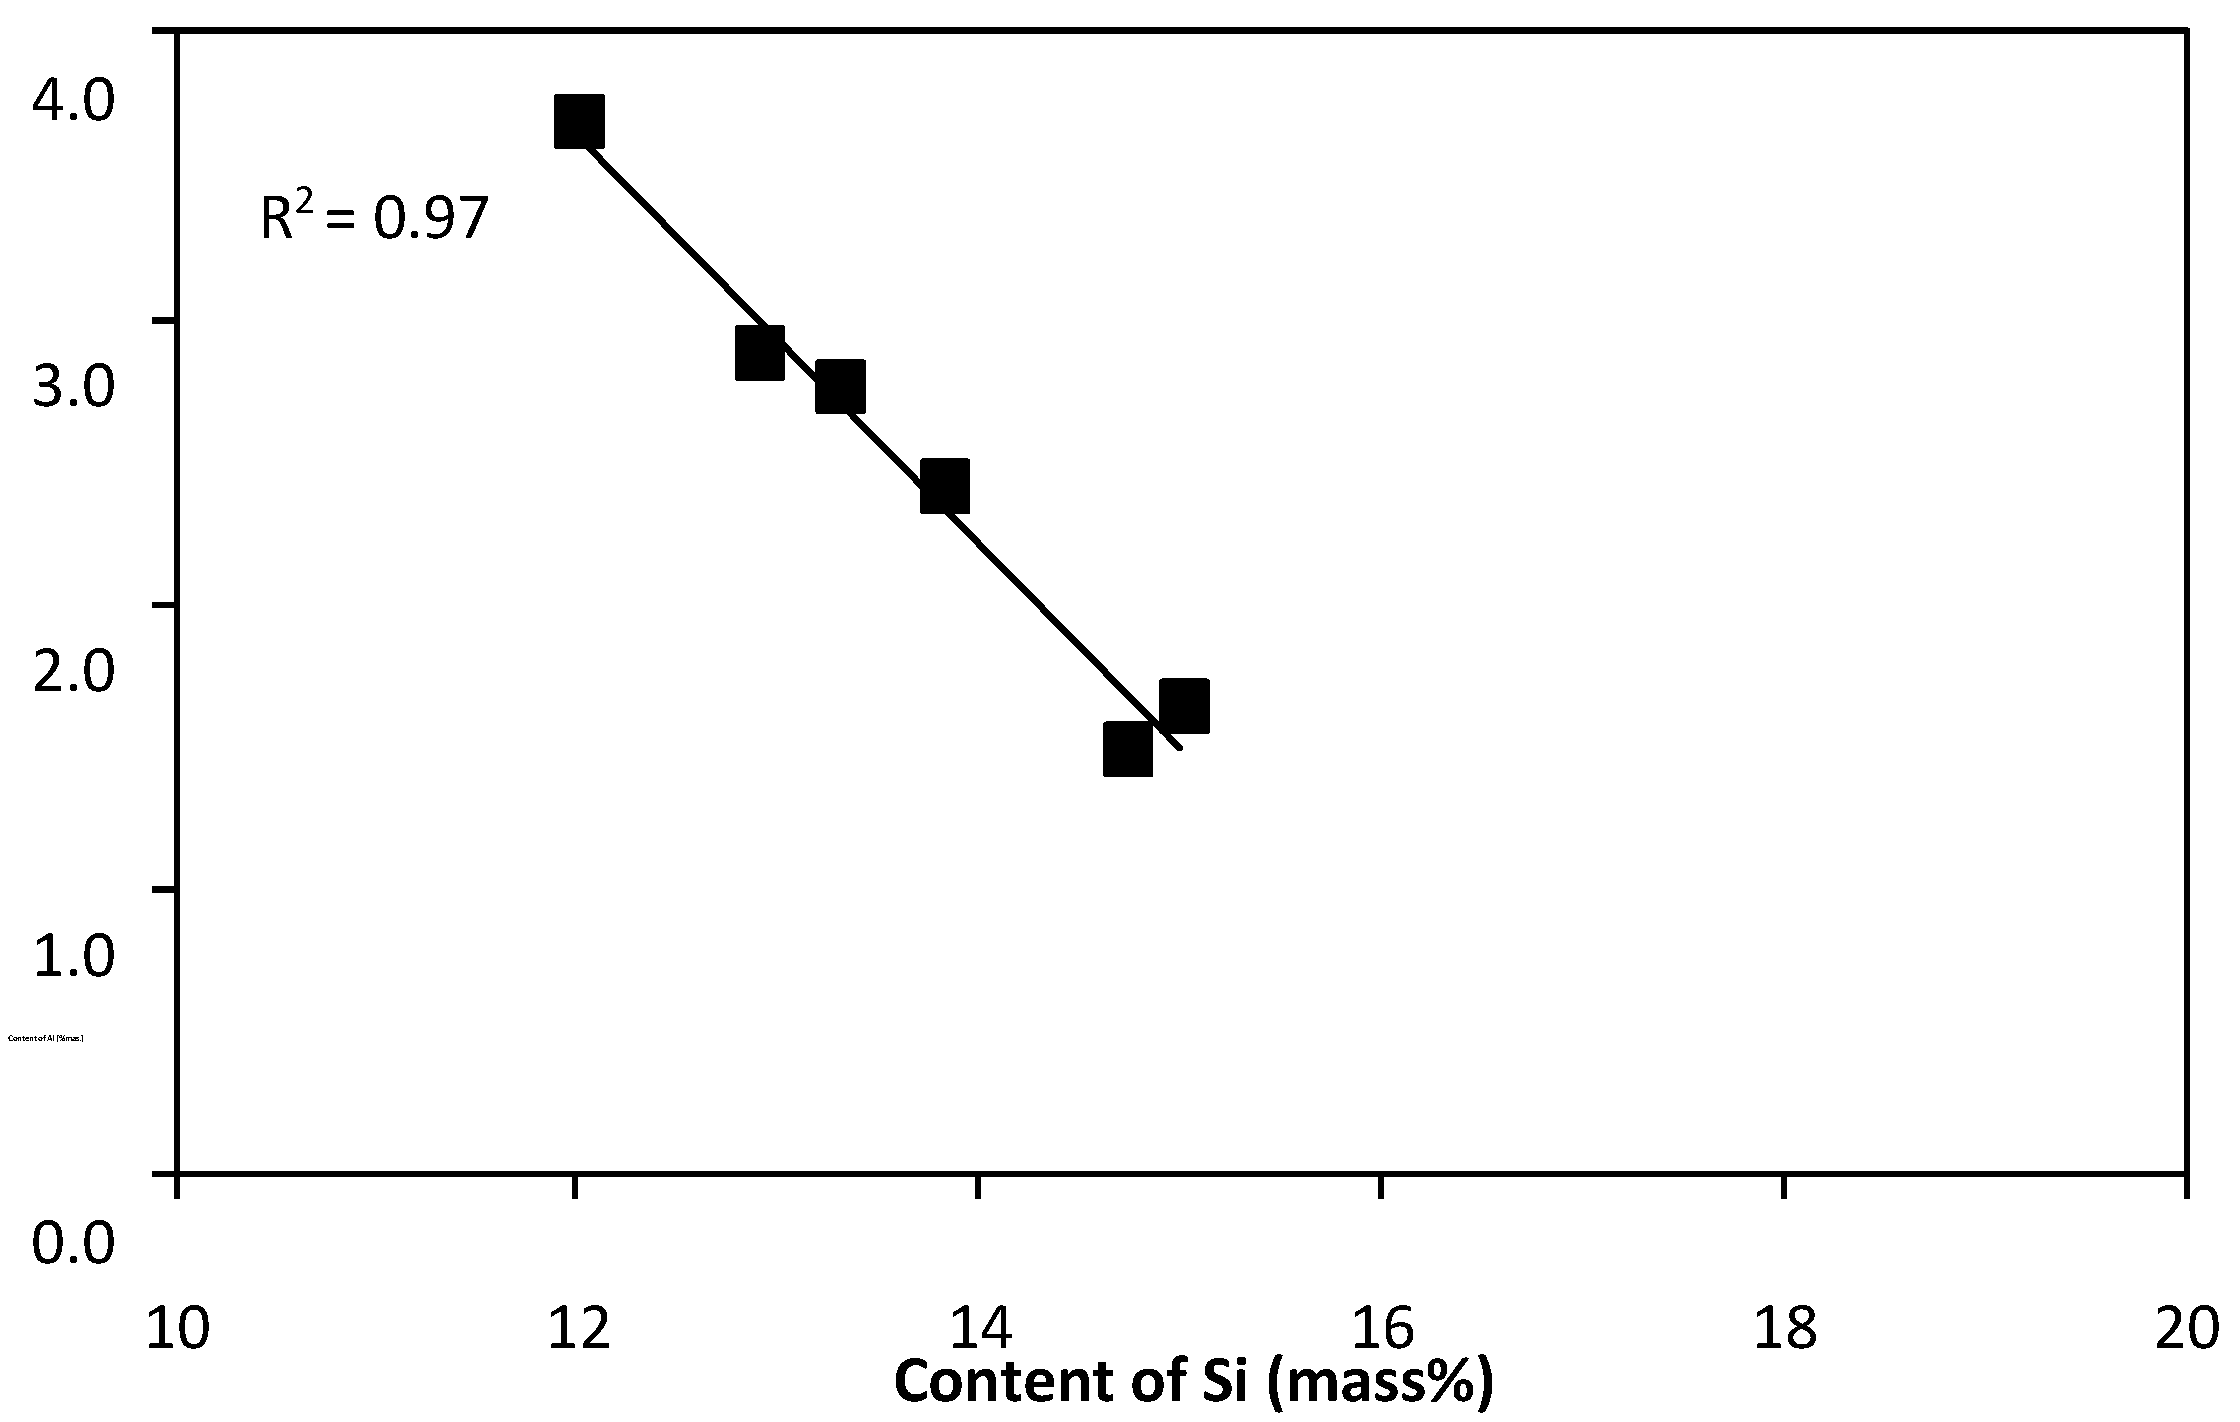
- with increasing silicon content, the content of aluminum decreases and the R2 value of the trend line is in this case 0.97 (Figure 6),
- –
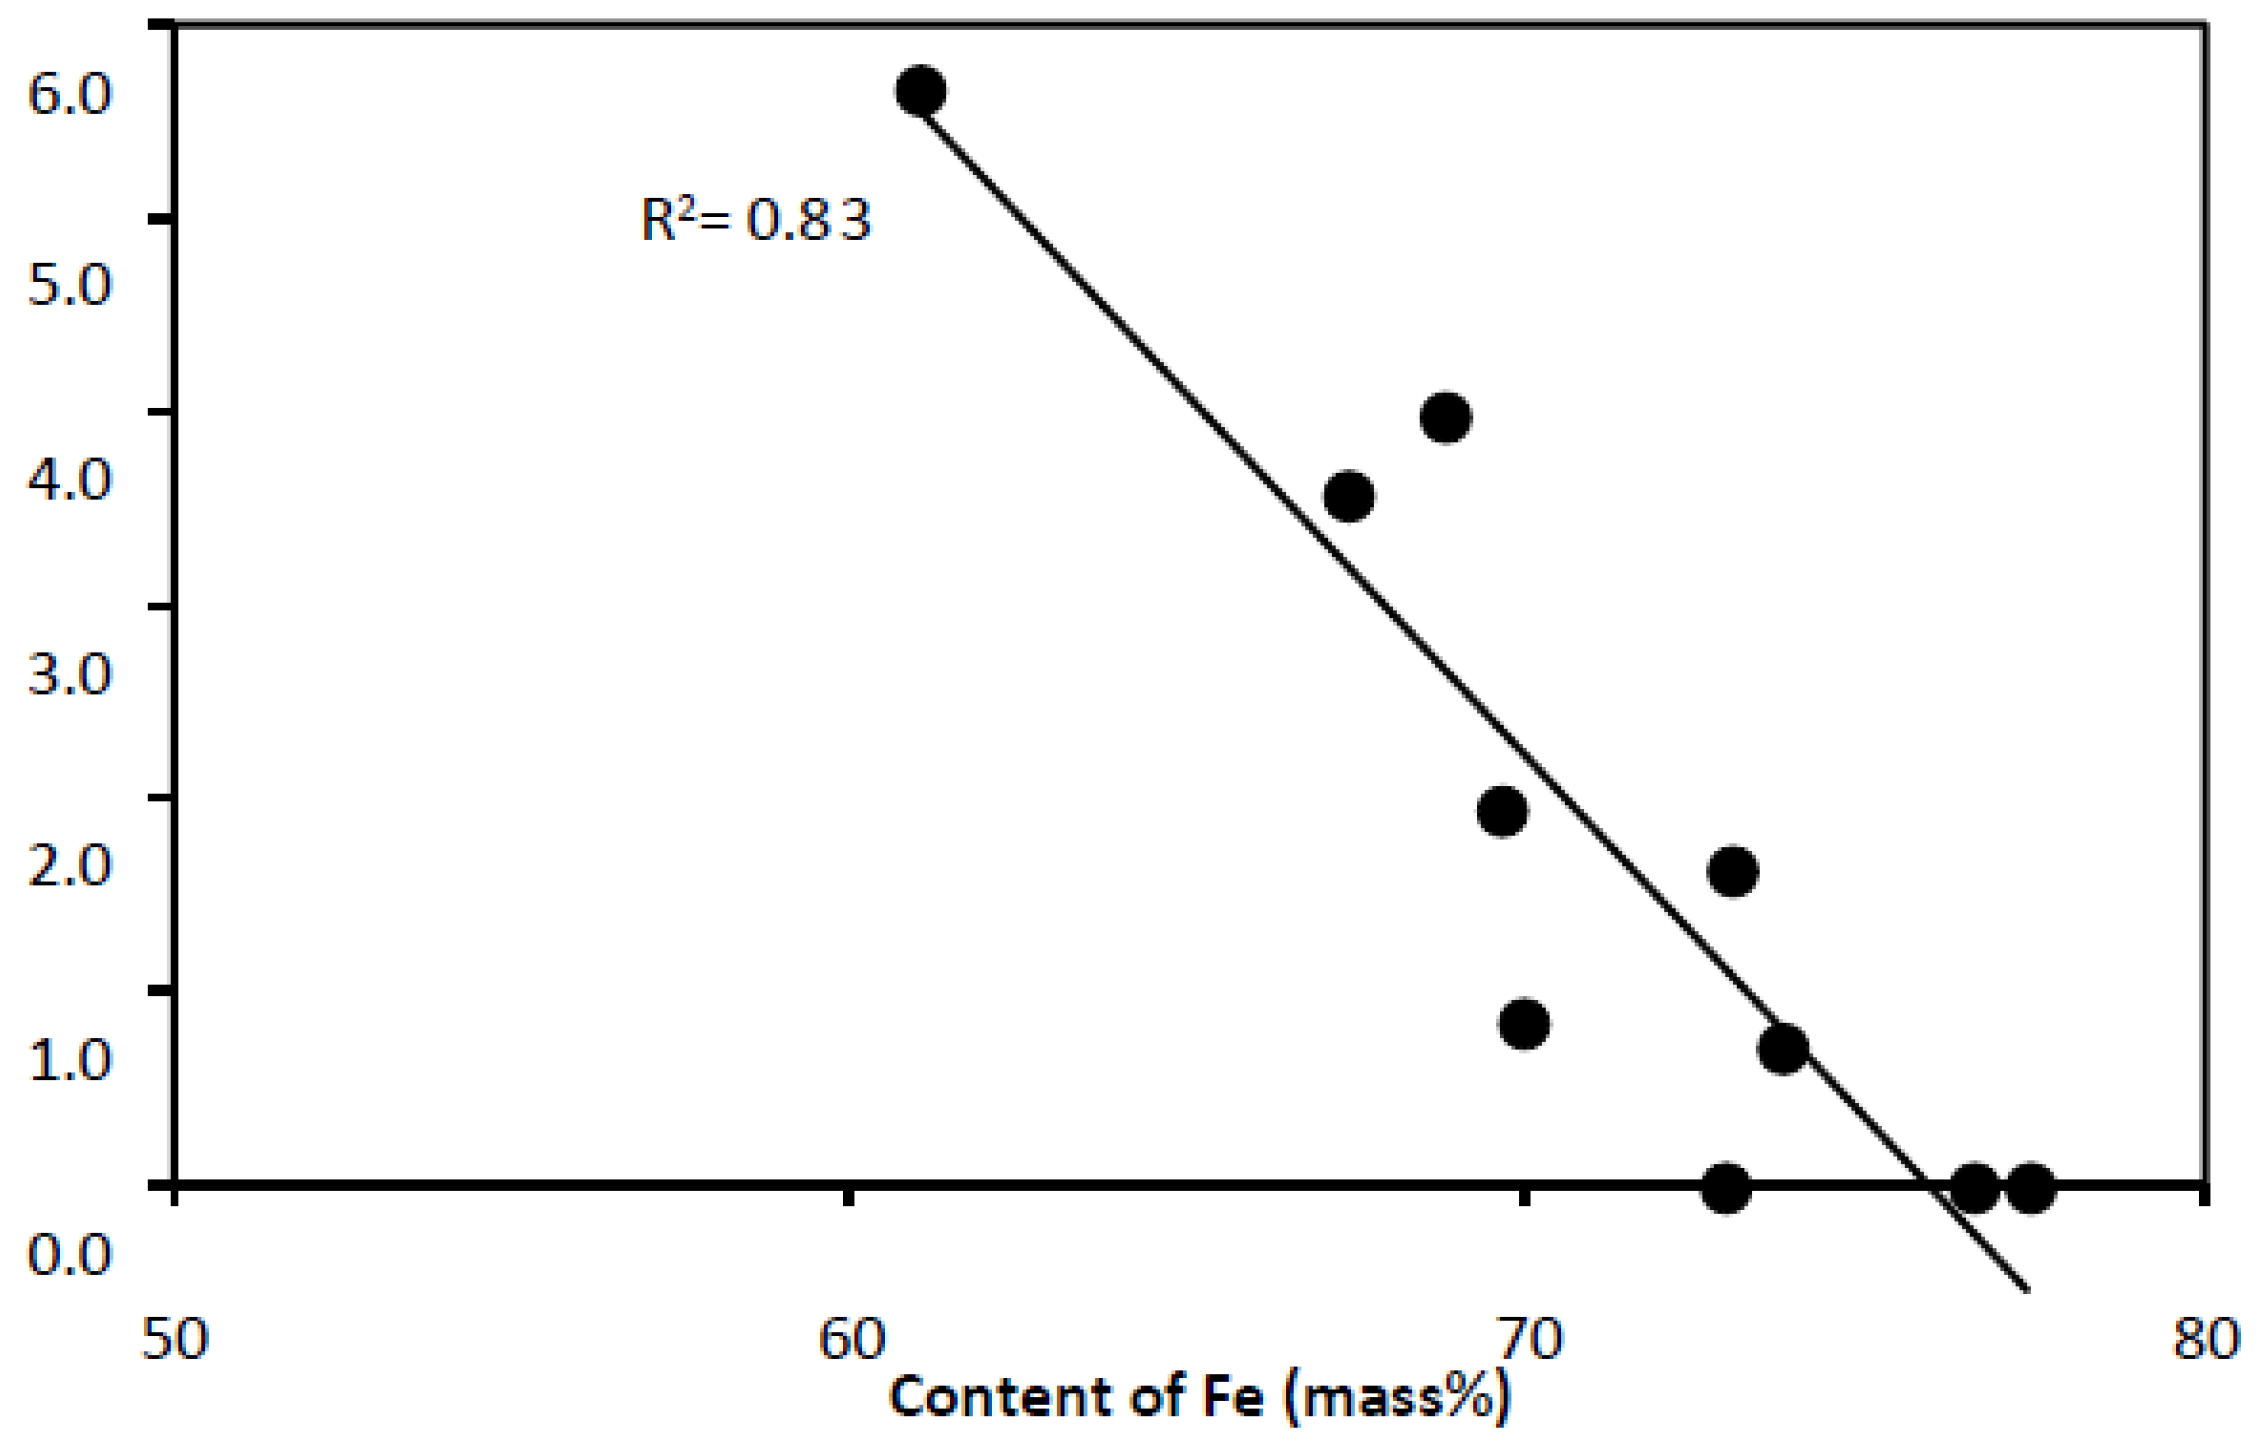
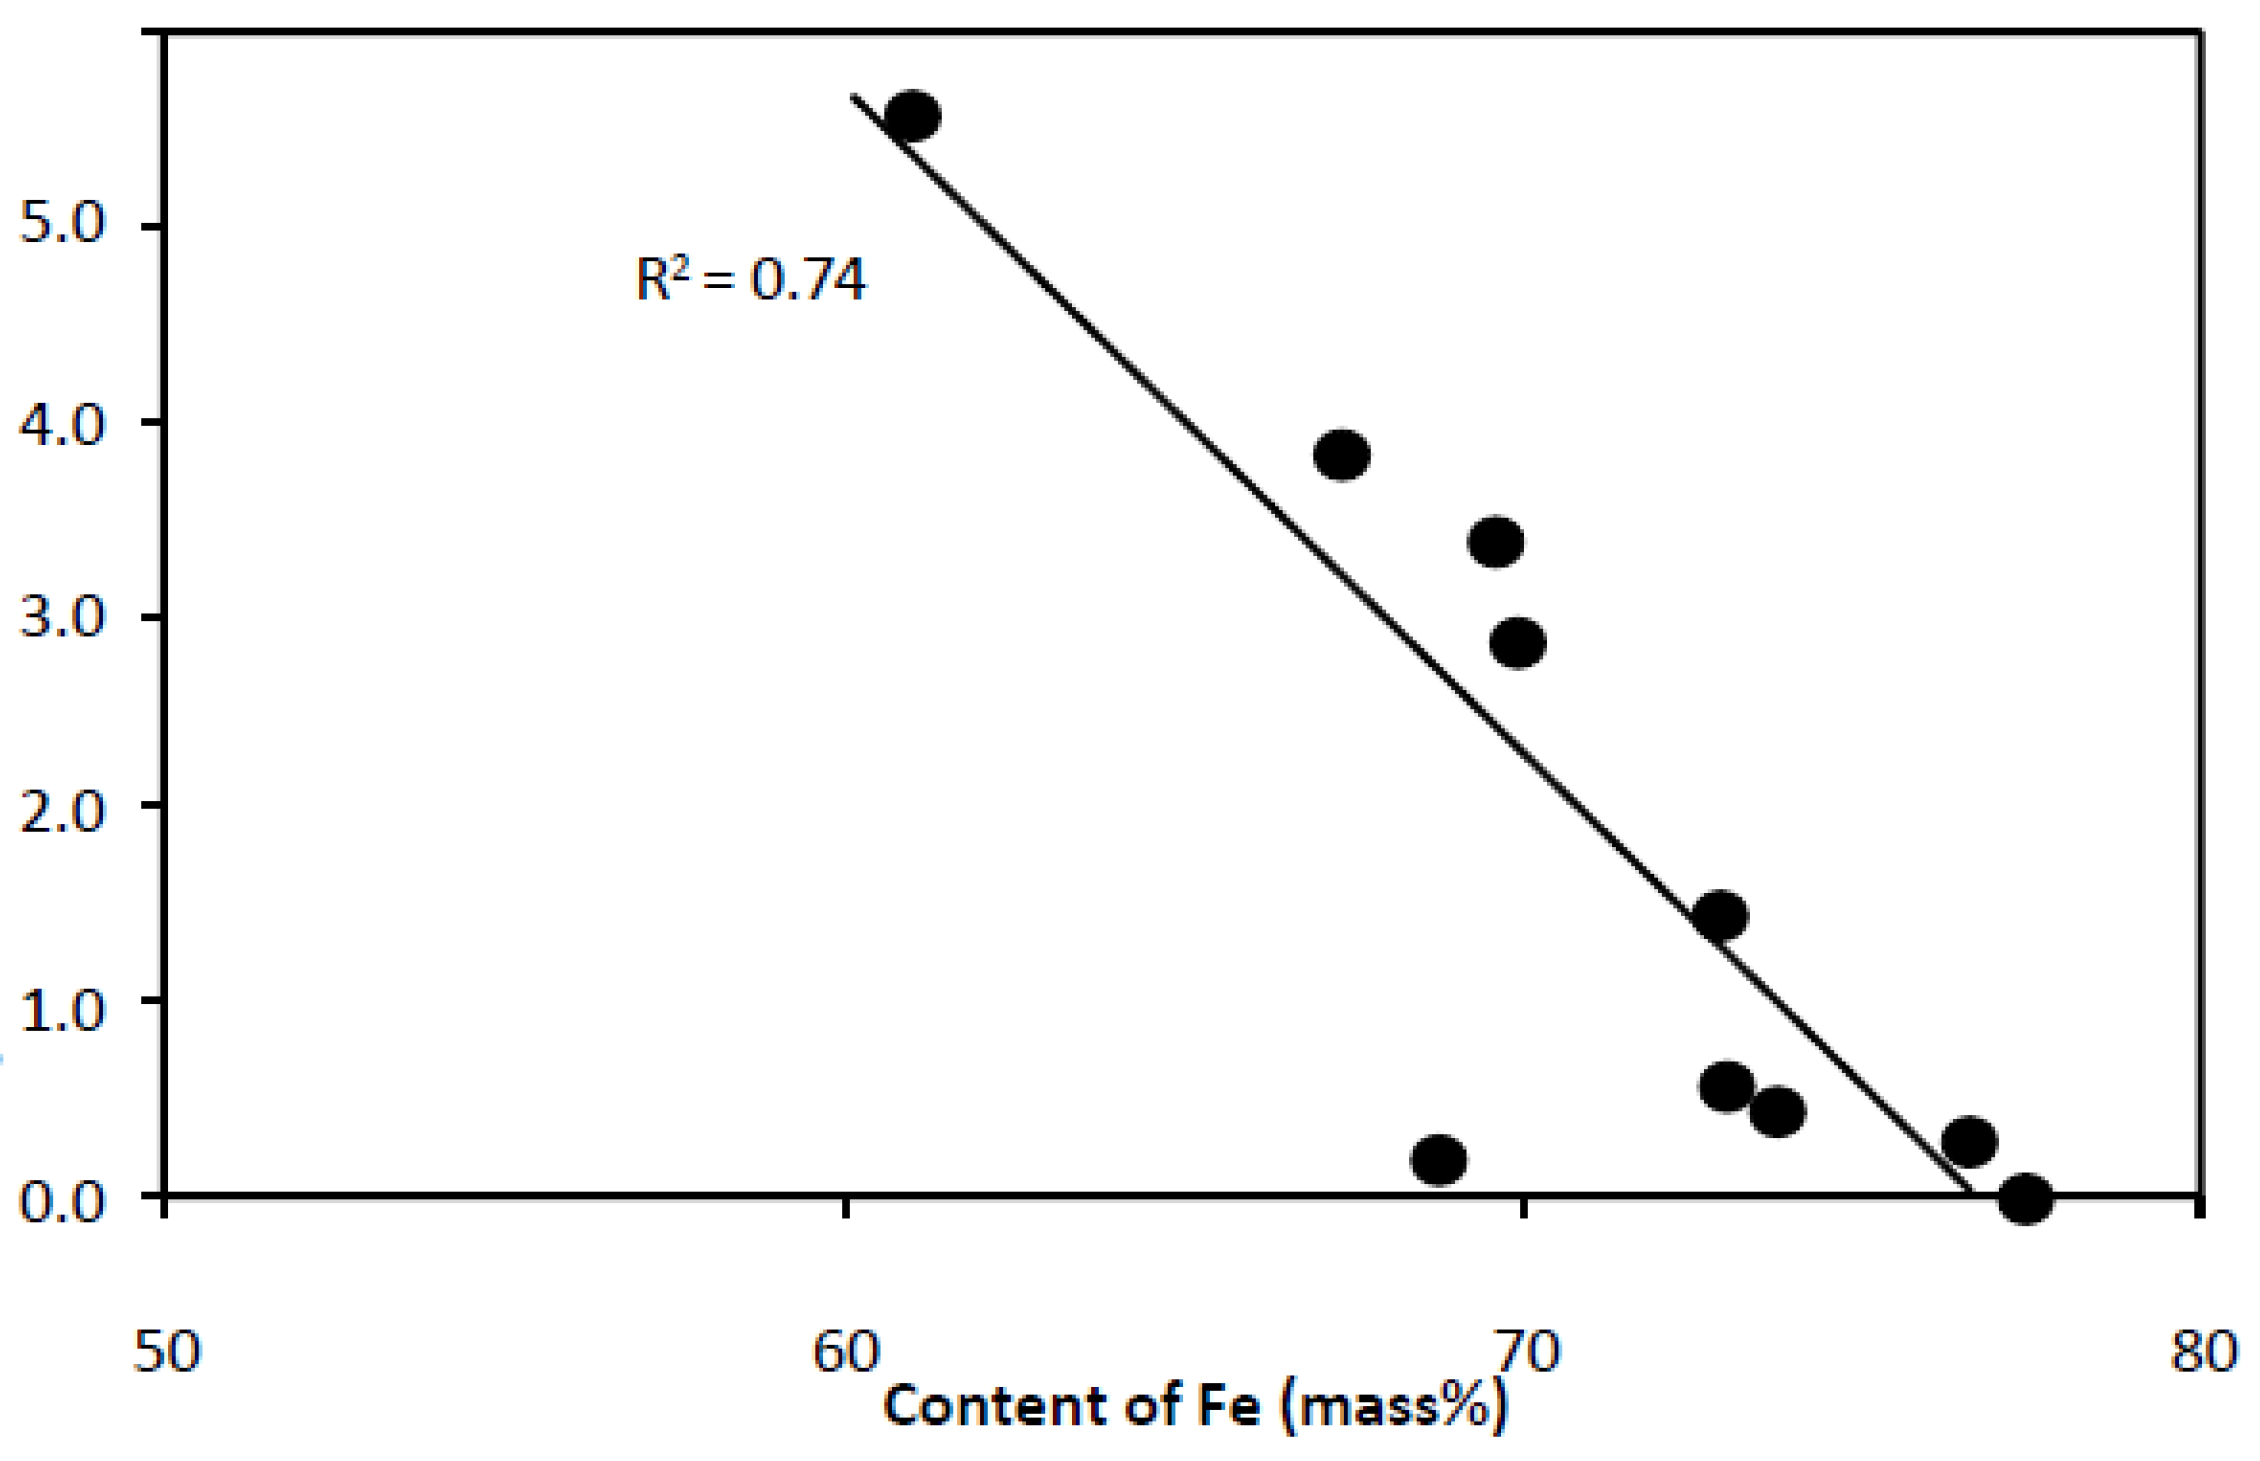
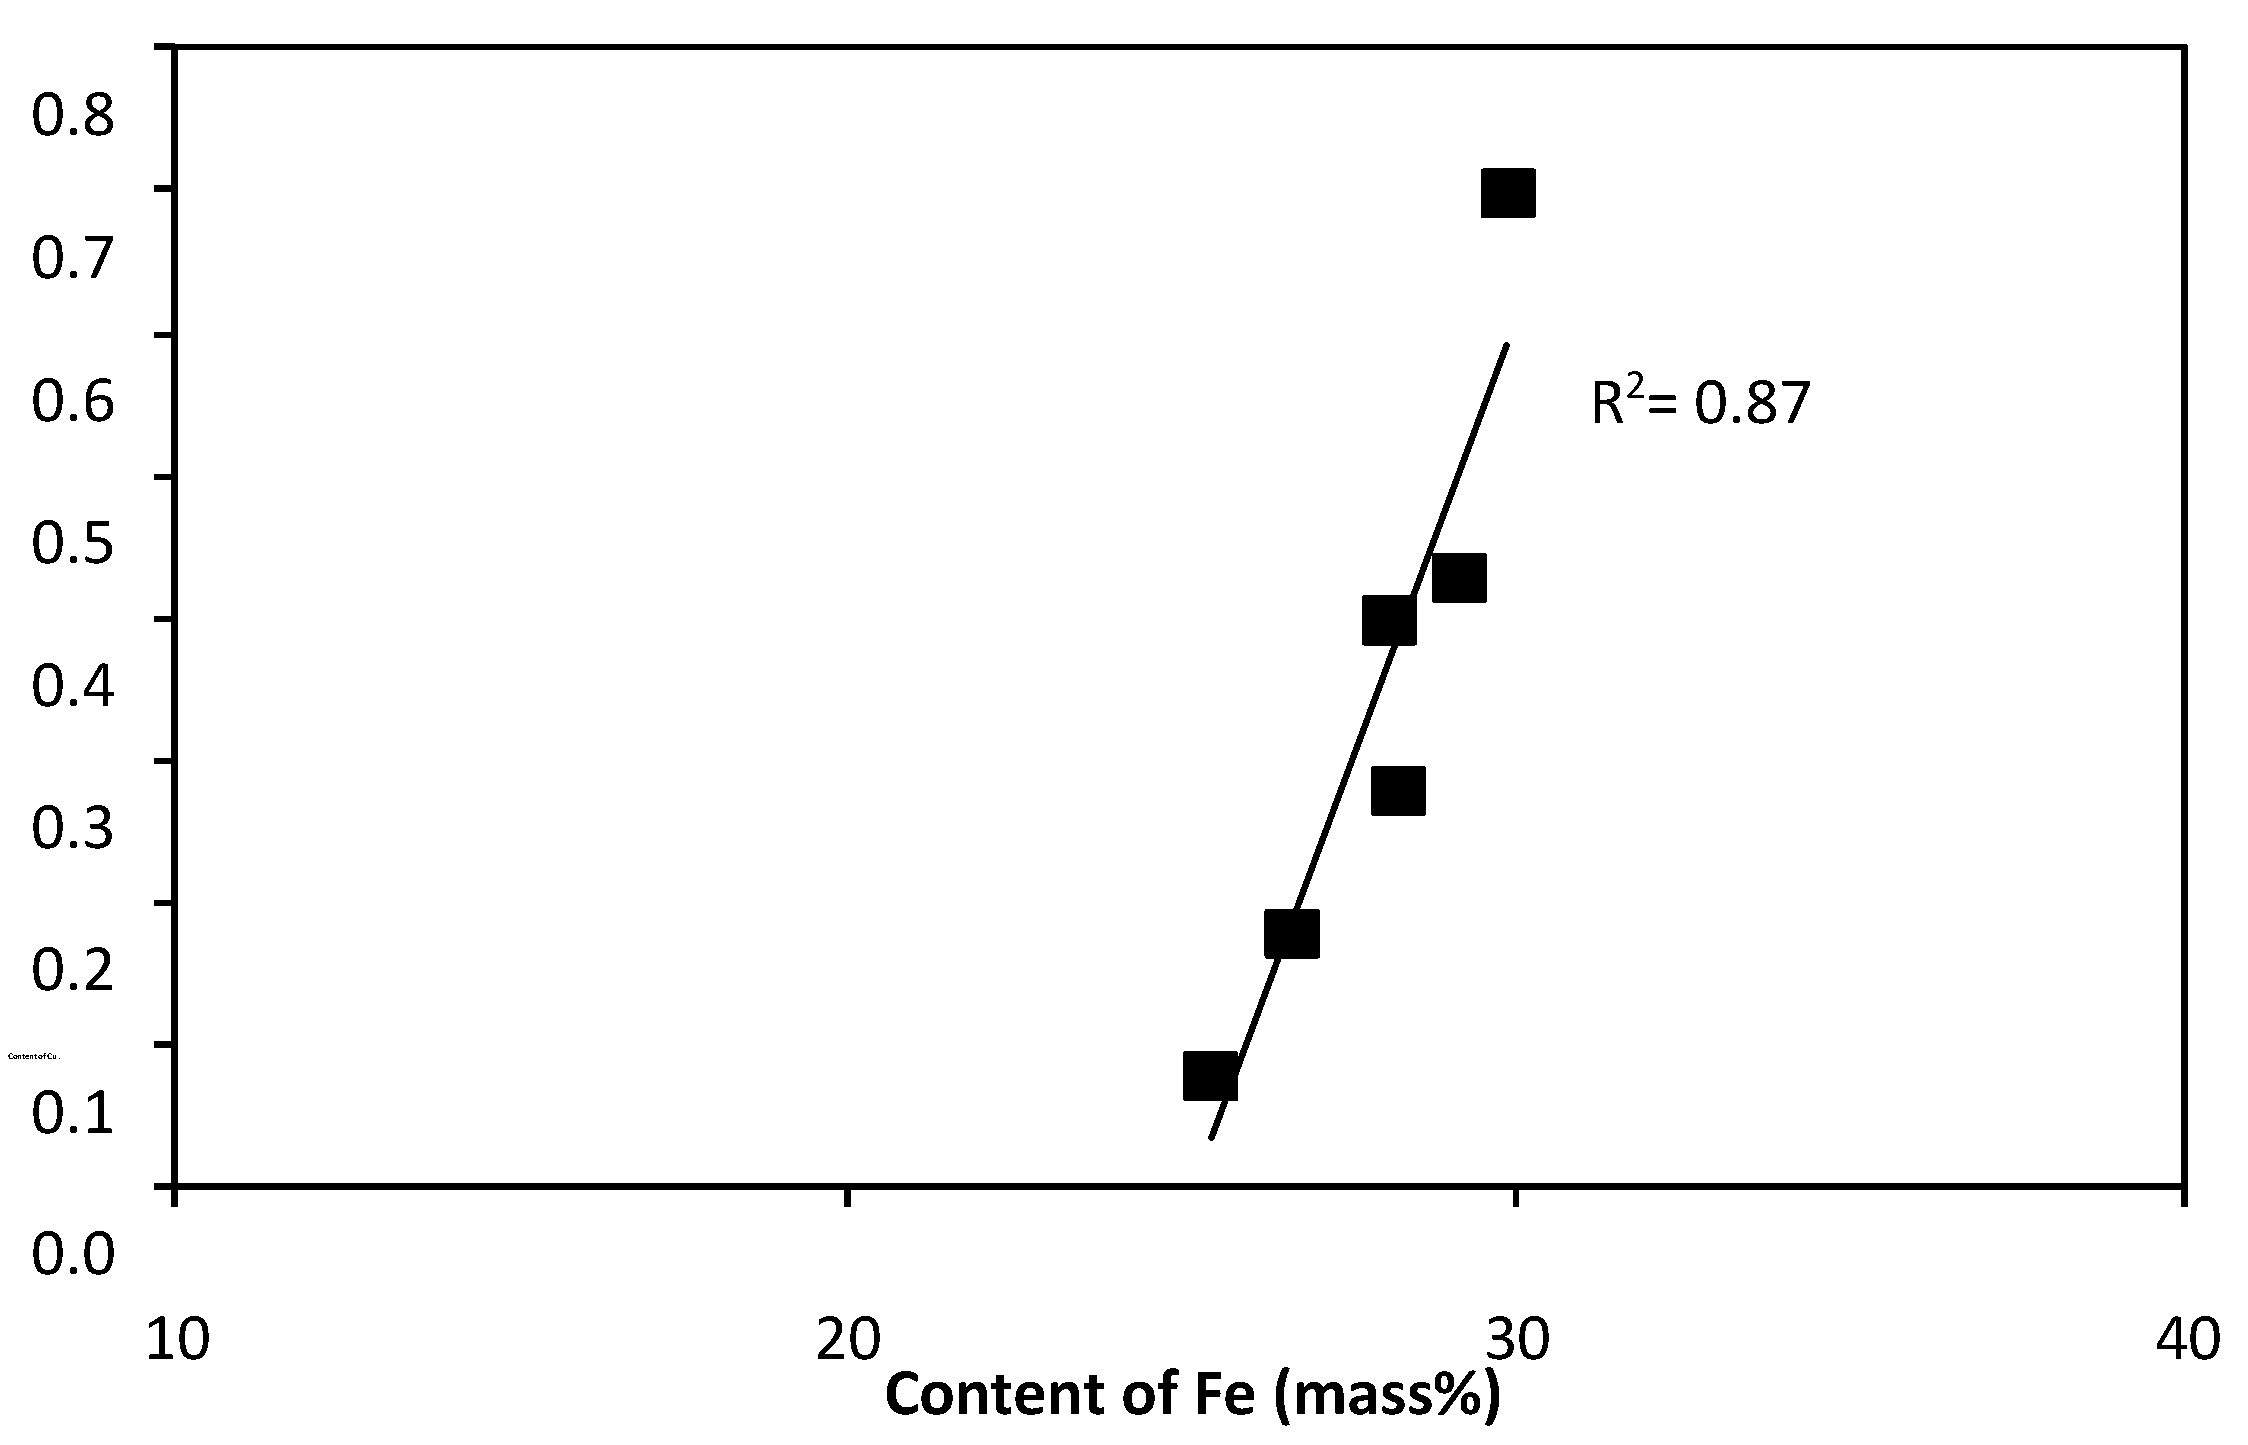
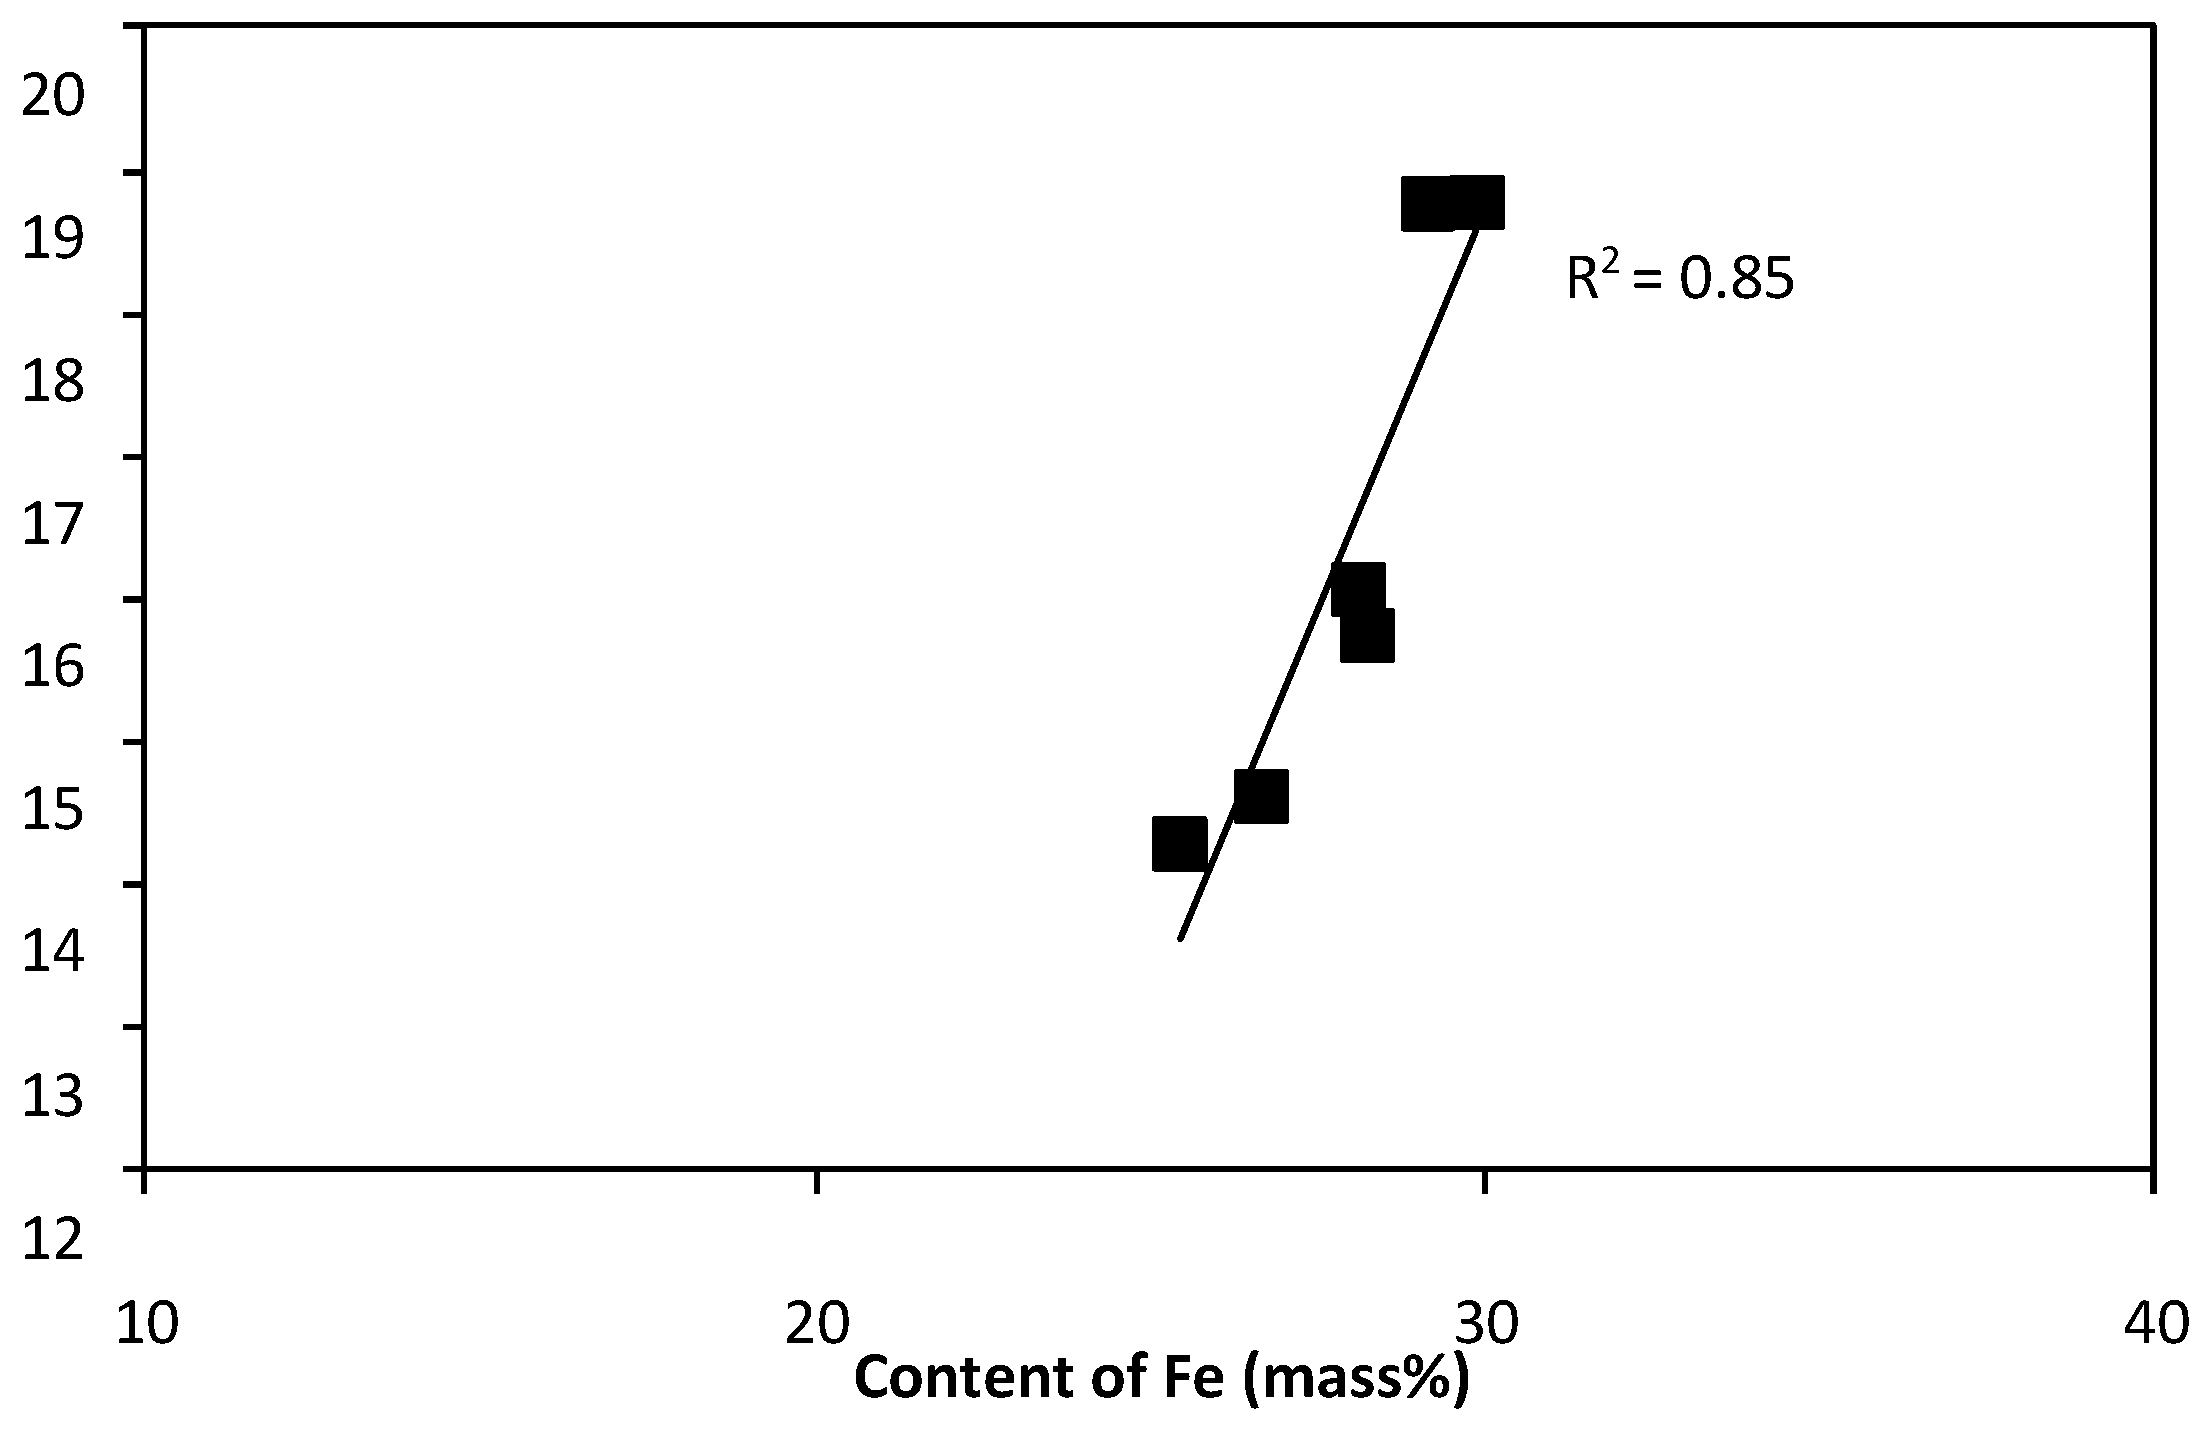
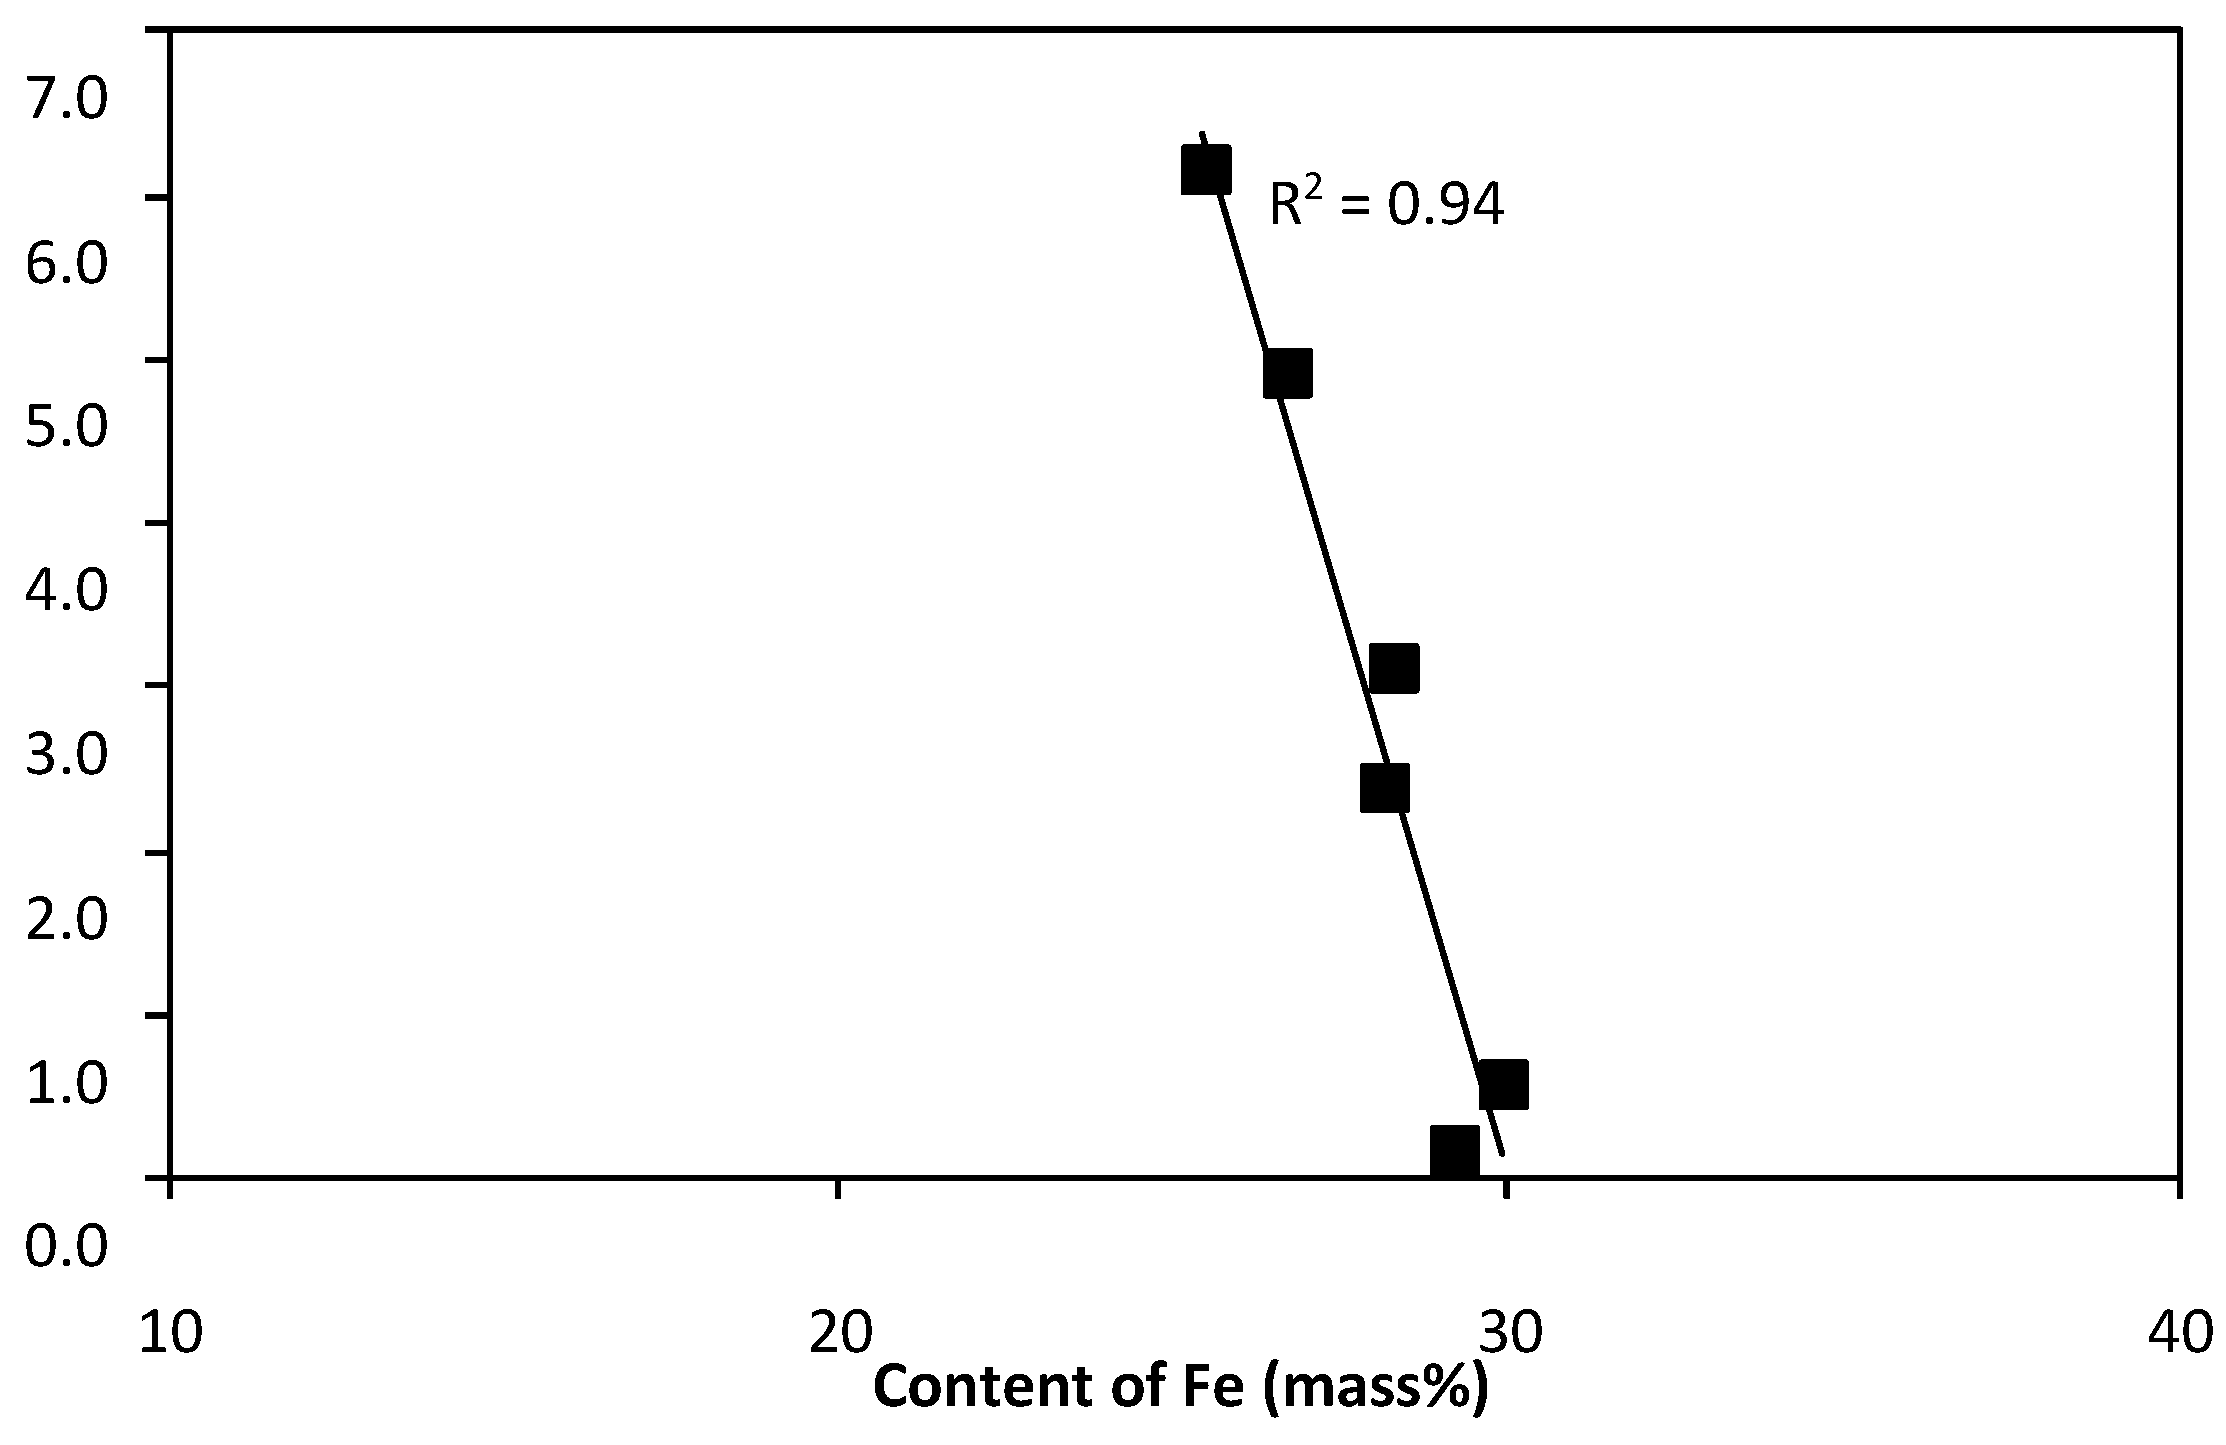
- with increasing iron content:
- –
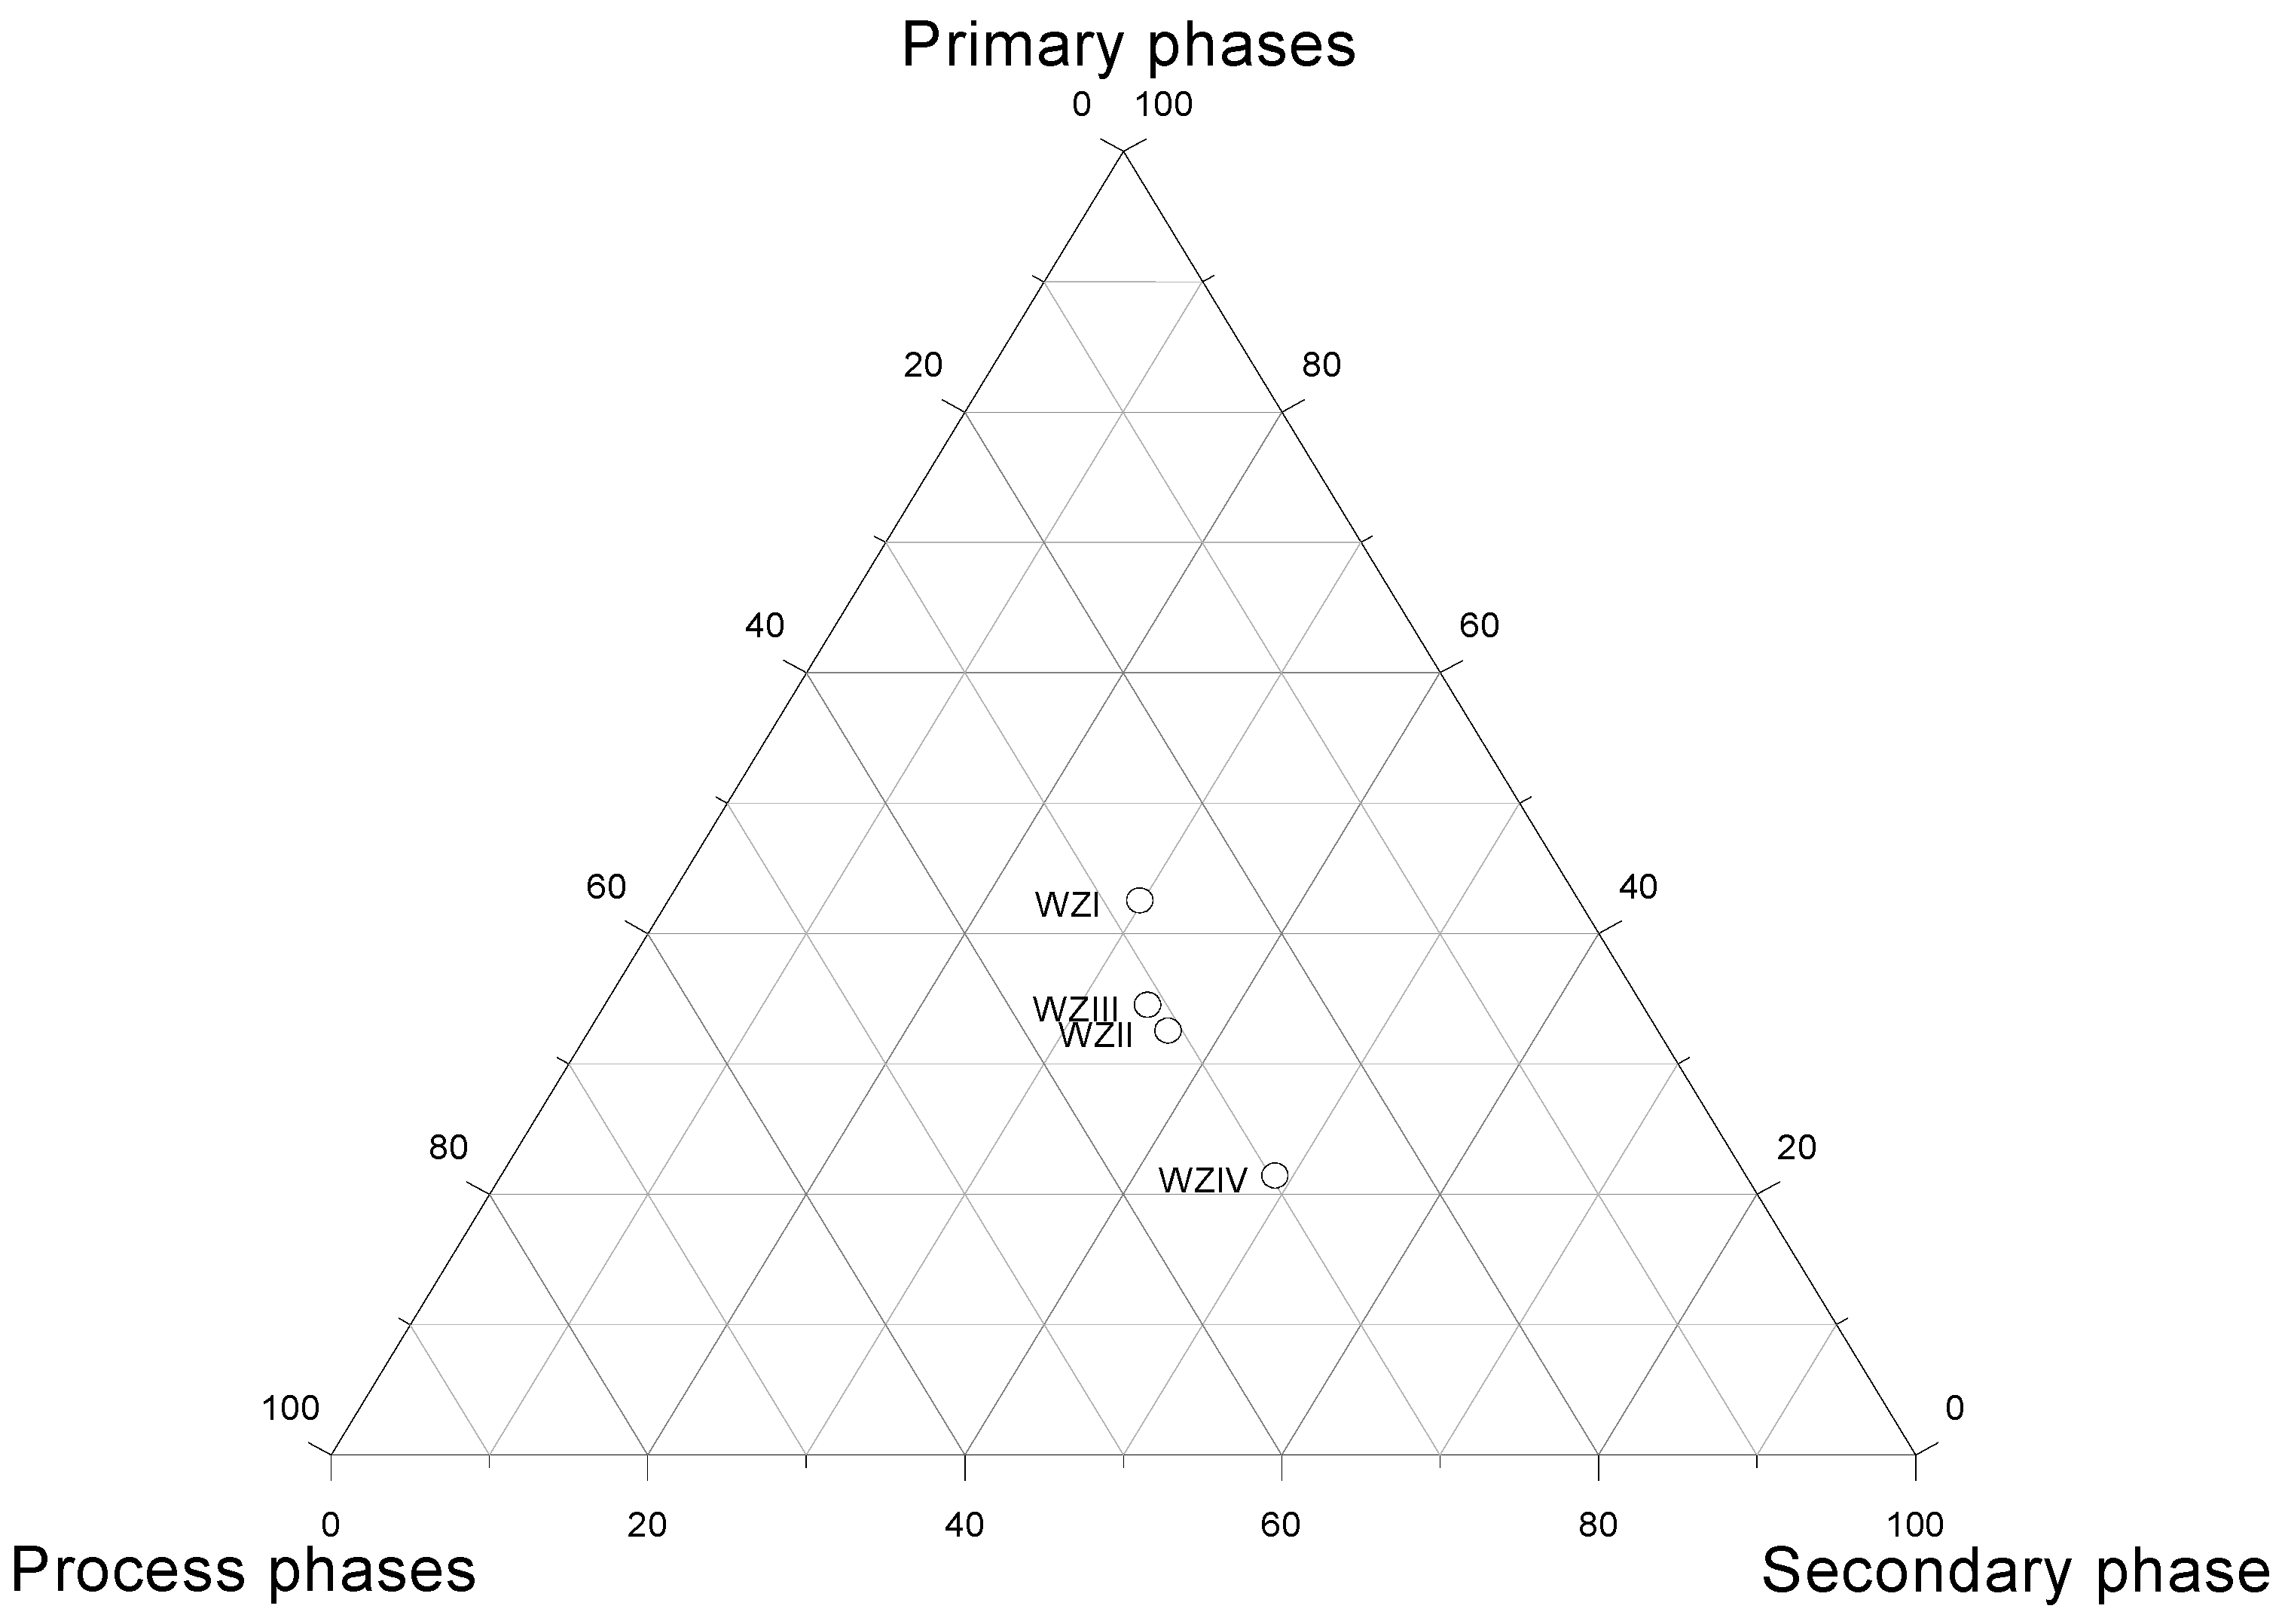
- mineral constituents, which are part of zinc and lead concentrates used as feedstock in the pyrometallurgical process—this includes sphalerite only,
- –
- phase constituents formed in the technological process—these include mainly kirschsteinite and wustite,
- –
- secondary mineral constituents, formed in the landfill under the action of hypergenic factors—these include gypsum, ktenasite, namuvite, tochilinite, gerhardtite, goethite.
3.2.2. Trace Phases
- –
- mineral constituents, which are part of zinc and lead concentrates used as feedstock in the pyrometallurgical process—these probably include alamosite, quartz and cerussite, which are contaminants of the concentrates resulting from the mineralization of the Zn-Pb ore deposits from which the concentrates are derived,
- –
- phase constituents formed in the technological process—these probably include metal alloys, Pb oxides and metallic Ag,
- –
- secondary mineral constituents, formed in the landfill under the action of hypergenic factors—these probably include leiteite and paulmooreite.
4. Discussion
- –
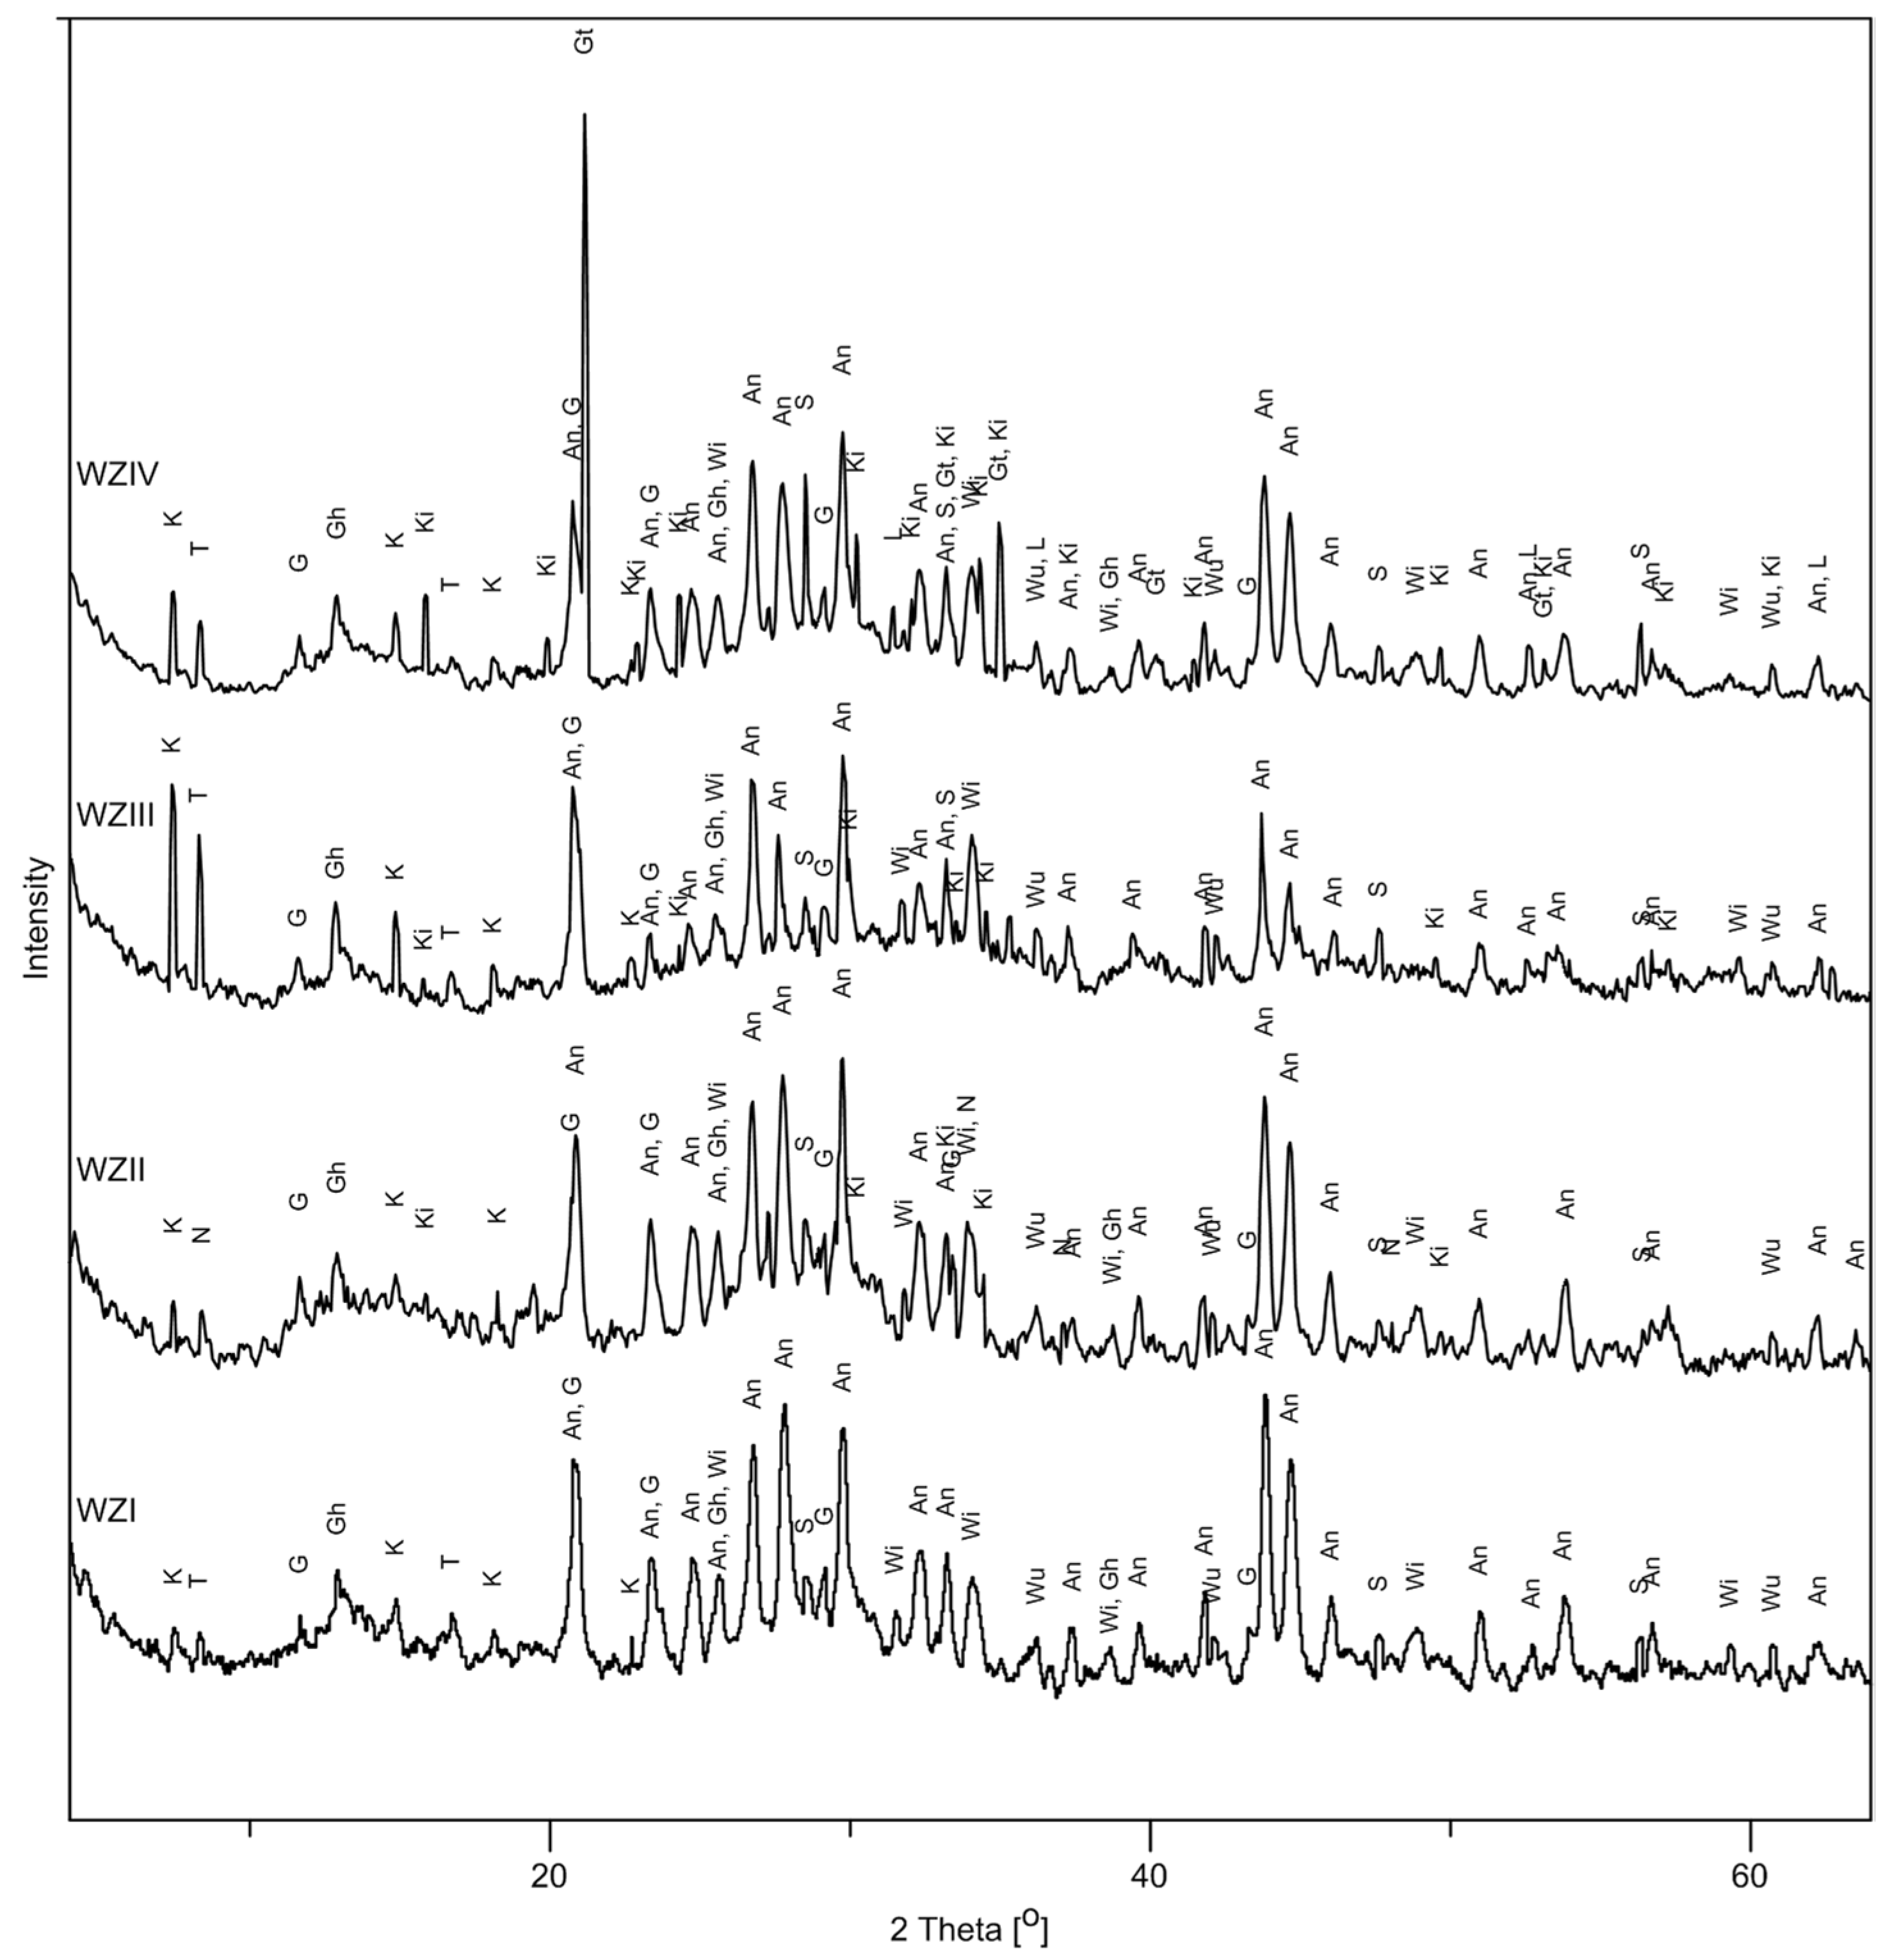
- namuvite in sample WZII, whereas samples WZI, WZIII and WZIV do not contain this phase,
- –
- tochilinite in samples WZI, WZIII and WZIV, whereas sample WZII does not contain this phase,
- –
- metallic Pb and goethite in sample WZIV, whereas these constituents are not present in any of the other samples,
- –
- kirschsteinite in all samples, except WZI.
5. Conclusions
Funding
Acknowledgments
Conflicts of Interest
References
- Vignes, A. Extractive Metallurgy 3; Willey: Hoboken, NJ, USA, 2013. [Google Scholar]
- Potesser, M.; Holleis, B.; Antrekowitsch, H.; Konetschnik, S. New Pyrometallurgical Bullion Lead Refining Process. In Proceedings of the TMS 2008, 137th Annual Meeting & Exhibition, New Orleans, LA, USA, 9–13 March 2008; pp. 1–8. [Google Scholar]
- Chodkowski, S. Metalurgia Metali Nieżelaznych; Wydawnictwo Śląsk: Katowice, Poland, 1971. [Google Scholar]
- Adamczyk, Z.; Nowińska, K. Phase composition of metallurgical zinc and lead slags. Civil Environ. Eng. Rep. 2013, 11, 13–21. [Google Scholar]
- Nowińska, K.; Adamczyk, Z. Slags of the imperial smelting process for Zn and Pb production. In Reference Module in Materials Science and Materials Engineering; Saleem, H., Ed.; Elsevier: Amsterdam, The Netherlands, 2017; pp. 1–5. [Google Scholar]
- Lima, L.R.P.D.A.; Bernardez, L. Characterization of the lead smelter slag in Santo Amaro, Bahia, Brazil. J. Hazard. Mater. 2011, 189, 692–699. [Google Scholar] [CrossRef] [PubMed]
- Ettler, V.; Johan, Z.; Touray, J.-C.; Jelínek, E. Zinc partitioning between glass and silicate phases in historical and modern lead–zinc metallurgical slags from the Příbram district, Czech Republic. Earth Planet. Sci. 2000, 331, 245–250. [Google Scholar] [CrossRef] [Green Version]
- Ettler, V.; Komárková, M.; Jehlicka, J.; Coufal, P.; Hradil, D.; Machovič, V.; Delorme, F. Leaching of lead metallurgical slag in citric solutions—implications for disposal and weathering in soil environments. Chemosphere 2004, 57, 567–577. [Google Scholar] [CrossRef]
- Harvey, W.; Downs-Rose, G. The Bay Mine, Wanlockhead, Scotland. Br. Min. 1976, 2, 1–9. [Google Scholar]
- Kierczak, J.; Puziewicz, J.; Bril, H. Pyrometallurgical Slags in Upper and Lower Silesia (Poland): From Environmental Risks to Use of Slag-based Products—A Review. Arch. Environ. Prot. 2010, 36, 111–126. [Google Scholar]
- Kucha, H.; Martens, A.; Ottenburgs, R.; De Vos, W.; Viaene, W. Primary minerals of Zn-Pb mining and metallurgical dumps and their environment behavior at Plombieres, Belgium. Environ. Geol. 1996, 27, 1–7. [Google Scholar] [CrossRef]
- Paar, W.H.; Mereiter, K.; Braithwaite, R.S.W.; Keller, P.; Dunn, P.J. Chenite, Pb4Cu(SO4)2(OH)6, a new mineral, from Leadhills, Scotland. Miner. Mag. 1986, 50, 129–135. [Google Scholar] [CrossRef]
- Piatak, N.M.; Seal, R., II. Mineralogy and the release of trace elements from slag from the Hegeler Zinc smelter, Illinois (USA). Appl. Geochem. 2010, 25, 302–320. [Google Scholar] [CrossRef]
- Warchulski, R.; Doniecki, T.; Gawęda, A.; Szopa, K. Composition and weathering of Zn-Pb slags from Bytom—PiekaryŚląskie area: A case of heavy metal concentration and mobility. Mineral. Spec. Pap. 2012, 40, 132–133. [Google Scholar]
- Warchulski, R.; Doniecki, T.; Gawęda, A.; Szopa, K. Secondary phases from the Zn-Pb smelting slags from Katowice—Piekary Śląskie area, Upper Silesia, Poland: A SEM—XRD overview. Mineral. Spec. Pap. 2014, 42, 110. [Google Scholar]
- Warchulski, R.; Gawęda, A.; Kądziołka-Gaweł, M.; Szopa, K. Composition and element mobilization in pyrometallurgical slags from the Orzeł Biały smelting plant in the Bytom–Piekary Śląskie area, Poland. Miner. Mag. 2015, 79, 459–483. [Google Scholar] [CrossRef]
- Pozzi, M.; Nowińska, K. Dystrybucja Wybranych Pierwiastków Towarzyszących Koncentratom Zn-Pb w Technologii Imperial Smelting Process; Wydawnictwo Politechniki Śląskiej: Gliwice, Poland, 2006. [Google Scholar]
- Adamczyk, Z.; Melaniuk-Wolny, E.; Nowińska, K. The Mineralogical and Chemical Study of Feedstock Mixtures and by-Products from Pyrometallurgical Process of Zinc and Lead Production; Wydawnictwo Politechniki Śląskiej: Gliwice, Poland, 2010. [Google Scholar]
- Billon, G.; Ouddane, B.; Recourt, P.; Boughriet, A. Depth Variability and some Geochemical Characteristics of Fe, Mn, Ca, Mg, Sr, S, P, Cd and Zn in Anoxic Sediments from Authie Bay (Northern France). Estuar. Coast. Shelf Sci. 2002, 55, 167–181. [Google Scholar] [CrossRef]
- Karbassi, A.R. Geochemistry of Ni, Zn, Cu, Pb, Co, Cd, V, Mn, Fe, Al and Ca in sediments of North Western part of the Persian Gulf. Int. J. Environ. Stud. 1998, 54, 205–212. [Google Scholar] [CrossRef]
- Rose, A.W. Geochemical methods of prospecting for non-metallic minerals. J. Geochem. Explor. 1991, 41, 387–388. [Google Scholar] [CrossRef]
- Cappuyns, V.; Alian, V.; Vassilieva, E.; Swennen, R. pH Dependent Leaching Behavior of Zn, Cd, Pb, Cu and As from Mining Wastes and Slags: Kinetics and Mineralogical Control. Waste Biomass. Valorization 2013, 5, 355–368. [Google Scholar] [CrossRef] [Green Version]
- Handke, M. Krystalochemia Krzemianów; Uczelniane Wydawnictwo Naukowo-Dydaktyczne AGH: Kraków, Poland, 2005. [Google Scholar]
- Cairncross, B.; Windisch, W. Microminerals from Bushveld Complex South Africa. Mineral. Rec. 1998, 29, 461–466. [Google Scholar]
- Trajanova, M.; Žorž, Z. Abandoned Remšnik mine with ramsbeckite and namuwite(?). Geologija 2013, 56, 57–72. [Google Scholar] [CrossRef]
- Groat, L.A. The crystal structure of namuwite, a mineral with Zn in tetrahedral and octahedral coordination, and its relationship to the synthetic basic zinc sulfates. Am. Miner. 1996, 81, 238–243. [Google Scholar] [CrossRef]
- Bevins, R.E.; Turgoose, S.; Williams, P.A. Namuwite, (Zn,Cu)4SO4(OH)6.4H2O, a new mineral from Wales. Miner. Mag. 1982, 46, 51–54. [Google Scholar] [CrossRef]
- Martín, F.; Diez, M.; García, I.; Simón, M.; Dorronsoro, C.; Iriarte, Á.; Aguilar, J.; Martín-Peinado, F. Weathering of primary minerals and mobility of major elements in soils affected by an accidental spill of pyrite tailing. Sci. Total. Environ. 2007, 378, 49–52. [Google Scholar] [CrossRef] [PubMed]
- Bril, H.; Zainoun, K.; Puziewicz, J.; Courtin-Nomade, A.; Vanaecker, M.; Bollinger, J.-C. Secondary phases from the alteration of a pile of zinc-smelting slag as indicators of environmental conditions: An example from swietochlowice, upper silesia, poland. Can. Miner. 2008, 46, 1235–1248. [Google Scholar] [CrossRef] [Green Version]
- Parsons, M.; Bird, D.K.; Einaudi, M.T.; Alpers, C.N. Geochemical and mineralogical controls on trace element release from the Penn Mine base-metal slag dump, California. Appl. Geochem. 2001, 16, 1567–1593. [Google Scholar] [CrossRef]
- Bauerek, J.; Cabala, B. Smieja-Król, Mineralogical Alterations of Zn-Pb Flotation Wastes of the Mississippi Valley Type Ores (Southern Poland) and Their Impact on Contamination of Rain Water Runoff. Polish J. Environ. Stud. 2009, 18, 781–788. [Google Scholar]
- Cabała, J. Metale Ciężkie w Środowisku Glebowym Olkuskiego Rejonu Eksploatacji Rud Zn-Pb; Wydawnictwo Uniwersytetu Śląskiego: Katowice, Poland, 2009. [Google Scholar]
- Bowell, R.J.; Mocke, H. Minerals new to Tsumeb. Commun. Geol. Surv. Namib. 2018, 19, 20–46. [Google Scholar]
- Majzlan, J.; Drahota, P.; Filippi, M. Parageneses and Crystal Chemistry of Arsenic Minerals. Rev. Miner. Geochem. 2014, 79, 17–184. [Google Scholar] [CrossRef]
- Bohlke, J.; Friedrich, B.; Hecker, E. Treatment of Industrial Lead and Zinc Slags in a Pilot Scale SAF. World Metall. Erzmetall 2005, 58, 210–217. [Google Scholar]


| Chemical Constituent | Sample Symbol | x | s | V | |||
|---|---|---|---|---|---|---|---|
| WZI | WZII | WZIII | WZIV | ||||
| SiO2 | 1.99 ± 0.20 | 2.98 ± 0.30 | 3.83 ± 0.39 | 4.99 ± 0.50 | 3.45 | 1.27 | 37 |
| TiO2 | 0.09 ± 0.02 | 0.14 ± 0.01 | 0.17 ± 0.02 | 0.15 ± 0.02 | 0.14 | 0.04 | 25 |
| Al2O3 | 1.35 ± 0.14 | 2.97 ± 0.30 | 3.27 ± 0.33 | 3.56 ± 0.36 | 2.79 | 0.99 | 35 |
| FeO | 24.77 ± 1.24 | 25.94 ± 1.30 | 26.59 ± 1.33 | 25.70 ± 1.29 | 25.75 | 0.76 | 3 |
| MnO | 0.12 ± 0.01 | 0.57 ± 0.06 | 0.57 ± 0.06 | 0.56 ± 0.06 | 0.45 | 0.22 | 49 |
| MgO | 0.36 ± 0.04 | 0.59 ± 0.06 | 0.73 ± 0.08 | 0.50 ± 0.05 | 0.54 | 0.16 | 29 |
| CaO | 1.69 ± 0.17 | 4.75 ± 0.48 | 5.16 ± 0.52 | 4.42 ± 0.45 | 4.00 | 1.57 | 39 |
| K2O | 0.05 ± 0.01 | 0.19 ± 0.02 | 0.23 ± 0.03 | LLOD | 0.12 | 0.11 | 94 |
| P2O5 | 0.06 ± 0.01 | 0.08 ± 0.02 | 0.11 ± 0.01 | 0.09 ± 0.01 | 0.08 | 0.02 | 23 |
| SO3 | 17.54 ± 0.88 | 16.11 ± 0.08 | 18.45 ± 0.93 | 13.17 ± 0.66 | 16.32 | 2.31 | 14 |
| ZnO | 9.59 ± 0.96 | 11.53 ± 0.58 | 10.35 ± 0.52 | 11.50 ± 0.56 | 10.74 | 0.95 | 9 |
| PbO | 21.72 ± 1.09 | 18.76 ± 0.94 | 16.97 ± 0.85 | 14.96 ± 0.75 | 18.10 | 2.86 | 16 |
| CuO | 20.68 ± 1.03 | 15.39 ± 0.77 | 13.57 ± 0.68 | 20.40 ± 1.02 | 17.51 | 3.58 | 20 |
| Total | 100.00 | 100.00 | 100.00 | 100.00 | |||
| PbO + CuO + ZnO | 51.99 | 45.68 | 40.89 | 46.87 | 46.36 | 4.56 | 10 |
| Element | Sample Symbol | |||
|---|---|---|---|---|
| WZI | WZII | WZIII | WZIV | |
| Ag | 0.036 ± 0.006 | 0.009 ± 0.002 | LLOD | 0.018 ± 0.003 |
| As | 1.33 ± 0.14 | 1.24 ± 0.13 | 1.02 ± 0.11 | 0.94 ± 0.10 |
| Ba | 0.043 ± 0.007 | 0.035 ± 0.005 | 0.034 ± 0.005 | 0.053 ± 0.008 |
| Bi | 0.0086 ± 0.0017 | LLOD | LLOD | LLOD |
| Cd | 0.33 ± 0.04 | 0.35 ± 0.04 | 0.34 ± 0.04 | 0.16 ± 0.02 |
| Co | 0.045 ± 0.007 | 0.030 ± 0.005 | 0.030 ± 0.005 | 0.039 ± 0.006 |
| Cr | 0.039 ± 0.006 | 0.079 ± 0.012 | 0.064 ± 0.010 | 0.067 ± 0.011 |
| In | 0.048 ± 0.008 | 0.048 ± 0.008 | 0.031 ± 0.005 | 0.041 ± 0.007 |
| Ni | 0.043 ± 0.007 | 0.030 ± 0.005 | 0.030 ± 0.005 | 0.031 ± 0.005 |
| Sb | 0.44 ± 0.05 | 0.43 ± 0.05 | LLOD | LLOD |
| Se | 0.034 ± 0.006 | 0.028 ± 0.005 | 0.027 ± 0.004 | 0.028 ± 0.005 |
| Tl | 0.0086 ± 0.0019 | LLOD | LLOD | LLOD |
| Element | Wustite | Kirschsteinite | ||||||||
|---|---|---|---|---|---|---|---|---|---|---|
| Min | Max | x | s | V | Min | Max | x | s | V | |
| O | 21.20 | 22.98 | 22.10 | 0.55 | 2 | 28.67 | 33.67 | 31.92 | 1.85 | 6 |
| Na | 0.00 | 0.60 | 0.15 | 0.25 | 168 | |||||
| Mg | 0.00 | 1.96 | 0.50 | 0.63 | 124 | 1.01 | 2.04 | 1.25 | 0.39 | 31 |
| Al | 0.00 | 0.51 | 0.22 | 0.18 | 83 | 1.20 | 3.70 | 2.44 | 0.90 | 37 |
| Si | 12.79 | 14.72 | 13.74 | 0.81 | 6 | |||||
| K | 0.00 | 0.70 | 0.35 | 0.22 | 64 | |||||
| Ca | 0.00 | 0.89 | 0.23 | 0.32 | 141 | 14.30 | 18.79 | 16.39 | 1.97 | 12 |
| Mn | 0.00 | 0.17 | 0.02 | 0.05 | 268 | 0.00 | 0.83 | 0.51 | 0.31 | 60 |
| Fe | 61.00 | 77.39 | 71.01 | 4.81 | 7 | 25.43 | 29.87 | 27.90 | 1.63 | 6 |
| Cu | 0.00 | 5.59 | 1.87 | 1.93 | 104 | 0.00 | 1.12 | 0.45 | 0.47 | 103 |
| Zn | 0.00 | 5.68 | 1.84 | 1.97 | 107 | 0.19 | 6.17 | 2.90 | 2.36 | 81 |
| Ag | 0.00 | 0.20 | 0.05 | 0.07 | 146 | 0.00 | 0.07 | 0.01 | 0.03 | 245 |
| Cd | 0.00 | 0.21 | 0.05 | 0.09 | 186 | 0.00 | 0.30 | 0.07 | 0.12 | 163 |
| As | 0.00 | 0.06 | 0.01 | 0.02 | 212 | 0.00 | 0.58 | 0.22 | 0.26 | 117 |
| In | 0.00 | 0.40 | 0.06 | 0.13 | 217 | 0.00 | 0.81 | 0.46 | 0.34 | 73 |
| Sn | 0.00 | 1.61 | 0.35 | 0.48 | 138 | |||||
| Sb | 0.00 | 2.09 | 0.37 | 0.66 | 180 | 0.00 | 0.70 | 0.27 | 0.24 | 91 |
| Pb | 0.00 | 2.95 | 1.33 | 0.98 | 73 | 0.12 | 2.00 | 0.95 | 0.61 | 64 |
| Element | Cerussite | Pb Oxide | Cu and Fe Sulphides | AnCe | Alloys | |||||||
|---|---|---|---|---|---|---|---|---|---|---|---|---|
| Pb–Fe(Sb) | Zn–Cu | Pb–Fe–Cu | Ag | |||||||||
| C | 4.3 | 14.9 | ||||||||||
| O | 12.3 | 4.7 | 6.3 | 7.5 | 14.0 | 4.1 | 12.2 | 11.7 | ||||
| Na | 2.0 | 1.2 | ||||||||||
| Mg | 0.1 | 0.2 | ||||||||||
| Al | 0.5 | 1.0 | 0.6 | 0.4 | 0.7 | 0.8 | ||||||
| Si | 3.8 | 1.3 | 2.2 | 2.2 | 0.7 | |||||||
| S | 21.8 | 30.0 | 26.1 | 9.3 | 1.9 | 1.0 | 2.6 | |||||
| K | ||||||||||||
| Ca | 1.3 | |||||||||||
| Mn | ||||||||||||
| Fe | 1.1 | 16.1 | 21.9 | 10.5 | 14.8 | 2.8 | 16.2 | 11.8 | 2.9 | |||
| Cu | 54.1 | 40.7 | 58.5 | 41.6 | 11.9 | 8.9 | 0.0 | |||||
| Zn | 1.1 | 3.2 | 49.6 | 8.7 | 2.9 | 0.0 | ||||||
| Ag | 0.4 | 0.2 | 94.3 | |||||||||
| Cd | 0.3 | 1.1 | 0.4 | |||||||||
| As | 4.0 | 0.1 | 0.0 | |||||||||
| In | 1.7 | 0.4 | ||||||||||
| Sn | 1.7 | 1.8 | 2.0 | 0.3 | 0.3 | 1.2 | 1.2 | 1.1 | ||||
| Sb | 2.9 | 3.8 | 1.3 | 0.3 | 0.3 | 0.3 | 2.8 | 23.1 | 2.8 | 2.5 | ||
| Pb | 76.8 | 88.6 | 82.1 | 3.4 | 1.7 | 4.3 | 63.2 | 44.2 | 42.5 | 57.8 | ||
| 100.0 | 100.0 | 100.0 | 100.0 | 100.0 | 100.0 | 100.0 | 100.0 | 100.0 | 100.0 | 100.0 | 100.0 | |
| Phase Type | Phase | Sample Symbol | x | s | V | |||
|---|---|---|---|---|---|---|---|---|
| WZI | WZII | WZIII | WZIV | |||||
| Primary | Sphalerite | 8.39 | 5.23 | 5.91 | 7.08 | 6.65 | 1.39 | 21 |
| Anglesite | 25.63 | 22.83 | 22.40 | 10.41 | 20.32 | 6.76 | 33 | |
| Willemite | 8.53 | 4.51 | 6.24 | 3.94 | 5.81 | 2.06 | 36 | |
| Process | Kirschsteinite | 3.46 | 4.88 | 14.73 | 5.77 | 6.32 | 110 | |
| Wustite | 22.61 | 22.24 | 20.08 | 1.99 | 16.73 | 9.89 | 59 | |
| Metallic Pb | 6.97 | |||||||
| Glass | 5.08 | 5.19 | 6.24 | 6.03 | 5.64 | 0.59 | 10 | |
| Secondary | Gypsum | 3.98 | 8.64 | 9.76 | 3.24 | 6.41 | 3.27 | 51 |
| Ktenasite | 2.78 | 2.55 | 8.22 | 13.77 | 6.83 | 5.32 | 78 | |
| Namuvite | 16.54 | |||||||
| Tochilinite | 2.95 | 6.00 | 4.14 | 3.27 | 2.52 | 77 | ||
| Gerhardtite | 20.05 | 8.81 | 10.27 | 15.10 | 13.56 | 5.10 | 38 | |
| Goethite | 12.60 | |||||||
| Total | 100.00 | 100.00 | 100.00 | 100.00 | ||||
| Phase group | ||||||||
| Silicates | 8.53 | 7.97 | 11.12 | 18.67 | 11.57 | 4.93 | 43 | |
| Sulphates | 32.39 | 50.56 | 40.38 | 27.42 | 37.69 | 10.11 | 27 | |
| Nitrates | 20.05 | 8.81 | 10.27 | 15.10 | 13.56 | 5.10 | 38 | |
| Sulphides and hydrated sulphides | 11.34 | 5.23 | 11.91 | 11.22 | 9.93 | 3.14 | 32 | |
| Oxides and hydroxides | 22.61 | 22.24 | 20.08 | 14.59 | 19.88 | 3.70 | 19 | |
| Metals | 0.00 | 0.00 | 0.00 | 6.97 | 1.74 | 3.49 | 200 | |
| Glass | 5.08 | 5.19 | 6.24 | 6.03 | 5.64 | 0.59 | 10 | |
| Total | 100.00 | 100.00 | 100.00 | 100.00 | ||||
© 2020 by the author. Licensee MDPI, Basel, Switzerland. This article is an open access article distributed under the terms and conditions of the Creative Commons Attribution (CC BY) license (http://creativecommons.org/licenses/by/4.0/).
Share and Cite
Nowinska, K. Mineralogical and Chemical Characteristics of Slags from the Pyrometallurgical Extraction of Zinc and Lead. Minerals 2020, 10, 371. https://doi.org/10.3390/min10040371
Nowinska K. Mineralogical and Chemical Characteristics of Slags from the Pyrometallurgical Extraction of Zinc and Lead. Minerals. 2020; 10(4):371. https://doi.org/10.3390/min10040371
Chicago/Turabian StyleNowinska, Katarzyna. 2020. "Mineralogical and Chemical Characteristics of Slags from the Pyrometallurgical Extraction of Zinc and Lead" Minerals 10, no. 4: 371. https://doi.org/10.3390/min10040371
APA StyleNowinska, K. (2020). Mineralogical and Chemical Characteristics of Slags from the Pyrometallurgical Extraction of Zinc and Lead. Minerals, 10(4), 371. https://doi.org/10.3390/min10040371