Article

The Crystallinity of Apatite in Contact with Metamict Pyrochlore from the Silver Crater Mine, ON, Canada

1
Department of Geology and Environmental Science, Miami University, Oxford, OH 45056, USA
2
Department of Geological Sciences, University of Florida, Gainesville, FL 32611, USA
*
Author to whom correspondence should be addressed.
Minerals 2020, 10(3), 244; https://doi.org/10.3390/min10030244
Submission received: 24 January 2020 / Revised: 4 March 2020 / Accepted: 4 March 2020 / Published: 7 March 2020
(This article belongs to the Special Issue Minerals of the Southern Grenville Province)

Abstract

:
The purpose of this work is to evaluate the long-term effects of radiation on the structure of naturally occurring apatite in the hope of assessing its potential for use as a solid nuclear waste form for actinide sequestration over geologically relevant timescales. When a crystal is exposed to radioactivity from unstable constituent atoms undergoing decay, the crystal’s structure may become damaged. Crystalline materials rendered partially or wholly amorphous in this way are deemed “partially metamict” or “metamict” respectively. Intimate proximity of a non-radioactive mineral to a radioactive one may also cause damage in the former, evident, for example, in pleochroic haloes surrounding zircon inclusions in micas. Radiation damage may be repaired through the process of annealing. Experimental evidence suggests that apatite may anneal during alpha particle bombardment (termed “self-annealing”), which, combined with a low solubility in aqueous fluids and propensity to incorporate actinide elements, makes this mineral a promising phase for nuclear waste storage. Apatite evaluated in this study occurs in a Grenville-aged crustal carbonatite at the Silver Crater Mine in direct contact with U-bearing pyrochlore (var. betafite)—a highly radioactive mineral. Stable isotope analyses of calcite from the carbonatite yield δ18O and δ13C consistent with other similar deposits in the Grenville Province. Although apatite and betafite imaged using cathodoluminescence (CL) show textures indicative of fracture-controlled alteration, Pb isotope analyses of betafite from the Silver Crater Mine reported in previous work are consistent with a model of long term Pb loss from diffusion, suggesting the alteration was not recent. Thus, it is interpreted that these minerals remained juxtaposed with no further metamorphic overprint for ≈1.0 Ga, and therefore provide an ideal opportunity to study the effects of natural, actinide-sourced radiation on the apatite structure over long timescales. Through broad and focused X-ray beam analyses and electron backscatter diffraction (EBSD) mapping, the pyrochlore is shown to be completely metamict—exhibiting no discernible diffraction associated with crystallinity. Meanwhile, apatite evaluated with these methods is confirmed to be highly crystalline with no detectable radiation damage. However, the depth of α-decay damage is not well-understood, with reported depths ranging from tens of microns to just a few nanometers. EBSD, a surface sensitive technique, was therefore used to evaluate the crystallinity of apatite surfaces which had been in direct contact with radioactive pyrochlore, and the entire volume of small apatite crystals whose cores may have received significant radiation doses. The EBSD results demonstrate that apatite remains crystalline, as derived from sharp and correctly-indexed Kikuchi patterns, even on surfaces in direct contact with a highly radioactive source for prolonged periods in natural systems.

1. Introduction

1.1. Apatite as a Nuclear Waste Storage Solution

Apatite group minerals have long been proposed as potential solid nuclear waste forms [1,2,3,4]. Their characteristics of incorporating various types of radioactive waste, having low solubility, and having the apparent ability to self-anneal, make them a promising solution for stable nuclear waste sequestration [1,3,5]. Contaminants can be at their lowest environmental availability when incorporated into a suitable crystalline solid [3]. However, given sufficient time, a material’s crystal structure may become compromised through the radioactive decay of incorporated unstable isotopes—a process known as metamictization [6,7,8]. Crystalline materials partially or wholly amorphized in this way are termed “partially metamict” or “metamict” respectively. Altering the crystallinity of a solid can result in weakened bonding through the introduction of defects, as well as changes to physical properties, such as solubility and volume (density) [3,6,7,8,9]. Volumetric changes may lead to fracturing, physically weakening the material and potentially hastening dissolution by exposing a higher surface area to fluids [3,9]. Thus, understanding how the apatite structure reacts to radioactive decay over geological timescales is critical to assessing its capabilities as a potential long-term nuclear waste repository. Previous studies suggest that apatite is not as susceptible to metamictization as many other actinide-accommodating minerals, and that the energy imparted by alpha particle bombardment is sufficient to induce annealing in apatite [3,4,10].

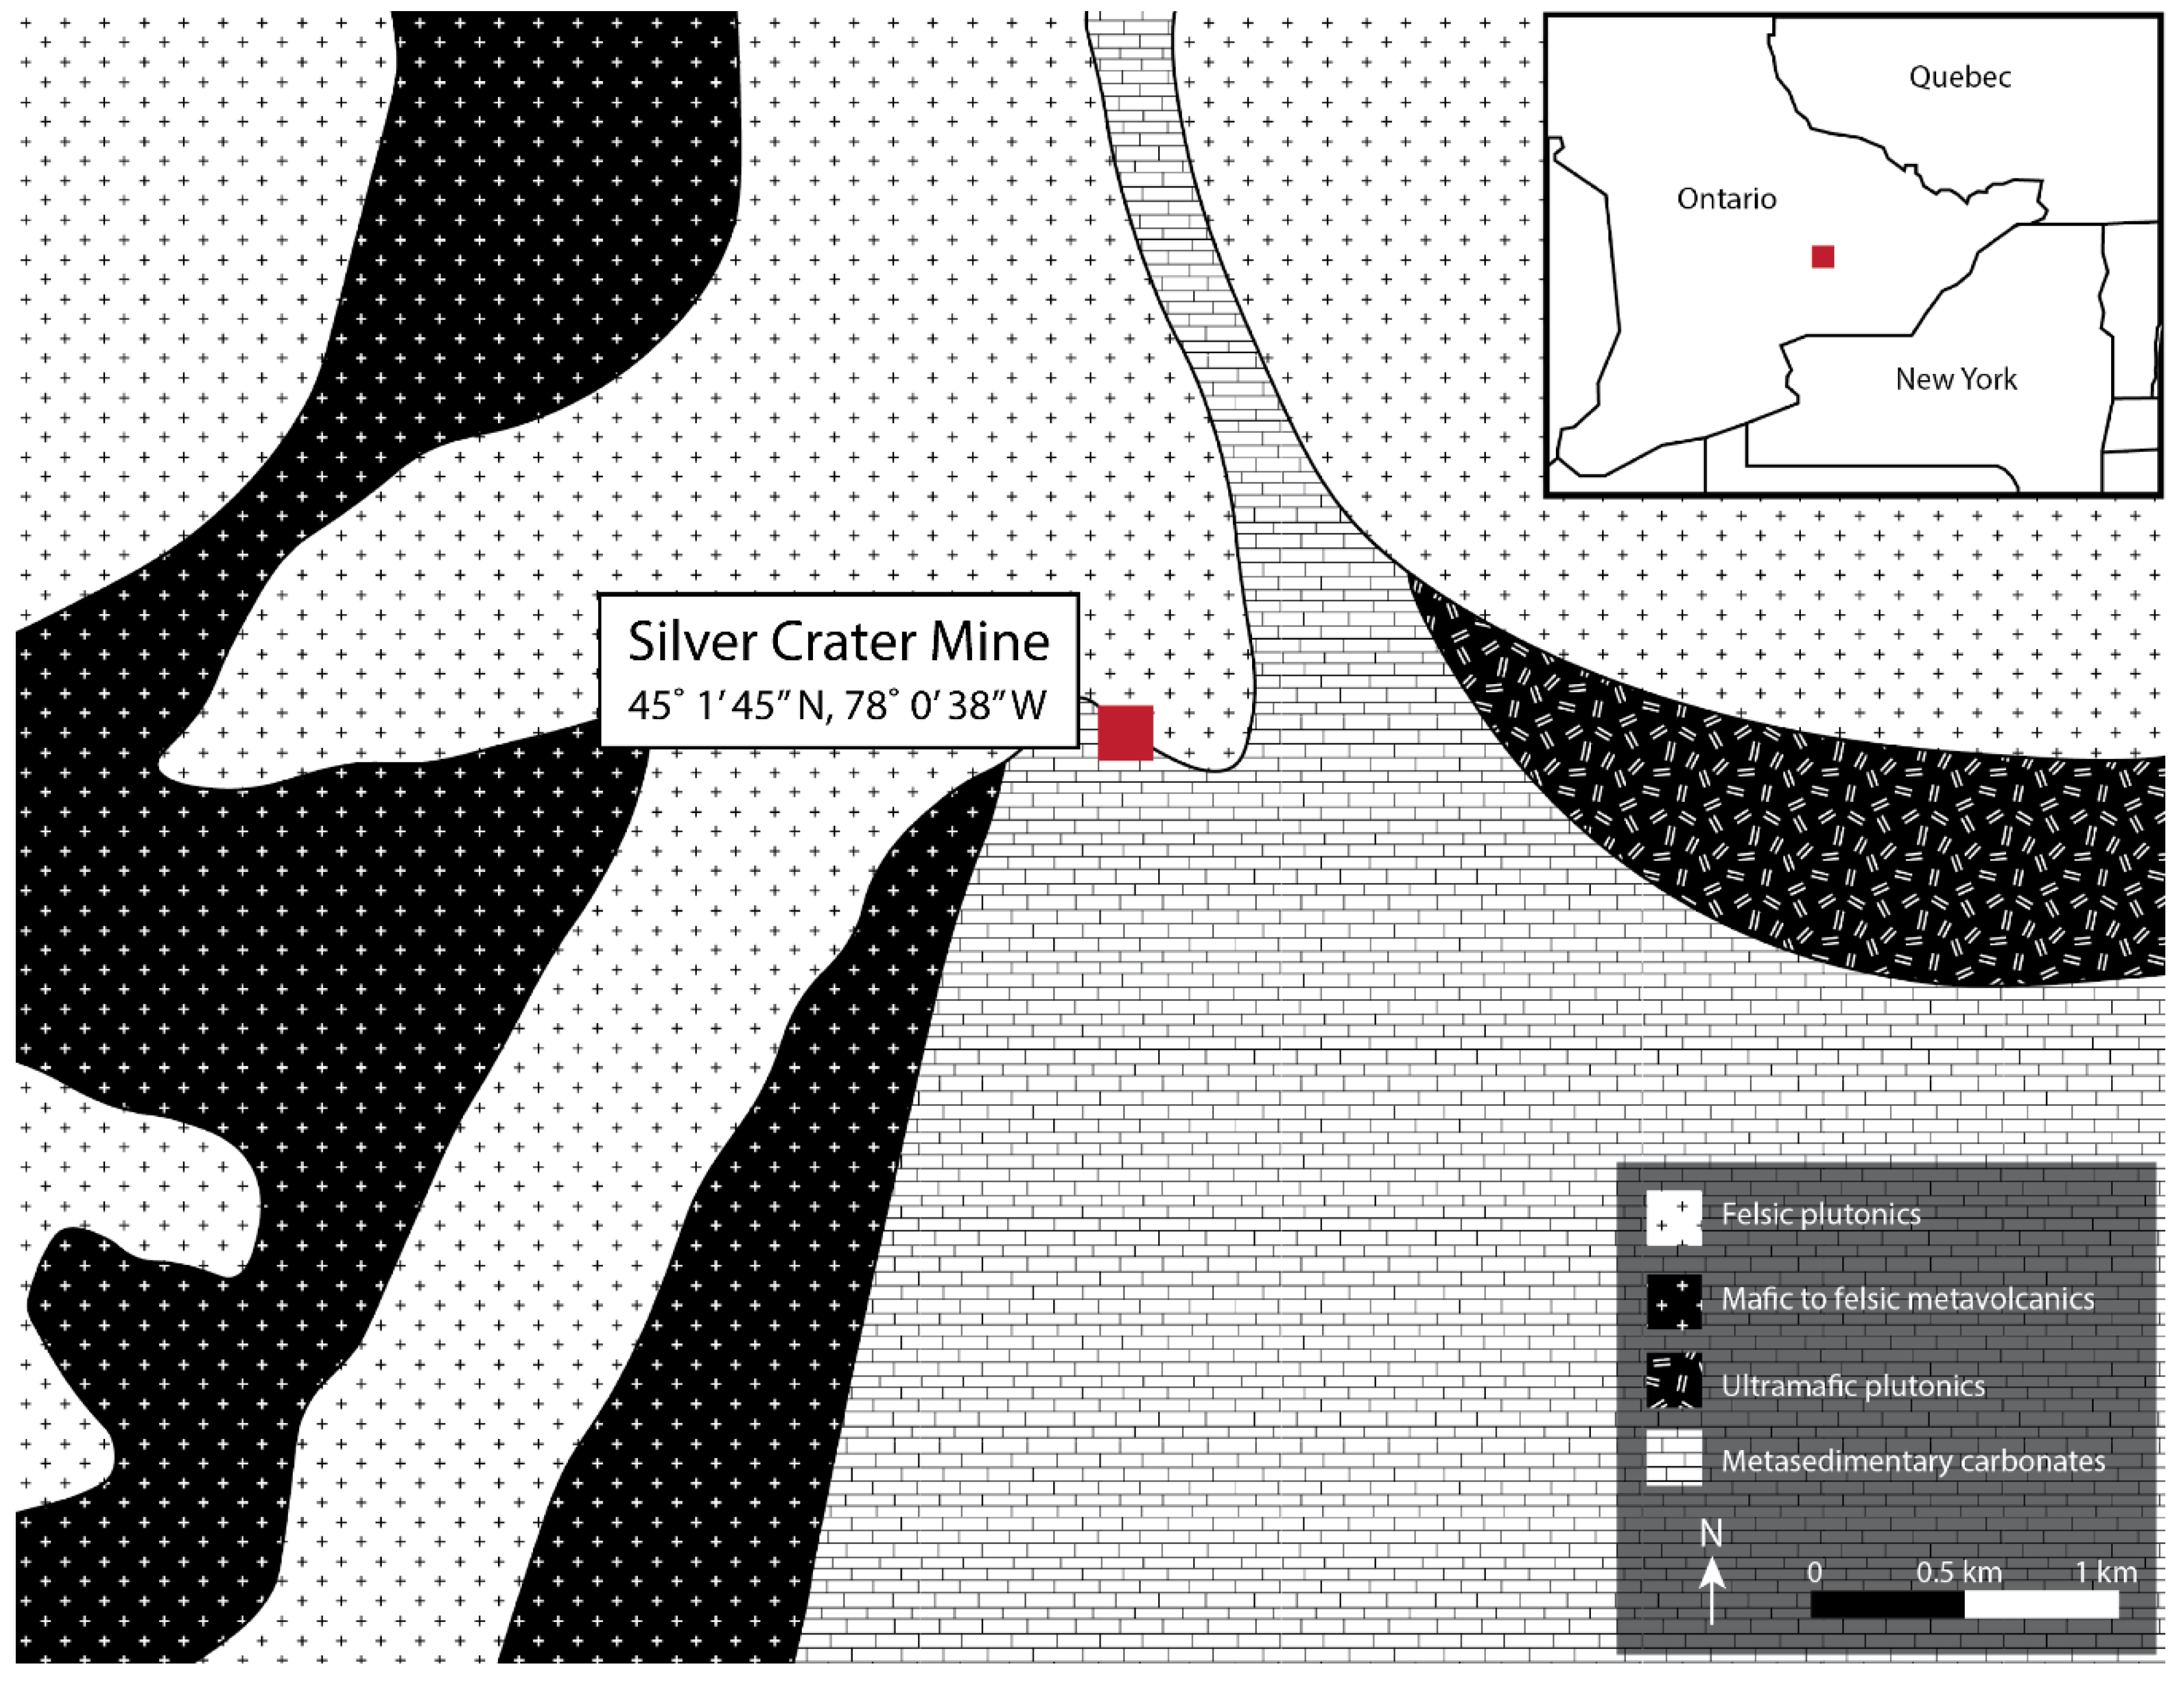
1.2. Geology of the Silver Crater Mine

The Silver Crater Mine is located in southern Ontario, Canada in the Grenville geologic province (Figure 1). This region was extensively deformed during the Grenville orogenic cycle and is associated with the assembly of the supercontinent of Rodinia [11,12]. Intrusive complexes associated with this orogenic cycle comprise anorthosites, granitic pegmatites, syenites, carbonatites, and others whose ages cluster in a bimodal distribution associated with the Shawinigan and Ottawan pulses of the Grenville orogenic cycle at c. 1165 Ma and c. 1050 Ma respectively [12,13]. The Grenville-aged basement rock exposed in southeastern Ontario has a rich mineralogy hosted in a miscellany of deposits including granitic pegmatites, skarns, and carbonatites [12,13,14]. There is a long history of mining and exploration in this region with most activity having occurred during the late 19th and early 20th centuries in the pursuit of mica, phosphate, and feldspar [14,15]. More famous perhaps than any commercially exploitable resource are the wonderful mineral specimens which have been streaming steadily and inexhaustibly from this region for well over one hundred years [15]. World class crystals of apatite, titanite, mica, and zircon (among others) have made their way into museum collections worldwide [12,15,16]. Despite the abundance of specimens, very little modern work has been done on many of the historic localities in this region [12].
The Silver Crater Mine accesses a carbonatite exhibiting high bulk U, Ti, and Nb [17]. Calcite forms the majority of the carbonatite core, which hosts exceptionally idiomorphic fluorapatite, phlogopite, zircon, and pyrochlore [17]. The margins of the carbonatite dike host coarsely crystallized phlogopite, amphibole, and fluorapatite to tens of centimeters or more [17,18]. The carbonatite dike is emplaced into a biotite amphibolite locally associated with nepheline syenite and syenite gneiss [19]. The mineralization style of the deposit closely resembles other carbonatite dikes in the area, known colloquially as “vein dikes” [12,16]. Vein dikes, as per current understanding, are narrow intrusive bodies of (silico)carbonatite which have been emplaced into silicate rocks, resulting in partial digestion and remobilization of the host rock constituents and the formation of large euhedral silicate minerals along the margins of the dike [20,21,22]. Although the mineralogy varies, even within individual swarms (and quite closely resembles many skarn lithologies), the mineralization style is distinct. The cores of vein dikes are made up primarily of calcite, often with abundant apatite, whereas the margins are predominately coarsely crystallized silicate minerals whose mineralogy is influenced by host rock composition [16,21]. Geochronology and isotopic studies suggest that these deposits form during the collapse of large orogens from the partial melting of crustal carbonate rocks and during pulses of A-type granitic magmatism [12,20,21,22]. The undeformed nature of the deposit, alongside known ages of petrologically similar deposits in New York and Quebec, suggests that the Silver Crater carbonatite is of either Shawinigan (c. 1150 Ma) or Ottawan (c. 1050 Ma) age [12,22].
Recent research assigns a crustal origin to vein dike deposits in general [12,20,22]. However, the U, Ti, and Nb enrichment of the Silver Crater deposit is evocative of mantle-derived carbonatites and delineates this deposit from other nearby vein dikes [16,21,22]. Although the mineralogy of the silicate phases appears to be derived from the composition of the host rock, textural and spatial associations reported in previous works suggest major non-silicate phases (calcite, fluorite, apatite, and betafite) have formed primarily from components inherent in the carbonatite melt rather than being sourced from host rock assimilation [17]. The property was explored for mica in the early 20th century, and uranium in the mid-20th century, but never developed to exhaustion [17,23]. The property has since been primarily worked for mineral specimens by collectors (Figure 2).
The U, Ti, and Nb at the Silver Crater Mine are almost exclusively sequestered in sharp, but metamict pseudomorphs after an as of yet unidentified pyrochlore supergroup mineral referred to in the literature as “betafite” (of Hogarth 1977) and referred to henceforth simply as “betafite” [25]. Betafite occurs primarily in the calcite matrix, forming the core of the carbonatite (Figure 3). Literature notes that betafite from the Silver Crater Mine is highly radioactive, and contains on average ≈22 wt% U3O8 [23]. The size and morphological perfection of these specimens has rendered them popular among mineral collectors worldwide. The structure of pyrochlore supergroup minerals is putatively isometric with 4 m 3 ¯ 2 m symmetry [23]. The dominant forms present in betafite from the Silver Crater Mine are the cube {100} and octahedron {111} [17,23]. Despite their sharp cuboctahedral habit, previous studies note that samples of betafite from the Silver Crater Mine are X-ray amorphous—lacking any detectable degree of crystallinity [23]. Occasionally, apatite crystals are intergrown with betafite (Figure 4 and Figure 5). Both inclusions of apatite within betafite and betafite inclusions within apatite occur, suggesting concurrent growth. Hogarth notes that apatite and betafite are spatially associated at the Silver Crater Mine [23]. The high natural radioactivity combined with the age of the deposit provides an ideal natural setting for understanding the long-term effects of actinide decay on the apatite structure.

2. Analytical Methods

2.1. X-ray Diffraction

Broad beam X-ray diffraction experiments were performed on a Scintag PadX X-ray diffractometer (Scintag, Los Angeles, CA, USA) using Cu Kα radiation at Miami University. X-ray scans were completed in a range of 10–50° 2θ at 35 mA and 40 KV. Samples prepared for broad X-ray beam analysis were cut into flat disks to counter topography-sourced sample error. Scans were analyzed using the ICDD PDF-2 reference database in Bruker DIFFRAC.EVA software (Version 4.2.2.3, Bruker, Billerica, MA, USA). Focused beam X-ray diffraction (single crystal X-ray diffraction, SCXRD) experiments were performed using a Bruker D8 Quest SCXRD (Bruker, Billerica, MA, USA) using Mo Kα radiation at Miami University in Oxford, Ohio. Small (100 μm) fragments of apatite and betafite were individually mounted on a Kapton loop for analysis. Full structure refinements of apatite including anion column occupancy were accomplished using Bruker APEX 3 software (Version 2018.1-0, Bruker, Billerica, MA, USA). Apatite column anion composition was modeled using additional free variables corresponding to site occupancy at each respective anion position.

2.2. Electron Microscopy

Scanning electron microscopy (SEM), energy-dispersive X-ray spectroscopy (XEDS), and electron backscatter diffraction (EBSD) experiments were performed using a Zeiss Supra-35VP field emission SEM (Zeiss, Oberkochen, Germany) at the Center for Advanced Microscopy and Imaging at Miami University. Sample slices originally prepared for broad X-ray beam diffraction analysis, which also preserved the apatite-betafite grain boundary, were polished and then coated with a thin (<10 nm) layer of carbon to alleviate charging. Crystals of apatite selected for surface analysis using EBSD were separated from betafite and left uncoated to increase contrast in the Kikuchi pattern. The surfaces directly in contact with betafite were marked for later reference. Surfaces analyzed using EBSD were oriented at 20° relative to the incident electron beam and analyzed using a 0.8° scan rotation, accelerating voltage of 10.0 KeV, and a 120 µm aperture. Patterns were collected using an HKL/NORDLYS EBSD detector (Oxford Instruments, Abingdon, UK) and indexed using Flamenco software (Version 5.0.9.1 number, Oxford Instruments, Abingdon, UK). EBSD maps were processed using Tango software (Version 5.0.9, Oxford Instruments, Abingdon, UK) to remove erroneous, high MAD data points using the wild spike noise reduction method, and to consolidate symmetrically equivalent solutions. Qualitative XEDS scans were collected on apatite and betafite to corroborate EBSD solutions using a Bruker Esprit 2.0 XEDS system (Bruker, Billerica, MA, USA). Imaging of samples was accomplished in variable pressure scanning electron (VPSE) and backscatter electron (BSE) imaging modes using Zeiss SmartSEM software (Version 6.0, Zeiss, Oberkochen, Germany). Imaging was done in variable pressure mode at a chamber pressure of 25 Pa to alleviate charging artifacts in analyses of nonconductive samples. Monochromatic cathodoluminescence (CL) imaging of polished and coated samples was accomplished by using the VPSE detector of the Zeiss Supra-35VP (Zeiss, Oberkochen, Germany), which is capable of detecting photons [26]. Samples were imaged at high vacuum, removing interference from electron collisions with gas in the chamber, thereby permitting monochromatic CL imaging.

2.3. Mass Spectrometry

Laser ablation inductively coupled plasma mass spectrometry (LA-ICP-MS) analyses of apatite were accomplished using a Thermo-iCAP Q quadrupole mass spectrometer (Thermo Scientific, Bremen, Germany) coupled with a New Wave/ESI 193 nm laser ablation system (Elemental Scientific Lasers, Huntingdon, UK) at the University of Arkansas Trace Element and Radiogenic Isotope Laboratory (TRAIL). Laser ablation analyses utilized a 50 µm laser spot diameter, 10 Hz repetition rate over 20 s, laser fluence of ≈4.3 J/cm2, and the application of a He carrier gas flow rate of 0.800 L/min. Instrumental settings were adjusted to maintain UO and ThO < 1.0%. The standard NIST 612 was used for calibration [27] with 43Ca as the internal standard in all analyses. Standards NIST 610 and NIST 612 were cycled prior to and at the end of each analytical session, and were bracketed once more after each set of ten analyses during the analytical run. Masses investigated for apatite included: 139La, 140Ce, 141Pr, 146Nd, 147Sm, 153Eu, 157Gd, 159Tb, 163Dy, 165Ho, 166Er, 169Tm, 172Yb, 175Lu, 232Th, and 238U. Data reduction was carried out using the Iolite v3.713.63 software package (Iolite, Melbourne, Australia) [28] and the X_trace_element_IS data reduction scheme.

2.4. Stable Isotope Analysis

Isotopic measurements were conducted in the Light Stable Isotope Mass Spectrometry Laboratory at the University of Florida using a Kiel III carbonate preparation device (Thermo Scientific, Bremen, Germany) coupled with a Finnigan-Mat 252 isotope ratio mass spectrometer (Thermo Scientific, Bremen, Germany). Each batch of samples was bracketed with eight NBS-19 and two NBS-18 standards. Standard and sample masses ranged from 30 to 50 µg. Six calcite separates from the Silver Crater carbonatite were run alongside separate ones from three other vein dike occurrences (Bear Lake, Schickler occurrence, Kelly Farm occurrence). Standards and samples were loaded in individual glass Kiel vials and placed in a carousel which was inserted in the Kiel oven. The phosphoric acid used was produced by boiling 99% crystalline phosphoric acid under vacuum until a specific gravity of 1.92 (at 25 °C) was achieved. Reaction temperature was 70 °C and reaction time was 10 min. Results for δ18O and δ13C were calculated with reference to the standards VSMOW (Vienna standard mean ocean water) and VPDB (Vienna Pee Dee belemnite), respectively.

3. Results

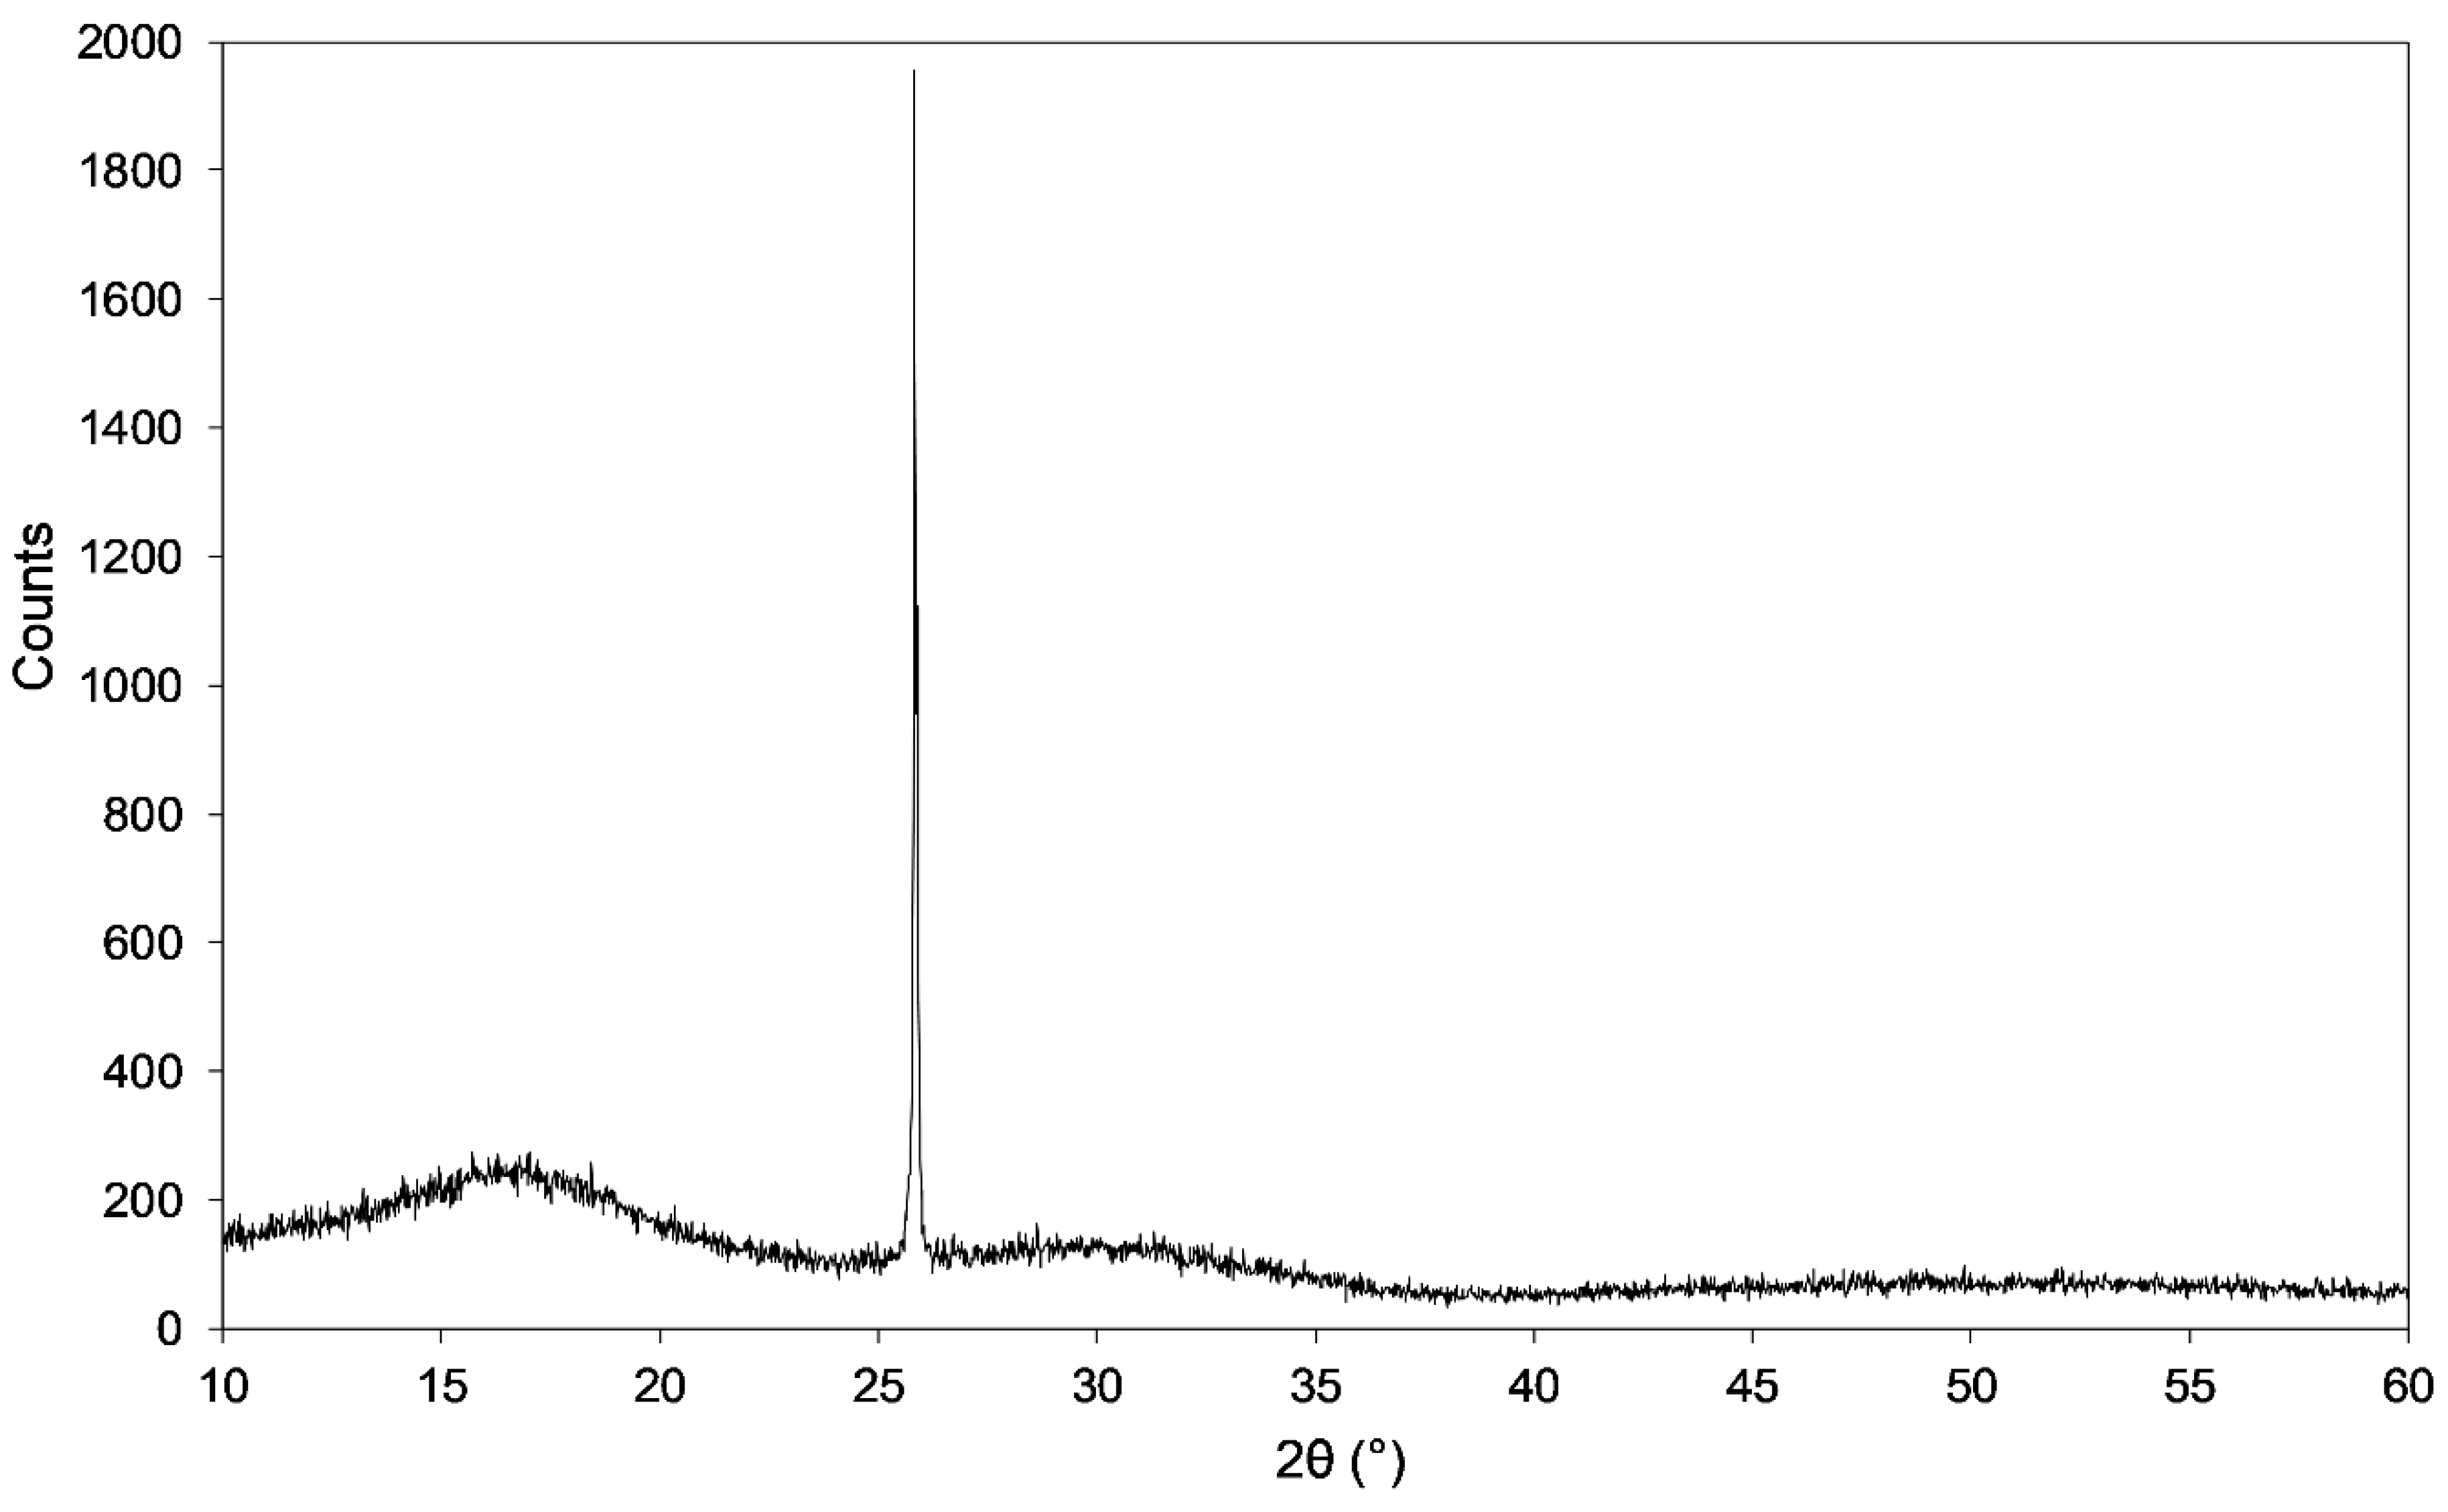
3.1. Broad X-ray Beam Analyses

Five slices from a sample of intergrown euhedral apatite and betafite were prepared and analyzed using broad X-ray beam analysis. The resulting diffraction data (Figure 6) show a long, broad hump and a sharp peak at ≈25.8° 2θ. The broad hump is attributable to incoherent X-ray scattering in the amorphous (metamict) betafite, whereas the discrete peak is consistent with apatite. No other minor phases were detected using this method.

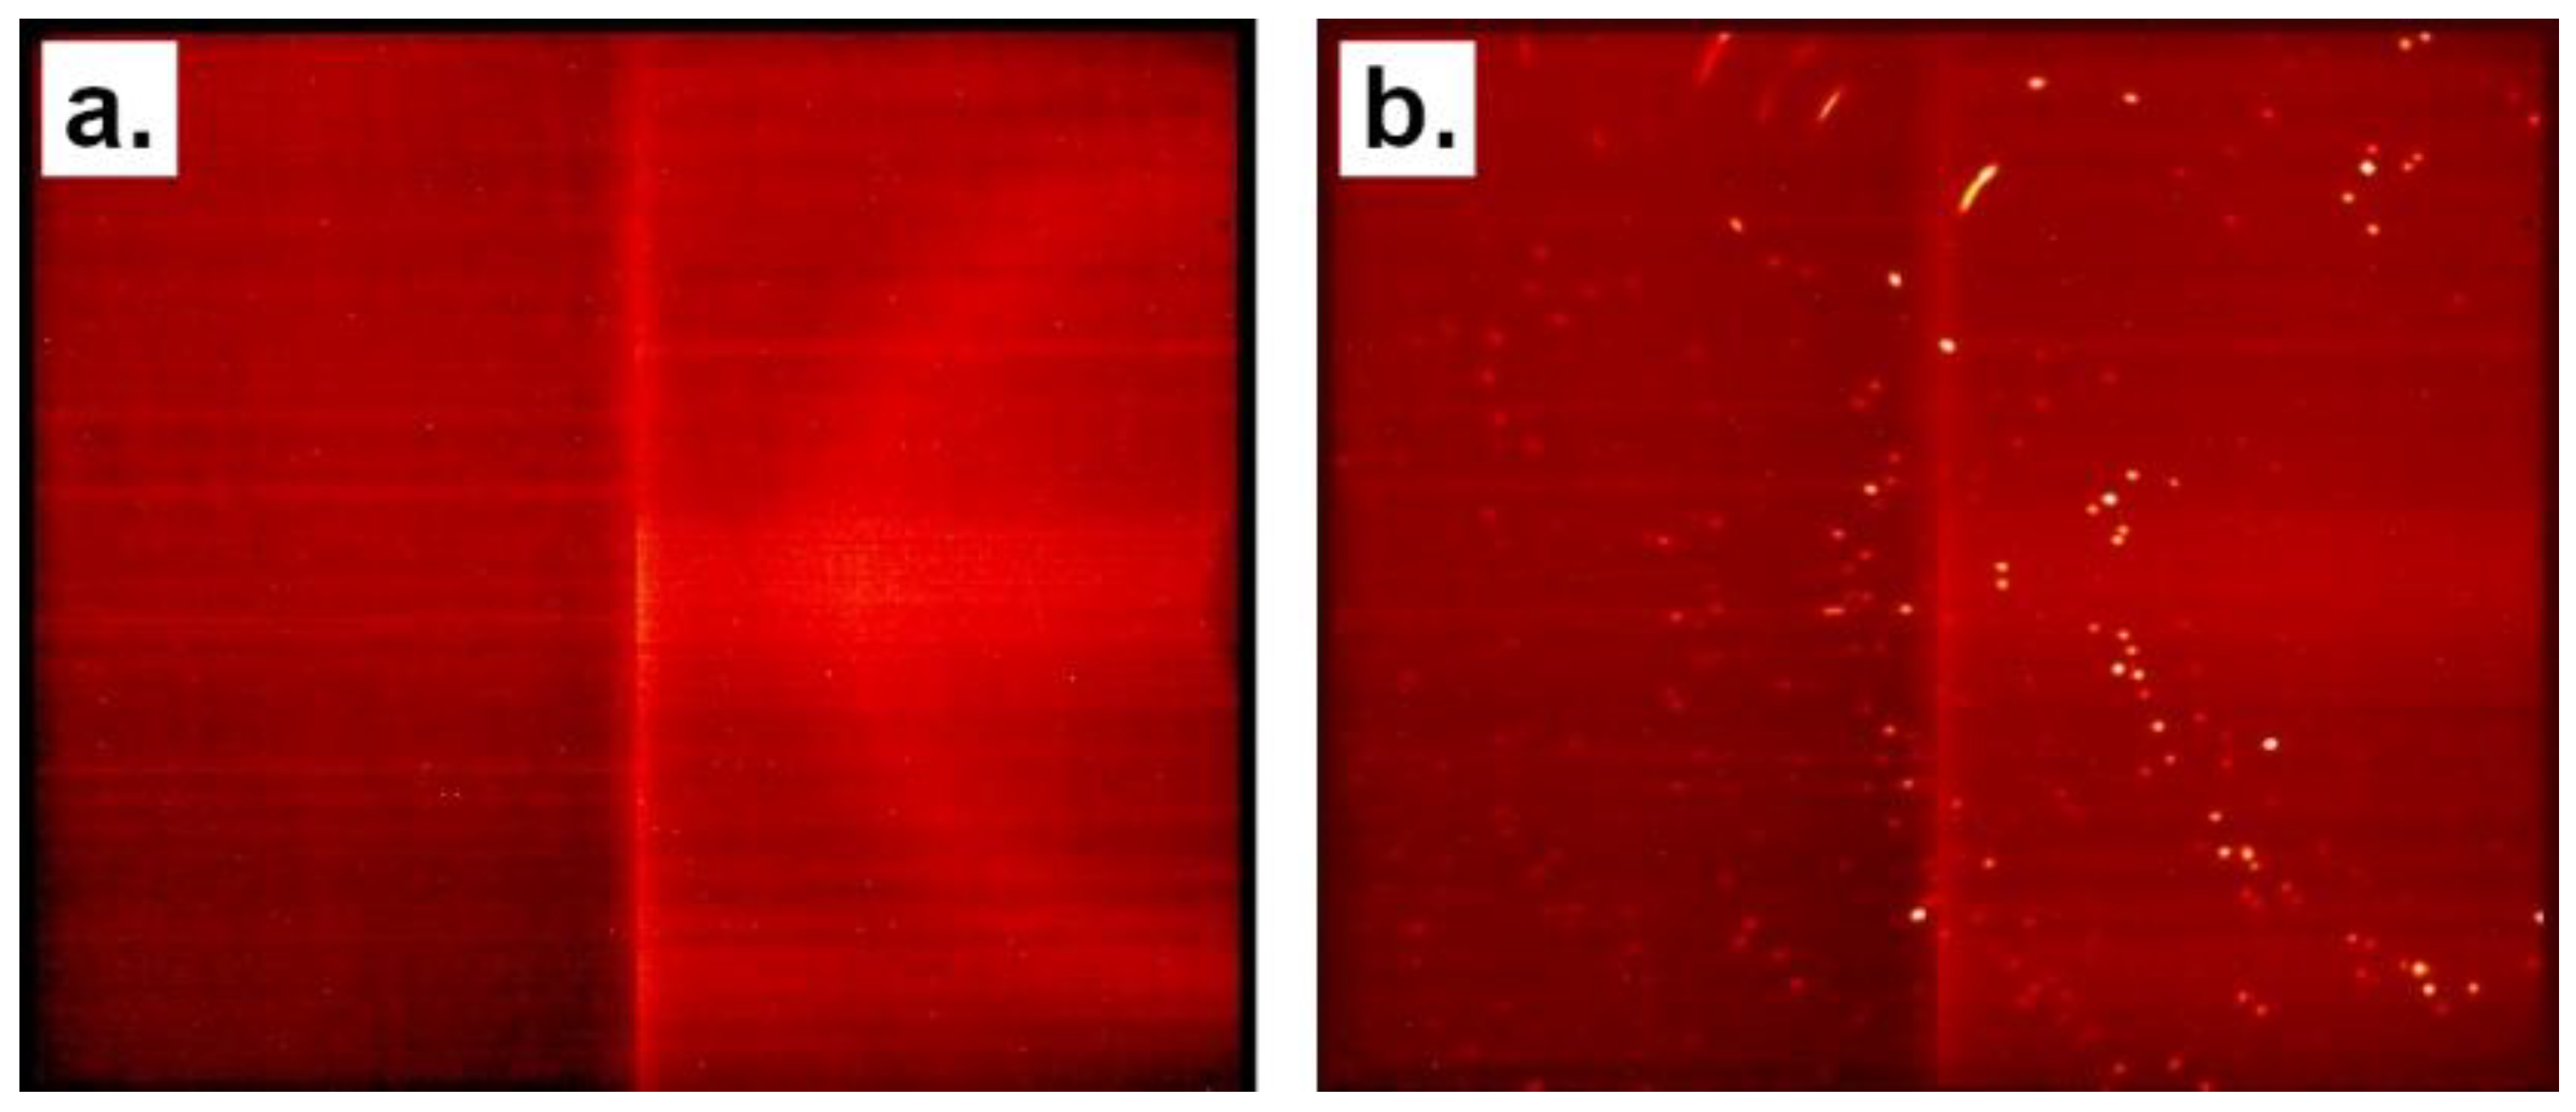
3.2. Focused X-ray Beam Analyses

Both betafite and apatite were analyzed using focused beam X-ray diffraction. Analyses of betafite yielded no discrete diffraction spots (Figure 7a), and therefore, structural refinement was not possible for this sample. Analyses of apatite yielded patterns consistent with a monocrystalline sample (Figure 7b). Full structure refinements carried out on three apatite diffraction datasets attained R values of 2.07%, 1.34%, and 1.33%, respectively. Anion column modeling suggests that apatite from the Silver Crater Mine is OH-rich fluorapatite with an approximate composition of Ca5(PO4)3(F0.6OH0.4). No known Cl position could be stably modeled. However, this does not preclude the presence of trace Cl in the sample.

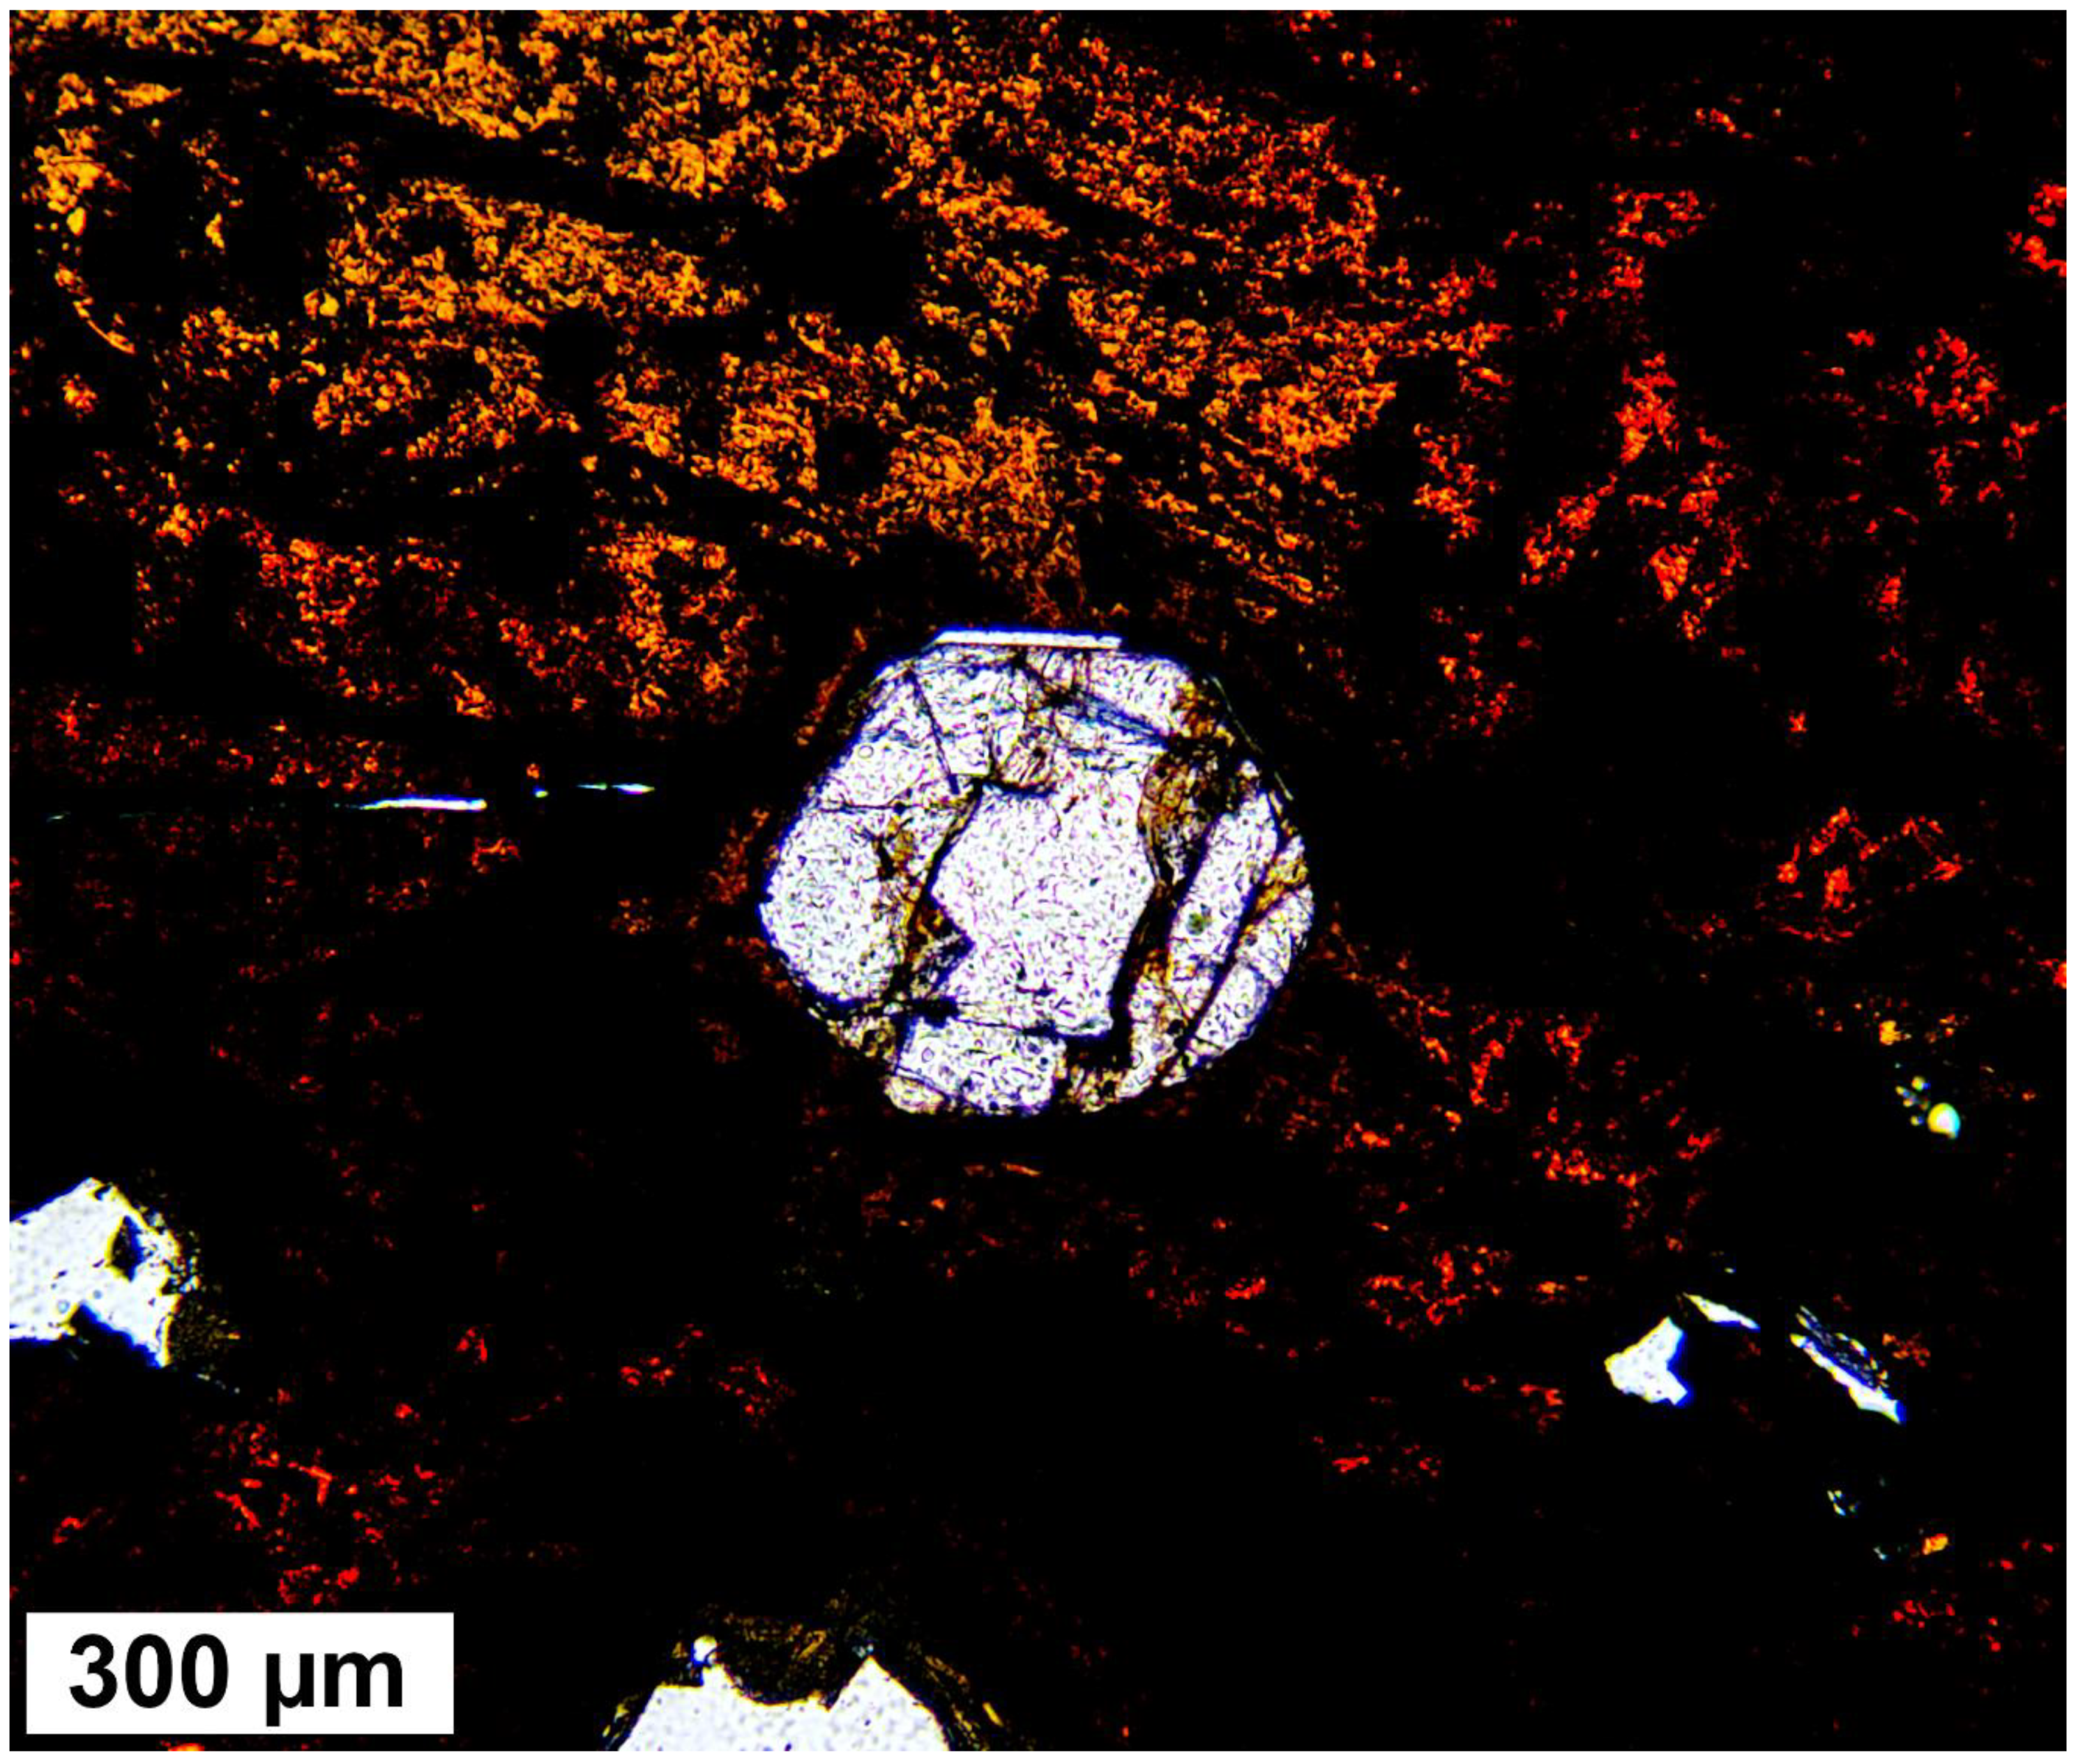
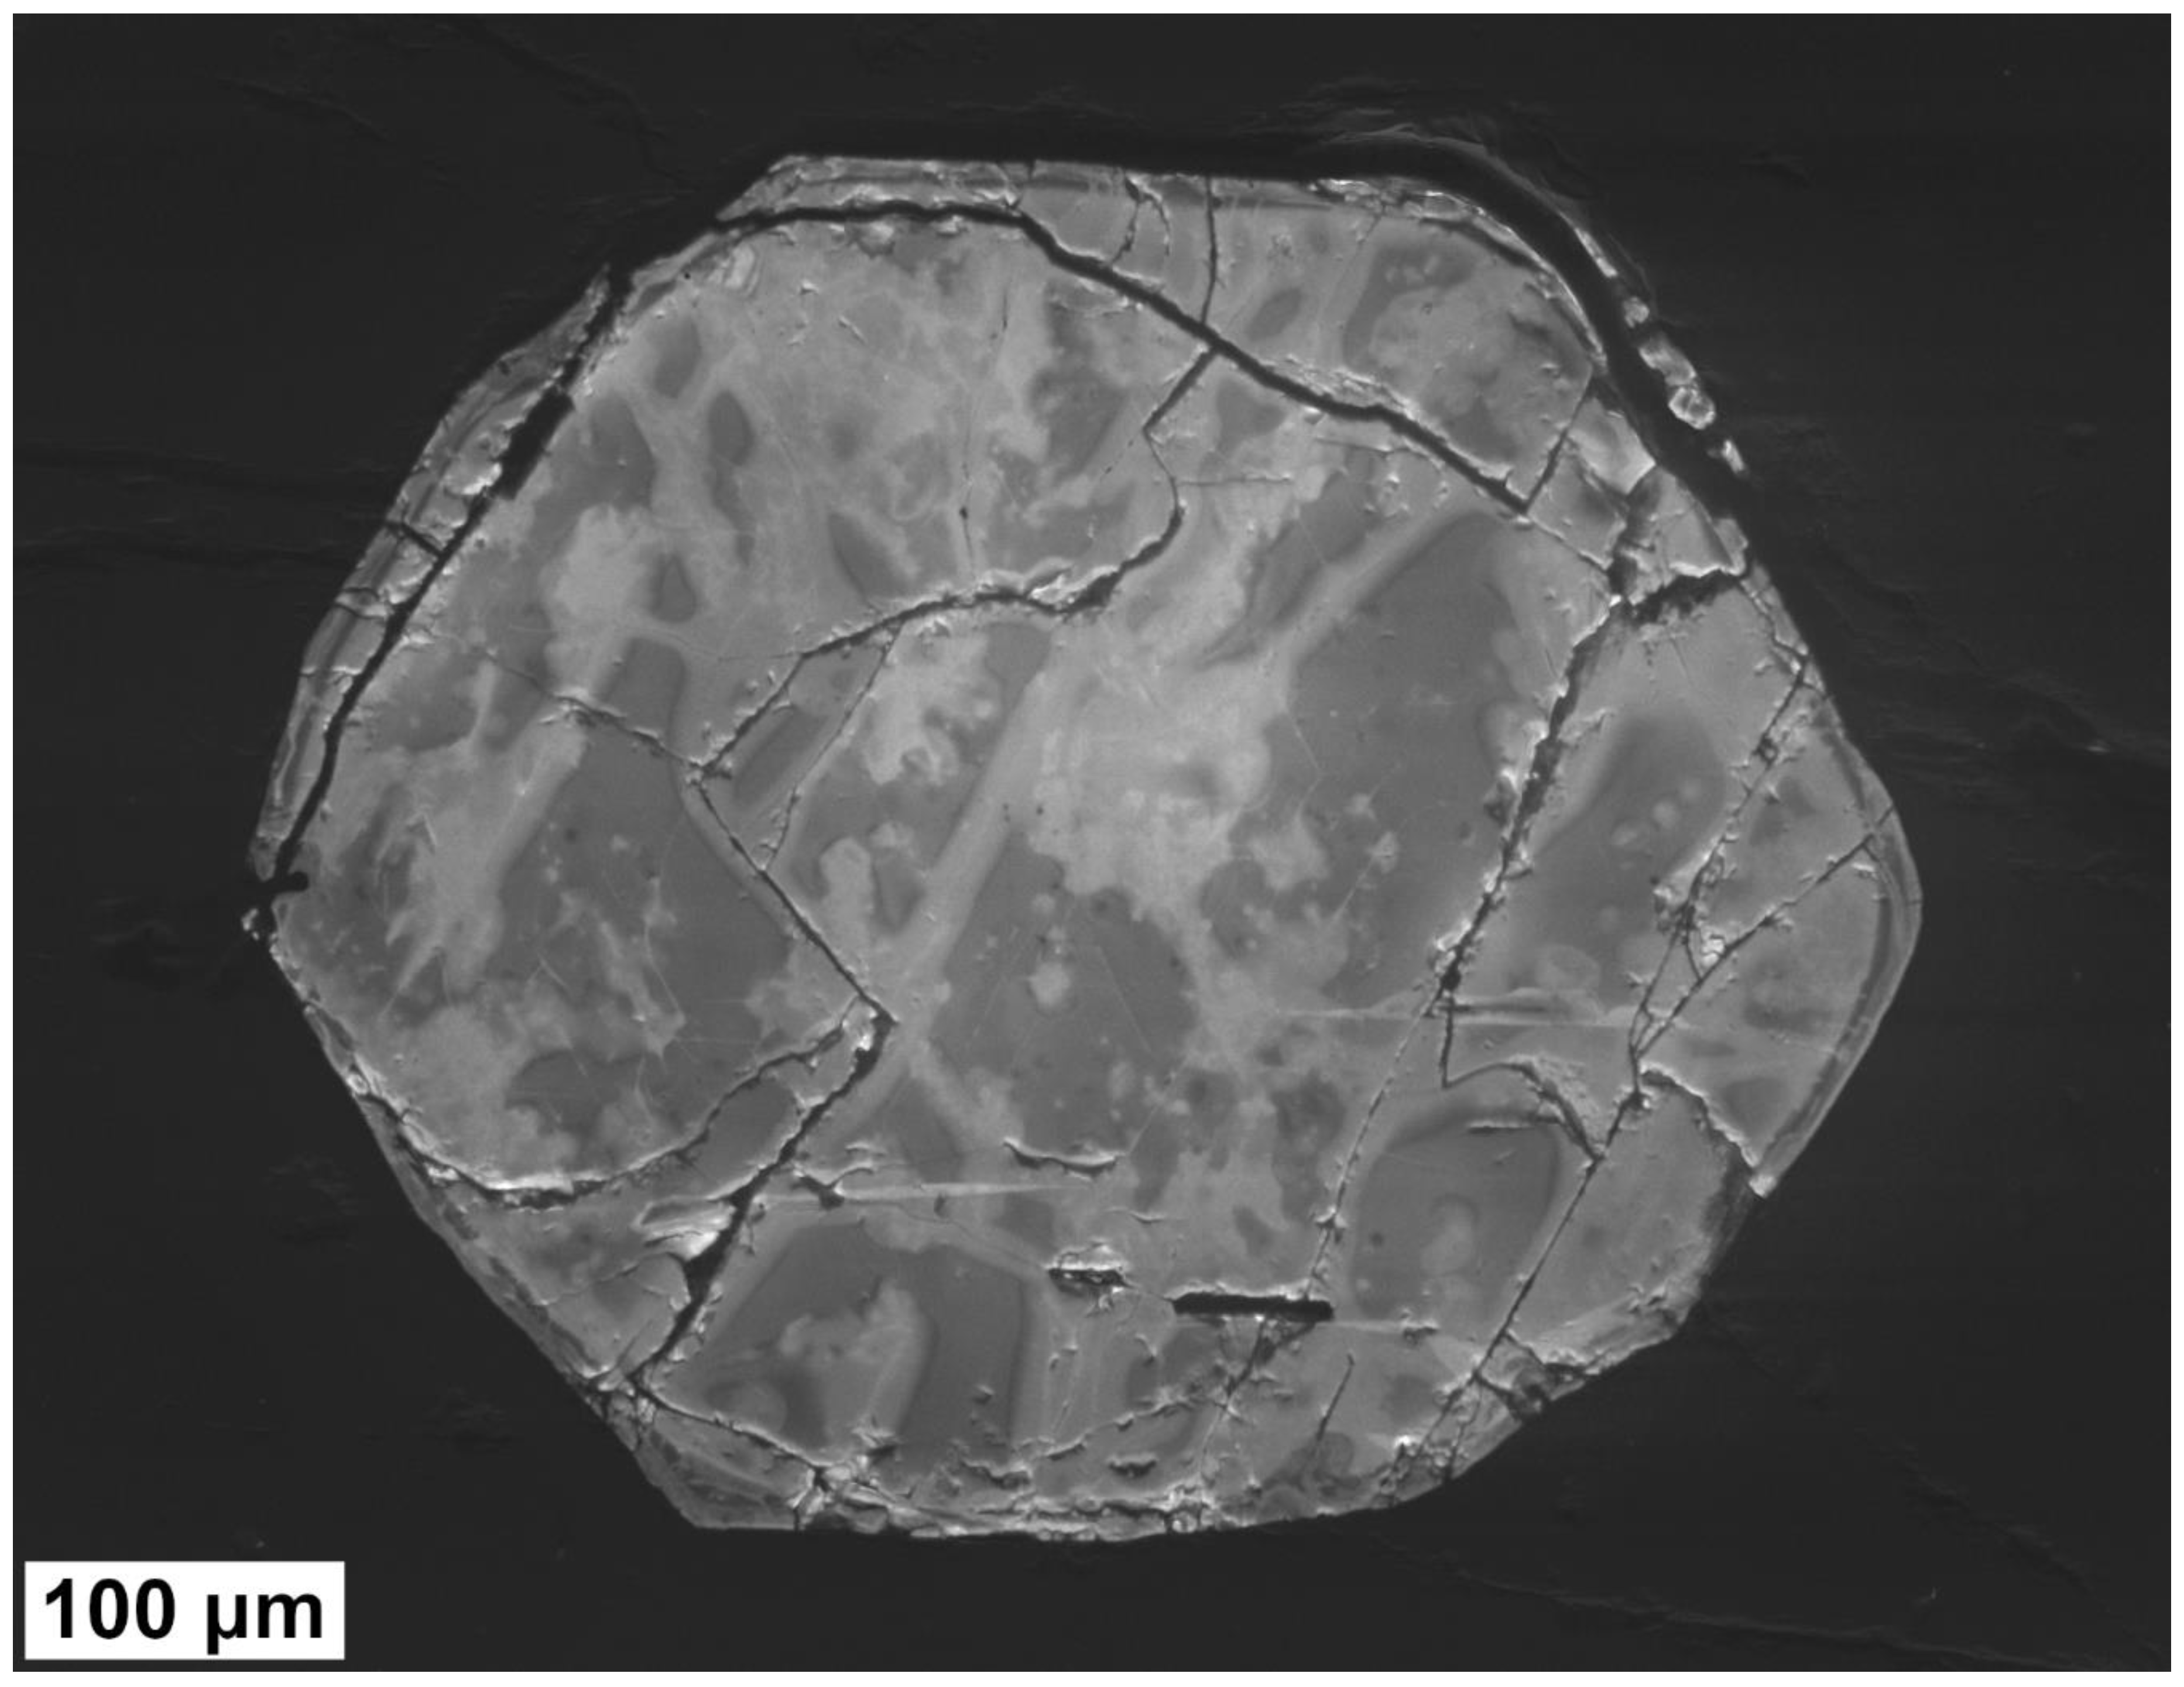
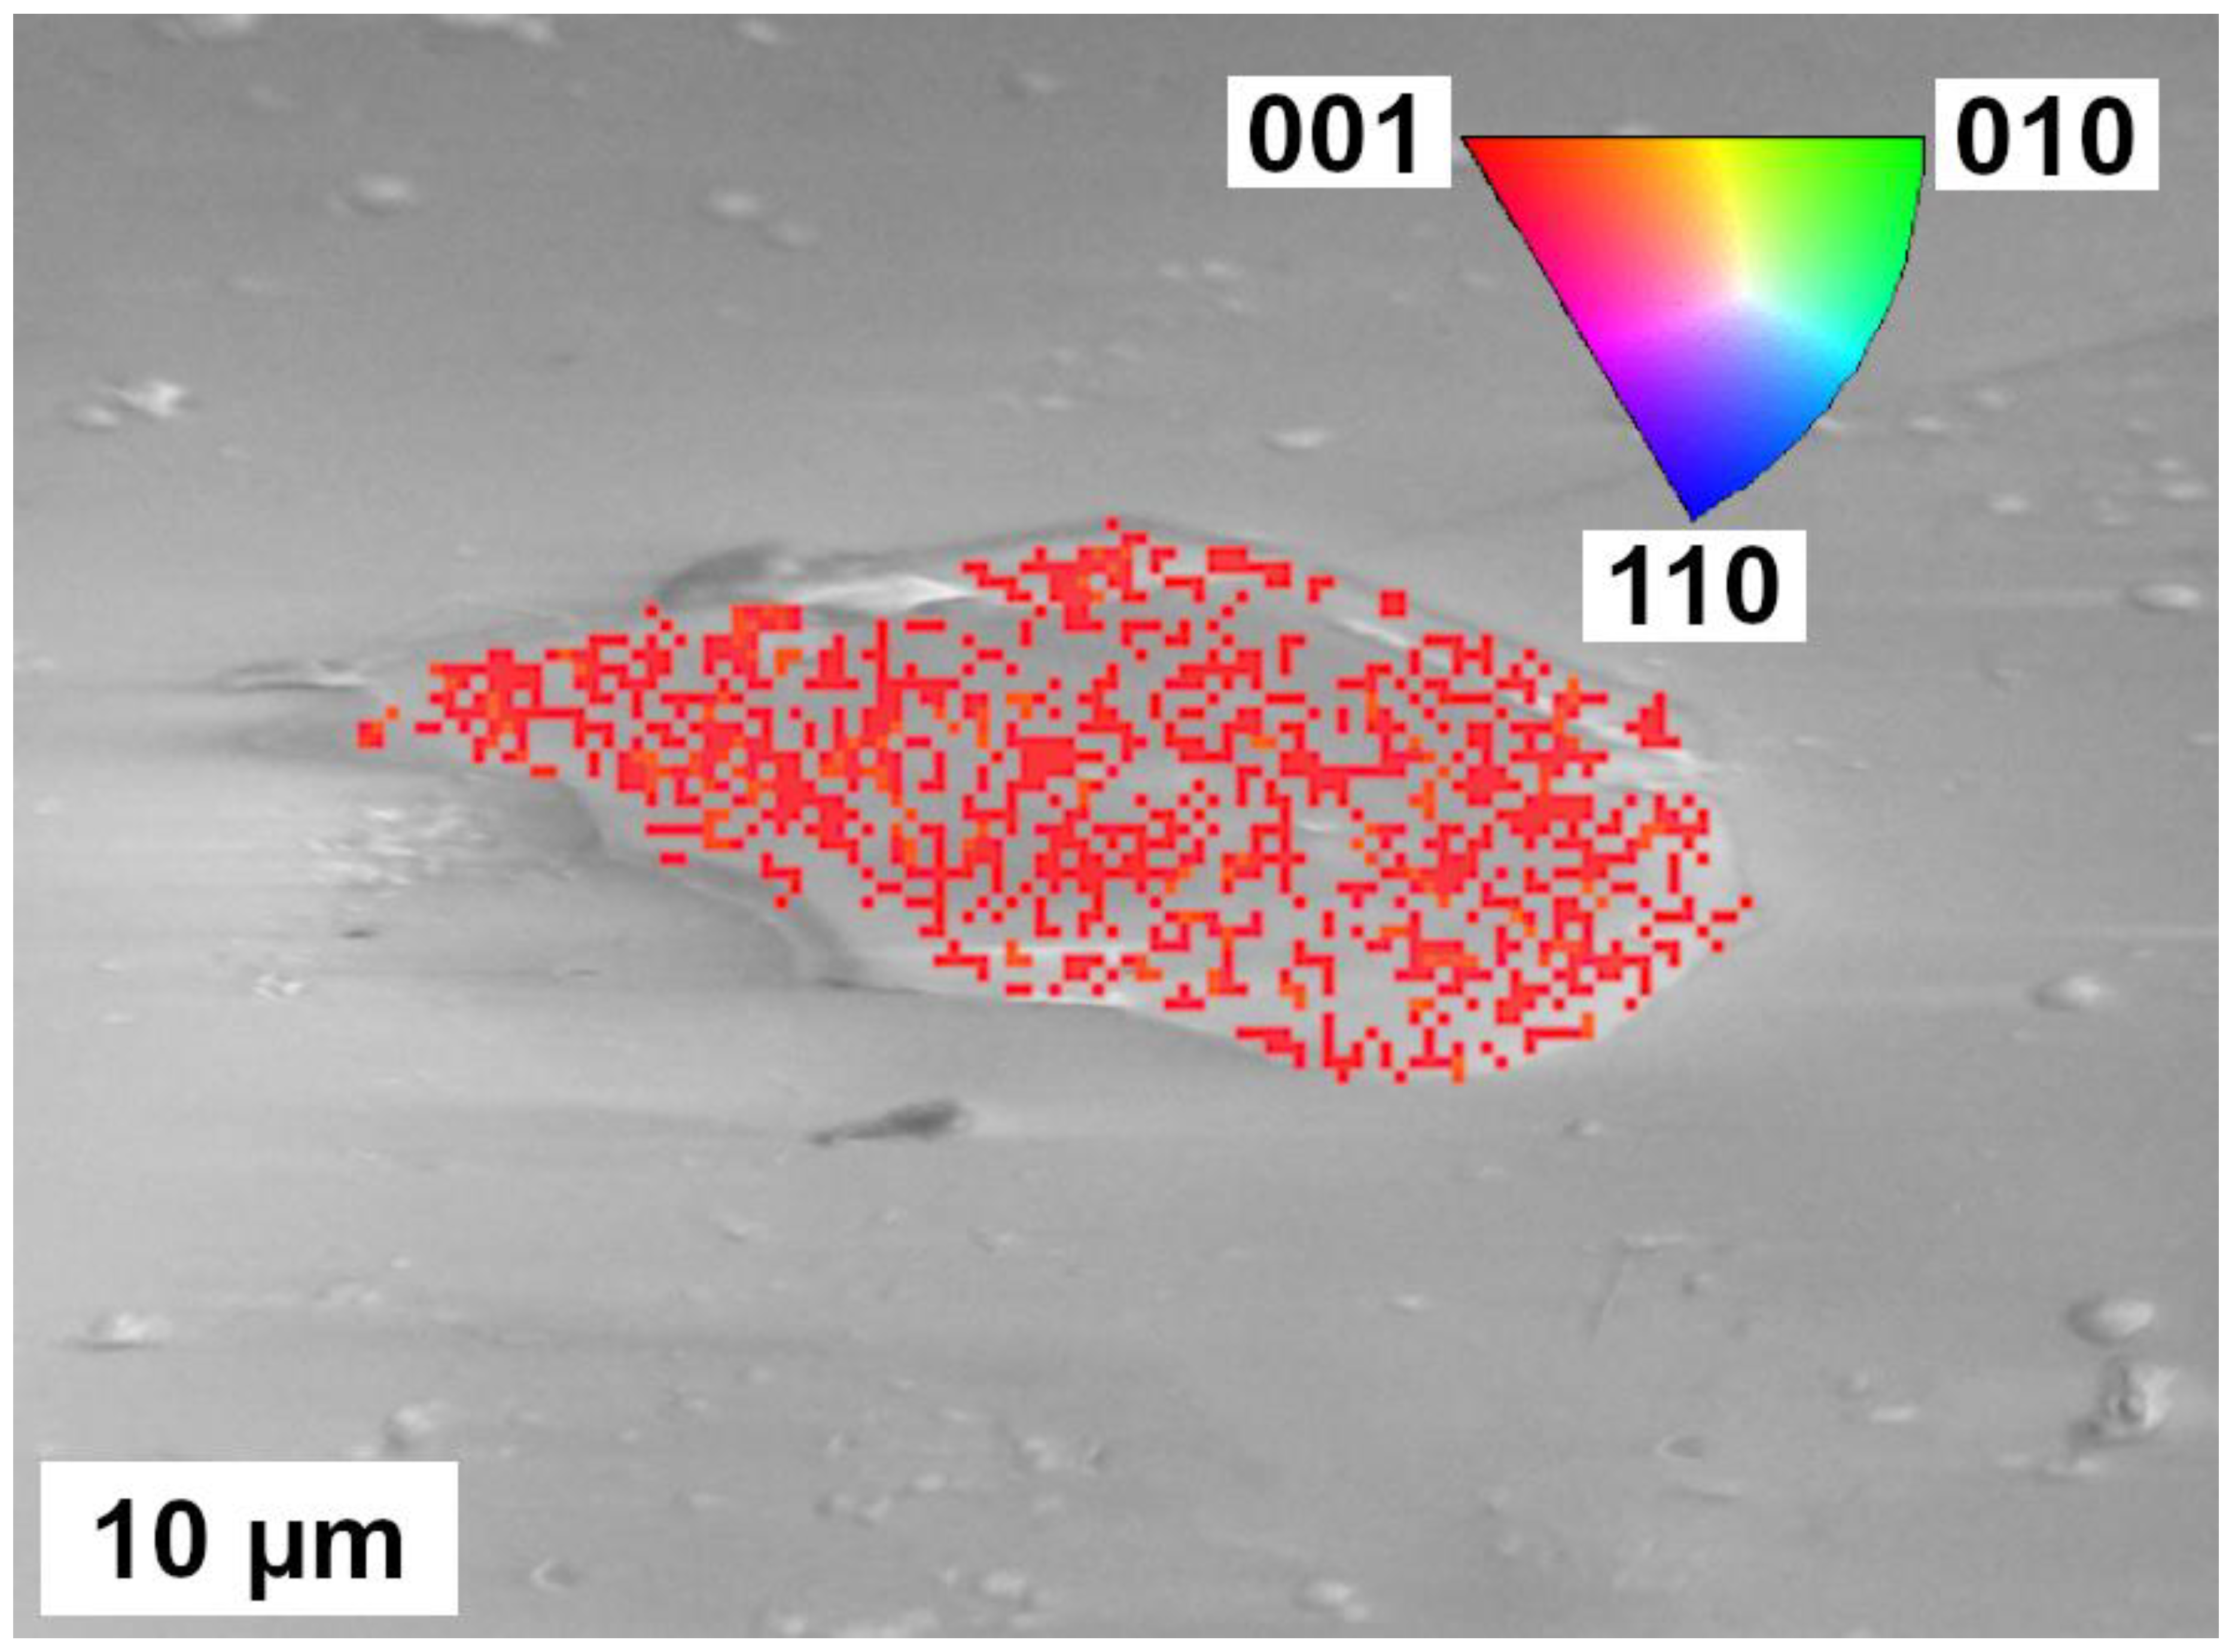
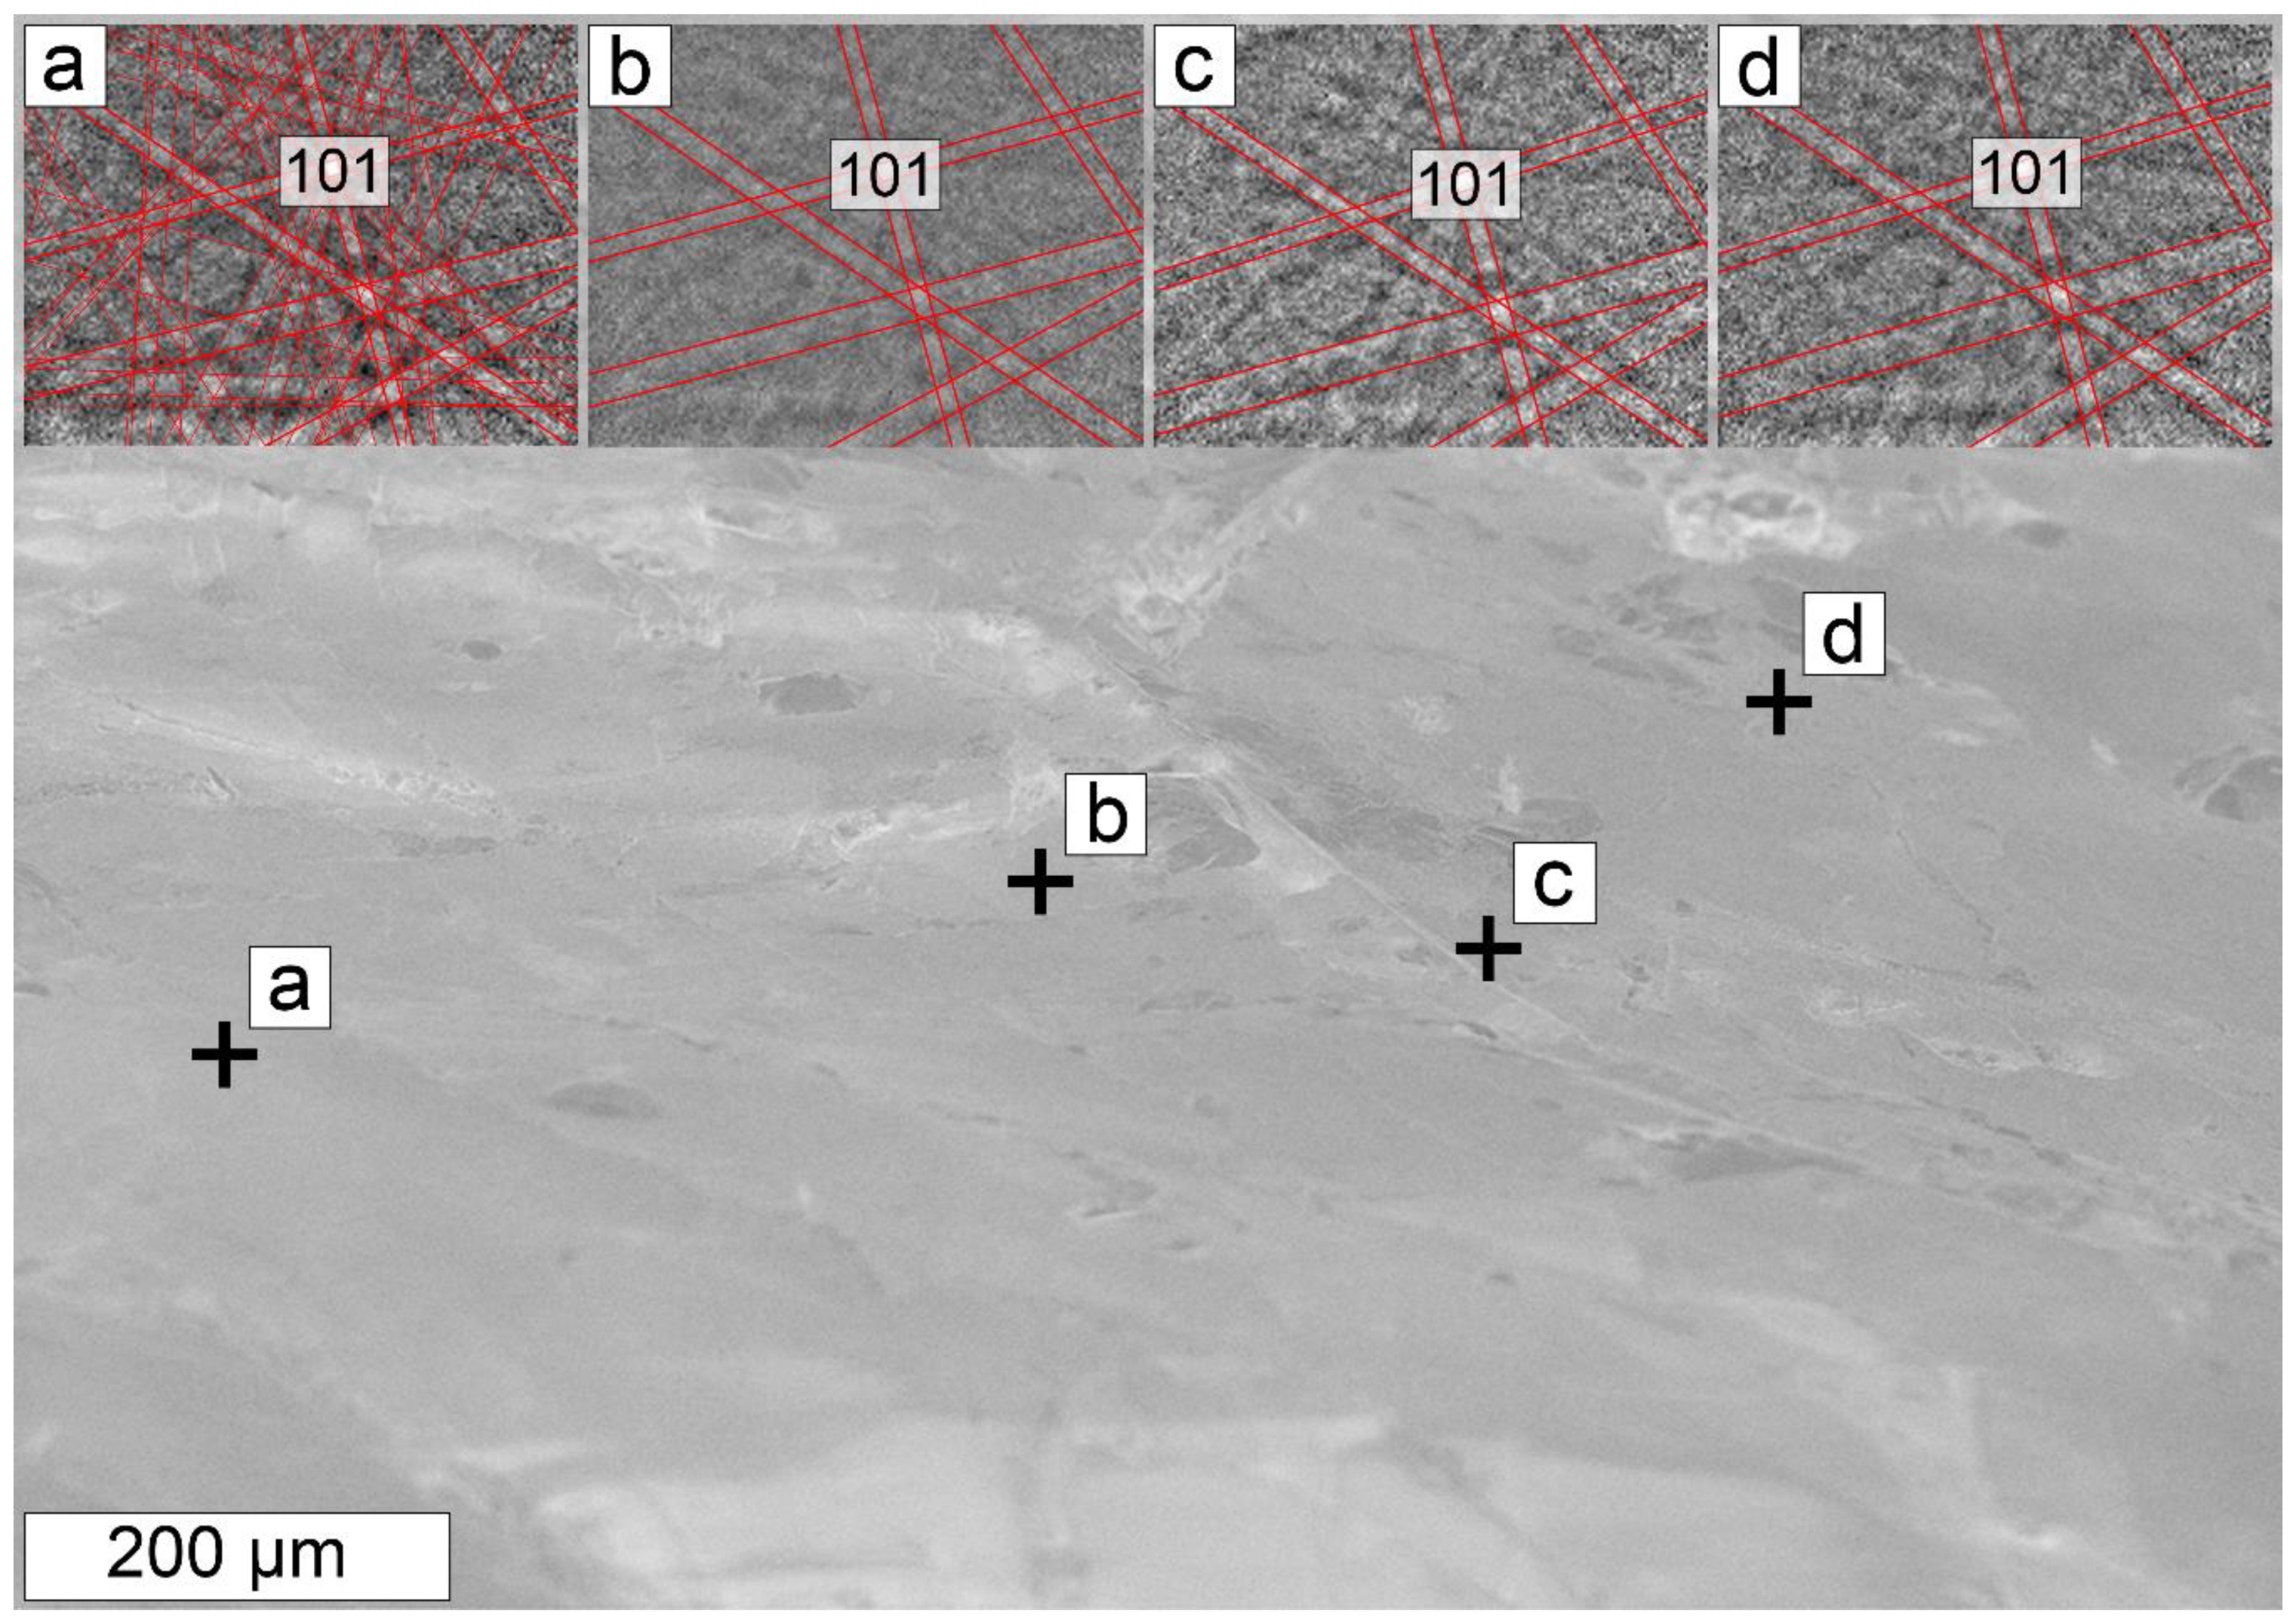
3.3. Electron Microscopy Analyses

Cathodoluminescence imaging demonstrates that apatite and betafite have experienced fracturing and metasomatism (Figure 8). Contrast differences observed in CL and BSE along fractures indicate a minimum alteration depth of ≈10 μm in both betafite and apatite. Despite the heterogeneity observed using CL, no appreciable major or minor element zoning was observed in XEDS mapping efforts, suggesting that impurities responsible for CL signal heterogeneity only occur in an abundance lower than the detection limit of the instrument (<1 wt%). Micromineral inclusions were also observed within apatite and betafite. The occurrence of such inclusions in vein dike minerals will be covered in a future work; however, it is important to note the identification of galena inclusions to ≈40 µm observed within betafite, as confirmed using XEDS. Two sample types were investigated for apatite crystallinity using EBSD: polished sections preserving the apatite–betafite boundary and apatite crystals pried from betafite preserving the growth surface which was in contact with betafite. In the samples preserving the apatite–betafite boundary, no discernible Kikuchi patterns were obtained from betafite. Kikuchi patterns consistent with the morphologically-inferred orientation of the respective crystals were readily obtained from adjacent apatite, even to within ≈500 nm of the apatite–betafite boundary. An orientation distribution map of an ≈30 μm apatite wholly included in betafite showed highly consistent orientation solutions, with non-indexed areas generally correlating with areas of rough sample topography (Figure 9). Correctly indexed (as inferred from crystal morphology) Kikuchi patterns were readily obtained from the apatite–betafite growth interface of an apatite crystal pried from betafite. Although the surface exhibited somewhat uneven growth topography from synchronous growth with adjacent betafite, numerous sharp patterns were gathered from various points across the crystal (Figure 10). Four representative patterns are shown in Figure 10 that were indexed with an average mean angular deviation (MAD) of 0.655 (s = 0.096). Patterns of identical orientation were also retrieved from other areas of the sample, but could not be indexed by Flamenco due to topographic obfuscation. This issue prevented the collection of an EBSD map of the unpolished apatite surface.

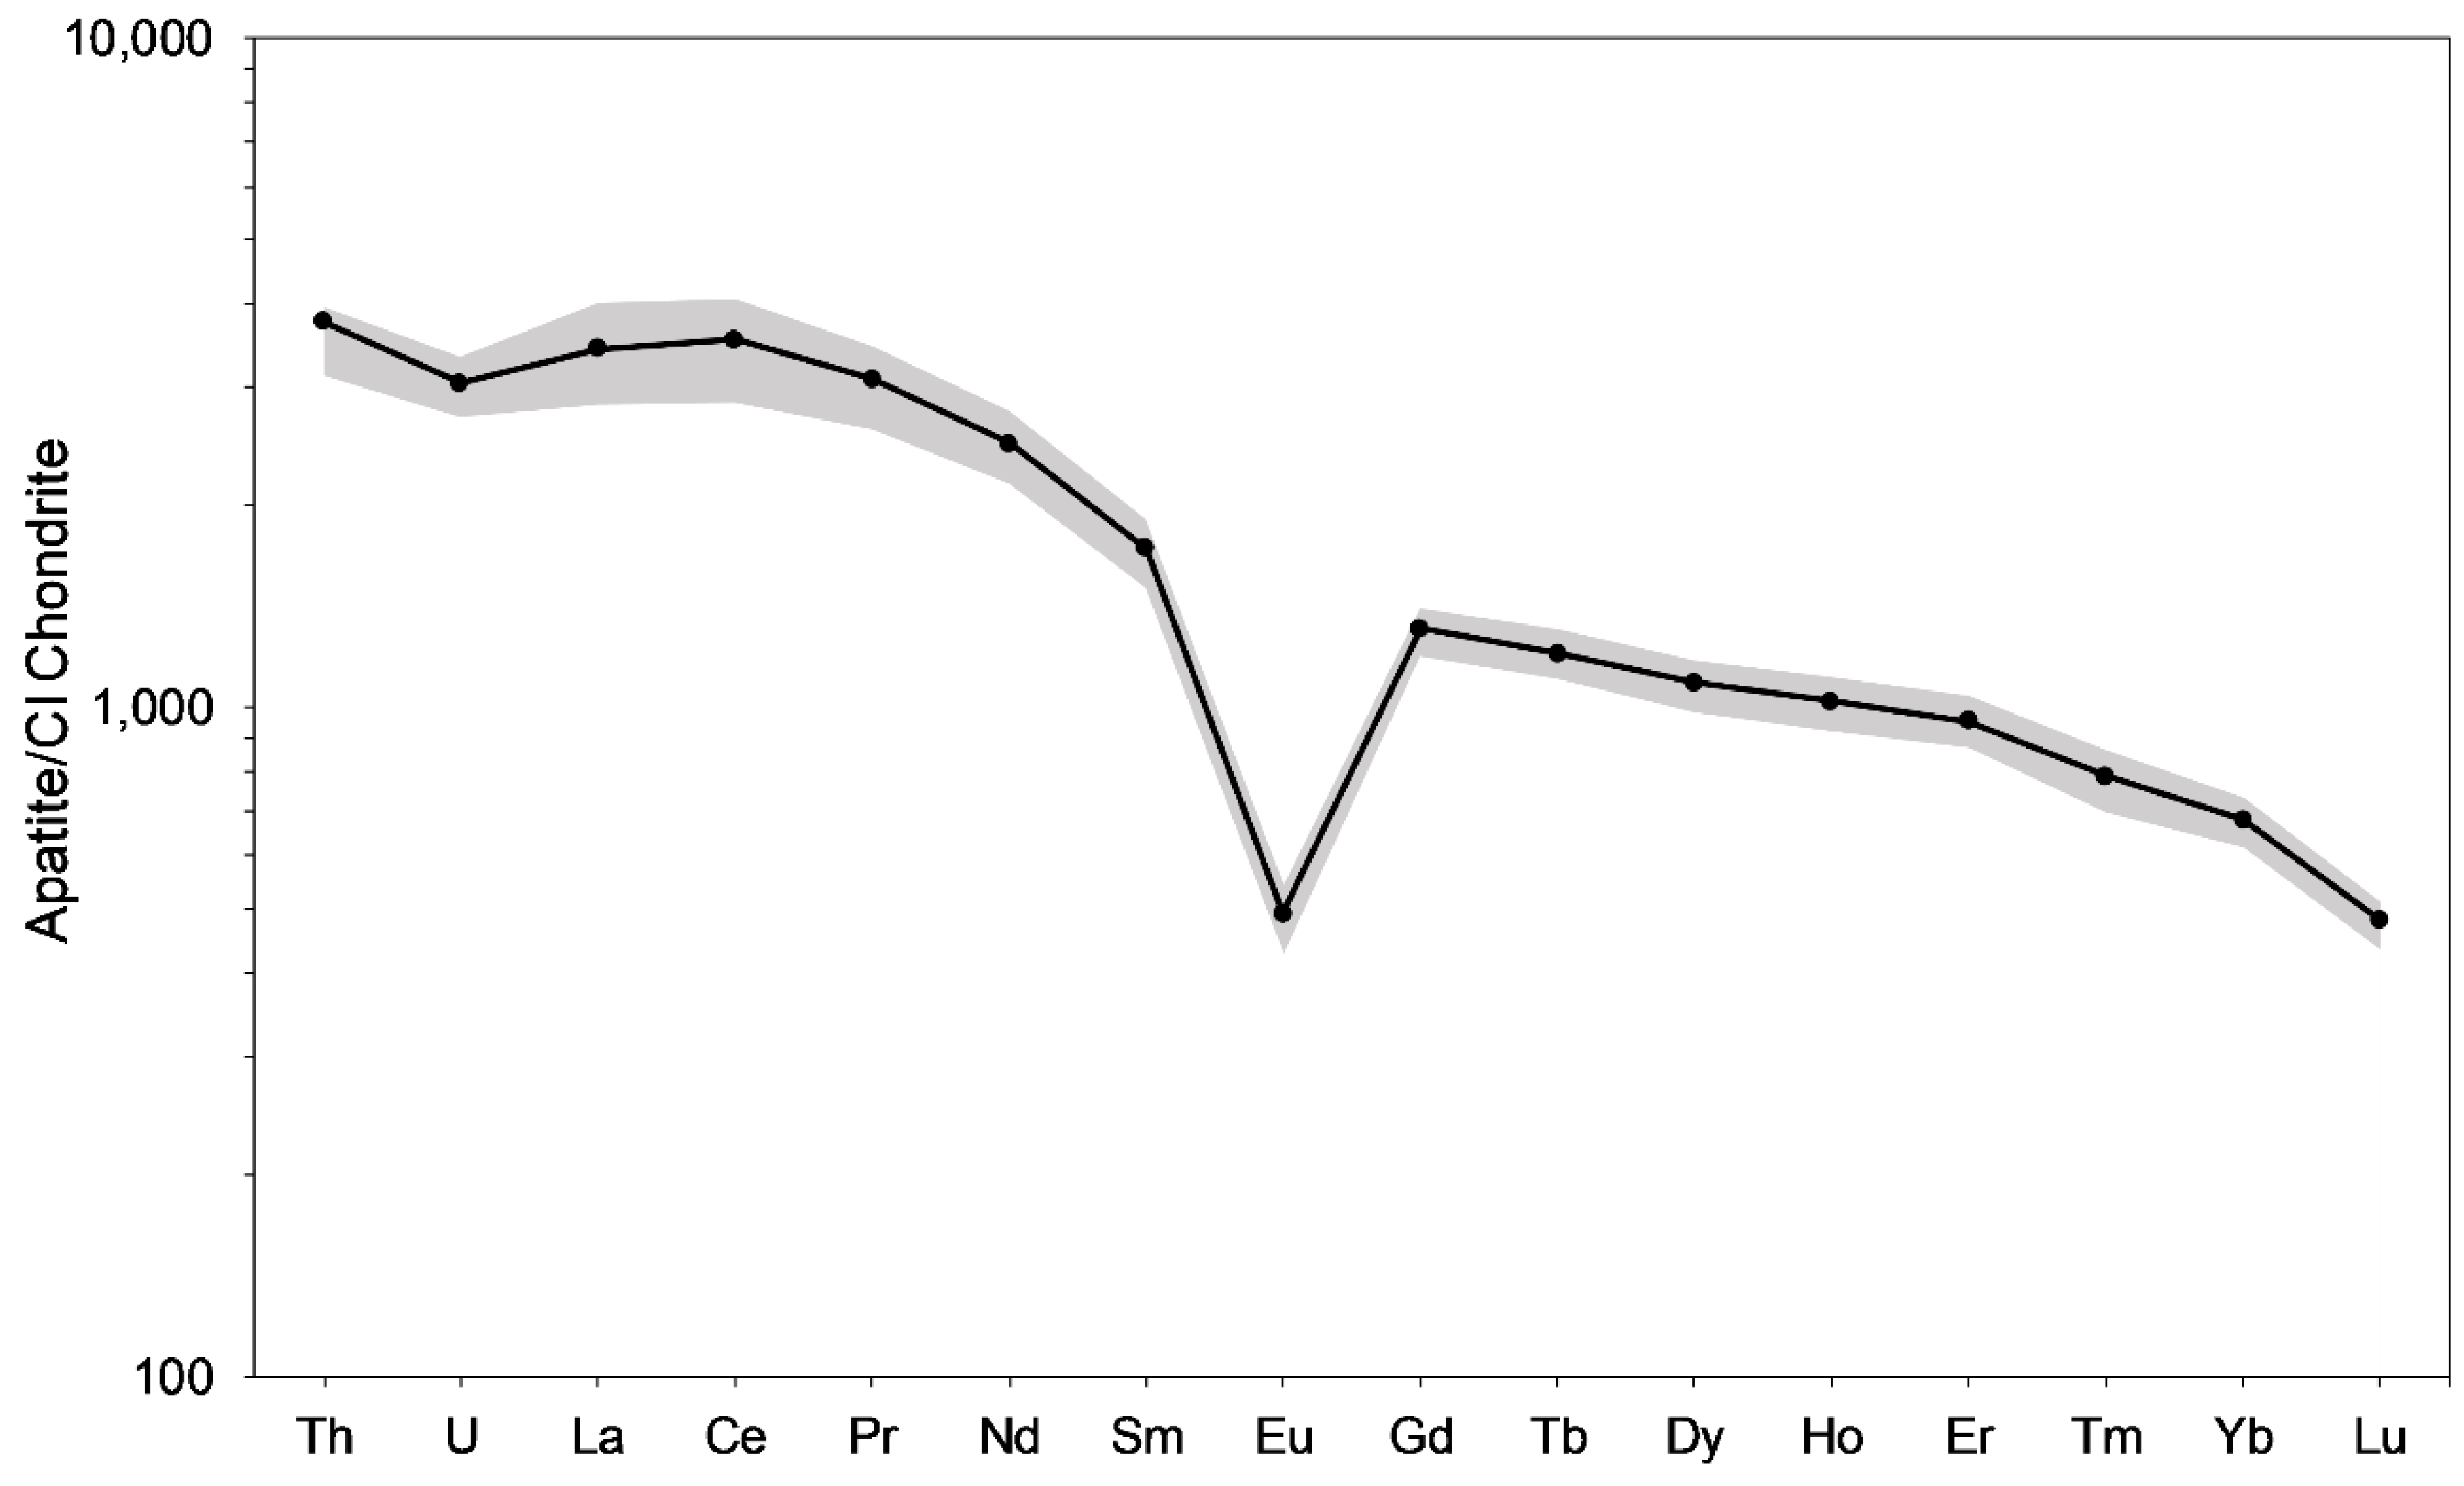
3.4. Mass Spectrometry Analyses

Trace element data for this study are provided in Table S1 and plotted in Figure 11. Apatite from the Silver Crater Mine contains on average ≈109.3 ppm Th and ≈24.3 ppm U (n = 9). Data were normalized to CI chondrite to facilitate comparison with published data [29]. Relative rare earth element (REE) concentrations normalized to CI chondrite show light REE (LREE) enrichment and sharp negative Eu anomalies. Major element analyses of betafite from the Silver Crater Mine are reported in Hogarth [25] and Lumpkin and Ewing [30].

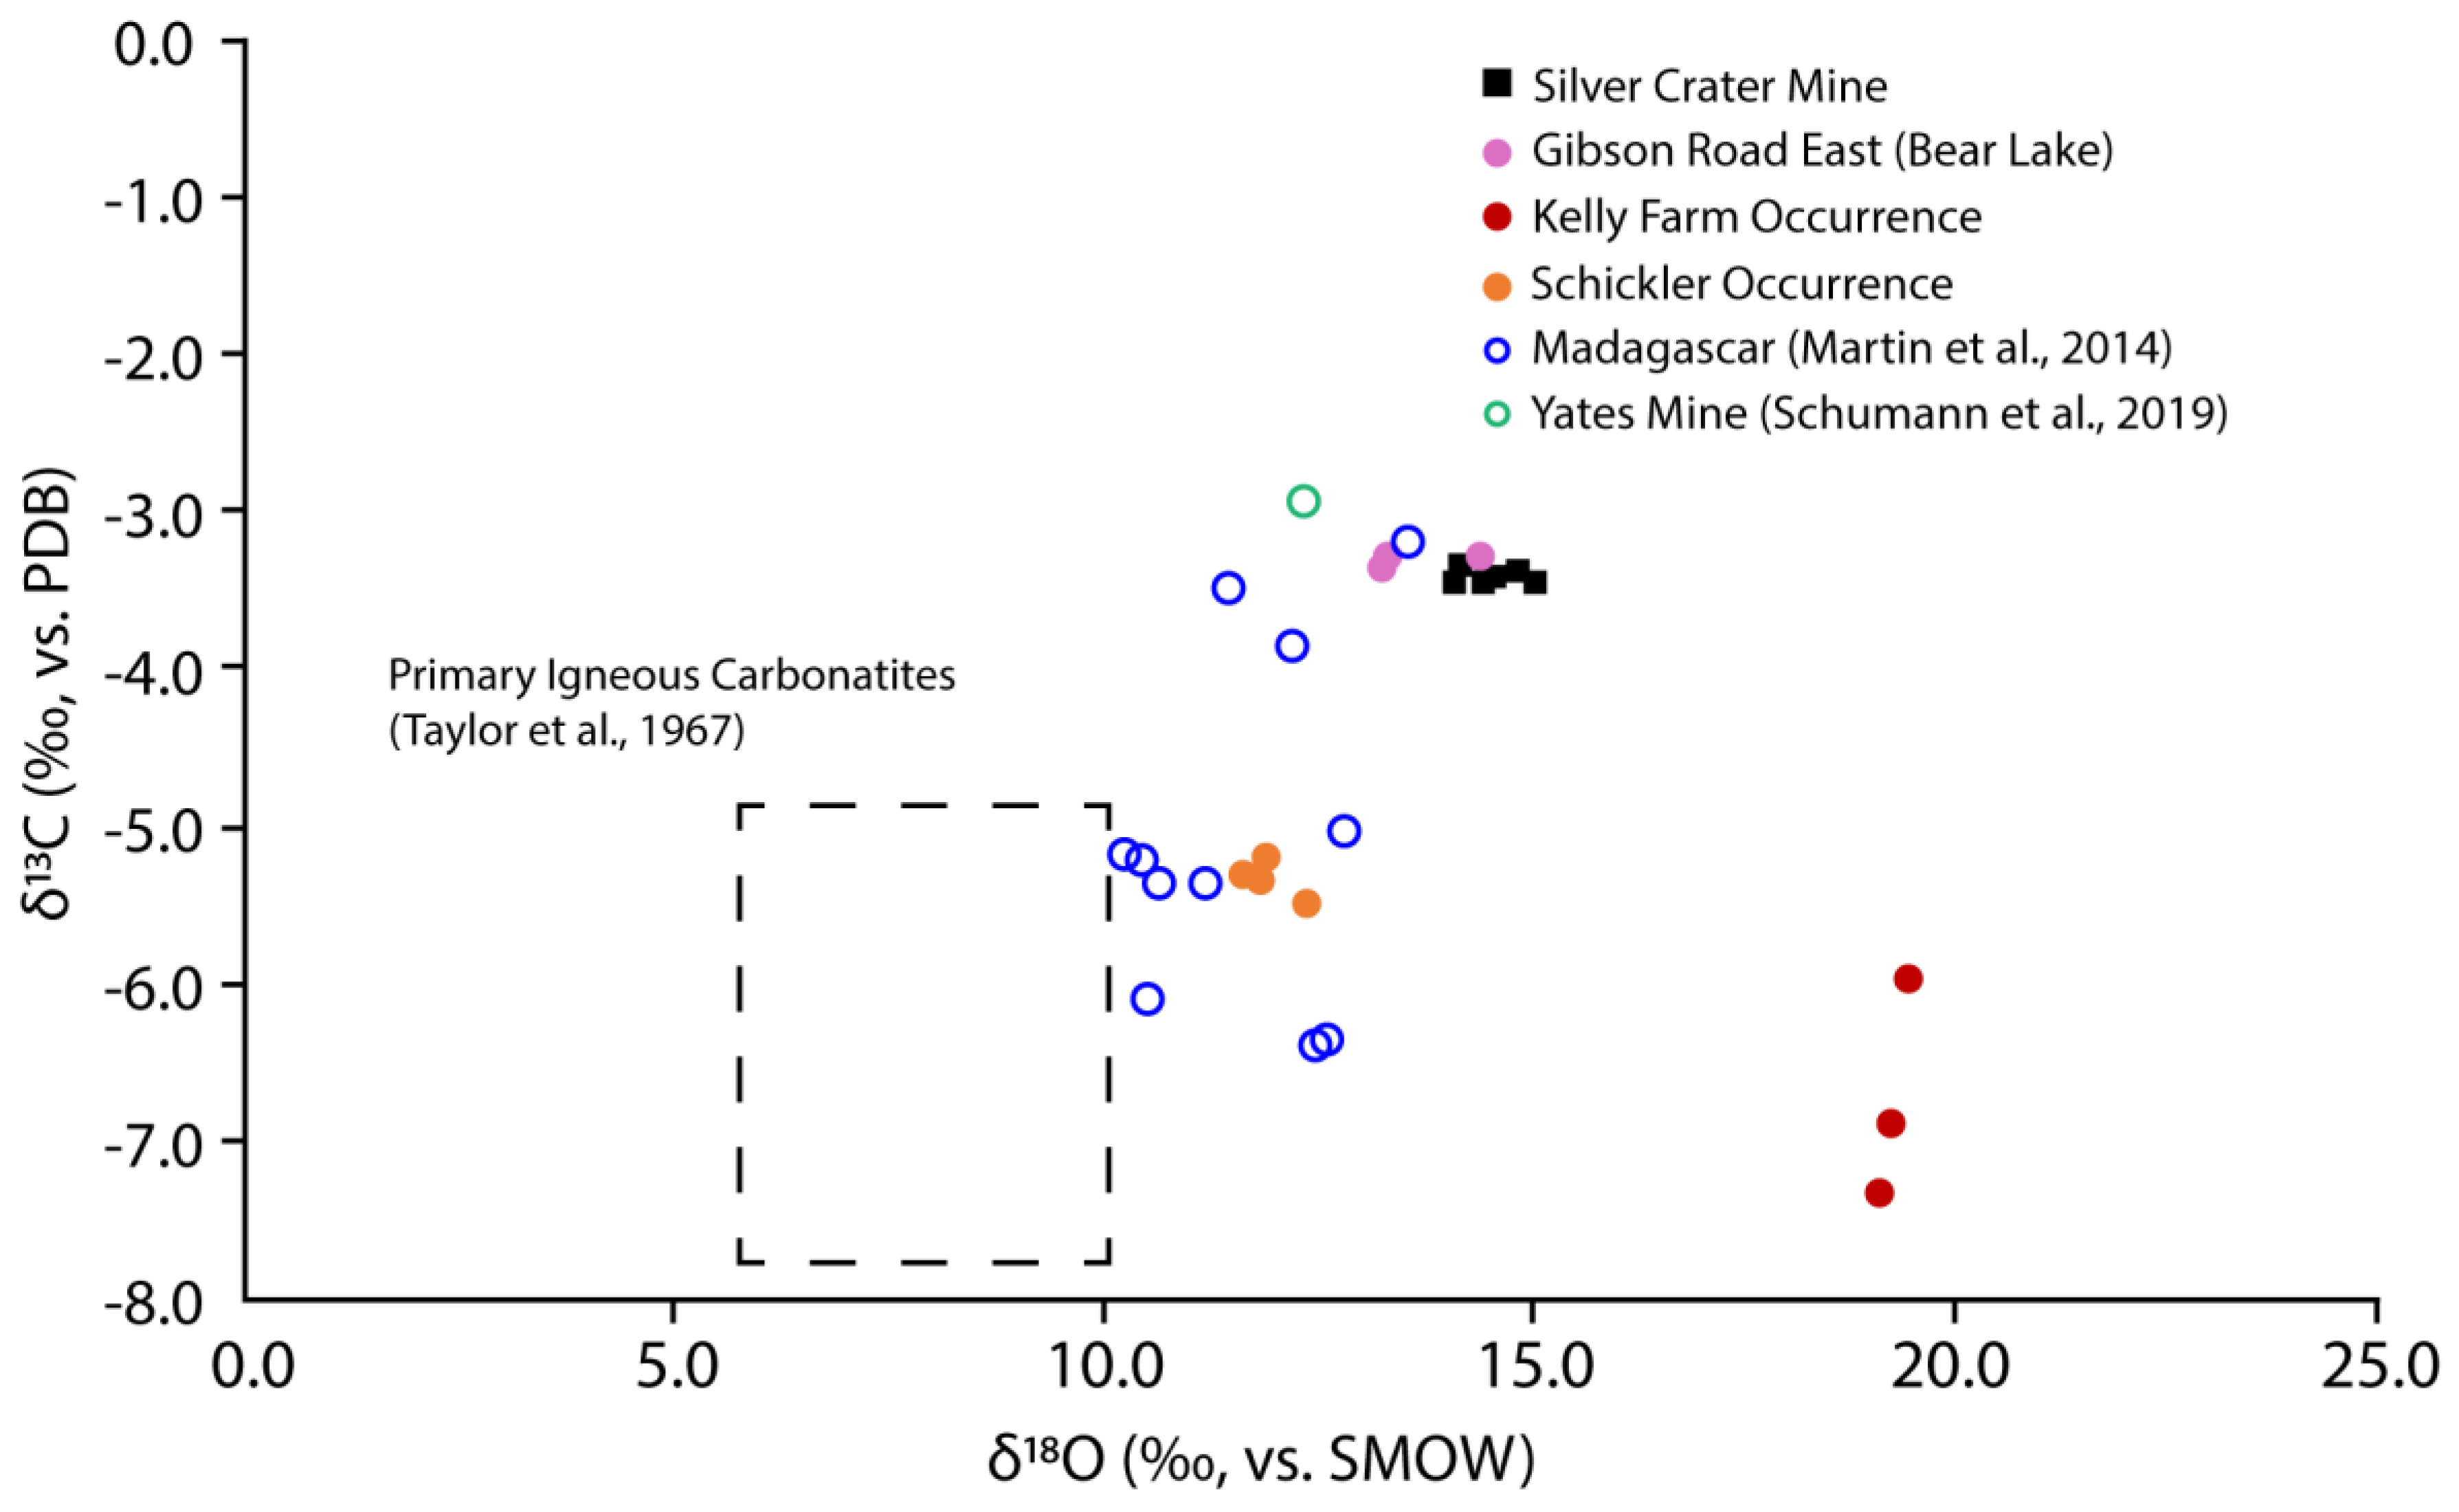
3.5. Stable Isotope Analyses

Isotopic data for this study are provided in Table S2 and plotted in Figure 12. Stable isotopic compositions of calcite separated from the Silver Crater carbonatite exhibit low degrees of variability: the elicited δ13C compositions range from –3.46 to –3.40‰ VPDB, with an average δ13C composition of –3.44‰ VPDB. The δ18O compositions are similarly invariant; the elicited δ18O compositions ranged from 14.21 to 15.07‰ VSMOW with an average δ18O composition of 14.60‰ VSMOW. There is little to no variation between samples derived from the intrusion’s calcite matrix and the samples derived from apatite-hosted calcite melt inclusions. The calcite separates analyzed here are in good agreement with calcite separates obtained from the intrusion at Bear Lake (average δ13C composition = −3.37 ‰ VPDB, average δ18O composition = 14.60 ‰ VSMOW).

4. Discussion

4.1. History of the Silver Crater Carbonatite

Textures observed at the interfaces between apatite and betafite are consistent with coeval growth, supporting our interpretation of the juxtaposition of these phases since emplacement. However, the association of chemical heterogeneity with internal fractures, both healed and extant, is evidence that apatite and betafite experienced fracture-controlled metasomatism post-emplacement. Although the sharp negative Eu anomalies observed in apatites from the Silver Crater carbonatite and the bulk enrichment in Nb, Ti, and U of the deposit are unusual for other vein dike deposits in the Grenville Province, the δ18O and δ13C isotopic data presented in this work are consistent with those from previous studies in which the authors interpreted similar data to be compatible with a crustal carbonate anataxis formation model (potentially involving mixing of mantle-sourced metasomatic fluids) (Figure 11 and Figure 12) [20,22]. Further, the δ18O and δ13C values for calcite from the Silver Crater Mine overlap very closely with analogous samples from the nearby Bear Lake area. Despite the scarcity of Nb in other crustal carbonatite swarms, Nb (and U/Th/REE) mineralization is reported (but minor) from crustal carbonatites in the Bear Lake area [32].

4.2. Crystallinity of Samples

Our X-ray diffraction results demonstrate that while the betafite displays no detectable degree of crystallinity, the adjacent apatite is unambiguously crystalline in the bulk (Figure 6 and Figure 7). The discrete X-ray peak in the broad beam data, sharp diffraction spots in the focused X-ray beam data, and superlative R values achieved during apatite crystal structure refinement are strong evidence that there are relatively few imperfections in the structure, such as radiation damage or high degrees of mosaicity.
Trace element analyses indicate that actinide content within apatite from the Silver Crater Mine is low (Σ ≅ 133 ppm), and therefore significant radiation damage from incorporated actinides is not expected. Although this study does not investigate the crystallinity of apatite which has incorporated a significant proportion of actinides into its own structure, we contest that our work is still a valid assessment of the ability of apatite to resist or anneal radiation damage from an actinide source over long periods of time. Radiation damage of crystals in proximity to radioactive sources is readily observed in nature [33,34]. Optical phenomena known as “pleochroic haloes” commonly surround zircon grains included within micas and cordierite. These zones of inferred damage may extend ≈40 µm or more into the adjacent mineral(s), providing a lower limit on the penetration depth of accrued damage [33,34].
Investigations of apatite growth surfaces using EBSD tested the sample well within this lower limit. Kikuchi patterns indexed in EBSD are formed by detecting electrons which are elastically and coherently scattered in a crystal lattice. The conventionally accepted escape depth beyond which electrons are exceedingly unlikely to have retained their initial kinetic energy (having only experienced elastic scattering events) and thus contribute to EBSD signal is ≈40 nm [35,36]. However, recent experiments suggest that electrons which have lost up to ≈20% of their initial kinetic energy may also contribute to EBSD signal—extending the maximum depth of this technique further into the bulk [35,36]. A maximum information depth for EBSD is estimated to be ≈100 nm for a 20.0 KeV accelerating voltage and 70° sample tilt [35]. Our analyses used an accelerating voltage of only 10.0 KeV, thereby constraining the maximum signal source depth to be somewhat less than 100 nm, which is already orders of magnitude smaller than the extent of radiation damage observed in pleochroic haloes [33,34].
Analyses of the surface crystallinity using EBSD demonstrate that apatite remains crystalline, even at interfaces shared with highly radioactive betafite (Figure 10). The consistency of orientation solutions (with respect to symmetrically equivalent orientations) indicates that the entirety of the surface that could be analyzed is congruent—with no recognizable subgrain development. The sharpness of patterns obtained from a nonconductive and unpolished sample attest to the high degree of crystallinity of the near-surface region. Because EBSD is a very surface sensitive technique, with signal emanating from only a few tens to hundreds of nanometers, the results from apatite growth surfaces (that have been in direct contact with betafite for ≈1.0 Ga) clearly show the absence of metamictization at depths that will have received high doses of alpha radiation over a prolonged period of time.
Previous works have used ion bombardment to simulate alpha recoil damage from actinide decay, successfully resulting in the amorphization of minerals such as zircon and apatite [8,10,37,38]. Li et al. concluded that amorphous apatite will recrystallize into polycrystalline domains when exposed to alpha particle bombardment, demonstrating that the energy imparted by an incident alpha particle is sufficient to instigate annealing in apatite group minerals [10]. Because Li et al. used amorphous apatite, recrystallization could form polycrystalline domains at odds with the protocrystal orientation. Epitaxial recrystallization has been achieved in electron beam experiments of irradiation-amorphized apatite [39]. In a natural system, the process of bombardment and annealing would occur incrementally throughout the crystal over a much longer period, resulting in annealing concordant with the bulk remaining more energetically favorable than the formation of a new orientation domain.

4.3. Significance of Data

Available data strongly suggest that both apatite and betafite have undergone fluid-mediated alteration since the time of formation at ≈1.0 Ga. However, while apatite remains crystalline, betafite is metamict and shows no detectable crystallinity. Anomalous ages of apatite from the vein dike exposed at the Yates Mine dated using U/Pb geochronology methods suggest Pb loss associated with metasomatism [21]. Age resetting from post-Grenville events (such as Appalachian orogenic events) has been documented elsewhere in the Grenville, but it remains unclear whether alteration events are associated with a single regional event or if multiple pulses of alteration are represented [40].
Earlier studies of betafite from the Silver Crater Mine report signs of alteration and secondary galena, in agreement with the observations of this study [30]. The occurrence of galena (if formed solely from radiogenic Pb mobilized by hydrothermal fluids) would suggest that alteration must have occurred long after emplacement, as successive retrograde reactions shortly after formation would not have had access to ample radiogenic Pb, given the slow decay rates of the most naturally abundant U and Th isotopes. However, Pb isotope analyses of betafite from the Silver Crater Mine fit a Pb loss model consistent with long-term diffusion rather than recent alteration, as suggested by identical Pb loss between altered and unaltered areas of the betafite [30]. The lack of any spatial association observed between galena and alteration within betafite is consistent with this interpretation. A long-term Pb loss model suggests that very little radiogenic Pb had accumulated at the time of metasomatism, and that galena likely formed from the slow diffusion of Pb through the increasingly metamict structure into voids occupied by low temperature S-bearing fluids [30]. Radiogenic Pb mobilization may be fluid-mediated or the result of diffusion through the (damaged) crystal structure, with both having been reported in nature [30]. Galena formed from the remobilization of radiogenic Pb has also been documented from the Oklo Mine in Gabon [41], and from the Phalaborwa carbonatite complex [42]. Constraining the timing of such events as they have affected the Silver Crater deposit is critical to assessing the absolute duration and potency of irradiation represented in our data. However, long-term exposure is consistent with the available data [30].

4.4. Future Work

Future investigations into these samples should aim to constrain the age and origin of the carbonatite and the metasomatic event interpreted from the textures observed in CL and BSE images of betafite and apatite. Although these samples exemplified the resistance of apatite to U decay, other actinides (such as Th) were not detected in appreciable abundance in betafite, and therefore irradiation from these sources is not represented in our data.

5. Summary and Conclusions

Nuclear waste disposal is one of the greatest environmental problems facing society today. Tractable strategies for the disposal of nuclear waste necessitate development and use of highly durable waste forms. The ability to design appropriate methods and materials for radionuclide waste disposal is dependent on knowledge of the basic physical and chemical properties of waste forms [43], and the mechanisms by which these forms accommodate the elements of interest [44,45]. Understanding the unknown, long-term effects high levels of radiation have on the apatite crystal structure is critical when assessing apatite’s viability as a safe solid nuclear waste form. The processes of metamictization and annealing may be simulated through ion bombardment experiments, but how the crystal structure of apatite reacts to natural actinide radiation sources over geologically relevant timescales is unknown. The Silver Crater Mine in Ontario, Canada, accesses a carbonatite hosting radioactive betafite intergrown with apatite. Stable isotope data (δ18O and δ13C) are consistent with previous studies of petrologically similar deposits in the region. The Silver Crater deposit is interpreted to have formed during either the Shawinigan (c. 1150 Ma) or Ottawan (c. 1050 Ma) pulses of the Grenville orogenic cycle, and thus presents the opportunity to evaluate the effects of natural actinide radiation on apatite over long periods of time. Although samples show textures indicative of fluid-mediated alteration, Pb loss data from previous work are consistent with long-term diffusion rather than recent alteration, supporting a long exposure time for apatite in contact with betafite. X-ray and electron diffraction analyses indicate that the bulk apatite is highly crystalline with no detectable signs of radiation damage, whereas associated betafite is highly metamict. Further analyses using EBSD demonstrate that the apatite surfaces in direct contact with radioactive betafite remain crystalline. These results are consistent with previous findings suggesting the apatite structure is resistant to metamictization from natural radiation sources. The long-term stability of the apatite structure when exposed to high doses of radioactivity reinforces the candidacy of this mineral as an important potential solid nuclear waste form.

Supplementary Materials

The following are available online at https://www.mdpi.com/2075-163X/10/3/244/s1, Table S1: Trace element data; Table S2: Stable isotope data.

Author Contributions

Conceptualization, J.R.; investigation, C.E., A.A. and C.A.; resources, J.R.; methodology, C.E. and J.R.; writing—original draft preparation, C.E., A.A. and C.A.; writing—review and editing, C.E. and J.R.; visualization, C.E.; supervision, J.R. All authors have read and agreed to the published version of the manuscript.

Funding

This research received no external funding.

Acknowledgments

The authors would like to express their gratitude to John Medici for providing photographs and samples of apatite and betafite, to Sal Avella for providing additional samples, to Richard Edelmann and Matt Duley for assistance with EBSD analyses, to Barry Shaulis for LA-ICP-MS analyses, to Jason Curtis for assistance with stable isotope analyses, and to Andrew Gangidine for assistance with thin section preparation.

Conflicts of Interest

The authors declare no conflict of interest.

References

  1. Weber, W.J.; Ewing, R.C. The kinetics of alpha-decay-induced amorphization in zircon and apatite containing weapons-grade plutonium or other actinides. J. Nucl. Mater. 1997, 250, 147–155. [Google Scholar] [CrossRef]
  2. Ewing, R.C.; Wang, L. Phosphates as nuclear waste forms. Rev. Mineral. Geochem. 2002, 48, 673–699. [Google Scholar] [CrossRef]
  3. Chaumont, J.; Soulet, S.; Krupa, J.C.; Carpena, J. Competition between disorder creation and annealing in fluoroapatite nuclear waste forms. J. Nucl. Mater. 2002, 301, 122–128. [Google Scholar] [CrossRef]
  4. Oelkers, E.H.; Montel, J.M. Phosphates and nuclear waste storage. Elements 2008, 4, 113–116. [Google Scholar] [CrossRef]
  5. Bros, R.; Carpena, J.; Sere, V.; Beltritti, A. Occurrence of Pu and fissiogenic REE in hydrothermal apatites from the fossil nuclear reactor 16 at Oklo (Gabon). Radiochim. Acta 1996, 74, 277–282. [Google Scholar] [CrossRef]
  6. Ewing, R.C.; Haaker, R.F. The metamict state: Implications for radiation damage in crystalline waste forms. Nucl. Chem. Waste Manag. 1980, 1, 51–57. [Google Scholar] [CrossRef]
  7. Ewing, R.C.; Chakoumakos, B.C.; Lumpkin, G.R.; Murakami, T. The metamict state. MRS Bull. 1987, 12, 58–66. [Google Scholar] [CrossRef]
  8. Ewing, R.C.; Meldrum, A.; Wang, L.; Wang, S. Radiation-induced amorphization. Rev. Mineral. Geochem. 2000, 39, 319–361. [Google Scholar] [CrossRef]
  9. Lumpkin, G.R.; Gao, Y.; Gieré, R.; Williams, C.T.; Mariano, A.N.; Geisler, T. The role of Th-U minerals in assessing the performance of nuclear waste forms. Mineral. Mag. 2014, 78, 1071–1095. [Google Scholar] [CrossRef] [Green Version]
  10. Li, W.; Shen, Y.; Zhou, Y.; Nan, S.; Chen, C.H.; Ewing, R.C. In situ TEM observation of alpha-particle induced annealing of radiation damage in Durango apatite. Sci. Rep. 2017, 7, 1–10. [Google Scholar] [CrossRef] [Green Version]
  11. Johnson, T.A.; Vervoort, J.D.; Ramsey, M.J.; Aleinikoff, J.N.; Southworth, S. Constraints on the timing and duration of orogenic events by combined Lu–Hf and Sm–Nd geochronology: An example from the Grenville orogeny. Earth Planet. Sci. Lett. 2018, 501, 152–164. [Google Scholar] [CrossRef]
  12. Chiarenzelli, J.; Lupulescu, M.; Robinson, G.; Bailey, D.; Singer, J. Age and origin of silicocarbonate pegmatites of the Adirondack region. Minerals 2019, 9, 508. [Google Scholar] [CrossRef] [Green Version]
  13. Sabina, A.P. Rocks and Minerals for the Collector: Bancroft—Parry Sound and Southern Ontario; Geological Survey of Canada: Ottawa, ON, Canada, 1986; Volume 39. [Google Scholar]
  14. Spence, H.S. Phosphate in Canada; Report; Canada Department of Mines, Mines Branch: Ottawa, ON, Canada, 1920; Volume 396. [Google Scholar]
  15. McDougall, R. Mineral highlights from the Bancroft area, Ontario, Canada. Rocks Miner. 2019, 94, 408–419. [Google Scholar] [CrossRef]
  16. Joyce, D.K. Calcite vein-dikes of the Grenville geological province, Ontario, Canada. Rocks Miner. 2000, 81, 34–42. [Google Scholar] [CrossRef]
  17. Satterly, J.; Hewitt, D.F. Some Radioactive Mineral Occurrences in the Bancroft Area. Report; Ontario Department of Mines, Mines Branch: Ottawa, ON, Canada, 1955; p. 2. [Google Scholar]
  18. Russell, R.; Guggenheim, S. Crystal structures of near end-member phlogopite at high temperatures and heat-treated Fe-rich phlogopite: The influence of the O, OH, F site. Can. Mineral. 1999, 37, 711–720. [Google Scholar]
  19. Gulbrandsen, R. Carbonate-bearing apatite from Faraday Township, Ontario, Canada. Am. Mineral. 1966, 51, 819–824. [Google Scholar]
  20. Martin, R.F.; Randrianandraisana, A.; Boulvais, P. Ampandrandava and similar phlogopite deposits in southern Madagascar: Derivation from a silicocarbonatitic melt of crustal origin. J. Afr. Earth Sci. 2014, 94, 111–118. [Google Scholar] [CrossRef]
  21. Schumann, D.; Martin, R.F.; Fuchs, S.; Fourestier, J. Silicocarbonatitic melt inclusions in fluorapatite from the Yates prospect, Otter Lake, Québec: Evidence of marble anatexis in the central metasedimentary belt of the Grenville Province. Can. Mineral. 2019, 57, 583–604. [Google Scholar] [CrossRef]
  22. Martin, R.F.; Schumann, D. A Silicocarbonatitic Melt and Spinel-Bearing Dunite of Crustal Origin at the Parker Phlogopite Mine, Notre-Dame-du-Laus, Quebec, Canada. Minerals 2019, 9, 613. [Google Scholar] [CrossRef] [Green Version]
  23. Hogarth, D.D. A Mineralogical Study of Pyrochlore and Betafite. Ph.D. Thesis, McGill University, Montreal, QC, Canada, 1959. [Google Scholar]
  24. Josey, S.D. Bedrock Geology of Ontario. 2011. Available online: https://www.mndm.gov.on.ca/en/mines-and-minerals/applications/ogsearth (accessed on 17 February 2020).
  25. Hogarth, D.D. Classification and nomenclature of the pyrochlore group. Am. Mineral. 1977, 62, 403–410. [Google Scholar]
  26. Williams, T.; Bailey, F. The Photon Detector and the Variable-Pressure Scanning Electron Microscope an Alternative Method for Cathodoluminescence Imaging of Geologic Materials. Microsc. Microanal. 2006, 12, 1530–1531. [Google Scholar] [CrossRef] [Green Version]
  27. Jochum, K.P.; Weis, U.; Stoll, B.; Kuzmin, D.; Yang, Q.; Raczek, I.; Jacob, D.E.; Stracke, A.; Birbaum, K.; Frick, D.A.; et al. Determination of Reference Values for NIST SRM 610–617 Glasses Following ISO Guidelines. Geostand. Geoanal. Res. 2011, 35, 397–429. [Google Scholar] [CrossRef]
  28. Hellstrom, J.; Paton, C.; Woodhead, J.; Hergt, J. Iolite: Software for spatially resolved LA-(quad and MC) ICPMS analysis. Mineral. Assoc. Can. Short Course Ser. 2008, 40, 343–348. [Google Scholar]
  29. McDonough, W.F.; Sun, S.-S. The composition of the Earth. Chem. Geol. 1995, 120, 223–253. [Google Scholar] [CrossRef]
  30. Lumpkin, G.R.; Ewing, R.C. Geochemical alteration of pyrochlore group minerals: Betafite subgroup. Am. Mineral. 1996, 81, 1237–1248. [Google Scholar] [CrossRef]
  31. Taylor, H.P., Jr.; Frechen, J.; Degens, E.T. Oxygen and carbon isotope studies of carbonatites from the Laacher See District, West Germany and the Alnö District, Sweden. Geochim. Cosmochim. Acta 1967, 31, 407–430. [Google Scholar] [CrossRef]
  32. Bermanec, V.; Tomašić, N.; Kniewald, G.; Back, M.E.; Zagler, G. Nioboaeschynite-(Y), A new member of the aeschynite group from Bear Lake Diggings, Haliburton County, Ontario, Canada. Can. Mineral. 2008, 46, 395–402. [Google Scholar] [CrossRef] [Green Version]
  33. Hayase, I. The development of pleochroic haloes and the alpha radioactivity of the nucleus minerals. Mineral. J. 1955, 1, 213–223. [Google Scholar] [CrossRef] [Green Version]
  34. Owen, M.R. Radiation-damage halos in quartz. Geology 1988, 16, 529–532. [Google Scholar] [CrossRef]
  35. Wisniewski, W.; Rüssel, C. An experimental viewpoint on the information depth of EBSD. Scanning 2016, 38, 164–171. [Google Scholar] [CrossRef]
  36. Wisniewski, W.; Saager, S.; Böbenroth, A.; Rüssel, C. Experimental evidence concerning the significant information depth of electron backscatter diffraction (EBSD). Ultramicroscopy 2017, 173, 1–9. [Google Scholar] [CrossRef] [PubMed]
  37. Wang, L.M.; Cameron, M.; Weber, W.J.; Crowley, K.D.; Ewing, R.C. In situ TEM observation of radiation induced amorphization of crystals with apatite structure. In Hydroxyapatite and Related Materials; Brown, P.W., Constanz, B., Eds.; CRC Press: Boca Raton, FL, USA, 1994; pp. 243–249. [Google Scholar]
  38. Meldrum, A.; Boatner, L.A.; Zinkle, S.J.; Wang, S.X.; Wang, L.M.; Ewing, R.C. Effects of dose rate and temperature on the crystalline-to-metamict transformation in the ABO orthosilicates. Can. Mineral. 1999, 37, 207–221. [Google Scholar]
  39. Bae, I.T.; Zhang, Y.; Weber, W.J.; Higuchi, M.; Gianuzzi, L.A. Electron-beam induced recrystallization in amorphous apatite. Appl. Phys. Lett. 2007, 90, 021912. [Google Scholar] [CrossRef]
  40. Lupulescu, M.V.; Chiarenzelli, J.R.; Pullen, A.T.; Price, J.D. Using pegmatite geochronology to constrain temporal events in the Adirondack Mountains. Geosphere 2011, 7, 23–39. [Google Scholar] [CrossRef] [Green Version]
  41. Horie, K.; Hidaka, H.; Gauthier-Lafaye, F. Isotopic evidence for trapped fissiogenic REE and nucleogenic Pu in apatite and Pb evolution at the Oklo natural reactor. Geochim. Cosmochim. Acta 2004, 68, 115–125. [Google Scholar] [CrossRef]
  42. Gieré, R.; Guggenheim, R.; Düggelin, M.; Mathys, D.; Williams, C.T.; Lumpkin, G.R.; Smith, K.L.; Blackford, M.G.; Hart, K.P.; McGlinn, P. Retention of actinides during alteration of aperiodic zirconolite. In Proceedings of the 13th Conference on Electron Microscopy, Paris, France, 17–22 July 1994; pp. 1269–1270. [Google Scholar]
  43. Rakovan, J.; Pasteris, J.D. A Technological Gem: Materials, Medical, and Environmental Mineralogy of Apatite. In Harlov, D. and Rakovan, J. (Guest Editors) Apatite—A mineral for All Seasons. Elements 2015, 11, 195–200. [Google Scholar] [CrossRef]
  44. Luo, Y.; Rakovan, J.; Hughes, J.; Pan, Y. Site preference of U and Th in Cl, F, Sr apatites. Am. Mineral. 2009, 94, 345–351. [Google Scholar] [CrossRef]
  45. Luo, Y.; Rakovan, J.; Elzinga, E.; Pan, Y.; Lupulescu, M.V.; Hughes, J. Crystal chemistry of Th in fluorapatite. Am. Mineral. 2011, 96, 23–33. [Google Scholar] [CrossRef]
Figure 1. Geologic map of the bedrock adjacent to the Silver Crater Mine (red square) with an inset showing the mine’s location in southeastern Ontario. Created using geological map data from Ontario Geological Survey Miscellaneous Release—Data 126 Revised [24].
Minerals 10 00244 g001
Figure 2. Collector (Jay Medici) excavating the weathered carbonatite for mineral specimens in a portion of the deposit especially rich in betafite. Betafite and apatite are primarily hosted in the calcite core of the carbonatite, while silicate minerals are more abundant at the coarsely mineralized margins where the carbonatite contacts silicate country rock.
Minerals 10 00244 g002
Figure 3. Roughly 9 cm betafite cluster removed from the calcite core of the carbonatite (Figure 1). This specimen shows sharply preserved {100} and {111} faces, common in betafite from the Silver Crater Mine.
Minerals 10 00244 g003
Figure 4. (a) A 3 cm betafite crystal with intergrown fluorapatite. (b) Section taken through the sample in (a) showing both intergrown and included apatite crystals.
Minerals 10 00244 g004
Figure 5. Apatite (bright, center) included within betafite imaged using transmitted plane polarized light.
Minerals 10 00244 g005
Figure 6. Broad X-ray beam scan of a slice of betafite partially embedded with a single grain of apatite. The discrete peak at ≈25.8° 2θ is consistent with the 002 peak from indexed apatite patterns from the PDF-2 database (PDF 15-0876). Additional apatite peaks are not represented in these diffraction data due to the singular orientation and monocrystalline nature of the embedded apatite. No discrete peaks associated with pyrochlore or any other mineral are present in our broad X-ray beam data.
Minerals 10 00244 g006
Figure 7. (a,b) Focused X-ray beam 360° φ rotation diffraction experiment on 100 μm fragments of betafite (a) and apatite (b). Note the absence of discrete diffraction spots in the scan of betafite (a) compared to the abundance of discrete spots observed in the scan of apatite (b).
Minerals 10 00244 g007
Figure 8. CL image of apatite (bright, center) wholly included within betafite demonstrating textures suggestive of fracture-controlled metasomatism. Imaged using a 15.0 KeV accelerating voltage, 10.0 mm working distance, and 120 μm aperture.
Minerals 10 00244 g008
Figure 9. EBSD map of apatite included within betafite (polished section) superimposed over a CL image of the analyzed grain. The distribution of orientation solutions is highly consistent across all data points. No diffraction was observed from the surrounding betafite during mapping. Surface imaged using a 0.8° scan rotation, 70° sample tilt, accelerating voltage of 10.0 KeV, 10.0 mm working distance, and a 120 μm aperture. EBSD mapping utilized a μm 0.5 step size.
Minerals 10 00244 g009
Figure 10. Secondary electron image of the growth surface of apatite which formed wholly in contact with betafite. Spots ad and associated Kikuchi patterns represent EBSD analyses performed at each spot. (a) Pattern with labeled orientation solution for inset-point pairs (ad). Red lines trace the indexed Kikuchi pattern for fluorapatite from the PDF-2 database (PDF 15-0876), with several of the strongest observed bands in bold and drawn for reference in (ad). No well-defined bands were observed that did not match the indexed fluorapatite pattern. Numerous other spots across this surface produced the same diffraction pattern and orientation. Apatite surface was imaged using a 15.0 KeV accelerating voltage, 10.0 mm working distance, and a 120 µm aperture in variable pressure mode at a chamber pressure of 25 Pa.
Minerals 10 00244 g010
Figure 11. Apatite U-Th-REE concentrations as derived from LA-ICP-MS normalized to CI chondrite of McDonough and Sun [29]. The black line represents the average trace element concentration in apatite from the Silver Crater Mine normalized to CI chondrite (n = 9), whereas the gray area represents the range of the dataset (Table S1).
Minerals 10 00244 g011
Figure 12. Plot of δ13C VPDB vs. δ18O VSMOW for calcite from Gibson Road East (Bear Lake), the Schickler Occurrence, the Silver Crater Mine, the Kelly Farm, Madagascar, and the Yates Mine (Table S2). Data points for Madagascan crustal carbonatite deposits include data from Ampandrandava, Benato, Sakamasy, Amboanevo, and Sakaravy [20]. Data for Madagascan localities and the Yates Mine are reported in Martin et al. [20] and Schumann et al. [21], respectively. The range for unaltered primary carbonatites (dashed box) is plotted from the dataset for global carbonatites given in Taylor et al. [31].
Minerals 10 00244 g012

