1. Introduction
The demand for accurate and reliable resource estimation in mining operations is growing rapidly, as it is advantageous to be able to obtain more readily information on the potential economic and environmental operability of commercial mines. This requires the use of different sensor technologies for raw material characterization. Each sensor technology operates over a certain range of the electromagnetic spectrum, associated with a subset of molecules or chemical structures of potential interest for mining extraction. However, a single sensor might not provide a sufficiently comprehensive description of a material’s composition. This introduces uncertainty into both resource estimation and defining requirements for mineral processing. Thus, it is necessary to utilize strategic sensor combinations to improve accuracy, minimize uncertainty, and enhance specific inferences for raw material characterization.
Sensor technologies may be integrated physically or digitally (through data fusion). Physical integration is achieved when two or more sensors are combined on a single platform. For example, Sharma et al. [
1] integrated a remote-laser-induced breakdown spectroscopy (LIBS) and Raman system for analysis of minerals (e.g., carbonates, sulphates, iron oxides) with a single 532 nm laser. The integrated system was capable of simultaneously providing elemental and mineralogical information. Fernández et al. [
2] physically integrated RGB and multispectral imagery sensors for an improved classification of the Cabernet Sauvignon grapevine elements. Hoehse et al. [
3] demonstrated the utility of mapping heterogeneous minerals using a single unified LIBS and Raman setup for a combined analysis of molecular and elemental information that resulted in a comprehensive material characterization.
Data fusion is a process of integrating data blocks from multiple sources or sensors into a single comprehensive model [
4]. It can be implemented using probabilistic descriptions of observations and processes. One such method is the Bayes’ rule, which is the most commonly employed method in robotics [
5] and military applications [
6]. However, when probabilistic methods are employed, a large number of probabilities needs to be specified, thus introducing inconsistencies into the specification of a consistent set of beliefs in terms of probability and model precision. Even though these limitations can be partially mitigated using alternative techniques, such as fuzzy logic [
7], this approach was not considered in the present study due to its high complexity.
Data fusion can also be implemented using chemometric techniques, which require the collected data to have a relatively high quality. This approach is widely applied in analytical chemistry and metabolomics [
8,
9,
10,
11,
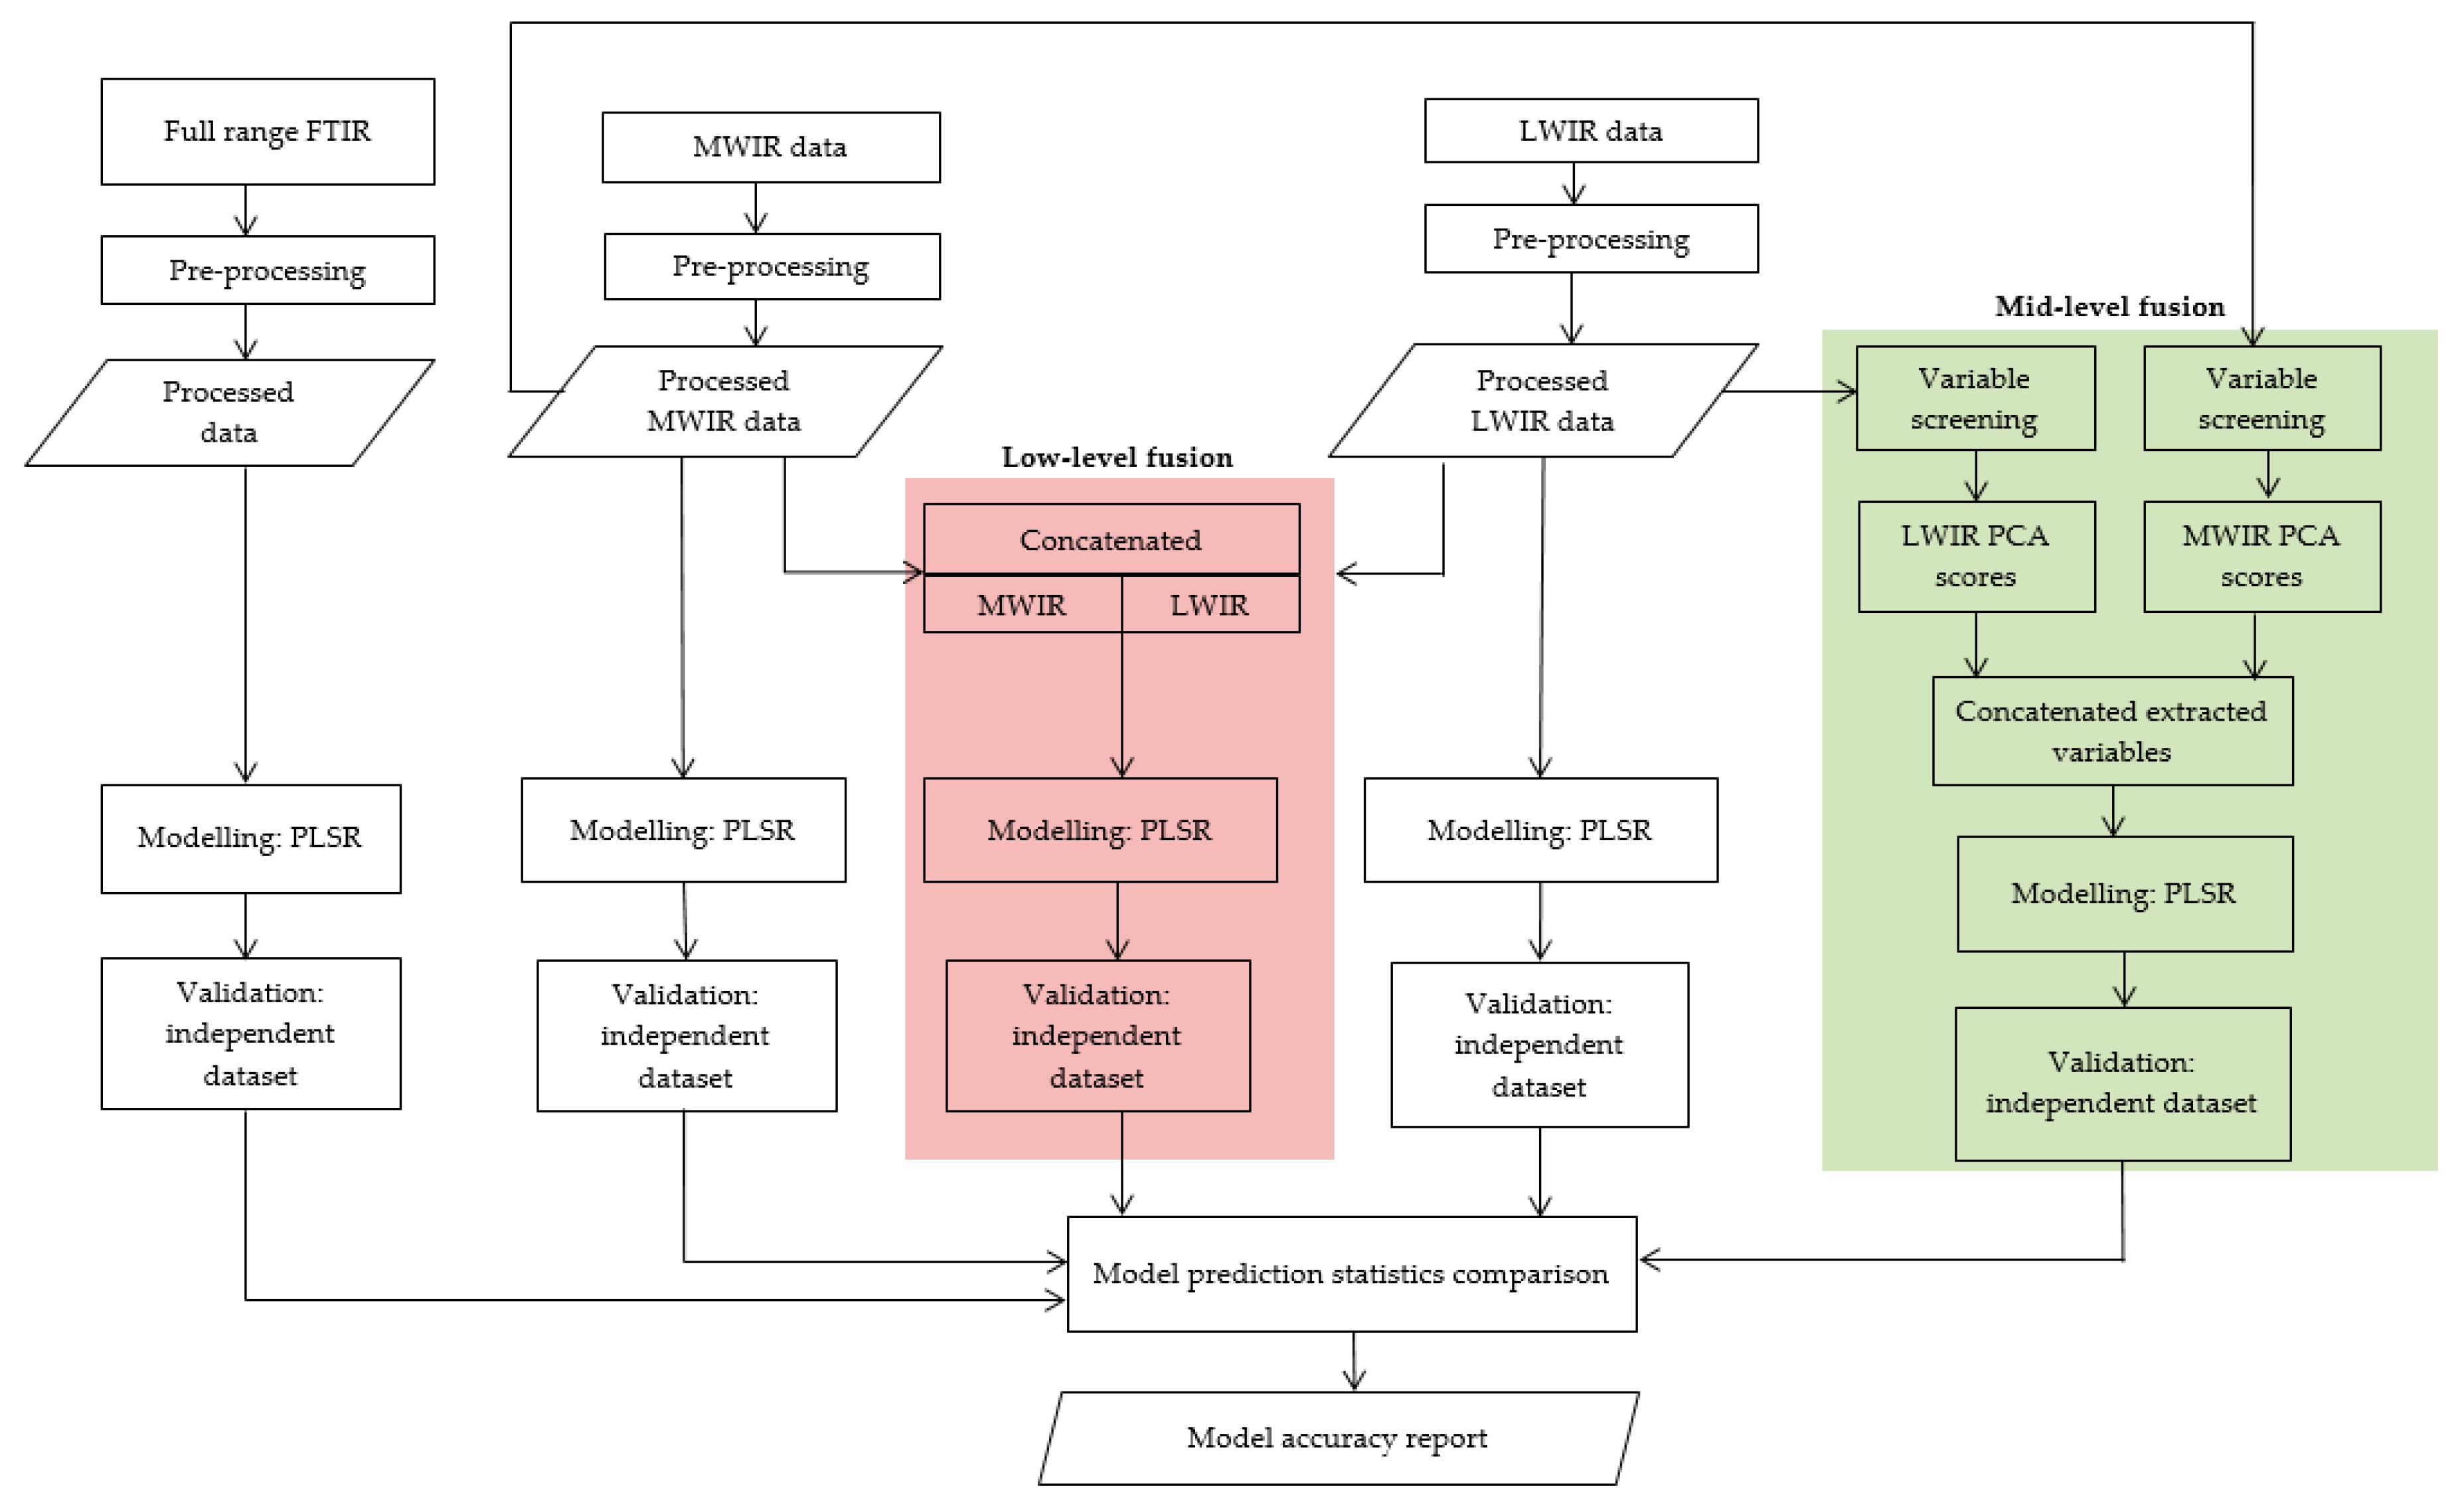
12]. Data fusion using chemometrics can be realized at three levels, designated as low-level, mid-level, and high-level fusion. Low-level data fusion involves the integration of multiple data sources by concatenating data blocks of different nature [
13,
14,
15]. In this approach, correlations among all variables collected in the different data blocks are considered. This results in a single matrix, which yields a single classification or prediction model. Mid-level or hierarchical data fusion is a feature-level fusion that involves variable screening [
9,
15]. Prior to the fusion process, important variables are extracted separately as features from each data source using decomposition (or resolution) or variables selection techniques [
16]. These features can subsequently be used in classification and prediction. One of the advantages of mid-level data fusion is that it reduces data dimensionality, thereby allowing for data blocks to be treated individually, avoiding the influence of other datasets. Mid-level data fusion, however, requires an optimal combination of extracted features that describe most of the variation in the data. Whereas both low- and mid-level data fusion methods combine the data sources at the data level, high-level data fusion is a decision-level fusion that combines model outputs to produce a final fused response. For each available block of data, separate models are developed and their individual responses are combined to produce a final fused response [
10].
Low-level data fusion has been widely used to authenticate the origin of foods and beverages and assess their quality. Available evidence indicates that low-level data fusion results in better prediction and classification models than individual techniques. For example, low-level data fusion has been shown to improve the quality assessment of wines [
17], the identification of the origin of olive oils [
18], the predictive model accuracy of the quality parameters of soybean flour [
19], and apples characterization [
20,
21], as well as to enhance the robustness in the discrimination of coffee varieties [
22]. Mid-level data fusion approaches have also been proven to be useful in a wide range of applications, such as in the identification of food fraud [
23], analysis of geographic traceability of soil samples [
11], and discrimination of different types of beer [
24,
25]. To date, high-level fusion has mainly been applied to classification tasks pertaining to, for example, fruit quality assessment [
24,
26] and identification of food fraud [
23]. Studies indicated that the use of data fusion for mineralogical investigations resulted in enhanced characterization of materials. For example, a low-level fusion of LIBS and visible/near-infrared (VNIR) data resulted in enhanced quantitative identification of hematite, magnetite, and quartz minerals in tailing slurries of an iron ore [
27]. However, at present, the application of data fusion using chemometrics for mineralogical investigations remains very limited.
Sensor technologies provide qualitative, quantitative, and semi-quantitative information on different aspects of material properties. Such information can be broadly categorized into geochemistry, mineralogy, and texture but is not limited to these attributes of materials. For example, technologies such as LIBS, X-ray fluorescence (XRF), and inductively coupled plasma optical emission spectrometry/mass spectrometry (ICP-ES/MS) provide qualitative and quantitative geochemical data, whereas infrared (IR) technologies (e.g., mid-wave infrared (MWIR) and long-wave infrared (LWIR)) measure the signals that result from the molecular bond vibrations of IR active minerals. Each molecule in the IR active minerals follows different vibrational modes such that the IR can be analyzed to acquire information on various minerals. Therefore, IR technologies provide mineralogical information, and from the different IR analytical methodologies, the choice of the IR region depends on the type of mineral under investigation. In this study, the MWIR and LWIR technologies that operate in the wavelength ranges of 2.5−7 µm and 7−15 µm, respectively, were considered. LWIR can provide accurate identification of rock-forming minerals [
28,
29]. The MWIR region of the electromagnetic spectrum is under-investigated due to limited instrumental development. However, recent studies [
30,
31] showed that the MWIR region of the electromagnetic spectrum has a good potential for the characterization of materials.
Infrared spectroscopy is a well-known analytical technique that responds to the concentration of the analyte. The measurements include instrumental artefacts, which are generally compensated for by data pre-processing. Pre-processing techniques generally use very simple models, based on first principles knowledge, to digitally remove such artefacts. However, it has proven to be very challenging to find the (most) optimal pre-processing technique for a dataset—i.e. that provides the best chemical predictions [
32]. Of specific interest in data fusion is, however, whether the pre-processing that is most effective on the dataset of one sensor is the same as for data collected with another sensor. As predictions based on spectroscopic data are generally performed with multivariate calibration that takes correlations between all variables into account, pre-processing may affect these correlations, both within data from one platform but also in data from different platforms.
Mineralogical techniques (MWIR and LWIR) have not been previously employed for the indication of element concentrations in polymetallic sulphide ore. This gap in the current analytical approaches and the promising findings reported recently [
30] have motivated the present study. The objective of this investigation was twofold: to develop prediction models that indicate the elemental concentration in polymetallic sulphide ore using the mineralogical techniques (i.e., MWIR and LWIR reflectance spectral data) separately, and to assess the improvements in the predictive models using low-level and mid-level data fusion approaches.
4. Results and Discussion
This section consists of seven parts. In the first two, the exploratory data analysis results and the results of the MWIR and LWIR prediction models are presented. In the subsequent two parts, the results of the low-level and mid-level data fusion for the prediction of element concentrations are described in detail. In the remaining three parts, the comparisons of the adopted approaches, assessment of IR spectra usability for prediction of elemental concentrations, and benefits and limitations of the current approach for in-situ applications are discussed, respectively.
4.1. Exploratory Data Analysis and Pre-processing
Descriptive statistics were used in the present study to describe and summarize the basic features of the elemental concentrations in the analyzed samples (
Table 1). The results reported in
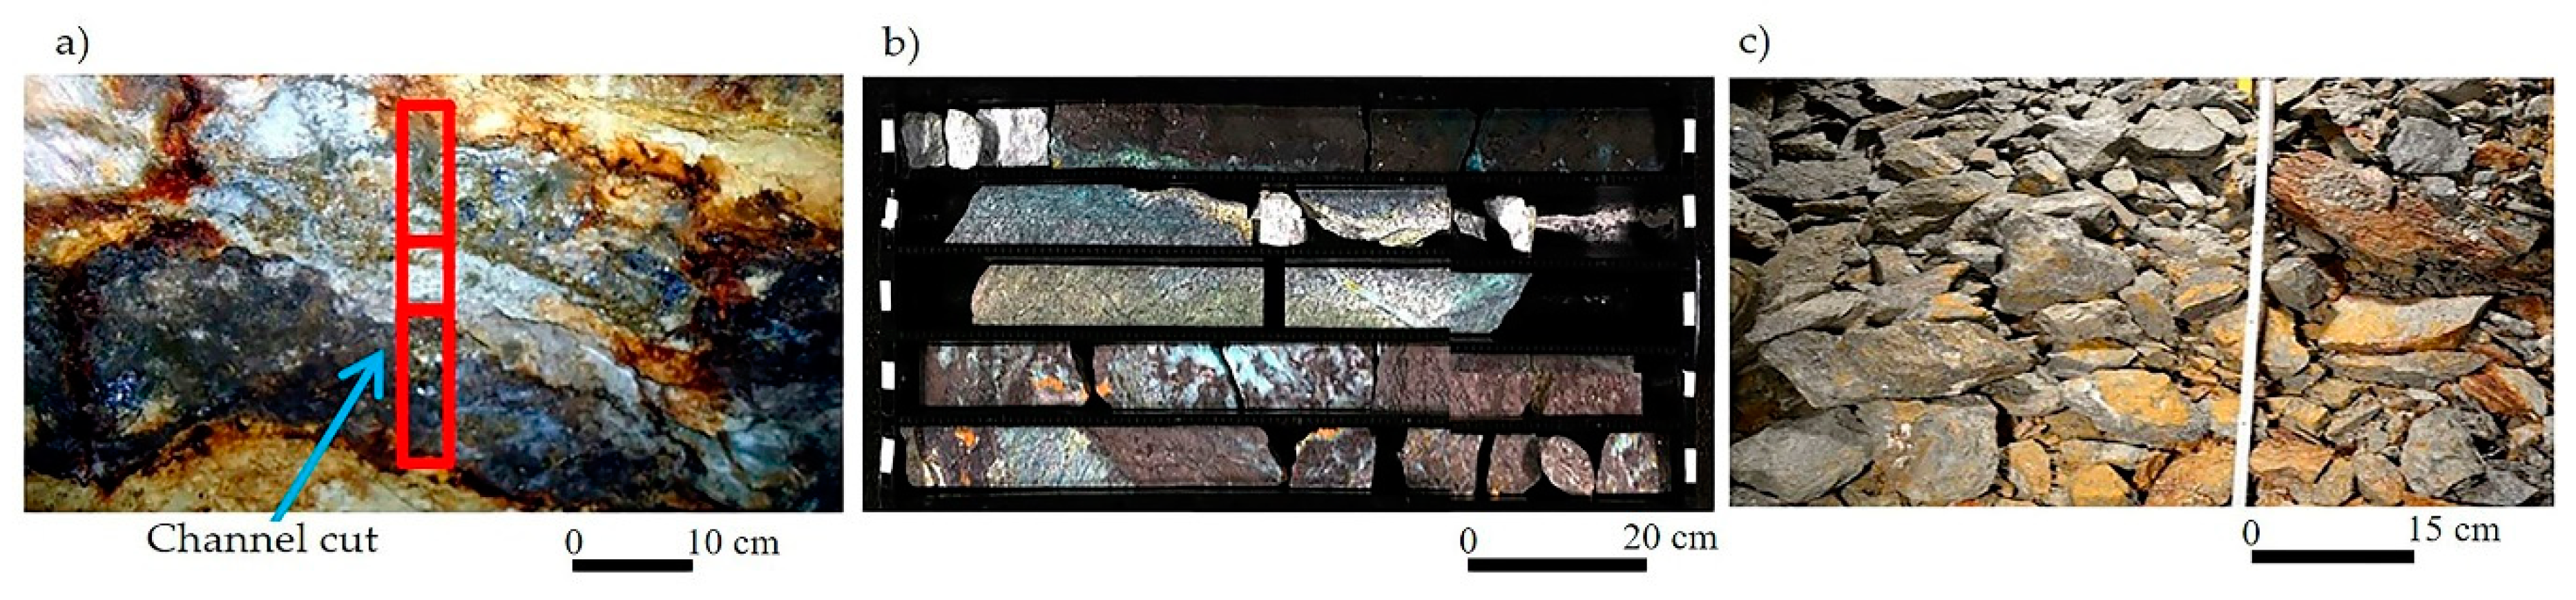
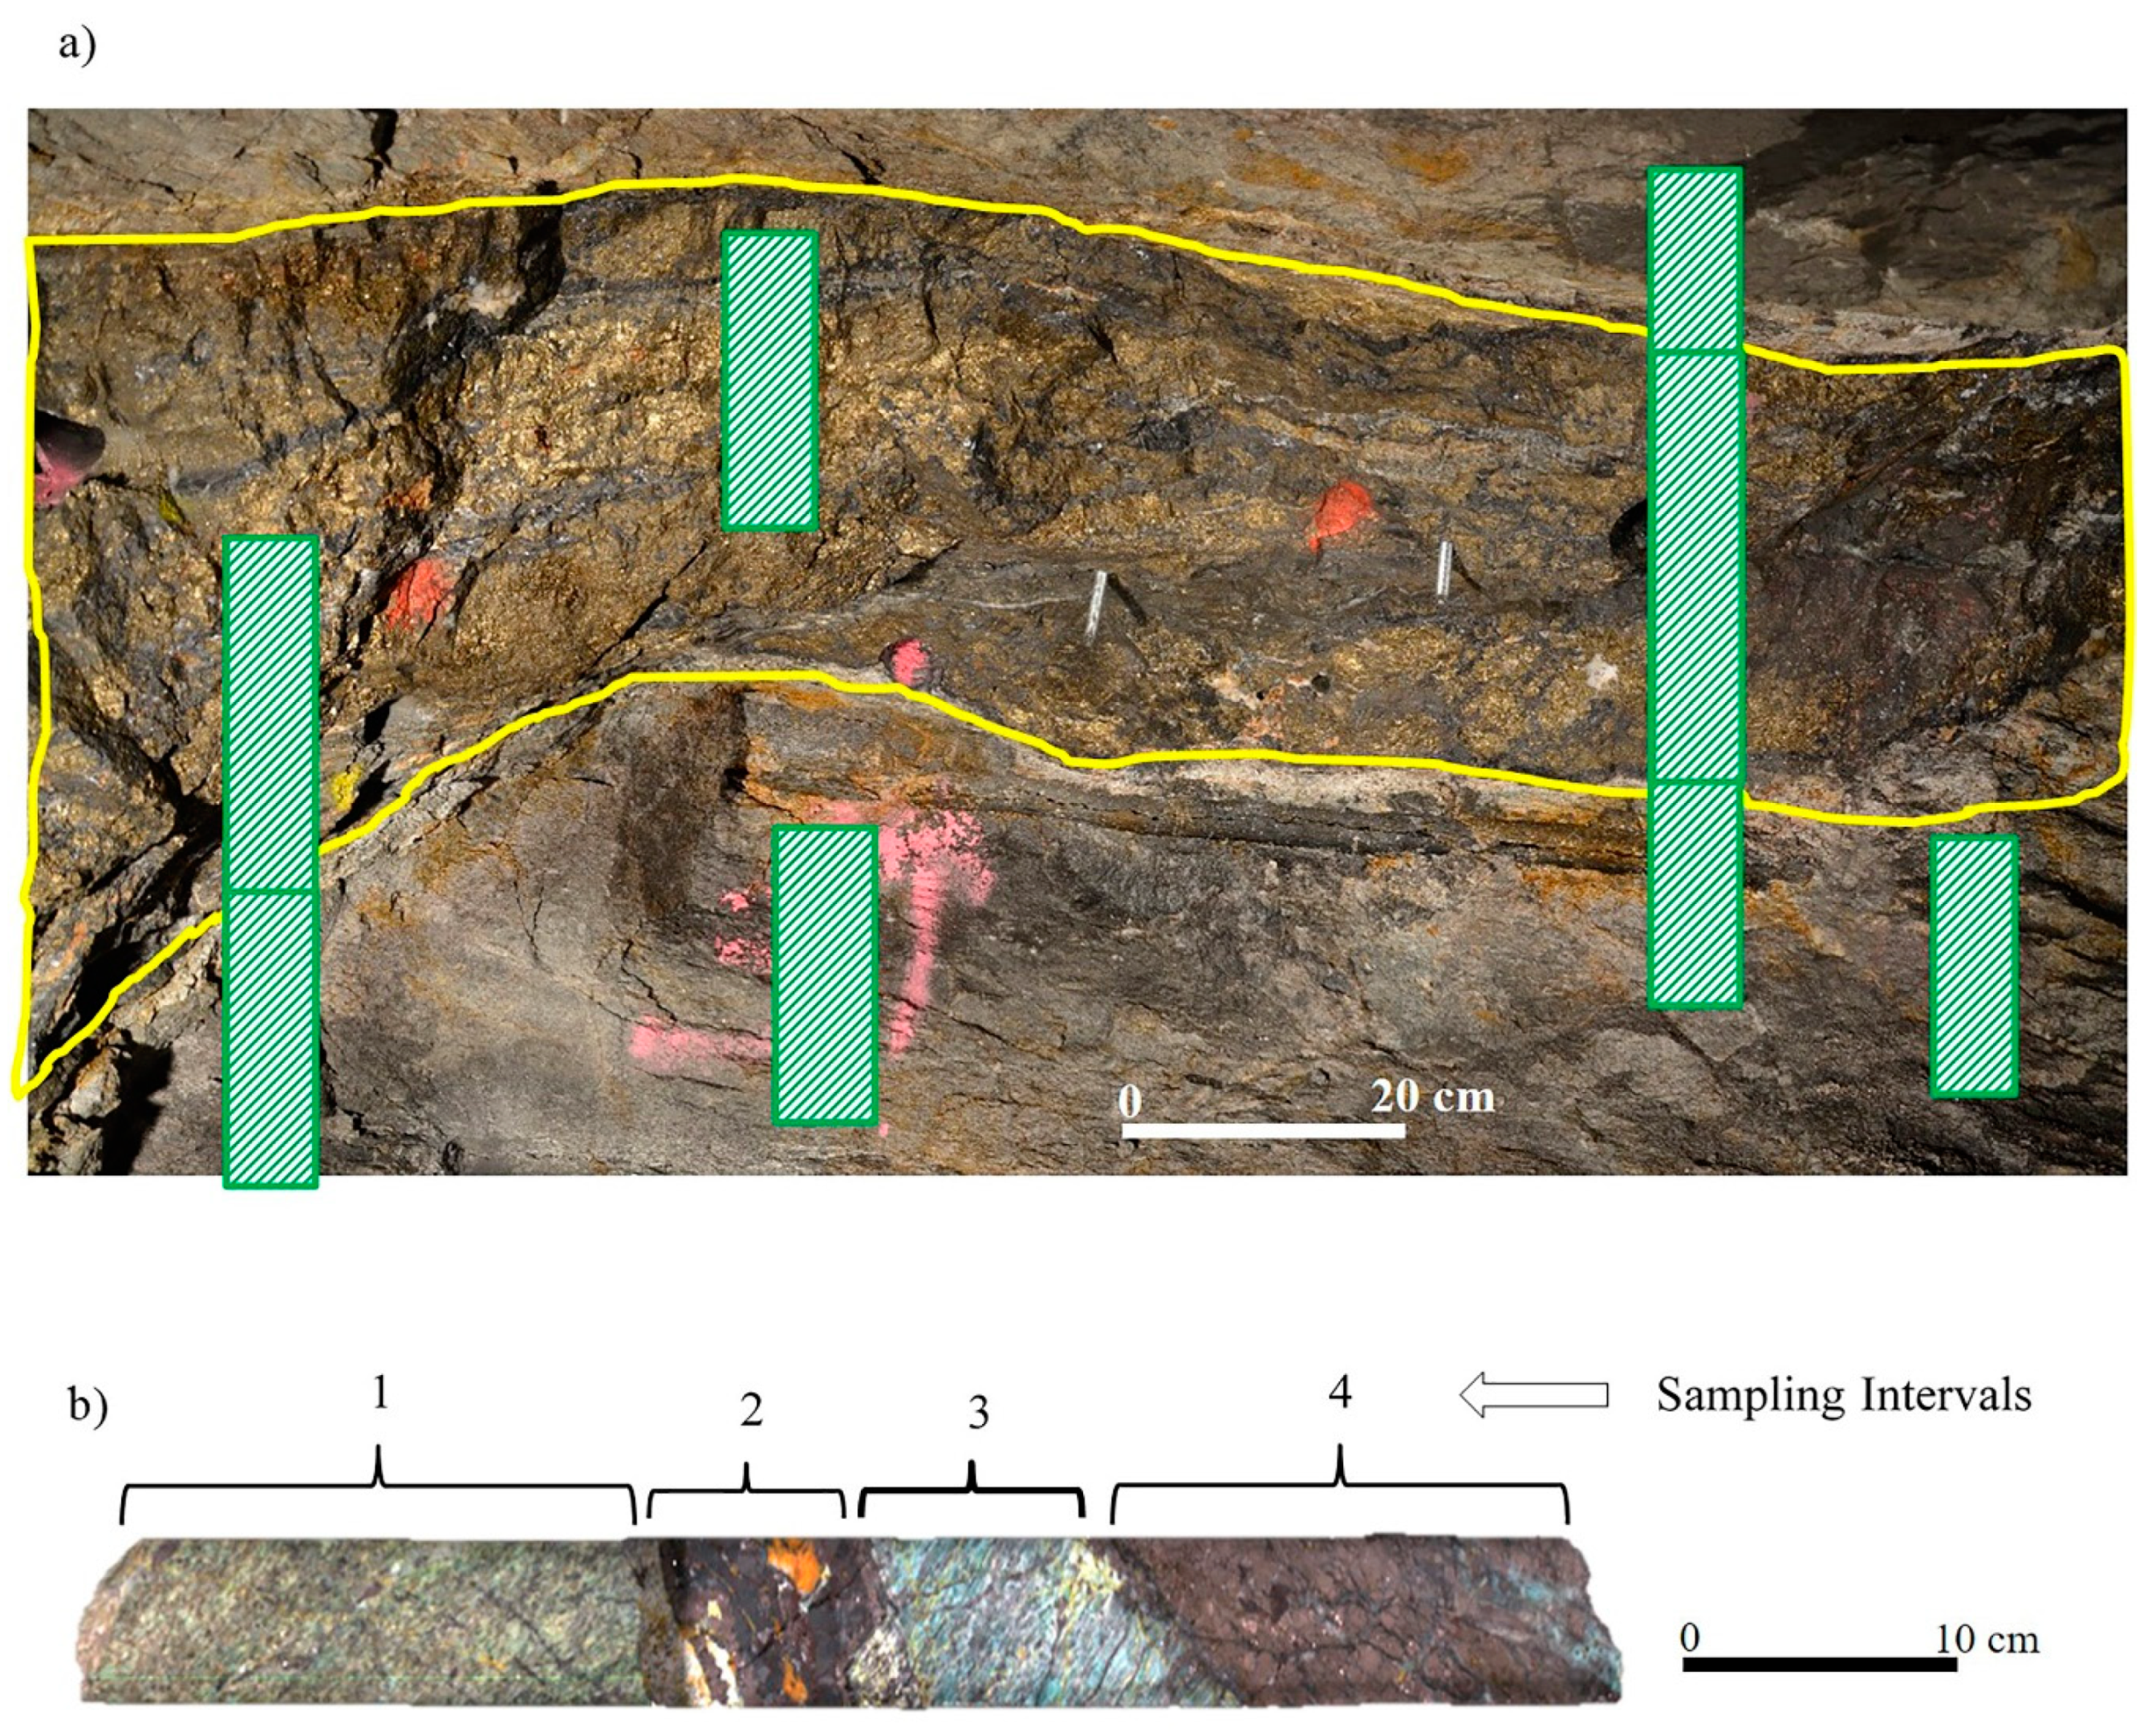
Table 1 indicate that the samples exhibit high variability in elemental concentrations. This likely stems from the sample collection strategy, whereby the ore zone region and waste (host rock and weathered) material were obtained to ensure material representativity (
Figure 3). However, variability was also observed within the ore material.
As shown in
Table 2, the use of the IR spectra for the prediction of the As, Cu, Ca, and Mg concentrations resulted in lower R
2 values (<0.4). Therefore, these elements were excluded from further analysis. Conversely, Fe and the combined Pb–Zn concentration showed a strong association (linear relationship) with the IR reflectance data. Therefore, the analysis results presented in this and the subsequent sections focus on Fe and the combined Pb–Zn only. The lower relationships of As, Cu, Ca, and Mg with the IR reflectance spectra are likely attributed to the lower concentration of the sourcing minerals in the samples that resulted in a lower spectral signal. It is also possible that the concentration of the sourcing minerals was below the detection limit of the instrument, or that the spectral signals of the sourcing minerals in the IR reflectance spectra were very weak.
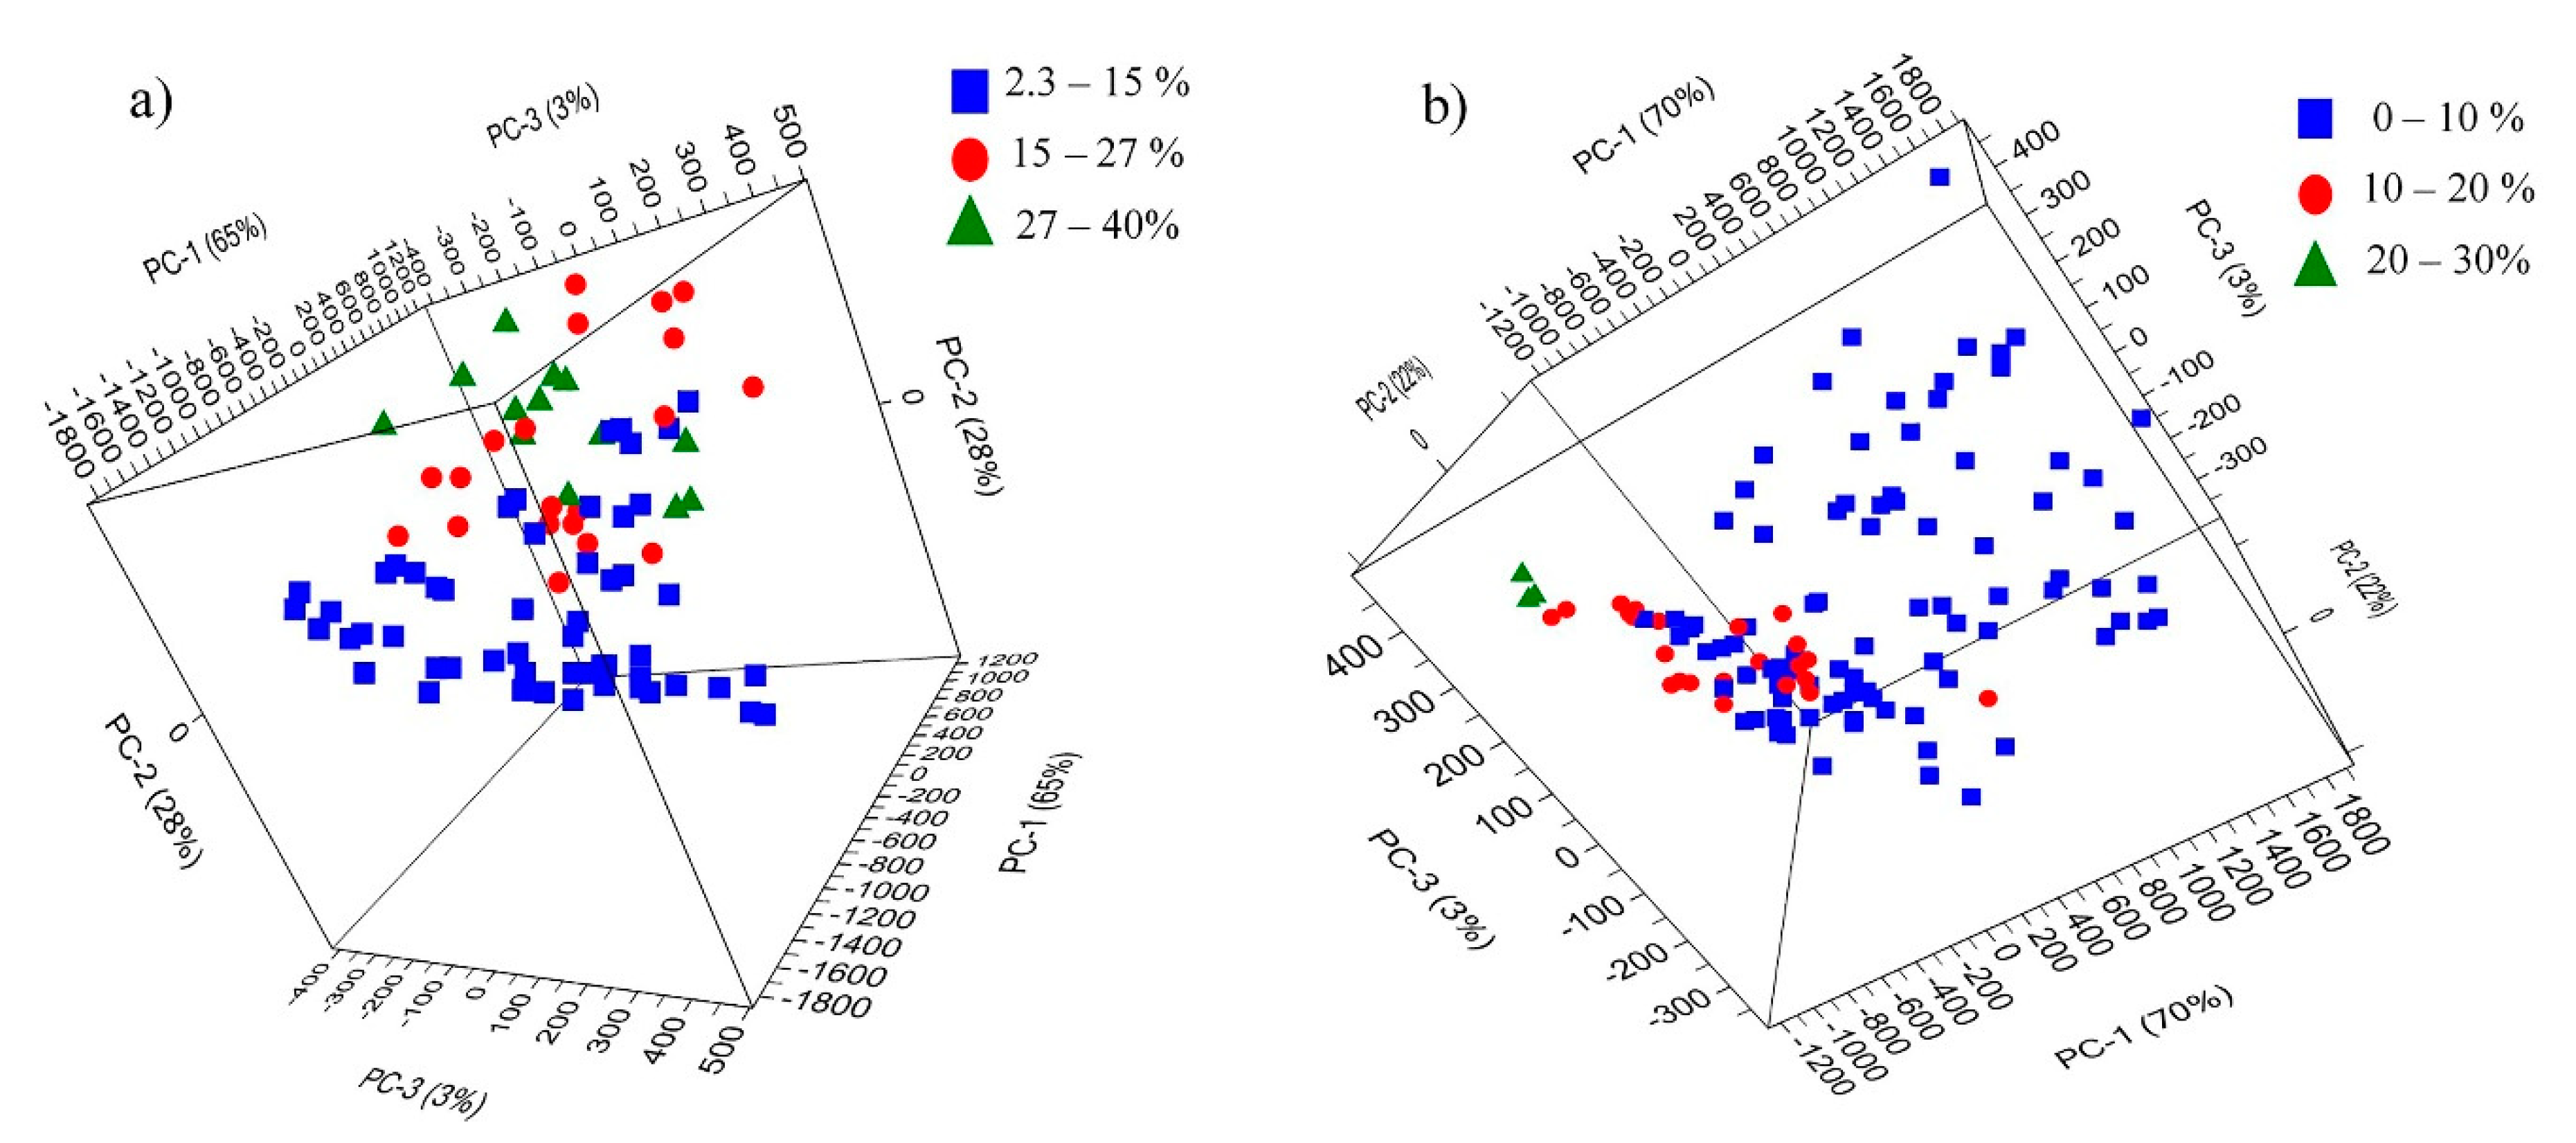
Figure 4 shows the PCA model score plots of the full-range FTIR data for Fe and the combined Pb–Zn datasets. The plots provide information on the potential patterns that are related to elemental concentration. As shown in
Figure 4, elemental concentrations (Fe and the combined Pb–Zn) were categorized into three ranges. The plots further reveal the presence of patterns that can be related to the elemental concentration. Potential outliers were identified. As a result, two outliers were excluded from the Fe dataset, whereas four outliers were excluded from the combined Pb–Zn dataset.
4.2. MWIR and LWIR Datasets
As shown in
Table 3, the model based on the MWIR dataset yields a better Fe prediction, with the RMSEP of 4.80 and the R
2 value of 0.69, after data normalization. Compared with the model performance based on raw MWIR data (the RMSEP of 5.63 and the R
2 of 0.58), data filtering using normalization improved the results. Likewise, the model developed using the normalized LWIR data resulted in RMSEP = 3.38 and R
2 = 0.85, which is a remarkable improvement relative to the RMSEP = 4.59 and the R
2 = 0.72 obtained using the raw LWIR data. Therefore, for Fe prediction, data normalization resulted in a better prediction performance for both MWIR and LWIR models. This shows that the removal of the undesired intensity variation in the spectra caused by multiplicative effects enhances the signals from the Fe-bearing minerals. Comparing the two datasets in terms of Fe prediction, the LWIR data model is superior to the MWIR model. The Fe-bearing minerals include oxides (e.g., hematite, goethite), carbonates (e.g., siderite), sulphides (e.g., pyrite, chalcopyrite), and silicates (pyroxene, olivine). LWIR is suited for rock-forming mineral and carbonate identification [
28,
29,
41]. This is likely one of the reasons for the better prediction of Fe concentration based on the LWIR relative to MWIR data. The other possible reason is the presence of certain minerals that have a good correlation with both IR spectra and Fe concentration but do not contain Fe. For example, minerals formed as a result of retrogressive mineralization during hydrothermal events have a high chance of correlation.
Model performance in terms of predicting the combined Pb–Zn concentration using MWIR and LWIR data is summarized in
Table 4. The model based on the MWIR data yielded a better prediction after the data were treated using baseline correction (RMSEP = 2.23 and R
2 = 0.83). The model prediction accuracy obtained using raw MWIR data was lower than that based on the pre-processed data (RMSEP = 2.46 and R
2 = 0.80). The prediction accuracy of the model based on the LWIR data treated using baseline correction is reflected in RMSEP = 3.25 and R
2 = 0.65. As shown in
Table 4, a better prediction was attained using the LWIR data subjected to baseline correction. A combination of the pre-processing techniques was analyzed for the prediction of both Fe and the combined Pb–Zn concentrations. However, the prediction performances of the models were not improved; thus, the results were not included in this paper.
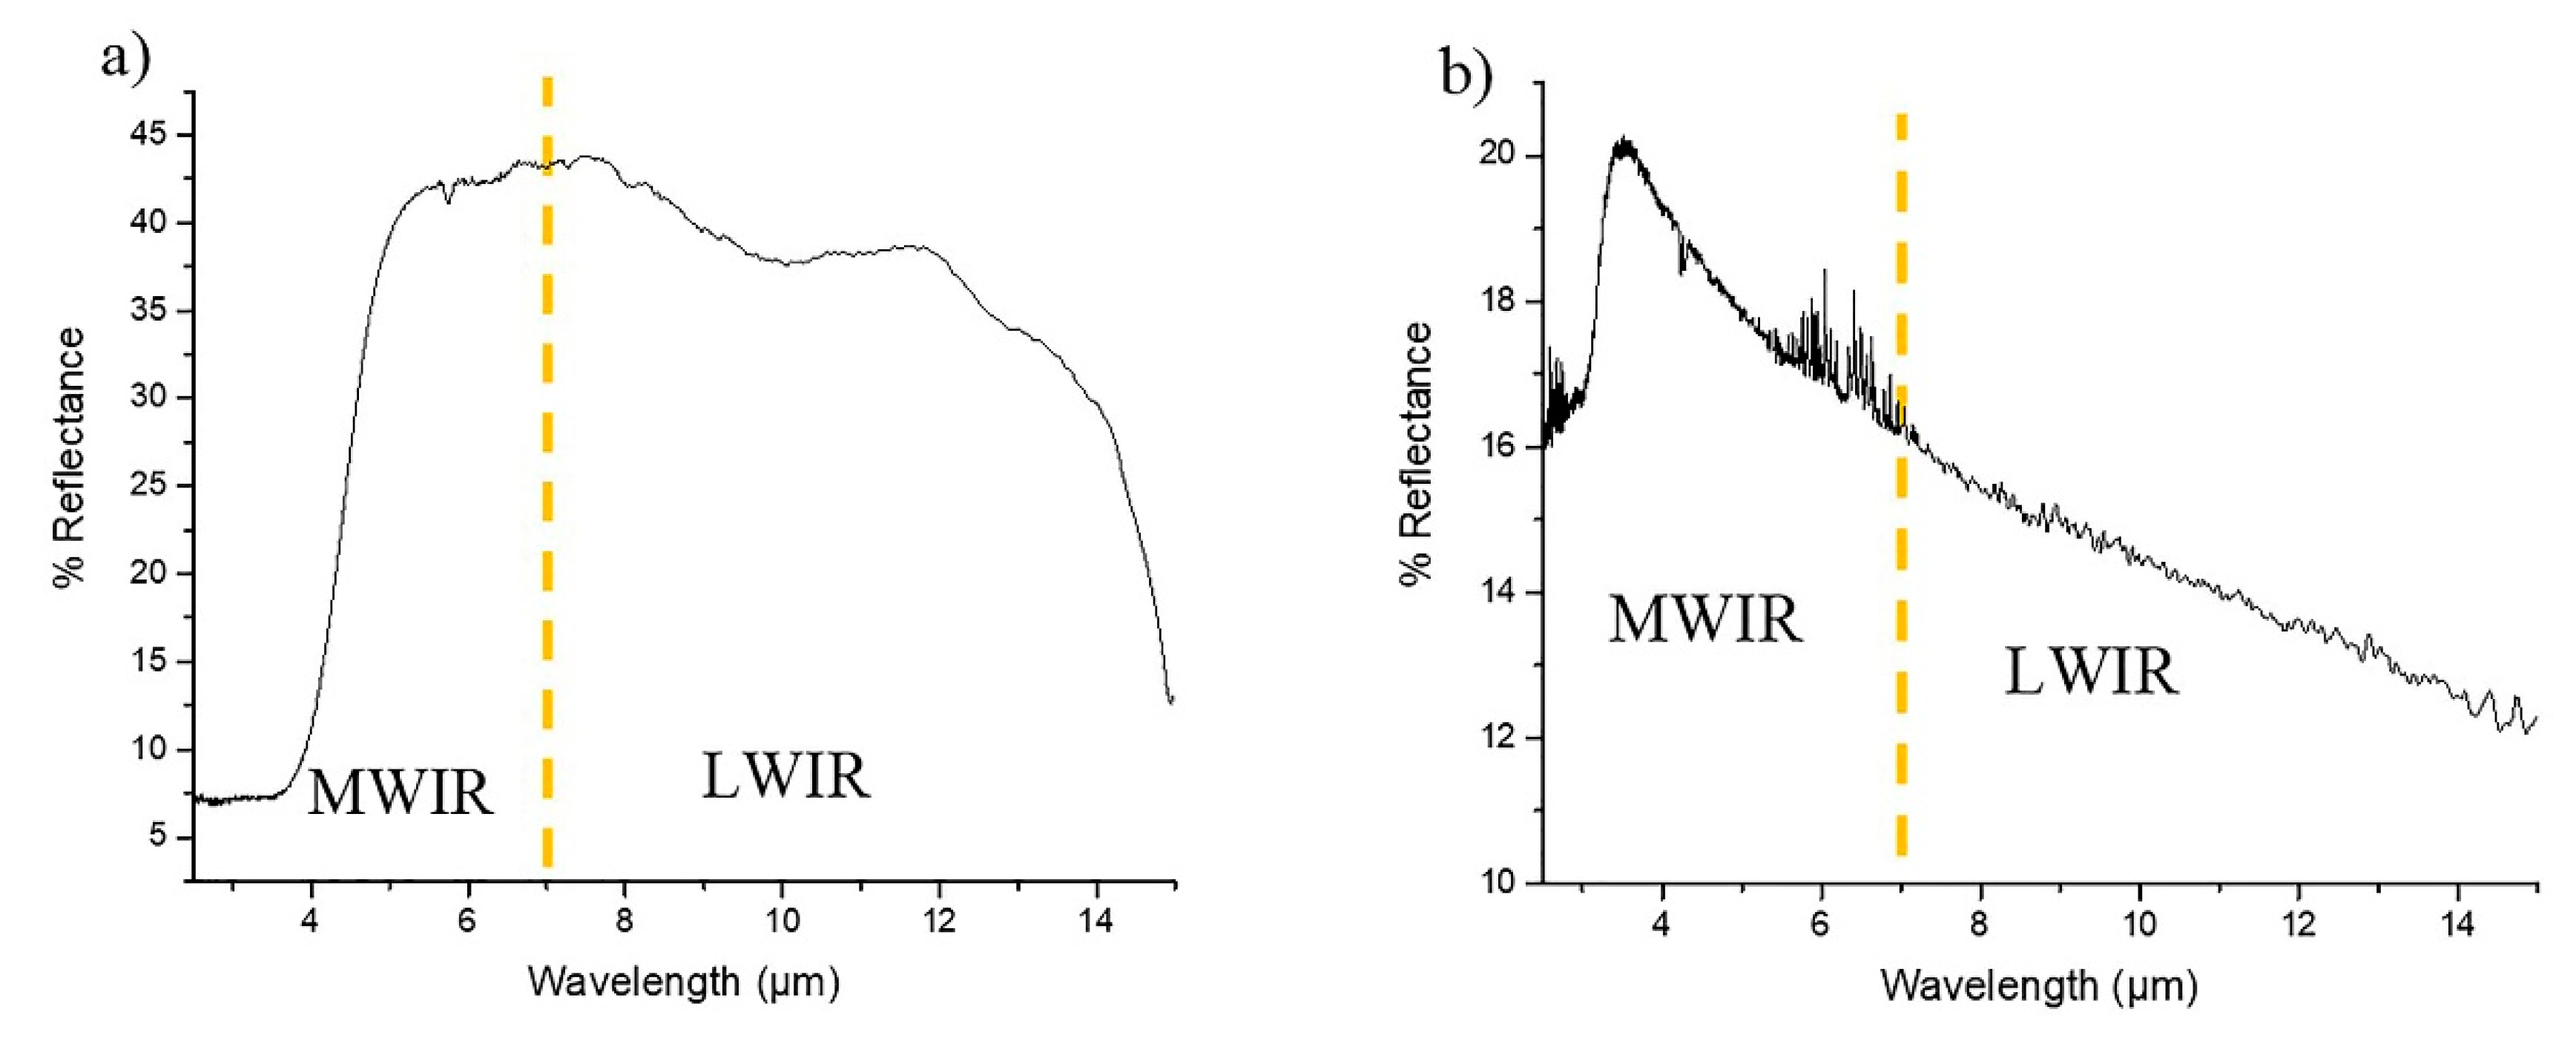
Comparing the model performance in terms of the combined Pb–Zn concentration prediction, the model based on the MWIR data is superior to that using the LWIR data. The primary mineral sources of Pb and Zn in the test case deposit are galena and sphalerite, respectively. This is one of the likely reasons for a better prediction of the combined Pb–Zn concentration using the MWIR data than the LWIR data. For example, sphalerite has a lower reflection pattern in the spectral data in the 2.33–3.78 µm range and at 14.9 µm [
42]. Similarly, for galena, higher reflection points are found in the MWIR region (
Figure 5). Therefore, the amount of spectral information (signals) in the MWIR dataset is greater (more pronounced) than in the LWIR dataset, resulting in a superior combined Pb–Zn concentration prediction yielded by the model based on MWIR data.
The elemental concentration prediction results yielded by the MWIR and LWIR models show that the IR technique is capable of indicating the concentration of elements in polymetallic sulphide ore semi-quantitatively. The IR technique is a mineralogical technique that provides information on the functional groups of minerals. Thus, elemental information cannot directly be derived from the IR spectra. However, the acquired results show that an indicative elemental concentration can be estimated using multivariate techniques without directly examining the fingerprint of individual elements in the IR spectral signals. The results of the present study indicate that MWIR data are a promising candidate for prediction of combined Pb–Zn concentrations. Thus, MWIR has great potential for use in material characterization.
The models developed using MWIR and LWIR data explained the variations in the Y-variables (concentration of elements) from the variations in the X-variables (reflectance spectral data), and resulted in acceptable prediction model accuracies. The model based on the MWIR data yielded a better prediction of the combined Pb–Zn concentration than that based on the LWIR data, whereas the Fe concentration was more accurately predicted using LWIR rather than MWIR data. Based on the available spectral libraries (e.g., the NASA mineral library), the sulphide minerals showed weak spectral features in the MWIR and LWIR spectral data. Such weak spectral information (signal) is insufficient for a direct interpretation or mineral fingerprinting, especially when target minerals are present in a mixture (co-occurring with other minerals). Moreover, the IR sensors provide mineralogical information but cannot directly identify the elements in the spectral signal. However, such information can be extracted using multivariate data analysis techniques.
4.3. Low-level Data Fusion
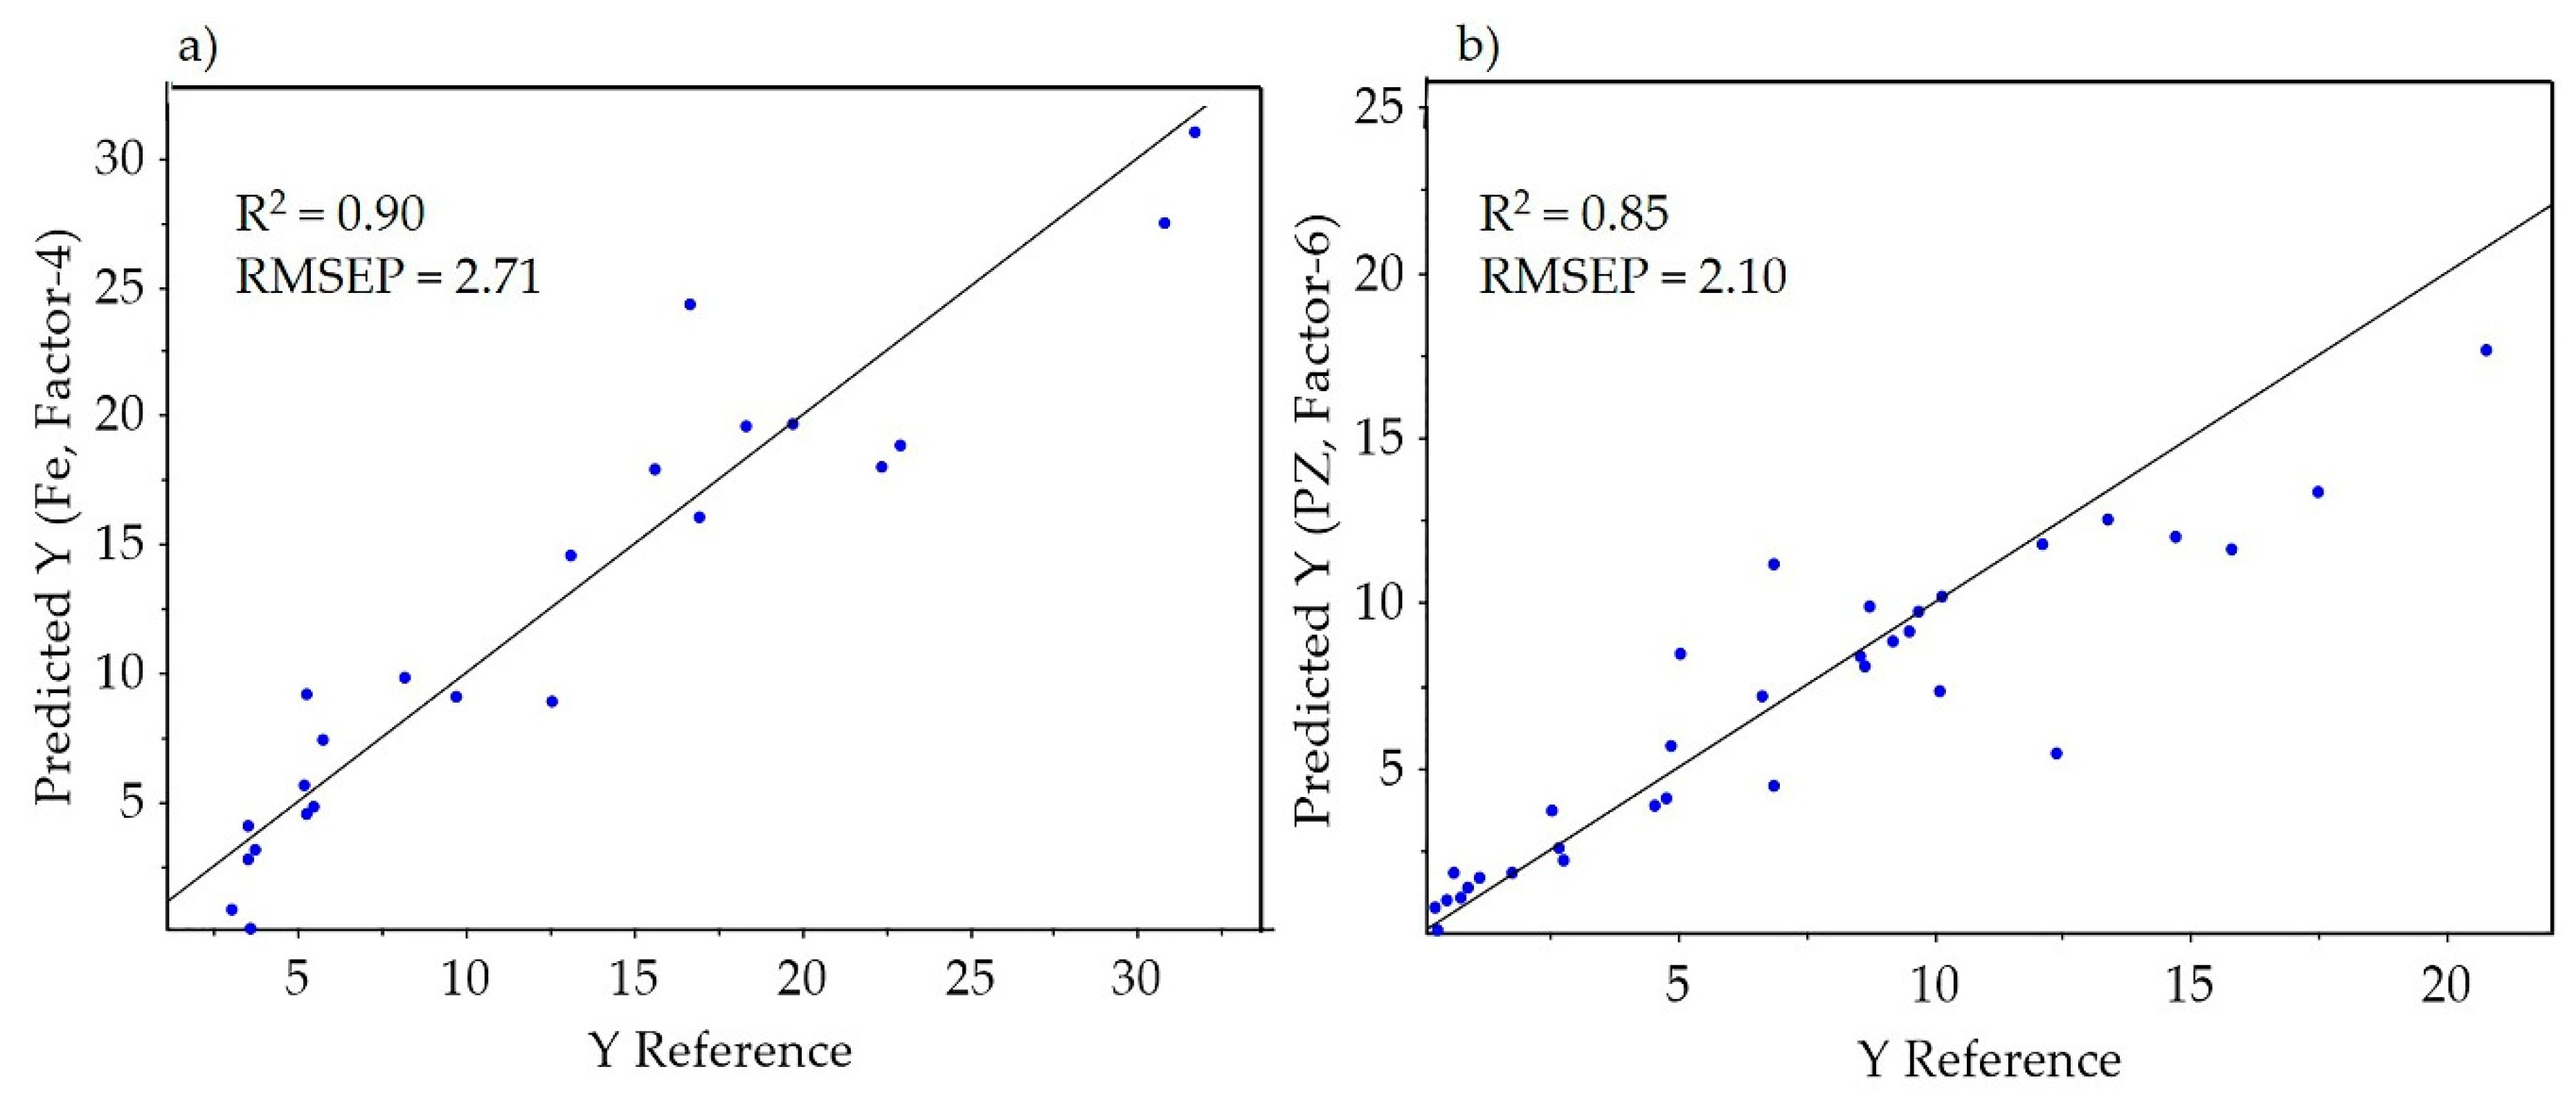
Table 3 shows a summary of the Fe prediction model performance when applied to the individual data blocks, full-range FTIR data, and low-level data fusion results. As shown in
Table 3 and
Figure 6, better model performance was achieved using low-level data fusion (RMSEP = 2.71 and R
2 = 0.90) after the normalized data blocks based on the MWIR and LWIR datasets were fused.
As described in
Section 2.1.2, the MWIR and LWIR datasets were acquired using a single-sensor FTIR spectrometer, which allowed for the performance of models based on the full-range FTIR data (which include both MWIR and LWIR datasets) to be assessed and compared to the low-level fusion results. This was done to test whether the low-level data fusion approach yielded superior results to those based on the full-range data. Though the performance of the prediction models based on the full-range FTIR data was better than that obtained using the individual datasets (
Table 3 and
Table 4), the prediction performance acquired from the low-level data fusion (after data block normalization) was superior to that acquired from the full-range FTIR data model. Similarly, the combined Pb–Zn prediction using a low-level data fusion was better than the results obtained using the individual and the full-range FTIR data (
Table 4).
The portable full-range FTIR sensor is an example of a physically integrated MWIR and LWIR sensor. This is an interesting achievement of the current advancement of IR technologies. The performance of the prediction models based on the full-range FTIR data was better than that obtained using the individual datasets. However, the results of this study suggest data fusion to be a better and comparative option for a combination of multiple sensors. Moreover, the physical integration of multiple sensor technologies into a single platform is challenging and, in terms of practical implementation, it is expensive. Therefore, for the integration of multiple data sources, such as short-wave infrared (SWIR), Raman, and LWIR data (provided each sensor technology has its own advantages in providing useful information), data fusion can be considered to be an economic and practical alternative option.
The Fe and the combined Pb–Zn concentrations yielded by the low-level data fusion approach were highly affected by the choice of pre-processing technique. This is in line with the recommended “systematic approach” [
32]. The normalization of the two data blocks prior to data fusion resulted in a better prediction of Fe concentration, whereas baseline correction resulted in a better model prediction for the combined Pb–Zn concentration. The MWIR and LWIR data considered in this study were acquired using a single instrument, thus ensuring that the data scale difference is not an issue. However, treating the noise in the two data blocks separately and fusing the pre-processed data blocks enhanced the prediction performance of the PLSR models.
In low-level data fusion, as the name suggests, data integration occurs at the bottom of the analytical data flow. Indeed, this strategy implies that the matrices describing the individual blocks, after proper pre-processing, are concatenated to build a fused data block, which is then processed by the desired chemometrics technique. Suppose X denotes an m x n matrix of independent variables, where m is the number of samples and n is the number of MWIR and LWIR wavelengths together. Y (m p) is the matrix of dependent variables, where p denotes the elements to be predicted. The purpose is to train a model estimating the concentration of the elements in each polymetallic sulphide ore sample through the matrix of the measured spectra. The problem is formulated by constructing input (X) and output (Y) matrices. For example, the combined MWIR and LWIR reflectance for 89 samples is formed as X (89 7190) and the matrix of outputs for Fe will be Y (89 1). As the fusion occurs at the level of the original data matrices, the resulting data block will typically contain a very high number of variables. Consequently, the main drawback of this strategy is that the increase in information obtained by adding one or more blocks of data to describe the sample may not compensate for irrelevant variability introduced by the addition of the same blocks.
The PLSR model developed using the fused data blocks simultaneously considers the MWIR and LWIR measurements, due to which it takes advantage of having a greater number of informative explanatory variables to perform the elemental concentration prediction with better accuracy than that achieved by the models based on individual data blocks. Low-level fusion is conceptually simple to implement and the acquired results are superior to those yielded when using individual techniques. However, the prediction performance of the individual MWIR and LWIR data models also resulted in a good prediction potential for Fe and the combined Pb–Zn concentration. It is possible that the same minerals were measured in both datasets or the minerals were highly correlated to each other due to their co-occurrence in the deposit. However, the improvement of the predictive model after low-level data fusion implies that, as there is unique spectral information in both datasets, combining the two data blocks results in better prediction performance.
4.4. Mid-level Data Fusion
Feature selection is an important step in mid-level data fusion implementation. Hence, an attempt was made to ensure proper coverage of the existing variation in the reflectance spectra data. For example, for the prediction of the combined Pb–Zn concentration using the MWIR data treated with baseline correction, four PCs that explain 98% of the variance in the data were chosen. Similarly, five PCs that explain 97% of the variation in the data were chosen for the LWIR data treated with baseline correction. These PCs (four from the MWIR data block and five from the LWIR data block) were concatenated to generate the fused data matrix. Using the newly generated variable data matrices, final elemental concentration prediction models were developed by adopting PLSR.
As shown in
Table 5, for the prediction of the combined Pb–Zn concentration, better model performance was achieved (RMSEP = 3.05 and R
2 = 0.69) after baseline correction. For the Fe concentration prediction, a better model was achieved after the normalized data block features were fused (RMSEP = 5.09 and R
2 = 0.65). The acquired prediction performance of the models for estimation of the combined Pb–Zn concentration was good. However, model performance in terms of predicting the Fe concentration was lower (RMSEP = 5.09). Overall, the performance of the prediction models after mid-level data fusion was lower than that of the models employing individual techniques. Nonetheless, the acquired results are promising and can likely be improved by adding more data to the calibration dataset (thus to fully capture the high variability between the samples) or by considering other feature selection techniques.
In the mid-level data fusion approach, data reduction using variable screening is a pre-requisite. The data volume of the combined MWIR and LWIR datasets and the new data matrices generated from the extracted features have a significant difference. The combined MWIR and LWIR datasets contain 7190 variables, whereas the new data blocks generated from the extracted features included only seven to nine variables, depending on the amount of the explained variance from the score results of the PCA models. With feature extraction methods, the important information (informative variables in the spectral data) is retained using fewer variables than in the original data blocks (MWIR and LWIR datasets). This is an interesting point, since a large data volume (megavariate or multivariate data) may lead to several computational challenges and, due to the development of high-throughput instrumentation, complex datasets are increasingly becoming available.
The reflectance IR data likely contains a certain amount of noise (e.g., caused by instrument imprecision and/or measurement errors) and, in some instances, may include irrelevant information in the spectra (data that are unrelated to elemental concentrations). Therefore, treating the datasets with the data filtering techniques mentioned above improved the prediction accuracy of the models developed as a part of this study. Irrelevant information can also hinder the predictive ability of the available information; in this case, extracting the important variables can result in better prediction.
4.5. Data Fusion versus Individual Sensors
The prediction model performance based on the individual MWIR and LWIR datasets is favorable in terms of the elemental concentration (Fe and the combined Pb–Zn concentration) prediction accuracy. Owing to the fact that these mineralogical techniques are mainly used for qualitative analysis of mineralogical information, the results obtained in this study are encouraging, indicating that the potential of these techniques, especially the MWIR data, should be explored further, since it is the least-utilized region of the IR spectrum. The approach presented in this study is a data-driven approach as a part of which the hidden information in the spectral signal is transformed into a quantitative indication of elemental concentration.
Comparing the performance of the prediction models based on the individual techniques with the data fusion results, an improved prediction accuracy was achieved using a low-level data fusion approach. Low-level data fusion enhanced the reliability of the prediction models by increasing the prediction performance and minimizing the uncertainty implicit in each individual technique. Data fusion is effective in identifying the correlations and the similarities/differences (common and distinctive information) among different variables. However, if applied to correlated or noisy data blocks, data fusion might not necessarily improve model performance [
14]. In some cases, unnecessary information can also hinder model performance, due to which a better prediction can be achieved from individual data blocks than from the fused dataset.
The prediction performance of the models after low-level data fusion was superior to that yielded by the mid-level data fusion models. This is likely due to the fact that the original information from both data blocks (MWIR and LWIR) is maintained in low-level fusion, making it potentially more accurate. In mid-level data fusion, PCA potentially failed to describe all important variations in the data. However, this issue can be overcome by considering other data decomposition methods, such as multivariate curve resolutionalternating least squares (MCR-ALS) or independent component analysis (ICA). Review studies [
9] indicate that there is no preferred level of data fusion, as the choice is always application-dependent.
4.6. Use of Infrared Reflectance Spectra for Elemental Concentration Indication
Understanding the spatial variability in elemental concentration is crucial for strategic extraction of minable products in mining operations. The data-driven approach proposed in this study provides an insight into the quantifiable elemental concentrations in polymetallic sulphide ore using IR reflectance data. PLSR was used to relate the concentration of elements of interest with complex high-dimensional IR data to reveal hidden information in the spectra. Low-level data fusion resulted in better predictive performance of models than could be attained using models based on the individual techniques. This is likely due to the fact that the two data blocks (MWIR and LWIR) contain different chemical information that can be linked to the description of the sourcing minerals containing elements of interest. In addition, the comparable predictive performance of the MWIR and LWIR data models likely indicates the occurrence of similar chemical information as well. Therefore, the two techniques are complementary to each other.
The performance of the prediction models utilizing the MWIR, LWIR, and fused datasets indicates that prediction improves with higher Fe concentration in the samples. This is likely due to the fact that a higher Fe concentration in the samples results in a better spectral signal of the Fe sourcing minerals in the datasets. Thus, a better linear relationship can be established with the IR spectra. Conversely, for the combined Pb–Zn concentration prediction, a lower concentration of these elements was better described by the models. However, the higher the Pb–Zn concentration in the samples, the lower its description by the models, likely due to higher reflectance variation, as more samples are needed in the calibration data to obtain a better description by the models.
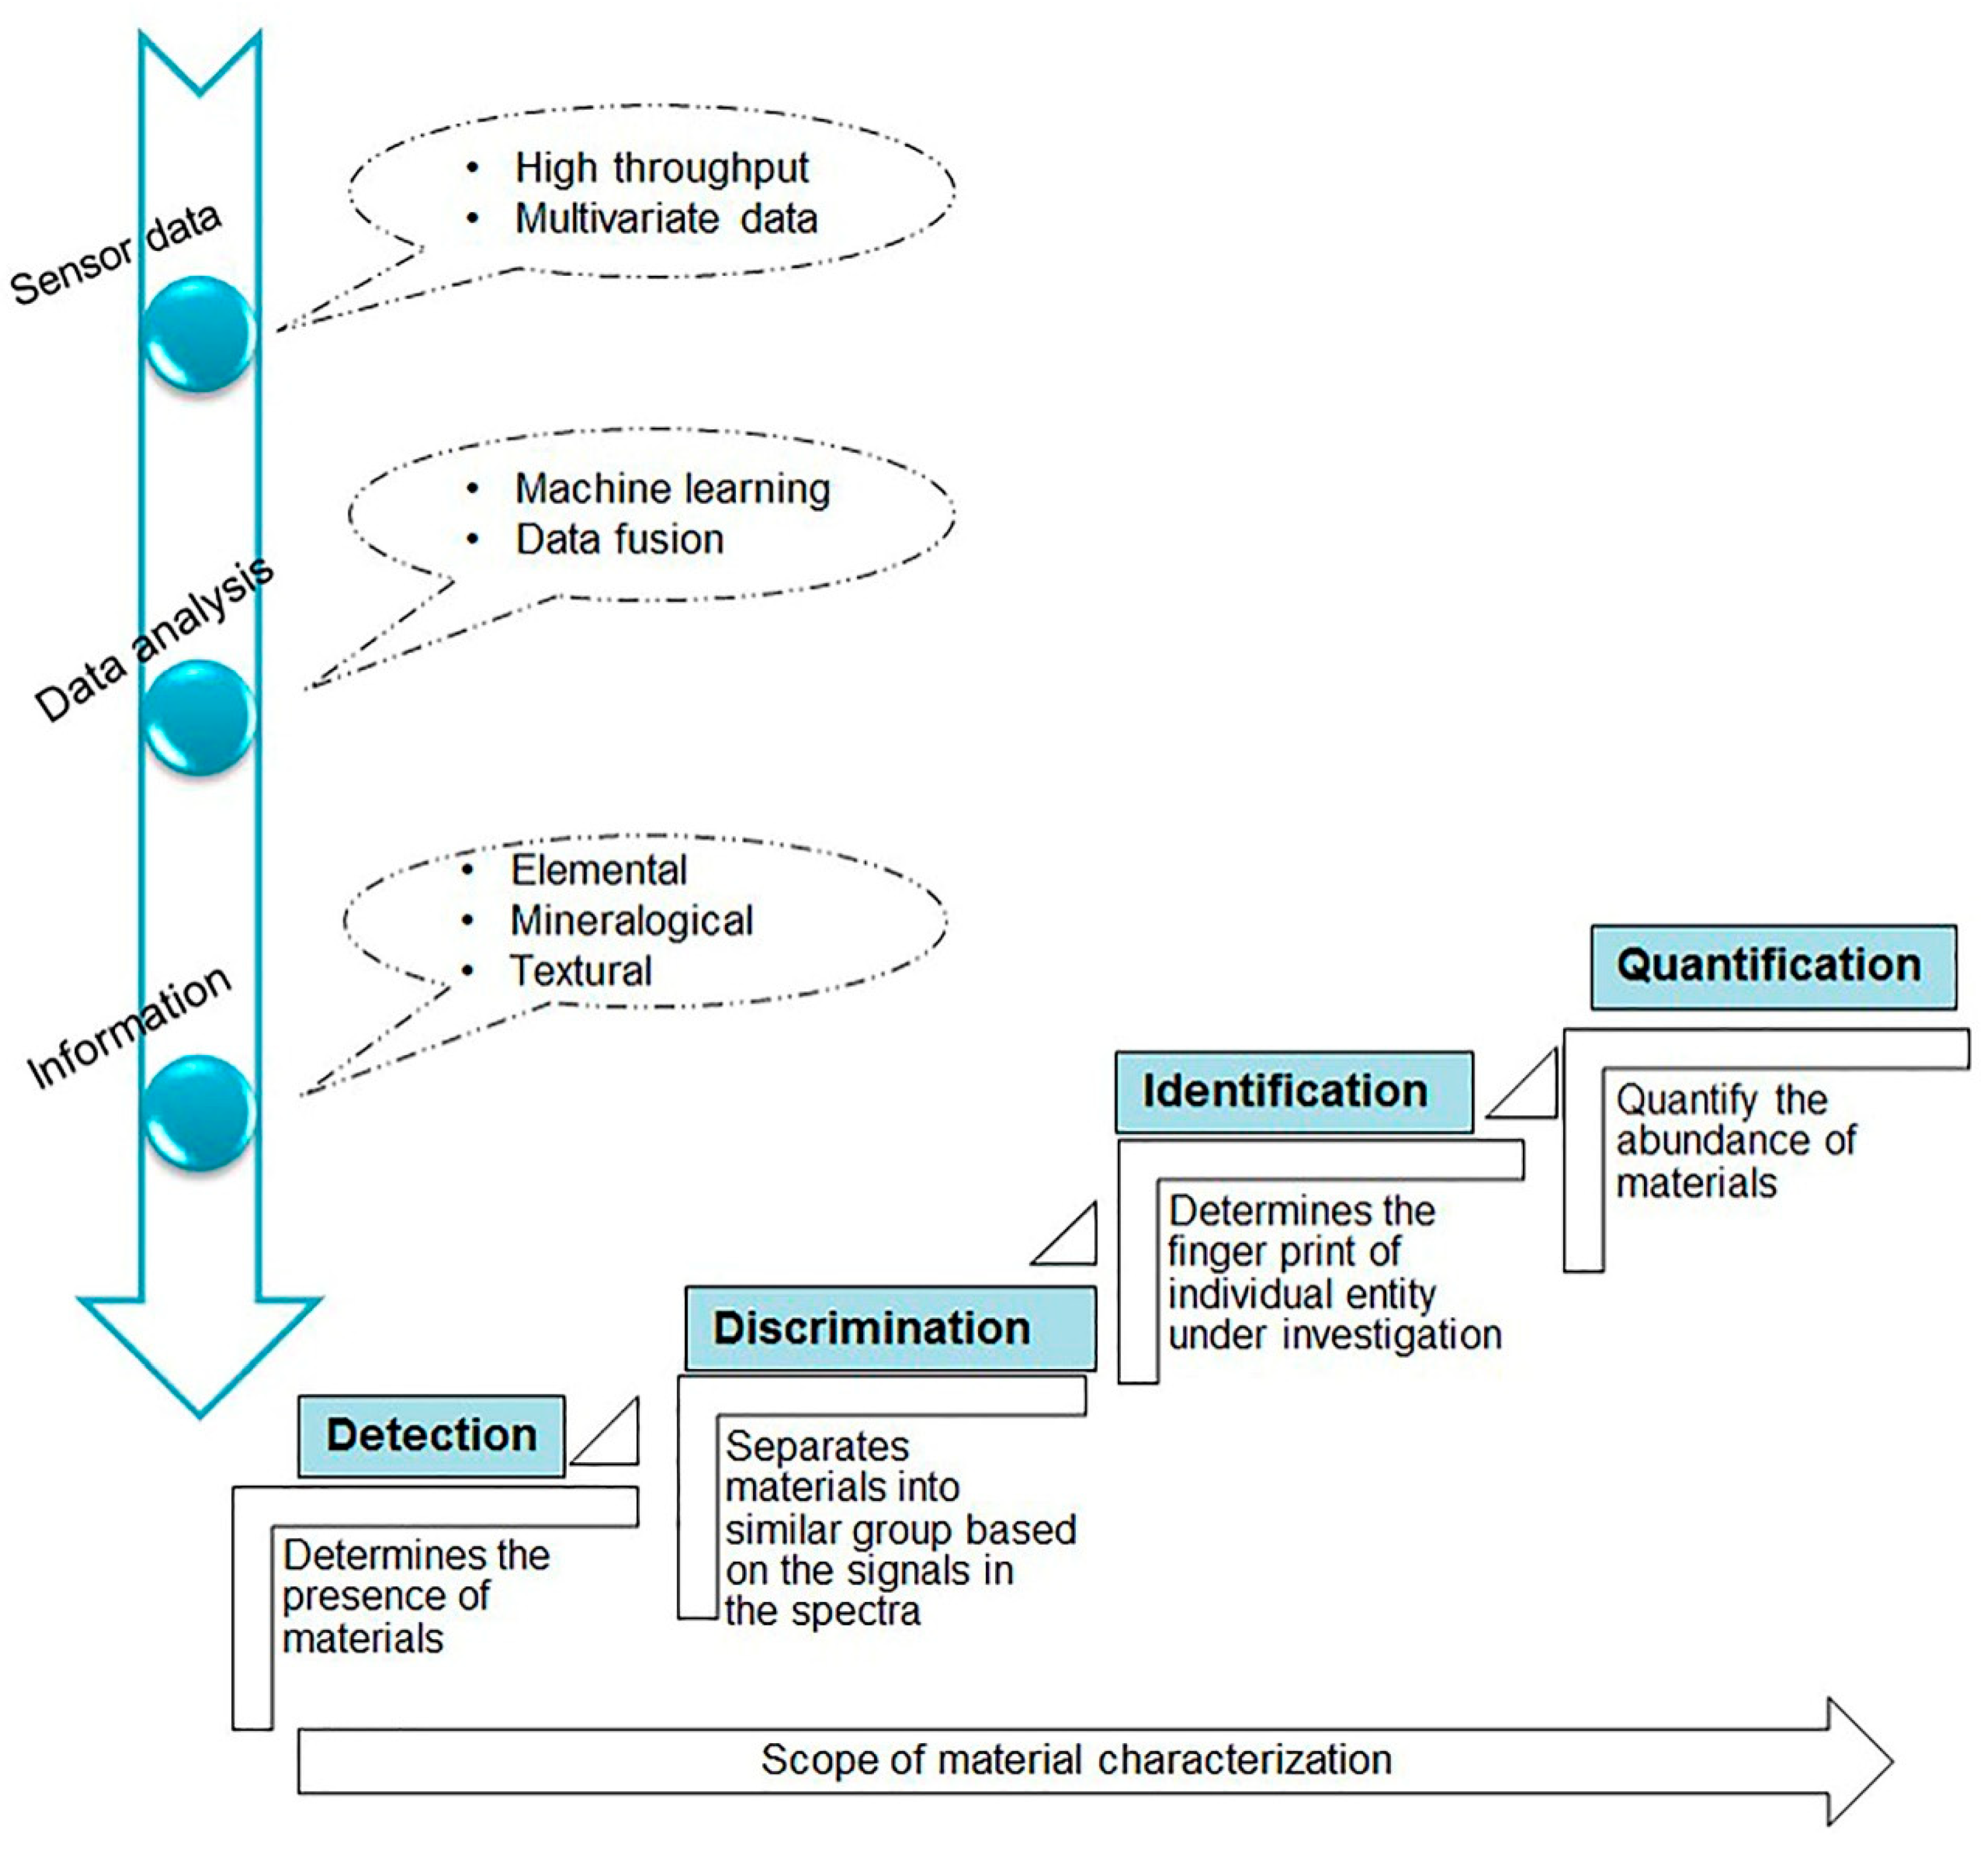
In mineralogical or elemental investigations, identification of as many minerals or elements as possible in the material is advantageous to finding indirect proxies of target minerals and understanding the requirements for mineral processing. However, material characterization is a multi-step process that involves addressing different issues at different levels. The entire process, which is comprised of data generation, analysis, information extraction, and the depth of information (or scope of material characterization), is illustrated in
Figure 7. Nowadays, most sensors produce high-throughput multivariate or megavariate data. The raw data is complex, making it challenging to interpret and handle the megavariate data obtained from different sources. Therefore, there is a need for machine learning methods, such chemometrics, for data-driven understanding of the complex datasets. Using multivariate techniques, the hidden information in spectral data can be transformed into useful information, such key geological parameters (elemental, mineralogical, and textural data) in mining operations. However, based on the information level that can be acquired from the sensor signals, the depth of information or the amount of information that can be generated differs. The depth of information or scope of material characterization from the bottom up can be organized into (i) detection (determines the presence of materials in the entity under investigation), (ii) discrimination (separates materials into similar groups based on the signals in the spectral data), (iii) identification (determines the fingerprints of individual entities), and (iv) quantification (determines the quantity of materials).
Thus, quantification of the composition of a material under investigation is at a higher level of the material characterization or information extraction process. Quantification can be achieved after identification of a unique identity of a material in the acquired spectra, or it can be achieved indirectly by developing prediction models based on the correlation between the spectral signal and the entity under investigation (e.g., elemental concentration). In the present study, the use of MWIR and LWIR data for semi-quantification of elemental concentration was analysed. The prediction accuracies acquired from the fused data or individual datasets were very good. The achieved results should be termed ‘semi-quantification’, since the acquired RMSEP was not as low as would be expected for exact prediction. However, the achieved RMSEP gives a very good indication of the elemental concentration in the samples and can be used to indicate high-, medium-, and low-mineralization zones in mining operations. In addition, a lower RMSEP can be achieved using more data in the calibration datasets. One of the advantages of the use of IR data for the indication of elemental concentration stems from the fact that the infrared data can be further analyzed to acquire mineralogical information simultaneously. Thus, IR can be considered to be a complementary technique to technologies that provide elemental information (e.g., XRF or LIBS).
Overall, the prediction accuracies acquired in this study show promise in terms of semi-quantification of elemental concentrations in polymetallic sulphide ore samples using data sources that have historically been used for mineral identification only. Therefore, this study can serve as a baseline to show a framework for the implementation of data fusion using multiple data sources and various classification or regression algorithms.
4.7. Opportunities and Limitations for In-Situ Application
Owing to current technological advancement, rapid and non-destructive sensor technologies are feasible for mineral and mining applications. These technologies produce high-throughput megavariate datasets. As a result, understanding and interpreting the sensor data directly might not be possible. This leads to computational challenges in analyzing the megavariate data and generating knowledge based on fast fingerprinting approaches in order to automate a material characterization process. Therefore, as illustrated in
Figure 7, knowledge generation from sensor-derived data requires advances in analytics using machine-learning techniques. The approach presented in this study enables semi-quantification of elemental concentrations using IR spectra and data fusion. The reflectance IR spectra were linearly correlated to the elemental concentrations in polymetallic sulphide ore. Data fusion resulted in improved model prediction accuracies and lower detection errors (uncertainty) than the individual datasets. This is likely due to jointly analyzing data blocks from different sensors, which allowed us to capture the latent information that would not be extracted by analyzing each data block individually.
Data fusion is mainly a data-driven approach in which the preferred level of data fusion depends on the nature of the data. Low-level fusion is conceptually simple, uses a single model, and can capture correlations between variables contained in different blocks. The disadvantages of the low-level data fusion are the high data volume (high variable to sample ratio) and the possible predominance of one data source over the others. The concerns stemming from a high data volume can be resolved using mid-level data fusion. For example, data reduction via feature selection (the scores in this case) in mid-level data fusion reduced the data dimensionality tremendously in the present study. Comparing the number of variables used in the two levels of data fusion, the mid-level data fusion used ~0.14% of the data volume required for low-level fusion. Thus, feature extraction in mid-level fusion reduces data dimensionality (in this case by ~99.86%), which significantly minimizes the time required for computational analysis. The disadvantage of mid-level data fusion is that it requires the development of many models prior to fusion (each dataset must be reduced) and there is a need for an ultimate variable screening method. Therefore, the choice of the preferred level of data fusion is dependent on the performance of prediction or classification models and their applications, and should thus be made using a “systematic” approach.
Polymetallic sulphide ore characterization using IR spectra considers weak IR features, complex matrices due to the presence of multiple sulphide minerals and other associated minerals, peak overlaps, and additional variability that results from physical and chemical weathering. Therefore, the need to reveal the hidden information in IR spectra related to the material of interest mandates the use of multivariate analysis (e.g., integration of data blocks from multiple sensors). Elemental concentration indication into low-, medium-, and high-mineralization zones is advantageous for elemental spatial variability mapping in ore grade control applications. The proposed framework can be extended to simultaneous fingerprinting of the mineralogical information and elemental concentration indication (measurements of concentrations of valuable elements) in order to achieve comprehensive quantitative analysis.
The in-situ application of elemental concentration indication using an IR spectra and data fusion approach is highly advantageous. However, to achieve this aim in practice, a robust system design and an integrated principled tool that integrates efficient data collection, processing, and knowledge generation is necessary. Going forward, automated material characterization is possible with a robust system design (exemplified by a portable and ruggedized system) and efficient software (test-case-specific mineral libraries) that can be developed using a combined sensor signal. As currently available sensor technologies measure different aspects of material properties, information acquired from each technique likely adds to a holistic description of materials. The application presented in this study was based on a point technique (FTIR spectrometer data), which yields information at a specific point. However, a correlation model can be developed using image data yielded by other sensor technologies, such as hyperspectral imagery or RGB imaging, to predict the elemental concentration in unmeasured areas (to extend the coverage).
5. Conclusions
This study developed prediction models for the indication of elemental concentration in polymetallic sulphide ore using infrared reflectance spectra. Different factors that possibly influence the performance of the prediction models were used to formulate testing scenarios: (1) the usability of the individual datasets (MWIR and LWIR) for the prediction of the elemental concentrations; (2) the effect of the different data pre-processing techniques on the prediction performance; and (3) the potential for improvement in prediction accuracy by applying low-level data fusion and mid-level data fusion.
The results reported in the preceding sections show that both MWIR and LWIR datasets include relevant information that can be related to the concentrations of the elements. Comparing the best-performing models, the prediction performance of the MWIR model after baseline correction (RMSEP = 2.23 and R2 = 0.83) for the combined Pb–Zn elemental concentration prediction was superior to that obtained using LWIR data (RMSEP = 3.25 and R2 = 0.65). On the other hand, the LWIR-based model after data normalization predicted the Fe concentration (RMSEP= 3.38 and R2 = 0.85) better than the MWIR-based model (RMSEP = 4.80 and R2 = 0.69). The MWIR is the least-explored region of the electromagnetic spectrum for mineralogical applications. However, the results yielded by this study show the potential of this technique for material characterization. The use of a low-level data fusion strategy improved the model predictive ability relative to the results yielded by using individual techniques. After the low-level fusion, the best-achieved model performance for the prediction of the combined Pb–Zn concentration was RMSEP = 2.10 and R2 = 0.85 and for the prediction of the Fe concentration was RMSEP = 2.71 and R2 = 0.90. The performance of the prediction models after the mid-level fusion was lower than that of the models employing individual techniques. However, the acquired results are promising and can likely be improved by adding more data to the calibration dataset (thus to fully capture the high variability between the samples) or by considering other feature extraction techniques.
Overall, the low- and mid-level data fusion approaches proposed in this study showed promising results. The outcomes suggest that the approach has a great potential to be extended for the integration of more complex data from a range of sensor technologies, due to the fact that each sensor technology has its own advantages in providing useful information. Prediction or indication of elemental concentration using mineralogical techniques (IR data) is useful to understand compositional properties, both in terms of mineralogy and geochemistry. The individual techniques (MWIR and LWIR) exhibit a great potential for use in elemental concentration characterization in sulphide ore, and the model performance can be improved using data fusion. This study is a baseline for future research that involves multiple sensor integration aimed at developing predictive models that can estimate elemental concentrations in different types of deposits. We recommend enhancing the current work using data from other sensors.


