Article

Geochemistry and Geochronology of Southern Norilsk Intrusions, SW Siberian Traps

by
Elena Sereda
1,*,
Boris Belyatsky
1 and
Nadezhda Krivolutskaya
2,*
1
A.P. Karpinsky Russian Geological Research Institute, Sredny prospect, 74, 199106 St.Petersburg, Russia
2
Vernadsky Institute of Geochemistry and Analytical Chemistry, Russian Academy of Sciences, Kosygin st., 119991 Moscow, Russia
*
Authors to whom correspondence should be addressed.
Minerals 2020, 10(2), 165; https://doi.org/10.3390/min10020165
Submission received: 25 November 2019 / Revised: 5 February 2020 / Accepted: 8 February 2020 / Published: 13 February 2020

Abstract

:
The Norilsk ore region is characterized by the occurrence of numerous intrusions comprising the PGE–Cu–Ni deposits. The Turumakit area, within the Southern Norilsk Trough, also contains many mineralized mafic intrusions of probably similar economic potential to the known Norilsk deposits. We study igneous rocks from three boreholes within the Turumakit area, sampling gabbro-dolerites and trachydolerites related to the Norilsk and Ergalakh complexes, as well as an outcrop of the Daldykan gabbro-dolerite intrusion. Our petrographical, mineralogical and geochemical data, as well as the U–Pb dating of extracted baddeleyites and zircons, primarily discriminate between the sub-alkaline rocks of the main Turumakit area and the Ergalakh trachydolerites located in the Norilsk and Talnakh ore junctions. Coarser grained Turumakit trachydolerites (with pegmatite segregations) contrast finer grained Ergalakh trachydolerites by having: (1) higher TiO2 (up to 5.5 wt %) compared with 2.2 wt %–3.3 wt % in the typical Ergalakh rocks; (2) low U, lower La/Yb and La/Sm ratios (5–7), in contrast to 8–10 ppm, 2.5–2.6 and 3.0–3.3, respectively, for the Ergalakh trachydolerites; and (3) their age was determined by U–Pb methods on baddeleyite and zircon (244.8 ± 2.7 Ma), and it appears likely that the mafic rocks traditionally attributed to the Ergalakh complex within the Turumakit area are younger than the Norilsk intrusions (250 ± 1.4 Ma). These data strongly indicate an emplacement of Turumakit intrusions during the end of a ~5 Myr magmatic evolution of the Norilsk district. It is therefore proposed that the sub-alkaline rocks of the Turumakit area belong to a separate intrusive complex within the Norilsk district.

1. Introduction

The Norilsk ore district known as a part of the large North Siberian metallogenic province [1] is located in the North-Western corner of the Siberian crystalline basement (AR; Figure 1), covered by stratified sedimentary and volcanic rocks [2,3]. It comprises many PGE–Cu–Ni deposits of varying reserves. The superlarge Octyabr’skoe and Talnakh deposits are located in the Southern Kharaelakh Trough, and the Norilsk 1 deposit is situated in the Northern Norilsk Trough (Figure 1). Within the Norilsk Trough there are also a number of moderate to smaller deposits, known as Chernogorsky, Norilsk 2 and Bol’shaya Bariernaya, among others.
The search for new deposits within the Norilsk district has challenged the Geological Survey for a number of years, and the southern part of the Norilsk trough is a prospective area, where Norilskgeologia LLC has drilled many boreholes that penetrate numerous intrusive bodies.
These intrusions differ in composition and internal structures (Figure 2), but their subdivisions into magmatic complexes are often ambiguous, and may lead to unjustified complications with regards to correlations across the region. Thus, the Norilsk district geological map (scale 1:50,000; [4]) highlights several magmatic complexes (i.e., association of intrusive bodies with similar internal structure and composition), according to their alleged intrusion sequence (from older to younger): Ergalakh, Pyasinsky, Ogonersky, Norilsk, Morongovsky and Avamsky. While the first two and the last complexes are all subalkaline, the others have a tholeiitic composition. The ore-bearing Norilsk intrusive complex, further subdivided into the Lower Talnakh, Kruglogorsky, Norilsk and Zubovsky sub-complexes, includes several intrusions, with distinct cryptic and modal layering. Since all intrusions are hosted within the sedimentary rocks that underlie the Siberian Traps flood basalts, there are no cross-cutting relationships that may elucidate relative intrusive ages with these extrusives.
The sedimentary rocks comprise three structural units: (1) Proterozoic-Cambrian terrigenous strata, (2) Silurian-Devonian marine sediments and (3) Carboniferous-Lower Permian terrigenous coal-bearing sediments, collectively referred to as the Tunguska Series (Figure 1). Sedimentary rocks are overlapped by a 3.5 km thick Siberian Traps sequence of lavas and tuffs. The volcanic rocks are folded into several troughs, the main ones being the Kharaelakh (I) and Norilsk (II). PGE–Cu–Ni deposits are located in the intersections of these troughs with the large Norilsk-Kharaelakh fault (Figure 1 and Figure 2).
The studied Turumakit area is located in the southern part of the Norilsk trough [4], where Silurian, Devonian and Permian sedimentary rocks are exposed at the surface (Figure 2). Siberian Traps’ extrusive rocks (lavas and tuffs) only outcrop in the eastern part of this study area, and intrusive igneous rocks (mainly layered gabbro-dolerite bodies) comprise 25% of the area. Individual sills are correlated and combined into four intrusive complexes, based upon similar degrees of alkalinity, internal structures and mineral composition, which chronologically (from early to late) are Ergalakh, Ogonersky, Norilsk and Daldykan (Figure 2). Thus, the main task of the geological study of intrusions from the Turumakit was to compare them with well-studied intrusions of the Norilsk area and to attribute them to specific intrusive complexes. In order to investigate these complexes further and constrain their petrogenesis, differentiation and emplacement over time, we have carried out the petrographic and geochemical studies (including rare earth elements) of 65 samples from three drill-cores through the Ergalakh, Norilsk and Daldykan complexes, as well as baddeleyite and zircon U–Pb ages and Sr–Nd–Pb–Os isotopes of the Norilsk and Daldykan complexes (six samples).

2. Materials and Methods

We study Turumakit area core specimens attributed to the Ergalakh and Norilsk intrusions, which were collected from the boreholes BT-1, BT-6 and BT-8 (Figure 2), while the Daldykan intrusion is only represented by outcrop samples. Petrographical studies of thin sections were carried out with an Olympus microscope (Olympus Corporation, Tokyo, Japan), and the most representative and coarse-grained samples were selected for the separation of zircons and baddeleyites.
Major oxide concentrations of 65 samples were determined by X-ray fluorescence (XRF) at the Institute Geology of Ore Deposits, Petrography, Mineralogy and Geochemistry RAS (analyst A.I. Yakushev). This XRF machine, an AxiosmAX model from PANalytical (Almelo, The Netherlands), has a sequenced-action vacuum spectrometer (with dispersion over the wavelength), equipped with a 4 kW X-ray tube with an Rh-anode. The maximum voltage on the tube is 60 kV, and the maximum anode current is 160 mA. The quality control of the results is carried out according to the analysis of rock standard samples (AGV-2 and BHVO-2, USGS). Results are presented in Table S1 and Table 1, and the relative standard deviations (RSDs) are as follows (%): SiO2: 0.12; TiO2: 0.05; Al2O3: 0.12; Fe2O3(total): 0.13; MnO: 0.005; MgO: 0.07; CaO: 0.08; Na2O: 0.08; K2O: 0.03; and P2O5: 0.01.
Trace elements were analyzed by inductively coupled plasma mass spectrometry (ICP-MS, ThermoFisher Scientific, Waltham, MS, USA) at the Institute of Microelectronics Technology and High Purity Materials, Russian Academy of Sciences, Chernogolovka, Moscow, Russia, (analyst V.K. Karandashev). A 100 mg powdered whole-rock sample was dissolved in 50 mL Teflon beakers with covers of watch-glass type (Halo Ploymer Kirovo-Chepetzk, Russia). We used HNO3 (65% nitric acid: max. 0.0000005% Hg, GR, ISO), HF (40% hydrofluoric acid: GR, ISO, Merck, Germany), HCl (37% hydrochloric acid: max. 0.0000005% Hg, PA-ACS-ISO: Panreac, Spain). Boric acid H3BO3 (GR for analysis: Merck, Germany) was used for the preparation of its 0.1 M solution. In each batch, 2–3 control samples and one standard sample were simultaneously decomposed. Andesite AGV-2 and BHVO-2 (US Geological Survey) were used as standards. Determination of elements was performed with an X-7 quadruple mass spectrometer (ThermoFisher Scientific, Waltham, MS, USA) at the following parameters: plasma power of 1300 W, set standard VeeSpray. Results are presented in Table S1 and Table 1. The lower limits of detection are as follows (ppm): Li: 0.02, Be: 0.01, Sc: 0.1, V: 0.8, Cr: 0.8, Co: 0.1, Ni: 0.6, Cu: 0.3, Zn: 0.4, Ga: 0.1, Rb: 0.08, Sr: 0.06, Y: 0.02, Zr: 0.07, Nb: 0.02, Cs: 0.005, Ba: 0.08, La: 0.01, Ce: 0.03, Pr: 0.01, Nd: 0.03, Sm: 0.01, Eu: 0.01, Gd: 0.01, Tb: 0.006, Dy: 0.007, Ho: 0.007, Er: 0.004, Tm: 0.002, Yb: 0.004, Lu: 0.006, Hf: 0.01, Ta: 0.01, Pb: 0.04, Th: 0.01, U: 0.005. Relative standard deviation (RSD) of element determinations are as follows (%): La: 1; Rb, Sr, Y, Ba, Ce, Pr, Nd, Er, Th, U, Pb, Ta, Nb, Zr: all of these 2; Sm, Eu, Gd, Tb, Dy, Ho, Yb, Hf, Sc, Co, Ni, Cu, Zn: these all 3; and Lu, Tm: both 4.
A water-based Wilfley table-technique, originally developed by [5], and adapted and modified in the laboratory of the Center of Isotope Research of the Karpinsky Geological Institute (VSEGEI, St. Petersburg, Russia), was used to separate a mono-mineral fraction of baddeleyite. The first important step for the successful liberation of baddeleyite from a hard-rock sample is a scanning of thin-sections of the sample with an electron microscope CamScan MX 2500S (CamScan Electron Optics, Finchley, London, United Kingdom).
If at least one >25 µm baddeleyite crystal was identified, the sample was crushed to obtain a fraction less than 100 µm. The resulting powder was mixed with detergent and water and laid onto the shaking table. The densest concentrate was collected, from which the magnetic fraction was removed, and baddeleyites could be hand-picked from the heavy non-magnetic fraction under a binocular microscope. The baddeleyite crystals were implanted in epoxy resin (diameter 2.5 cm) together with international Phalaborwa baddeleyite and 91,500 zircon mineral standards. Mounts were documented by a CamScan M× 2500 scanning electron microscope, while a CLI/QUA2 system produced back-scattered electron (BSE) and cathodoluminescent (CL) images to reveal the internal mineral structures and zonations.
Dating was carried out by a Secondary Ion Mass Spectrometry (SIMS) on a Sensitive High Resolution Ion Micro Probe (SHRIMP-II, ASI, Canberra, Australia) at the Center of Isotope Research of the Karpinsky Geological Institute (VSEGEI, St. Petersburg, Russia). This machine also measures the mineral concentrations of U, Th, Pb, Hf and REE. U–Pb isotope ratios were measured according to the scheme described in [6], and adopted in Russia [7]. The SQUID 1.0 program [8] was used to calculate the raw-data. U–Pb Concordia diagrams [9] were constructed using the program ISOPLOT/EX [10]. Corrections for common lead were made using the measured 208Pb and the model isotopic composition of lead according to [11].
Sr, Nd, Pb and Os isotope ratios and Rb, Sr, Sm, Nd, Re and Os concentrations of whole rock samples were determined by isotopic dilution and were measured on a TRITON (ThermoFisher, Bremen, Germany) solid-state multicollector mass spectrometer at the CIR VSEGEI (St. Petersburg, Russia). The uncertainties of the measured ratios are given at two sigma levels together with results in Table 2 and Table 3. A basalt BCR-2 was used as a standard sample for the Pb–Sr–Nd analytical work and serpentinite UB–N for standardization procedure for the Re–Os analysis. Details of this analytical procedure are described by [12].

3. Results

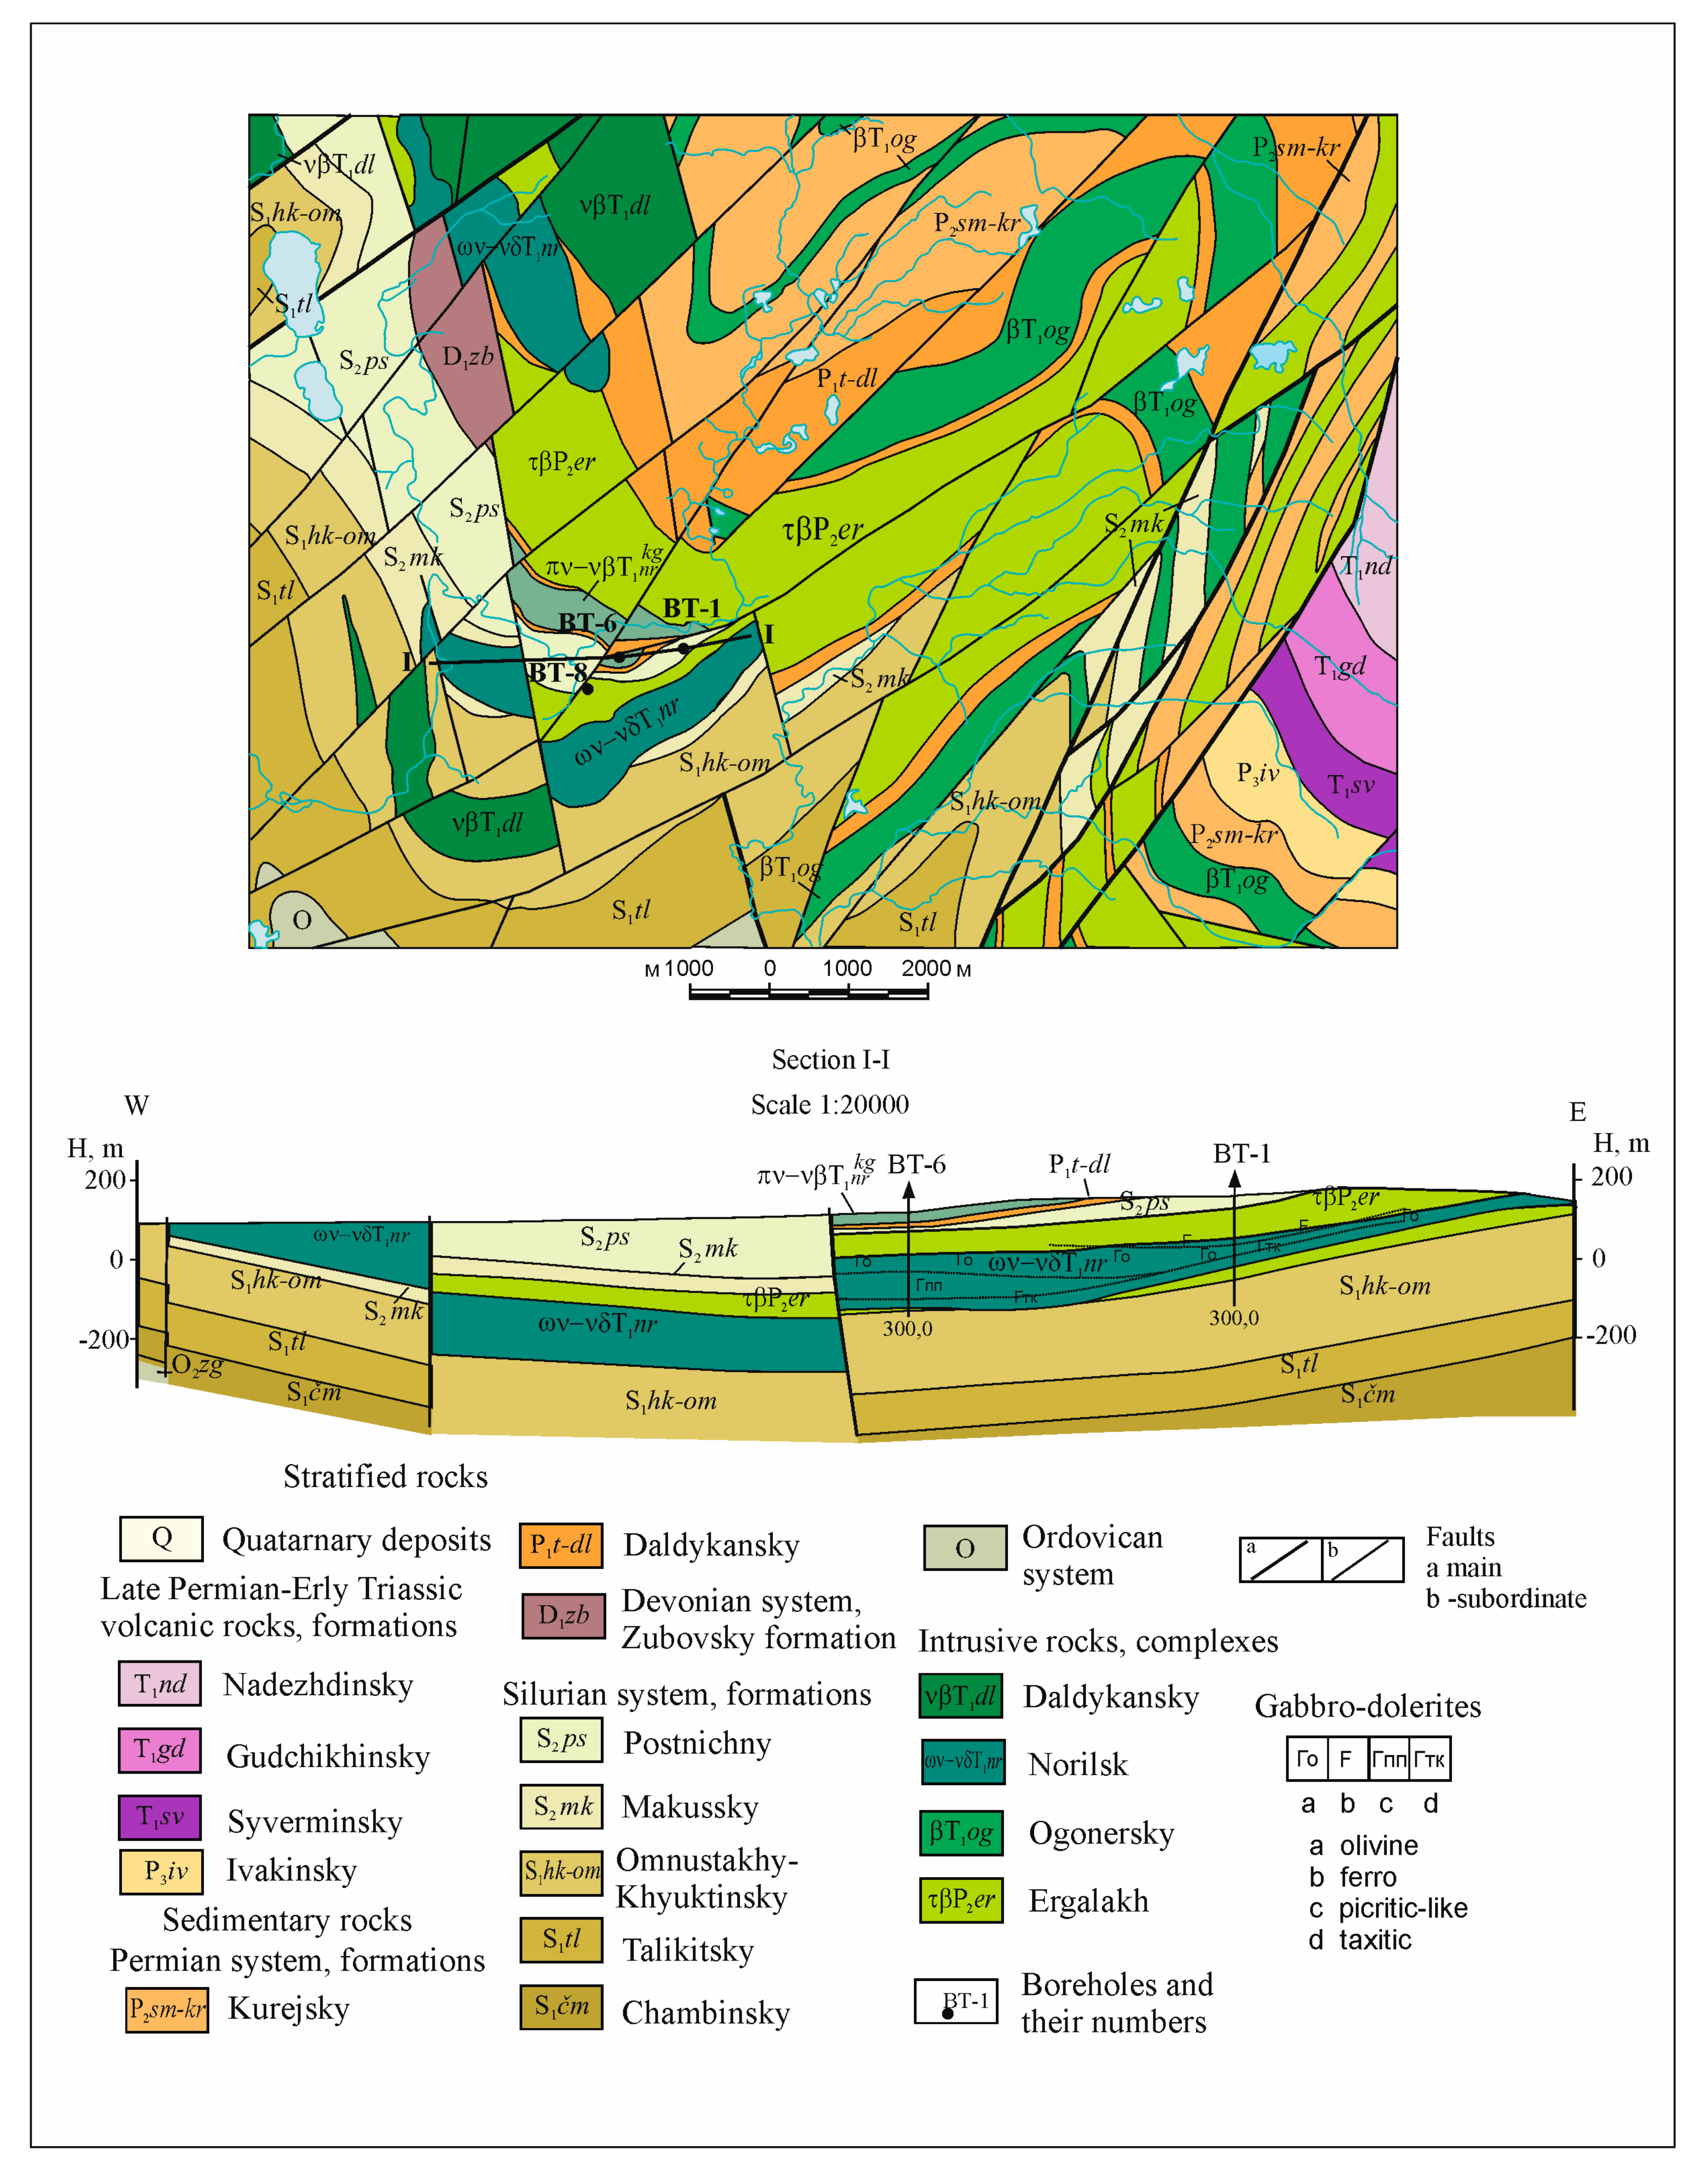
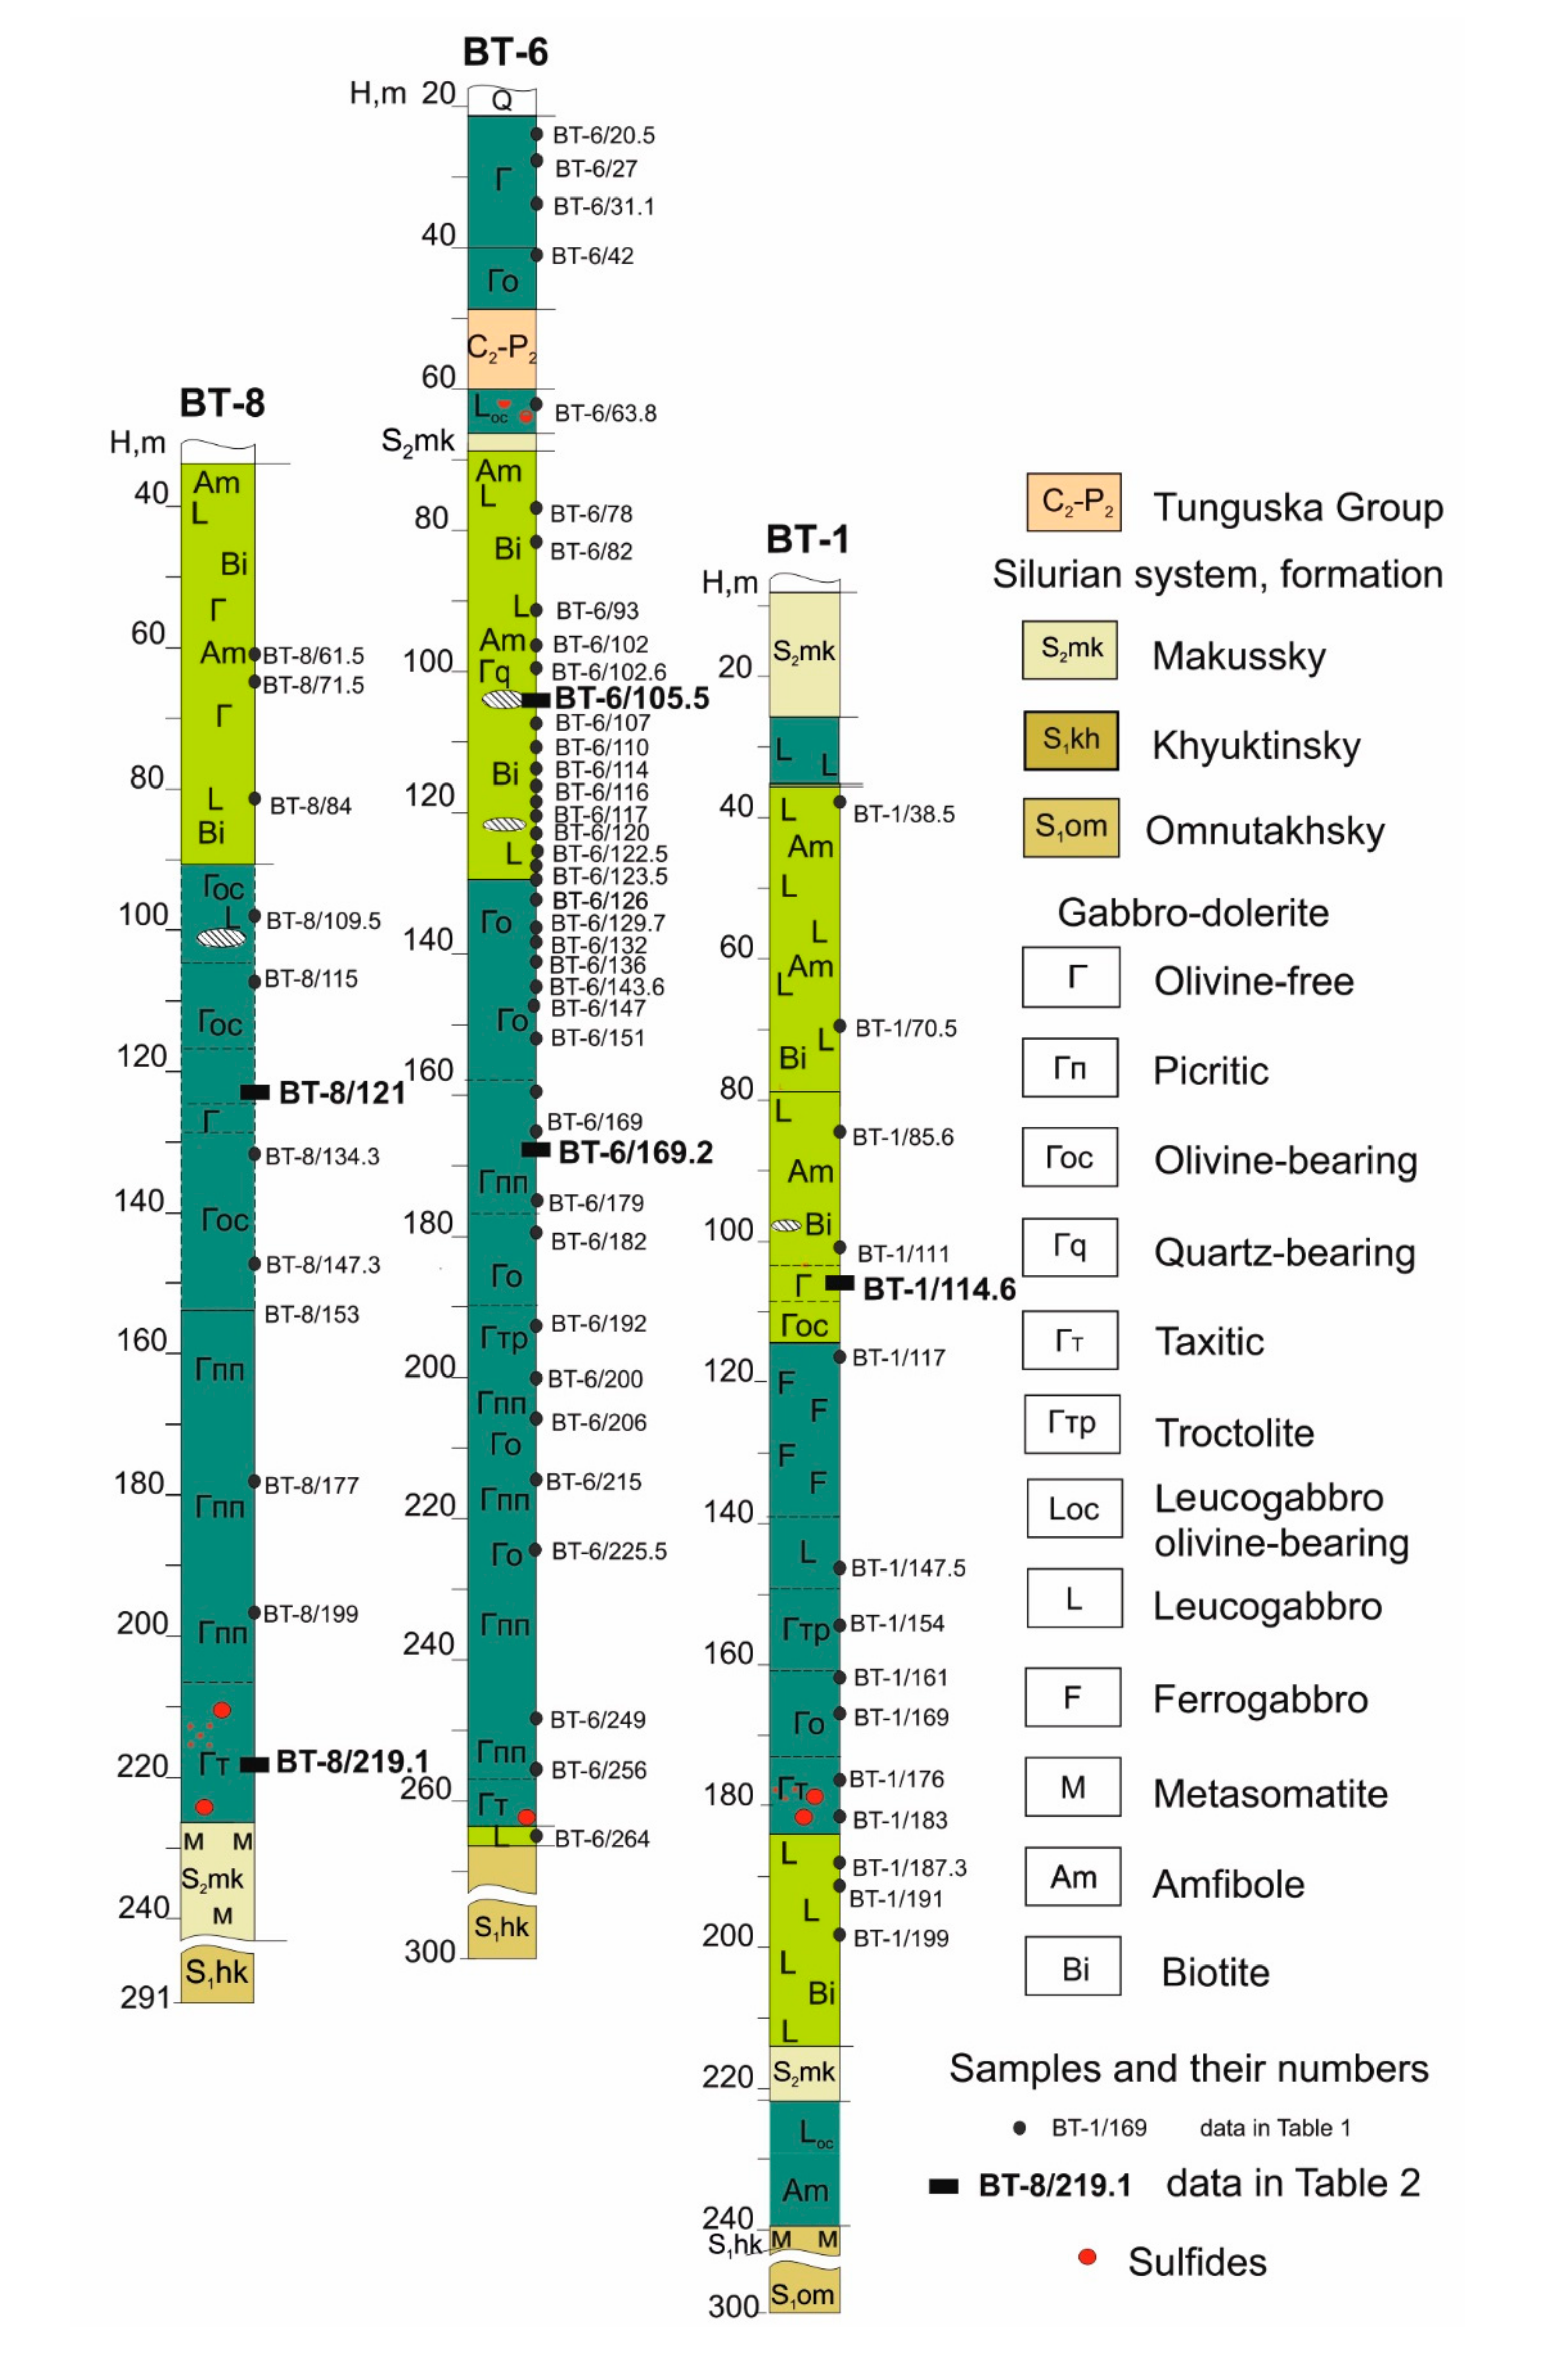
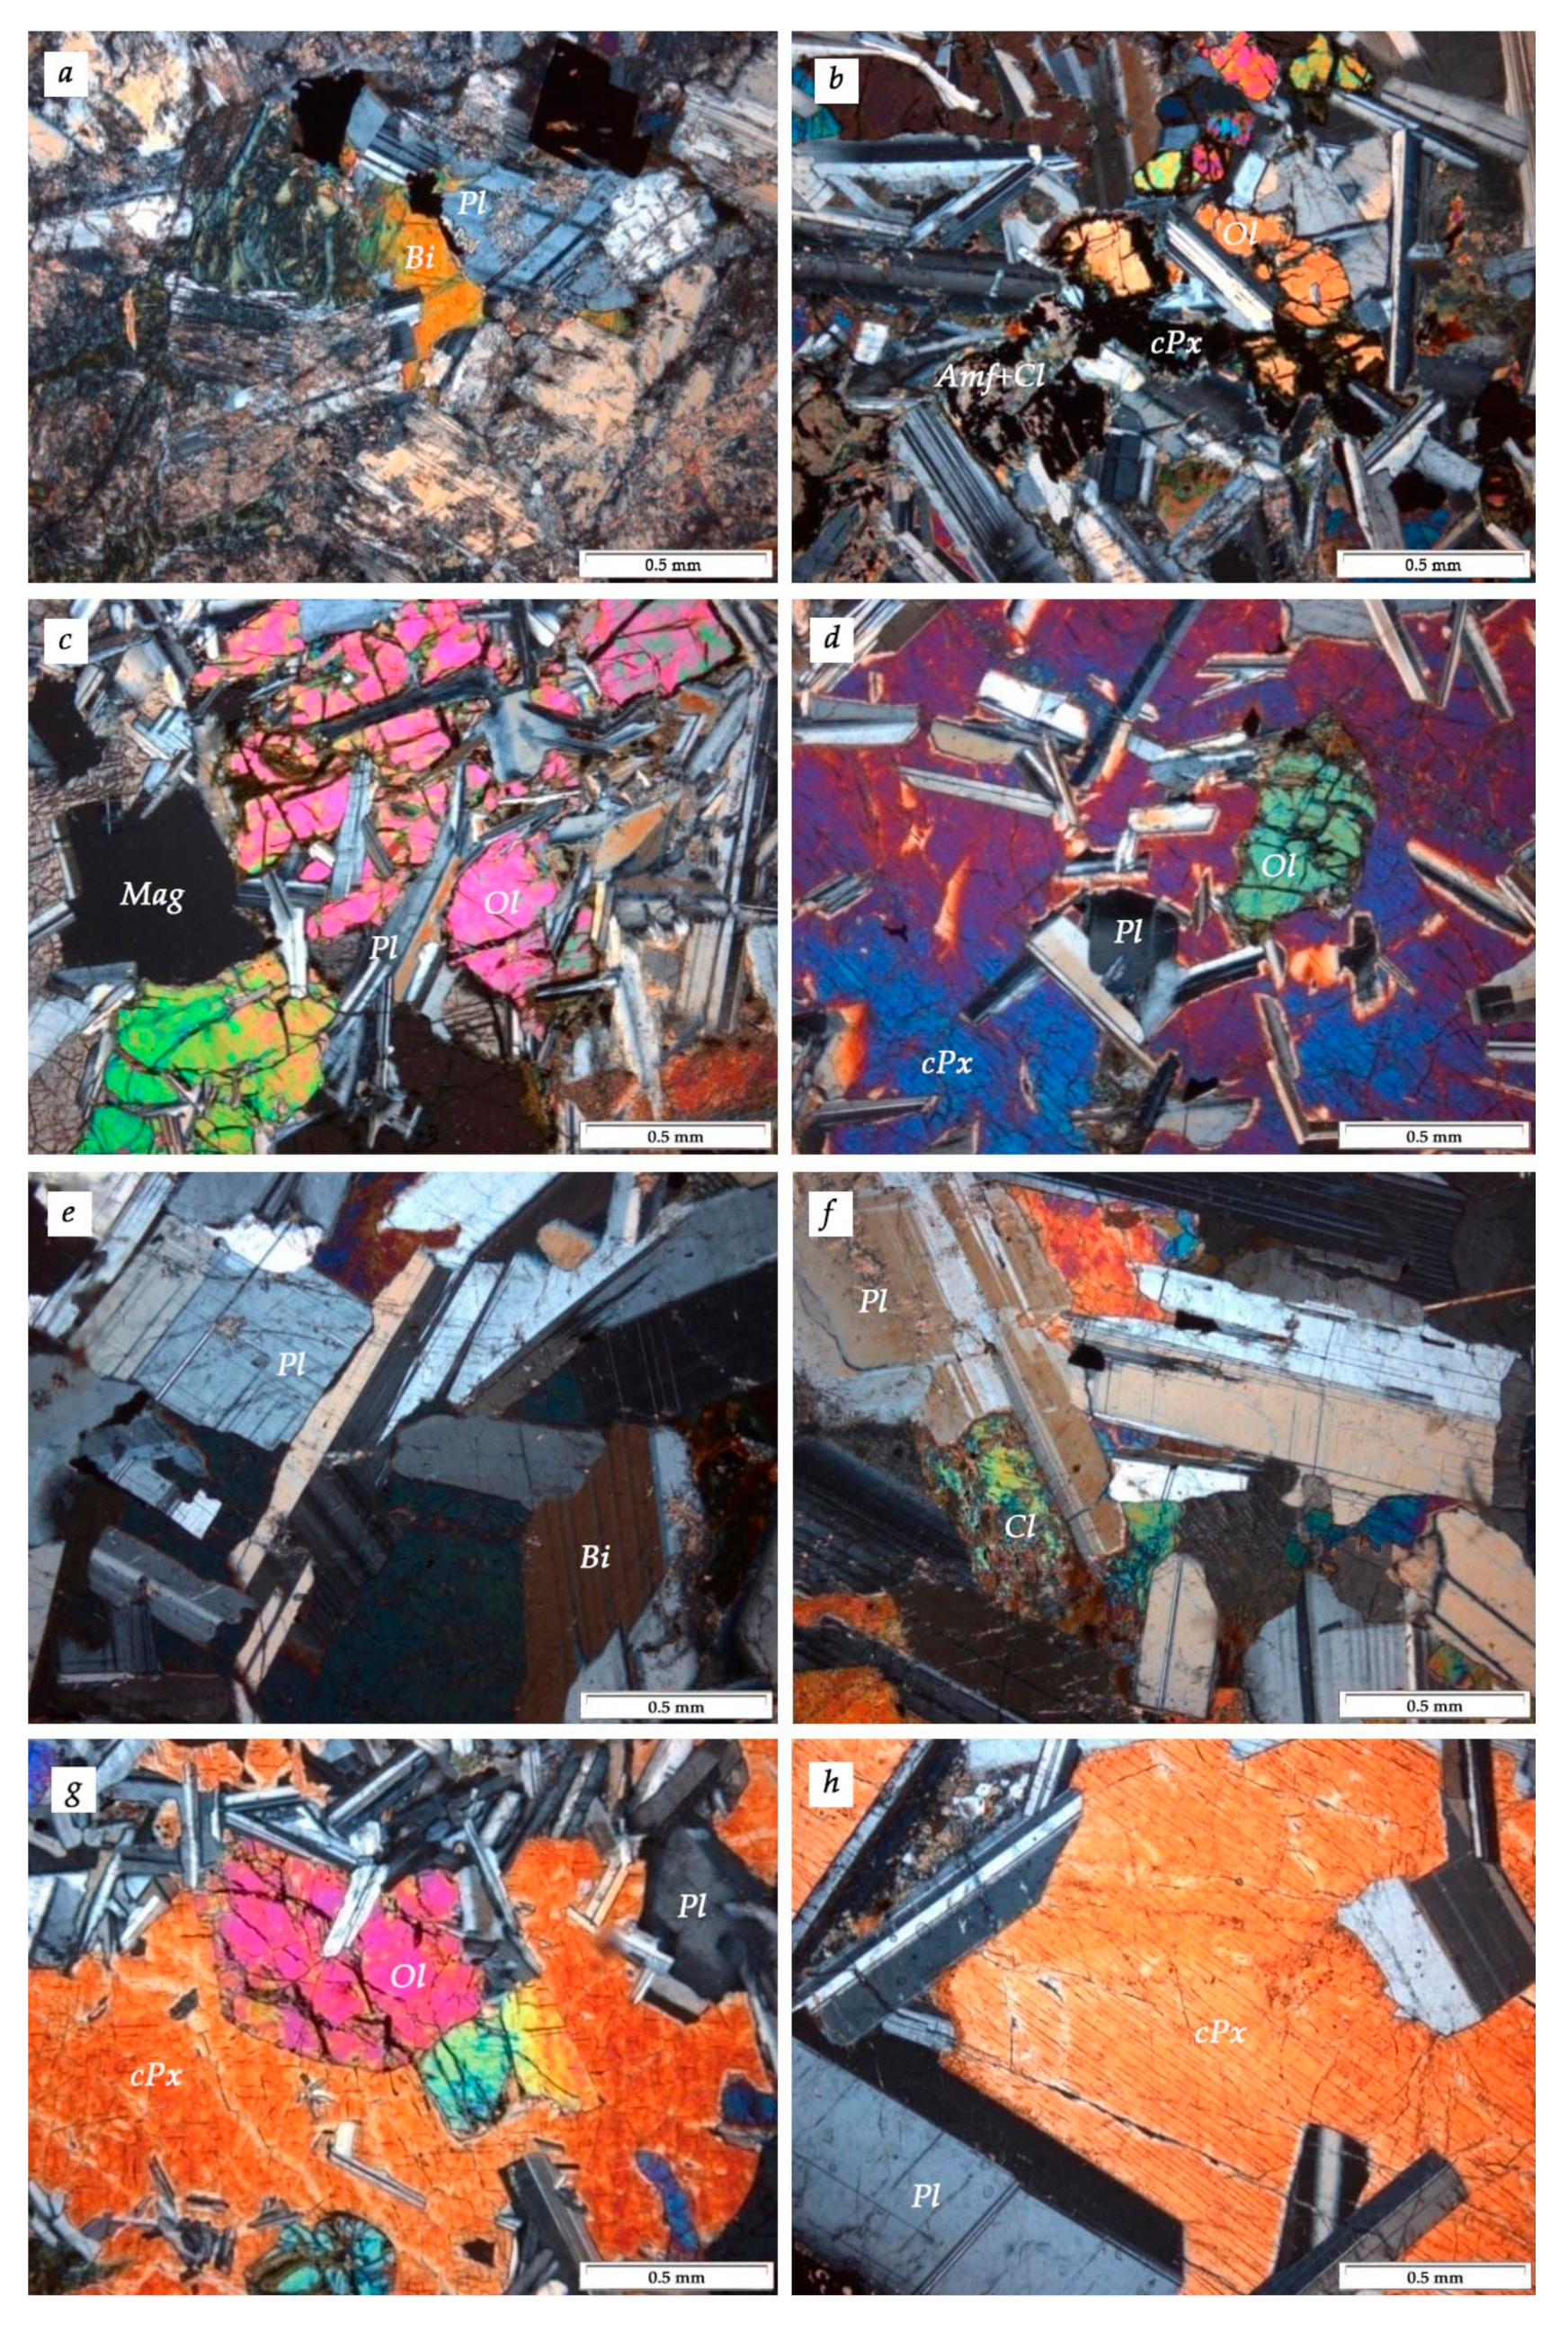
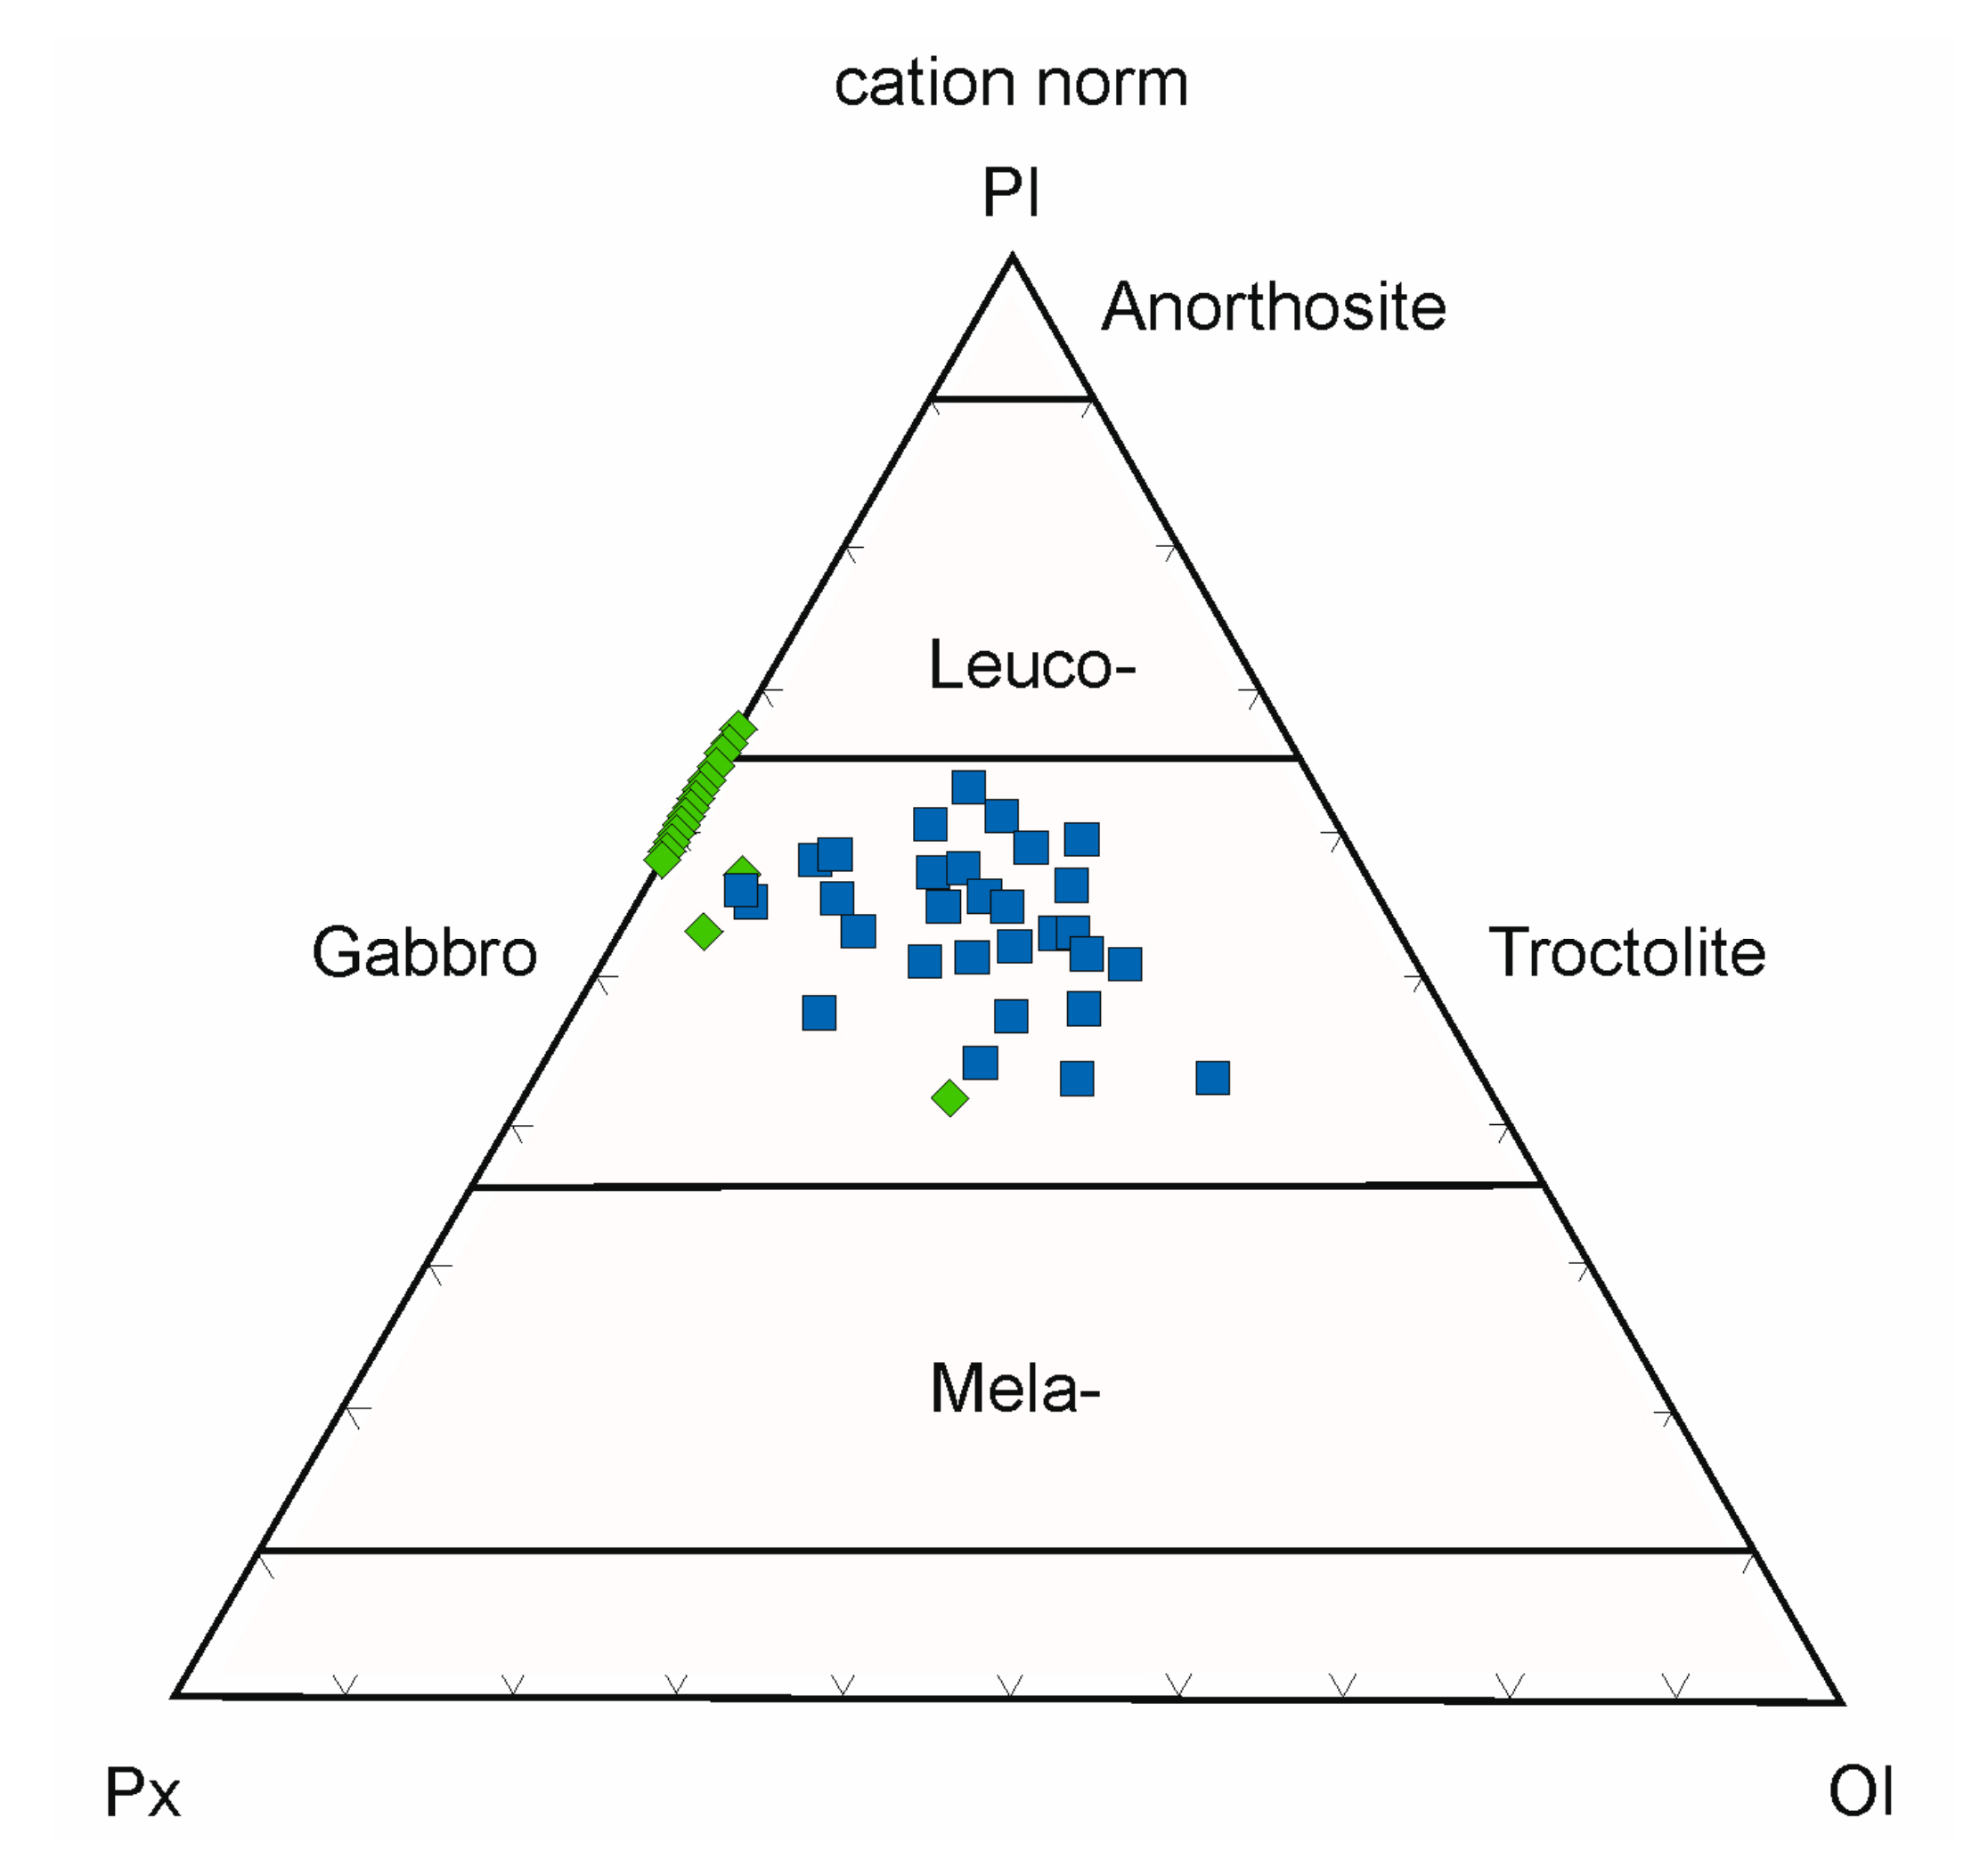
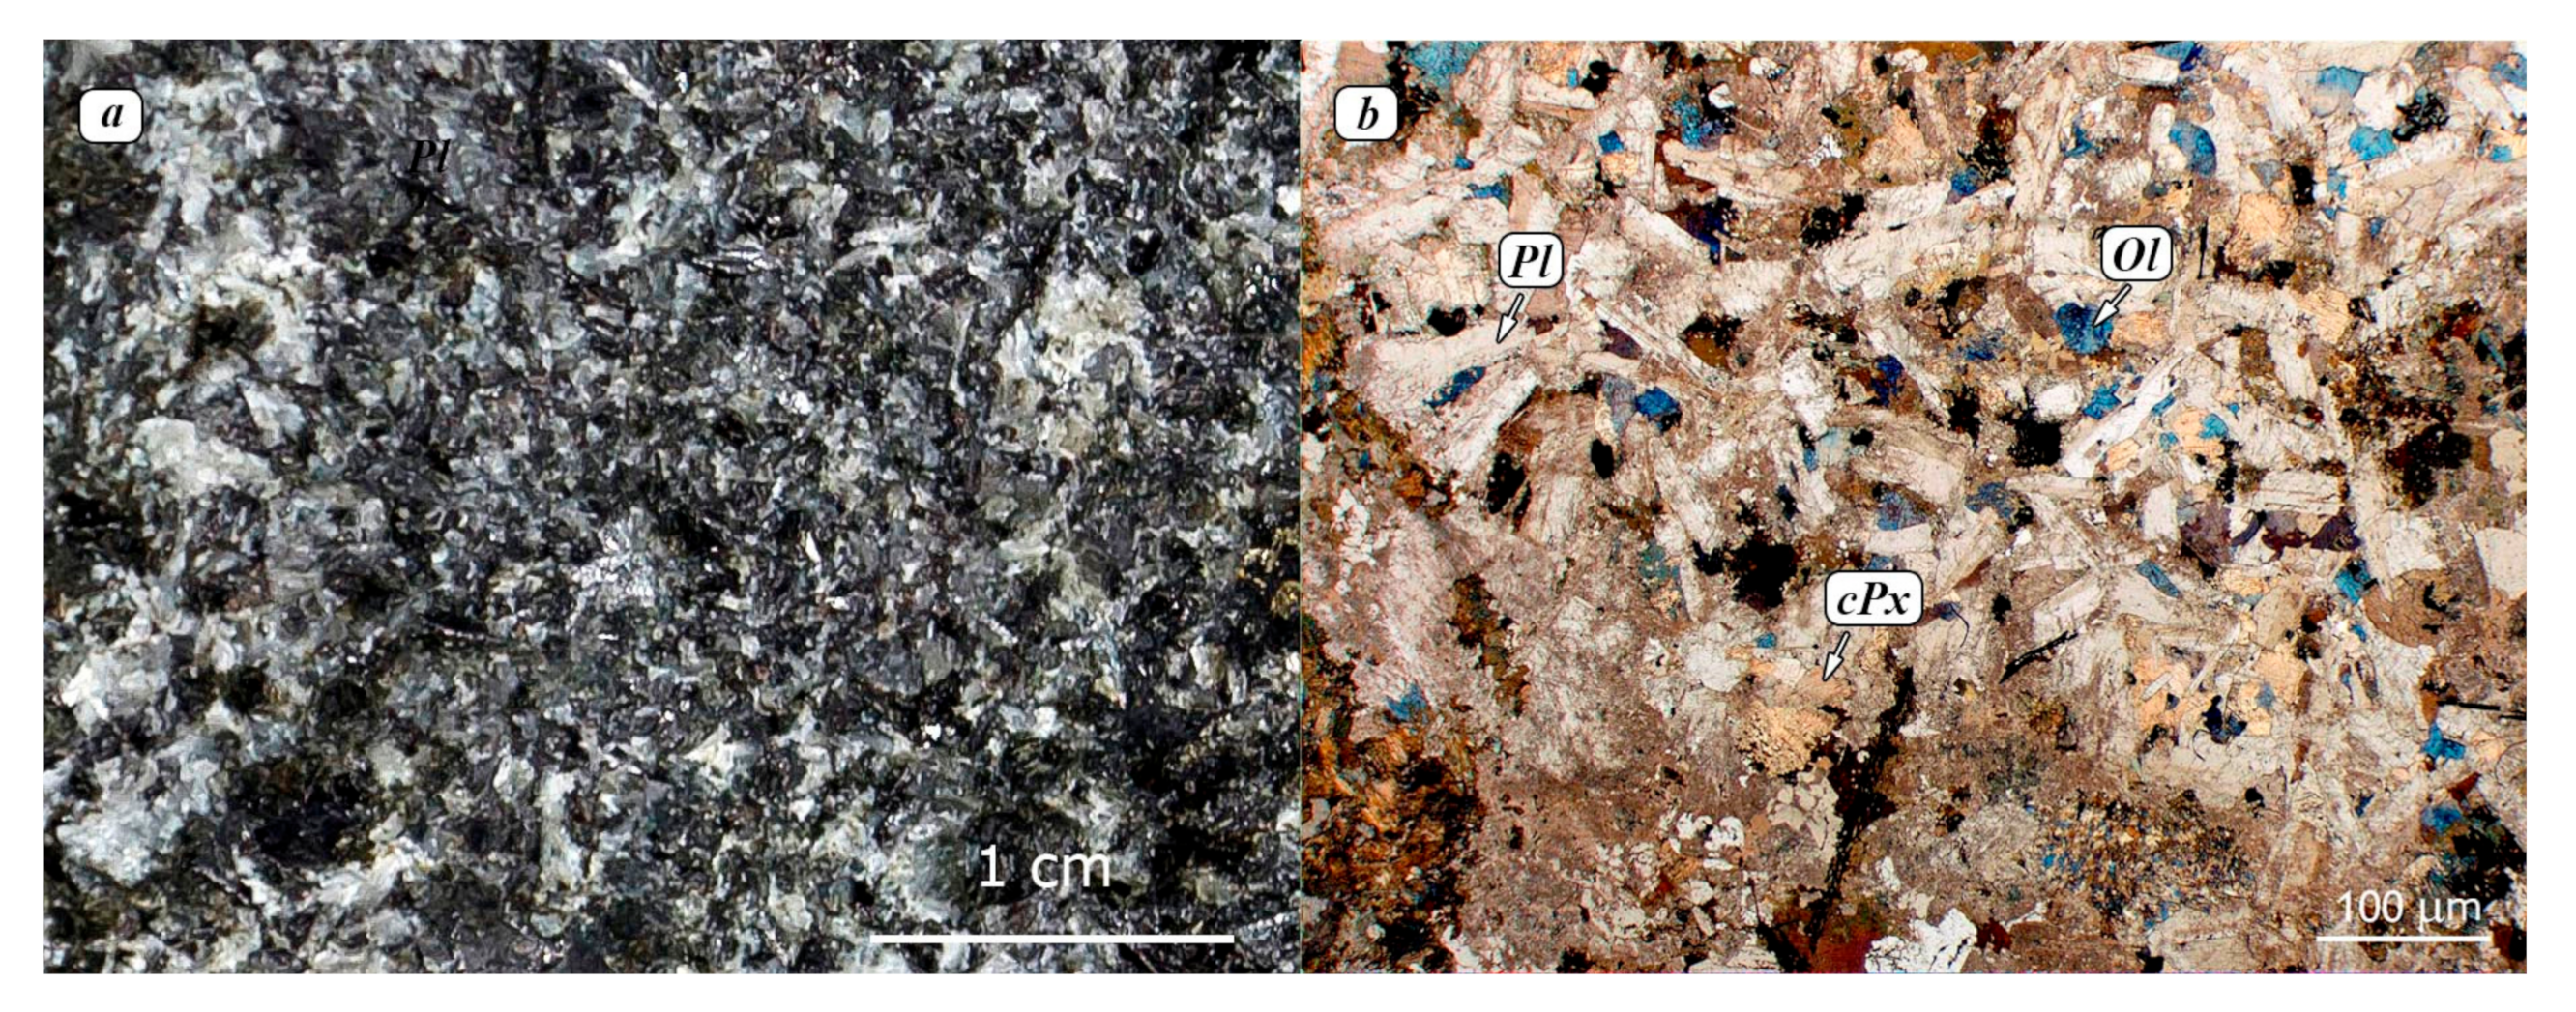
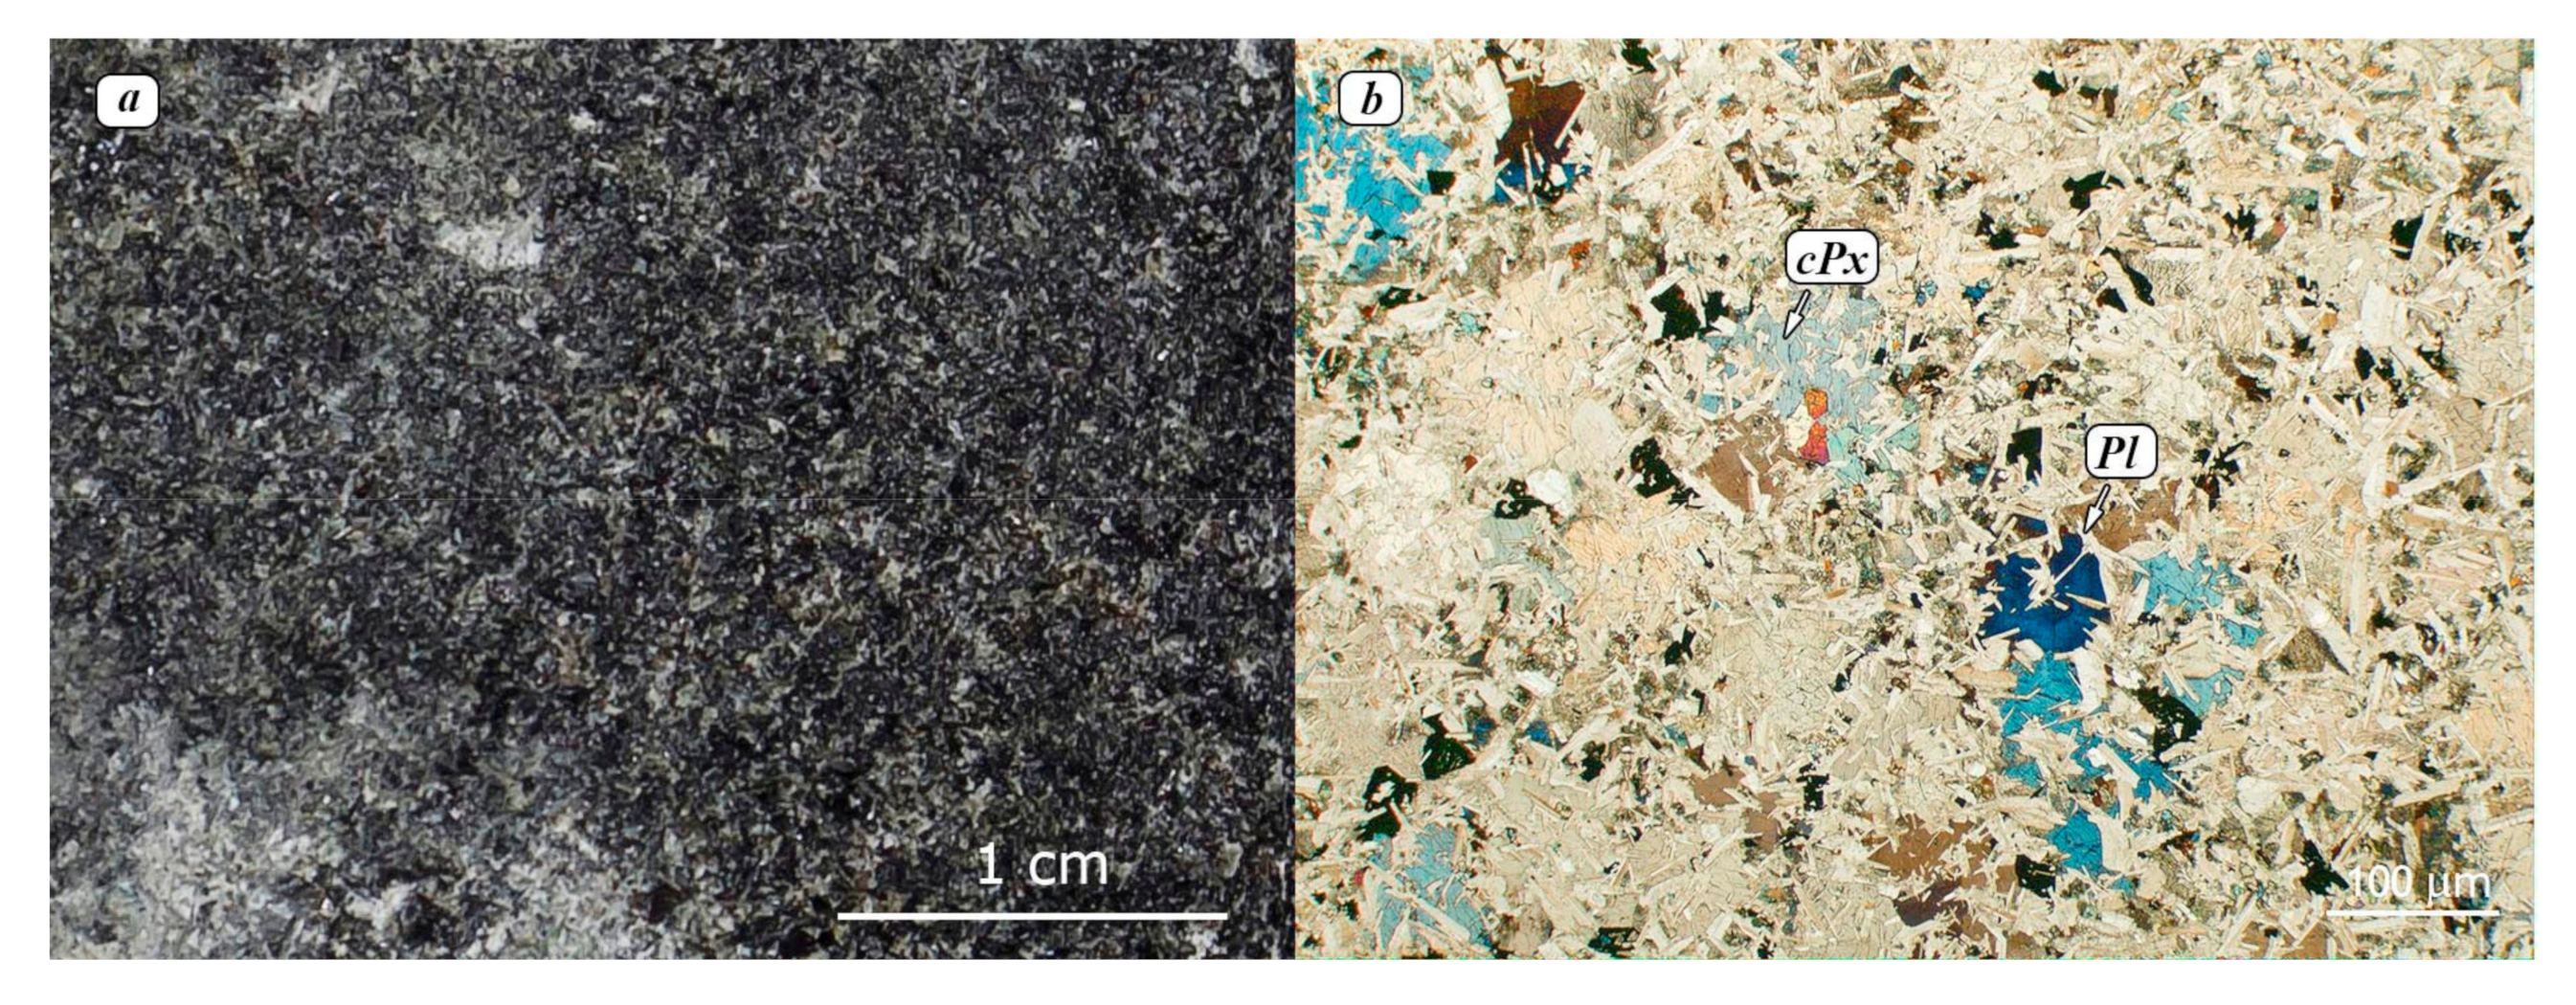
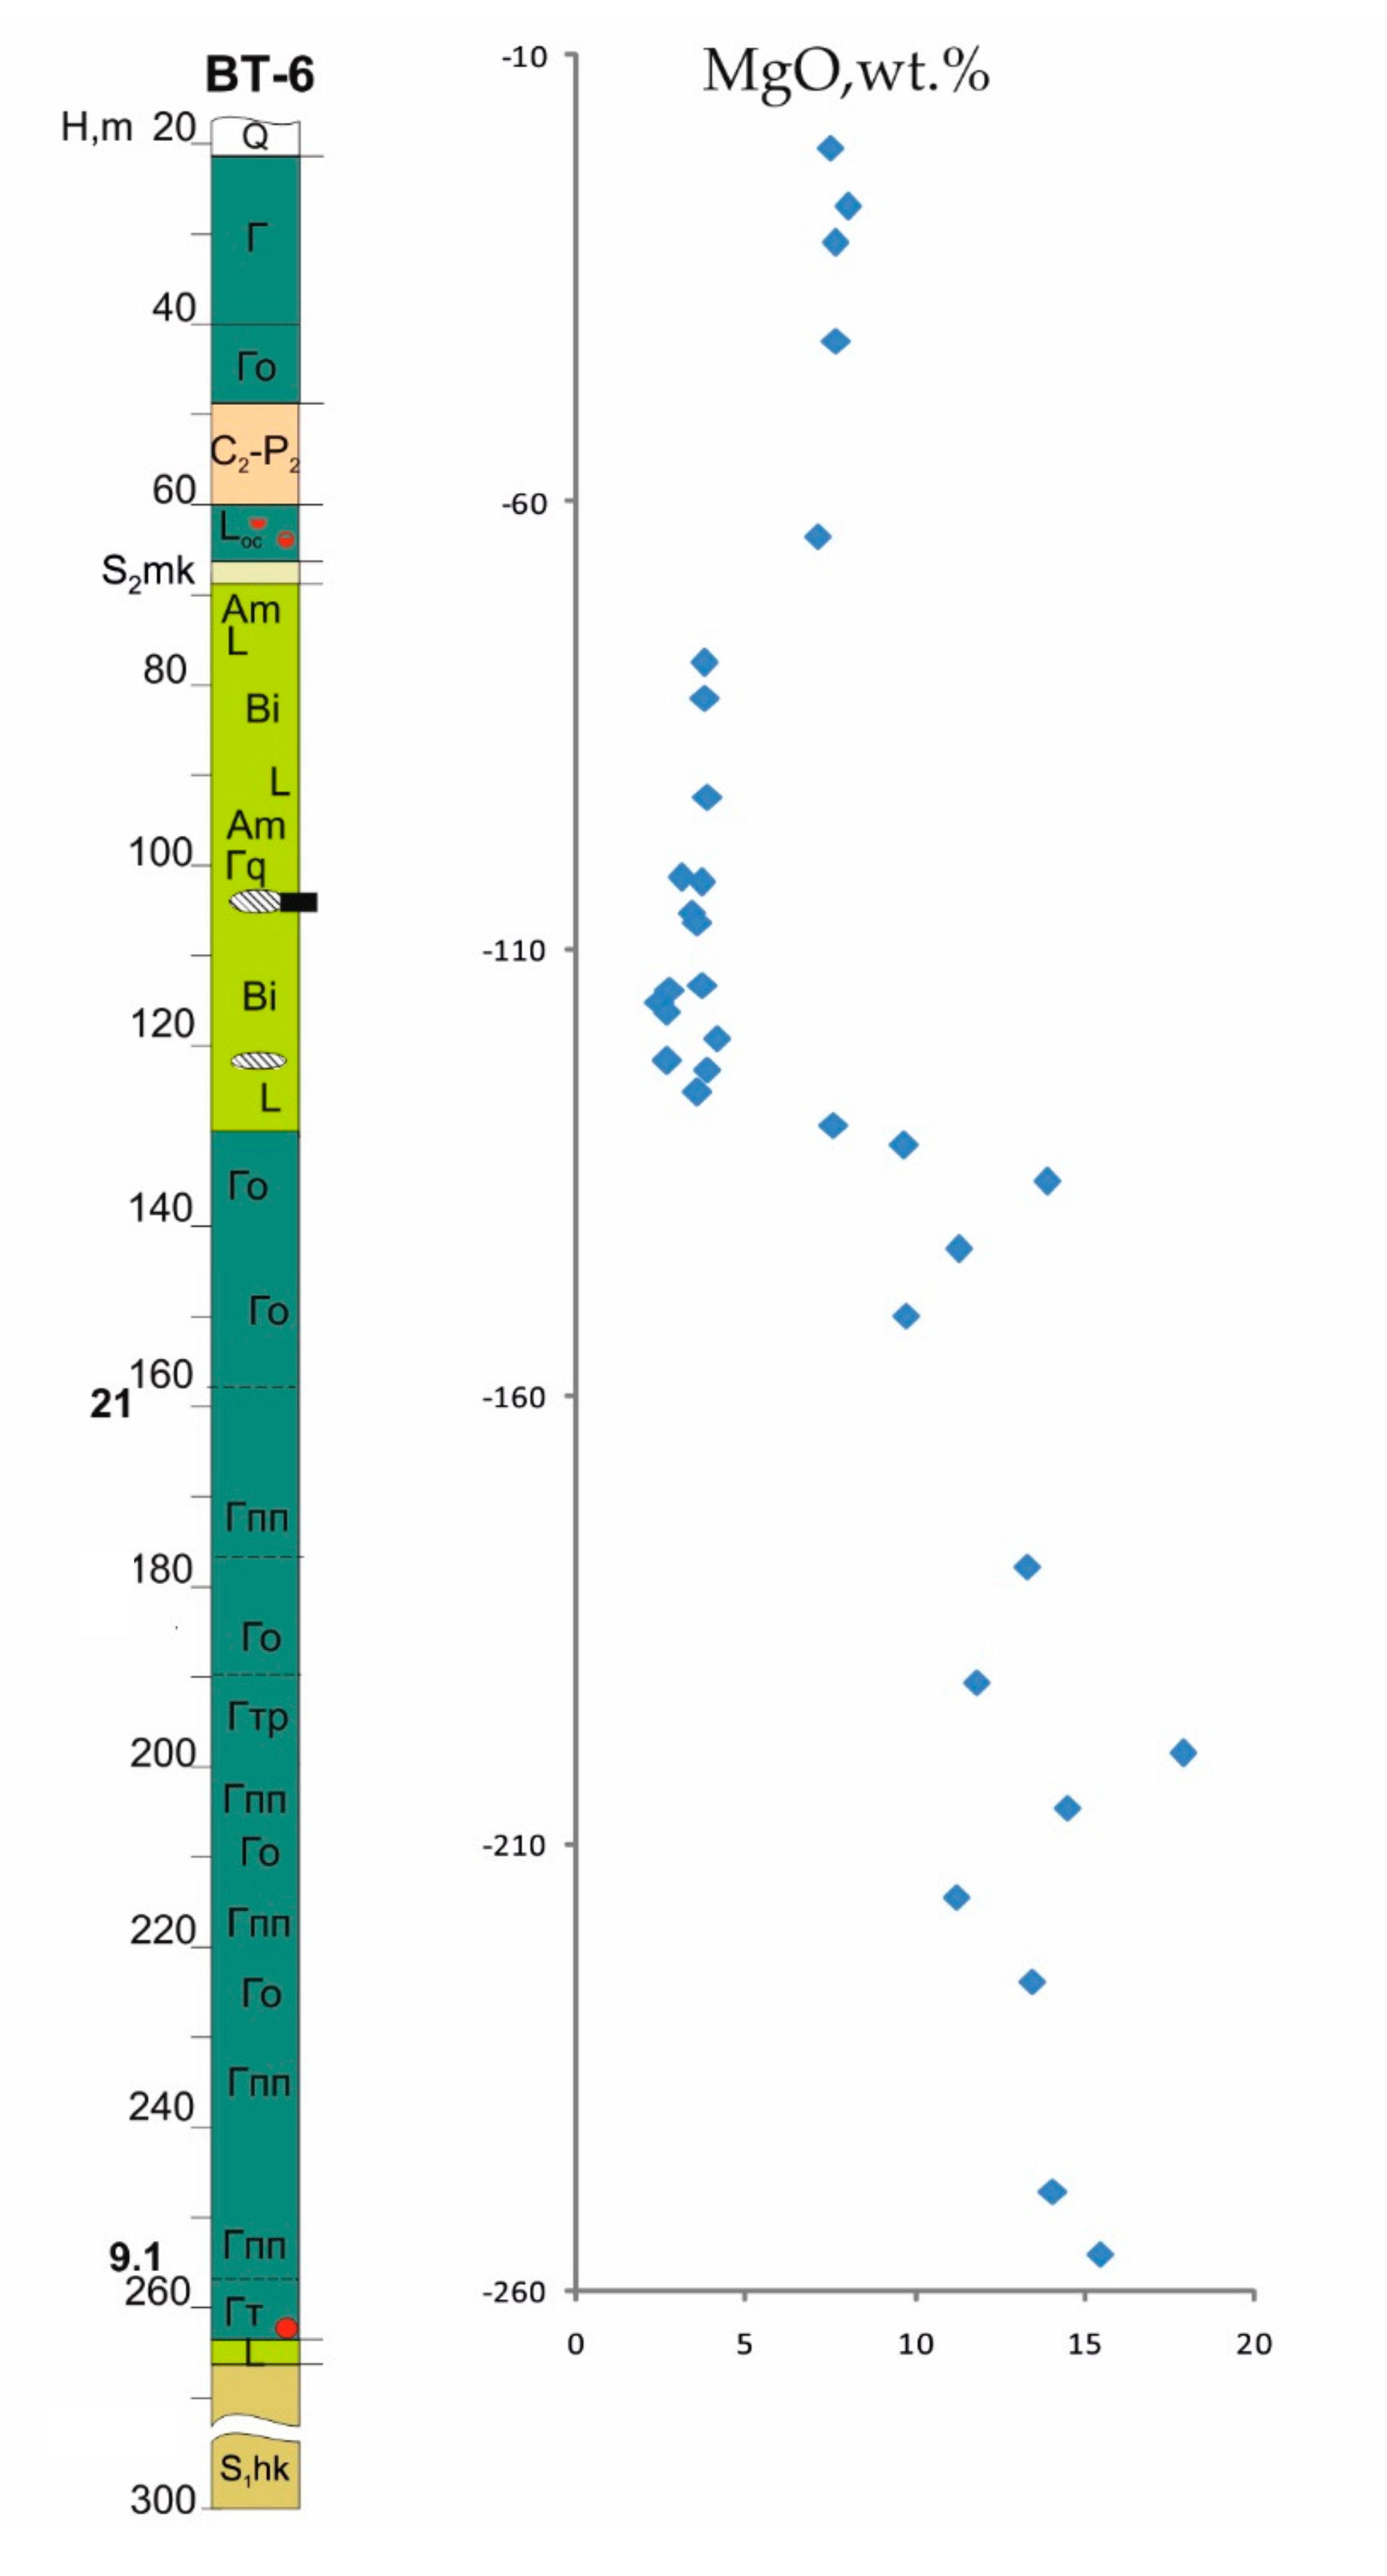
3.1. Inner Structure and Petrography of Intrusions

As indicated on the map and cross-section in Figure 2, intrusions previously attributed to the Ergalakh and Norilsk (nr) complexes are penetrated by boreholes BT-1, BT-6 and BT-8, and are logged as shown in Figure 3.
The trachydolerites of the Ergalakh complex (er in Figure 2 and Figure 3) are recognized on the basis of their elevated alkalinity, and are traditionally correlated with the Ivakinsky tuff-lava formation at the base of the Siberian Traps, with equally high alkalis and titanium [2,4,13,14,15]. This correlation is consistent with an absence of trachydoleritic sills within the Siberian Traps. However, there are some differences between typical Ergalakh rocks in the northern and central parts of the Norilsk district and those of the studied southern Turumakit area. First of all, trachydoleritic sills of the northern-central Ergalakh complex are usually thinner, darker and finer grained, while supposed Ergalakh rocks of the Turumakit area sills consist of paler and coarser grained trachygabbros, with numerous subalkaline pegmatite segregations (515 cm) with (vol %) 55−60 plagioclase, 20−35 pyroxene, 0−12 olivine, 1−15 amphibole + chlorite, 0%−5% quartz, and up to 3% apatite, biotite, magnetite and ilmenite. Zircon and baddeleyite are only scarce accessory minerals.
Subalkaline rocks of the Ergalakh complex within the Turumakit area are represented by sill-like bodies reaching up 200 m in thickness and 10–20 km in length. Their thickness of the upper sill in the BT-1 borehole is 80 m (Figure 3) and the lower sill is penetrated to 25 m. The absence of both an upper and lower chilled margin, typical of other Norilsk complex intrusions (Figure 3), do not provide field evidence on relative age relationships between intrusions. The mineral composition of the studied samples is as follows: olivine, pyroxenes and plagioclase are the main rock-forming minerals (Figure 4), and biotite, titanomagnetite and sulfides are subordinate. The main sulfides are represented by chalcopyrite, pyrrhotite and pentlandite; their concentration in the lower part of this intrusion is on average 1.5%–3%, but sometimes reaches 5%–7%. Of rare accessory minerals, apatite, zircon and baddeleyite are represented.
From the base to the top of logs in Figure 3, the Norilsk complex comprise taxitic (Figure 4h), picritic-like, olivine, olivine-bearing (Figure 4c,d,f,g) and olivine-free gabbros-dolerites; troctolites, leucogabbro and ferrogabbro; i.e., from basal olivine-rich (up 40 modal% of Fo74–68) cumulates to upper more evolved differentiates (olivine-bearing gabbro-dolerites) where Fo53–55 dominates. Plagioclase (An84–76) also changes in both its habit and composition up through this layered sequence, crystallizing as the earliest liquidus phase, together with olivine and with olivine inclusions in the picritic gabbro-dolerites and troctolites. Clinopyroxenes form large zoned crystals (up to 5–6 mm) with Mg# = (100 × MgO/(MgO + FeO)) = 86–74 (Mg# it is Mg number) compositions that decreases 52 in the uppermost ferrogabbros. Sulfides are chalcopyrite, pyrrhotite and pentlandite, and their concentration in the lower part of this intrusion average 1.5%–3%, but sometimes reaches 5%–7%.

3.2. Whole Rocks Composition

The petrographic features established for the supposed Ergalakh intrusive rocks in the Turumakit area are confirmed by their chemical composition and differ from typical Ergalakh rocks of the Norilsk district. (Table S1 and Table 1; Figure 5). In the Turumakit area, the rocks of the Ergalakh intrusion consist of gabbro and leucogabbro with elevated alkalis, while the intrusions of the Norilsk complex are enriched in olivine, forming a separate field in the diagram Px–Pl–Ol. The points of analyses for the Norilsk rocks are located between gabbro and troctolite.

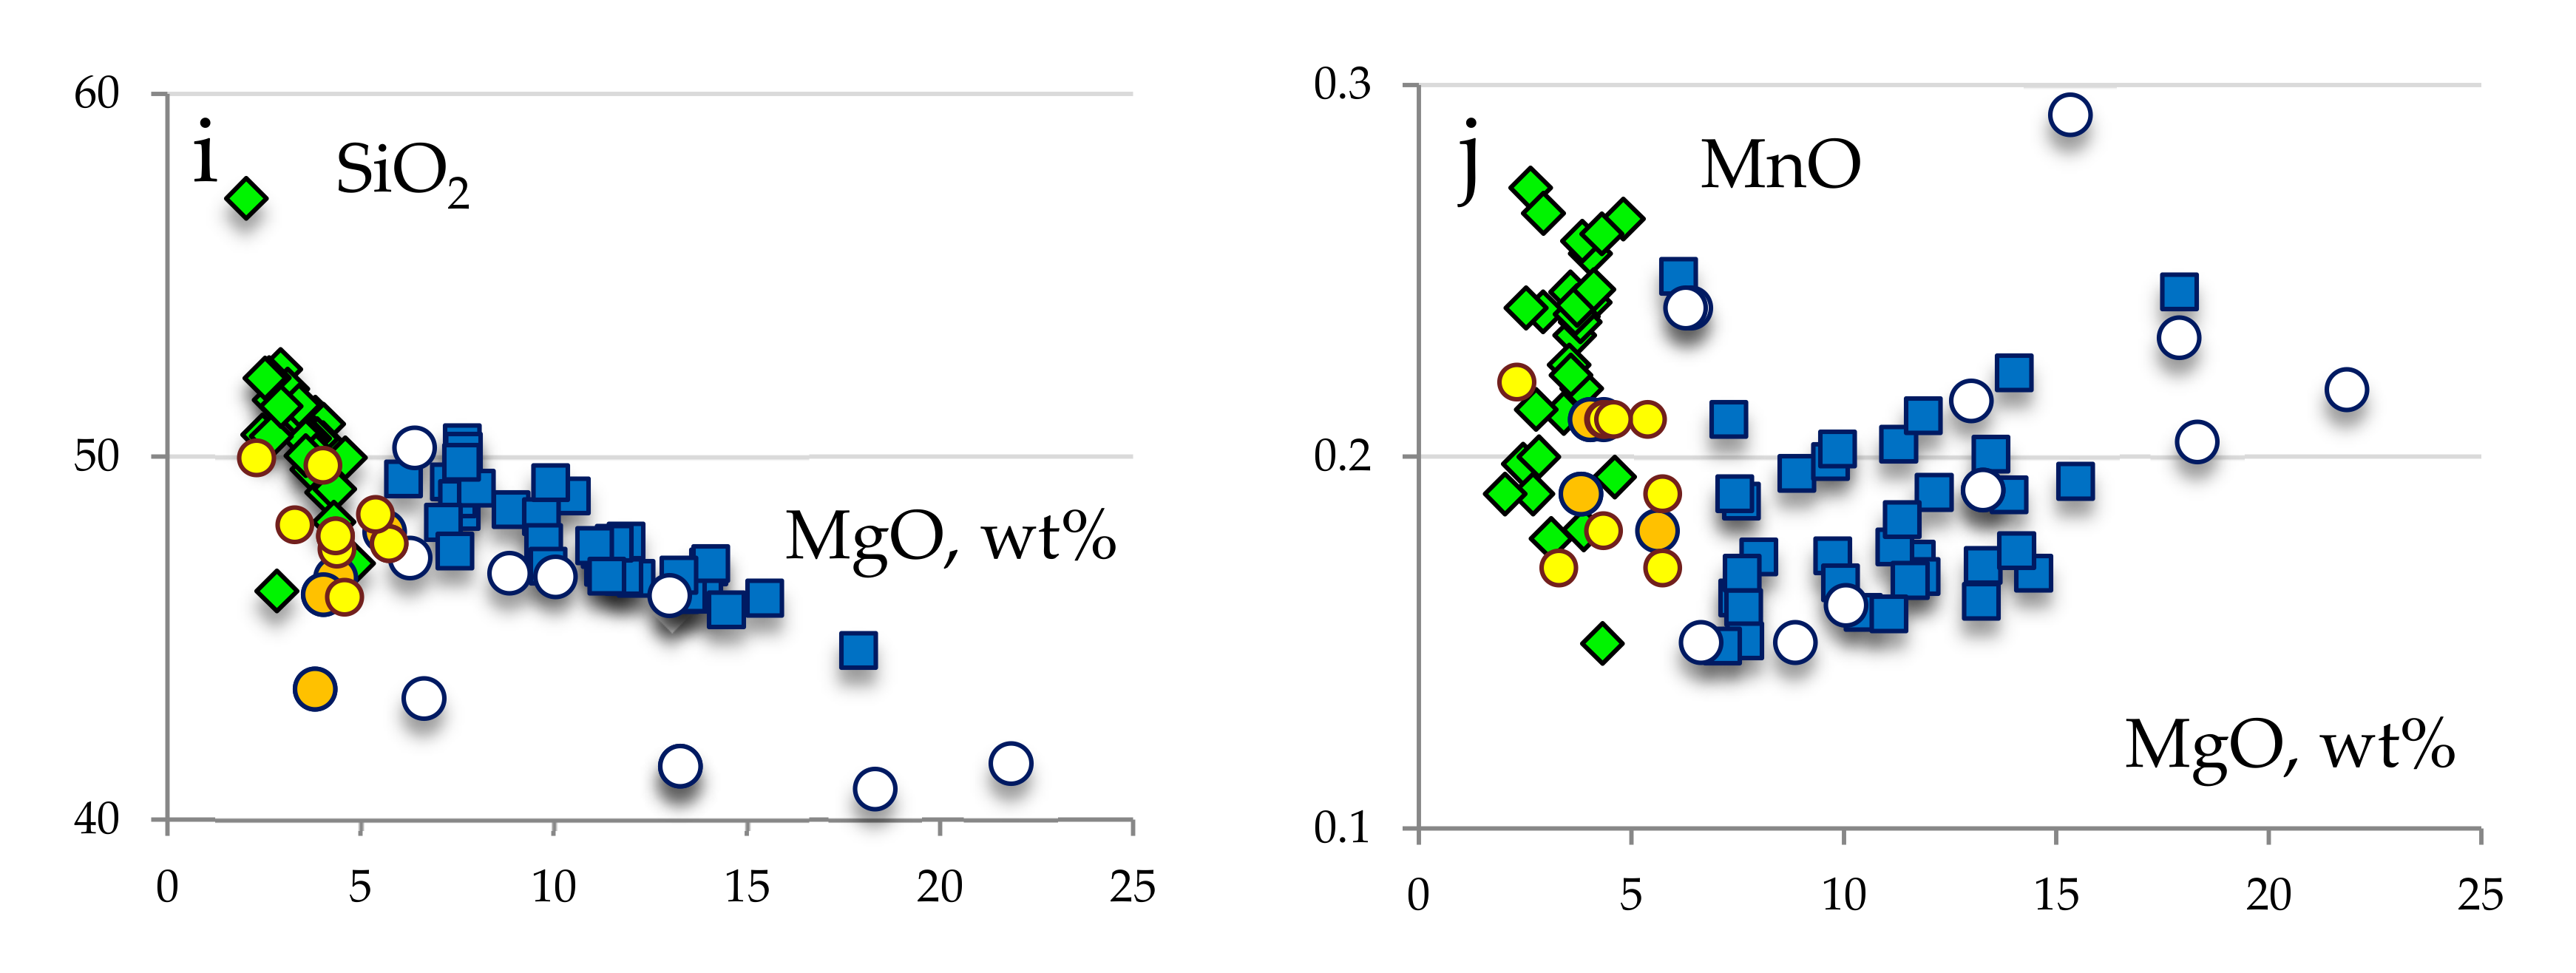
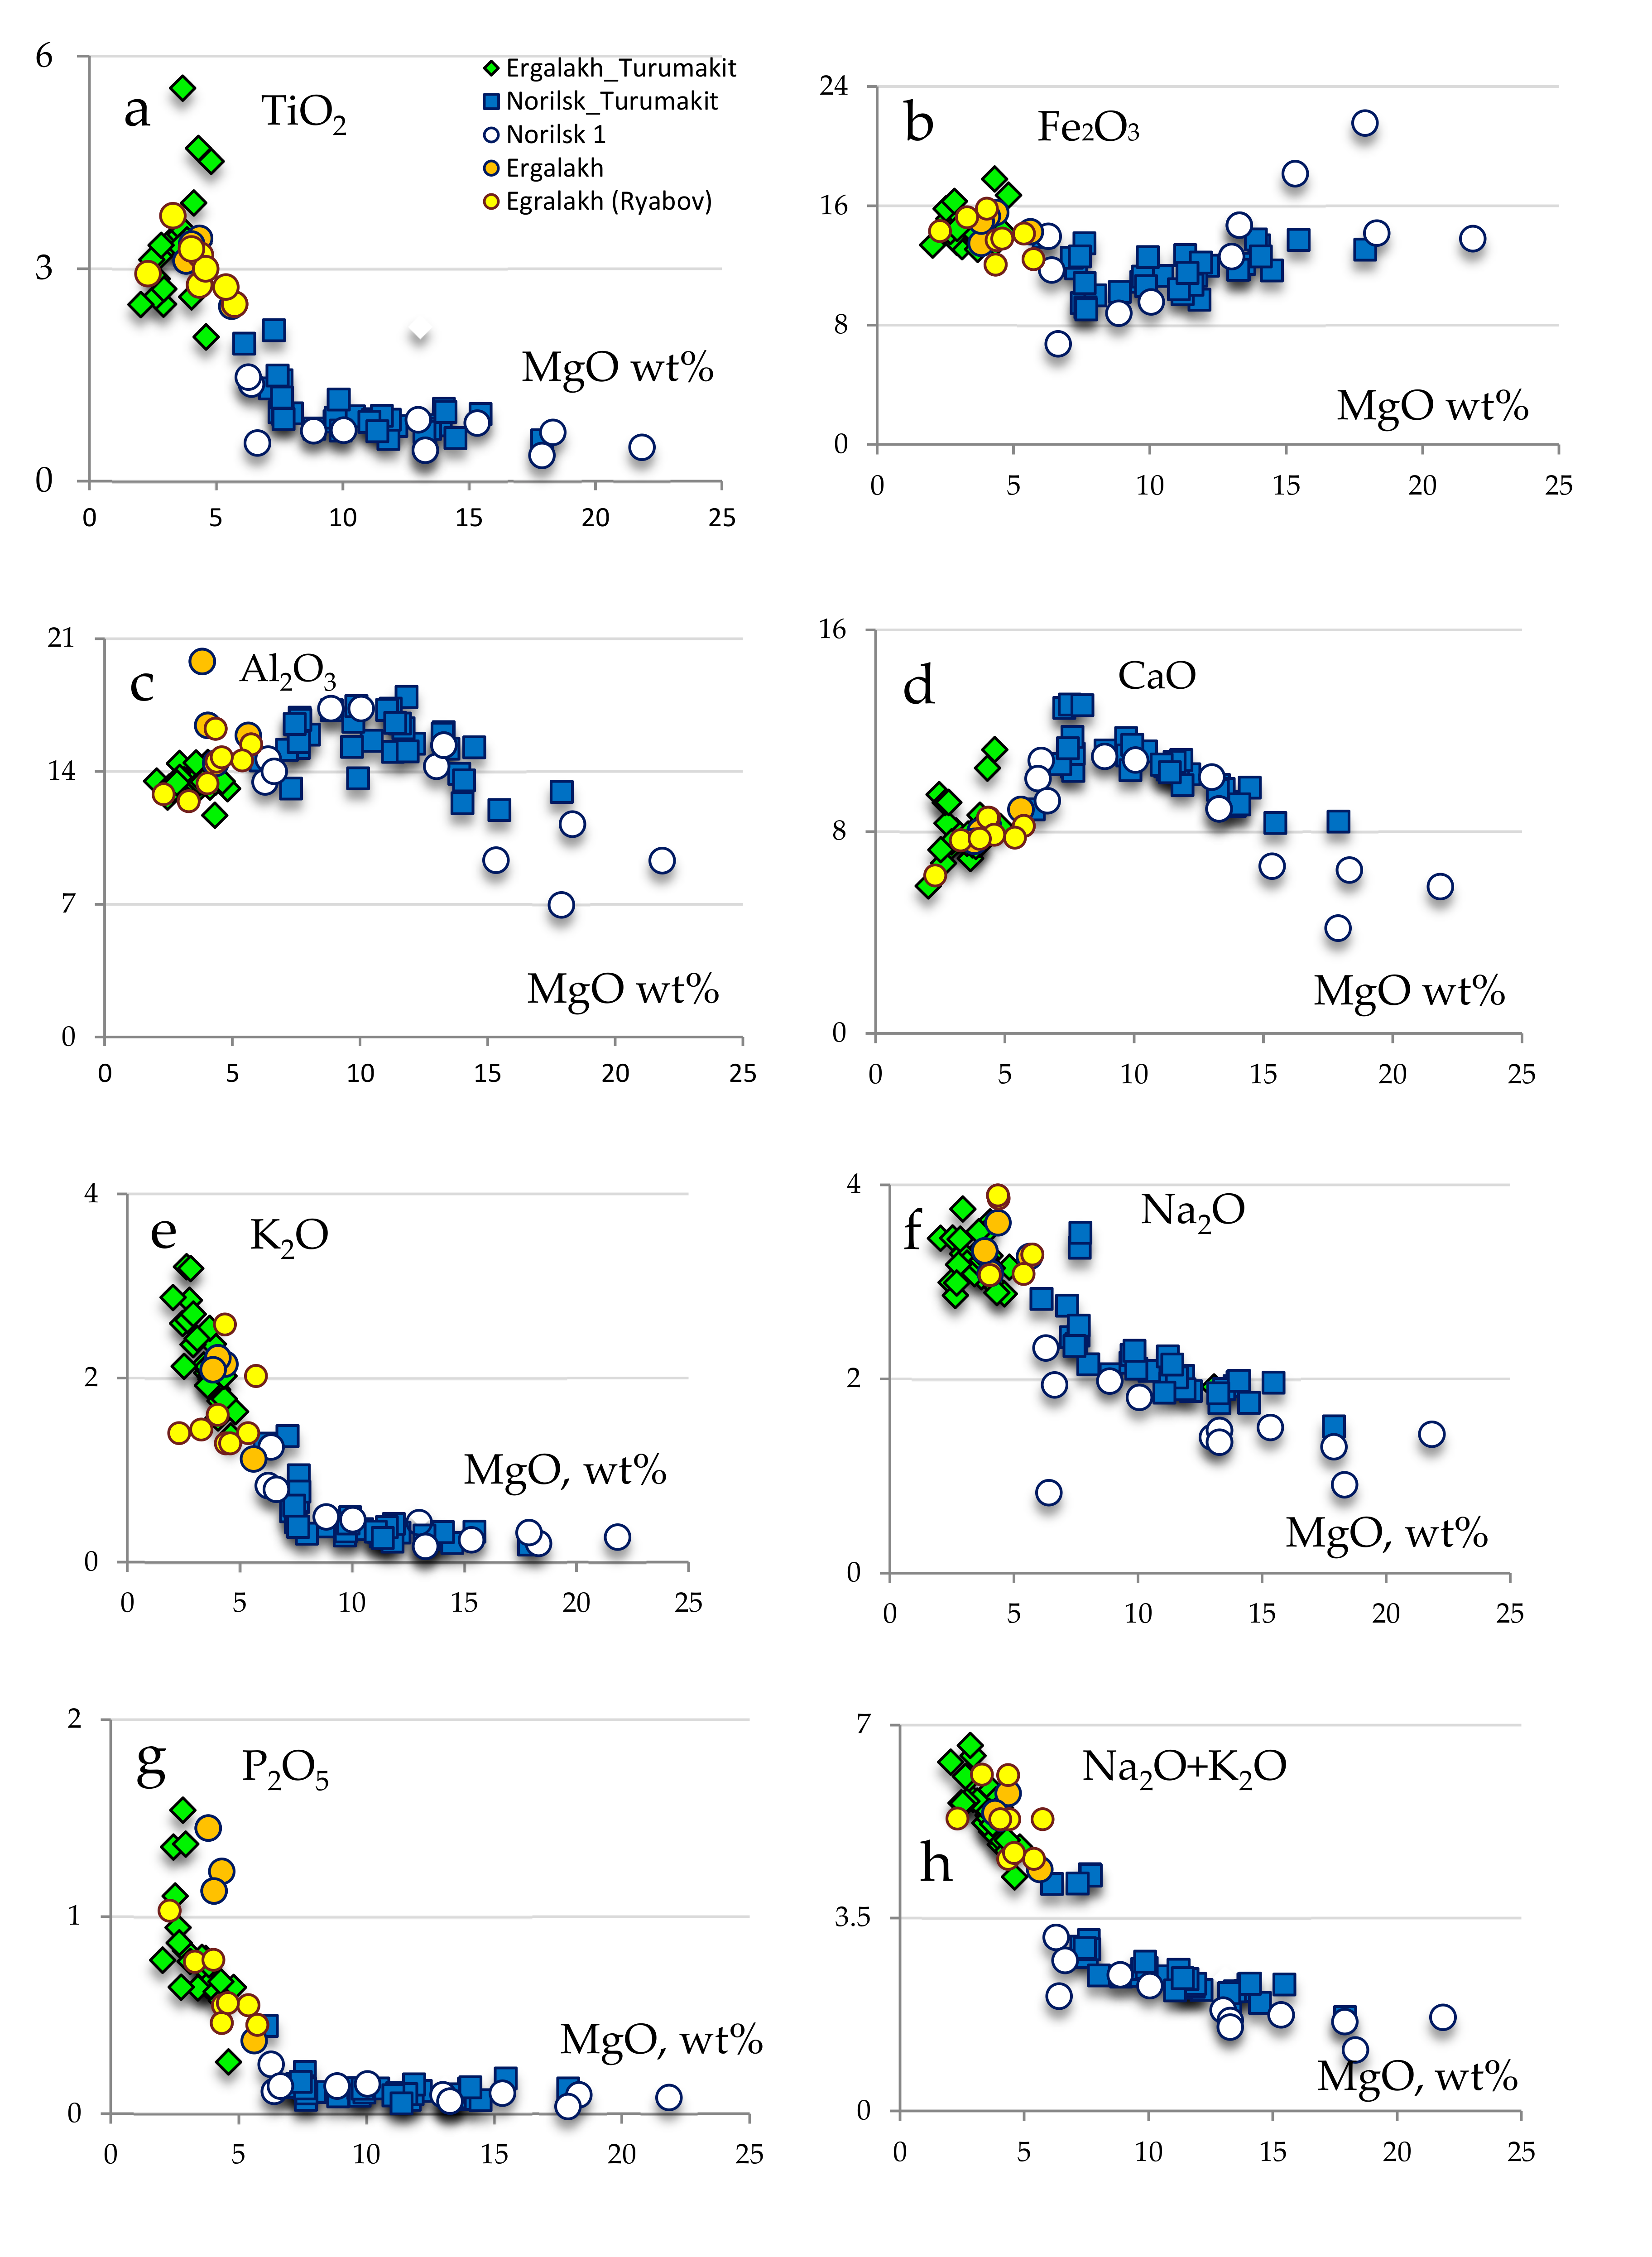
3.2.1. Major Components

To compare the studied rocks with typical rocks of the Ergalakh complex from the Kharaelakh trough and the Norilsk complex (the Norilsk 1 intrusion), we constrain series diagrams that demonstrate the behavior of major oxides during the crystallization reflected in MgO variations (Figure 6).
The main distinguishing feature of the Ergalakh rocks in the Turumakit area is the high TiO2 content, which reaches 5.47 wt % and usually exceeds 3 wt %–3.5 wt % (Figure 6a). All Ergalakh samples are also characterized by elevated FeO content (Figure 6b) in comparison with the Norilsk samples that are enriched in CaO and Al2O3(Figure 6c,d). The Ergalakh rocks in the Turumakit area also have a high alkali content (Figure 6e,f), Na2O + K2O up to 6.7 wt %. The elevated alkali contents in these rocks allow us to attribute them to coarser grained equivalents to volcanic trachybasalts or basaltic trachyandesites (Figure 6), while all samples from the Norilsk intrusive complex are basalts.
Concentrations of P2O5 in these rocks are high and from 0.64 to 1.54 (Figure 6g), and maximum SiO2 content is 57.1 wt % (Figure 6i). The Norilsk intrusions from the Turumakit region are characterized by higher MgO (up to 17.9 wt %) and lower concentrations of TiO2, alkalis, P2O5 and FeO. Figure 6a shows that the TiO2 content increases in the process of the fractionation of the primary melt in contrast to the supposed Ergalakh intrusion, in which high titanium is a primary characteristic. The composition comparison of the Ergalakh rocks in the Kharaelakh trough with those from the Turumakit demonstrates their similarity (Figure 6) in some oxides, i.e., CaO and P2O5, but there is a significant difference in SiO2, Al2O3 and TiO2.
The layered inner structure is reflected in the MgO distribution in rocks of the Norilsk complex (the example of borehole BT-6). The MgO content increases toward the lower contact of the intrusion (Figure 7), and there are some high picks reflecting the appearance of picritic and taxitic gabbro-dolerites in the section (depth 130–150 m, 190 m). The upper part of this section is represented by olivine gabbro with 7 wt %–8 wt % MgO. It is suggested that these rocks belong to the same intrusive body into which the BT-6 borehole penetrated at a depth of 130–270 m and formed its upper endo-contact zone. Thus, we suggest that the single massif of the Norilsk complex was intruded by late trachydolerite magma of the Ergalakh complex. This assumption is also proven by the composition of the rocks: on the BT-6 section (Figure 7) there is an interval from 70 down to 130 m with a low MgO (3 wt %–4 wt %) as low as typical for Ergalakh trachydolerites.

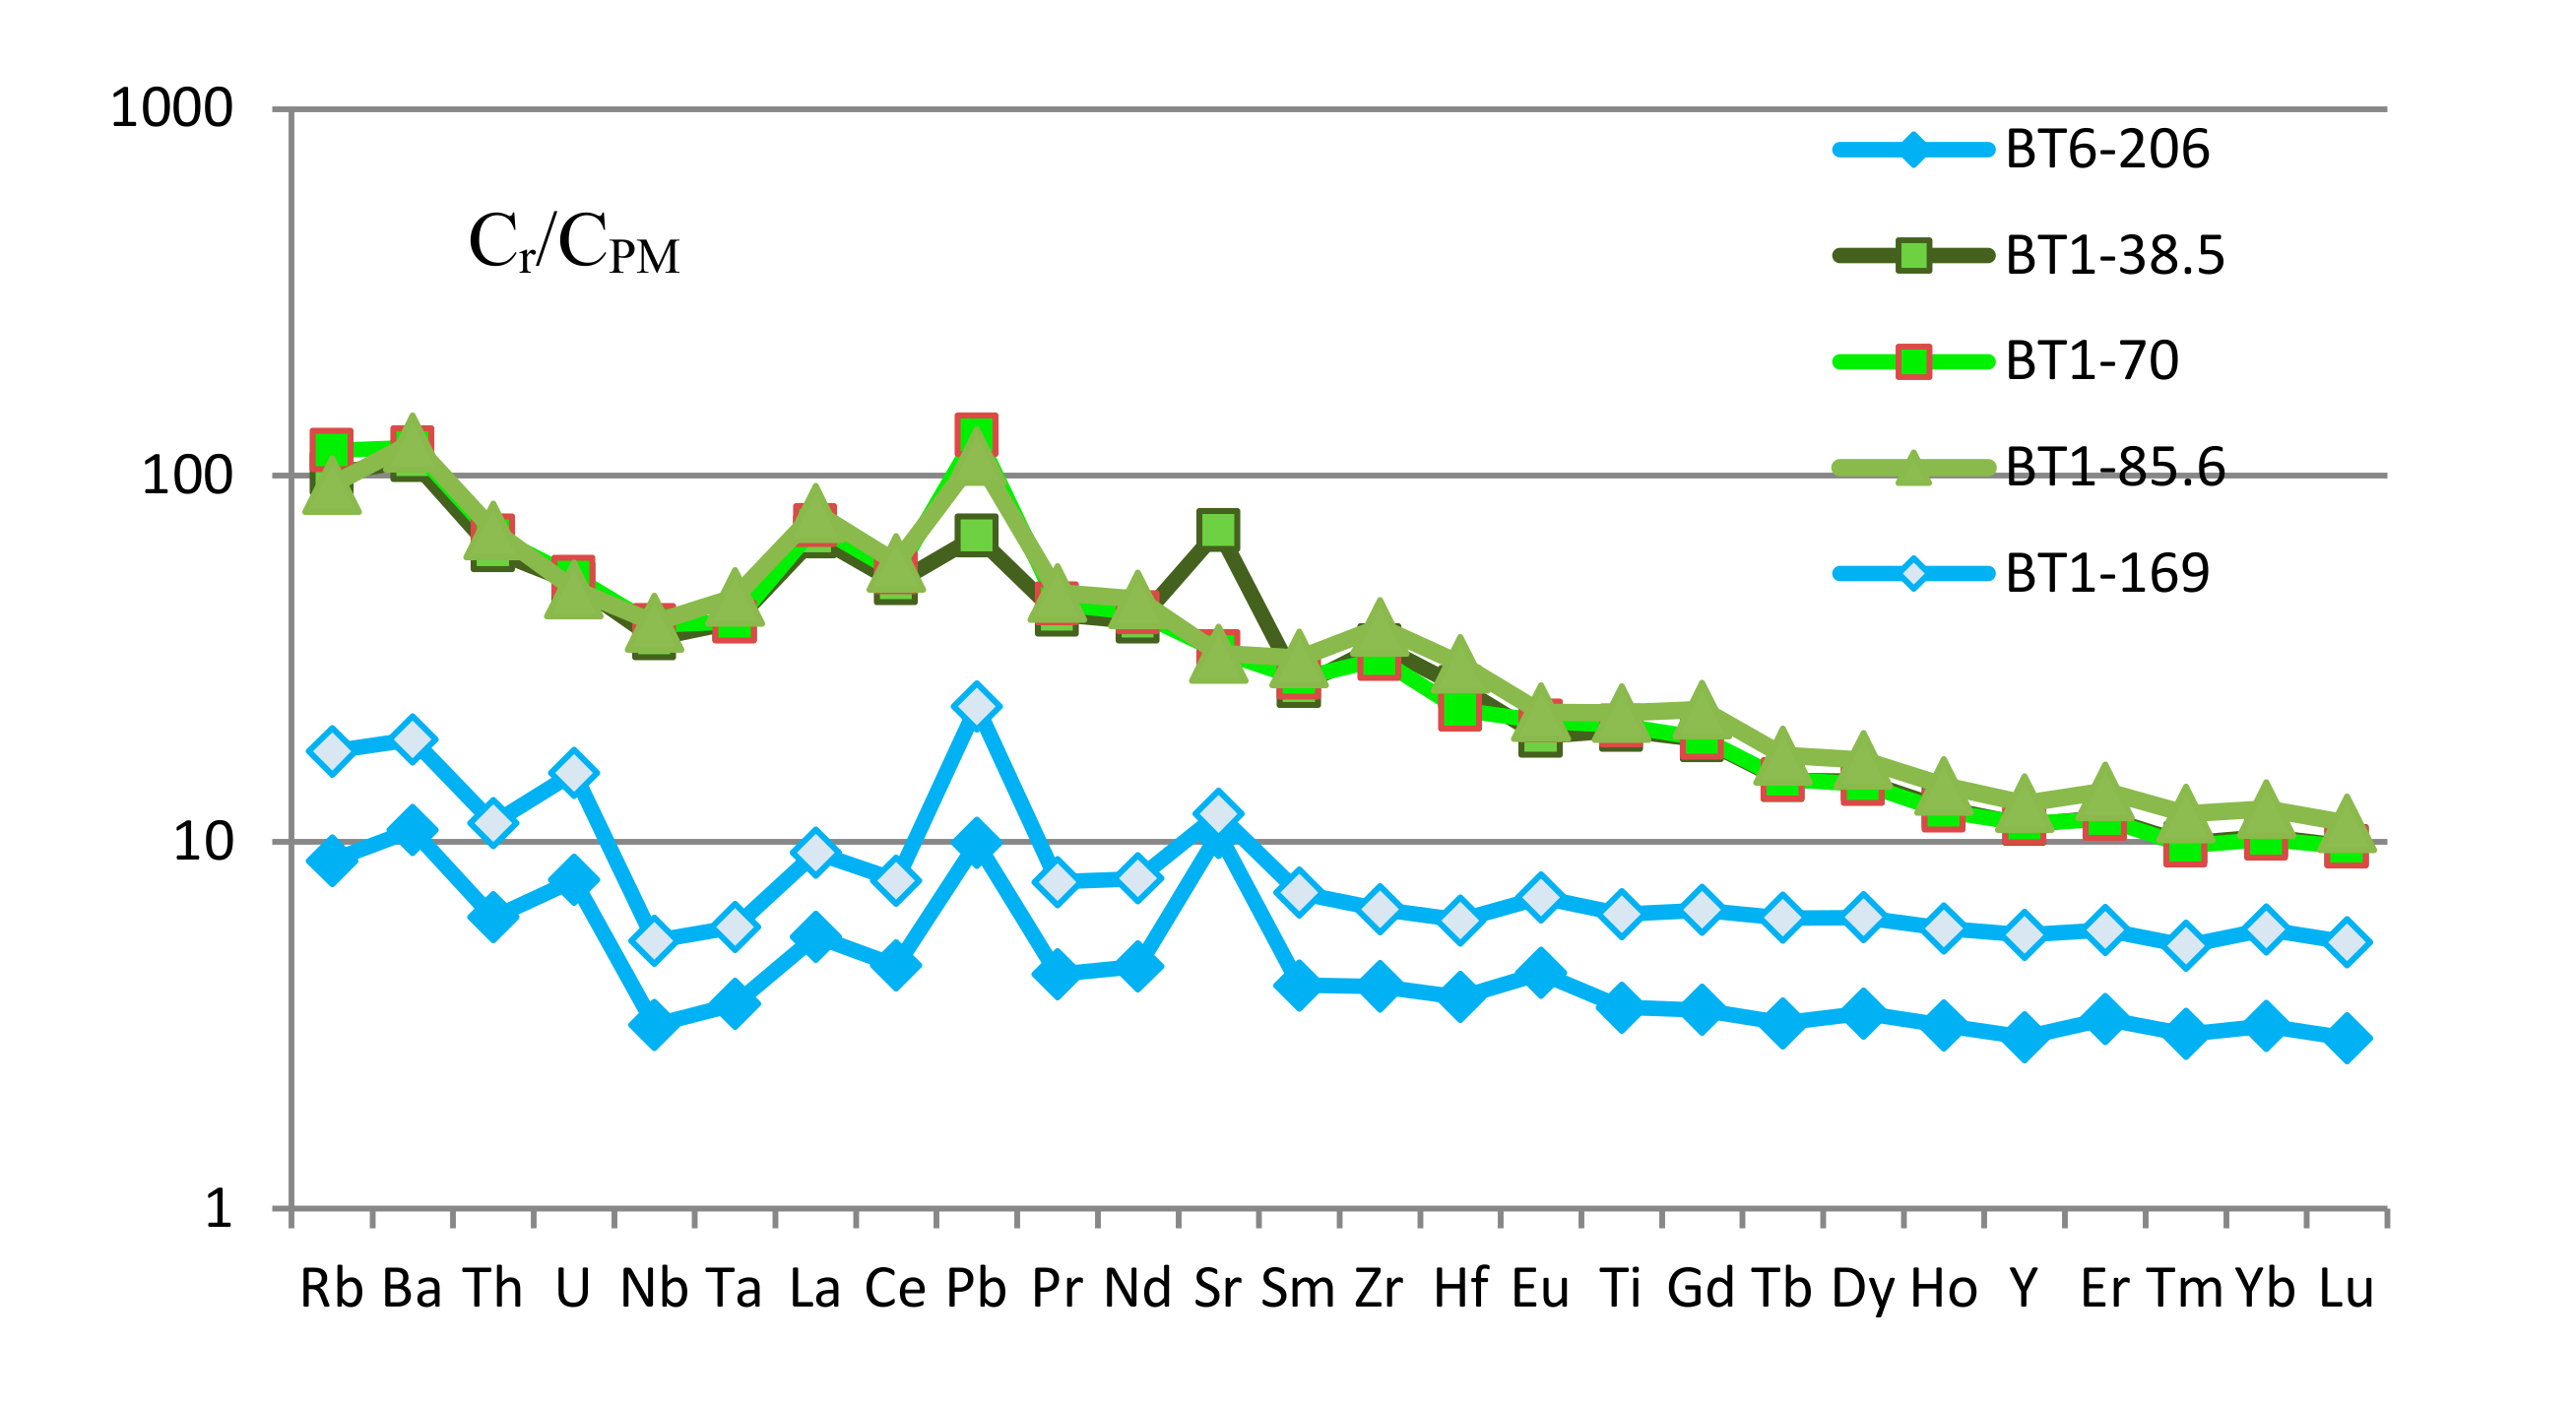
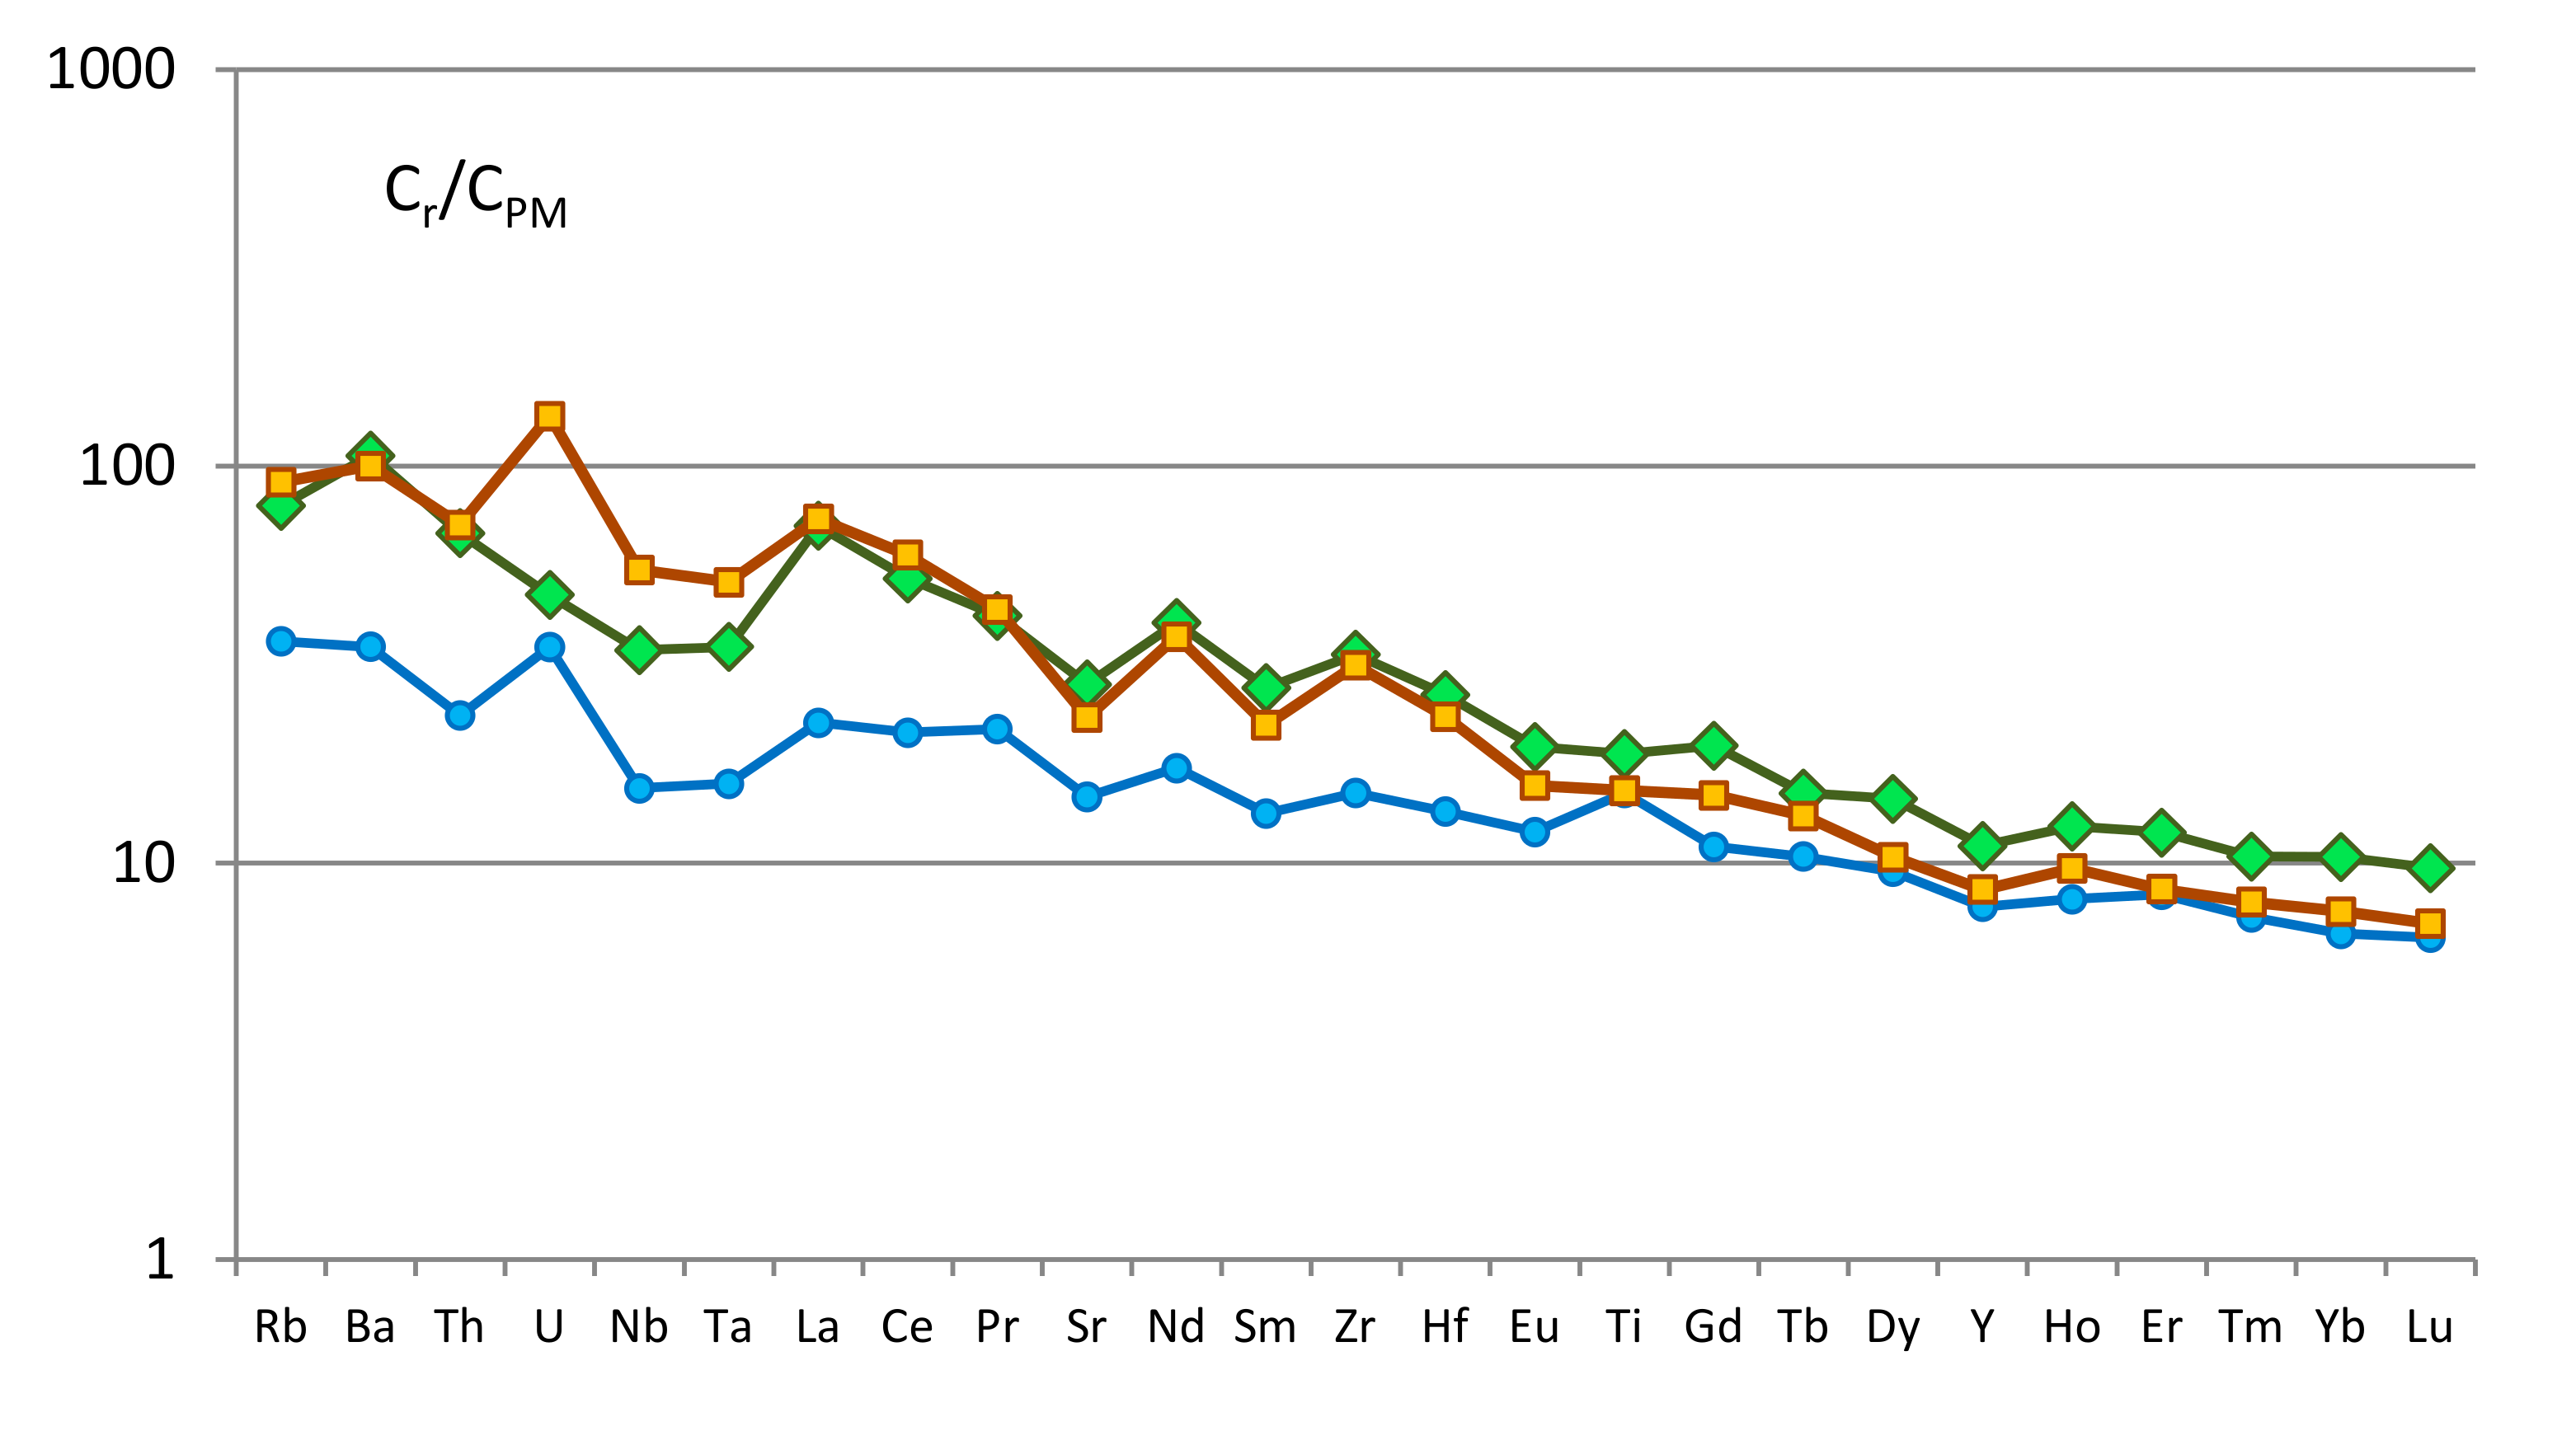
3.2.2. Trace Elements

Trace element patterns also differ between the alleged Ergalakh and Norilsk intrusions of the Turumakit area. The supposed Ergalakh trachydolerites are more enriched in all incompatible elements compared to the cumulates of the Norilsk intrusion (Figure 8). Both complexes, however, are characterized by small, negative Ta–Nb and positive Pb and Sr anomalies, where the latter may be attributed to plagioclase accumulation. Lower Nb–Ta and elevated Pb are typical lithospheric signatures that could be derived from a lithospheric mantle and/or crustal assimilation.
The (Gd/Yb)n ratios of 1.9–2.0 and 1.2–1.3 for Ergalakh and Norilsk complexes suggest that their primary melts segregated from a deeper garnet- and a shallower spinel-bearing mantle source, respectively, as the boundary between garnet- and spinel-lherzolite sources passes through the value (Gd/Yb)n = 2 [18].

3.3. Age of Intrusive Rocks

The following U–Pb ages of the igneous rocks of the Ergalakh, Norilsk and Daldykan intrusions in the Turumakit area are based on a variable number of baddeleyites and zircons within six samples, the geochemical compositions and locations of which are provided in Table 1 and Figure 3.

3.3.1. Ergalakh Intrusion in Turumakit Area

Baddeleyite and zircon were separated from coarse-grained trachydolerite samples BT-1/114.6 and BT-6/105.5 (Figure 9a,b). From the first sample we have separated 20 baddeleyite grains, which are represented by the elongated and almost isometric fragments of lamellar crystals, from 50 to 150 µm in length (Figure 10). Its color changes from light (grains 11.1 and 13.1, Figure 11) to dark brown (19.1, Figure 10). They are transparent (17.1) and translucent (3.1), sometimes fractured (10.1, 15.1), with characteristic shading along the elongation of crystals (16.1) and stepped relief (8.1, 18.1). Single crystals have well distinguished prism [011] faces (13.1, 7.1). The U–Pb system of the studied baddeleyite grains is marked by high U (300–3000 ppm) and low Th (2–350 ppm), and a sufficiently high radiogenic 206Pb (10–110 ppm), which translates to low analytical errors of measured isotopic ratios.
The estimated concordant age for BT-1/114.6 trachydolerite based on 18 out of 20 U–Pb analyses of baddeleyite is 245.3 ± 3.0 Ma (Figure 11a) if the correction for the share of common Pb was made with the assumption of 206Pb/238U and 208Pb/232Th age-concordance (208Pb correction-method). From the second BT-6/105.5 trachydolerite sample, several baddeleyite grains coated with a polycrystalline micro-zircon shell were selected for U–Pb isotopic analysis. In some cases, the morphology of the baddeleyite crystals is preserved, but the grain composition corresponds to zircon, presumably reflecting the replacement of baddeleyite with zircon with an increase in silicic activity during the evolution of magmatic melt. We tried to perform an isotopic analysis separately on the surviving baddeleyite matrix or on the newly formed zircons, but the U–Pb system for both analyzed minerals turned out to be almost identical (U from 500 to 4000 ppm for baddeleyite and 570–2150 ppm for zircon, and Th 40–3100 and 450–5460 ppm, radiogenic 206Pb 15–130 and 10–90 ppm, Th/U: 0.1–0.9 and 0.6–2.8, respectively). Thus, two ages based on (1) three zircon analyses and (2) 10 baddeleyite analyses (Figure 11b) give similar values within their limits of uncertainty 245.2 ± 8.7 and 240.6 ± 7.9 Ma, respectively. Recalculation by the sum of all 13 analyses leads to a date of 244.3 ± 4.5 Ma, which is also indistinguishable from the corresponding value for another trachydolerite sample BT-1/114.6.
The best age estimation of the Ergalakh intrusion crystallization can be obtained for all 31 U–Pb SHRIMP-II isotopic analyses of baddeleyite and zircon from both samples, namely 244.8 ± 2.7 Ma (Figure 11c).

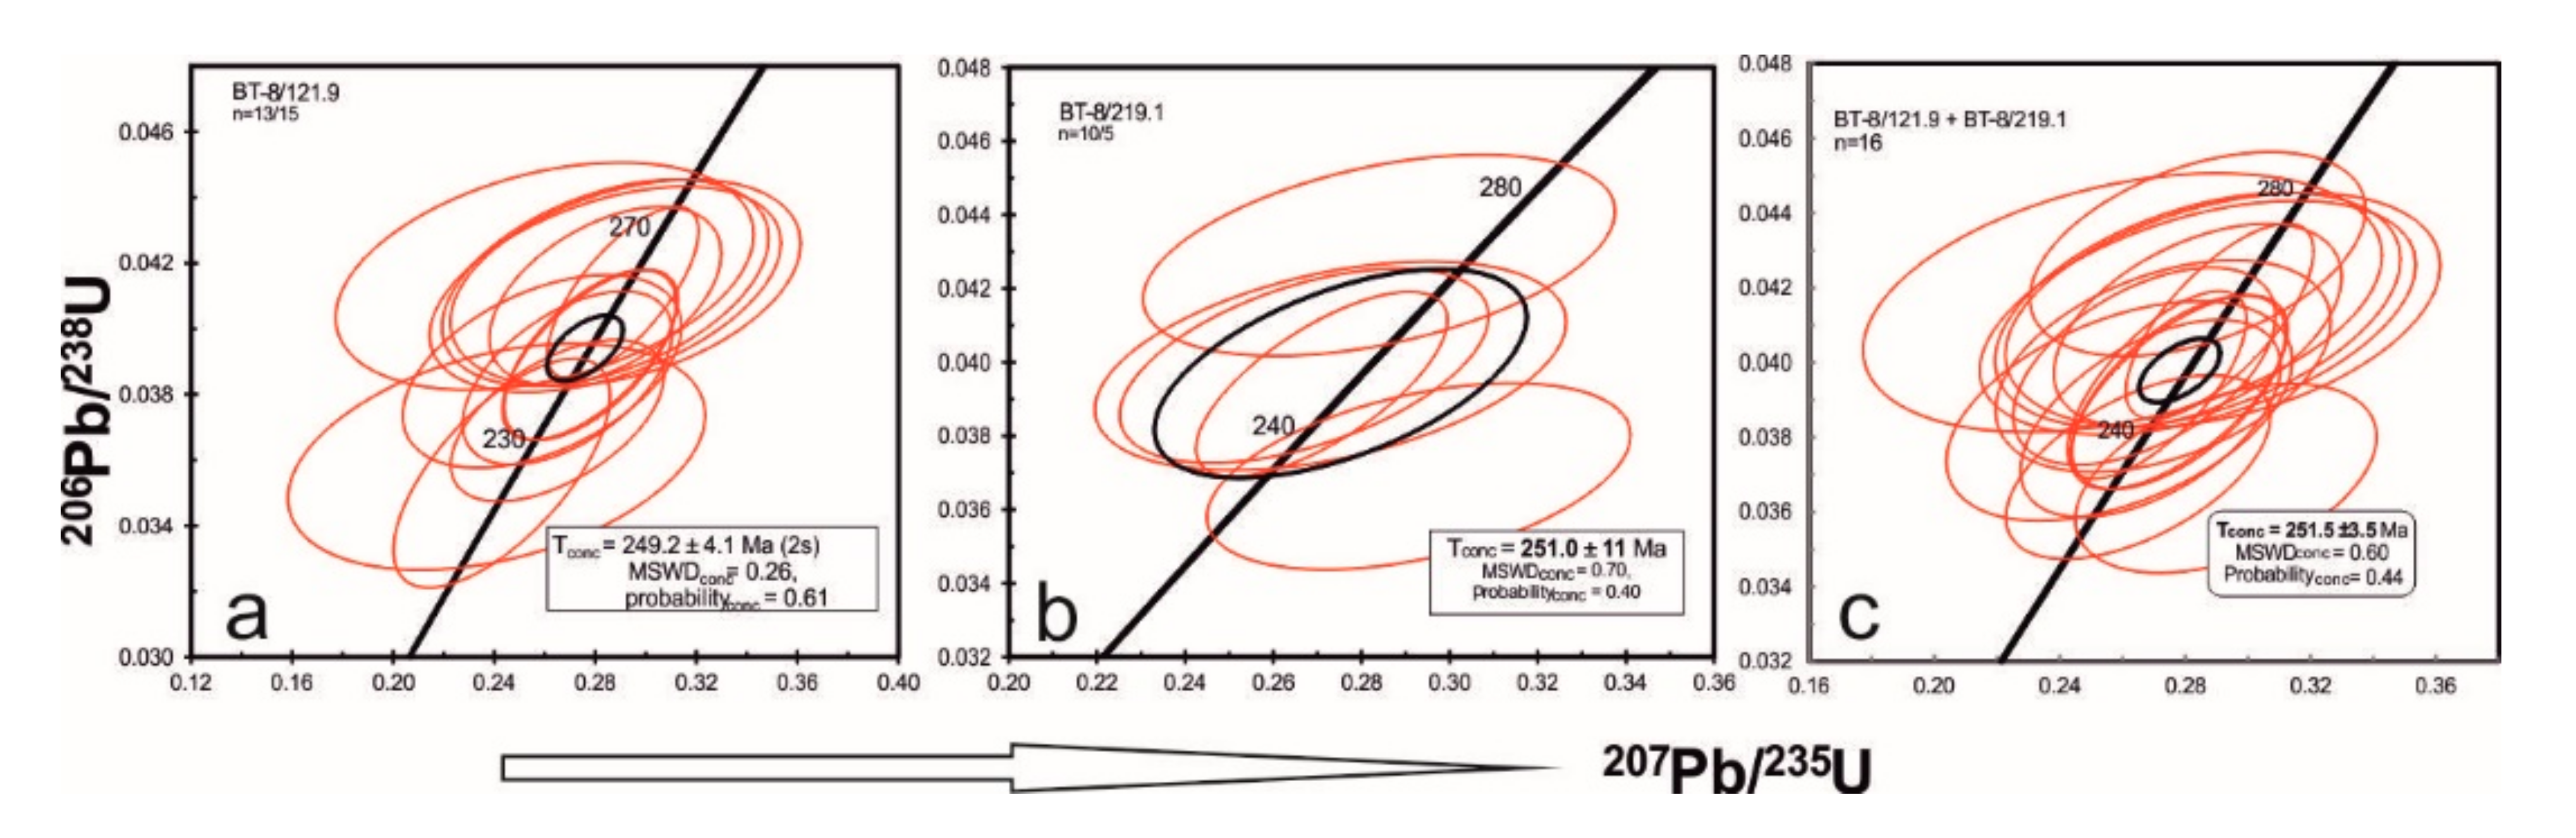
3.3.2. Norilsk Intrusions

Baddeleyites from two samples of gabbro-dolerites from the Norilsk-type intrusions (Figure 12), BT-8/121.9 and BT-8/219.1, are similar, and do not differ in appearance from that shown in Figure 9.
In the first sample, baddeleyite is represented by light brown, transparent, elongated and isometric fragments of plate crystals with a size of 50–100 µm. Individual crystals have a characteristic hatching (6.1) and prism faces [011] (4.1, 6.1). In the second sample BT-8/219.1, finer grains ranging in size from 50 to 80 µm, elongated and irregular fragments of plate crystals from light to saturated brown were found. Separate grains have a characteristic hatching (6.1), a stepped relief (10.1) and a prism faces [011] (6.1).
15 U–Pb SHRIMP-analyses on 13 baddeleyite grains were performed for the BT-8/121.9 gabbro-dolerite. Their uranium and thorium contents varied between 100–1200 and 2–70 ppm, respectively, and the Th/U ratio also varied between 0.01 and 0.1. While the proportion of non-radiogenic lead did not exceed 1.6%, radiogenic 206Pb only varied in the range 3–40 ppm, and this made it possible to measure radiogenic 206Pb to 238U ratios with an error of less than 2.6%–4.5% (1σ confidence level). Moreover, all data-points are concordant within this error range (Figure 13a), but are distributed alongside the Concordia line from 220 to 280 Ma due to a non-perfect matrix-matched or crystal-lattice orientation effect. The age of 251.2 ± 5.7 Ma was obtained from 14 out of 15 analyses, with an MSWD of 0.3 and a concordance probability of 0.56. The exception of grain 9, with very poor and inconsistent lead emissions, gives a slightly lower concordant age of 249.2 ± 4.1 Ma (MSWD 0.2, probability 0.6, 13 analyses, Figure 11a). If we only use 11 analyses with the least individual errors, then the resulting concordant age is a 251.8 ± 4.3 Ma (with an MSWD of 0.1 and a probability of concordance of 0.7).
In the case of BT-8/219.1 gabbro-dolerite, the U–Pb local analysis was carried out on all 10 separated baddeleyite grains, but the small grain size and mainly low Pb radiogenic content (as low as 1.5–36 ppm) led to sufficiently large analytical errors (up to 7%–8% in the 207Pb/206Pb ratio). While other characteristics of the U–Pb isotope system of this baddeleyite are very similar to those that have baddeleyite BT-8/121.9, the U varies from 150 to 1000 ppm, Th from 2 to 100 ppm, common Pb from 0.2 to 1.5% and 206Pb/238U ages ranges from 200 to 280 Ma. This leads to concordant age estimation with increased uncertainty of 251.0 ± 11 Ma for the most consistent cluster of the 5 out of 10 data-points (Figure 13b).
Combining 16 U–Pb baddeleyite analyses from both Norilsk intrusion samples provides a concordant age of 251.5 ± 3.5 Ma, which is preferred as the best age estimation for the time of the Norilsk intrusion formation (Figure 13c).

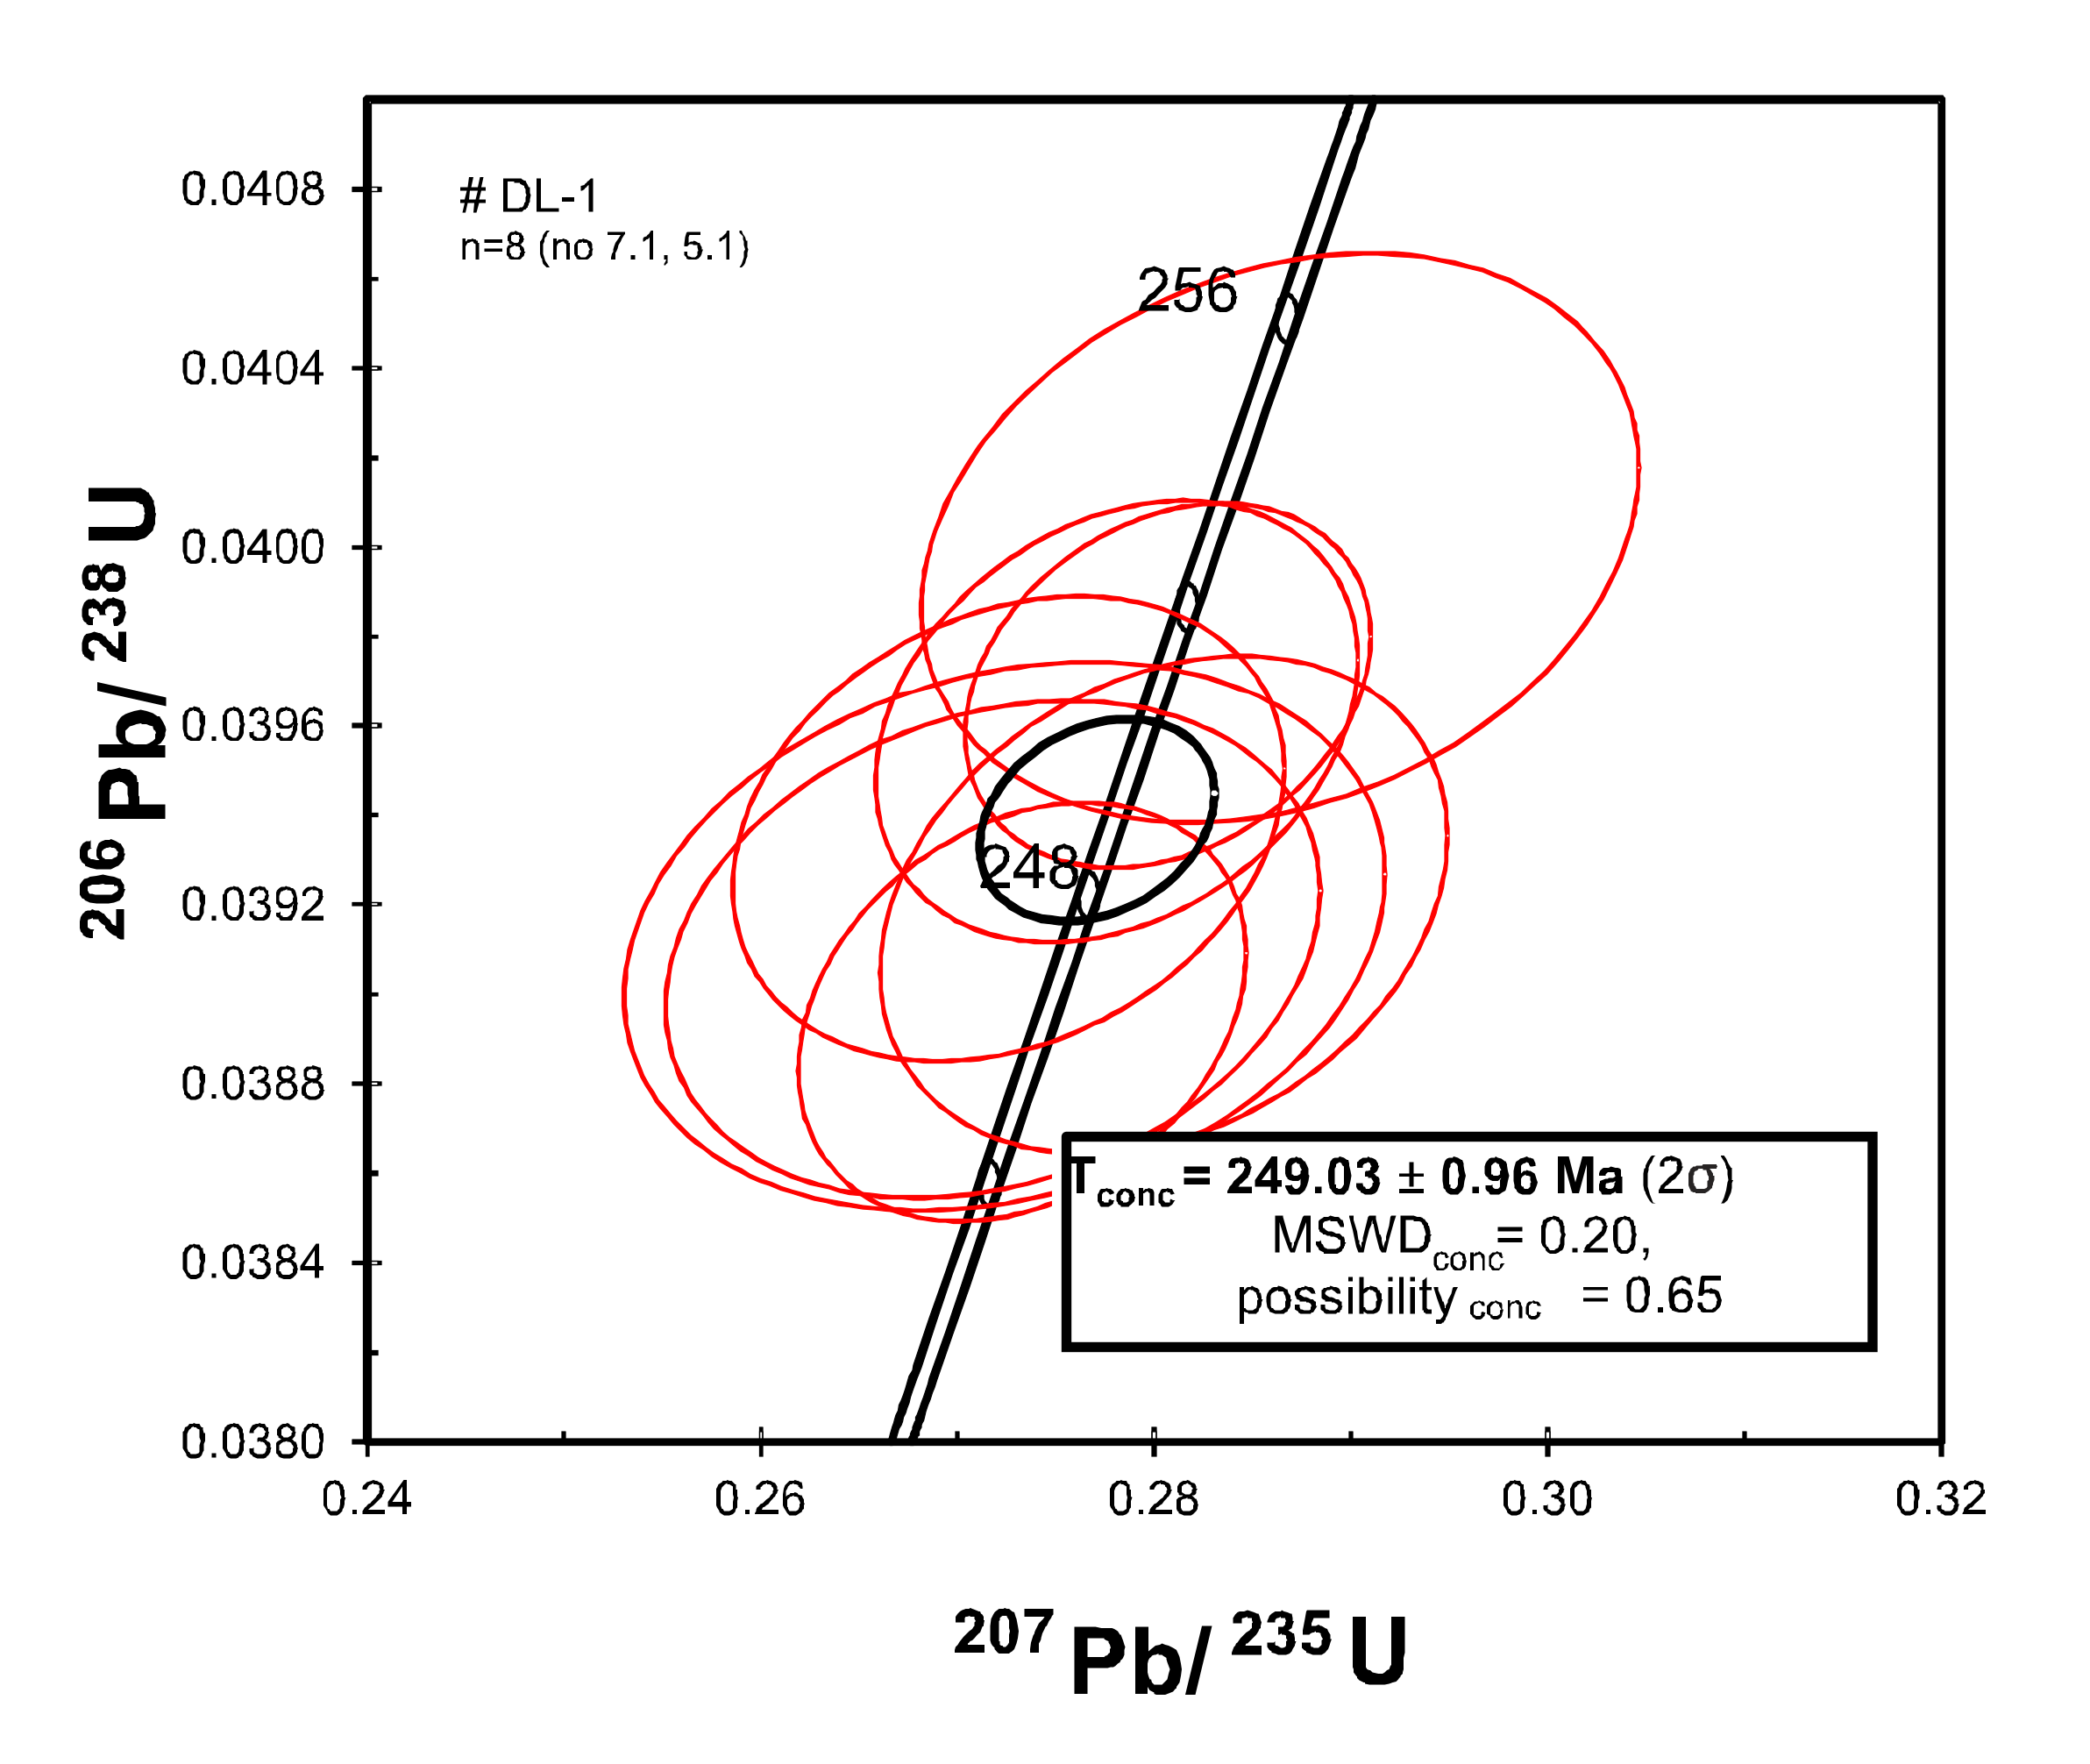
3.3.3. Daldykan Intrusion

Mainly zircon was separated from the Daldykan gabbro-dolerite sample DL-1 (Figure 14 and Figure 15), but a more thorough search revealed individual brownish thin-plate baddeleyite crystals among these zircon fractions. It should be noted there are no reaction shells and zones of baddeleyite substitution after zircon, and conversely, a polycrystalline zircon crust is absent on baddeleyite grains, and both are often recorded in mafic rocks as a consequence of changes in the melt composition during magma evolution [20]. Zircon grains in this rock are represented by fragments of prismatic crystals from elongated (grains 8.1 and 9.1) to almost isometric (1.1) and irregular (4.1) morphology (Figure 15). The dipyramid [111] faces are clearly distinguishable in individual grains (10.1). There are also twinning crystals (3.1). Grain sizes change from 80 to 150 µm, color varies from colorless to dark brown. Transparent (7.1) and translucent (1.1, 3.1), partly fractured (9.1, 2.1) and with the different kinds of inclusions (6.1) 8 zircon grains were dated by U–Pb SHRIMP-II method.
The U–Pb system of Dl-1 zircons is highly homogeneous: the uranium and thorium content is moderately high: 1700–3700 and 1100–4700 ppm, respectively, the radiogenic 206Pb content is 40–130 ppm, and a Th/U ratio (0.9–1.7) is typically magmatic. A concordant cluster of 8 U–Pb analyses corresponds to the age of 249.07 ± 0.92 Ma with an MSWD value of 0.2 and a probability of concordance at 0.7 (Figure 16). The weighted average age calculated on the 206Pb/238U ratio for two analyzed baddeleyite grains corresponds to 250.8 ± 6.9 Ma. Within error limits, it coincides with the age obtained from zircons, but baddeleyite is characterized by an almost complete absence of thorium and moderate uranium of 100–120 ppm, whereas radiogenic 206Pb does not exceed 3–4 ppm, which does not allow measuring the U/Pb ratio with an accuracy comparable to zircon (1σ > 3%–4%).

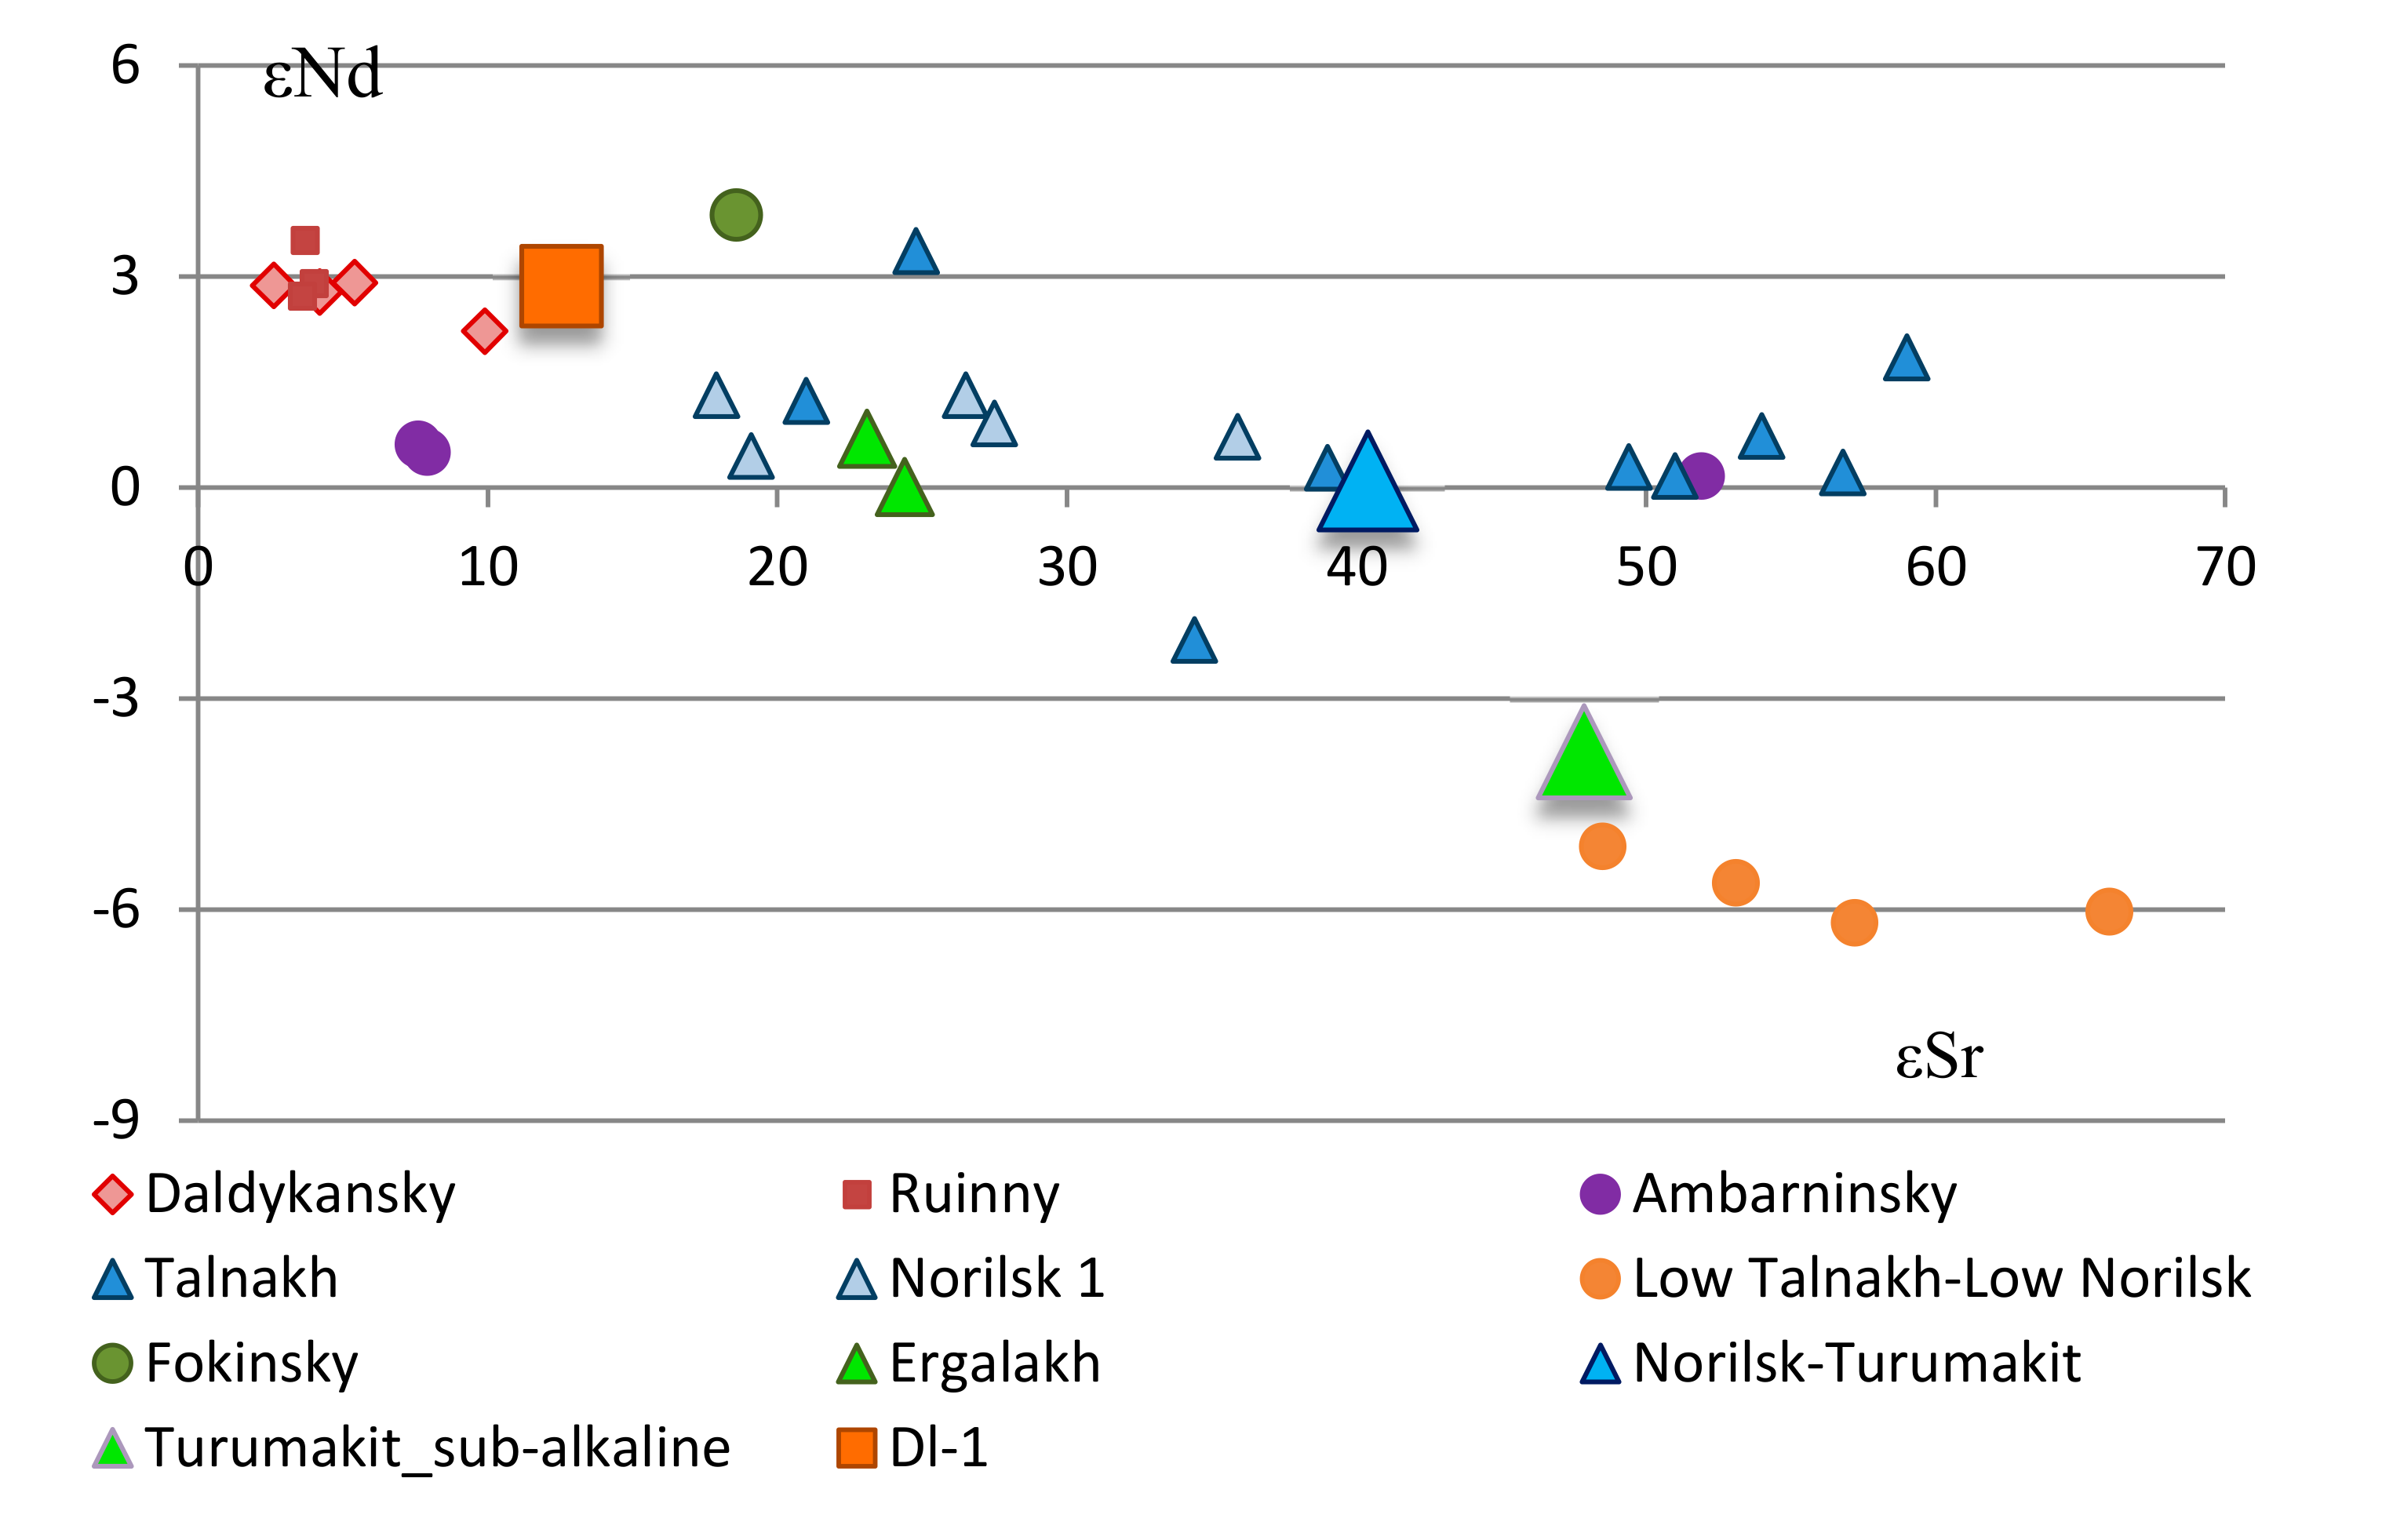
3.4. Radiogenic Isotopes

The isotopic composition of Sr, Nd and Pb and of the Re–Os isotope system for the whole-rock samples that the dated baddeleyites and zircons were extracted from are shown in Table 2 and Table 3. As expected, trachydolerite (BT-1/114.6) of the supposed Ergalakh intrusion is more than 4-fold enriched in incompatible REE, Rb and Sr, compared to the subalkaline gabbro-dolerites of the Norilsk and Daldykan complexes. The measured ratios of Nd and Pb isotopes of the alleged Ergalakh intrusion are less radiogenic, while Sr is the most radiogenic, with 87Sr/86Sr up to 0.708, and very similar to those published for the mafic rocks of the Norilsk region [14,15,16]. At the same time, the trachydolerite is characterized by the highest Re and the lowest Os contents, and the most radiogenic measured 187Os/188Os value (Table 3).
All three analyzed samples from the Norilsk and Ergalakh intrusions lie on the same correlation line within the 187Re/188Os-187Os/188Os diagram (not shown), corresponding to an age of 250 ± 15 Ma and an initial 187Os/188Os isotope ratio of 0.197 ± 0.017, whereas, the Daldykan gabbro-dolerite has a lower measured value of this ratio ~0.1911. The two-point isochron on the Norilsk intrusive gabbro-dolerites determines a very precise age estimation of 250.64 ± 0.68 Ma and an initial ratio of 0.19709 ± 0.00075 (also not shown). This value is rather higher than those for the model primitive upper mantle reservoir (0.1296 [21]) or convective mantle [22], as well as for any meteorite groups [23]. This may be a sign of the formation of such a lithospheric mantle due to the involvement of a radiogenic metasomatic substance, or mixing with crustal rocks of various composition and age [24]. If so, the least contaminated and the most primitive magmas are associated with the Daldykan intrusion, which is characterized by γOs [25] of +30, while the other studied samples from the Norilsk and alleged Ergalakh intrusions have γOs within +48 to +58. The model ages calculated relative to the isotope composition of the chondritic mantle [26] vary from 264 (for the alleged Ergalakh) up to 700 Ma (for the Norilsk intrusion), and these reflect participation in the melting ancient crustal material as well. The intriguing fact is the earlier determined initial 187Os/188Os composition for the mafic and ultramafic rocks of the Norilsk, Talnakh and Kharaelakh intrusions was about 0.133, and the γOs signature was within the interval from +4 to +11 [27,28].
Comparison of the initial isotope characteristics of various intrusive complexes of the Norilsk region (for example, the εNd-εSr diagram in Figure 17) shows that the rocks of the Norilsk complex (Talnakh, Norilsk 1 and Kharaelakh massifs) are characterized by a rather large range of εSr, but fairly consistent values of εNd. Our Turumakit intrusion data is almost at the center of this area, while the data for the Daldykan complex are identical to those given by Hawkesworth et al. [16].
At the same time, the studied rock of the Ergalakh complex is significantly different from the trachydolerites of the Turumakit region that we studied in both parameters. Firstly, negative εNd values are characteristic of alleged Ergalakh trachydolerite, which are close to those for the Lower Talnakh intrusive type of rocks (Lower Talnakh and Lower Norilsk intrusions). Secondly, they are distinguished by high values of εSr. Thus, our data (large green triangle) are located far from those for typical Ergalakh rocks (small green triangles), which indicates their different genesis.

4. Discussion

The problem of classification and age estimation for intrusions from the Norilsk region and their correlation with volcanic rocks has a very long story. Due to the absence of geological relationships between intrusions and lavas, geochemical and isotopic methods have a great importance. The first results of an ore-bearing intrusion isotope dating by the K–Ar method during 1970th–1980th demonstrated a huge range of values [29,30] due to the secondary alteration of rocks and the low accuracy of the analysis. U–Pb zircon age for the Norilsk 1 intrusions of 248 ± 3.8 Ma was only obtained in 1992 [31], as well as the recalculated age of 250 ± 1.5 Ma for the inception of Siberian Traps flood volcanism [32]. Later on, a very precise 39Ar–40Ar age was obtained for biotite and hornblende from the Norilsk 1 intrusion [33]: 250 ± 1.5 and 249 ± 1.6 Ma, respectively, which is a reasonable age of magma crystallization, since biotite igneous mineral in the studied biotite-olivine gabbro-dolerites.
The development of local analytical methods (SIMS and laser ablation with ICP-MS) was the trigger for study of accessory minerals, especially zircons and baddeleyites, from Norilsk rocks. Malitch with co-authors studied zircons and baddeleyites from the Kharaelakh and Norilsk 1 intrusions, and several other massifs [34,35,36], and obtained different ages for individual intrusions which were interpreted as different stages of intrusion formation. So, for the Kharaelakh intrusion, two ages of 347 ± 16 and 235.7 ± 6.1 Ma were attributed to two events of tectonic activity within the Siberian Craton. Additionally, for the Norilsk 1 intrusion, four events were identified according to four age groups of zircon and baddeleyite: 290 ± 2.8, 261.3 ± 1.6, 245.7 ± 1.1, 236.5 ± 1.8 and 226.7 ± 0.9 Ma, which the authors interpreted as successive stages of crystallization. But which specific events are characterized by these ages remains unclear, since crystallization of the Norilsk intrusions being the subvolcanic bodies occurred for a very short time. This is confirmed by the texture of dolerite rocks, the glass appearance in the contact zones of intrusions and melts inclusions in rock-forming minerals, the zoning of rock-forming minerals [37], and the paleomagnetic data. That is, the process of magma crystallization took a short time, and it could not correlate with the four zircon stages mentioned above. Moreover, the Hf isotopic composition of the studied zircon and baddeleyite indicates the complex nature of the magmatic source of the Norilsk intrusions, i.e., juvenile and lithospheric mantle and continental crust. Thus, the appearance of the inherited (captured) zircon of various ages is associated just with the participation in the melting of the material of the continental crust and metamorphic rocks of different ages.

4.1. Geochemical Constrains

4.1.1. Major Components

The studied gabbro-dolerites of the Norilsk intrusions of the Turumakit area are well compared with the intrusions of the Talnakh and Norilsk ore junctions [38,39]. Their geochemical features are very similar (Figure 6), but there are some differences in their differentiation. The Norilsk intrusions located in the Turumakit do not contain high-magnesian rocks, which are observed in the Talnakh and Norilsk intrusions, and are an indispensable attribute of ore-bearing bodies. Thus, the MgO content in studied samples in the Turumakit intrusions does not exceed 18 wt % (Figure 6), whereas picritic gabbro-dolerites in economically significant intrusions are characterized by 25–27 wt % [29,38]. Given the relatively low MgO content, they were designated as picrite-like rocks. The second important feature of intrusive bodies in the Turumakit region is the limited amount of taxitic gabbro-dolerites in comparison with classic ore-bearing intrusions. The sulfide content in the rocks is lower as well (usually, 3 vol%).
Any attempt at classification of subalkaline rocks of the Norilsk district is difficult realize. In the Norilsk district, these rocks have been designated as two intrusive complexes, Ergalakh and Avamsky [4], represented by sills and dikes, respectively. The trachydolerite sills of the Ergalakh complex in the Norilsk area are compared with the rocks of the Ivakinsky formation, which has a subalkaline composition and takes the lowest position in the tuff-lava sequences in the Norilsk district [32].
There were identified two sub-complexes of the Ergalakh complex, namely: alkaline rocks correlated with the lower part of the Ivakinsky formation (Er I), and subalkaline rocks close to rocks of the upper part of this formation (Er II). Indeed, there are two types of intrusive rocks in the Norilsk district differing in titanium and alkali contents: high-Ti (TiO2 > 3%) and low Ti (TiO2 2.2–2.5, K2O < 5.0%).
However, both types of these rocks fall in the area of subalkaline basalts in the diagram SiO2 vs Na2O + K2O, similar to the rocks of the Ivakinsky formation [15,16,17,29,30,31].
Hawkesworth and co-authors [16] studied the rock of the Ergalakh complex in the northern and central parts of the Norilsk district, and subdivided them into two groups as well: low Ti (2.2 wt % TiO2) and high-Ti (3 wt %–3.3 wt % TiO2). The most representative data on the rocks of the Ergalakh complex were obtained by Ryabov (Figure 6), who studied them in different parts of the Norilsk district (including the Turumakit area), and within the Syverma plateau [17]. His data demonstrate that the TiO2 content in these rocks varies between 2.5 wt %–3.6 wt % forming a continuous range of compositions. Our data on the rocks of the Turumakit area (Table 1 and Table 2) occupy a special place in the TiO2–SiO2 diagram and show the elevated silica and high titanium concentration in several samples, which compositions correspond to subalkaline rocks. The trachybasalts of the Ivakinsky formation are similar to the low-Ti varieties of the Ergalakh complex, but differ in higher silica concentrations in some cases.
Data on the Avamsky complex is mostly obtained from the dikes of the Maymecha-Kotuy region (Figure 18), and only one sample from the Norilsk district was analyzed [38]. The rocks of the Avamsky complex are considered in the last work [38] as intermediate in composition between Er I and Er II, but they are closer to the second type of the Ergalakh complex.
Indeed, the titanium concentrations in these rocks are not different from those for the Ergalakh complex, but they contain much less alkalis (Figure 18). A sample of the Avamsky complex from the Norilsk region is not similar to samples of the Avamsky samples from the Maymecha-Kotuy district [16], since it more closely corresponds to alkaline rocks. Significant inconsistencies in the location of the dikes of this complex and their different composition lead to the question of the legality of referring them to a single complex, which requires further study.

4.1.2. Trace Elements

Unfortunately, there is very little information on rare elements in the samples of the Avamsky complex in comparison with the major elements. Thus, a more or less reliable spectrum was obtained only for one sample of the Avamsky complex taken in the Norilsk region [40]. The distribution of rare elements in the rocks of the Ergalakh and Avamsky complexes, as well as in subalkaline rocks of the Turumakit area, reveals a number of significant differences between them. First of all, the rocks of the Ergalakh and Avamsky (Figure 19) complexes are characterized by high uranium, which forms a small, positive anomaly of this element in patterns. This anomaly is absent in the Turumakit rocks (Figure 19). This is evidenced by the U/Nb ratio, which is 2.2–4.0 for the Eraglakh complex, and 1.2–1.6 for the subalkaline rocks of the Turumakit area. This ratio for the Ivakinsky formation is similar to the Ergalakh rocks. There is a difference between these two rock types in the Gd/Yb ratio: it is higher for the Ergalakh complex (2.1–2.5) and lower for the Turumakit complex (1.8 and 1.9). The Avamsky complex is characterized by a very gentle inclination of the spectrum (Figure 19).
Thus, the subalkaline rocks of the Turumakit area indicate their difference from the typical Ergalakh complex. It is possible to suggest that this is a special type of the Ergalakh complex. The age of these rocks allows us to attribute their formation to the latest stage of magmatism evolution in the Norilsk district, whereas the age of typical rocks from the Ergalakh intrusions has never determined by modern geochemical methods.

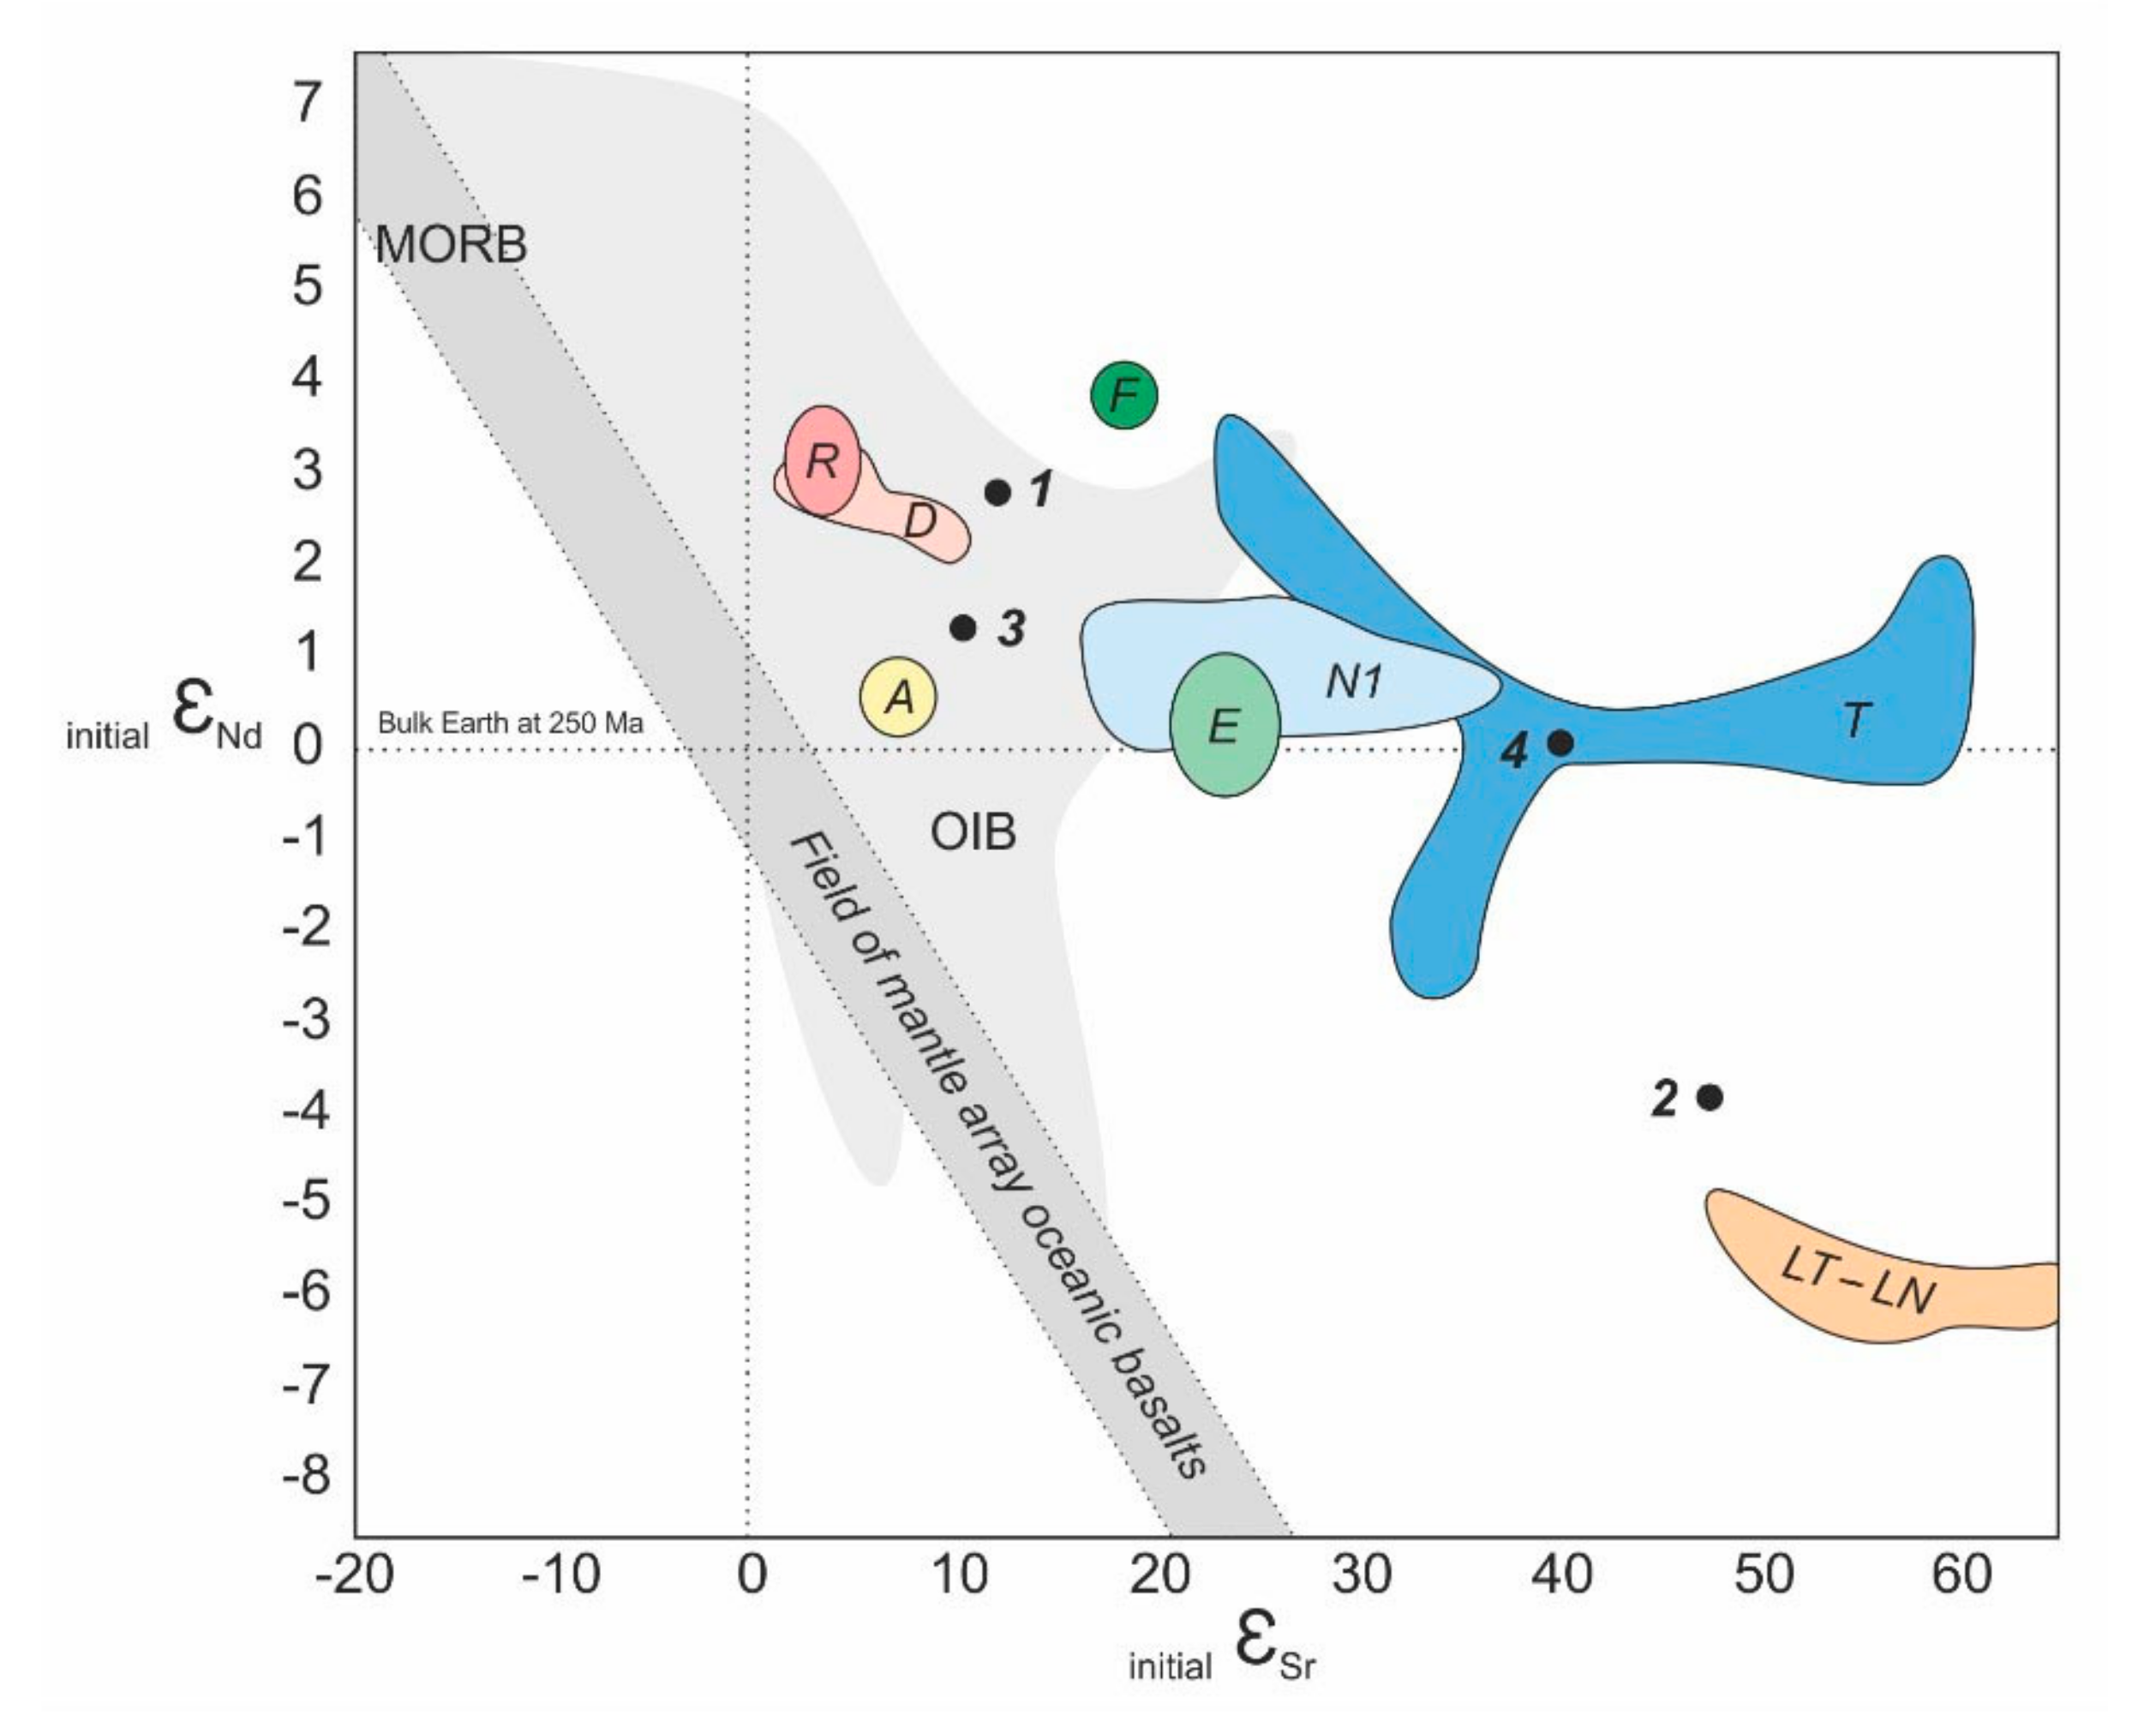
4.1.3. Radiogenic Isotopes

A number of recent studies on various flood basalt provinces have suggested that the subcontinental lithosphere maybe a viable source for the basalts, because they display a wide range of Nd–Sr–Pb isotopic compositions [16,41,42,43].
In εSr-εNd (t) space, all the Siberian mafic intrusive rocks define an array that lies near the mantle correlation line, but is distinctly displaced to the right (Figure 20). This relationship may be defined by a hyperbola having three different components: depleted sub-oceanic mantle, undepleted primitive mantle, and old continental crust.
There is an excellent, overlapping correspondence in Figure 20 between the Norilsk type samples 1 and 3 and the basalts of the oceanic islands in terms of their Nd and Sr-isotopic signatures. This feature was also noted by [41,44], particularly in the case of the Columbia River Basalts, and in general, for all continental flood basalts by [46].
But the rocks of the alleged Ergalakh complex studied by the authors (2 in Figure 20) are located far from typical Ergalakh rocks (E in Figure 20), which indicates their different genesis, but under the strong influence of the continental crust, as well as the Lower Talnakh and Lower Norilsk weakly mineralized intrusions. The Re–Os isotopic data (Table 3) also confirm that the sub-alkaline rocks of the Turumakit area are only comparable to those of disseminated sulfide ores from weakly mineralized intrusives of the Norilsk district [26,28]. As mentioned above, the zircon and baddeleyite Hf isotopic composition also proves the participation of continental crust material in the magmatic source of the Norilsk intrusions [36].

4.2. Geochronological Constrains

As mentioned above, the age determination of magmatic rocks of the Norilsk region by isotopic methods began from the 1970s and continues to the present, and if the first decades geochronological dating was carried out exclusively by the potassium–argon method, then the main attention was focused on obtaining the most accurate age estimations of the injection and crystallization of various ore-bearing and barren igneous bodies and effusive trap basalts associated with the manifestation of the Siberian Permian-Triassic plume. The accuracy of modern U–Pb isotope analysis allowed the limiting of the time of formation of Siberian traps within 252–255 Ma [31,33,47], while the time of injection of various intrusions varies from 10–15 Ma from 260 to 240 Ma [28,35,36]. A recently published overview of detailed dating by the local U–Pb zircon method (SHRIMP-II) from 22 mafic intrusions of the Norilsk region [48] showed that the distribution of the obtained age estimations can be determined by two main magmatism pulses at 244 ± 4 and 254 ± 4 Ma, with quasi-synchronous sulfide ore formation in these intrusions 245–250 million years ago.
The results of the baddeleyite and zircon U–Pb dating of the Turumakit region mafic intrusions are consistent with previously obtained estimations for the crystallization age of the Norilsk region intrusions [48]; moreover, these ages indicate that the studied intrusions belong to both recognized magmatic pulses: the Norilsk and Daldykan intrusions formed at an early one of 254 ± 4 Ma, and if the Norilsk intrusion can be associated with the beginning of magmatic activity in the region 251.5 ± 3.5 Ma, then the Daldykan intrusion was injected at the final magmatic activity of this pulse 249.03 ± 0.9 Ma. Moreover, it is obvious that the alleged Ergalakh intrusion was one of the last in the region (244.8 ± 2.7 Ma). Up to now there are a few ages characterizing the Ergalakh intrusion crystallization within the Norilsk region. However, all of them were determined by inherited Proterozoic zircons, so the true correlation with this intrusive event is impossible. Based on our data we suggest that the studied intrusive from the Turumakit region represents a distinct subalkaline trachydolerite intrusion during the final stages of the plume magmatic activity in the Siberian region.

5. Conclusions

(1)
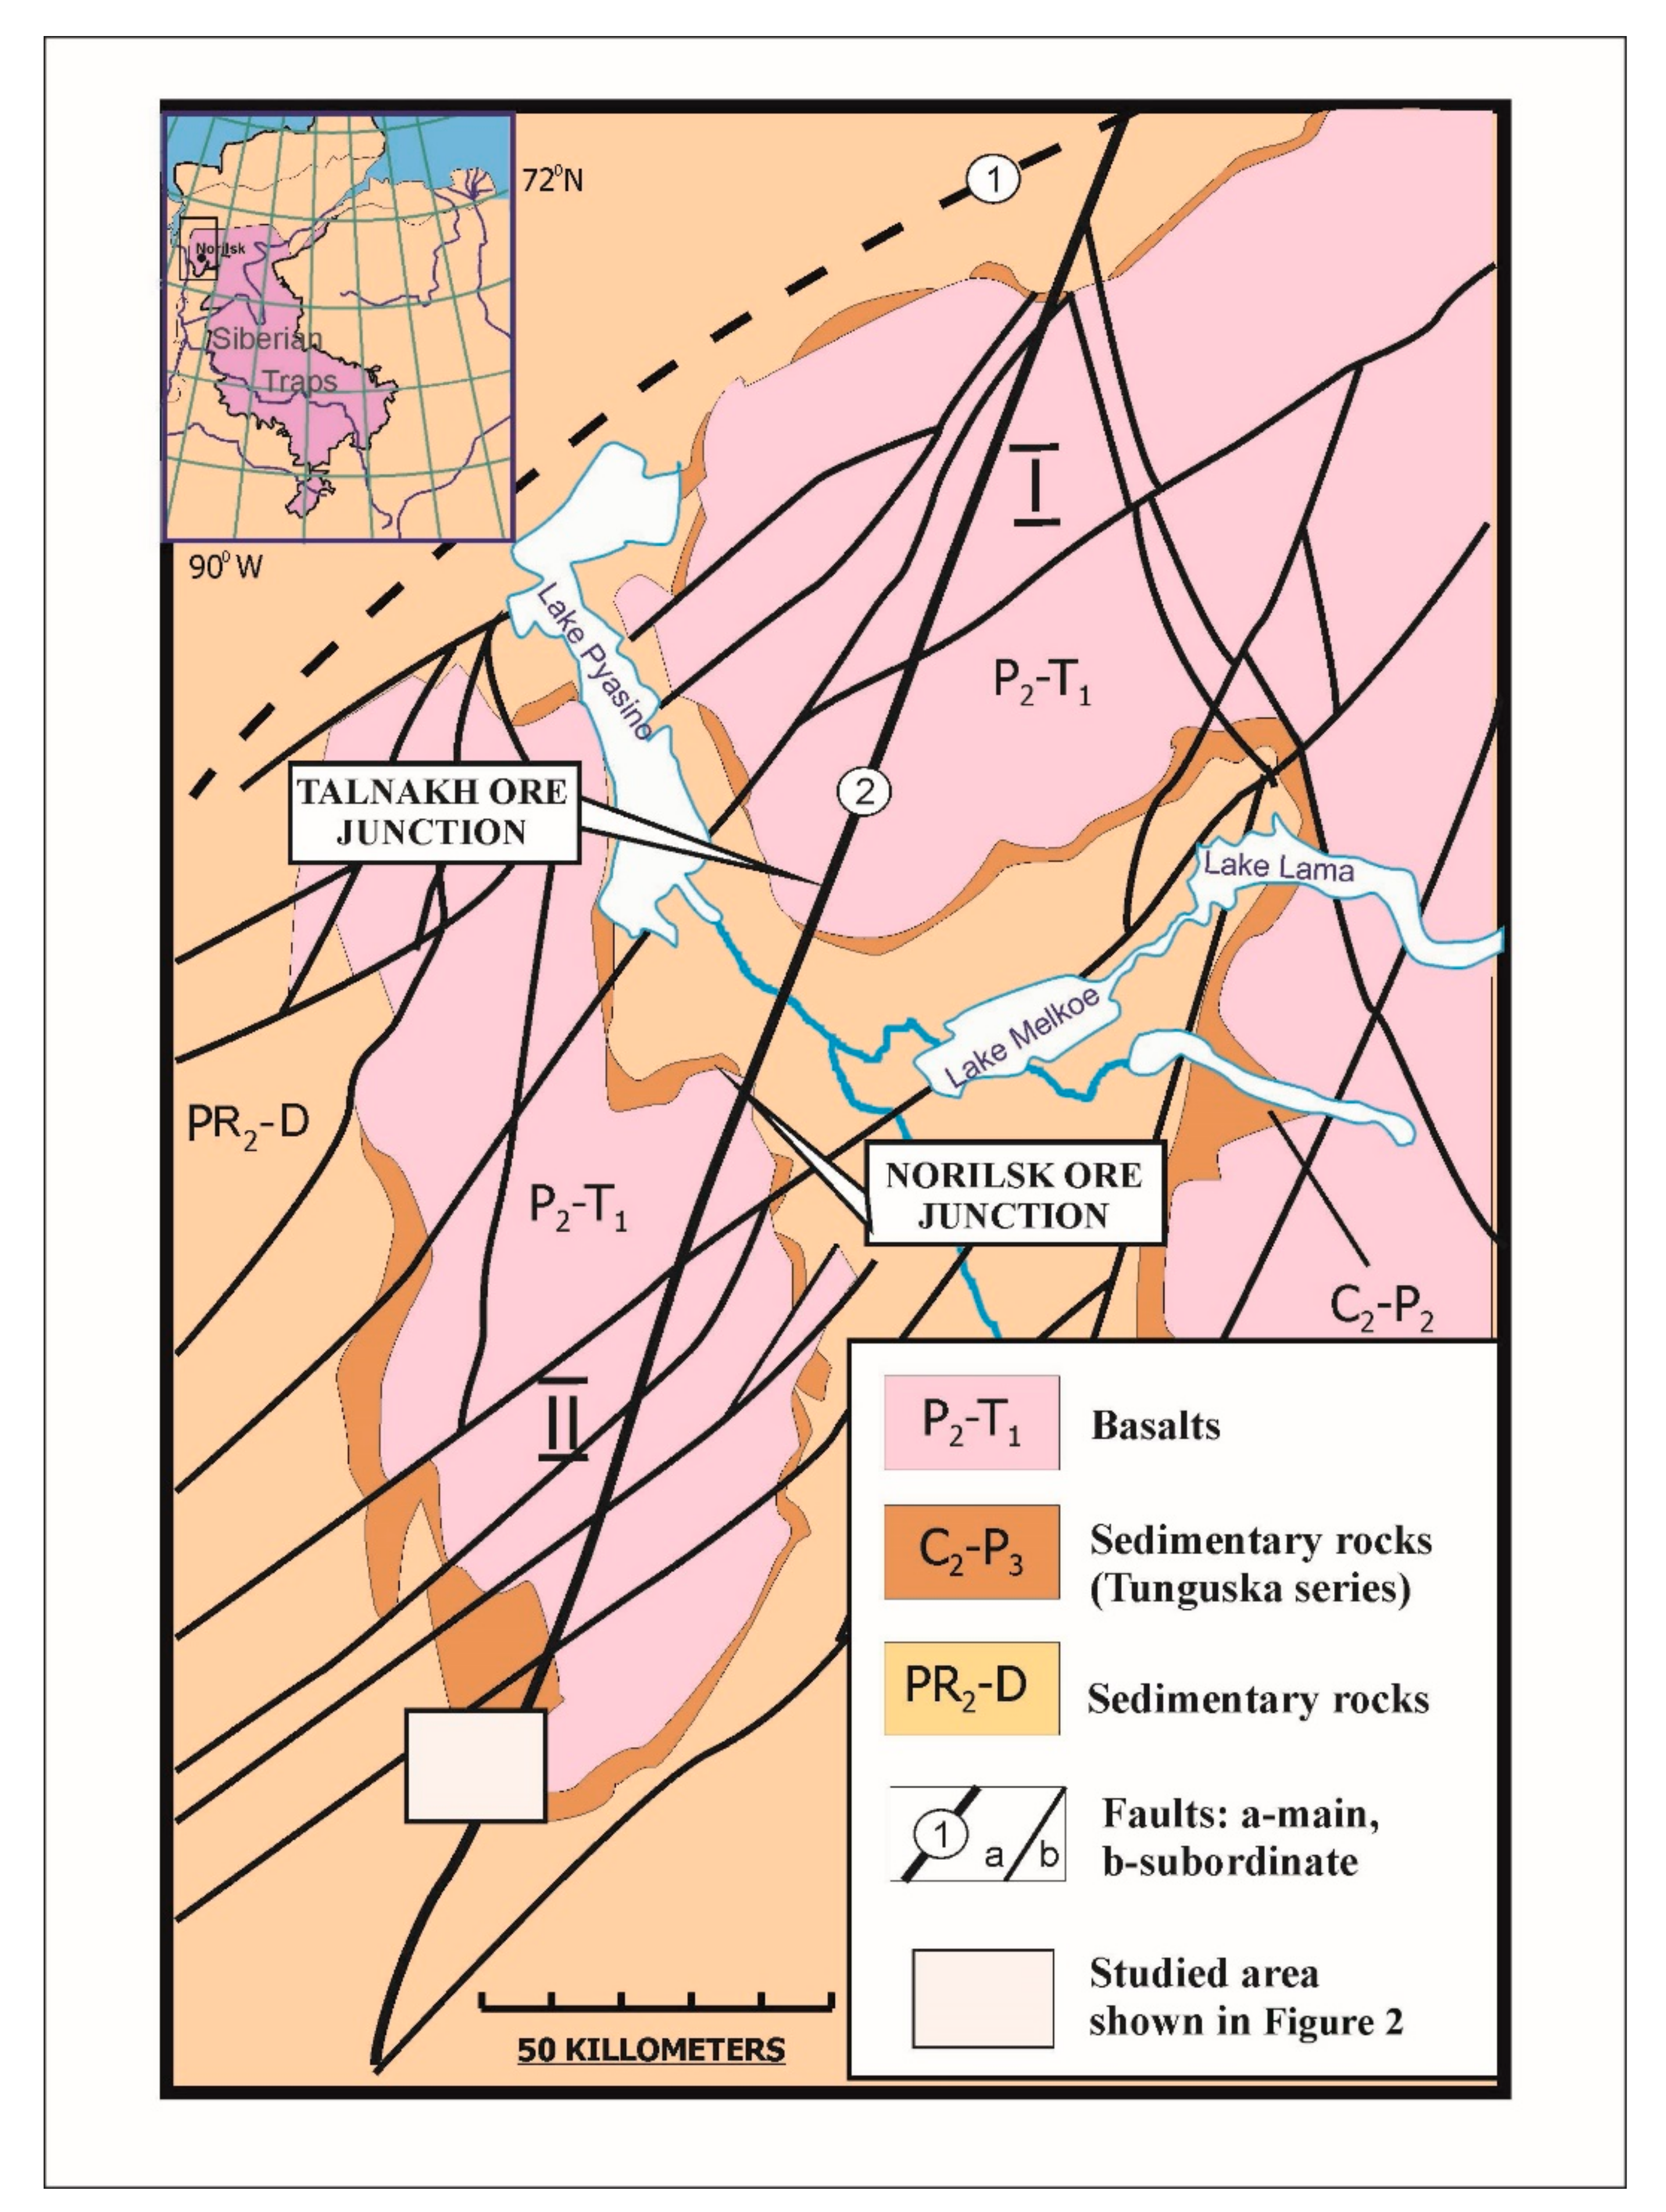
We have studied mafic rocks of the Turumakit area previously attributed to the three intrusive complexes–Norilsk, Daldykan of normal alkalinity and to the sub-alkaline rocks preliminary referred to the Ergalakh intrusive complex. The rocks from the first two units have geochemical features, typical of the Norilsk and Daldykan intrusions. Norilsk intrusions of the Turumakit area do not comprise high-Mg rocks similar to the picritic gabbro-dolerites in ore-bearing massifs, and contain low concentrations of sulfides (vol 3%).
(2)
The subalkaline rocks of the Turumakit area have a number of features that distinguish them from the typical Ergalakh rocks. They are represented by large bodies consisting of coarse varieties of rocks with pegmatite segregations while typical Ergalakh massifs are homogeneous with fine-grained texture. The sub-alkaline Turumakit rocks are enriched in titanium and silica (up to 5.5 wt % TiO2, in comparison with the typical Ergalakh rocks, 2.2 wt %–3.3 wt % TiO2). They are characterized by a low uranium content and Gd/Yb ratio (1.6).
(3)
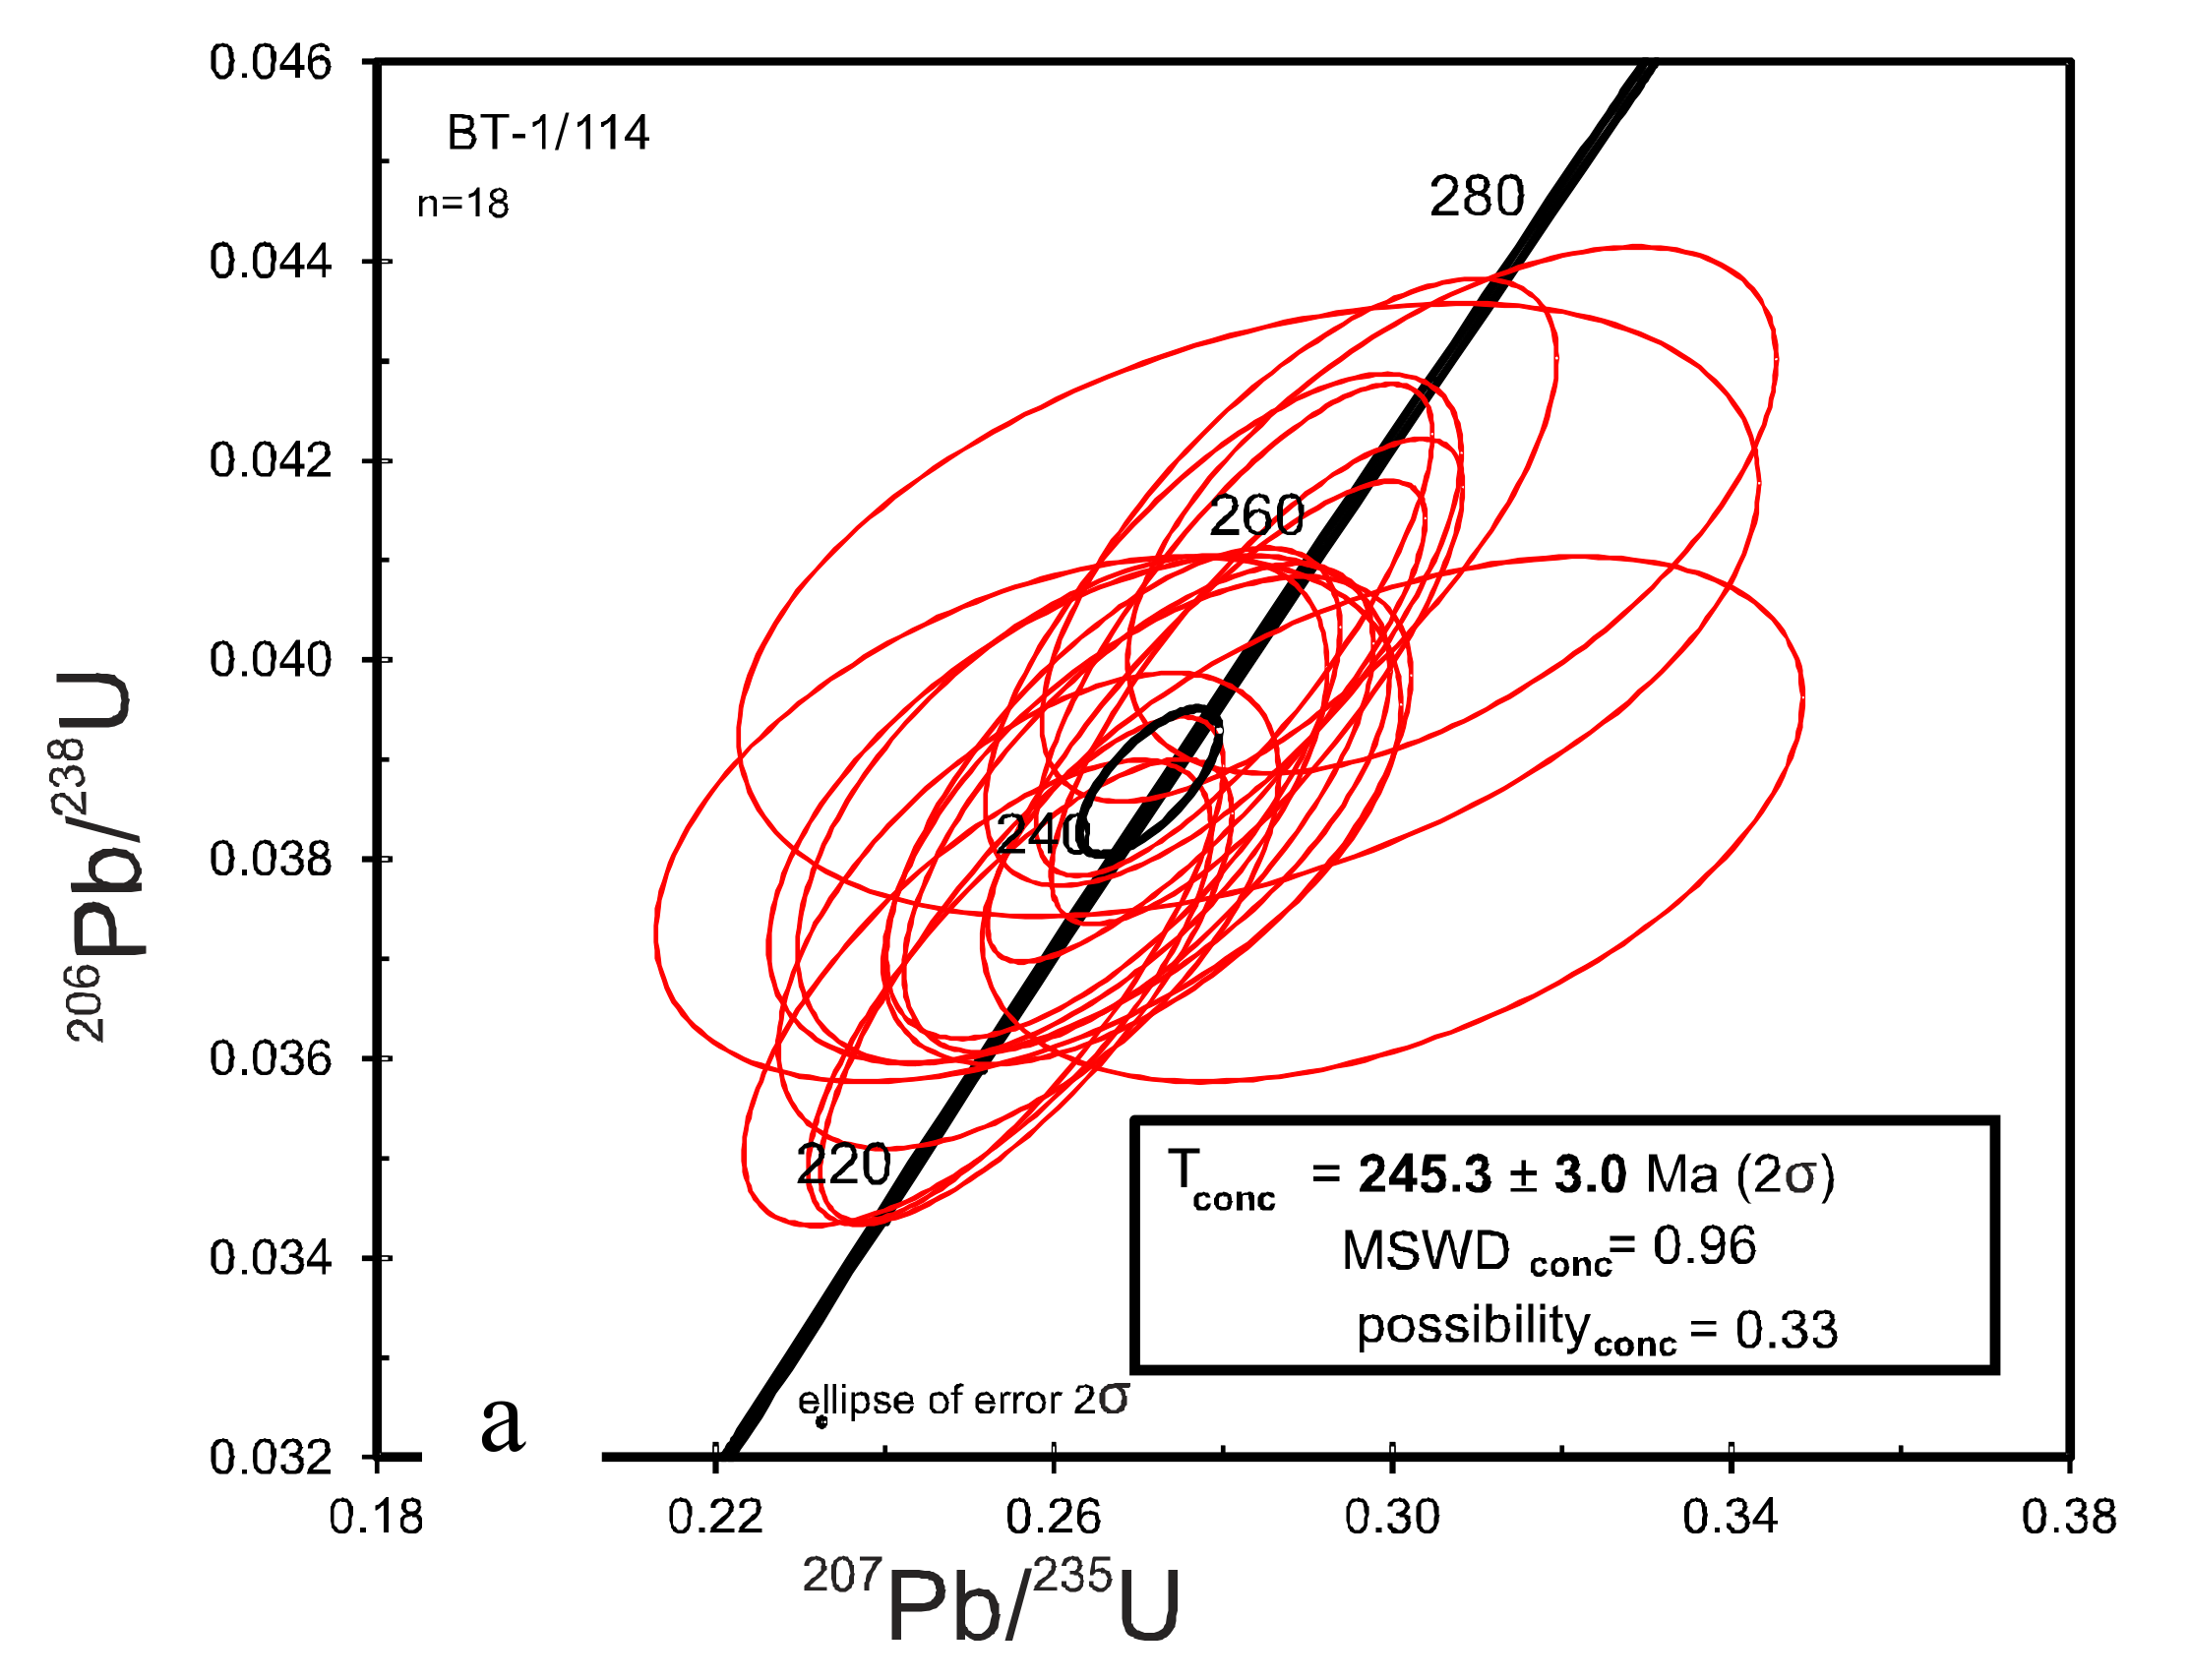
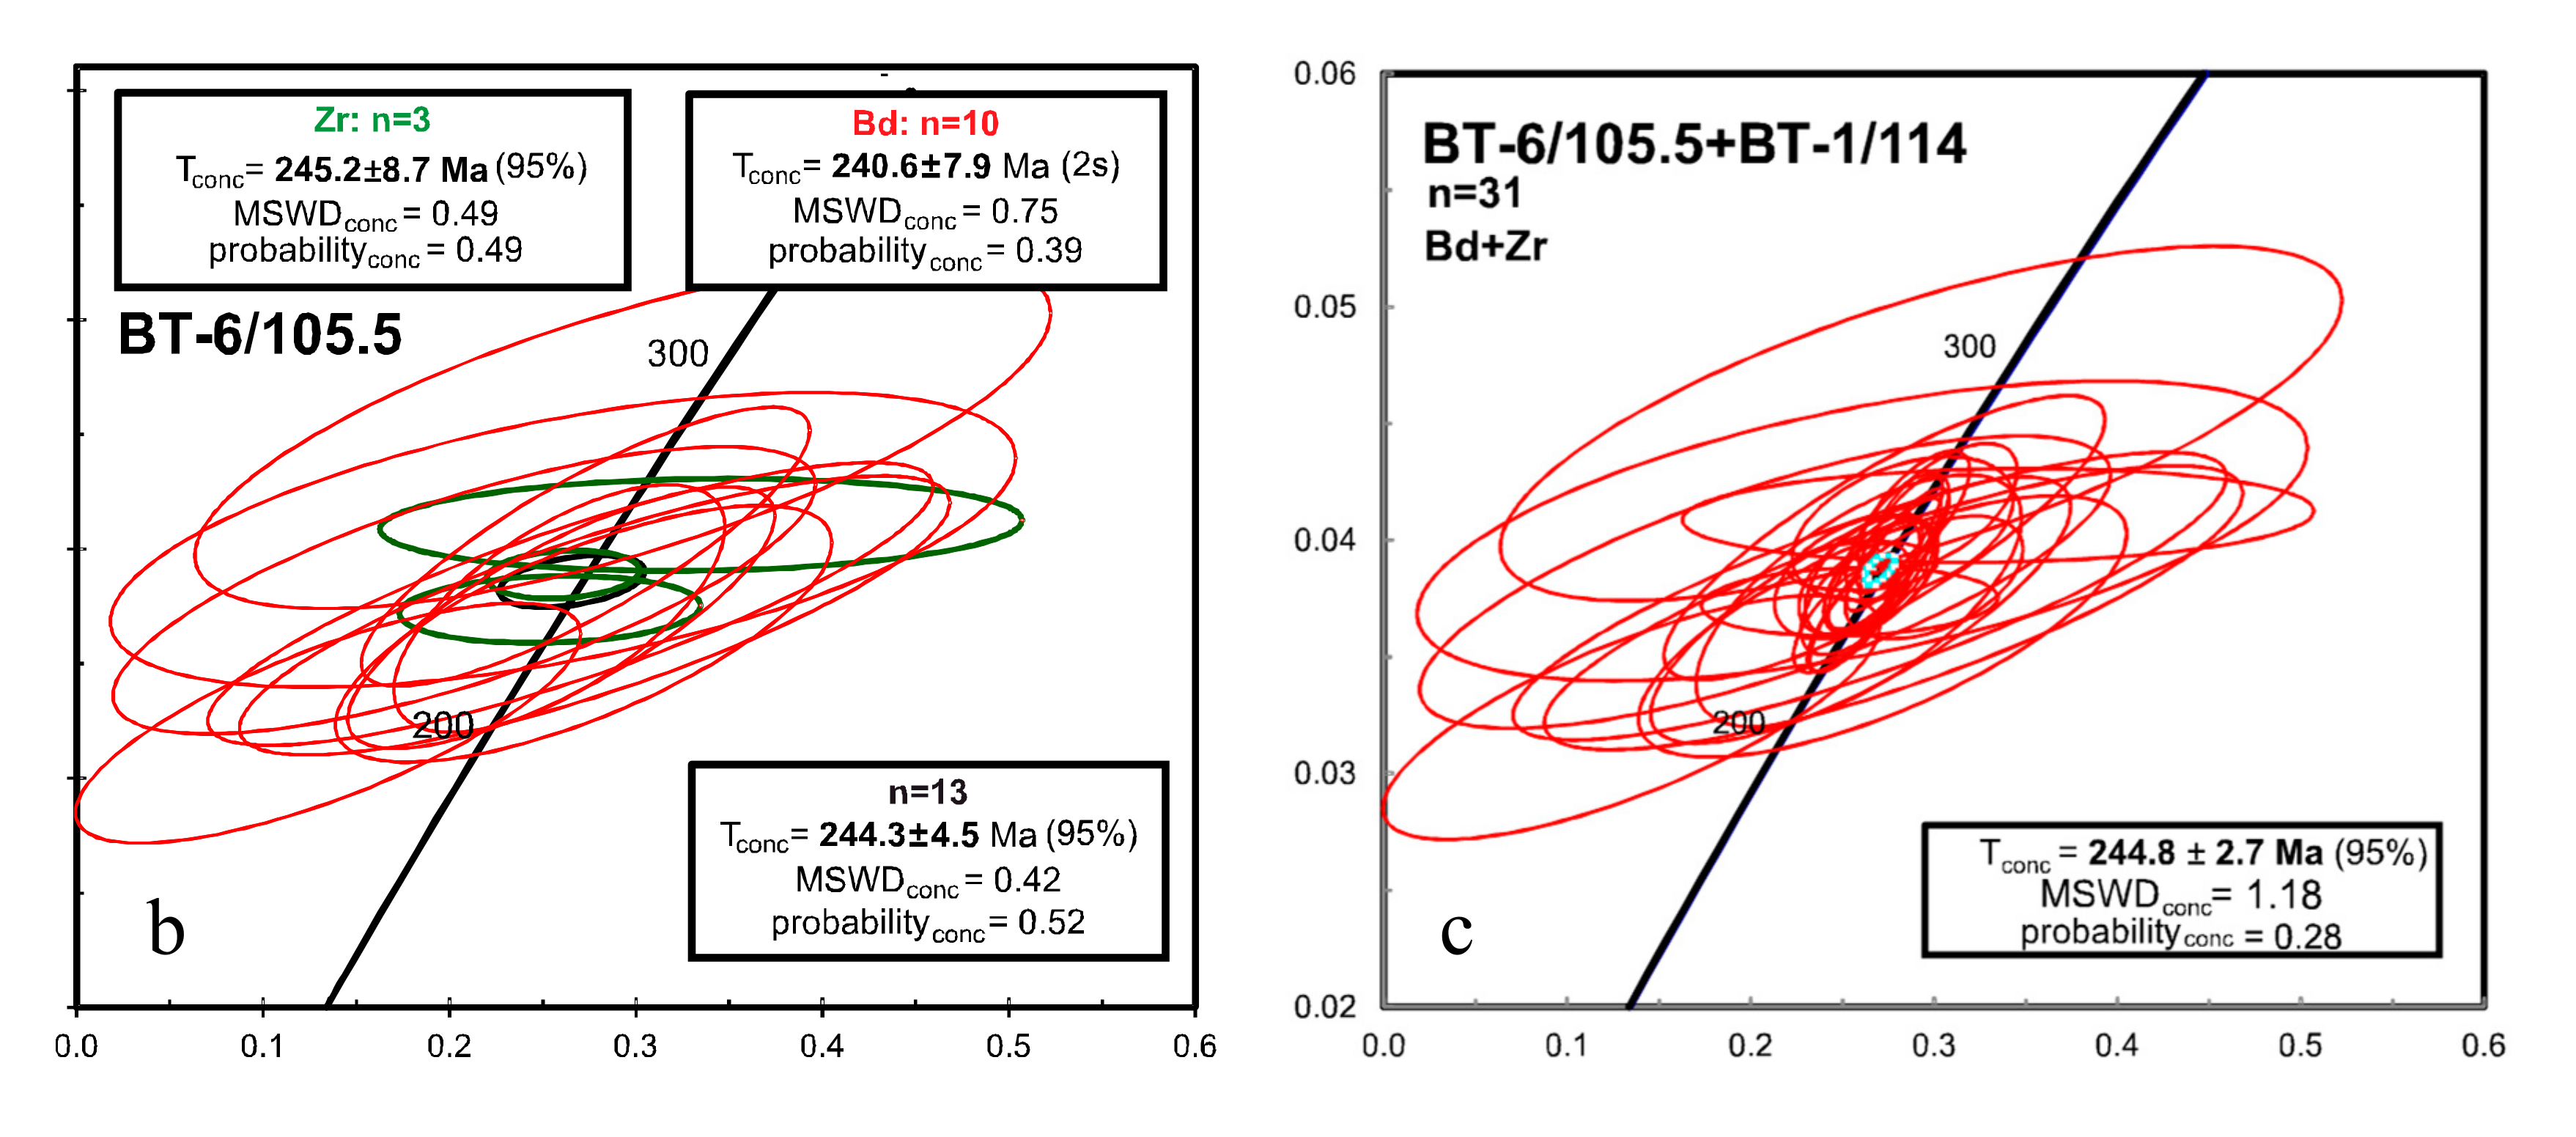
The U–Pb system of zircon and baddeleyite of the studied samples from the three intrusions assumes sub-synchronous but nevertheless distinctly sequential formation: First, the gabbro-dolerites of the Norilsk intrusions crystallized at 250.3 ± 1.4 m.y. ago, then the Daldykan intrusive at 249.03 ± 0.96, and the last subalkaline trachydolerites of the alleged Ergalakh intrusion completed magmatism −244 ± 2.7 m.y. ago.
(4)
The initial isotope characteristics (at age 250 Ma) calculated for these rocks are follows: Norilsk intrusions εNd = +0.1~+1.4,εSr = +10~+40, γOs = +48–58, 206Pb/204Pb 18.17–18.20, 207Pb/204Pb 15.56–15.59, 208Pb/204Pb 38.11–38.16; the Daldykan complex εNd = +2.9,εSr = +12.5, γOs = +30, 206Pb/204Pb 18.57, 207Pb/204Pb 15.57, 208Pb/204Pb 38.22; Turumakit trachydolerite εNd= −3.8, εSr = +47.9, γOs= +40, 206Pb/204Pb 17.88, 207Pb/204Pb 15.51, 208Pb/204Pb 37.78. The first two correlate well with the data published for the rocks from a type locality within the Norilsk district (Norilsk and Daldykan), while the Turumakit trachydolerite, alleged to be Ergalakh, is a completely another case.

Supplementary Materials

The following are available online at https://www.mdpi.com/2075-163X/10/2/165/s1, Table S1: Bulk compositions of igneous rocks within the Turumakit area.

Author Contributions

Conceptualization and writing were carried out by E.S. and N.K; the methodology and interpretation of isotopic data by E.S. and B.B.; and the field trip sampling was done by N.K. All authors have read and agreed to the published version of the manuscript.

Funding

This work was done as a part of CIR ‘VSEGEI” works under the project of the Russian State Geological Survey No. 049-00009-1800, aimed in the development of laboratory and analytical methods, and was supported by Russian Foundation for Basic Researches (project 18-05-70094).

Acknowledgments

The authors are grateful to K. Shishaev (Norilskgeologiya LLC) and E. Krasnova for a fruitful discussion of the Turumakit area geology and isotopic data. We are very grateful to an unknown reviewer who made an invaluable contribution, not only to clarifying the text of our article, but also significantly to improving the English language.

Conflicts of Interest

The authors declare no conflict of interest.

References

  1. Urvantsev, N.N. North Siberian Ni-bearing area. Geol. Geophys. 1974, 3, 3–11. (In Russian) [Google Scholar]
  2. Dyuzhikov, O.A.; Distler, V.V.; Strunin, B.M.; Mkrtychyan, A.K.; Sherman, M.L.; Sluzhenikin, S.F.; Lurye, A.M. Geology and Ore Potential of the Noril’sk Ore District; Nauka: Moscow, Russia, 1988; p. 238. (In Russian) [Google Scholar]
  3. Sherman, M.L. GeologicalMap of the Noril’sk Ore Dstrict, 1:200000 Scale; VSEGEI: Leningrad, Russia, 1991. [Google Scholar]
  4. Lyul’ko, V.A. Legend for 1: 50000 Scale Map, Noril’sk Group; Geoinformmark: Moscow, Russia, 1993; p. 53. (In Russian) [Google Scholar]
  5. Soderlund, U.; Johansson, L. A simple way to extract baddeleyite (ZrO2). Geochem. Geophys. Geosyst. 2002, 3, 1–7. [Google Scholar] [CrossRef]
  6. Williams, I.S. U-Th-Pb Geochronology by Ion Microprobe. Rev. Econ. Geol. 1998, 7, 1–35. [Google Scholar]
  7. Rodionov, N.V.; Belyatsky, B.V.; Antonov, A.V.; Kapitonov, I.N.; Sergeev, S.A. Comparative in-situ U-Th-Pb geochronology and trace element composition of baddeleyite and low-U zircon from carbonatites of the Palaeozoic Kovdor alkaline-ultramafic complex, Kola Peninsula, Russia. Gondwana Res. 2012, 21, 728–744. [Google Scholar] [CrossRef]
  8. Ludwig, K.R. SQUID 1.02, A User Manual, A Geochronological Toolkit for Microsoft Excel; Berkeley Geochronology Center Special Publication: Berkeley, CA, USA, 2001. [Google Scholar]
  9. Wetherill, G.W. Discordant uranium-lead ages. Trans. Am. Geophys. Union 1956, 37, 320–326. [Google Scholar] [CrossRef]
  10. Ludwig, K.R. User’s Manual for Isoplot/Ex, Version 3.00. A Geochronological Toolkit for Microsoft Excel; Berkeley Geochronology Center Special Publication: Berkeley, CA, USA, 2003. [Google Scholar]
  11. Stacey, J.S.; Kramers, J.D. Approximation of terrestrial lead isotope evolution by a two-stage model. Earth Planet. Sci. Lett. 1975, 26, 207–221. [Google Scholar] [CrossRef]
  12. Krivolutskaya, N.A.; Belyatsky, B.V.; Smolkin, V.F.; Mamontov, V.P.; Fanygin, A.S.; Svirskaya, N.M. Geochemical specific of massifs of the Druzite Complex in Central Belomorian Mobil Belt: II Sm-Ndisotopic system of the rocks and U-Pb system of zircons. Geochem. Int. 2010, 48, 1064–1083. [Google Scholar] [CrossRef]
  13. Zolotukhin, V.V.; Vilensky, A.M.; Dyuzhikov, O.A. Basalts of the Siberian Platform; Nauka: Novosibirsk, Russia, 1986; p. 245. (In Russian) [Google Scholar]
  14. Lightfoot, P.C.; Naldrett, A.J.; Gorbachev, N.S.; Doherty, W.; Fedorenko, V.A. Geochemistry of the Siberian traps of the Noril’sk area: with implications for the relative contributions of crust and mantle to flood basalts. Contrib. Mineral. Petrol. 1990, 104, 631–644. [Google Scholar] [CrossRef]
  15. Wooden, J.L.; Czamanske, G.K.; Bouse, R.M.; King, B.-S.W.; Knight, R.J.; Siems, D.F. Isotopic and trace-element constraints on mantle and crustal contributions to Siberian continental flood basalts, Norilsk area, Siberia. Geochim. Cosmochim. Acta 1993, 57, 3677–3704. [Google Scholar] [CrossRef]
  16. Hawkesworth, C.J.; Lightfoot, P.C.; Fedorenko, V.A.; Blake, S.; Naldrett, A.J.; Doherty, W.; Gorbachev, N.S. Magma differentiation and mineralisation in the Siberian flood basalts. Lithos 1995, 34, 61–88. [Google Scholar] [CrossRef]
  17. Ryabov, V.V.; Shevko, A.Y.; Gora, M.P. Trap Magmatism and Ore Formation in the Siberian Noril’sk Region; Springer: Amsterdam, The Netherlands, 2014; Volume 1, p. 2. [Google Scholar]
  18. Rogers, C.; Cousens, B.; Ernst, R.E.; Söderlund, U. Phosphorus and Potassium Metasomatic Enrichment in the Mantle Source of the c. 1450–1425 Michael-Shabogamo Gabbro of Eastern Laurentia. J. Petrol. 2019, 60, 57–83. [Google Scholar] [CrossRef] [Green Version]
  19. Hofmann, A.W. Chemical differentiation of the earth: the relationship between mantle, continental and ocean crust. Earth Planet Sci. Lett. 1988, 90, 297–314. [Google Scholar] [CrossRef] [Green Version]
  20. Gervasoni, F.; Klemme, S.; Rohrbach, A.; Tobias Grützner, T.; Berndt, J. Experimental constraints on the stability of baddeleyite and zircon in carbonate- and silicate-carbonate melts. Am. Mineral. 2017, 102, 860–866. [Google Scholar] [CrossRef]
  21. Meisel, T.; Walker, R.J.; Irving, A.J.; Lorand, J.P. Osmium isotopic compositions of mantle xenoliths: a global perspective. Geochim. Cosmochim. Acta 2001, 65, 1311–1323. [Google Scholar] [CrossRef]
  22. Rudnick, R.; Walker, R.J. Interpreting ages from Re-Os isotopes in peridotites. Lithos 2009, 112S, 1083–1095. [Google Scholar] [CrossRef]
  23. Day, J.M.D.; Brandon, A.D.; Walker, R.J. Highly siderophile elements in Earth, Mars, the Moon, and asteroids. Rev. Mineral. Geochem. 2017, 81, 161–238. [Google Scholar] [CrossRef] [Green Version]
  24. Reisberg, L.; Lorand, J.-P.; Bedini, R.M. Reliability of Os model ages in pervasively metasomatazed continental mantle lithosphere: a casee study of Sidamo spinel peridotute xenoliths (East African Rift, Ethiopia). Chem. Geol. 2004, 208, 119–140. [Google Scholar] [CrossRef]
  25. Chen, J.H.; Papanastassiou, D.A.; Wasserburg, G.J. Re-Os systematics in chondrites and the fractionation of the platinum group elements in the early solar system. Geochim. Cosmochim. Acta 1998, 62, 3379–3392. [Google Scholar] [CrossRef]
  26. Walker, R.J.; Morgan, J.W.; Horan, M.F.; Czamanske, G.K.; Krogstad, E.J.; Fedorenko, V.A.; Kunilov, E. Re–Os isotopic evidence for an enriched-mantle source for the Noril’sk-type, ore-bearing intrusions. Geochim. Cosmochim. Acta 1994, 58, 4179–4197. [Google Scholar] [CrossRef]
  27. Shirey, S.B.; Walker, R.J. The Re–Os isotopes in cosmochemistry and high-temperature geochemistry. Annu. Rev. Earth Planet. Sci. 1998, 26, 423–500. [Google Scholar] [CrossRef]
  28. Malitch, K.N.; Latypov, R.M. Re-Os and S isotope contrants on timing and source heterogeneity of PGE-Cu-Ni sulfide ores: a case study at the Talnakh ore junction, Noril’sk province, Russia. Can. Miberalogist 2011, 49, 1653–1677. [Google Scholar] [CrossRef]
  29. Dodin, D.A.; Batuev, B.N. Geology and petrology of the Talhakh differentiated intrusions and their metamorphic aureole. In Petrology and Ore Resource Potential of the Talnakh and Noril’sk Differentiated Intrusions; Nedra: Leningrad, Russia, 1971; pp. 31–100. (In Russian) [Google Scholar]
  30. Zolotukhin, V.V.; Vilensky, A.M.; Vasil’ev, Y.R. Magnesium Basic Rocks of Western Part of the Siberian Platform and Problems of Nickel Potential; Nauka: Novosibirsk, Russia, 1984; p. 208. (In Russian) [Google Scholar]
  31. Campbell, I.H.; Czamanske, G.K.; Fedorenko, V.A.; Hill, R.I.; Stepanov, V. Synchronism of the Siberan Traps and Permian-Triassic boundary. Science 1992, 258, 1760–1763. [Google Scholar] [CrossRef] [PubMed]
  32. Renne, P.R.; Basu, A.R. Rapid eruption of the Siberian Trap flood basalts at the Permian-Triassic boundary. Science 1991, 253, 176–179. [Google Scholar] [CrossRef] [PubMed] [Green Version]
  33. Renne, P.R. Excess 40Ar in biotite and hornblende from the Noril’sk 1 intrusion, Siberia: implication for the age of the Siberan Traps. Earth Planet. Sci. Lett. 1995, 131, 165–176. [Google Scholar] [CrossRef]
  34. Malitch, K.N.; Badanina, I.Y.; Belousova, E.A.; Tuganova, E.V. Results of U-Pb dating of zircon and baddeleyite from the Norilsk-1 ultramafic-mafic intrusion (Russia). Russ. Geol. Geophys. 2012, 53, 123–130. [Google Scholar] [CrossRef]
  35. Malitch, K.N.; Belousova, E.A.; Griffin, W.L.; Badanina, I.Y.; Pearson, N.J.; Presnyakov, S.L.; Tuganova, E.V. Magmatic evolution of the ultramafic-mafic Kharaelakh intrusion (Siberian Craton, Russia): Insight from trace-element, U-Pb and Hf isotope data on zircon. Contrib. Mineral. Petrol. 2010, 159, 753–768. [Google Scholar] [CrossRef]
  36. Malitch, K.N.; Belousova, E.A.; Griffin, W.L.; Badanina, I.Y.; Latypov, R.M.; Sluzhenikin, S.F. New insights on the origin of ultramafic-mafic intrusions and associated Ni-Cu-PGE sulfide deposits of the Noril’sk and Taimyr provinces, Russia: evidence from radiogenic and stable isotope data. In Processes and Ore Deposits of Ultramafic-Mafic Magmas through Space and Time; Elsevier: Amsterdam, The Netherlands, 2017; Volume 7, pp. 198–237. [Google Scholar]
  37. Krivolutskaya, N.A. Siberian Traps and Pt-Cu-Ni Deposits of the Norilsk Area; Springer: Amsterdam, The Netherlands, 2016; p. 316. [Google Scholar]
  38. Lul’ko, V.A.; Fedorenko, V.A.; Distler, V.V.; Sluzhenikin, S.F.; Kunilov, V.E.; Stekhin, A.I.; Ryabikin, V.A.; Simonov, O.N.; Zen’ko, T.E. Geology and Ore Deposits of the Noril’sk Region; Guidebook VII IPS: Moscow/Noril’sk, Russia, 1994; p. 67. [Google Scholar]
  39. Streckeisen, A.; Zanettin, B.; Le Bas, M.J.; Bonin, B.; Bateman, P.; Bellieni, G.; Dudek, A.; Efremova, S.; Keller, J. Igneous Rocks. A Classification and Glossary of Terms; Le Maitre, R.W., Ed.; Cambridge University Press: Cambridge, UK, 2002; p. 37. [Google Scholar]
  40. Krivolutskaya, N.A.; Rudakova, A.V. Structure and Geochemistry of trap rocks from the Noril’sk trough, Northwestern Siberian Craton. Geochem. Int. 2009, 47, 635–656. [Google Scholar] [CrossRef]
  41. Carlson, R.W.; Lugmair, G.W.; McDougall, J.D. Columbia River volcanism: the question of mantle heterogeneityor crustal contamination. Geochim. Cosmochim. Acta 1981, 45, 2483–2500. [Google Scholar] [CrossRef]
  42. Allegre, C.J.; Dupre, B.; Richard, P.; Rousseau, D. Subcontinental versus suboceanic mantle debate, II. Nd-Sr-Pb isotopic comparison of continental tholeiites with mid-ocean ridge tholeiites, and the structure of the continental lithosphere. Earth Planet. Sci. Lett. 1982, 57, 25–34. [Google Scholar] [CrossRef]
  43. Carlson, R.W.; Lugmair, G.W.; McDougall, J.D. Columbia River volcanism: the question of mantle heterogeneity or crustal contamination (reply to a comment by DePaolo, D.J.). Geochim. Cosmochim. Acta 1983, 47, 845–846. [Google Scholar] [CrossRef]
  44. Sharma, M.; Basu, A.; Nesterenko, G.V. Temporal Sr-, Nd- and Pb-isotopic variations in the Siberian flood basalts: implications for the plume-source characteristics. Earth Planet. Sci. Lett. 1992, 113, 365–381. [Google Scholar] [CrossRef]
  45. Hart, S.R.; Staudigel, H. Isotopic characterization and identification of recycled components. In Crust-Mantle Recycling at Convergence Zones; Hart, S.R., Gullen, L., Eds.; Kluwer Academic Publishers: Berlin, Germany, 1989; pp. 15–28. [Google Scholar]
  46. McDougall, J.D. Continental flood basalts and MORB: A brief discussion of similarities and differences in their petrogenesis. In Continental Flood Basalts; McDougall, J.D., Ed.; Kluwer Academic Publishers: Berlin, Germany, 1988; pp. 331–341. [Google Scholar]
  47. Dalrymple, G.B.; Czamanske, G.K.; Fedorenko, V.A.; Simonov, O.N.; Lanphere, M.A.; Likhachev, A.P. A reconnaissance 40Ar/39Ar geochronologic study of ore-bearing and related rocks, Siberian Russia. Geochim. Cosmochim. Acta 1995, 59, 2071–2083. [Google Scholar] [CrossRef]
  48. Prasolov, E.M.; Sergeev, S.A.; Belyatsky, B.V.; Bogomolov, E.S.; Gruzdov, K.A.; Kapitonov, I.N.; Krymsky, R.S.; Khalenev, V.O. Isotopic systematics of He, Ar, S, Cu, Re, Os, Pb, U, Sm, Nd, Rb, Sr, Lu, and Hf in the rocks and ores of the Norilsk deposits. Geochem. Int. 2018, 56, 46–64. [Google Scholar] [CrossRef]
Figure 1. Geology of the Norilsk district (modified after [2]). Troughs: I—Kharaelakh, II—Norilsk; faults: 1—Yenisey-Khatangsky, 2—Norilsk-Kharaelakh. The sidebar shows the position of the Norilsk district within the Siberian traps province.
Minerals 10 00165 g001
Figure 2. Geological map of the Turumakit area modified after Norilskgeologia LLC data.
Minerals 10 00165 g002
Figure 3. Inner structure of the intrusive bodies in the boreholes BT-1, BT-6 and BT-8, and the relative location of the studied samples. The mineral composition of gabbro-dolerite is indicated by letter symbols in the lower right column.
Minerals 10 00165 g003
Figure 4. Photomicrographs of the intrusive rocks of the Turumakit area, borehole BT-6 and BT-8. Samples: (a,b) BT-6/90 biotite-amphibole bearing leucogabbro; (c,d) BT-8/97.4 olivine-bearing gabbro-dolerite; (e) BT-8/109 leucogabbro; (f,g) BT-8/134 olivine-bearing gabbro-dolerite; (h) BT-8/212 taxitic gabbro-dolerite (see relative position of the samples in the Figure 3); Minerals: Ol—olivine, cPx—clinopyroxene, Pl—plagioclase, Bi—biotite, Mag—magnetite, Amf—amphibole.
Minerals 10 00165 g004
Figure 5. Px–Pl–Ol diagram for the Turumakit area rock compositions, where: blue squares and green diamonds correspond to samples from Norilsk and Ergalakh intrusions, respectively.
Minerals 10 00165 g005
Figure 6. Oxides (a) TiO2, (b) Fe2O3, (c) Al2O3, (d) CaO, (e) K2O, (f) Na2O, (g) P2O5, (h) Na2O + K2O, (i) SiO2, (j) MnO vs MgO (as a differentiation index) variation diagrams (wt %). Data for Norilsk and Ergalakh (Turumakit area) are from Table S1 and Table 1; Norilsk 1 intrusion-unpublished authors’ data, the Ergalakh data from the Kharaelakh trough-are from [16], Ergalakh (Ryabov)–data from the Ergalakh intrusion in the Norilsk trough [17].
Minerals 10 00165 g006aMinerals 10 00165 g006b
Figure 7. MgO (wt %) distribution along the borehole BT-6 section.
Minerals 10 00165 g007
Figure 8. Spidergram for normalized [19] trace-element patterns of the rocks from the alleged Ergalakh (green lines) and Norilsk intrusions (blue lines) of the Turumakit area (data in Table S1).
Minerals 10 00165 g008
Figure 9. Hand specimen photo (a) and microphotogaph (b) of sample BT-1/114.6 trachydolerite (Pl: plagioclase, cPx: clinopyroxene, Ol: olivine).
Minerals 10 00165 g009
Figure 10. Baddeleyite grains from the trachydolerite sample BT-1/114.6. Rows (1–8 from top to bottom): 1 row-grains 1–10 in CLI, 3 row)–grains 1–10 in back-scattered electron (BSE), 3 row–grains 1–10 in transparent light, 4 row–grains 1–10 in reflected light; 5 row–grains 11–20 in CLI, 6 row–grains 11–20 in BSE, 7 row-grains 11–20 in transparent light, 8 row–grains 11–20 in reflected light.
Minerals 10 00165 g010
Figure 11. The U–Pb diagrams with Concordia for baddeleyite (red) and zircon (green) from trachydolerites of samples BT-1/114.6 (a) and BT-6/105.5 (b) and for a total of 31 concordant data-points from these samples (c). Reported ellipses correspond to a 95% level of confidence of analytical data.
Minerals 10 00165 g011aMinerals 10 00165 g011b
Figure 12. Photo and photomicrographs of gabbro-dolerites, samples BT-8/121.9 (a,b) and BT-8/219.1 (c,d).
Minerals 10 00165 g012
Figure 13. The U–Pb diagrams with concordia for baddeleyite from the gabbro-dolerites of samples BT-8/121.9 (a) and BT-8/219.1 (b), and summary for 16 concordant data-points from these samples (c) Reported ellipses correspond to a 95% level of confidence of analytical data.
Minerals 10 00165 g013
Figure 14. Photo (a) and photomicrorgaph (b) of gabbro-dolerite DL-1 (Pl—plagioclase, cPx—clynopyroxene).
Minerals 10 00165 g014
Figure 15. Zircon (1–4 and 9–10) and baddeleyite (5–8) grains from the gabbro-dolerite of the Daldykan intrusion (sample Dl-1).
Minerals 10 00165 g015
Figure 16. The U–Pb diagram with Concordia for zircon from the gabbro-dolerite Dl-1. Reported ellipses correspond to a 95% level of confidence of analytical data.
Minerals 10 00165 g016
Figure 17. εNd-εSr diagram for intrusive rocks of the Norilsk region (data are from [16] and unpublished authors’ data, large symbols, studied Turumakit samples: BT-6/169.2; Norilsk-Turumakit, BT-1/114.6; supposed Ergalakh, Dl-1-Daldykan).
Minerals 10 00165 g017
Figure 18. Comparative diagram of SiO2 vs Na2O + K2O for various intrusive complexes of the Norilsk district. Data for the Ergalakh (green diamonds) and Norilsk (blue squares) rocks are given in Table S1 and Table 1 (Turumakit area); data for Avamsky (yellow squares) complex after [16], Ivakinsky Formation (orange circles)—unpublished authors’ data. Red dashed lines are represented boundaries between alkaline and subalkaline rocks, according to [39].
Minerals 10 00165 g018
Figure 19. Normalized [19] trace-element patterns for sub-alkaline rocks of Avamsky (blue circles) and Ergalakh complexes of the Norilsk region (yellow squares, SG-9-2200 [16]) and the Turumakit area (green diamonds).
Minerals 10 00165 g019
Figure 20. Initial εNd–εSr plot for the Siberian intrusive rocks. D—Daldykan, R—Ruinny, A—Ambarninsky, T—Talnakh, N1—Norilsk 1, LT–LN—Lower Talnakh—Lower Norilsk, F—Fokinskiy, E—Ergalakh from [16,44]. This work: 1—DL-1, 2—BT–6/114.6, 3—BT–6/169.2, 4—BT–8/219.1. Fields of Mid-Ocean Ridge Basalts (MORBs) and Ocean Island Basalts (OIBs) are from [45].
Minerals 10 00165 g020
Table 1. Bulk rock geochemical compositions of the Turumakit rock samples from which baddeleyites were separated.
No.123456
SampleBT-1/114.6BT-6/105.5BT-8/121.9BT-8/219.1BT-6/169.2Dl-1
Complexerernrnrnrdl
SiO246.348.249.347.446.7045.7
TiO23.334.72.131.490.712.02
Al2O313.411.713.116.516.5615.3
Fe2O316.317.811.812.611.4915.6
MnO0.20.260.210.190.180.22
MgO2.834.317.37.4411.386.53
CaO9.168.1312.911.310.3510.1
Na2O3.442.892.432.342.152.95
K2O3.192.020.550.610.260.62
P2O51.540.670.150.160.050.21
LOI0.20.050.270.330.61.0.61
Cr4.297.32545165310158
Ni5.339.3879.5134320118
Rb55.156.415.312.66.317.7
Sr1010555215433194238
Y65.645.826.519.813.539.3
Zr39427881.572.657.4135
Nb40.223.44.034.092,617.88
Ba114063312018684163
La70.540.48.057.274.8311.1
Ce153881816.710.326.1
Pr19.210.92.622.211.413.62
Nd81.346.512.29.667.3217.4
Sm17.210.53.613.032.045.04
Eu4.643.131.131.050.781.73
Gd1710.43.982.842.746.13
Tb2.381.550.720.531.561.04
Dy13.48.884.533.52.726.66
Ho2.551.680.980.750.561.41
Er6.984.612.682.291.664.02
Tm0.940.650.350.30.230.58
Yb5.553.932.471.931.593.64
Lu0.830.590.410.320.230.51
Hf9.196.932.292.277.613.73
Ta2.341.410.250.270.170.47
Pb11.37.93.891.871.074.5
Th6.364.591.111.10.681.38
U1.831.220.420.470.200.58
Note: Complex: nr: Norilsk, er: Ergalakh, dl: Daldykan intrusions.
Table 2. Sr–Nd–Pb isotope data for Turumakit intrusions (element contents in ppm, uncertainties correspond to the last digits of respective ratios).
SampleRbSr87Rb/86Sr87Sr/86Sr ± 2σSmNd147Sm/144Nd143Nd/144Nd ± 2σ206Pb/204Pb ± 2σ207Pb/204Pb ± 2σ208Pb/204Pb ± 2σ
DL-114.52190.191700.705775 ± 74.8116.90.172060.512744 ± 318.8406 ± 515.5896 ± 438.4779 ± 13
БT-1/114.647.09380.144810.708095 ± 1016.476.80.128870.512334 ± 218.2812 ± 1015.5356 ± 938.2412 ± 28
БT-6/169.24.901680.084390.705271 ± 71.846.600.168180.512661 ± 318.5325 ± 715.5807 ± 638.4754 ± 17
БT-8/219.113.64940.079550.707337 ± 73.4412.20.170160.512599 ± 318.8393 ± 1015.6203 ± 938.6435 ± 26
Table 3. Re–Os isotope data for the Turumakit samples.
SampleRe, ppbOs, ppb187Re/188Os187Os/188Os ± 2σModel Age, Ma
DL-10.1460.1066.7540.1911 ± 13597
BT-1/114.61.4680.034263.01.2833 ± 44264
BT-8/219.10.6490.3369.3330.2361 ± 6725
BT-8/121.91.0060.05297.930.6069 ± 5294

