1. Introduction
The upgrading of metal concentration of ores before fine comminution can decrease the capital expenditure and energy consumption of mining operations, as well as simplify environmental permitting [
1,
2]. The propensity of some ores to deport metal into specific size fractions can, in some cases, allow the early rejection of low grade materials by using selective comminution, grade by size or pre-concentrations during the coarse comminution stage [
3,
4,
5,
6,
7,
8,
9,
10]. Understanding how compressional breakage influences mineral liberation is an important first step to identify ores that have suitable characteristics for pre-concentration. There are multiple models that consider particle size reduction for coarse comminution, but few of them include mineral concentration or mineral liberation. Normally, the evaluation of liberation is made in the last step of the process, when all particles are reduced to a smaller size. Relatively few studies have tried to address liberation during coarse comminution, such as in the work of Carrasco [
8,
9] and Bazin [
10].
During liberation analysis, the size reduction of the particles is not the only interesting concept, and it is important to understand how the minerals break. Gaudin [
11] described two types of mineral liberation: by comminution and by detachment. Liberation by comminution or random breakage is achieved by random fracture mechanism; the crack propagation occurs through the mineral grain. In this type of breakage, the particles will be broken into finer particles with predictable unimodal distribution, which generate a constant composition due the same distribution of the minerals. In this case, the ore texture, grain boundaries or mineral properties do not influence the breakage [
12]. The second type is liberation by detachment or non-random breakage, where the fractures or the cracks propagation are situated along the grain boundaries allowing the preferential liberation of the phases. Contrary to the random breakage, this type will generate a variation in the mineral composition of different size fractions [
1]. There are two forms of non-random breakage in particle bed breakage: interfacial breakage (grain/phase boundary fracture) and preferential breakage. In interfacial breakage, the fracture occurs between different grains or between the phase boundaries, allowing the preferential liberation of the phases. In the second case, the preferential breakage occurs when the characteristics of the phases are different, resulting in breakage at different rates depending on the minerals properties of the ore [
13,
14,
15]. Researchers such as Wang, Dhawan, Kodali and Vizcarra [
16,
17,
18,
19,
20] have evaluated mineral liberation using different breakage mechanisms and their influence on the type of fractures.
The large number of factors influencing coarse liberation makes it difficult to make predictions based on the textural analysis. This study is, therefore, focused on developing a test protocol to analyze and characterize grade by size variation during compression breakage. The main hypothesis of this paper is that critical metals are not evenly distributed in the different size fractions during coarse comminution processes, since the breakage of particles will be affected by the mineralogy and texture, therefore a test protocol is necessary for evaluation.
2. Method for Analyzing the Mineral and Element Composition in Compression Breakage
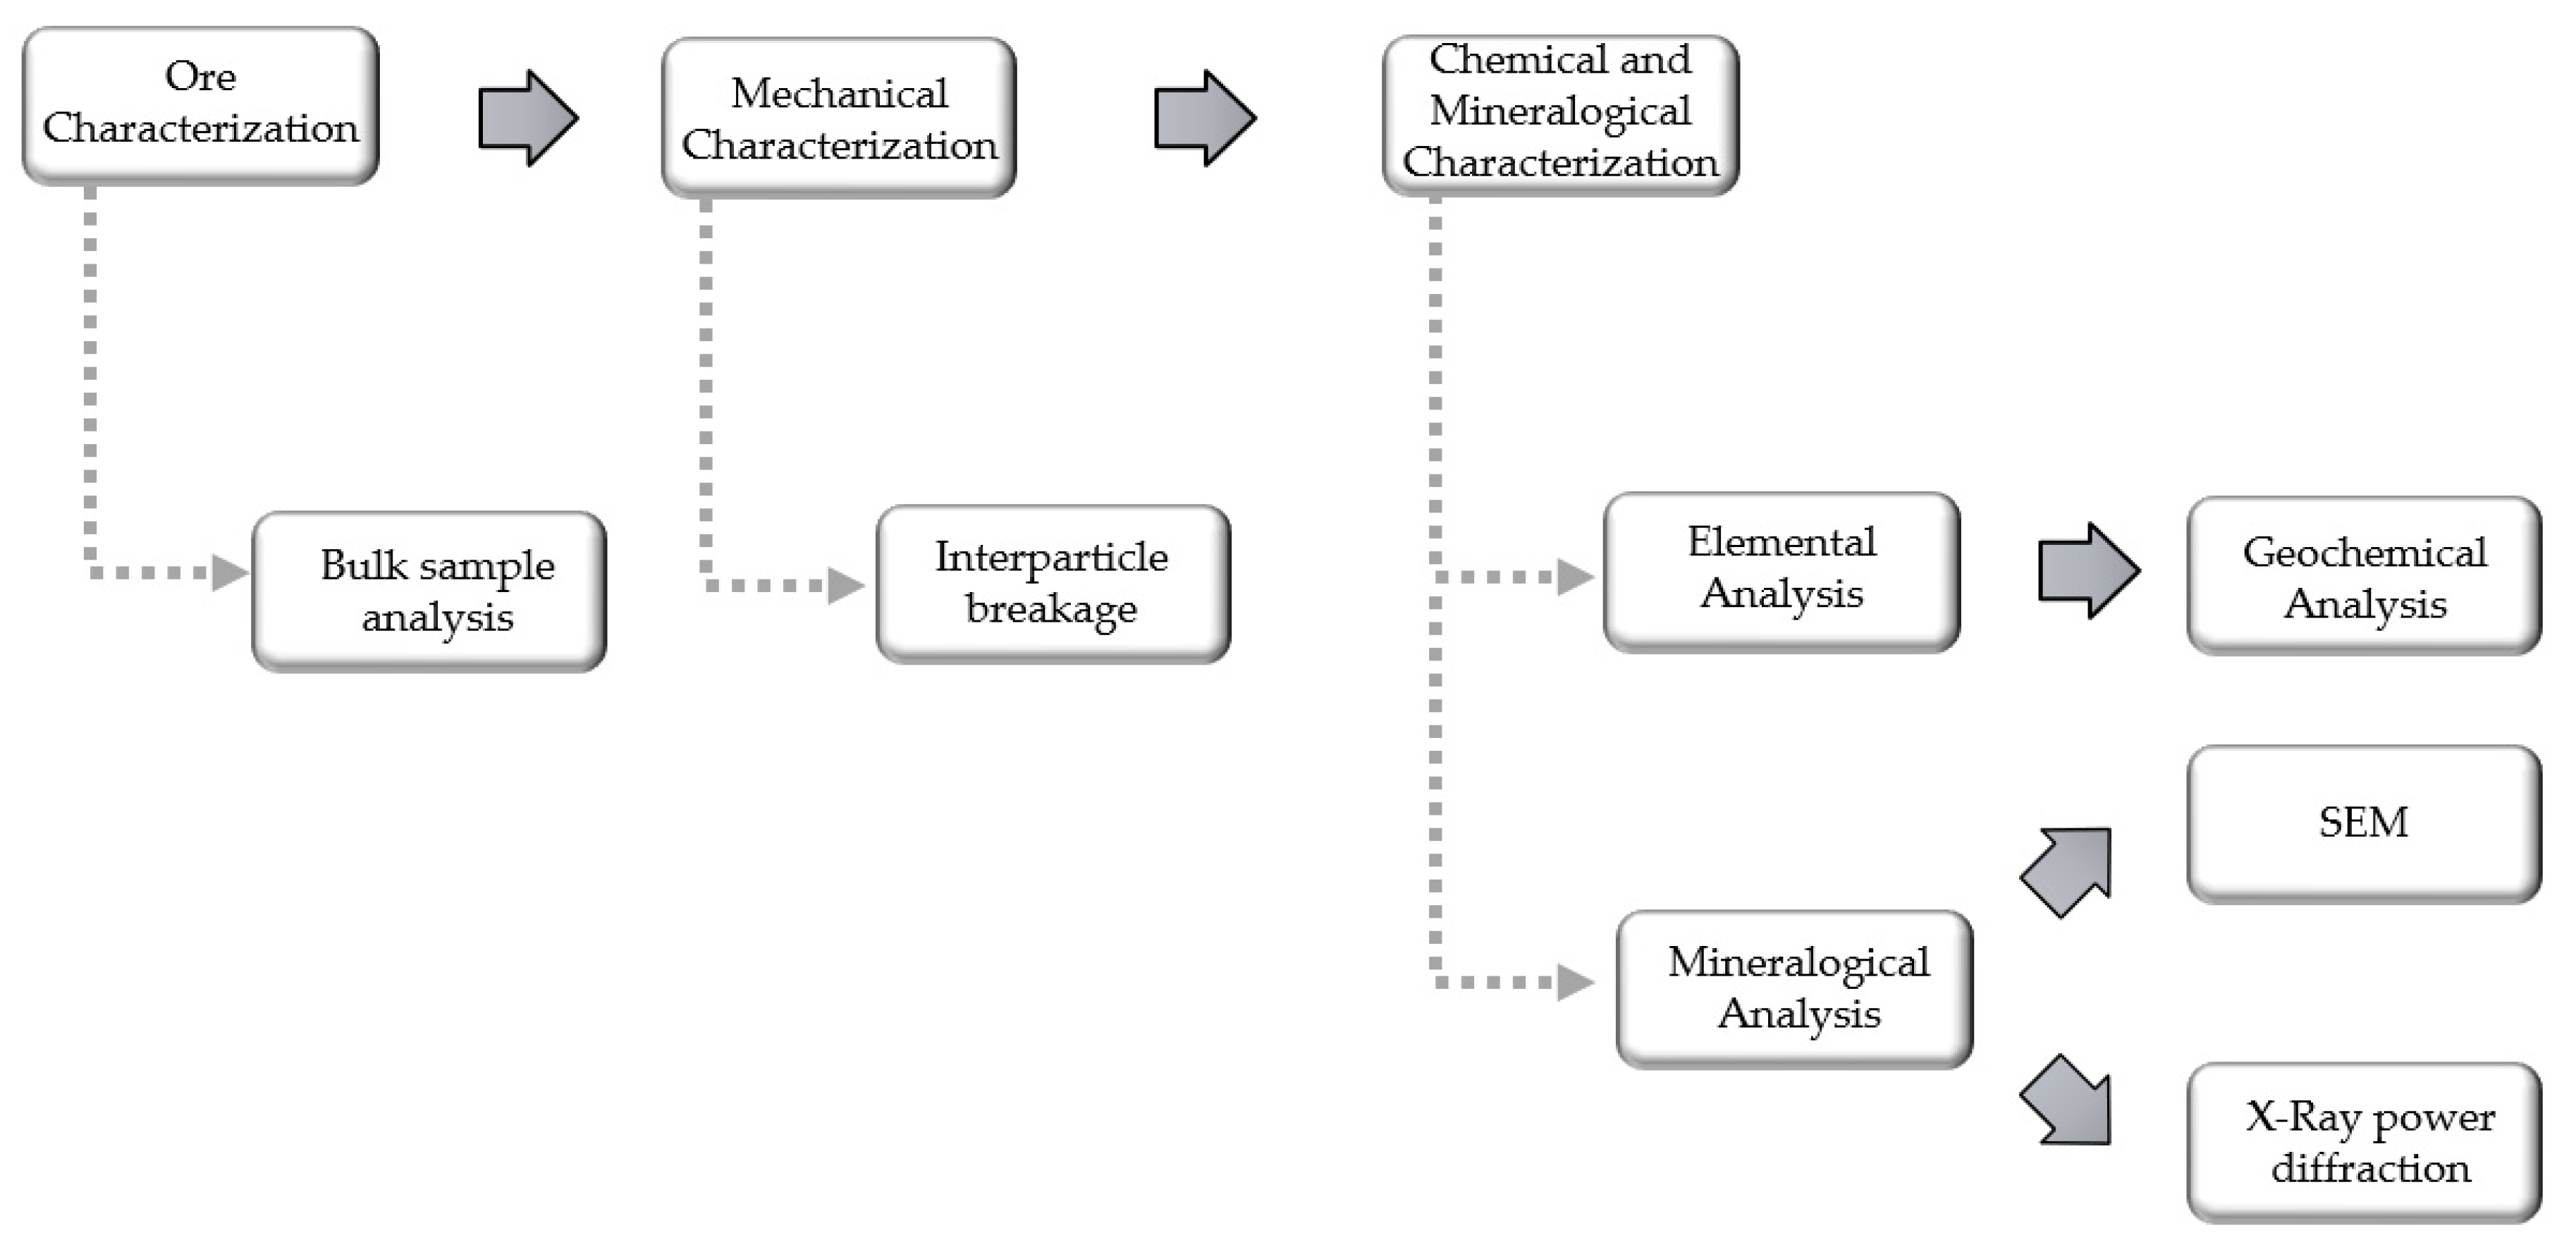
The methods used in this study are divided into three parts that are schematically illustrated in
Figure 1. The first part relates to a mineralogical and chemical characterization of the bulk sample. The second part is the mechanical characterization and includes laboratory compressive crushing involving interparticle breakage (IPB—bed breakage). The third part relates to mineralogical and chemical characterization of the sample after compression breakage.
2.1. Chemical and Mineralogical Characterization of the Bulk Sample—Raw Material Characterization
The characterization of the original sample or raw material includes the evaluation of the mineralogy and chemical composition. The mineralogy is evaluated by an automatic scanning electron microscopy (SEM) with energy-dispersive X-ray spectrometer (EDS) for high-density mineral phases and is conducted on polished slabs over a 4 cm × 2.5 cm area. The chemical composition of the ore is evaluated by bulk geochemical analysis. The description of both methods is included in
Section 2.3. In-depth knowledge of the composition in terms of minerals and composition of the ore will help to understand the behavior of the material during comminution.
2.2. Compressive Breakage Test—Interparticle Breakage
Evertsson [
21] developed a method for characterizing the compressive breakage behavior for rock material with the use of a piston and die test. This is a well-known method that imitates the conditions in a cone crusher, it has been used and optimized by Lee, Bengtsson and Barrios and Tavares [
22,
23,
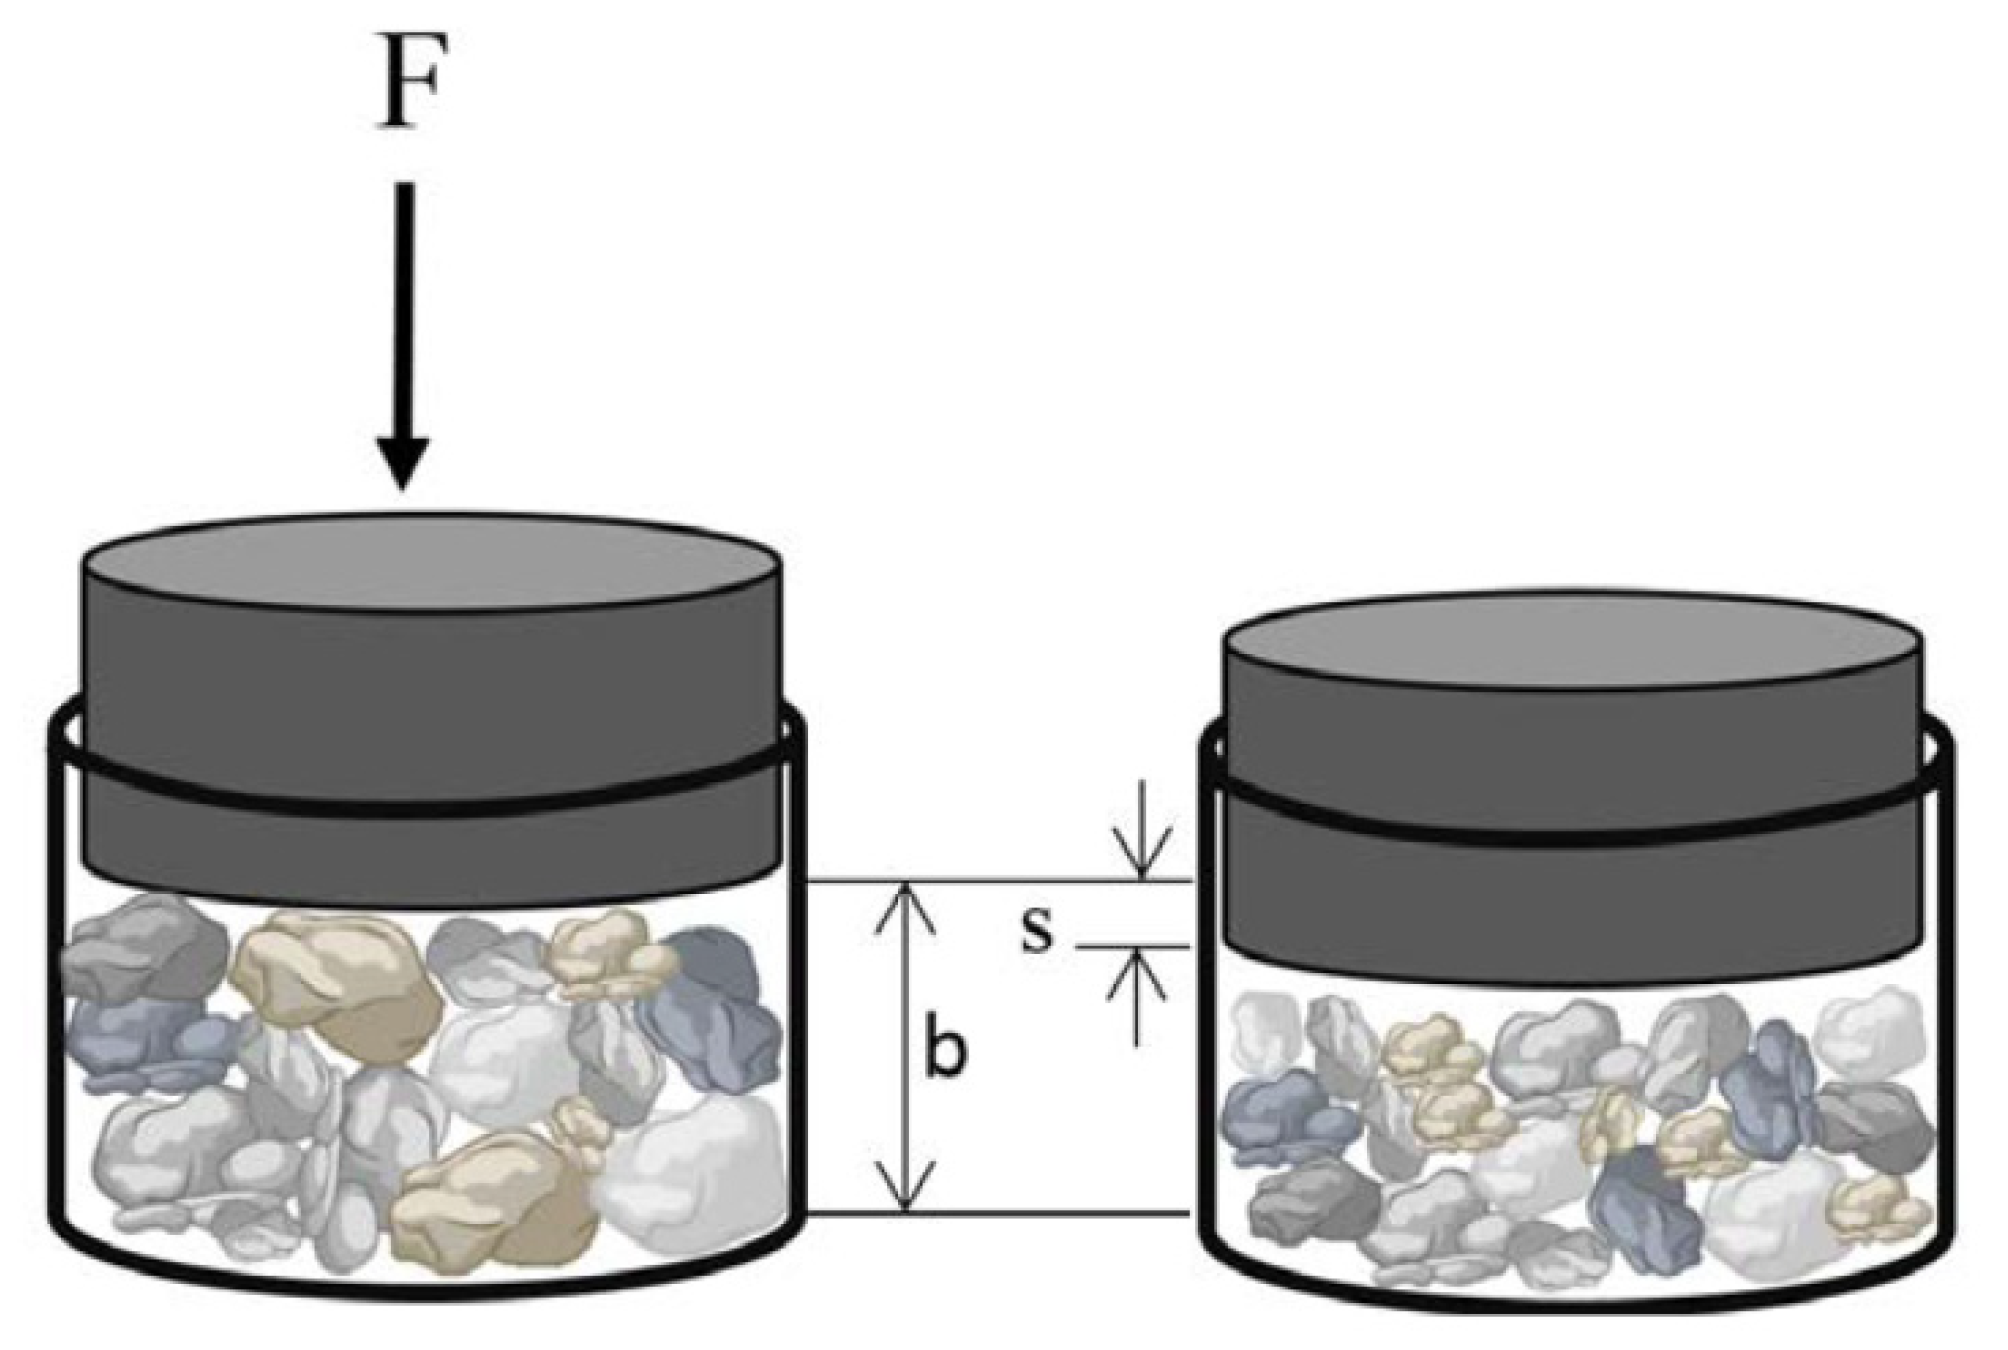
24]. The compressive breakage methodology allows analysis and mechanical characterization of the rock in terms of the breakage, particle size distribution, and energy consumption when compressive forces are applied. The breakage behavior is characterized by determining the particle size distribution after repeated compressions at different compression ratios. The test requires approximately 350 mono-sized particles corresponding to a size fraction of 22.4–31.5 mm. A quantity of 350 particles of this size fraction correspond approximately to 500 gr, and variation in the mass will depend on the density of the evaluated material and variation in size of each particle. A schematic illustration of the interparticle breakage (IPB) is shown in
Figure 2. The bed height (
b) is defined by the thickness occupied by the material. The displacement of the piston (
s) and the compression ratio (
s/b) are fixed values. The definition of the compression ratio is presented in Equation (1) and it represents the compression by the relation between the initial and final height.
For the interparticle breakage, the mono-sized particles are located in the piston chamber with several inter-contact points between the particles and the cylinder surface, as
Figure 2 shows. It is necessary to avoid unfilled spaces between particles in the bed. Homogeneity is achieved by a good reorganization of the particles by shaking the piston chamber with the particles before the test. The tested values for the compression ratio are 0.10, 0.15, 0.20, 0.25, 0.30 and 0.35. For each compression ratio, the samples are compressed and sieved a number of times or cycles to analyze the particle size distribution as a function of the compression, 0.10 is repeated 5 times or 5 cycles, 0.15 is repeated 4 cycles, 0.20 4 cycles, 0.25 4 cycles, 0.30 2 cycles with an addition of one cycle of 0.15, and 0.35 2 cycles. In
Figure 3, the test procedure for the experiment is described. The suggested test is designed to simulate the conditions where a volume of material is compressed in a real crushing chamber and it is based on the work of Evertsson [
21].
2.3. Methods for Geochemical and Mineralogical Characterization
The chemical and mineralogical characterizations are performed on the products generated from the breakage sequence in the compression breakage test using a specific compression ratio and size distribution fraction. Three values of compression ratio are evaluated: 10%, 20% and 30%. After the IPB test the comminuted product is sieved and divided into nine class size fractions as shown in
Table 1.
For the geochemical characterization, the samples were analyzed by acid digestion of fused bead by inductively-coupled plasma atomic emission spectrometry (ICP-AES; major elements) and inductively-coupled mass spectrometry (ICP-MS; trace elements) by ALS global. Refractory elements (e.g., Nb and Ta minerals) are difficult to digest, but fused samples were totally solubilized with sodium peroxide and then analyzed by ICP-MS. The mineralogy was analyzed by X-ray diffraction (XRD). The XRD spectra was measured from powdered samples in a Bragg-Brentano PANAnalytical X’Pert Diffractometer (graphite monochromator, automatic gap, Kα-radiation of Cu at λ = 1.54061 Å, powered at 45 kV-40 mA, scanning range 4–100° with a 0.017° 2θ step scan and a 50 s measuring time). Identification and Rietveld semi-quantitative evaluation of phases is done using the PAN analytical X’Pert HighScore software. The analysis was performed at the Centres Cientifics i Tecnològics de la Universitat de Barcelona. SEM with EDS was used for mineralogical and textural characterization of the ore, e.g., to study mineral liberation, the mineralogy of composite particles, grain sizes, and fractures. The analysis of the composite particles was focused on minerals related to critical metals and their associations. The particles from each size fraction were mounted separately and were embedded in epoxy. Polished surfaces of epoxy mounts were carbon coated and analysis was performed using a Hitachi S-3400N SEM coupled to an Oxford Instruments X-Max EDS at the University of Gothenburg, Sweden. Oxford Inca software was set up to automatically detect high-density minerals by the back-scatter intensity and to analyze the chemistry of each grain detected by EDS.
3. Application of the Method
The combination of methods for the testing of mechanical and material properties allows the identification of grade by size variation in coarse comminution by recognizing how ore-bearing particles relate to compression ratio, size distribution, and mineralogy.
The aim of this study was to introduce a test protocol for coarse comminution that provides relevant and accurate information, at an acceptable cost. Other techniques such as QEMSCAN will provide similar information, but considering the large number of samples that would be required this is not economically feasible. For this purpose, we performed a case study of a low grade Sn–Ta greisen-type mineralization in Spain. Through fairly detailed investigations of this material, we tried to constrain tests that could accurately characterize liberation during coarse comminution. Based on the case study we made recommendations of a protocol for material characterization.
4. Case Study
4.1. Materials
The application of the method was evaluated in a case study of a low grade Sn–Ta greisen-type mineralization ore from the Penouta deposit located in Penouta village, in the municipality of Viana do Bola, Ourense, Galicia, in the northeast of Spain. The mineralization is hosted in leucogranite affected by greisen processes to the greisen and in the surrounding leucogranites. The Penouta leucogranite is hosted in metamorphic rocks, mainly constituted by gneisses and mica-schists [
25]. The essential minerals are quartz, albite, K-feldspar, muscovite, and kaolinite. Accessory minerals are present, such as garnet, cassiterite, apatite, monazite, zircon, columbite-tantalite, and uraninite. The major components of this ore are SiO
2 70–76 wt.%, Al
2O
3 14.2–16.6 wt.%, Fe
2O
3 0.4–1.12 wt.%, Na
2O 4.3–6.7 wt.%, CaO 0.1–0.15 wt.%, MgO 0.01–0.03 wt.%, and K
2O 3.35–4.1 wt.% [
26,
27]. Main valuable minerals are cassiterite (SnO
2) and columbite-group minerals (CGM), which constitute a solid solution with tantalite ((Fe,Mn)(Ta,Nb)
2O
6) and columbite ((Fe, Mn)(Nb, Ta)
2O
6) and four end members: columbite-(Fe), (FeNb
2O
6), columbite-(Mn), (MnNb
2O
6), tantalite-(Fe), (FeTa
2O
6) and tantalite-(Mn), (MnTa
2O
6) [
26]. Other Ta-rich minerals, such as microlite and wodginite, have also been reported [
25,
28]. A detail characterization of Penouta ore is described by Lorens et al., López et al., and Alfonso et al. [
26,
27,
28].
The case study was performed on two ~1 ton samples from the Penouta open pit mine, collected by university of Centres Cientifics i Tecnològics de la Universitat de Barcelona during January 2015, as a part of a multi-partner research collaboration (OPTIMORE, project number 642201) [
25,
28,
29,
30,
31,
32]. Due to potential mineralogical variations, samples of the mineralized leucogranite were collected from different parts of the open pit. Splits of 100 kg from the original samples were received to Chalmers University in Gothenburg during 2015. The sub-sampling of this material was based on the protocol of Evertsson [
21], and 12 samples each weighting 500 g was collected by hand from each original sample. Particles in the range of 22.4 to 31.5 mm was selected for the for the compressive breakage test. Initial petrographic studies indicated that valuable minerals in Penuota samples were relatively small and homogenously distributed, and it was therefore assumed that 500 g grams of starting materials would be sufficient for representative geochemical analysis. This assumption was validated by evaluation of grade by size distribution of test materials (see below). This may not be the case for other mineralization (e.g., gold) where valuable mineral grains can be much more heterogeneously distributed, and more material must be tested in order to obtain representative analysis c.f. Gy [
33].
4.2. Chemical and Mineralogical Characterization of the Bulk Sample
The ore is an extremely fragile granite rich in quartz, cassiterite and columbite-group minerals. The granite is dominated by 2–4 mm spherical quartz and occasional K-feldspar and white mica megacrysts in a matrix of albite, muscovite and K-feldspar. Minor kaolinite is also present, replacing feldspars. Albite is present in the ore. The fracturing of the rock is controlled mainly by frequent micro-fractures in albite, while megacrysts are much less fractured or even unfractured. Results show that columbite-group minerals occur as smaller grains, usually in grains of less than 250 µm diameter insize with variable composition. Valuable minerals typically occur in the matrix, or more rarely in grain boundaries of megacrysts. The chemical composition of the two samples is presented in
Table 2 as whole rock values.
4.3. Compressive Breakage Test
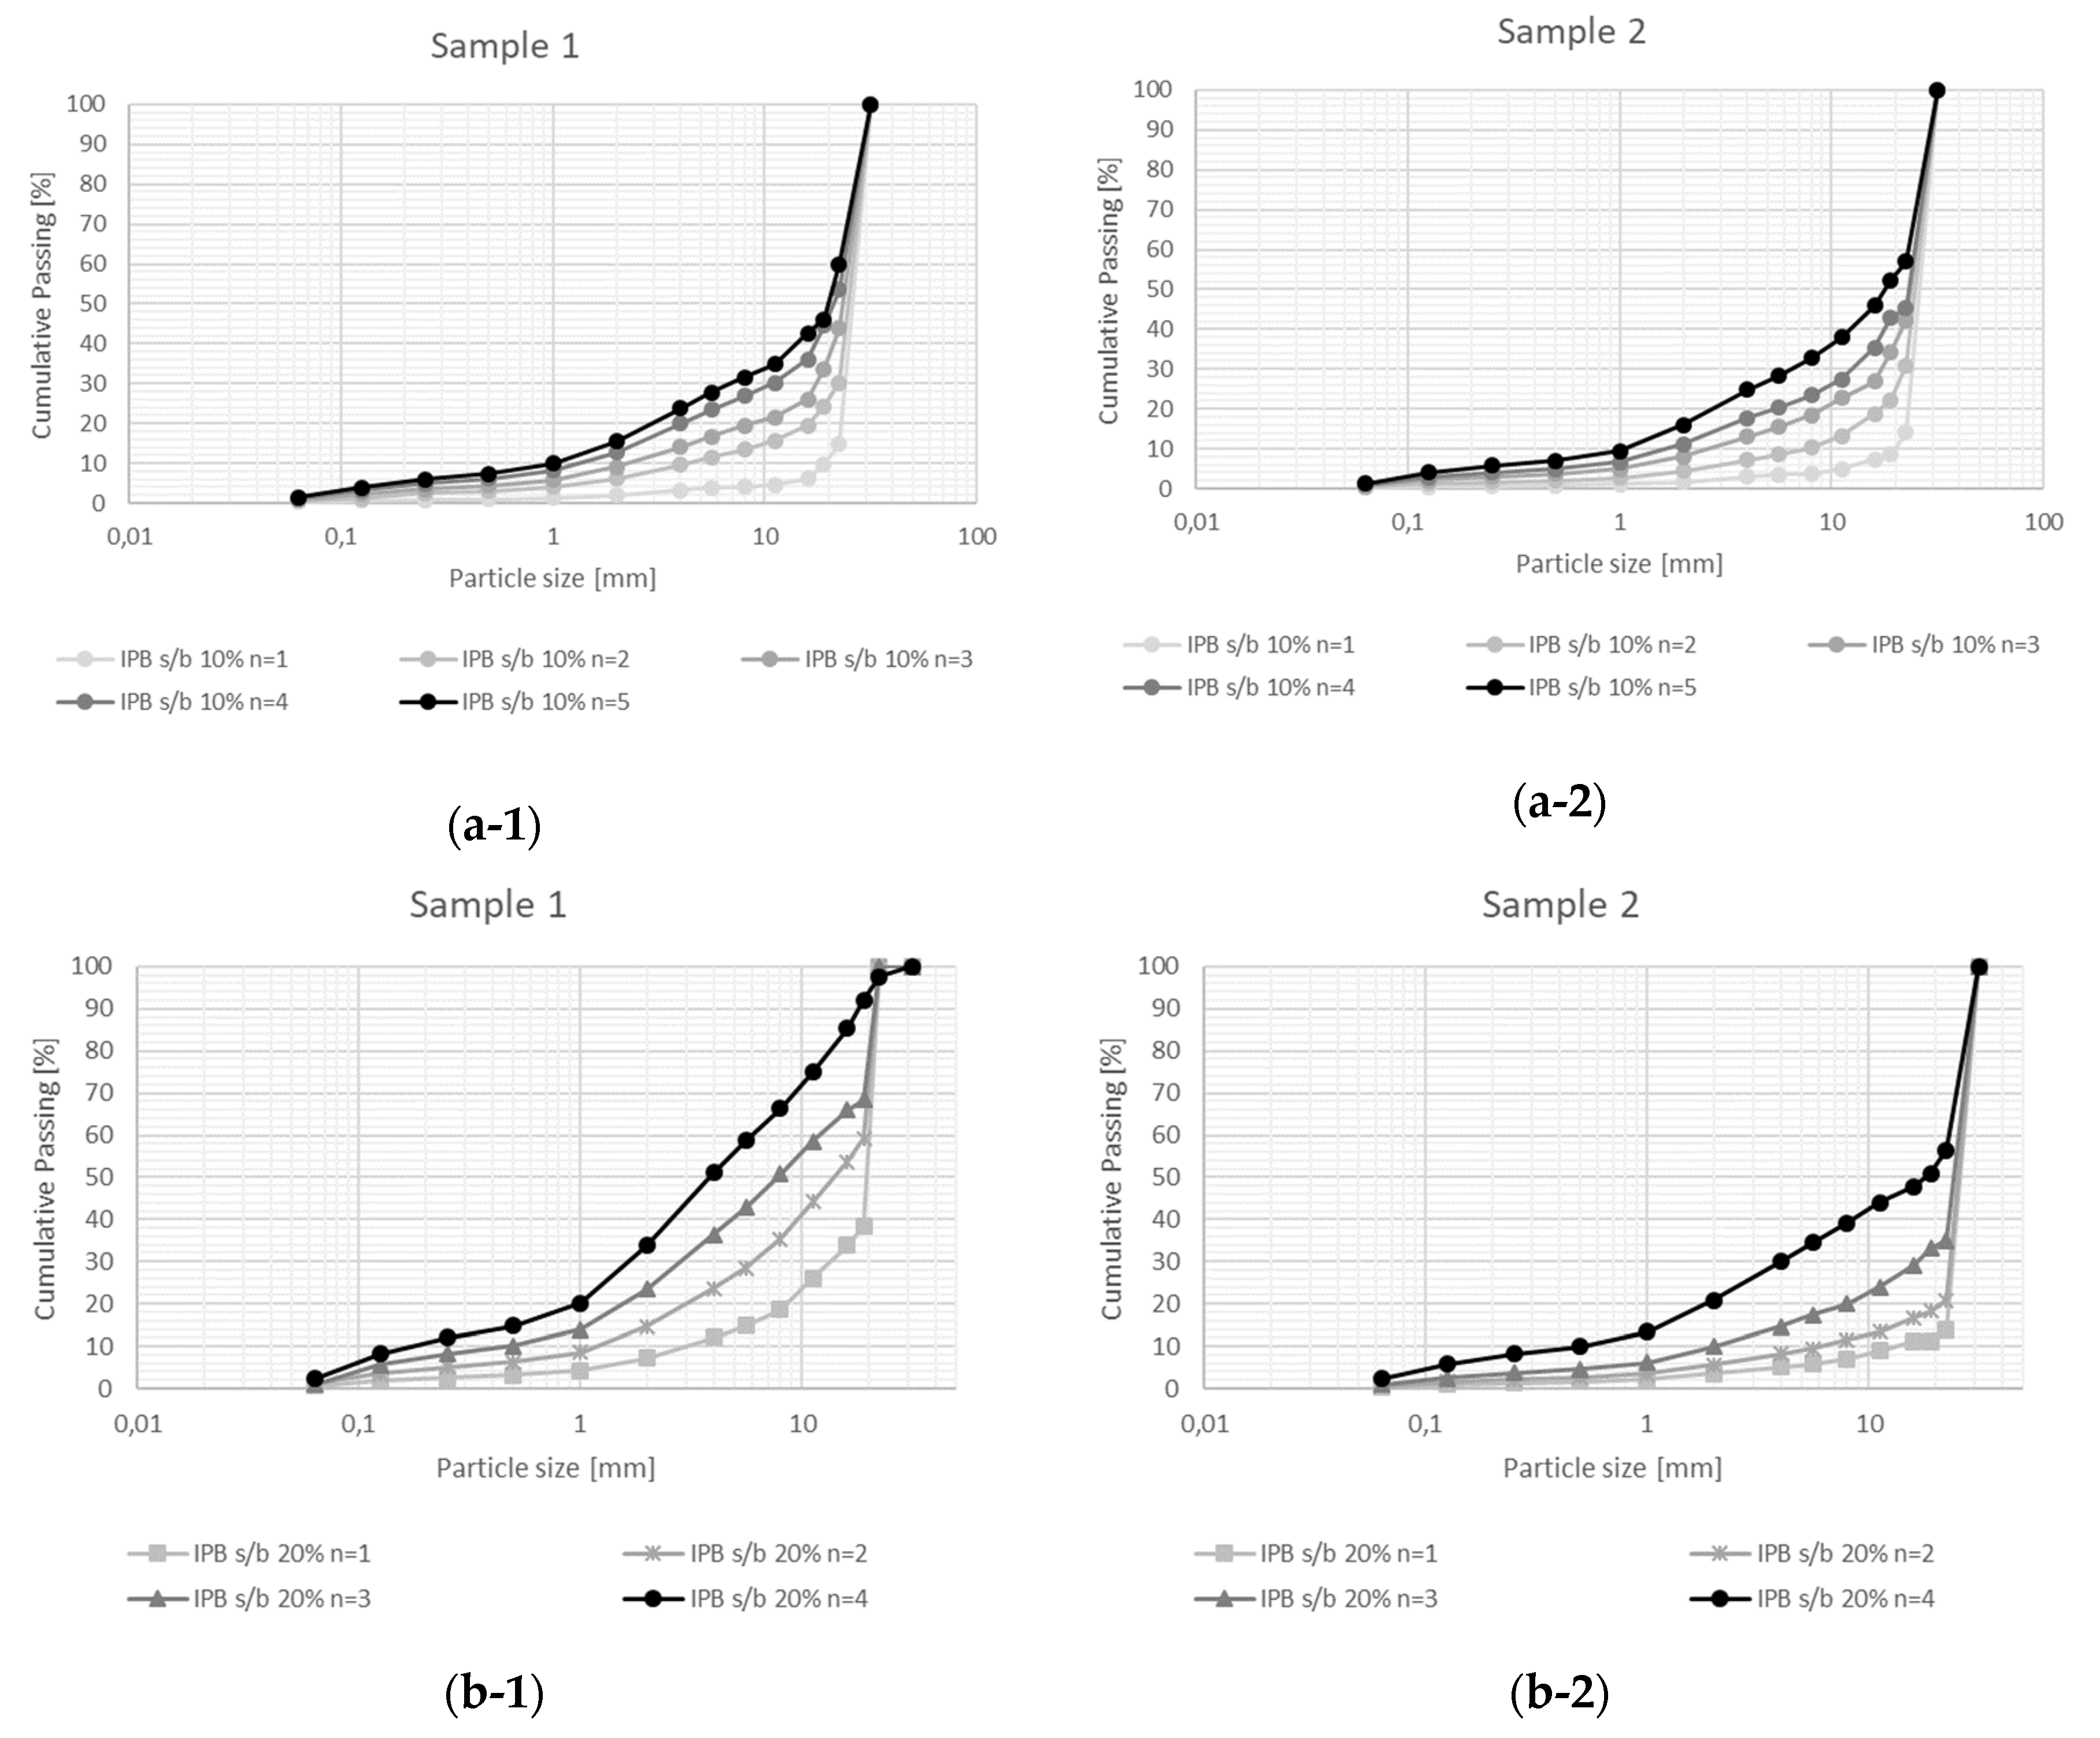
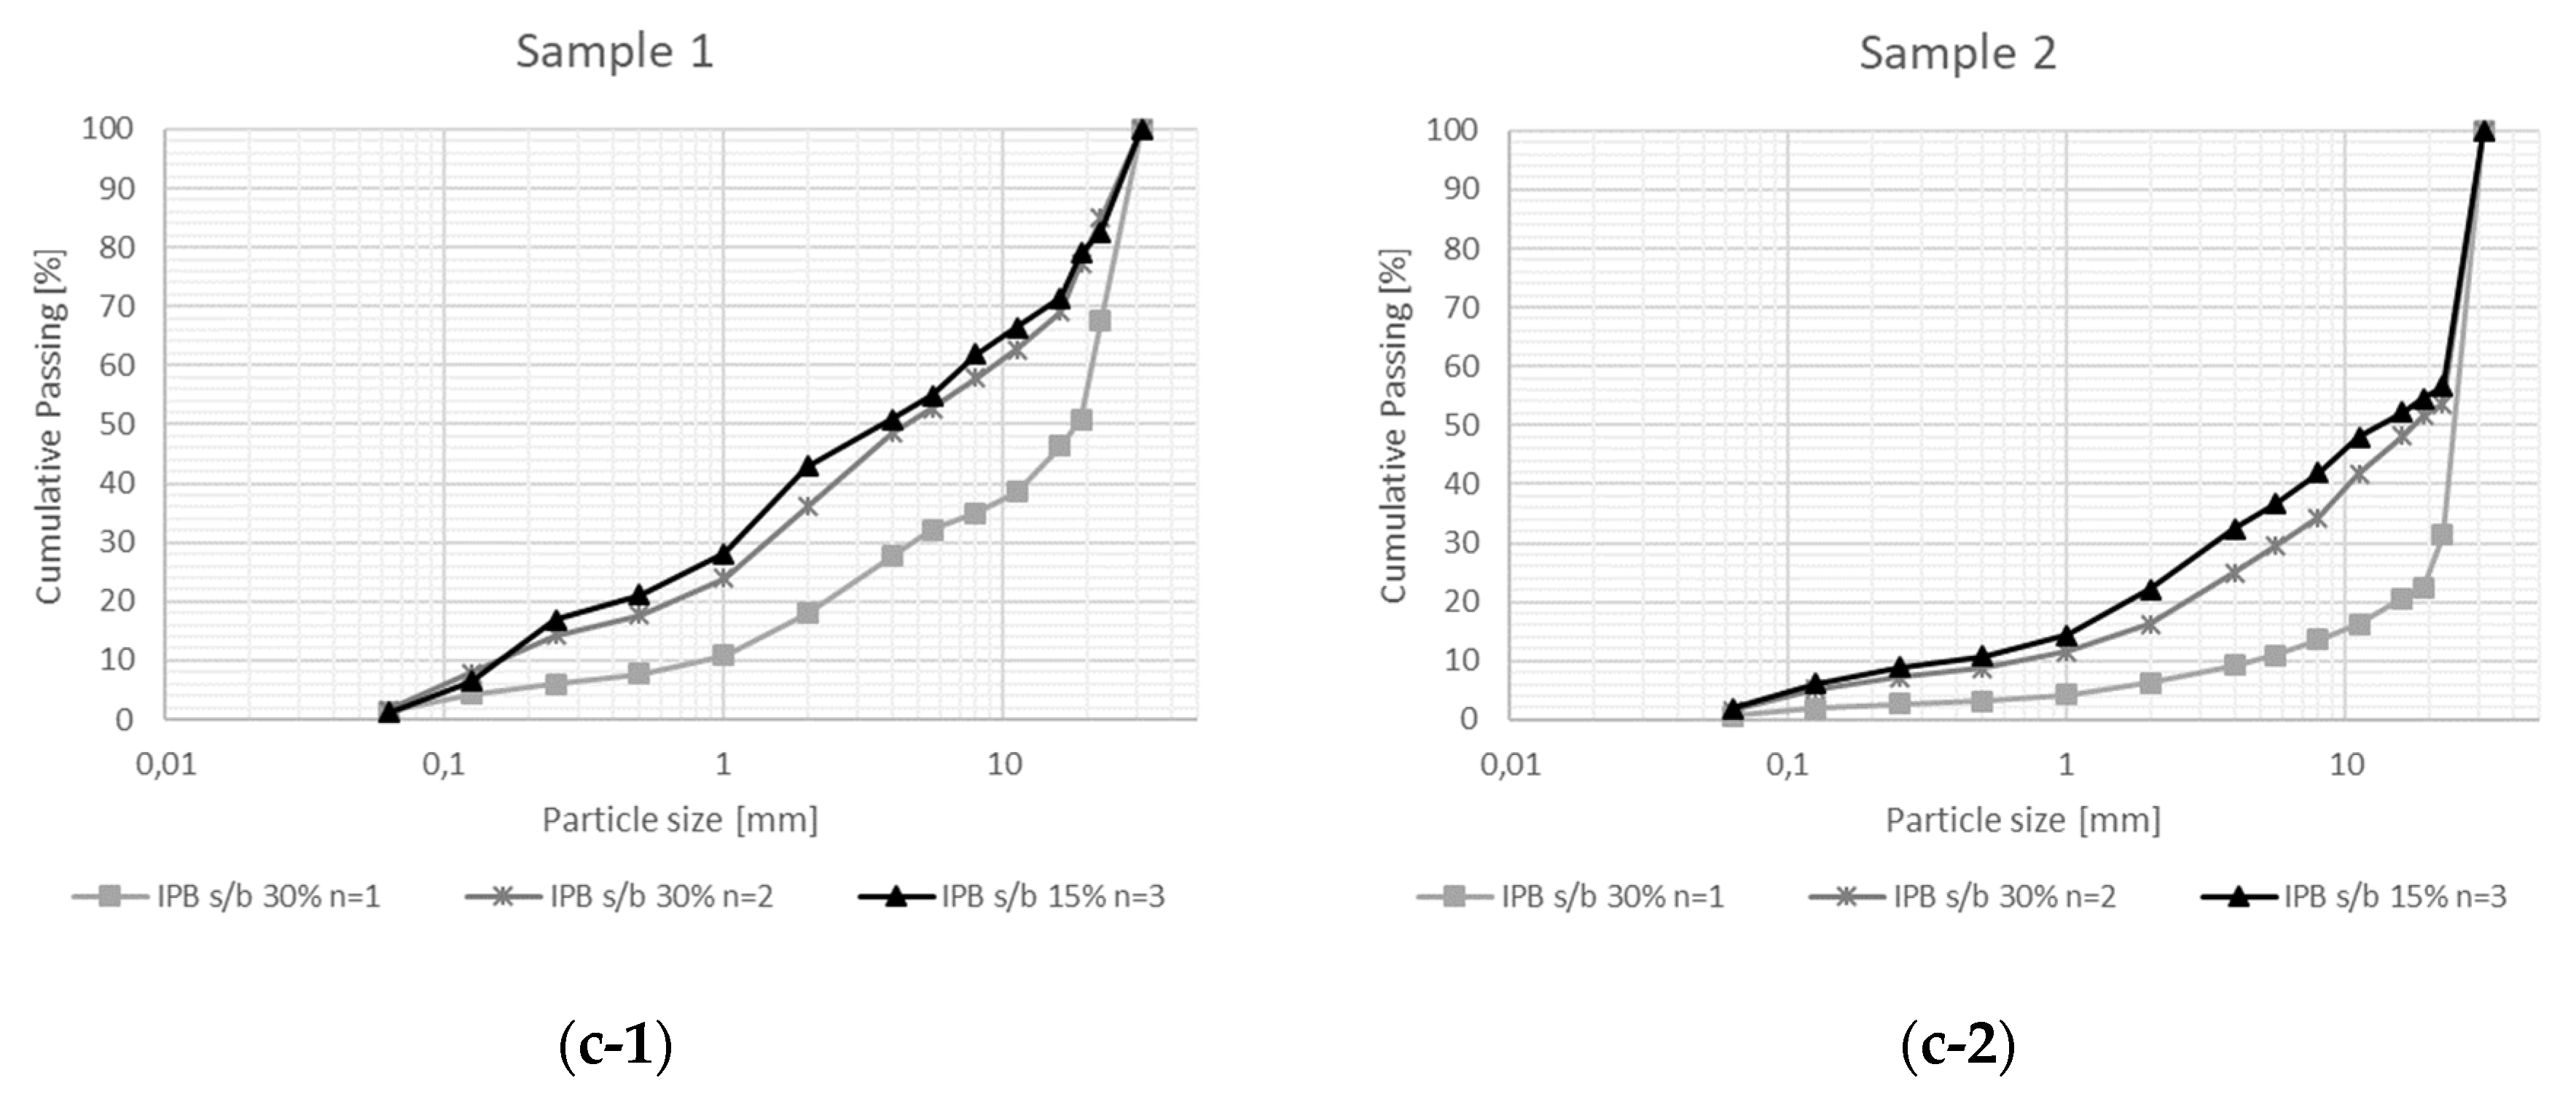
Results from particle size distributions obtained after interparticle breakage are shown in
Figure 4 for both samples. The plots correspond to the cumulative size distribution of the particles for three compression ratios: 10%, 20% and 30%. Each plot shows the particle size distribution of the sequences of compressions or cycles. The black line represents the final reduction step or compression test. Sample 2 showed the same behavior as Sample 1 in terms of the size distribution of the particles.
As expected, the particle size distribution is dependent on the compression ratio and the number of cycles. A higher compression ratio generates more reduction in the particles, resulting in more particles in the fine fraction. Likewise, a large number of cycles produces a greater reduction in size. This behavior is observed in
Figure 4, by comparing each sequence of compression with the previous one.
The particle size distributions obtained after cycles of compression by 20% or 30% are similar (
Figure 4b,c). In the case of 10% compression, the material is more coarse, and only 24 wt.% of processed material is smaller than 4 mm.
4.4. Elemental Analysis of the Ore—Grade by Size
Major, minor and trace element analyses were performed on the sieved products generated in the crushing sequence in the compression breakage test for 10%, 20% and 30% of the compression ratio in the final reduction step (black lines in
Figure 4). The bulk chemical data offers information on how the element distribution is related to particle size and compression ratio. The representative composition of the ore in the different class size fractions is presented in
Table 2 for a compression ratio of 30% and for selected number of elements. Niobium, tin and tantalum content in different size fractions after compression breakage at the three values of compression ratios for both samples are presented in
Table 3. More elements were analyzed, which include, Cr
2O
3, TiO, MnO, P
2O
5, SrO, BaO, Ba, Ce, Cr, Cs, Dy, Er, Eu, Ga, Gd, Hf, Ho, La, Lu, Nb, Nd, Pr, Rb, Sm, Sn, Sr, Ta, Tb, Th, Tm, U, V, W, Y, Yb, and Zr, and the totals of the analyses varied between 99.70% and 101.63%.
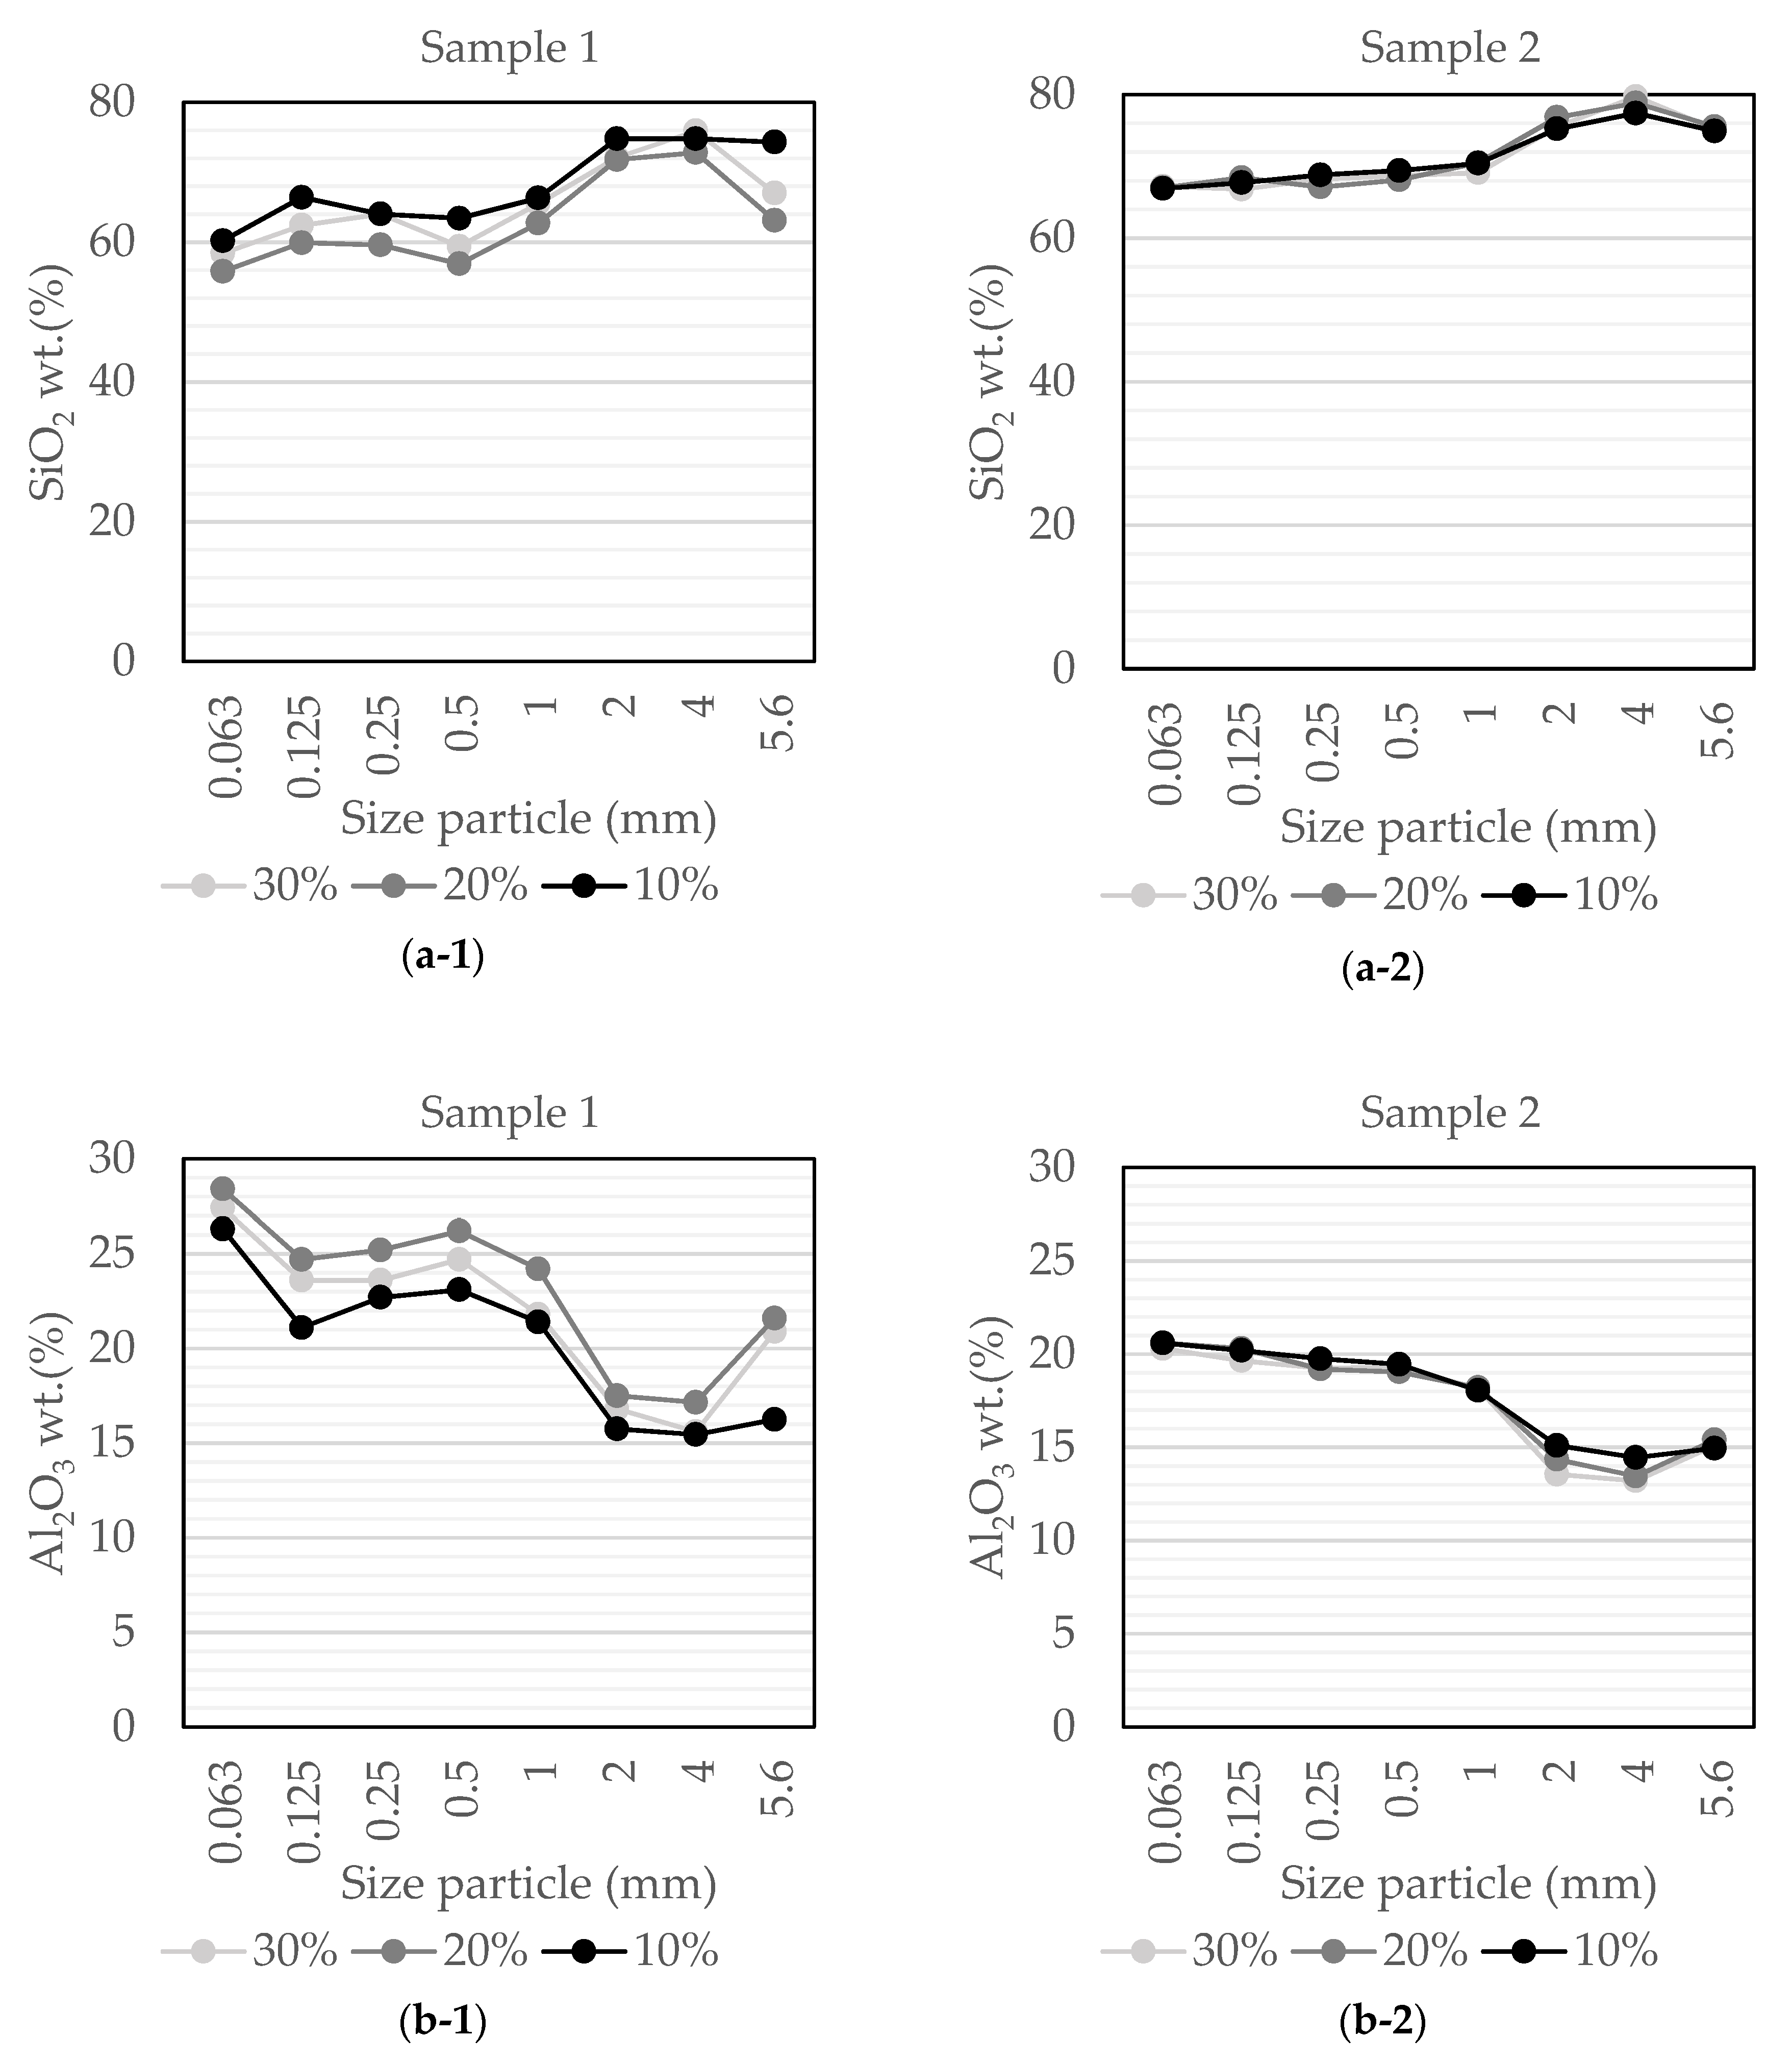
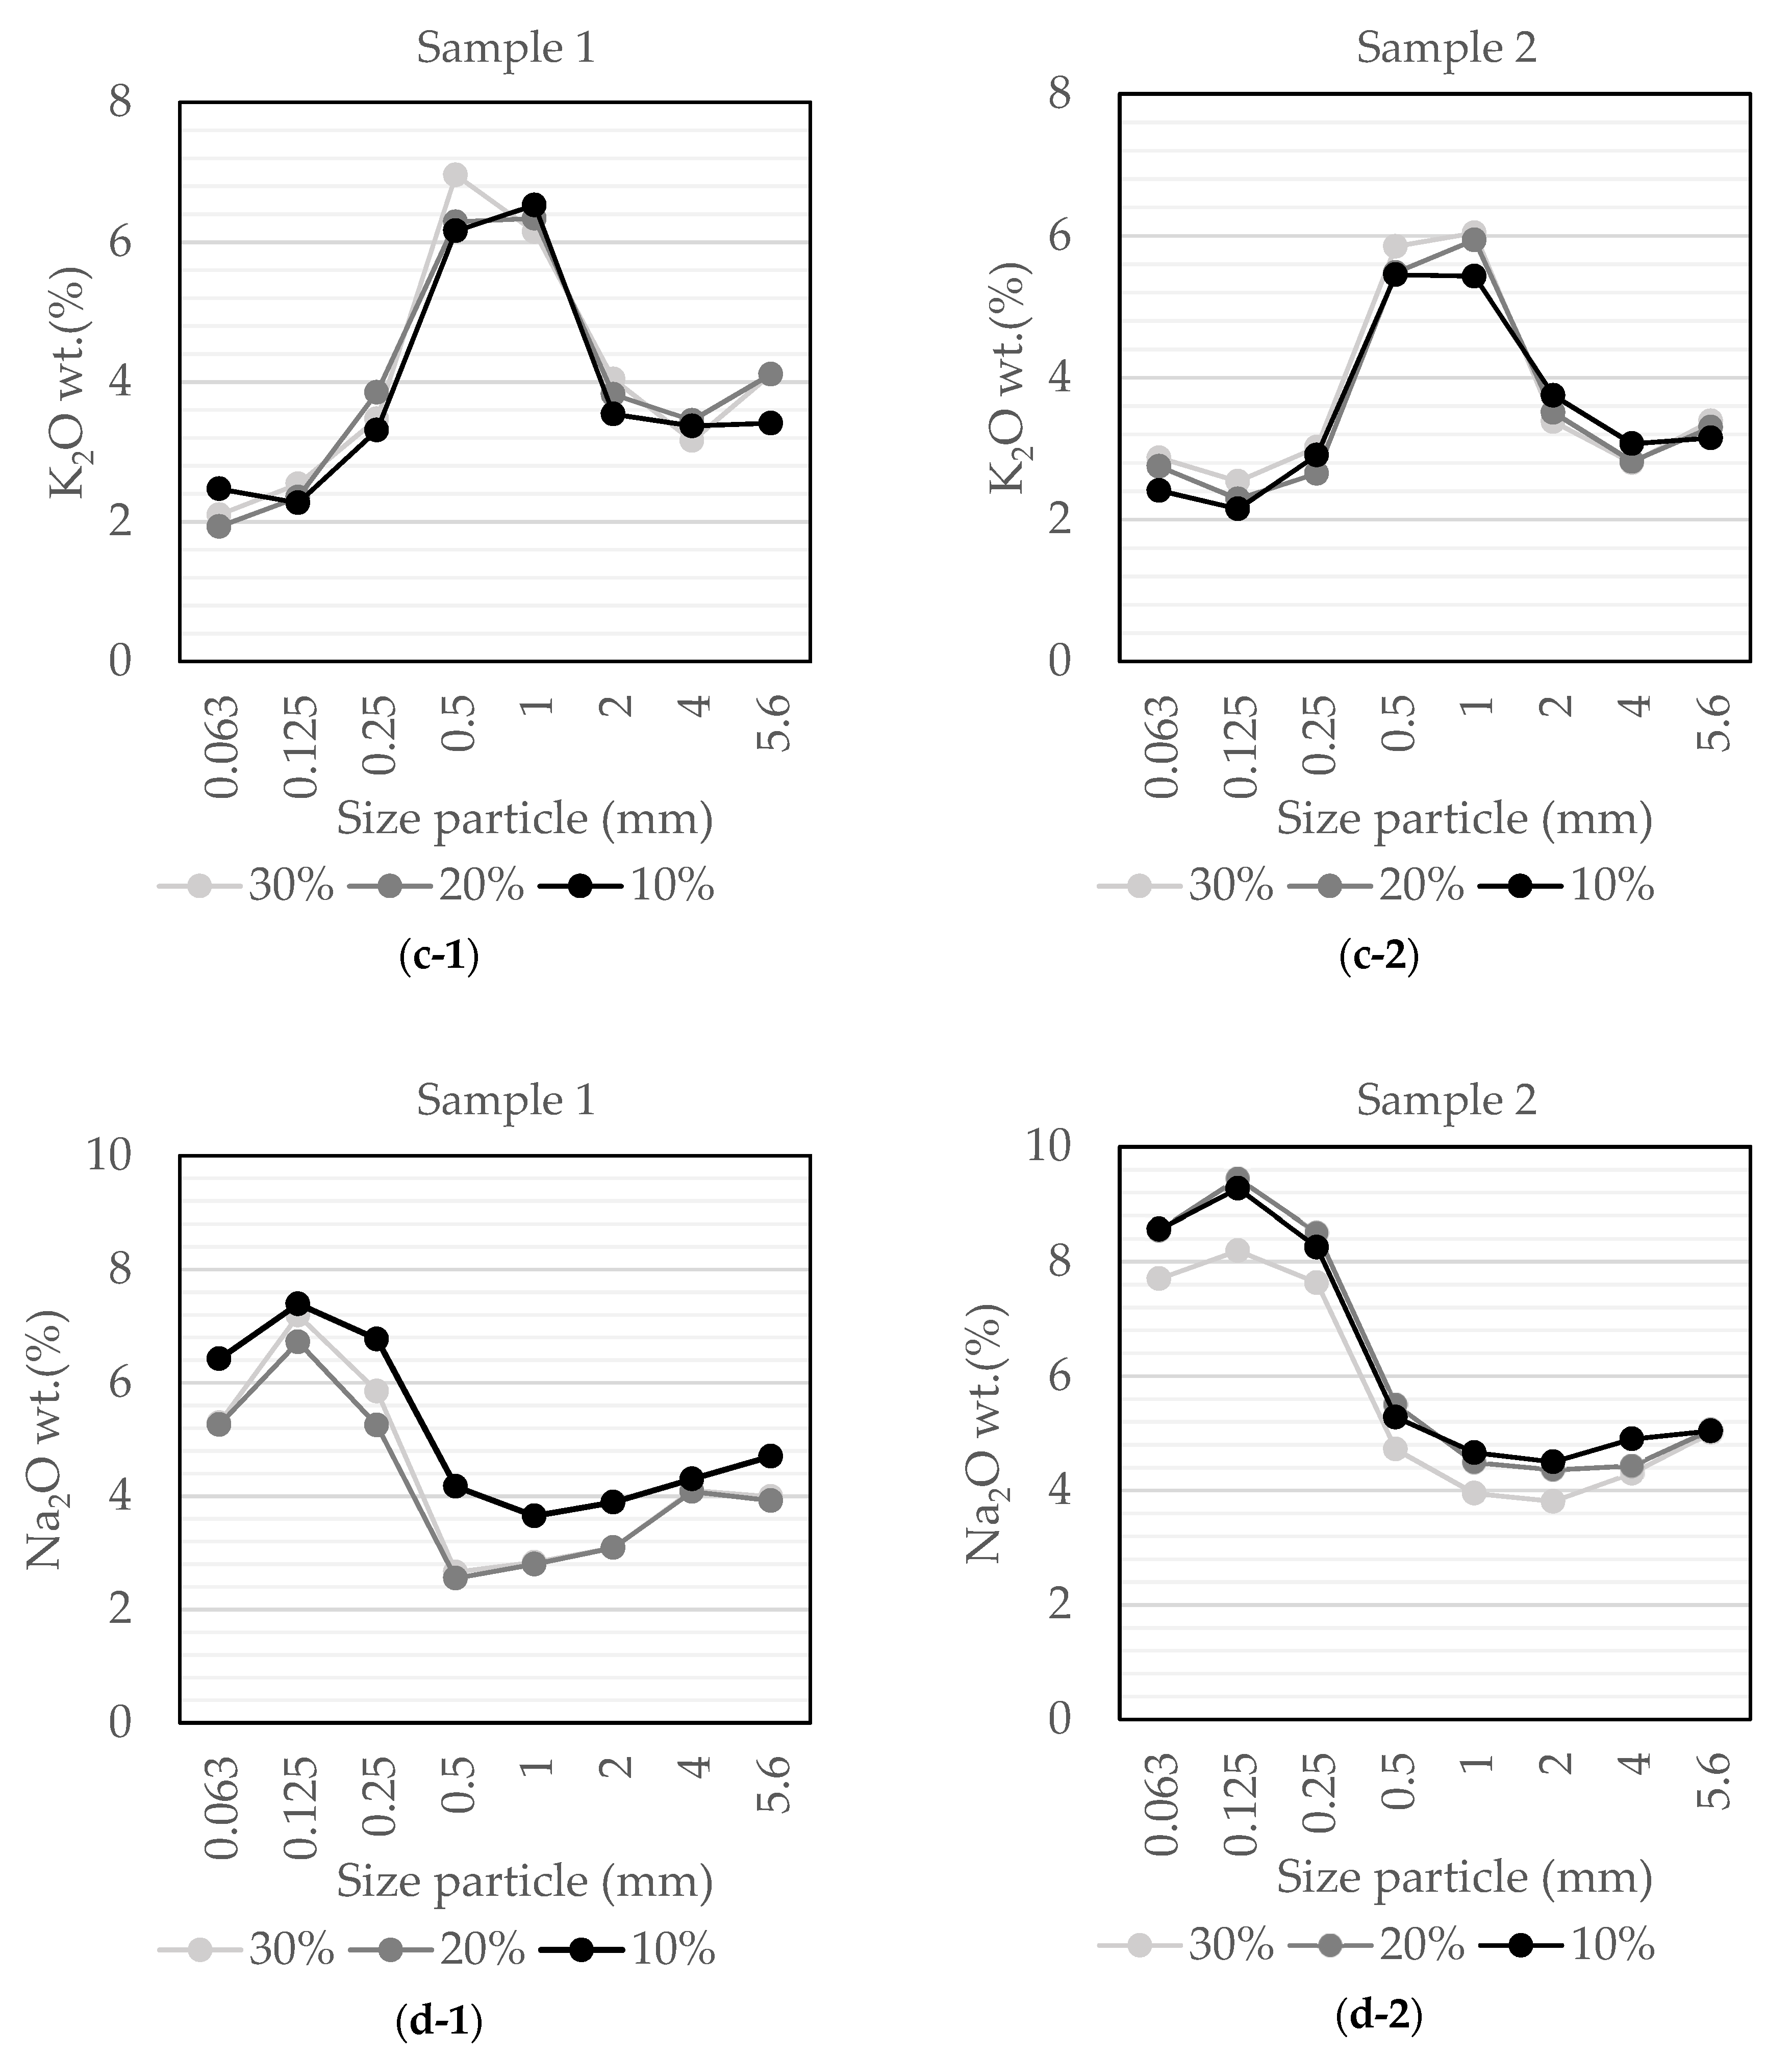
Figure 5 represents the variation of major elements in size fractions for the three different compression ratios for both sample 1 and sample 2.
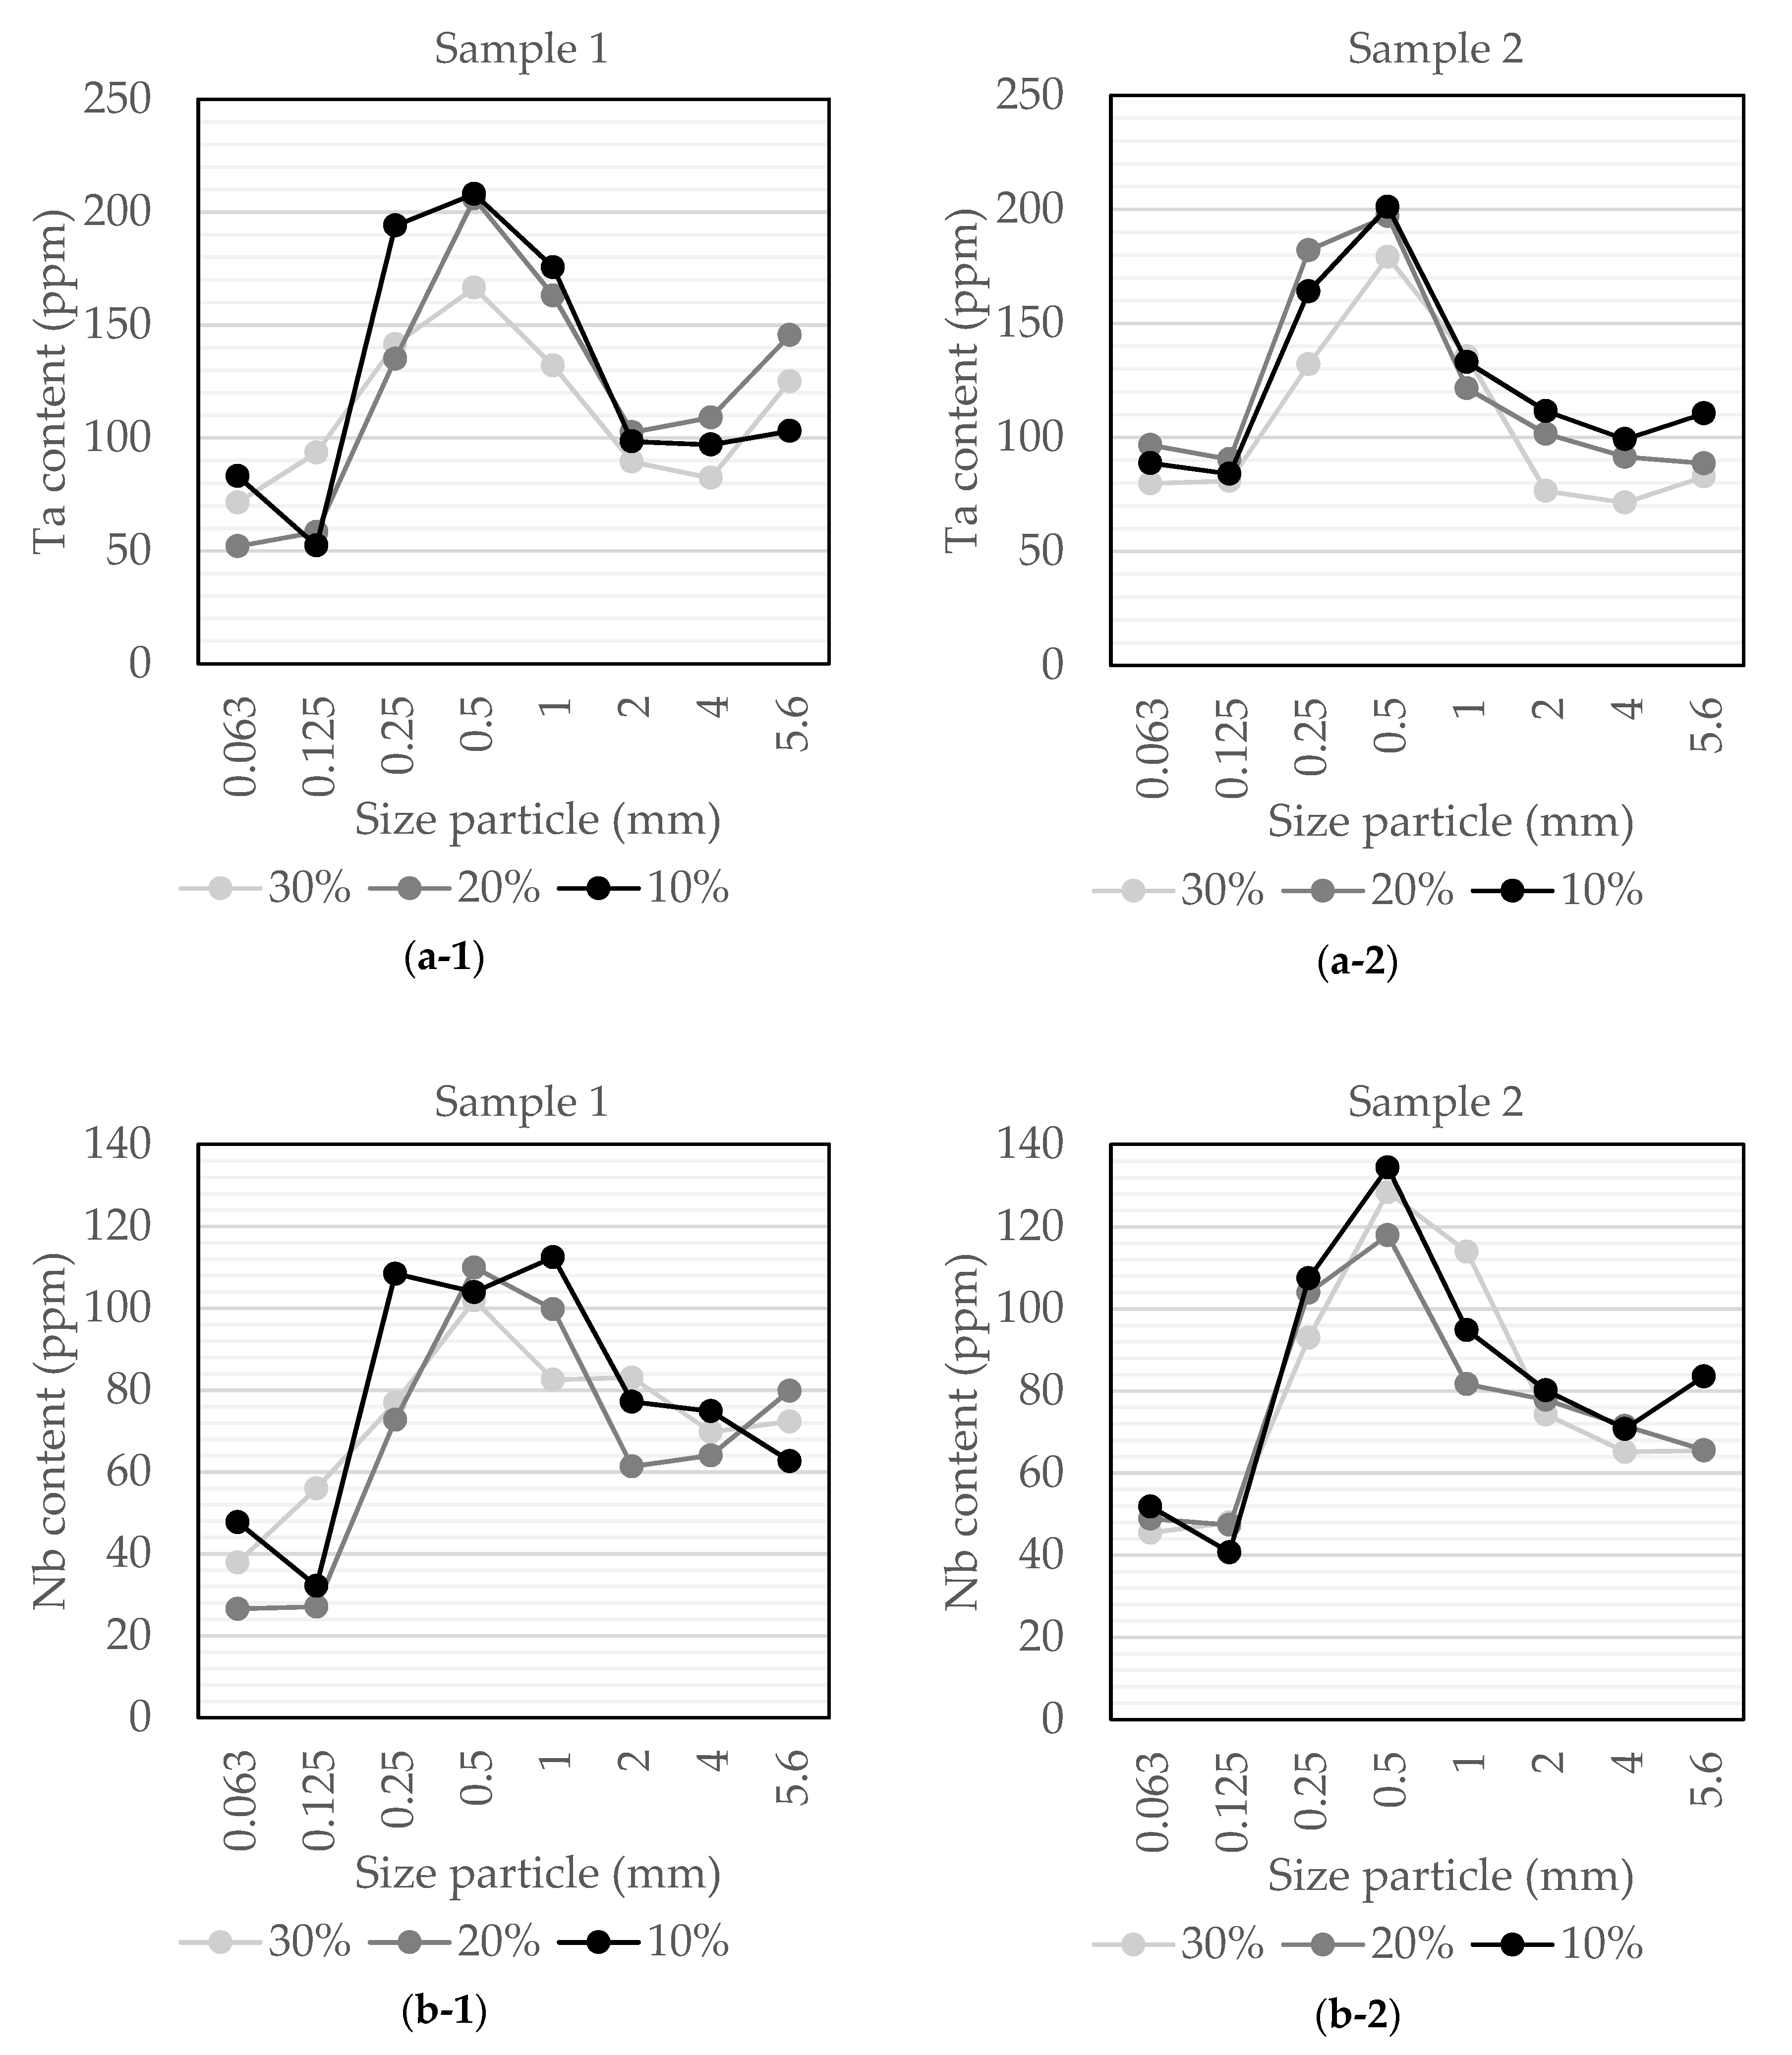
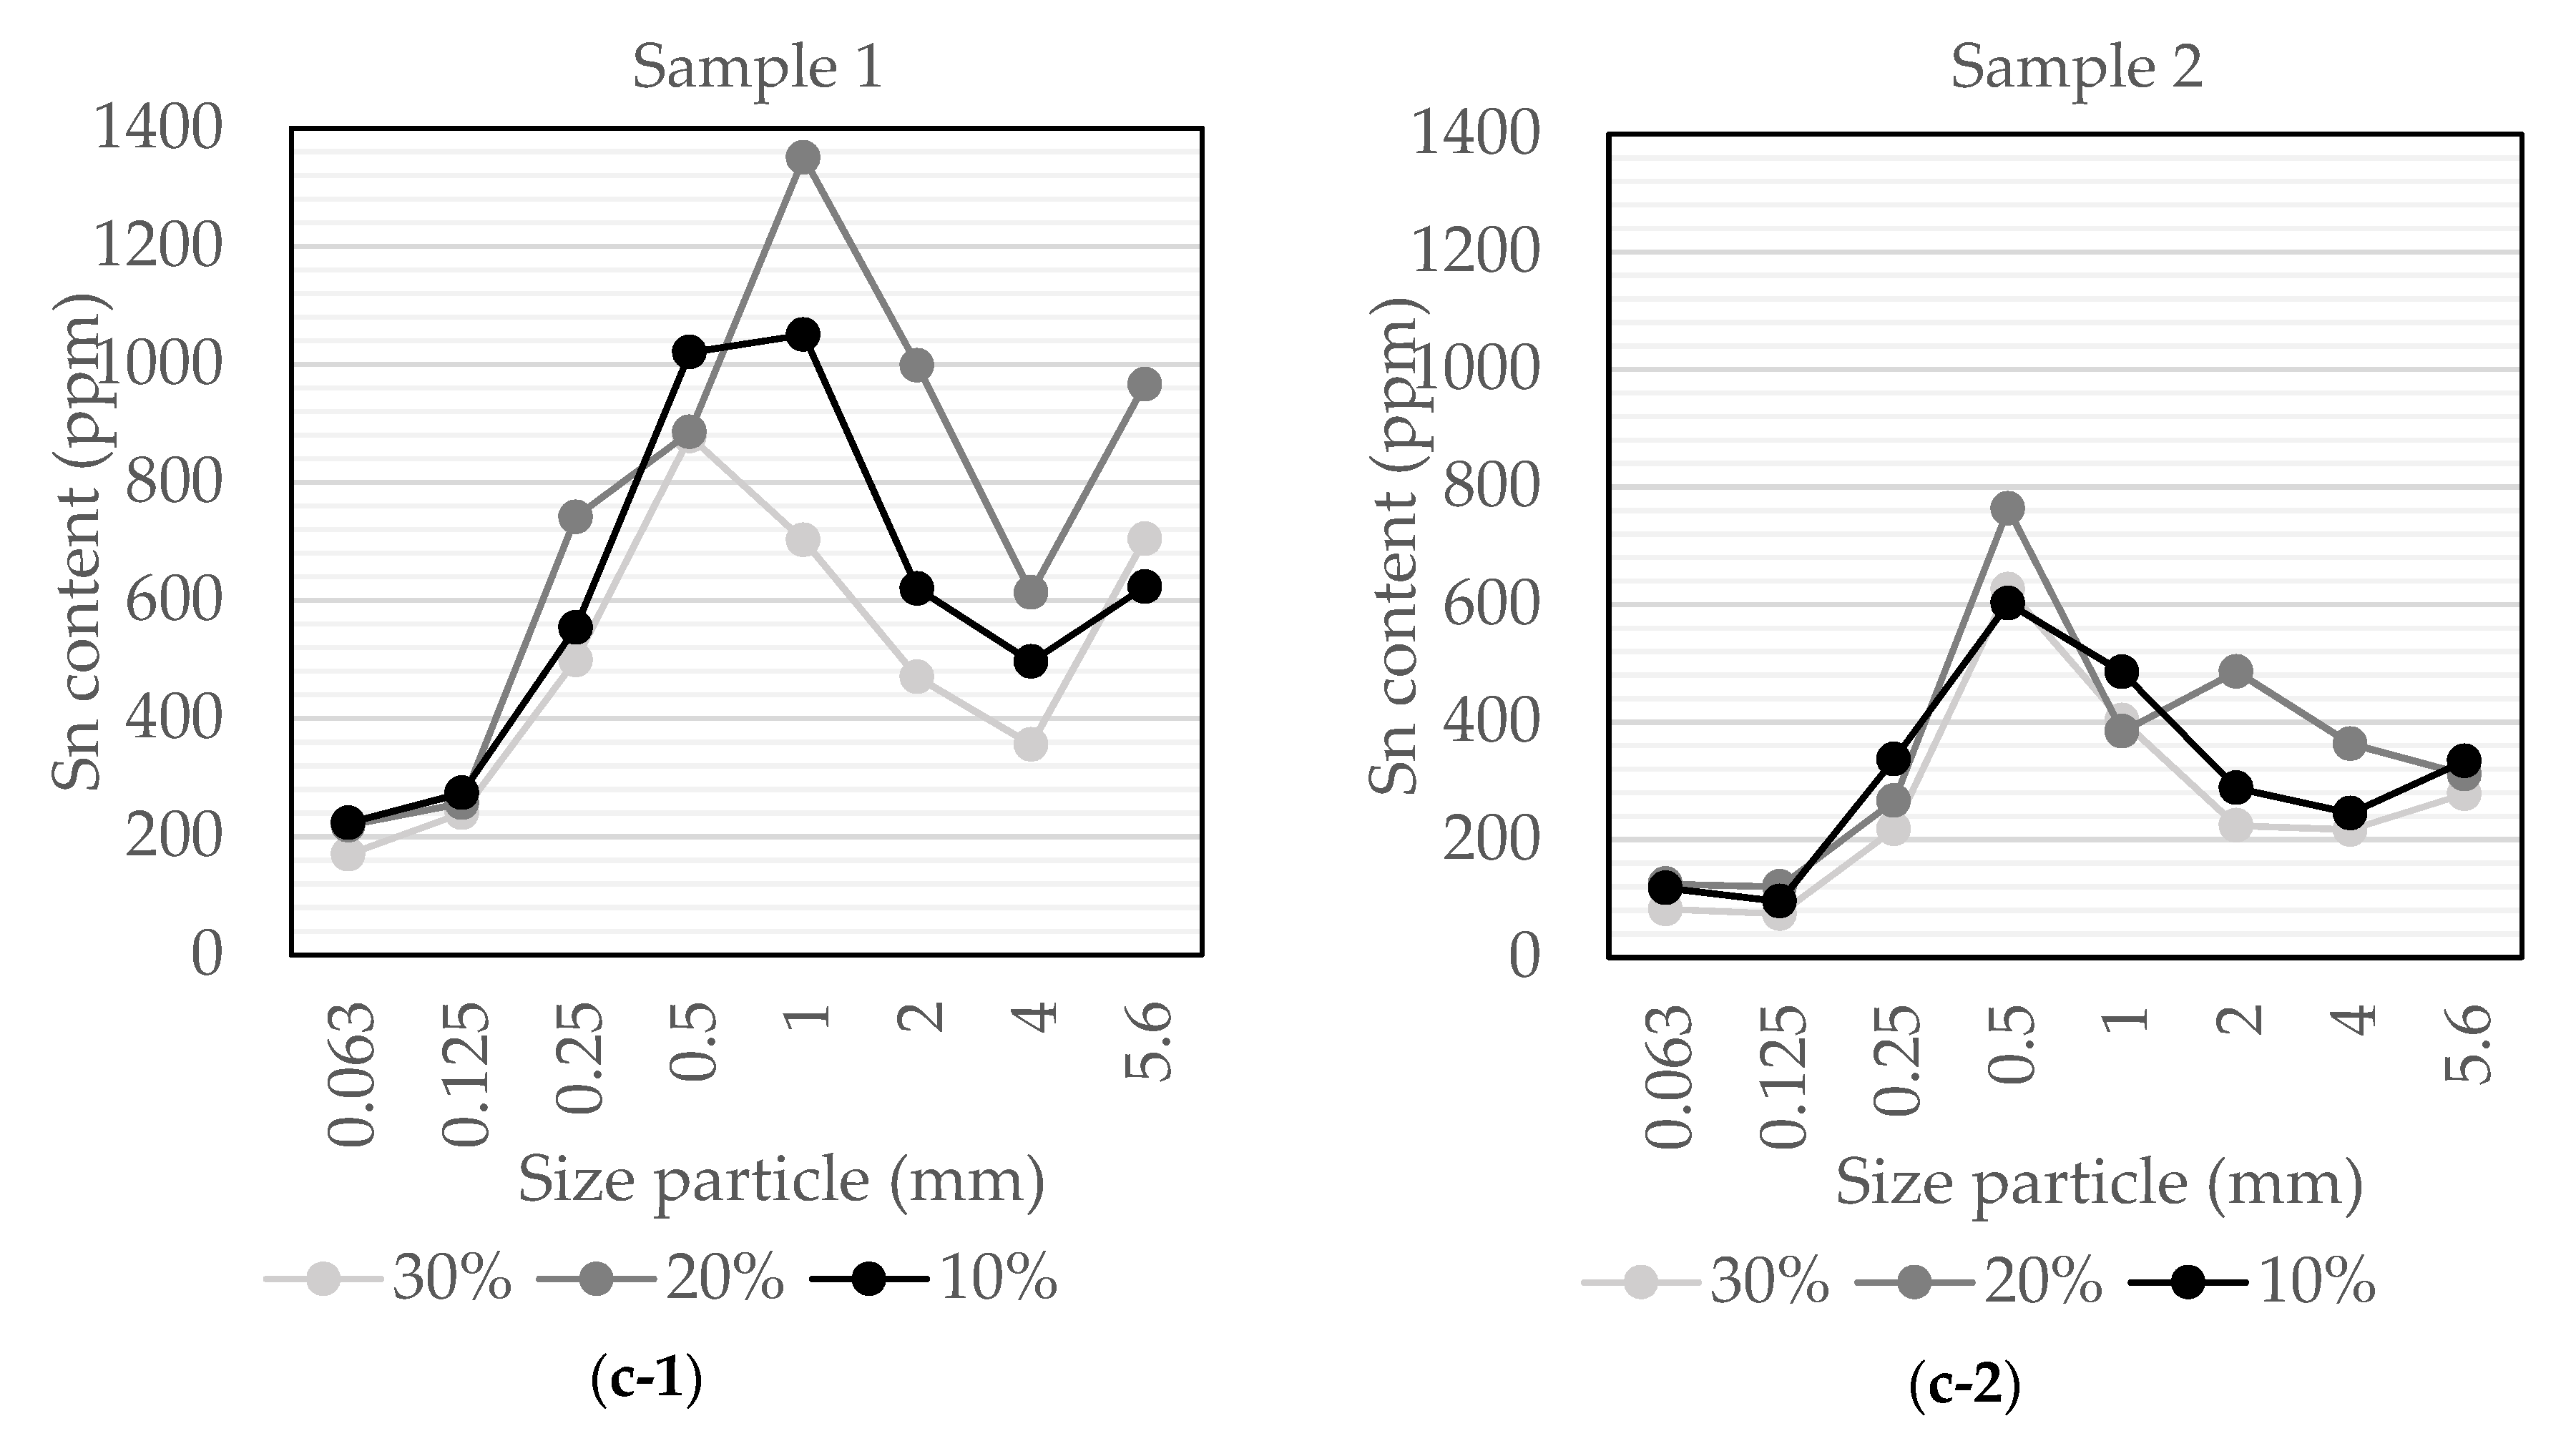
Figure 6 represents the variation of trace elements in size fractions for the three different compression ratios for both sample 1 and sample 2.
There are no clear differences in the grade-by-size distribution for the three different compression ratios. Minor variations in chemistry between different compression ratios are more easily explained by small heterogeneities in the chemical composition of the starting material. This indicates very similar mineral breakage behavior in the size reduction range of 20% to 50% of the material less than 4 mm for the Penouta deposit. The composition of the 4–5.6 mm fraction is similar to the starting composition of major elements in both samples (
Table 2), suggesting that crushing induced fractionation starts at grain-sizes from 4 mm and smaller. The two different samples show very similar major element distribution, despite minor differences in the concentration of the starting composition (
Table 2). In both samples, the SiO
2 increases and Al
2O
3 decreases in the 1–2 and 2–4 mm fractions relative to the 4–5.6 mm fraction. SiO
2 is lower and Al
2O
3 is higher in the smaller fractions (0.063 to 1 mm) relative to 4–5.6mm. There is also a weak trend of decreasing SiO
2 and increasing trend of Al
2O
3 decreasing from 1 mm to 0.063 mm. K
2O concentrations increase dramatically in the fractions 0.5 and 1 mm, and drop significantly again in the smaller fractions to levels below that of the 4–5.6 mm fraction. Na
2O is significantly enriched in the finest fractions (<0.25 mm).
Tantalum and niobium, the critical metals of main interest in this deposit, show similar grade by size variations in both samples, with strong enrichment in the 0.25 to 1 mm size range (~40%), relative to the 4–5.6 mm fraction. These elements are strongly depleted in the fraction finer than 0.125 mm, and slightly lower in the 1–2 and 2–4 mm fractions relative to the 4–5.6 mm fraction. Tin shows a similar trend, although displays a more pronounced enrichment in 0.25–0.5 and 0.5–1 mm fractions than in 0.125–0.25 mm fraction. A suggested analysis and modeling of the element content as a function of the size fraction is presented by Leon et al. [
34]. The calculated head grades correspond well with the whole rock composition of the starting materials. Tin shows a difference in sample 1 between the calculated and measured head grade, which could result from more heterogeneous distribution of cassiterite crystal, compared to tantalum and niobium minerals. However, general similarity in composition of the valuable elements between the two different samples and the three different compression tests show that the sampling strategy and amount of material were appropriate for the Penuota mineralization.
4.5. Mineralogical Analysis
Results of the XRD in the different size fractions are presented in
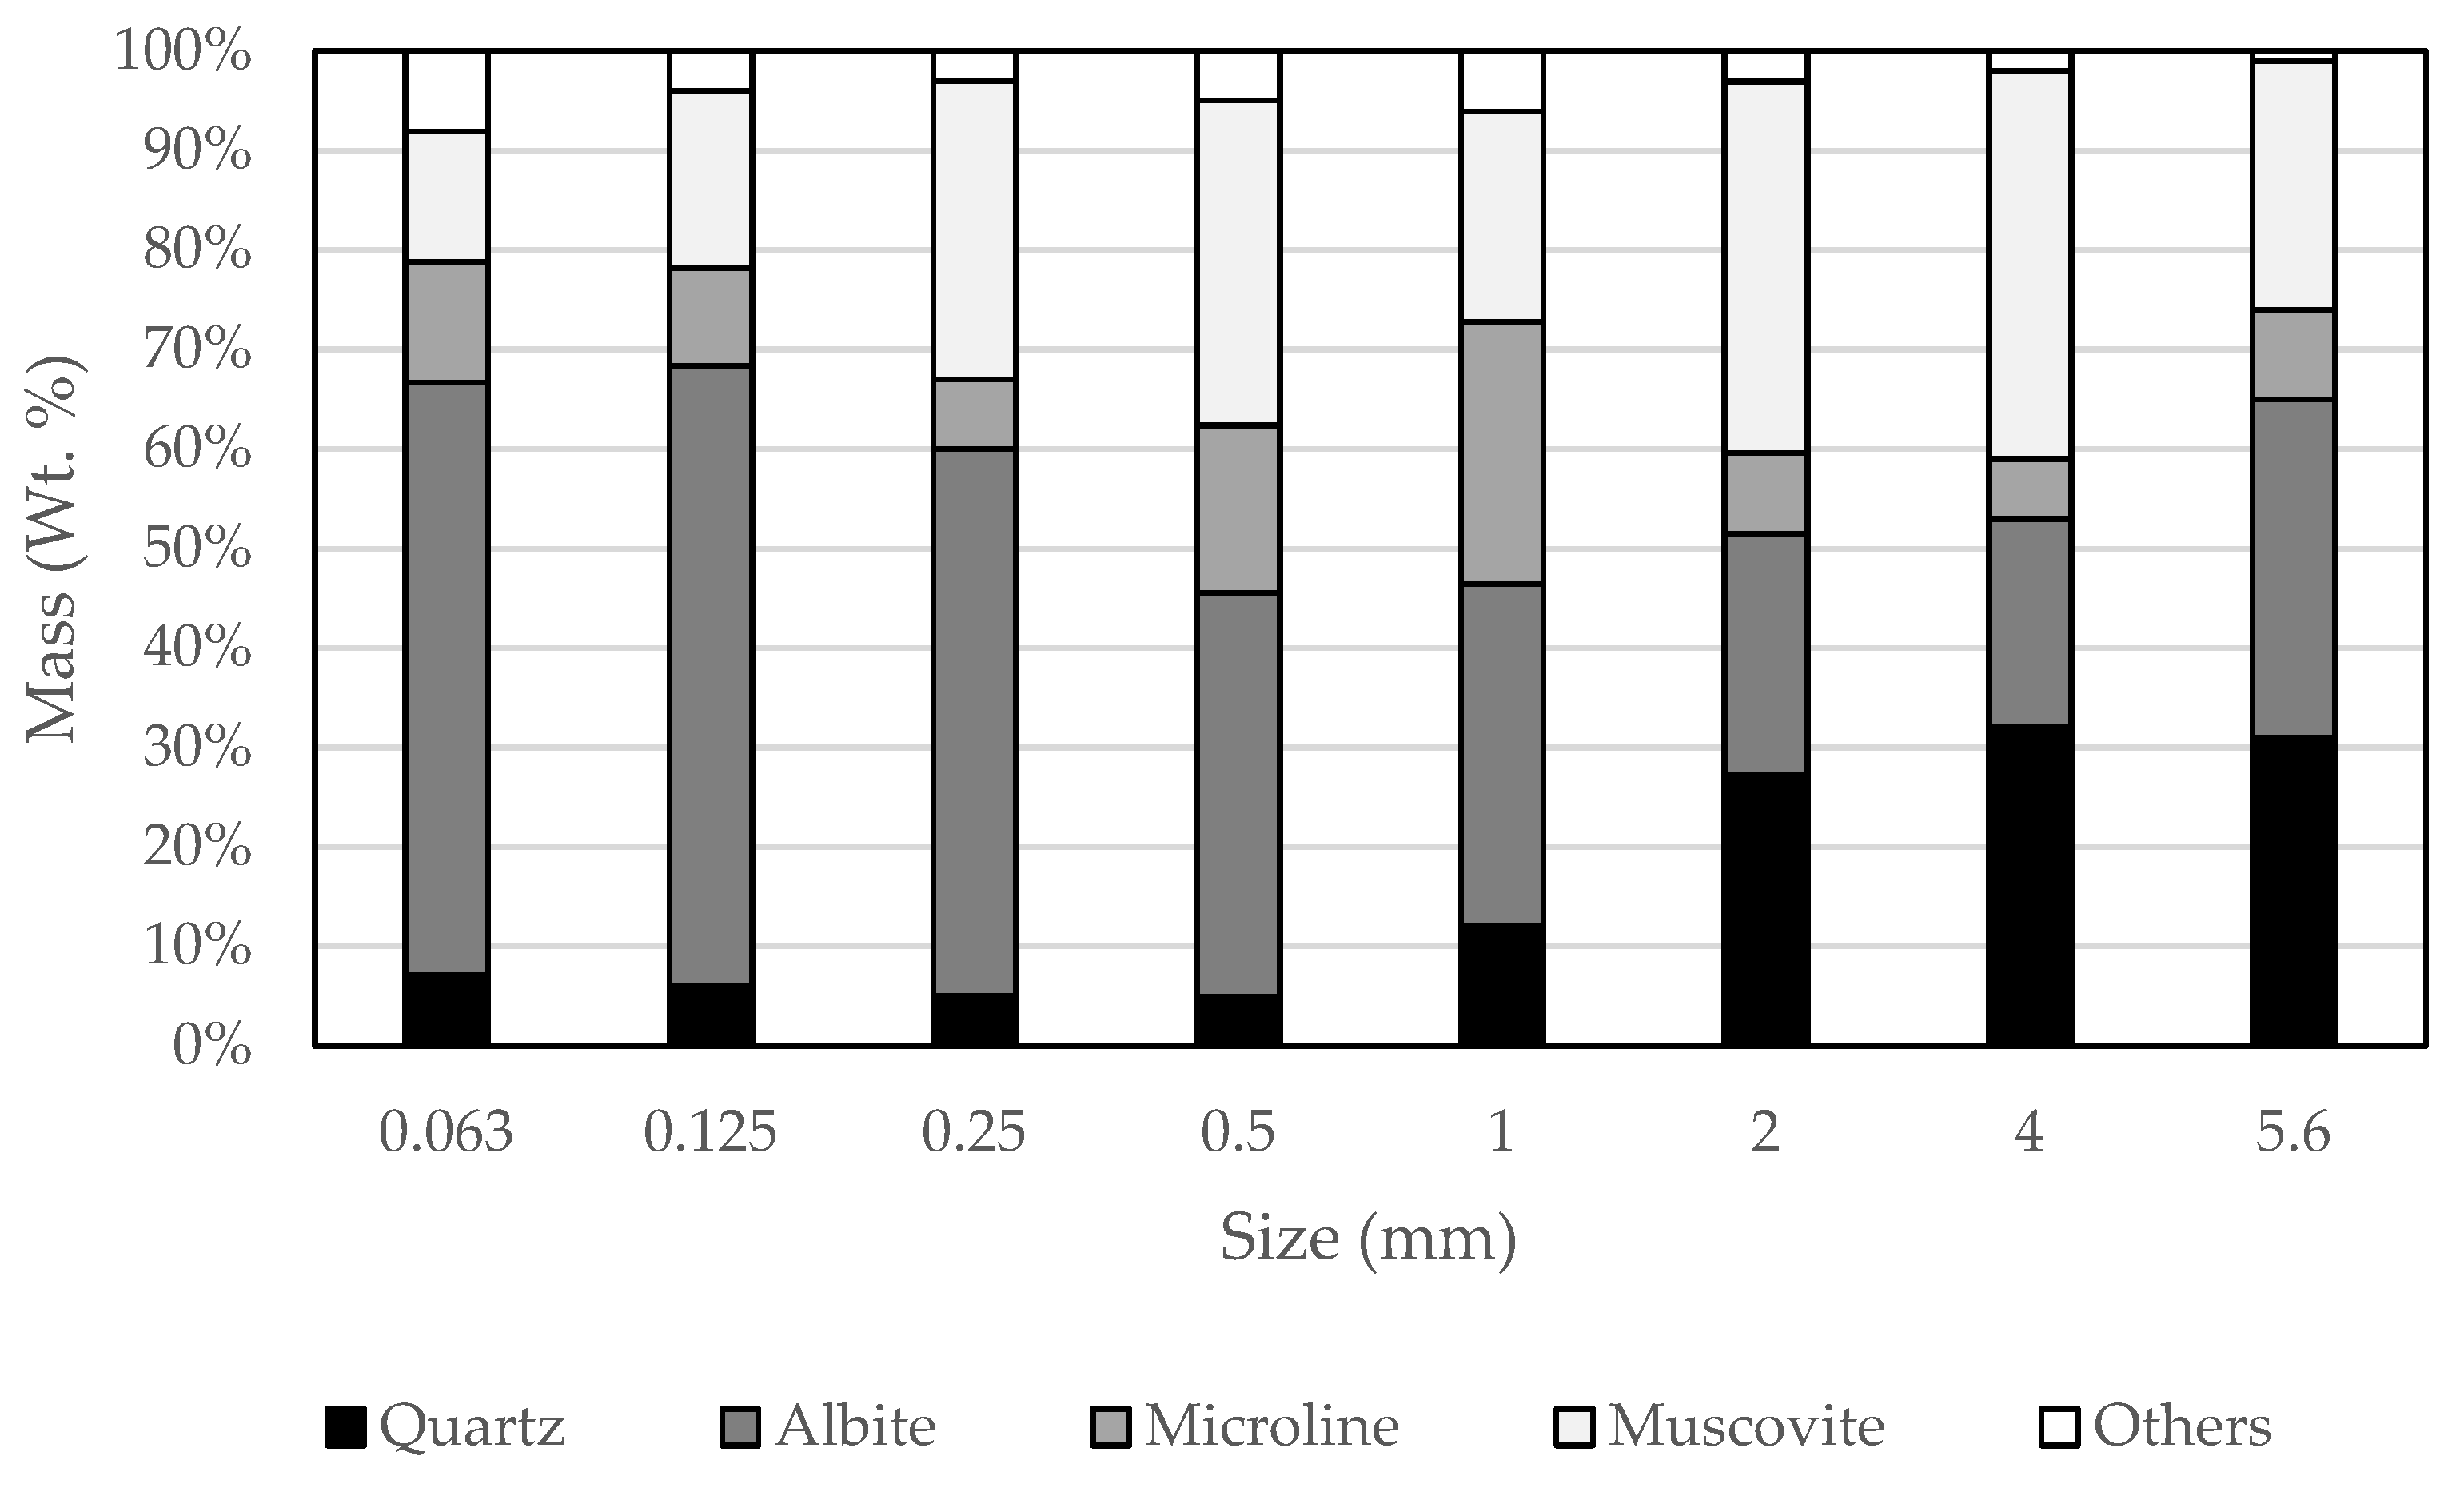
Figure 7, which shows the quartz, albite, microcline and muscovite content for sample 1.
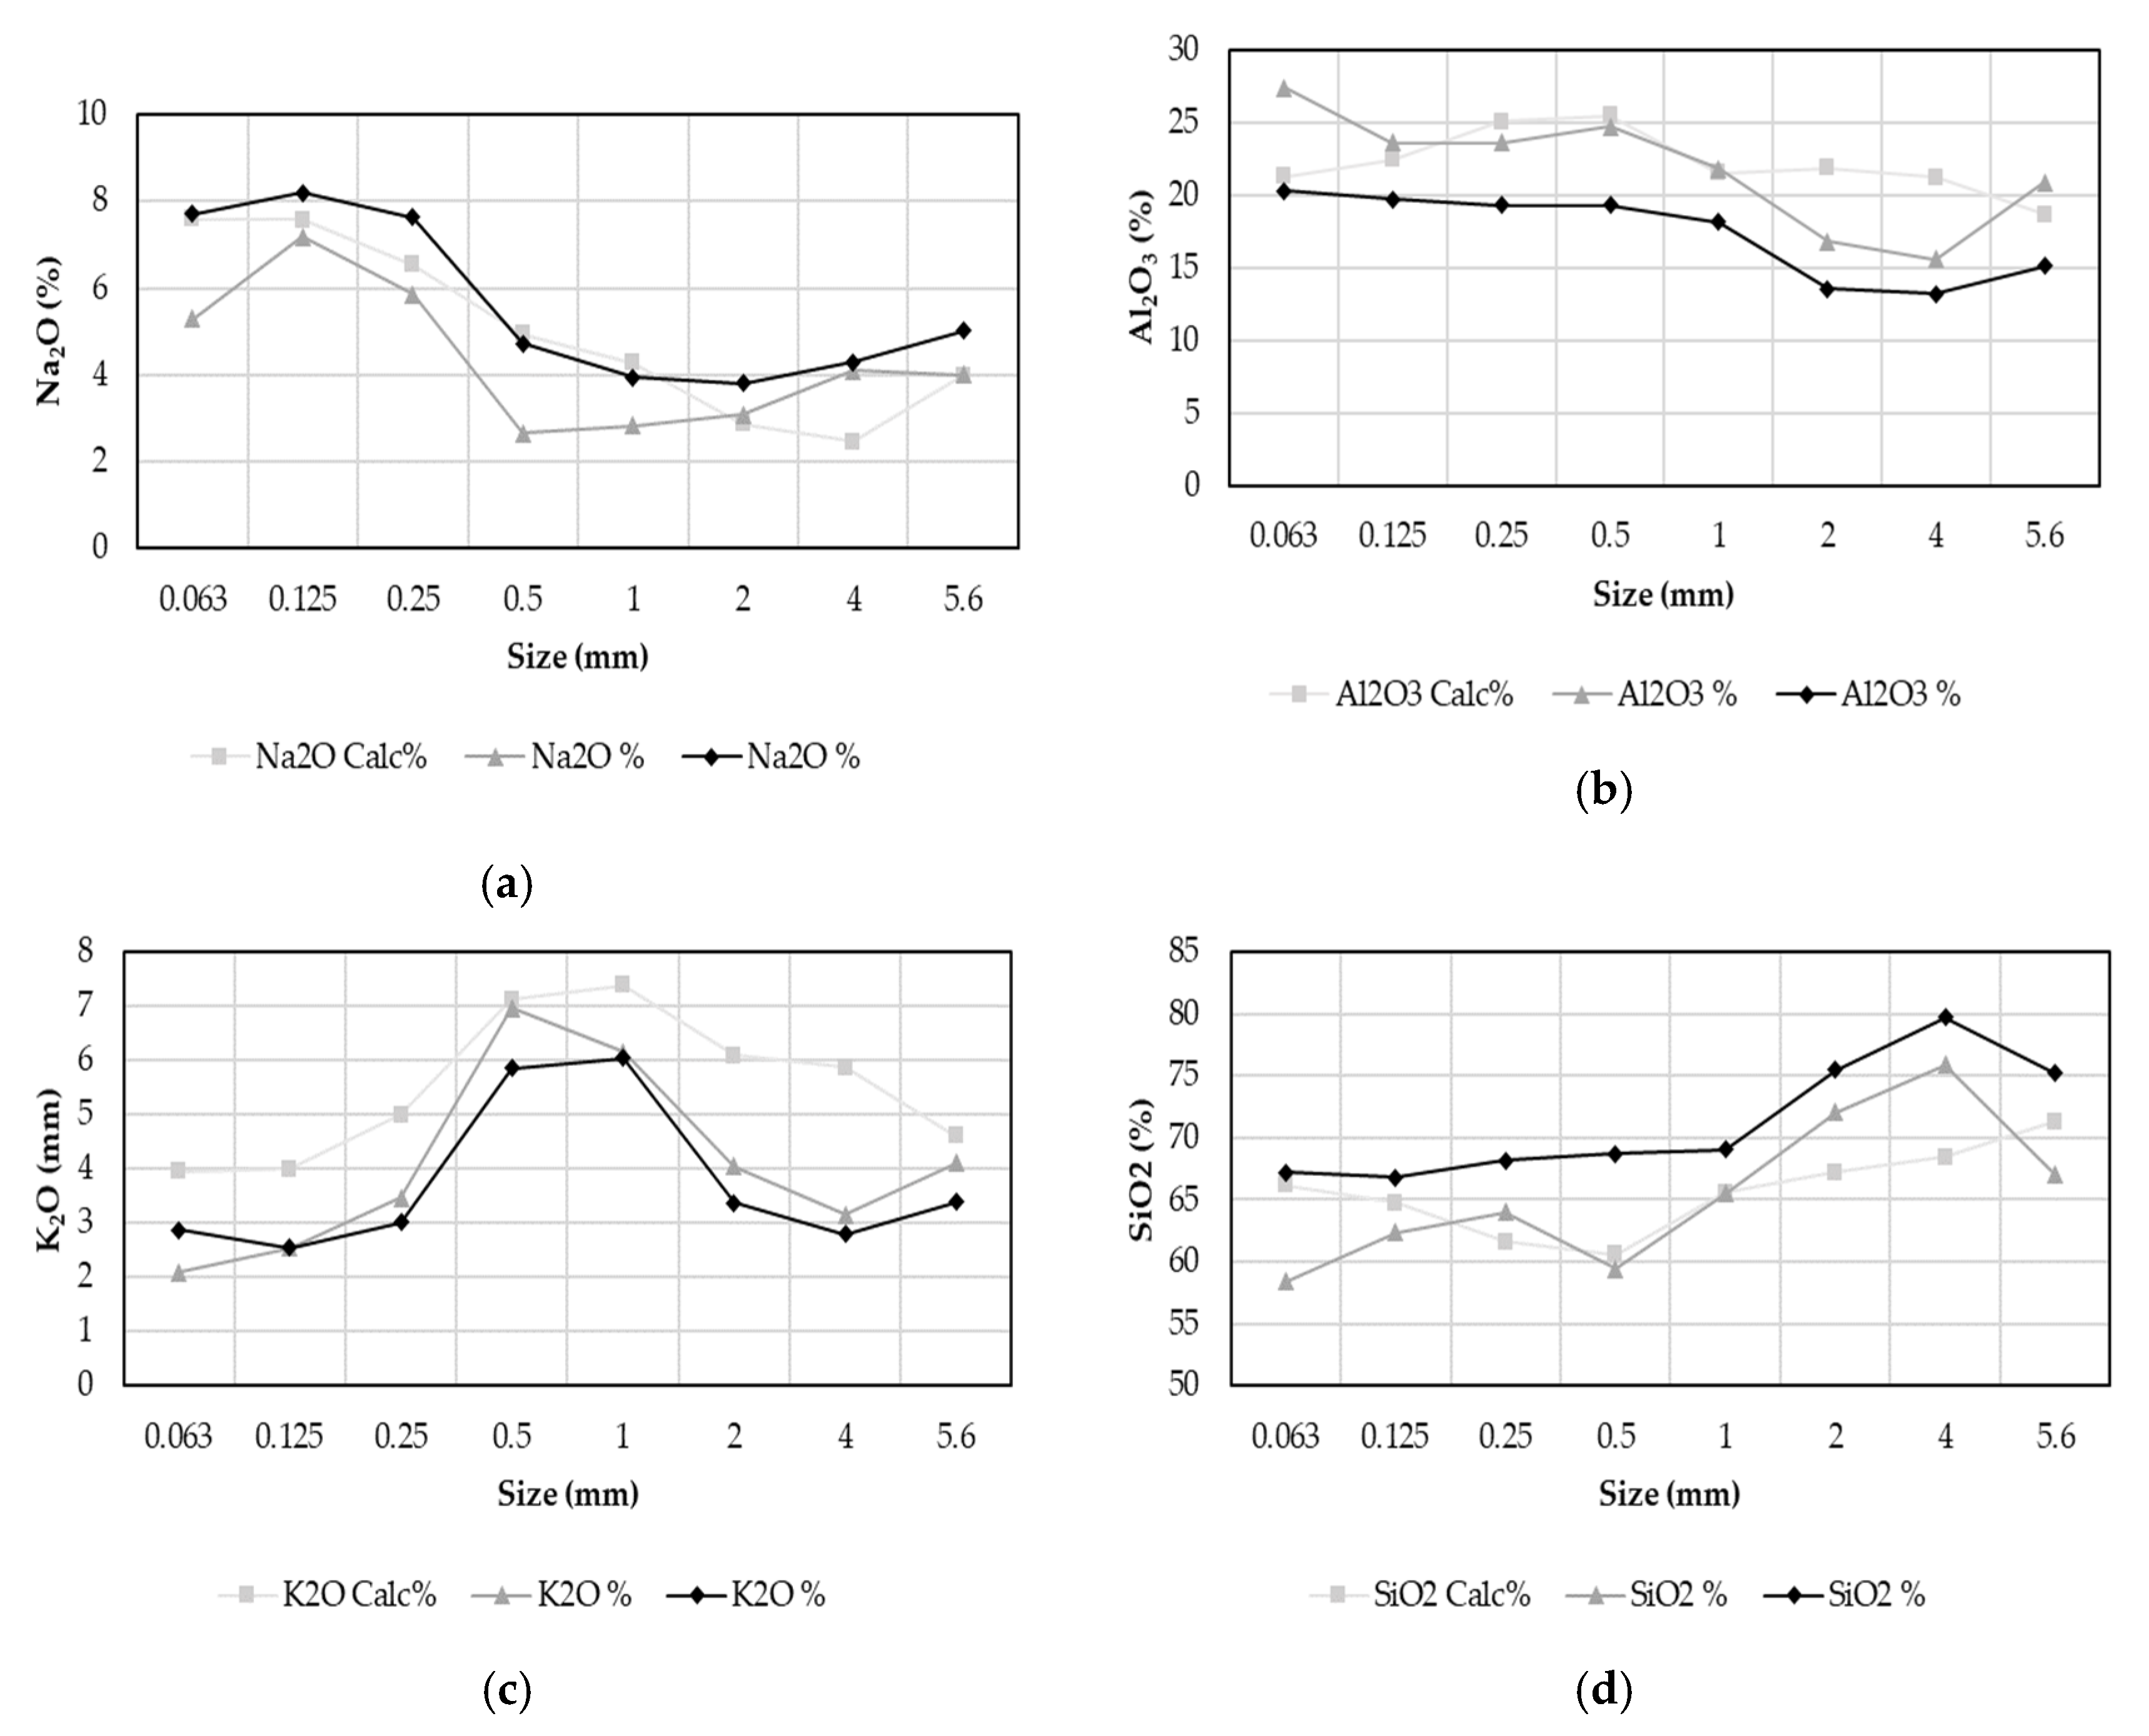
The mineral modal proportions from XRD are broadly consistent with the grade by size distribution of major elements. This can be shown by recalculating mineral proportions from XRD to major element composition using the mineral chemical formulas of the main minerals, and to compare these these calculated compositions with the geochemical analysis (
Figure 8).The results show that quarts is enriched in the 4 mm fraction and strongly depleted in fraction <0.5 mm (
Figure 7), in agreement with SiO
2 content of corresponding fraction. Albite is enriched in <0.25 mm fraction, which explains the increase in Na
2O observed in the finer grain sizes.
Microcline is enriched in the fraction between 0.125 and 0.5 mm, which likely explain the strong enrichment of K2O in the 1 and 0.5 mm fractions. Muscovite is depleted in the <0.125 mm fractions which explain the K2O depletion in the finest fractions.
SEM-EDS was used for mineralogical and textural characterization of the different size fractions. No pre-concentration of valuable minerals was performed, because the breakage mechanism responsible for grade and by size distribution was of primary interest. Valuable minerals typically occur in the matrix (
Figure 8), or more rarely in the grain boundaries of megacrysts, and are heterogeneously distributed in agreement with previous studies [
25,
28].
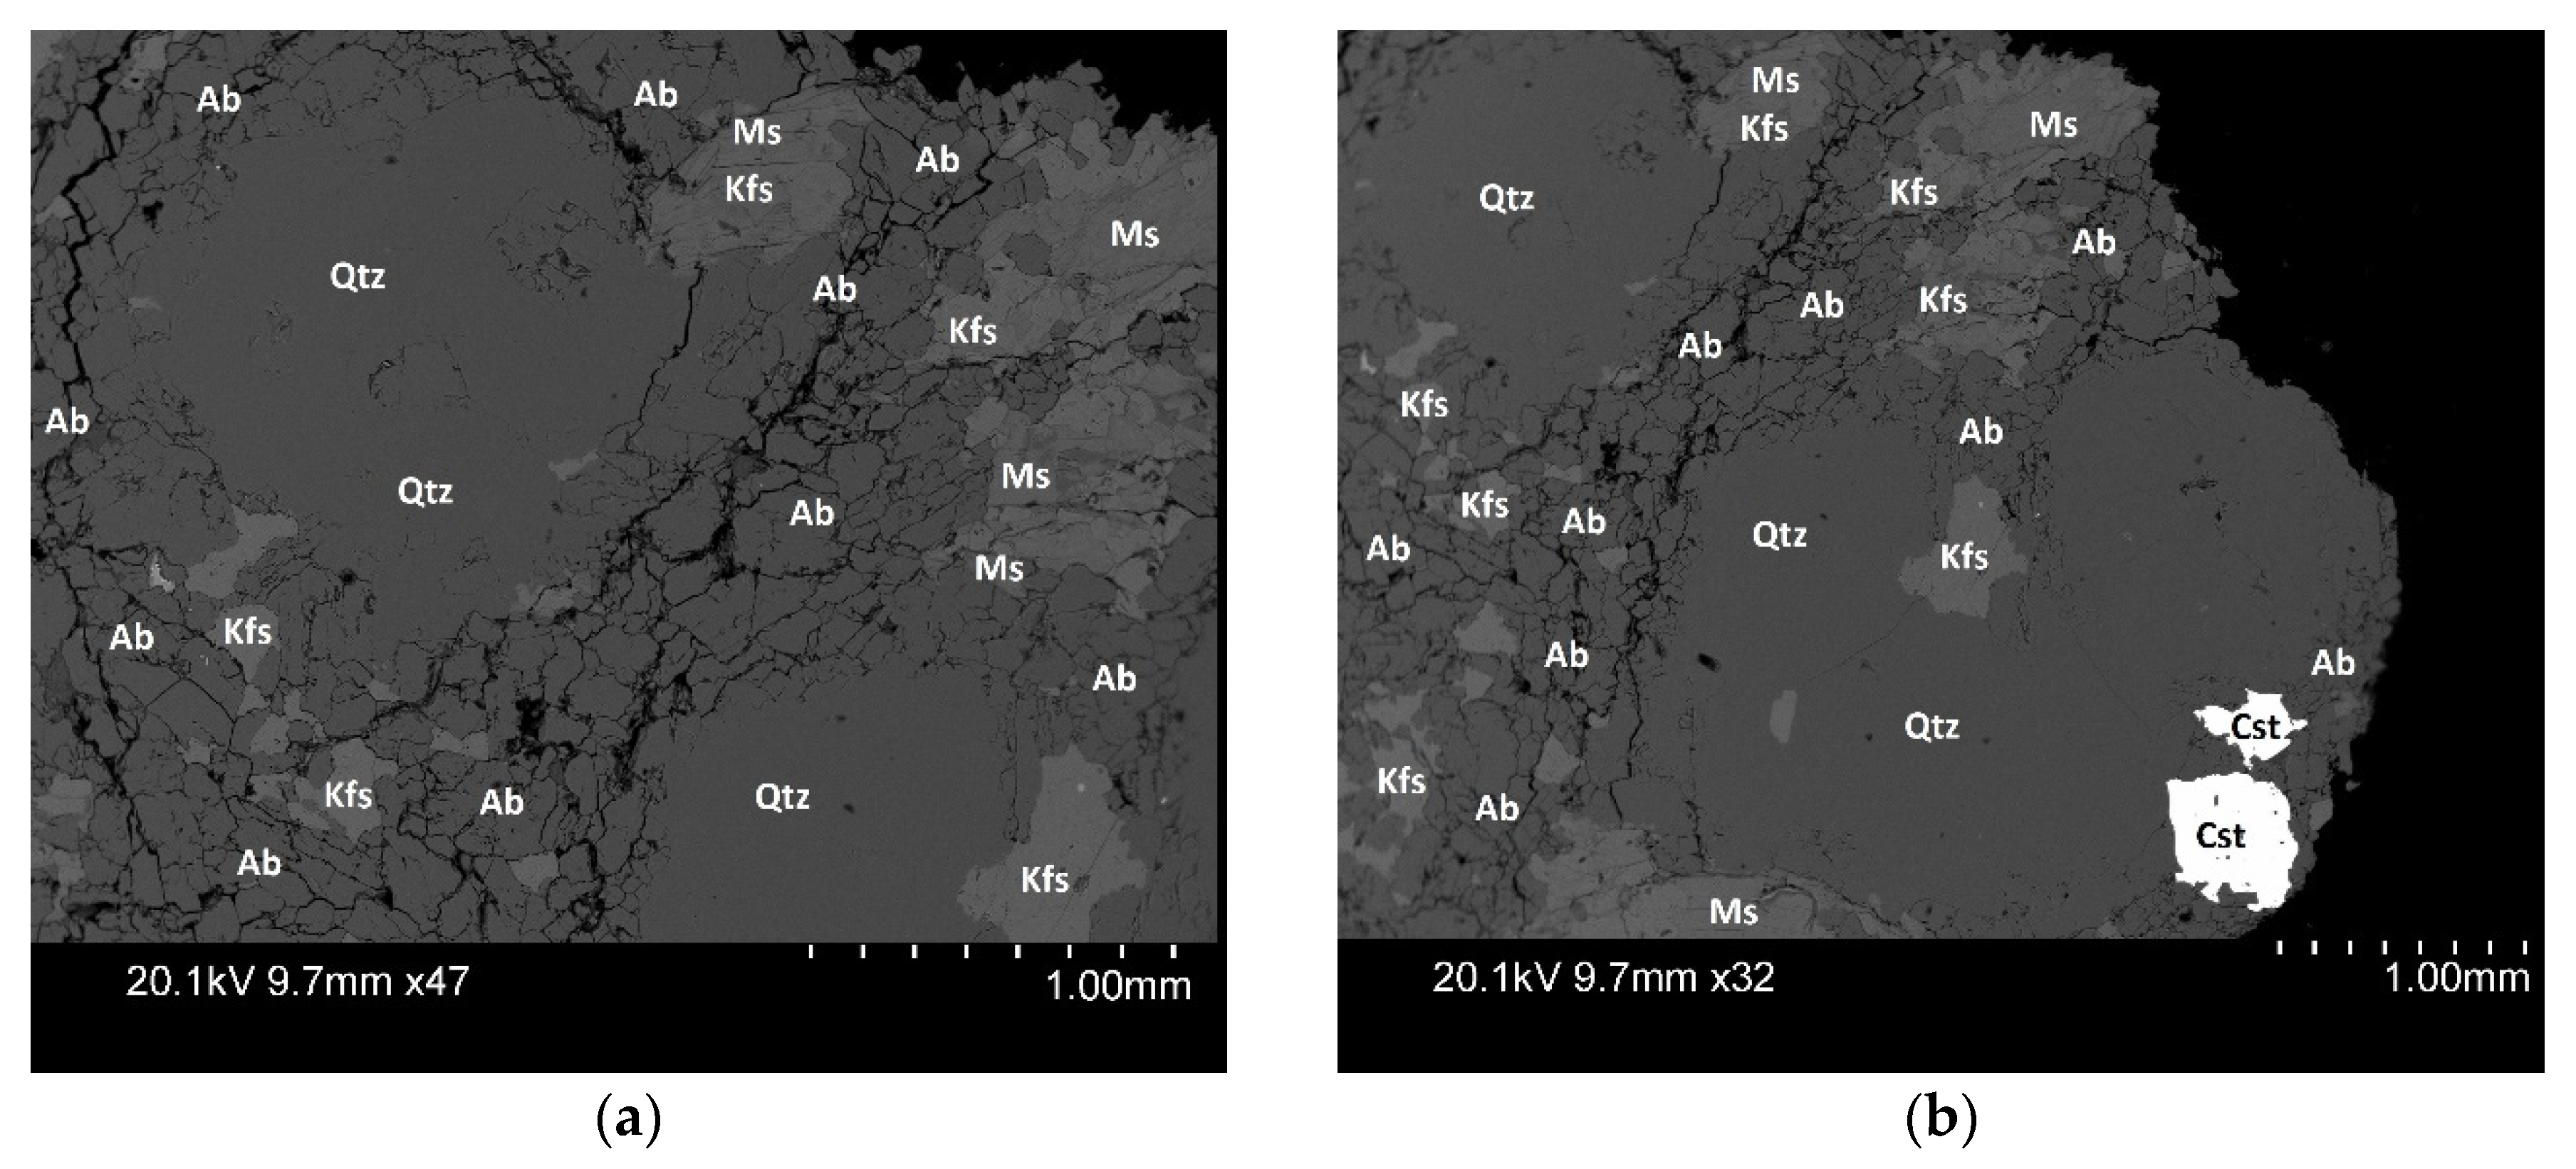
The fracturing of the rock is mainly controlled by frequent micro-fractures in albite, whereas the quartz megacrysts are less fractured or without fractures, especially in the coarse particles, as it is possible to observe in
Figure 9.
Figure 9 shows the material with a particle size of 4 mm after a compression ratio of 20%.
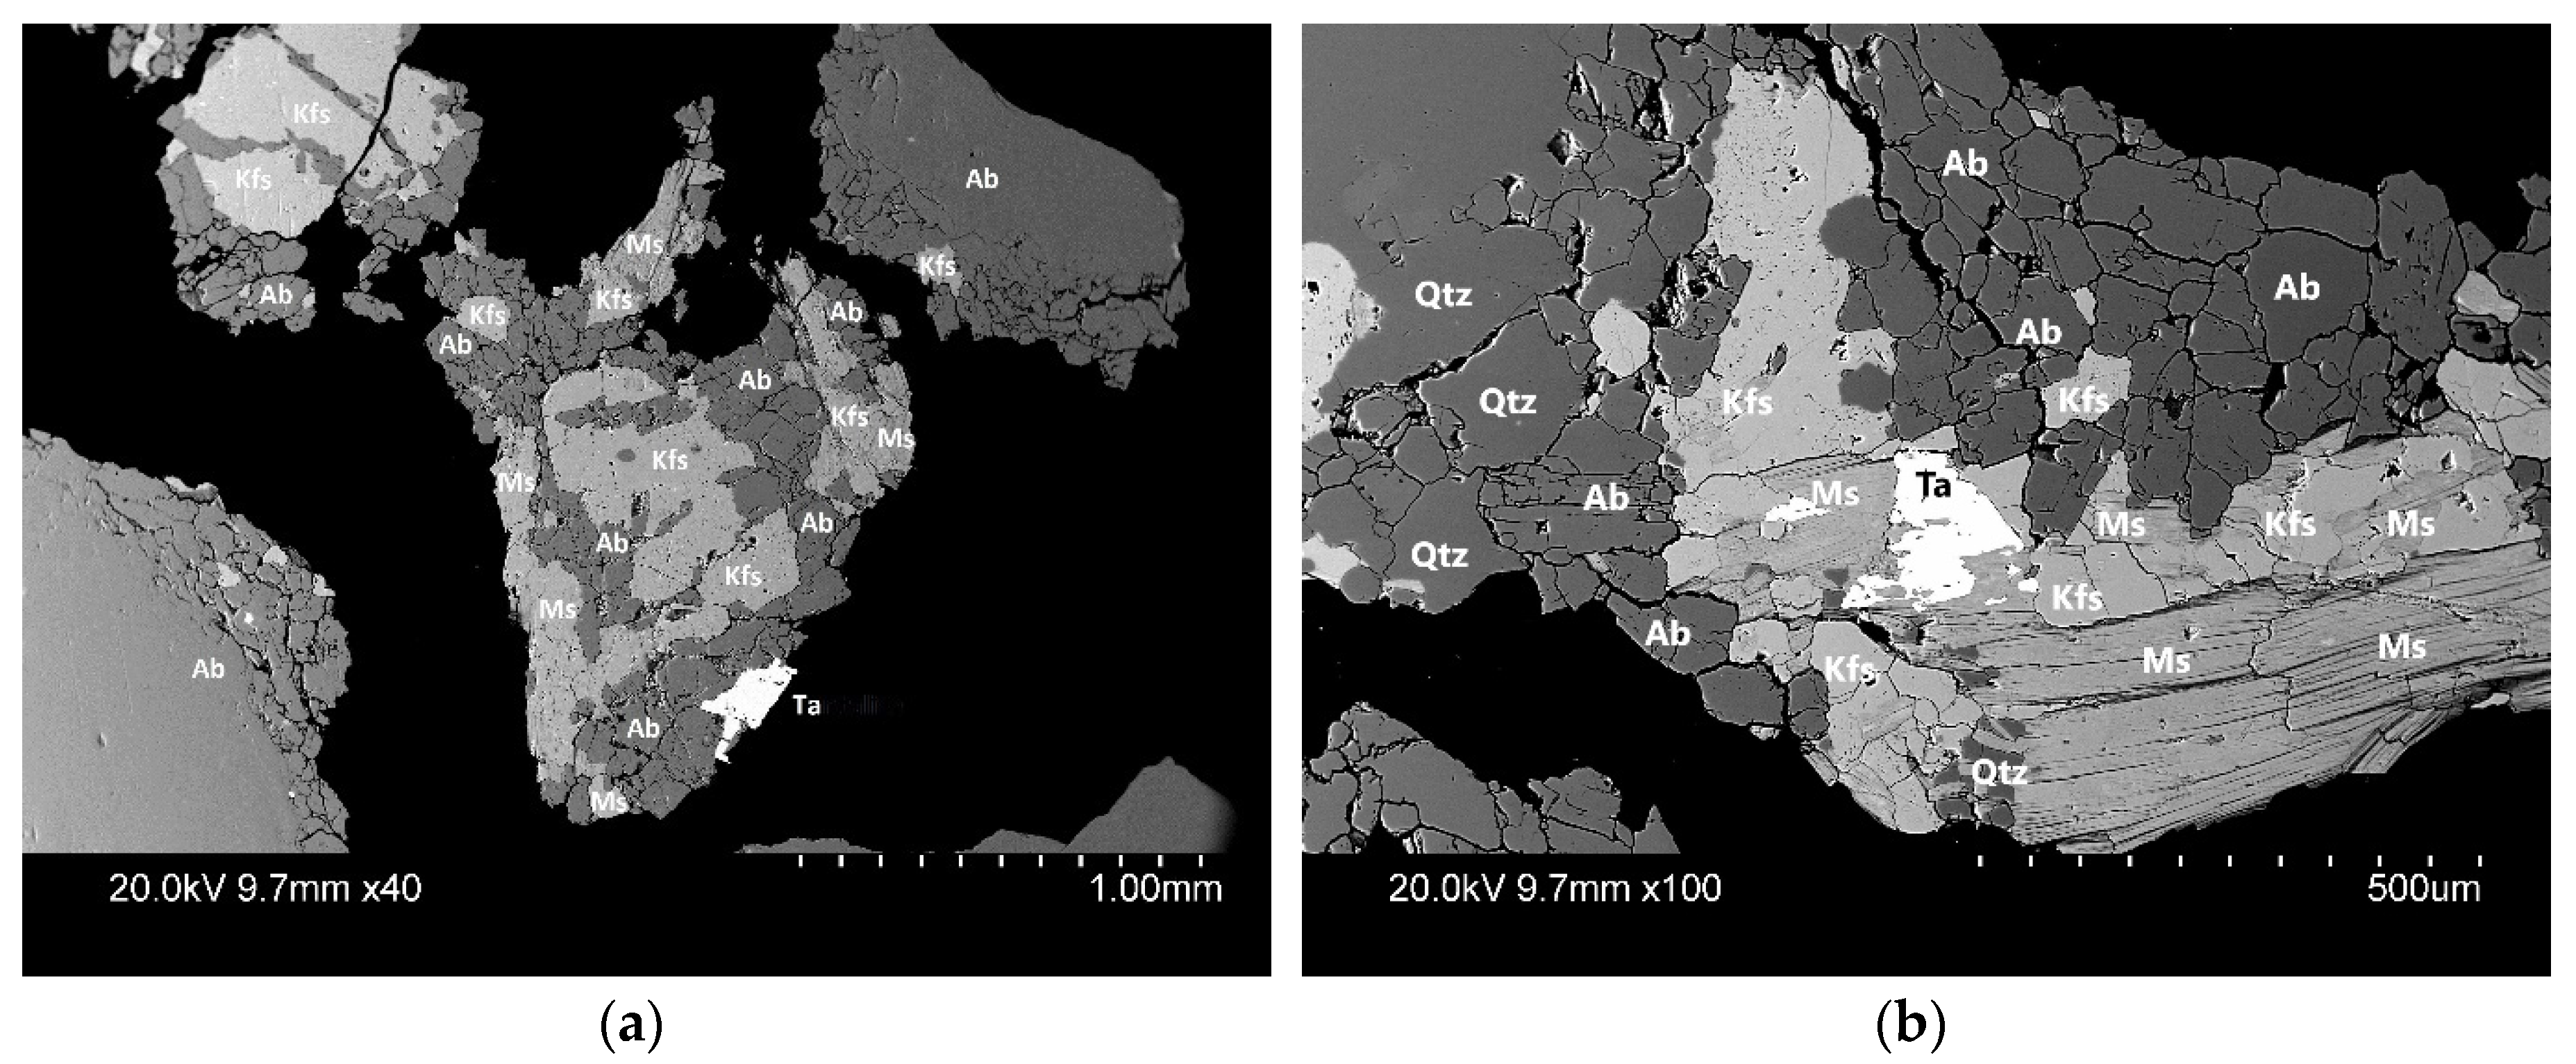
Figure 10 shows the material with a particle size of 1 mm after a compression ratio of 10%. In
Figure 9 it is possible to observe a pattern of interfacial breakage (non-random breakage), which allows the easy liberation of the minerals present in the brittle matrix. The breakages mainly occur in the matrix of fine grained and micro-fractured albite, whereas the more competent quartz megacrysts remain unfractured.
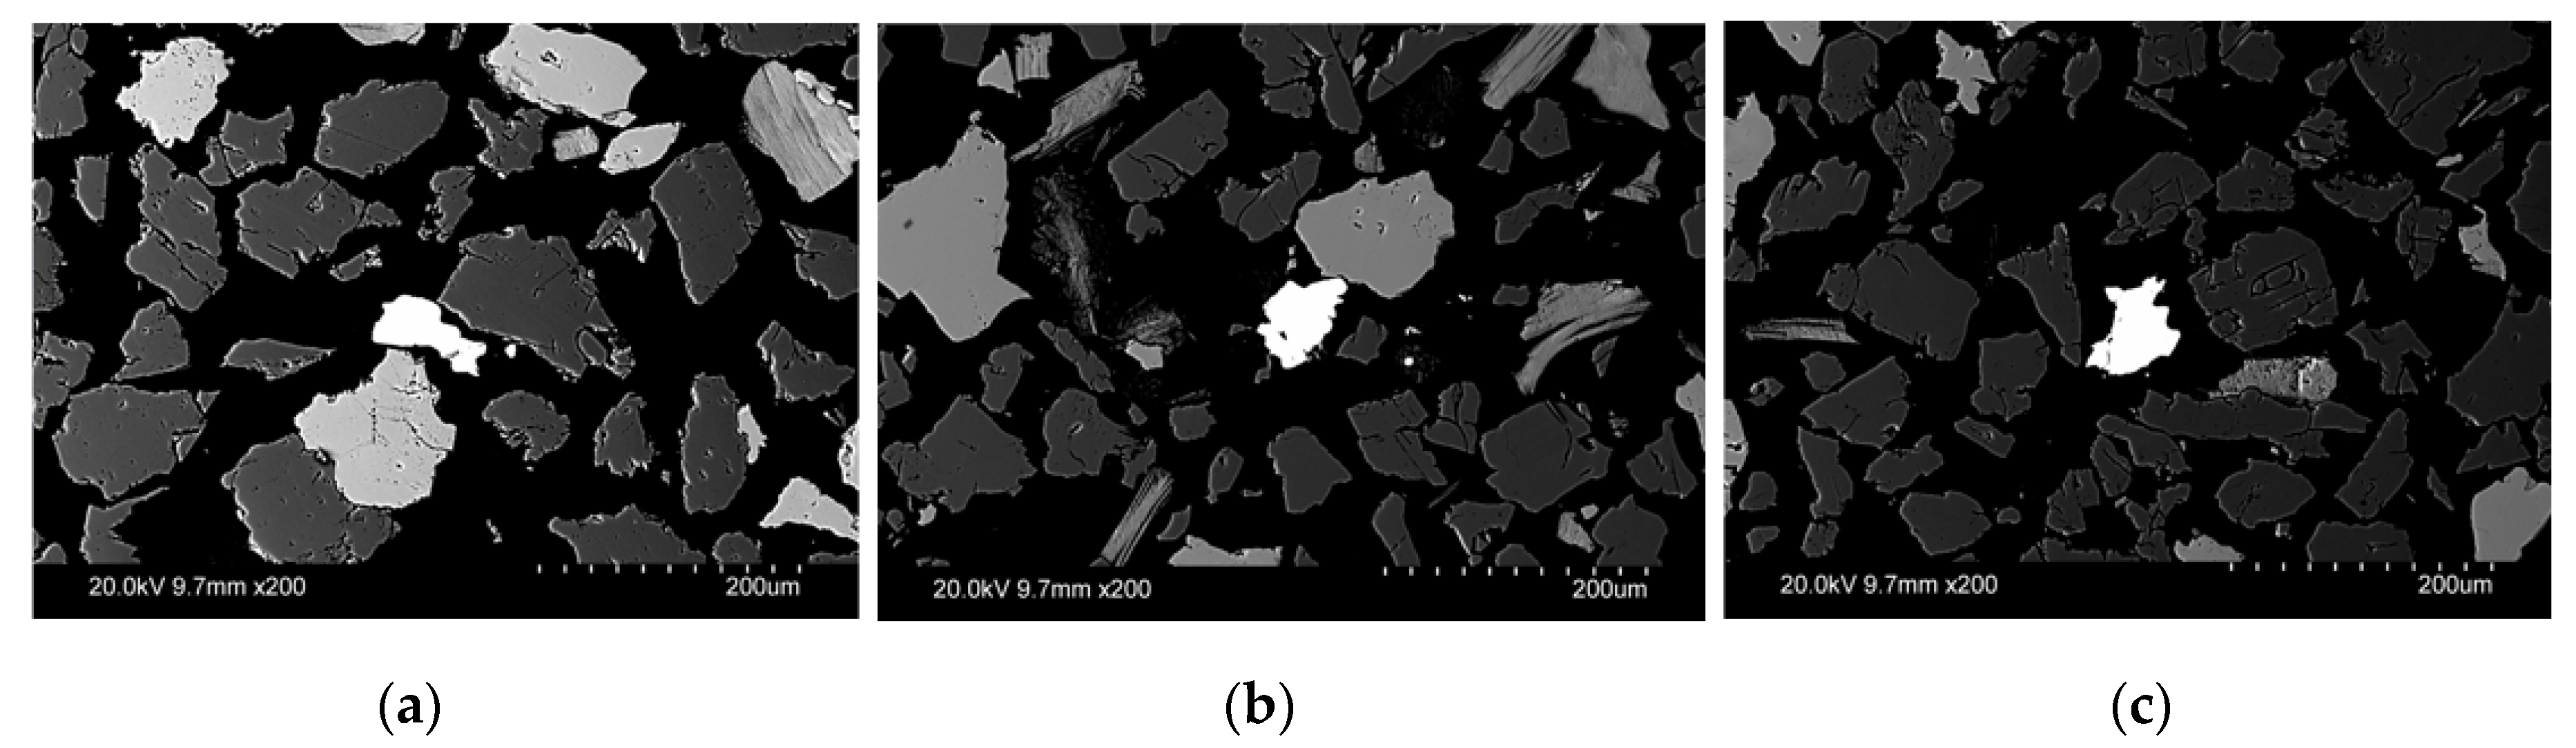
Particles that contain Ta, Nb, and Sn were identified by EDS analysis of all high-density minerals in the epoxy mounts of size fractions (4.0, 2.0, 1.0, 0.5, 0.25, 0.125, 0.063 mm) in sample 1 and sample 2 (
Table S1). The particles from each size fraction were mounted separately and were embedded in epoxy, followed by polishing. One polished block was used for each size fraction and each sample. Minerals containing tantalum were either found as liberated particles or occurred as composite particles with other minerals. The investigated fractions generally contained between 5 and 10 ore-bearing particles, with up to 40 particles in the <0.063 mm fraction. Four examples of a composite particle are presented in
Figure 9;
Figure 10.
Figure 11 shows three examples of liberated tantalum-rich particles for particles finer than 0.063 mm. Most columbite-tantalite particles were found in the small particle size fraction (0.063 and 0.25 mm). In the 1 to 4 mm fractions, columbite-tantalite grains were composite, and normally the columbite-tantalite grains were associated with quartz, albite, and K-feldspar and muscovite. For 0.063–0.125 and <0.063 mm fractions, ~50% of tantalite/columbite particles occur totally liberated (>90% of the particle consist of the ore-mineral), and composite particles were associated with quartz, albite, and K-feldspar and muscovite.
5. Penouta Material Characteristics
Material from Penuota has previously been studied in terms of breakage mechanism and ore mineral liberation in medium to fine-comminution (high pressure grinding-roles (HPRG) and ball mill) [
31]. Methods such as XRD, automatic SEM and pre-concentration have been deployed for quantification of comminution and liberation characteristics [
25]. Of relevance to the present study, a laboratory compression test of inter-particle breakage in a piston press was used to simulate HPGR at a high compression rate [
31]. The test produced ~70% material < 4 mm compared to ~50% for the highest compression rate in the present study. Despite the different compression rates the distribution of the main minerals shows very similar trends. The mineral-by-size distribution indicates a strong crushing induced fractionation that can be explained by a relative increase in resistance to breakage from albite, K-feldspar, and muscovite to quartz. Hamid et al. [
31] suggest that this trend is a result of albite and K-feldspar being more prone to the alteration, but our SEM-EDS study indicates that albite and K-feldspar are typically associated with frequent micro-fractures not observed in quartz megacrysts. Considering that mineral by size distribution is so similar across a wide range of compression rates, breakage induced mineral fractionation is likely restricted to grain sizes < 4 mm.
The liberation of niobium and tantalum phases by HPGR comminution was evaluated by a laboratory HPGR, followed by gravity separation on a shaking table [
25]. Gravity separation was effective in the size fraction < 250 µm and automated SEM showed that a high proportion of the minerals were liberated (>40%) and that the rest of the ore mineral occurs in mixed particles where niobium and tantalum minerals make up >50 volume % of the particle. In the >250 µm fraction, gravity concentration is less effective, where niobium tantalum minerals occur in mixed particles in the concentrate. These results are in line with an observation from our SEM-EDS investigation of unconcentrated samples, despite the much more limited number of ore-bearing particles studied.
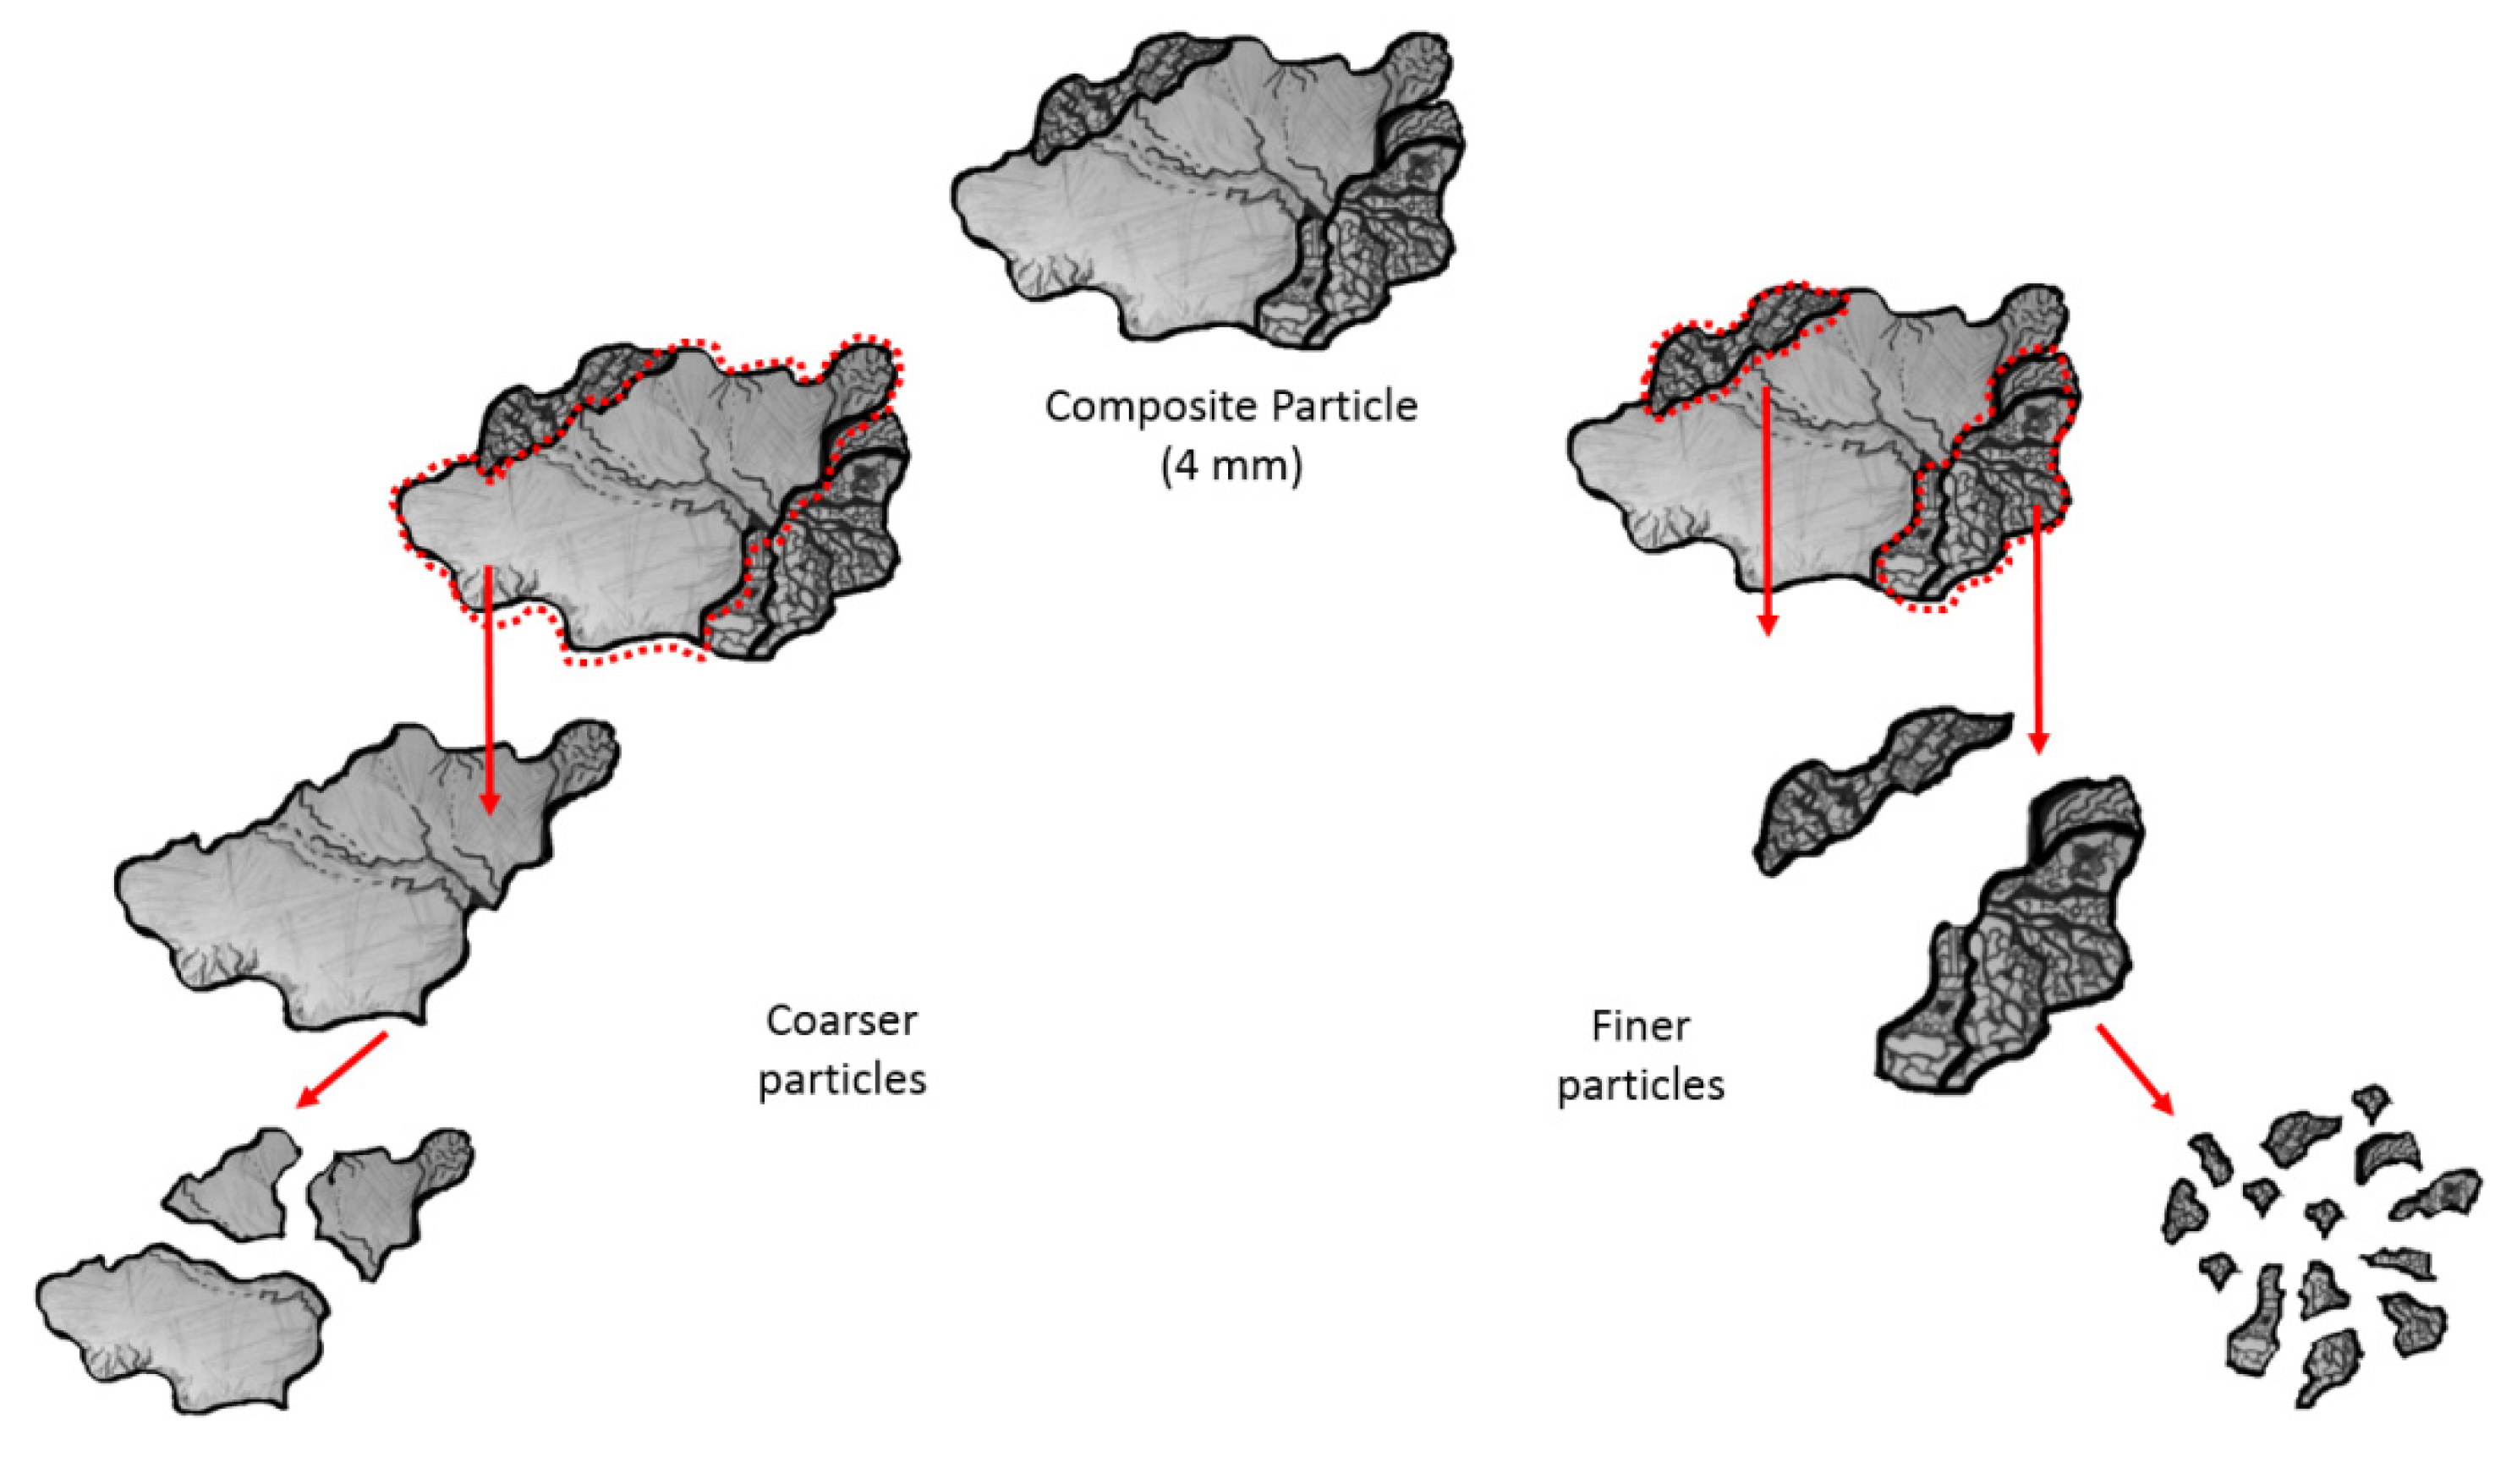
A simple conceptual model for the induced fractionation of minerals during crushing is presented in
Figure 12, which is based on the presented results and previous studies [
25,
31,
32]. Fractures and microfractures in matrix minerals possibly control the overall breakage behavior of the rock; as a consequence of this, most of the finer particles are generated from breakage of matrix minerals. In contrast, quartz megacrysts are much more difficult to break and therefore accumulate in the coarser size fractions. The ore mineral mainly occurs in association with matrix minerals, and this likely results in the liberation of ore-bearing particles at relatively coarse size fractions. However, the valuable minerals behave more competently than the microfractured matrix minerals and experience relatively modest size reduction in relation to their original size. This likely results in an enrichment of the ore-minerals in 0.25–1 mm fractions and a depletion in the finest fractions < 0.125 mm.
6. Grade-by-Size Methodology
The combined information from automated SEM, XRD, and pre-concentration by gravity separation provides a detailed understanding of compressive breakage of material from the Penouta deposit. The only problem is that these methods are time consuming, expensive, and not well suited for testing large numbers of samples for geometallurgy or for monitoring of coarse to medium ore-comminution in production. Therefore, we compare information that can be gained from grade-by-size distribution curves to information that was gained from the more specialized methods. The goal is to assess grade-by-size distribution as a standalone method for certain applications in the development of low-grade ore deposits.
The main advantage of a method that is based on bulk composition is that the large number of grains analyzed in each size fraction provides a strong statistical basis for comparisons. This is supported by results from the Penouta case study showing that grade-by-size distribution is highly reproducible between samples and between different compression rates. The drawback is that detailed information about mineralogy and mineral liberation is not quantified but has to be inferred. However, without any knowledge about the mineralogy or mineral chemistry of the Penouta deposit, several insights can be extracted from grade-by-size distribution after compressive breakage. The fractionation of major elements shows that the rocks consist of several minerals with different mechanical properties, where a sodium rich phase(s) breaks down most easily and that a silica-rich phase(s) is most resistant to breakage. The strong enrichment of K2O and Ta, Nb and Sn in the 0.125 to 1 mm range indicate that the valuable minerals are either frequently associated with potassium-rich mineral(s), or that the liberated ore mineral occurs in this size range. The low abundance of valuable minerals in <0.125 mm fractions would indicate that the bulk of the valuable minerals are larger than 0.125 mm, and the decrease in Nb–Ta–Sn in the 2–4 mm fraction suggests that these metals are less frequently associated with the silica-rich phase(s). These insights are fully consistent with results from SEM-EDS and XRD, showing that geologically meaningful information can be extracted from the grade-by-size distribution. The liberation point of the valuable minerals cannot be inferred from the grade-by-size curve, but fractionation of the ore mineral into a distinct size range points to the liberation of ore-bearing particles during comminution. For coarse to medium comminution, this information is actually more valuable than knowledge about complete liberation of valuable minerals, since the focus here is to identify material characteristic that could enable pre-concentration or screening in an operation. In the case of Penouta mineralization, the distinct enrichment of Ta, Nb, and Sn in material < 1 mm warrant further investigation. It would be reasonable to evaluate if early rejection of ore-depleted quartz-rich material in the range of 1–4 mm could benefit the overall economy of the operation. The early rejection could be accomplished either by screening at 1 mm or by gravitational separation (e.g., jig) of material less than 4 mm. In both cases, a substantial amount of metal would be lost, but the cost of fine comminution could be reduced significantly. These options would necessarily have to be carefully evaluated in the larger context of the planned operation, but the point is that grade-by-size information or assessment of the distribution of each element in the coarse to medium comminution steps, could be helpful to evaluate the potential of early rejection of coarse material. This could result in a process that is more economical, uses less energy, and produces less fine-grained waste material.
Ore deposits are generally associated with large internal variations in lithology. This means that different parts of the ore body may behave very differently during comminution, and variations in texture and mineralogy will have a large effect on liberation in coarse to medium comminution. In the typical mineral processing operation with fine grinding, variation in liberation characteristic of the material can be accommodated with minor adjustments in the milling stage. However, when designing an operation that relies on the liberation of valuable minerals or ore-bearing particles at more coarse grain-sizes, it is critical to understand the variation in lithology and comminution characteristics of all rock types in the deposit. Otherwise, there is a risk that the processing plant is designed in a way that is not functional. Here, an optimized grade-by-size approach can be helpful for studying many samples from drill-cores and outcrops. To test if a proposed design of processing plant is suitable for an entire deposit, a focused grade-by-size study would provide a time and cost-effective way of testing rock characteristics on a deposit scale. Testing would include a suitable compression test that could simulate comminution in the proposed processing plant (e.g., piston press or laboratory comminution equipment), and bulk-chemical analysis of a limited number of fractions (two to three fractions). A well-designed test-work covering samples from all ore-types in a deposit should provide information on the comminution and liberation characteristics of the deposit as a whole. This information should provide actionable information that can improve the plant design and provide basis for investment decisions.
7. Conclusions
The early rejection of waste material could result in many benefits for a mining operation, but is rarely implemented in the industry. Most ores are not suitable since they display weak fractionation of valuable minerals during comminutionm, or the liberation of ore bearing particles occurs at very fine grain sizes. However, it is easy to overlook the potential for early rejection if test-work is only focused on grinding to complete liberation. In this case study of the Penuota Sn-Ta deposit, we show that grade-by-size distribution detected a strong fractionation of metal bearing particles into the size range of 0.125 to 1 mm. We, therefore, recommend that suitable compression tests combined with a tailored grade-by-size analysis should be considered for coarse-grained ores (e.g., porphyry deposits) or ores with heterogeneous textures (e.g., vein mineralization). This information could be used in order to identify potentially useful liberation characteristics during coarse and medium comminution. If a processing plant is designed for early rejection, we think that the presented method could be used to survey the variation in comminution and liberation behavior of different parts of the ore body (drill cores and outcrops), at a comparatively low cost. More specialized methods (e.g., SEM-EDS and XRD) are needed to target specific questions relating to mineralogy and micro-textures that cannot be resolved by grade-by size analysis.


