Article

Stability of Cu-Sulfides in Submarine Tailing Disposals: A Case Study from Repparfjorden, Northern Norway

1
Department of Geosciences, UiT—The Arctic University of Norway, Dramsveien 201, 9037 Tromsø, Norway
2
Akvaplan-Niva, 9007 Tromsø, Norway
3
Institute of Geology, Geohazards Lab, Adam Mickiewicz University in Poznań, Bogumiła Krygowskiego 12, 61-680 Poznań, Poland
4
Department of Geology, Faculty of Science, University of Zagreb, Horvatovac 95, 10000 Zagreb, Croatia
5
Norwegian Mining Museum, P.O. Box 18, N-3602 Kongsberg, Norway
*
Author to whom correspondence should be addressed.
Minerals 2020, 10(2), 169; https://doi.org/10.3390/min10020169
Submission received: 21 December 2019 / Revised: 4 February 2020 / Accepted: 8 February 2020 / Published: 13 February 2020
(This article belongs to the Special Issue Environmental Geochemistry of Mineral Deposits)

Abstract

:
Mine tailings that were produced during the exploitation of the Ulveryggen siliciclastic sediment-hosted Cu deposit in northern Norway were disposed into the inner part of Repparfjorden from 1972 to 1978/1979. This study focuses on the mineralogy and geochemistry of the submarine mine tailings and underlying natural marine sediments from the inner part of Repparfjorden, as well as on the primary Ulveryggen ore. The ore mineralization from the neighboring Nussir carbonate sediment-hosted Cu deposit was studied too, due to the forthcoming mining of both deposits. Bornite and chalcopyrite are the major Cu-sulfides, and are characterized by low concentrations of potentially toxic elements including Cd, Hg, and As. The tailing material occupies the uppermost 9 cm of Repparfjorden sediments. It is characterized by predomination of a silty component with elevated Cu (up to 747.7 ppm), Ni (up to 87 ppm), and Cr (up to 417 ppm) concentrations. The high Cu concentration is related to the deposition of mine tailings. In contrast, Ni and Cr concentrations are close to those in naturally occurring stream sediments from the feeding river, Repparfjordelva, reflecting the compatibility of these elements with hosting mafic volcanics, which are widely spread in the Repparfjord Tectonic Window. Copper in the uppermost part of the sediments is bound to the acid-soluble fraction while Ni and Cr are bound to the residual fraction. Artificial placement of large masses of fine-grained material, i.e., smothering, resulted in a diminished biological activity and/or physical distortion of mostly benthic fauna, which was reflected in total organic carbon (TOC) values as low as 0.15% in the uppermost strata. Sulfide minerals are found both in natural marine sediments and in the mine tailings. They are generally well-preserved with an exception for chalcopyrite from the uppermost part of the submarine tailing, which shows signs of incipient weathering. Thermodynamic modeling confirmed that redox potential and pH are important factors in the weathering of sulfides. Available ligands contribute to the Cu speciation. In near-neutral to slightly alkaline conditions a presence of carbonates can lead to the mobilization of Cu in form of CuCO3 complexes.

1. Introduction

Global economic growth, the development of new technologies, and a general trend towards renewable energy production has led to increased global need for a wide spectrum of metals and metalloids, including Cu [1,2,3,4]. However, mining activities can generate large quantities of waste material. Tailings, a residual material after the separation of the valuable fraction of an ore, can be a significant environmental threat, contributing to acid rock drainage (ARD) and responsible for the leaching of potentially toxic metals and metalloids [5]. Tailings have traditionally been deposited on land, but in several countries including Norway, Papua New Guinea, Philippines, Chile, Indonesia, and Turkey, submarine disposal sites are common [1,6,7]. The potential environmental impact of tailings strongly depends on the origin of the ore mineralization, its mineral composition, and mineral chemistry of the ore and gangue minerals [1,8]. Depending on their depths of deposition, submarine disposals are subdivided into coastal shallow-water tailing disposal (CTD), submarine tailing disposal (STD), and deep-sea tailing placement (DSTP) [9]. On-land deposition of mine waste occurs in tailing impoundments, dams or waste dumps, as well as through discharge into rivers and lakes, or backfilling to underground mines and open pits [1,5]. Both submarine and on-land tailings may have negative socioeconomic and environmental impacts [10,11,12,13]. The most common environmental issues related to on-land deposition of mine waste materials include tailing-dam failures leading to the release of toxic metals and acid waters into the environment [14,15,16,17], oxidation of sulfide minerals and creation of acid rock drainage [18,19,20], and chemical pollution of waterways (rivers, groundwater, streams) followed by adverse impacts on biota [5]. Furthermore, dissolved species of heavy metals may become bioavailable and lead to significant changes in the ecosystem associated with both on-land and submarine tailings [5,9,21,22,23,24].
The mining activity in the Repparfjord Tectonic Window, an exposure of a Paleoproterozoic greenstone belt, took place between 1972 and 1978/1979 [25]. The waste material in the Repparfjord area was discharged offshore into Repparfjorden (Figure 1). Recent studies reveal elevated concentrations of Cu within fjord sediments [24] and a significant bioavailability of Cu and a potentially negative impact on biota in Repparfjorden [23].
The main objectives of this study were to obtain a better insight into the mineralogical and geochemical changes that occurred in Cu-sulfide tailings disposed in submarine conditions of Repparfjorden, northern Norway (Figure 1), and to reveal their environmental impact. The research was based on multi-proxy analyses of sediments and primary ore, as well as on thermodynamic modelling of sulfides oxidation in order to reveal physicochemical factors that control weathering of Cu-sulfides and the resulting bioaccessibility of Cu. On-land deposition was considered as one of the alternatives to store the future mine tailings [26]; therefore, here we also present thermodynamic modelling of Cu sulfides oxidation in on-land conditions.

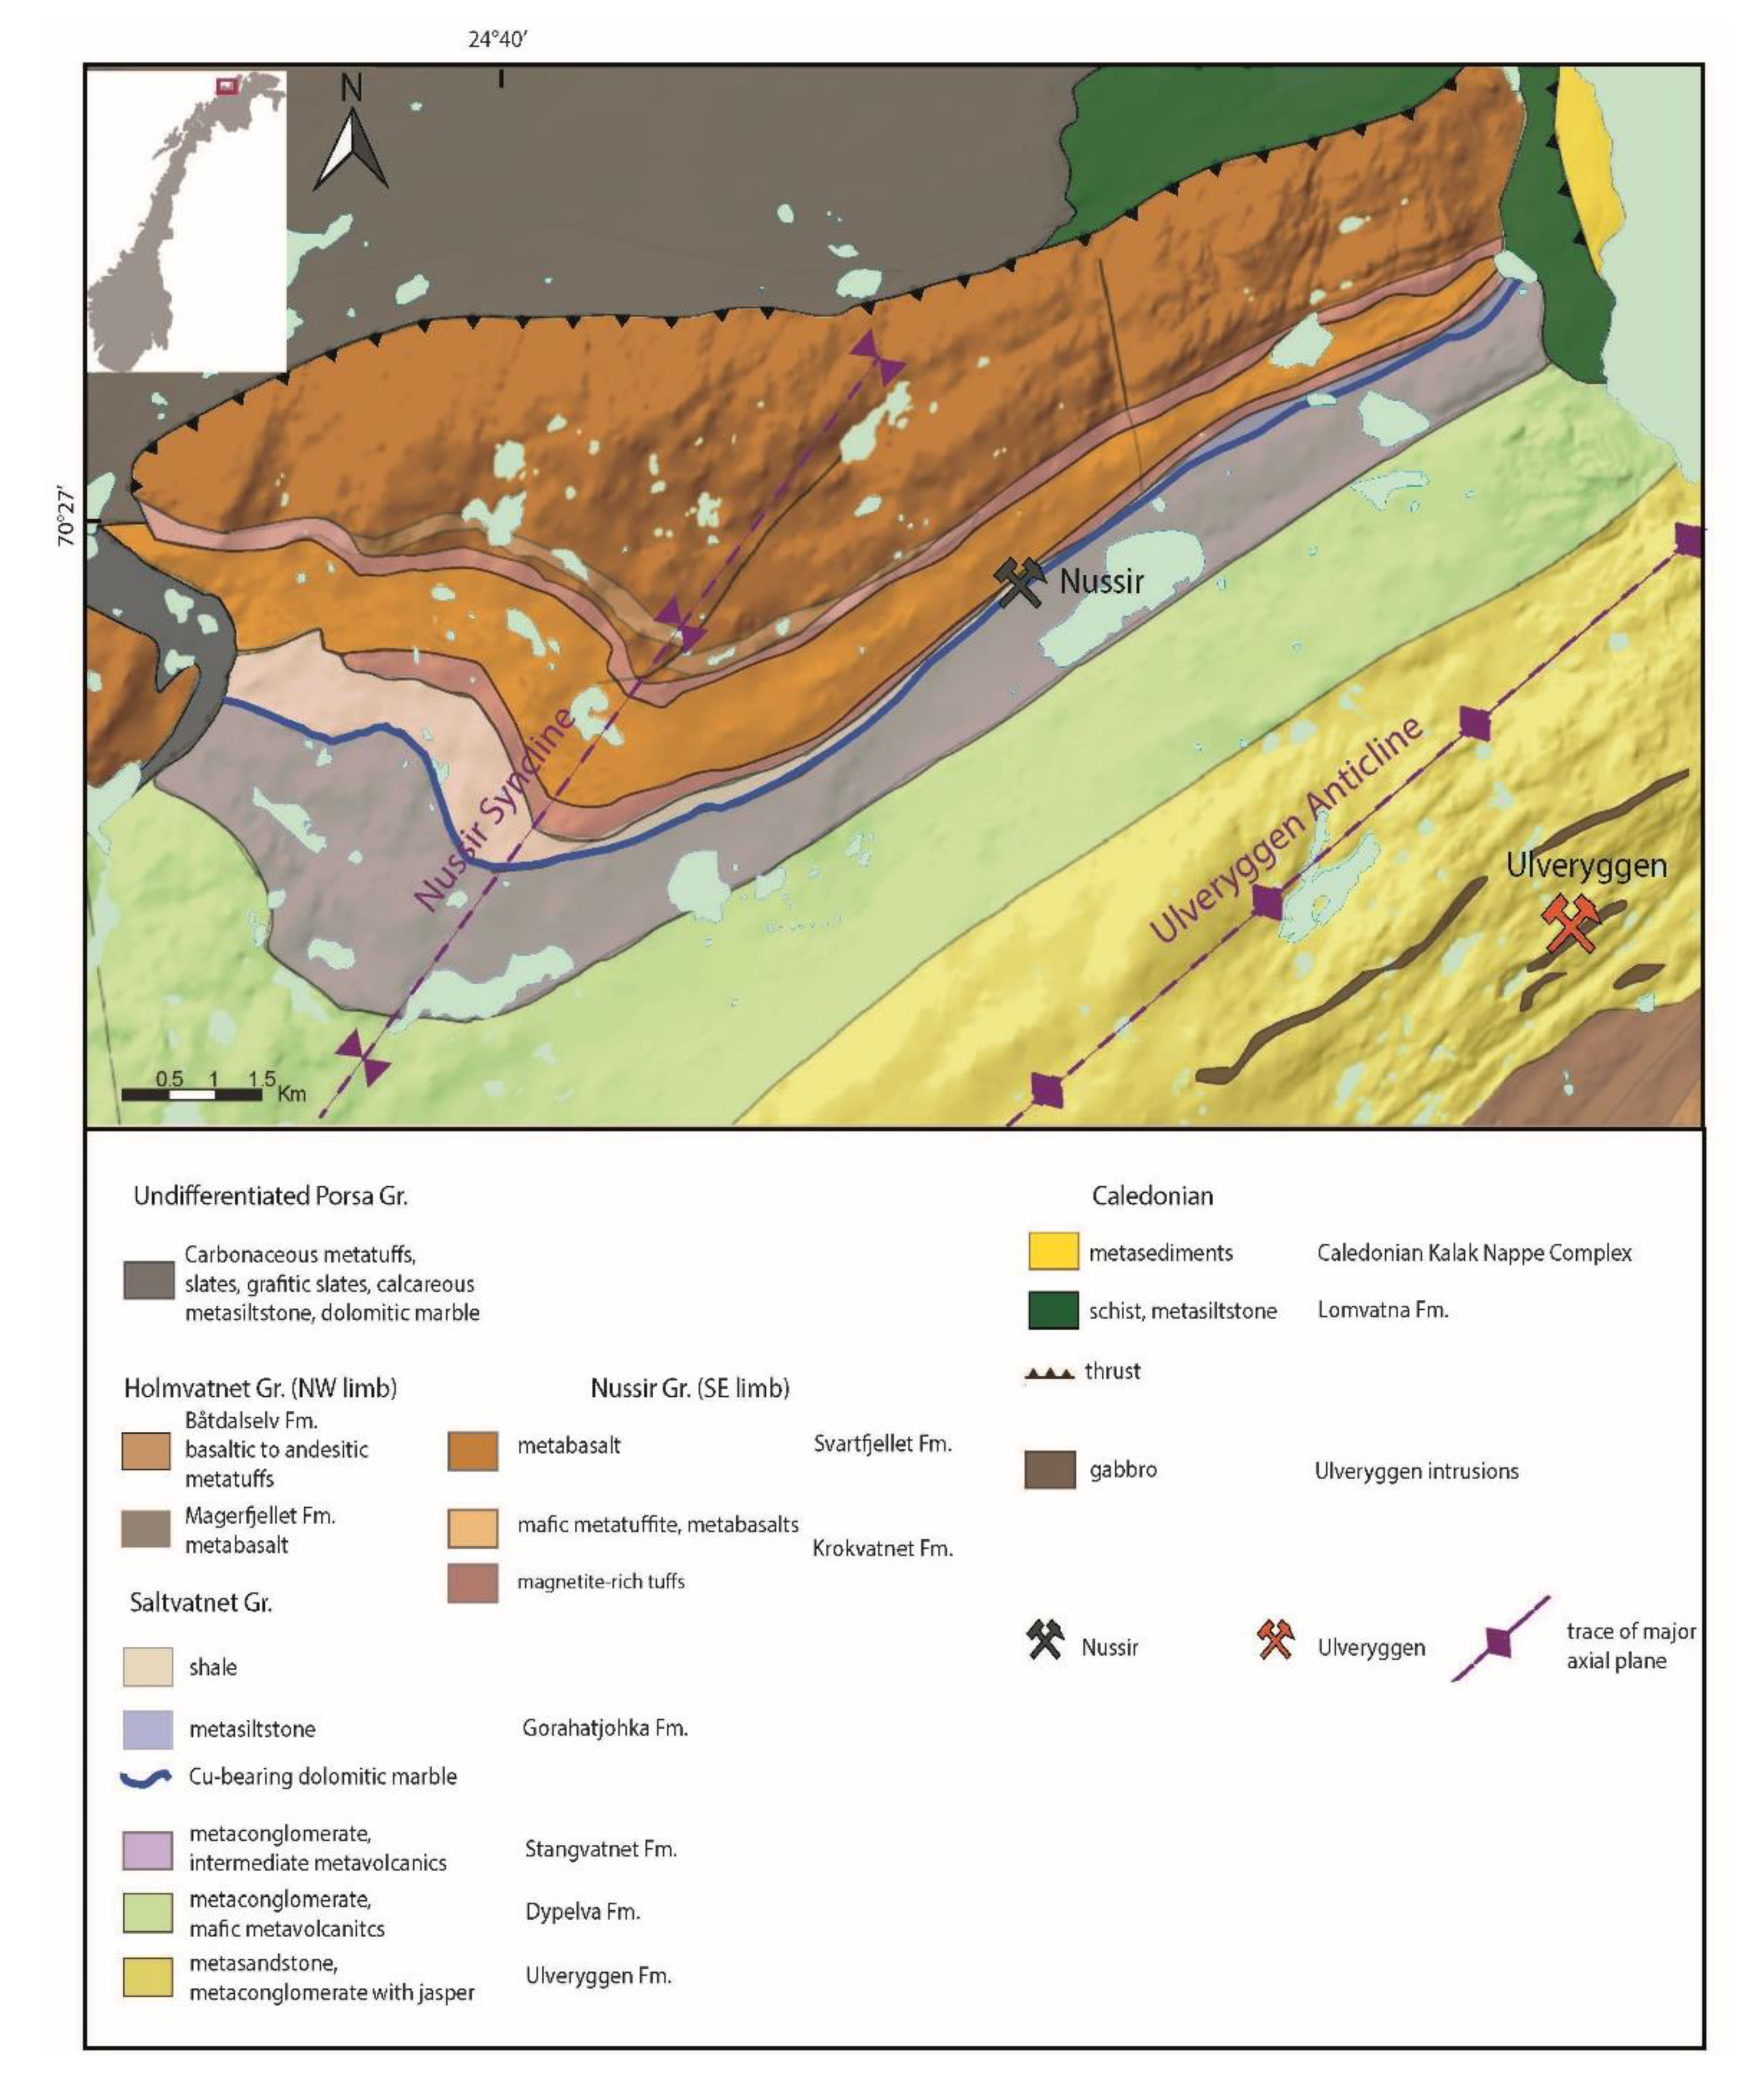
Geological Setting and Mining History

Repparfjorden is an approximately 13-km long and up to ~4-km wide fjord, oriented southeast–northwest, and located in the Troms and Finnmark County, northern Norway (Figure 1). Beyond its mouth, the fjord is connected to Sammelsundet in the north and Kvalsundet in the south. In the east, the Repparfjordelva (Repparfjord River), which drains an area of 1092.15 km2, enters the fjord head [23,27].
The Repparfjord Tectonic Window, located S/SE of Repparfjorden, is an exposed fragment of a Fennoscandian Paleoproterozoic greenstone belt composed of mafic volcanics (pillow lavas, volcanoclastic breccia and tuff) intercalated with sedimentary carbonate–siliciclastic rocks (dolomitic marbles, metasandstone and metasiltstone) (Figure 2; [29]). The region hosts numerous Cu sediment-hosted and vein-type occurrences that were deposited as a result of interactions of moderately to highly saline basinal brines with the volcano-sedimentary complex [30,31,32]. Even though the Nussir and Ulveryggen sediment-hosted Cu deposits (Figure 2) are considered as products of the same mineralizing event [31,32], they have different mineral and geochemical characteristics, which are mostly controlled by diverse host–rock lithologies [32].
The company Folldal Verk AS mined the Ulveryggen sediment-hosted Cu deposit in several open pits from 1972 to 1978/1979 [25,33]. The remaining resources in the deposits are approximately 3.7 million tons of ore at 0.8 wt.% Cu [34]. The Cu mineralization at Ulveryggen is predominantly hosted by arkosic metasandstones, metasiltstone, and metaconglomerates, and mostly occurs as sulfide disseminations, though locally mineralized quartz and carbonate veins also occur. Chalcopyrite, bornite, chalcocite and covellite are the major Cu sulfides in this deposit (Figure 3), although pyrite, and to lesser extent, sphalerite, are common as well.
The Nussir deposit is located approximately 6 km to the north-west of the Ulveryggen deposit (Figure 2), and estimated remaining resources are 5.8 million tons of ore at 1.15 wt.% Cu with Au and Ag as by-products [34]. The mineralization at the Nussir deposit is similar to that at Ulveryggen (i.e., chalcopyrite, bornite, chalcocite and covellite, associated with pyrite and sphalerite) and represents the main assemblage of sulfide minerals. However, the Nussir mineralization is hosted by a metamorphosed volcano-sedimentary complex, predominately composed of mafic metavolcanics intercalated with carbonate–siliciclastic rocks. The major part of the mineralization is strictly confined to dolomitic marble crosscut by quartz–carbonate veins [30,31,32]. Complicated intergrowths of ore minerals are typically absent from both deposits (Figure 3; [31,32,35]).
During the time of mining activity at Ulveryggen, approximately 1 Mt of mine tailings were disposed into the inner part of Repparfjorden. The tailings were transported through a 600 m long pipeline with openings at 100 m intervals, suspended approximately 20 m above the seafloor [24], and the historical mine tailings are preserved as a series of cone-shaped mounds on the fjord floor [27]. The layer of sediments affected by the mine tailings is up to 9 cm thick and contains elevated concentration of Ba, Bi, Cu, Hf, and Zr [24,27]. According to [23] the dispersion of Ba, Cr, Ni, Pb, and Zn was limited to the inner part of the fjord. However, about 2.5–10 t of Cu was dispersed to the outer fjord [23]. At a sediment depth of about 20 cm, [27] describe the presence of a hardpan, a schist-like Fe–Mn rich layer with elevated concentrations of Co, Cr, Ni, Al, and Ga.
Mining activities within the Ulveryggen deposit are planned to resume in 2020, and the Cu mineralization from the Nussir deposit will be exploited. The produced tailings will be deposited within a confined area in the outer part of Repparfjorden [26,27,36].

2. Materials and Methods

Three types of samples provide the basis for this study: (1) Cu-ore mineralization from the Nussir and Ulveryggen sediment-hosted Cu deposits; (2) natural marine sediments from Repparfjorden; and (3) historical submarine tailings from Repparfjorden.

2.1. Type 1 Samples: Cu-Ore Mineralization

Representative samples of the Cu mineralization were sampled from drill cores from the Nussir and Ulveryggen deposits stored in the Norwegian National Drill Core and Sample Centre. The permission for sampling was provided by Nussir ASA.
The mineral compositions of the Cu-ore mineralization from Ulveryggen and Nussir were determined combining transmitted and reflected light microscopy as well as a Zeiss Merlin Compact VP field emission scanning electron microscope (FE SEM), equipped with an Energy-dispersive X-ray spectrometer (EDS) at the UiT, The Arctic University of Norway. Individual sulfide grains (i.e., chalcopyrite and bornite) were handpicked under a binocular microscope, washed in an ultrasonic bath, and pulverized in an agate mortar. The amount of 0.5 g was analyzed for bulk trace element composition at Acmelabs (Vancouver, Canada), using the ICP MS method with the LF202 analysis code (for details the reader is referred to [37].

2.2. Types 2 and 3 Samples: Natural and Tailing-Affected Marine Sediments from Repparfjorden and Overbank Sediments from Repparfjordelva

Two research cruises to the inner part of Repparfjorden were carried out in 2012 and 2015 using UiT’s research vessel RV Helmer Hanssen to retrieve natural marine sediments and the sediments affected by the historical submarine tailings disposed during the 1970s. In total, five marine sediment cores were selected for this study: two gravity cores: HH12-004-GC and IG15-1-1106GC, two multi-cores: IG15-1-1089 and IG15-1-1079MC, and one box core: IG-15-1-1039BC (Figure 1; Appendix A). The multi-corer consists of six core-liners with outer diameter 110 mm and approximately 70 cm in length, whereas the box corer consists of 50 × 50 × 50 cm box from which 2–3 cores were obtained via pushing the core liners into the retrieved sediments. Both the multi and box cores were sampled at 1 cm intervals onboard the ship, and the samples were frozen immediately. Geochemical analyses and heavy metal dispersion from cores IG15-1-1079MC and IG15-1089MC are presented by [23] and [24], respectively. The riverine samples from Repparfjordelva were provided by Norwegian Geological Survey.

2.2.1. Total Organic Carbon (TOC)

Total organic carbon (TOC) was measured in sub-samples of core HH12-004-GC using a LECO CS-200 instrument at the Department of Geosciences, UiT, and the samples were prepared following the procedure described in [24]. For the purpose of this study, the following intervals were sampled (all samples are of 1 cm thickness) and analyzed: 0–30 cm, followed by 43, 100, 155, 167, 181, and 216 cm depths.

2.2.2. Lithogeochemistry

Lithogeochemistry of marine sediments from intervals of 0–1, 2.5–3.5, 6–7, 8–9, 10–11, 12–13 cm (HH12-004-GC) was analyzed at AcmeLabs using ICP MS with the GC806, LF200, and AQ200 analytical codes. Around 5 g of crushed sample was mixed with lithium metaborate/tetraborate and fused to ensure total acid dissolution of refractory minerals such as xenotime, monazite, and zircon prior to analysis to determine major and trace element contents. Accuracy and precision can be found at http//:www.acmelab.com. For simplicity, the samples were named according to their shallowest depth, namely: 0, 2.5, 6, 8, 10, 12.
River sediments from Repparfjordelva were analyzed at Actlabs (Canada) using ICP methods with the analytical codes 4LITHO for major elements and WRA4B2 for trace elements. For the accuracy and the precision of analysis the reader is referred to [38]. The detection limits of trace elements in the two laboratories varied and the analysis performed in AcmeLabs was demonstrated to be more suitable for trace elements determination.

2.2.3. Grain-Size

Grain size analyses were performed on HH12-004-GC at 0.5 cm intervals using a Diffraction Particle Size Analyzer at UiT (Beckman Coulter LS 13 320). All samples were prepared and analyzed following the procedures described by [39] and processed as described in [24] using the GRADISTAT program, applying the geometric methods of moments [40]. For the purposes of this study, we exclusively present the results from the uppermost 100 cm.

2.2.4. X-Ray Diffraction

Gravity core HH12-004-GC was also sampled up to 12 cm depth in 2-cm-thick intervals for X-ray diffraction (XRD) analysis of bulk sediments. Clay minerals (<2 µm) were separated from the samples at depths of 3–4, 8–9, 43, 100, and 216 cm for further XRD analyses. A 1 g aliquot of air-dried sediments was mixed with 25 mL of distilled water. The mixture was centrifuged for 30 s at 20,000 rpm to separate a suspension with clay minerals from the rest of the sample. The surface of the thin section glass was roughed using diamond paper for better cohesion, and the clay mineral suspension was dropped on the glass using a pipette, in several layers. Each layer was air-dried before the next layer was dropped. The XRD analyses were conducted at the Department of Geology, University of Zagreb, Croatia, using a Philips PW 3040/60 X’Pert PRO powder diffractometer (45 kV, 40 μA), with CuKα-monochromatized radiation (λ = 1.54056 Å) and θ-θ geometry. The area between 4° and 63° 2θ was measured with a 0.5° primary beam divergence at 0.02° steps. Compound identifications from the bulk samples were based on a computer program X’Pert high score 1.0B and literature data. Highly oriented samples of the <2 μm fraction were prepared for clay mineral identification on air-dried, ethylene–glycol saturated, and heated (at 400 °C and 550 °C, respectively) samples according to the procedure described by [41]. The XRD analysis of the Fe–Mn crust, hardpan, was performed on samples from core IG 15-1-1106GC.

2.2.5. Sulfide Mineral Chemistry

The heavy fraction of sediments was separated using sodium polytungstate of 3.1 g/cm3 density. For the purpose of this study only sulfides found in the heavy fraction were used. They were mounted into a crystal bond and subsequently polished. Polished samples were investigated using a Zeiss Merlin Compact VP field emission SEM using the EDS detector at the UiT. The analyses were carried out in a high vacuum regime at 20 kV accelerating voltage, 20 s counting time, and with an aperture of 60 µm.

2.2.6. Sequential Extraction

Metal partitioning was conducted on seven samples from HH12-004-GC by sequential extraction in five steps based on the improvement of the three-step method [42] described by Standards, Measurements and Testing Program of the European Union [43]. In the first step, nitrate acid (0.5 M, 20 mL) was agitated with dried solids for 16 h (exchangeable fraction). In the second step, acetic acid (0.11 M, 20 mL, pH3) was agitated with the dried solids for 16 h (acid soluble fraction). In the third step, the solid particles were agitated with hydroxylammonium chloride (0.1 M, 20 mL, pH 2) for 16 h (reducible fraction). In the fourth step, the solid particles were agitated with hydrogen peroxide (8.8 M, 5 mL) for 1 h, subsequently heated for an hour at 85 °C, then liquid was evaporated at 85 °C. The solid fractions were cooled down to room temperature, and agitated with ammonium acetate (1 M, 25 mL, pH 2) for 16 h (oxidizable fraction). In the fifth step the remaining solid particles were digested by 9 M HNO3 (20 mL) and autoclaved for 30 min at 200 kPa, 120 °C (residual fraction). The liquids from each step were analyzed for metals by ICP-OES.

2.2.7. Thermodynamic Modelling

Visual Minteq Version 3.1 [44], a freeware to simulate chemical equilibrium models and to calculate metal speciation, mineral solubility and sorption capacities in natural waters [45], as well as the geochemical modelling software PHREEQC [46] were used to calculate Cu speciation and Cu-mineral solubility applying the concentrations of major dissolved components defined for on-land and submarine conditions.

3. Results

3.1. Type 1 Samples: Cu-Ore Mineralization

3.1.1. The Ulveryggen Cu Sediment Hosted Ore Deposit

The dominant Cu sulfides at the Ulveryggen deposit are bornite, chalcopyrite and chalcocite (Figure 3A,C), and these sulfides form simple intergrowths [47]. Chalcopyrite grain size is more than 1 cm in diameter (Figure 3A), and Chalcocite is abundant at the Ulveryggen deposit, forming grains more than 150 μm long (Figure 3C).

3.1.2. The Nussir Cu Sediment Hosted Ore Deposit

The mineralogical study demonstrated that major ore minerals at the Nussir deposit are chalcopyrite and bornite, with minor amounts of chalcocite and galena (Figure 3B,D). The chalcopyrite from the Nussir deposit forms both irregular grains and veins/exsolutions within bornite (Figure 3B,D). The grain size is about 0.6 mm in diameter and the vein width is approximately 10 μm. Chalcocite forms minor inclusions in bornite at the Nussir deposit. Pyrite has euhedral to subhedral shape and is often surrounded by chalcopyrite [32]. The trace element analyses of chalcopyrite deposit reveal that the concentrations of potentially toxic elements, such as As, Cd, Se, Sb, and Hg, are below their detection limits (Table 1). However, the chalcopyrite is enriched in Ni (100 ppm) and contains detectable amounts of Zn (310 ppm), Co (85 ppm), Sr (48 ppm), V (5 ppm), Tl (3.69 ppm) and Bi (0.3 ppm).
The bornite contains elevated concentrations of Cr (140 ppm), V (27 ppm) and Ga (6 ppm), but only 2 ppm of Co, 0.96 ppm of Tl and 0.1 ppm of Bi. The Ni and Zn concentrations are below their detection limits.

3.2. Types 2 and 3 Samples: Natural and Tailing-Affected Marine Sediments from Repparfjorden and Overbank Sediments from Repparfjordelva

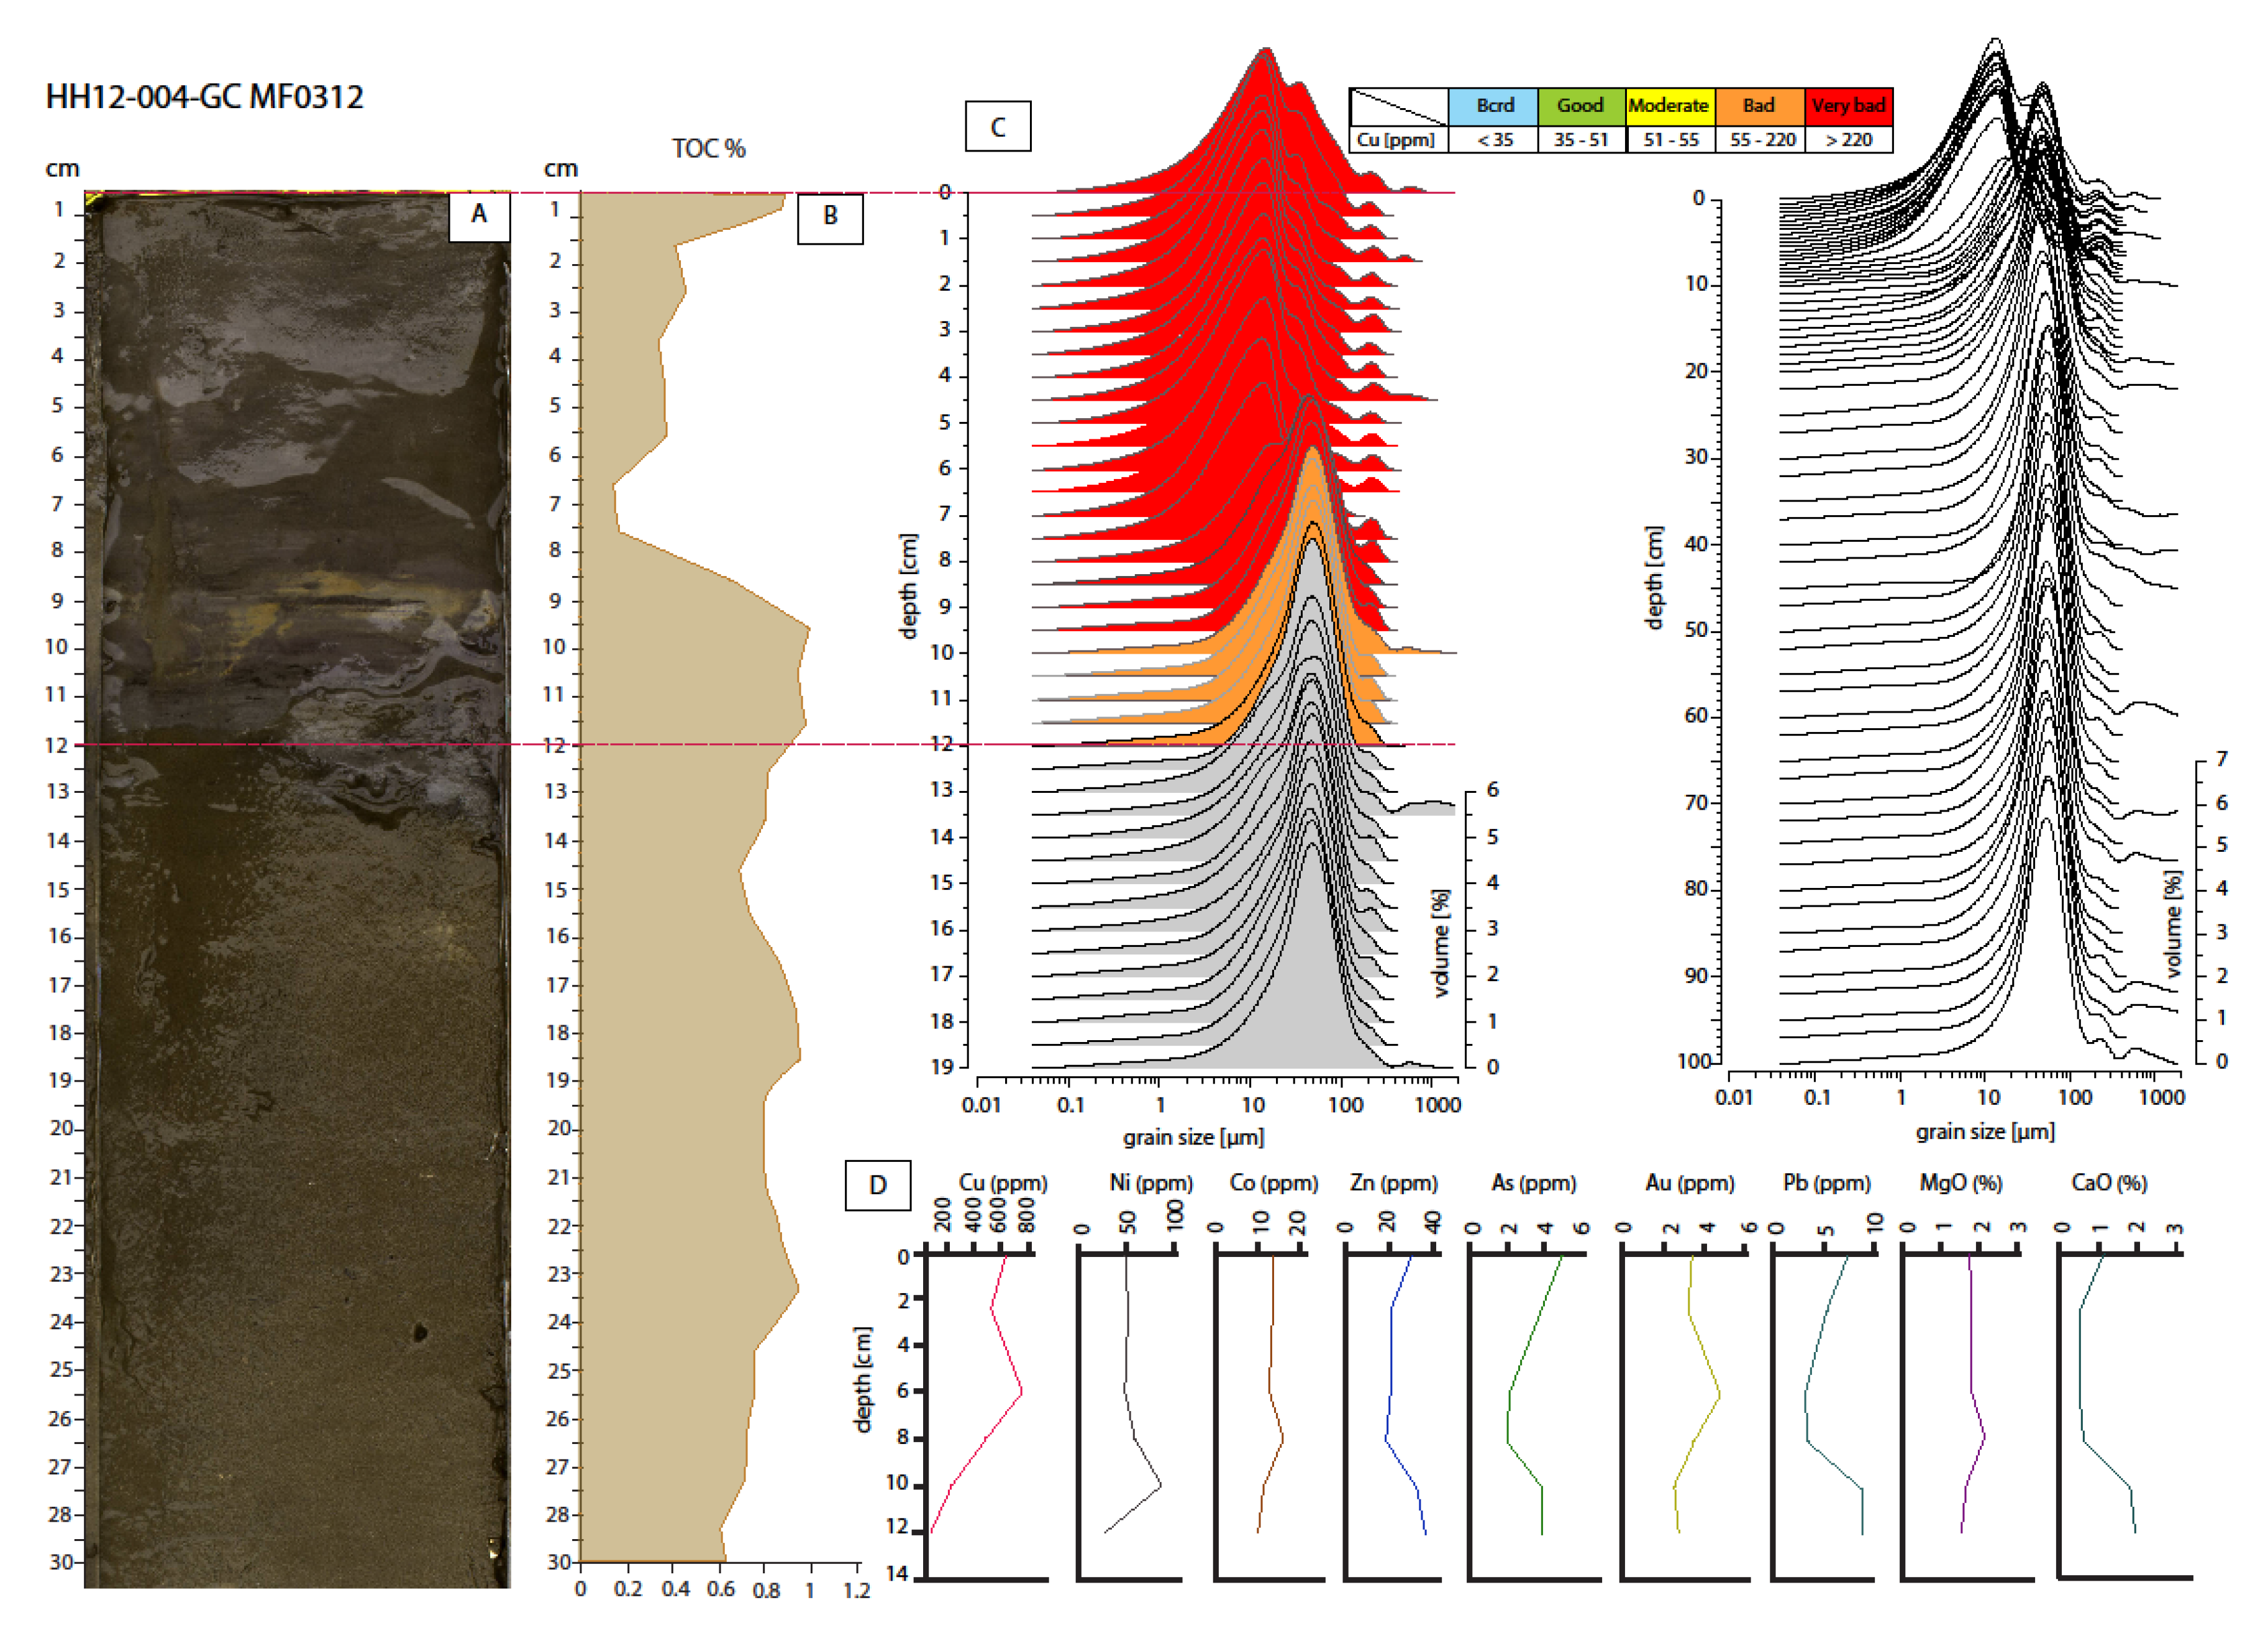
3.2.1. Total Organic Carbon (TOC)

TOC content in core HH12-004-GC (Figure 4A) varies from 0.13 to 1.04 wt.% (Figure 4B; Appendix B). The interval between 1 and 8 cm depth is characterized by depletion in organic matter content, with a minimum of 0.15 wt.% between 6.5 and 7.5 cm (Figure 4B; Appendix B). From 9 to 30 cm depth the TOC varies from 1.04 to 0.61 wt.% and generally decreases, down to values as low as 0.13 wt.% (Figure 4B; Appendix B).

3.2.2. Lithogeochemistry

Marine Sediments

The uppermost twelve centimetres of the marine sediments from core HH12-004-GC are characterized by small variations in the contents of major elements: SiO2 (68.10 to 71.26 wt.%), CaO (0.50 to 1.94 wt.%), Fe2O3 (3.73 to 5.05 wt.%) and Al2O3 (10.60 to 12.52 wt.%) (Table 2). However, Cu, Ni, Cr and Ba have elevated concentrations, especially in the samples taken from the uppermost 10 cm. In this interval, the Cu concentration varies from 237.6 up to 747.7 ppm, and decreases to 86.6 ppm at 12 cm depth. The Ni content varies from 49.0 to 87.0 ppm in the uppermost 10 cm interval and decreases to 27.0 ppm at 12 cm depth. Barium is particularly high in the uppermost 8 cm, ranging from 1097 to 1377 ppm. Arsenic and Hg concentrations range from 2 to 5 ppm and from 0.02 to 0.04 ppm, respectively. The Pb and Zn contents vary from 3.2 to 8.7 ppm and 19 to 37 ppm, respectively. Cadmium was below the detection limit in all analyzed samples (Table 2; Figure 4D).

River Sediments

The SiO2 content in the river sediment (Table 1, Sample Rpelv) is 70.69 wt.%, while CaO is 1.65 wt.%. Fe2O3 and Al2O3 contents are 3.66 wt.% and 9.82 wt.%, respectively. The Cu content in river sediments is 10 ppm while Cr and Ni have concentrations of 100 ppm and 50 ppm, respectively. Furthermore, the sample contains 561 ppm of Ba, 18 ppm of Pb and 40 ppm of Zn. The As concentration was below 5 ppm (Table 2).

3.2.3. Grain-Size Analysis

The granulometric composition of HH12-004-GC varies between sandy silt in the uppermost 0.5 cm (mean: 14.1 µm), silt dominates between 0.5 and 8 cm depth (mean: 7.6 to 11.6 µm), and sandy silt below 8 cm (mean: 20.6 and 51.8 µm; Figure 4C; Appendix C).

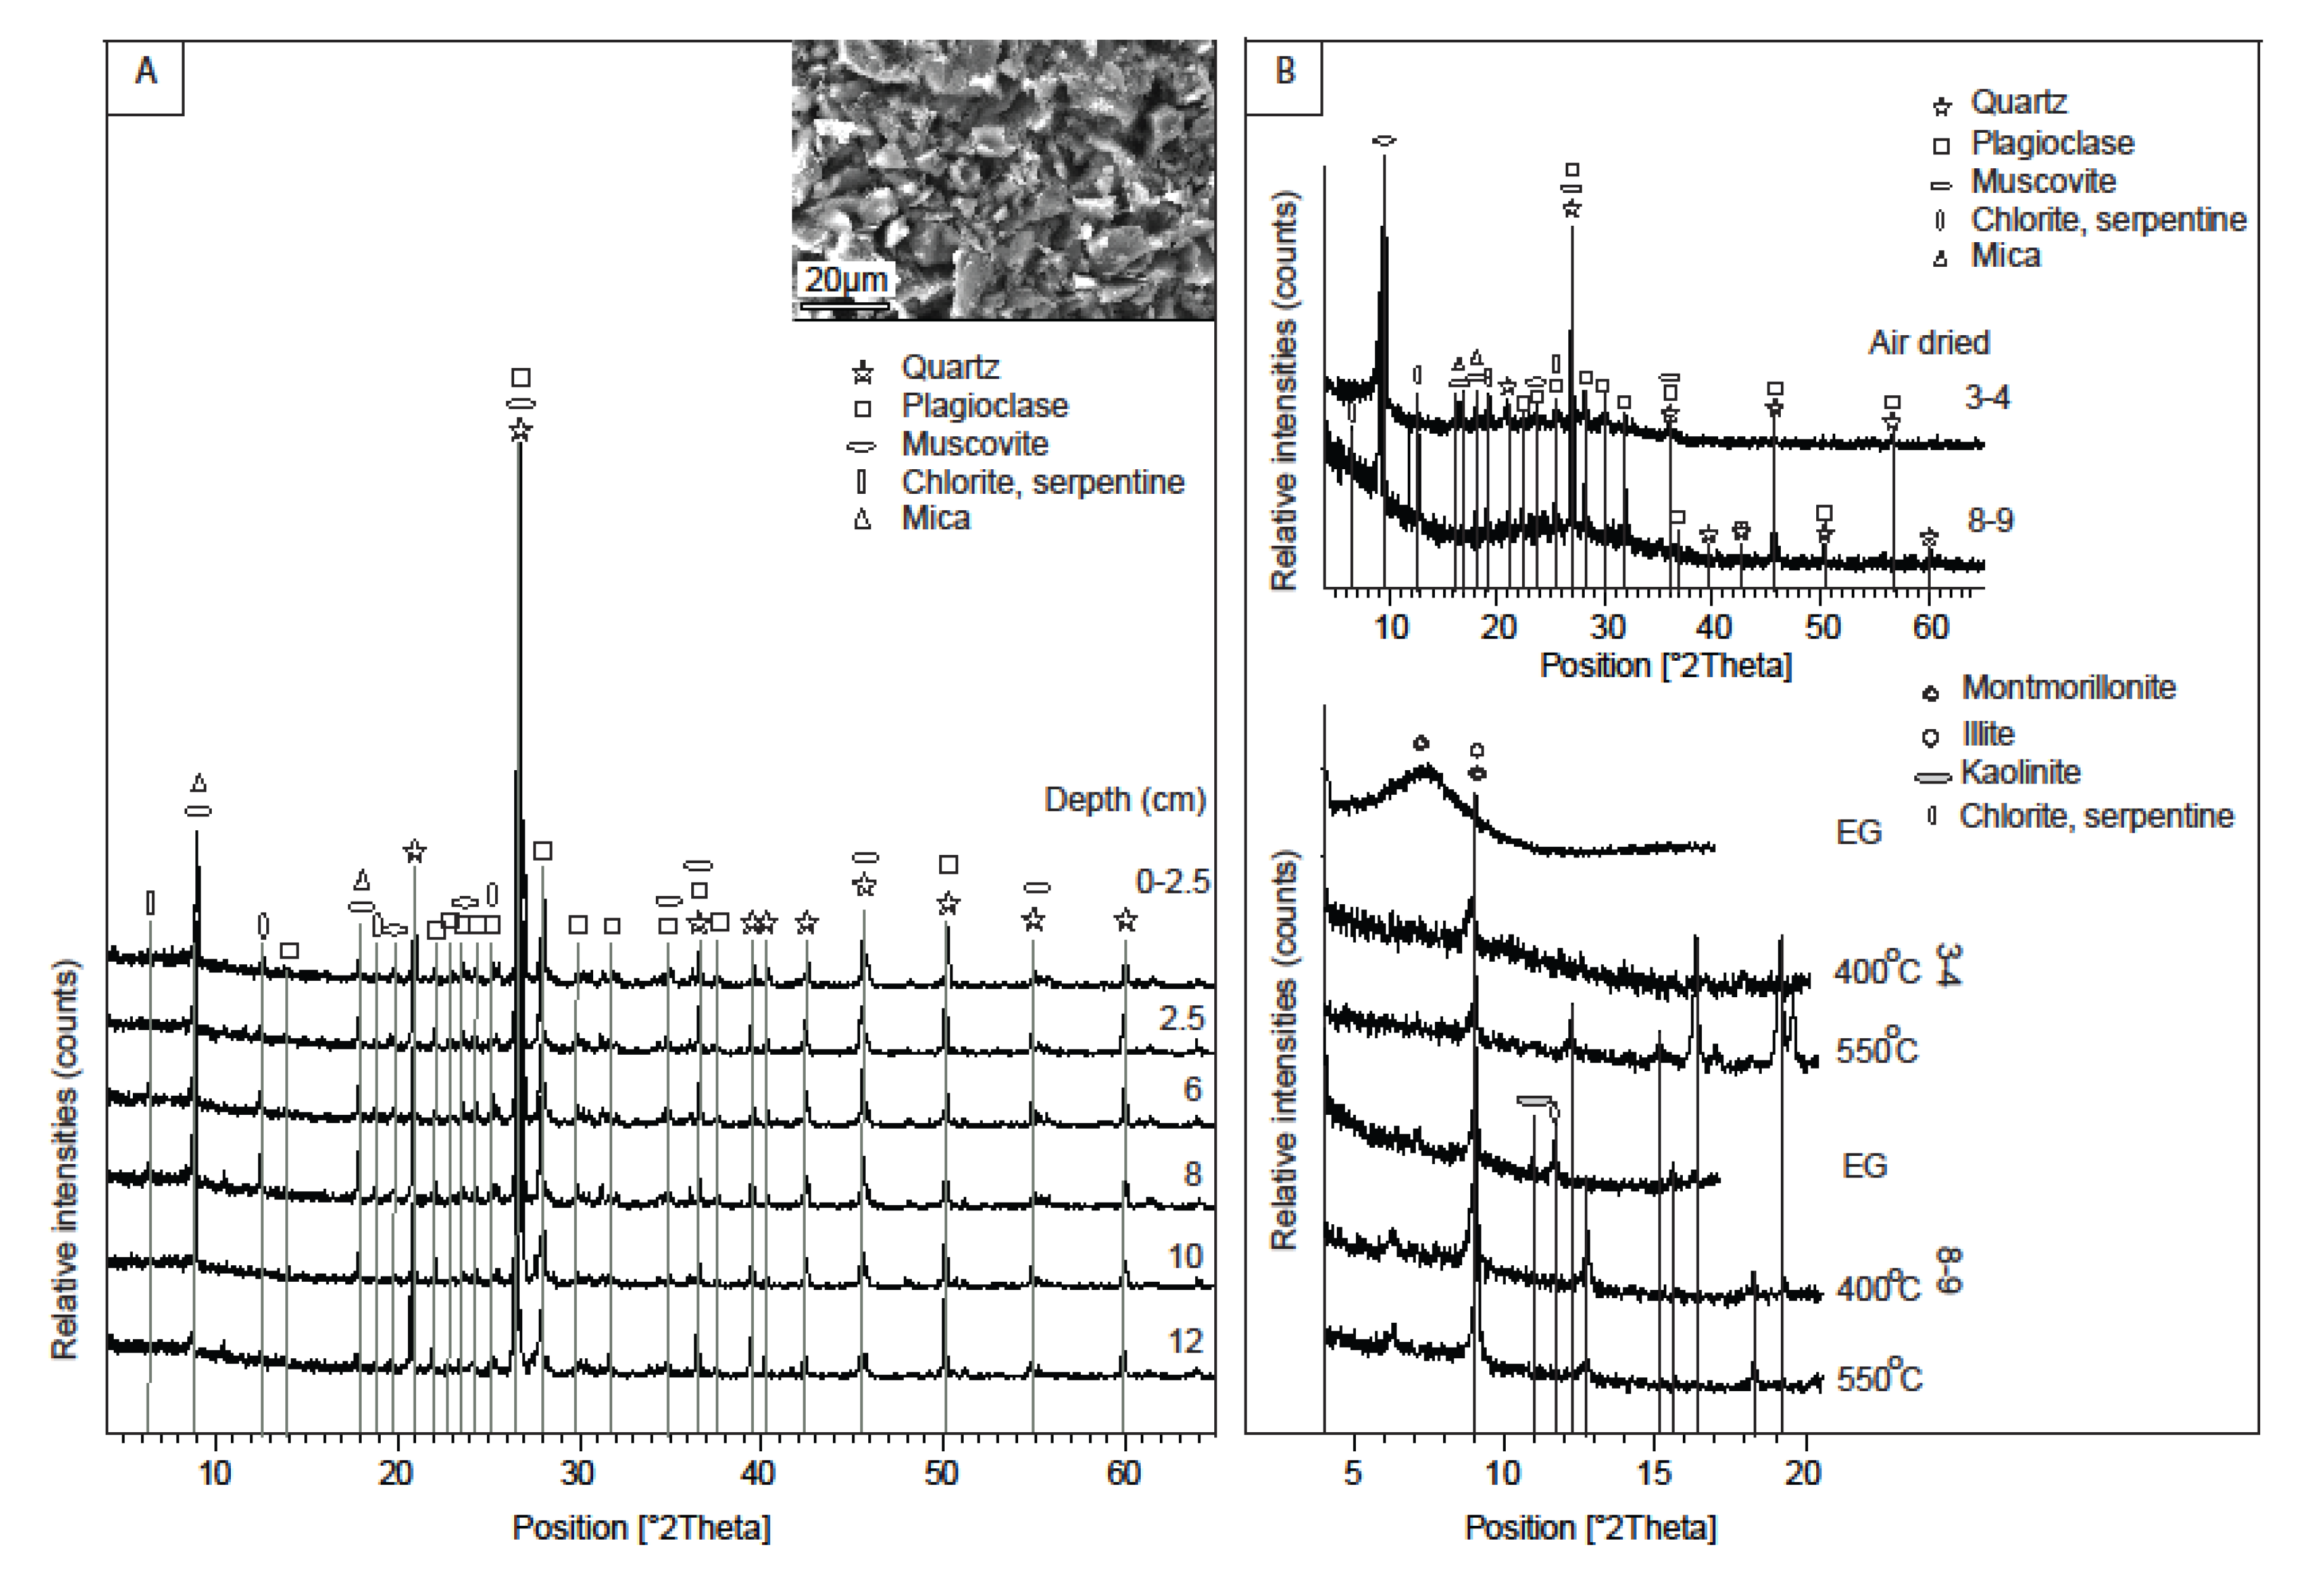
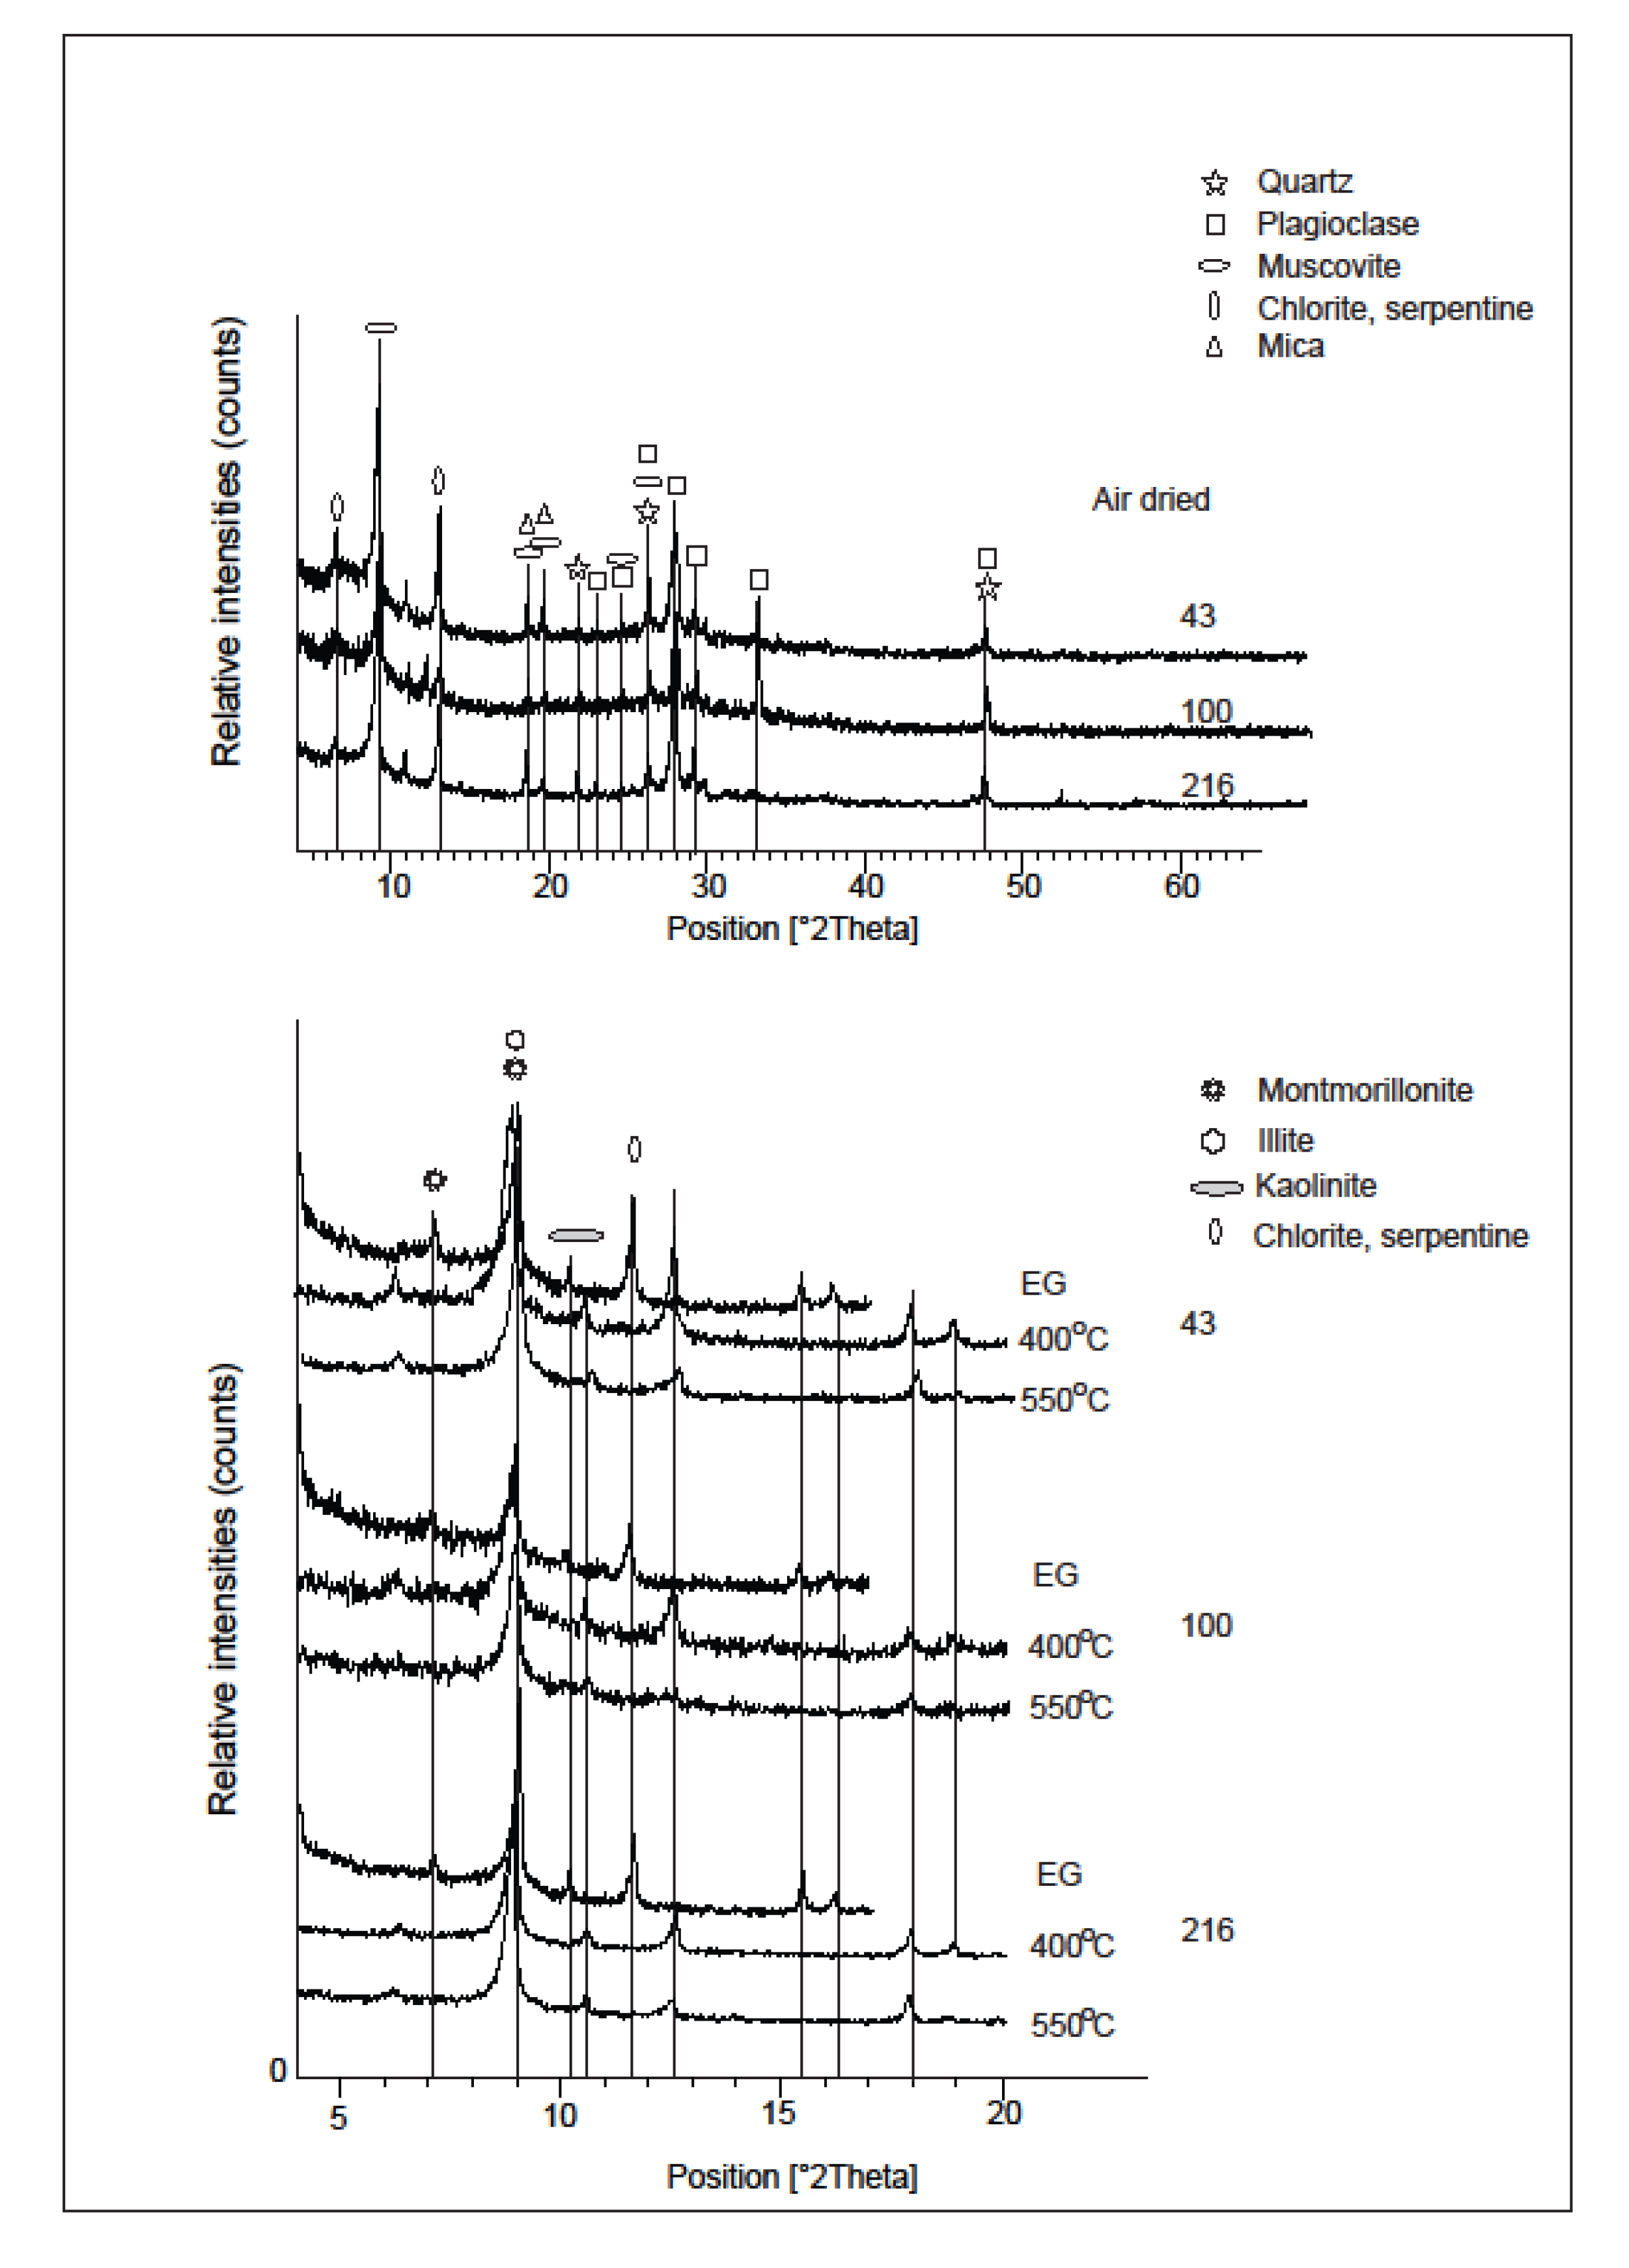
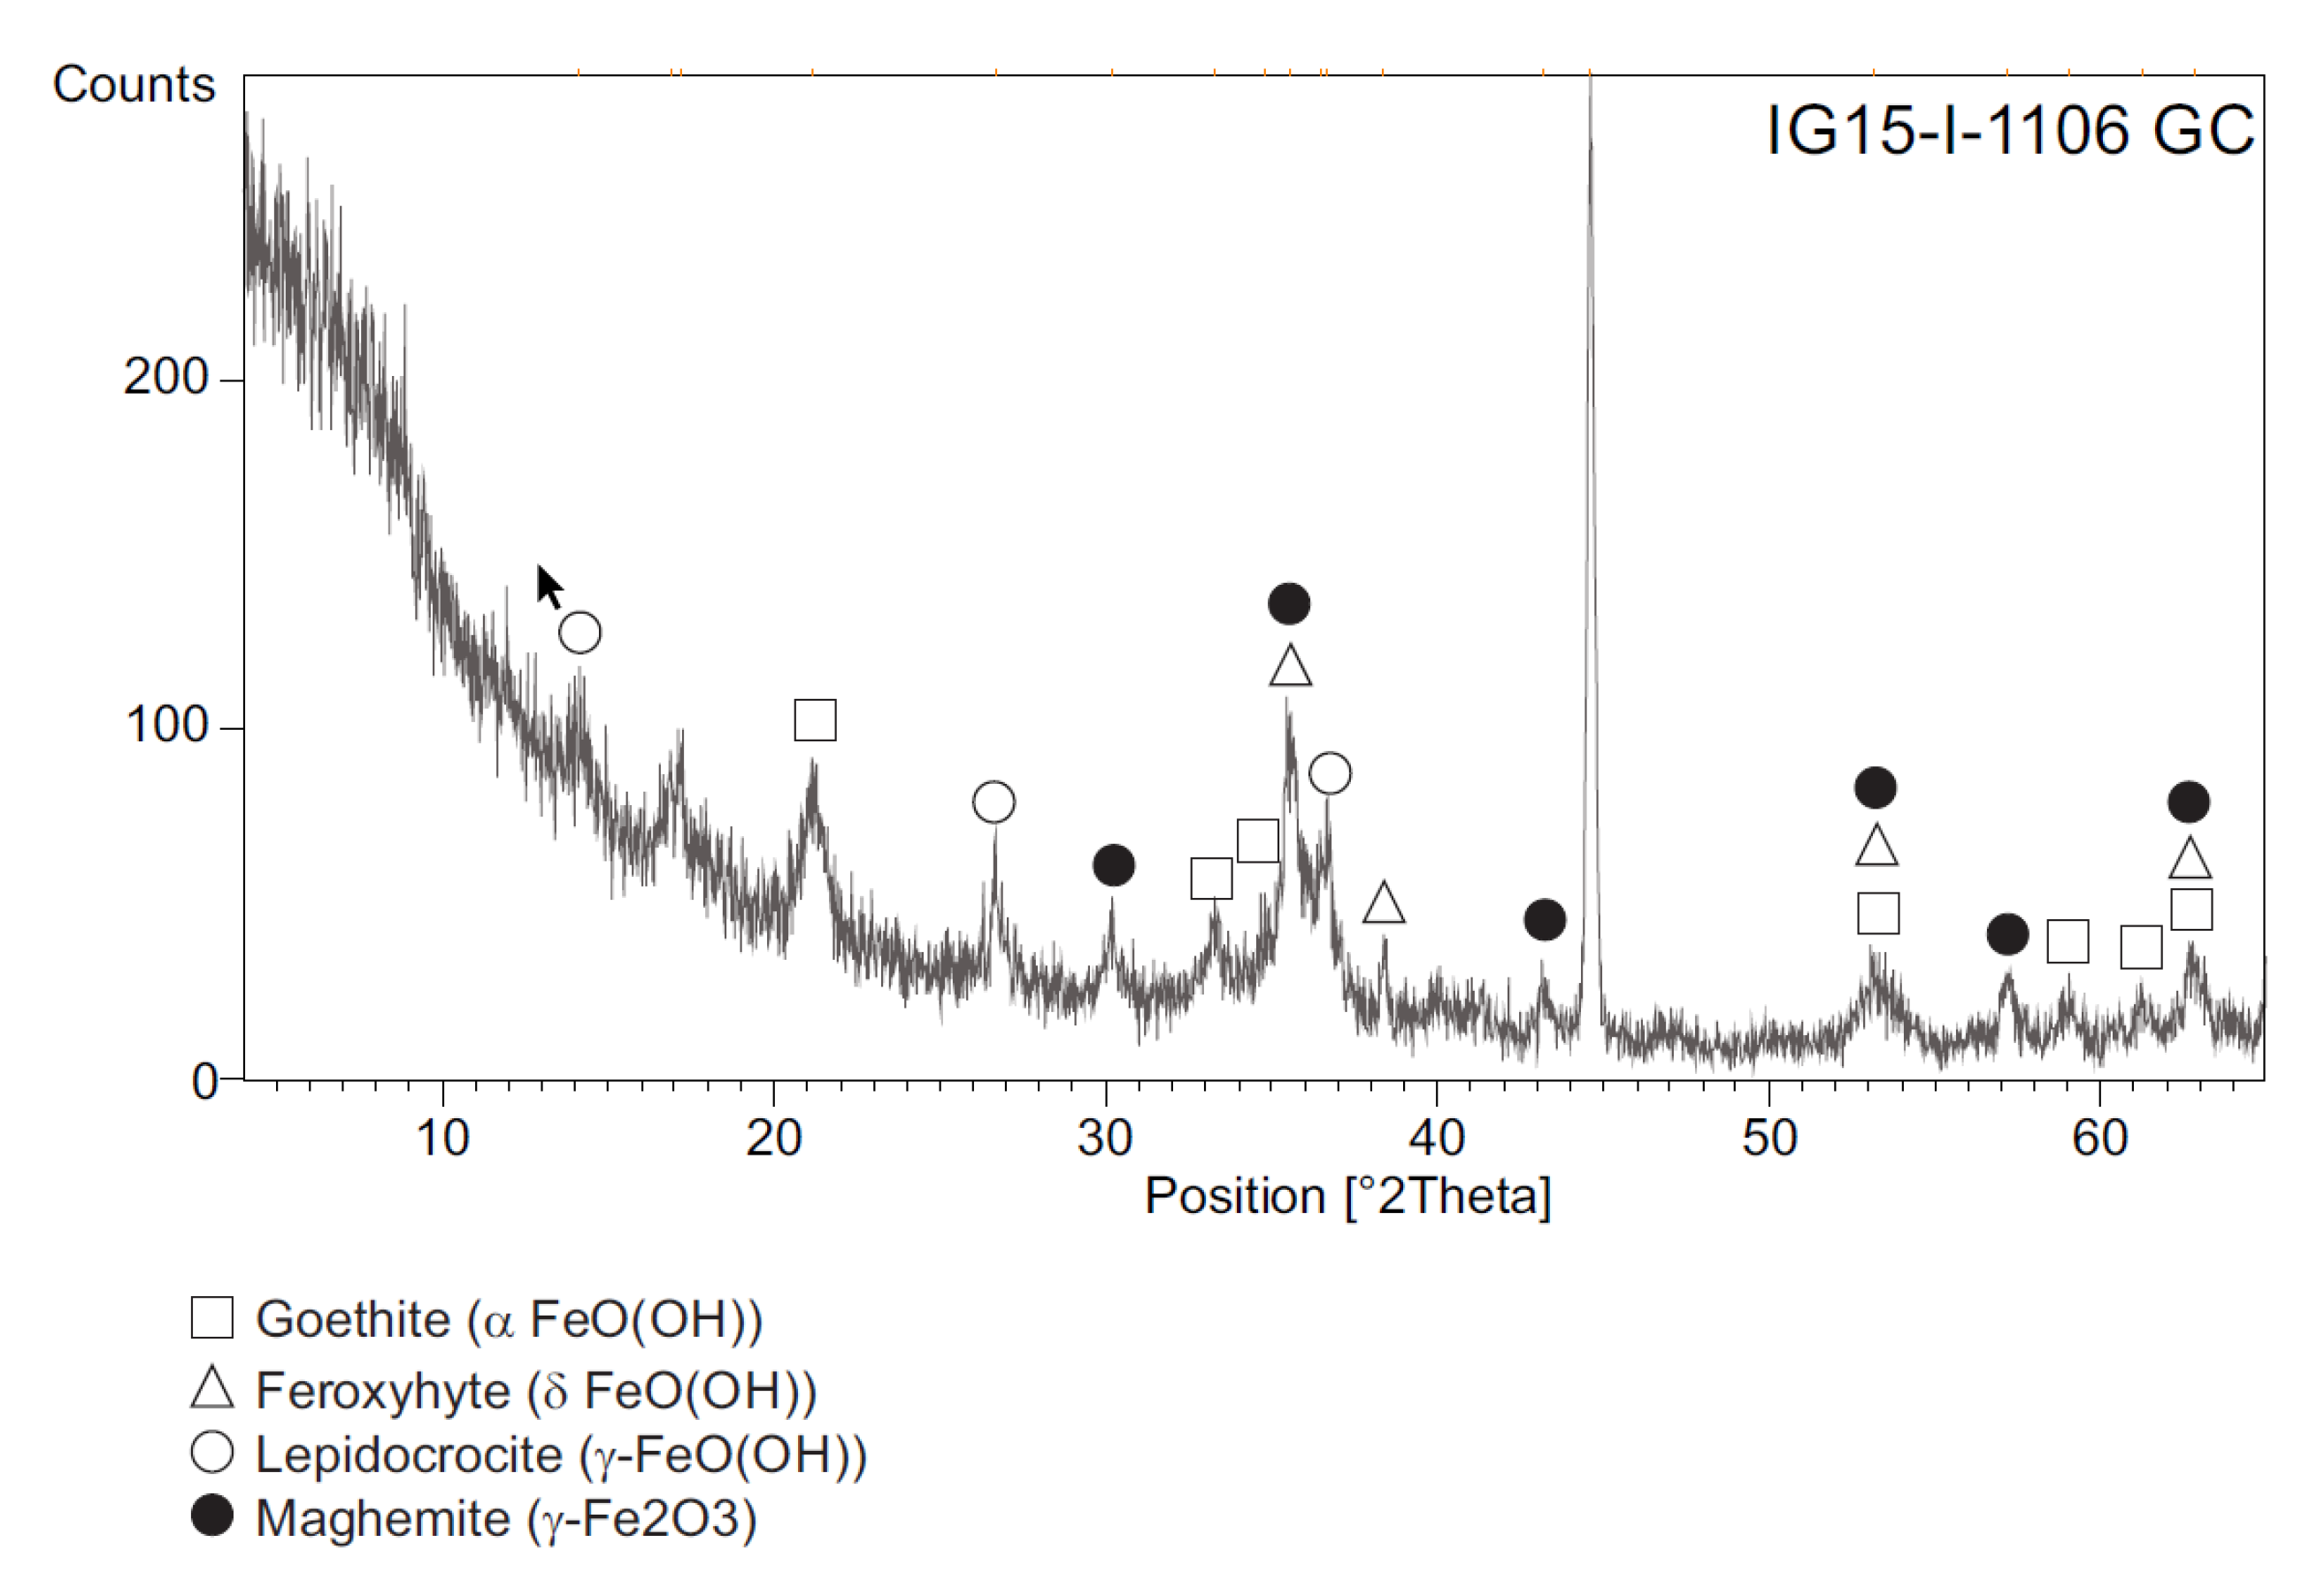
3.2.4. X-Ray Diffraction (XRD)

The bulk XRD analyses of sediments sampled up to 12 cm depth from core HH12-004-GC revealed that quartz, plagioclase, muscovite, chlorite/serpentine and micas, in addition to sulfides, are the most common minerals in the sediments retrieved from Repparfjorden (Figure 5A). Clay mineral analyses revealed the presence of an expandable clays montmorillonite between 3 and 4 cm, together with the non-expandable illite. Both montmorillonite, illite, as well as kaolinite and chlorite/serpentine are present between 8 and 9 cm depth (Figure 5B). The marine sediments from deeper depths in core HH12-004-GC (43 cm, 100 cm, 216 cm) contain montmorillonite, as well as non-expandable clays such as kaolinite, illite and chlorite (Figure 6).
The hard, schist-like hardpan material found in core IG 15-1-1106GC is mostly composed of amorphous Fe–Mn oxyhydroxides. XRD analysis revealed the presence of goethite (α-FeO(OH)), feroxyhyte (δ-FeO(OH)), lepidocrocite (γ-FeO(OH)), and maghemite (γ-Fe2O3) (Figure 7).

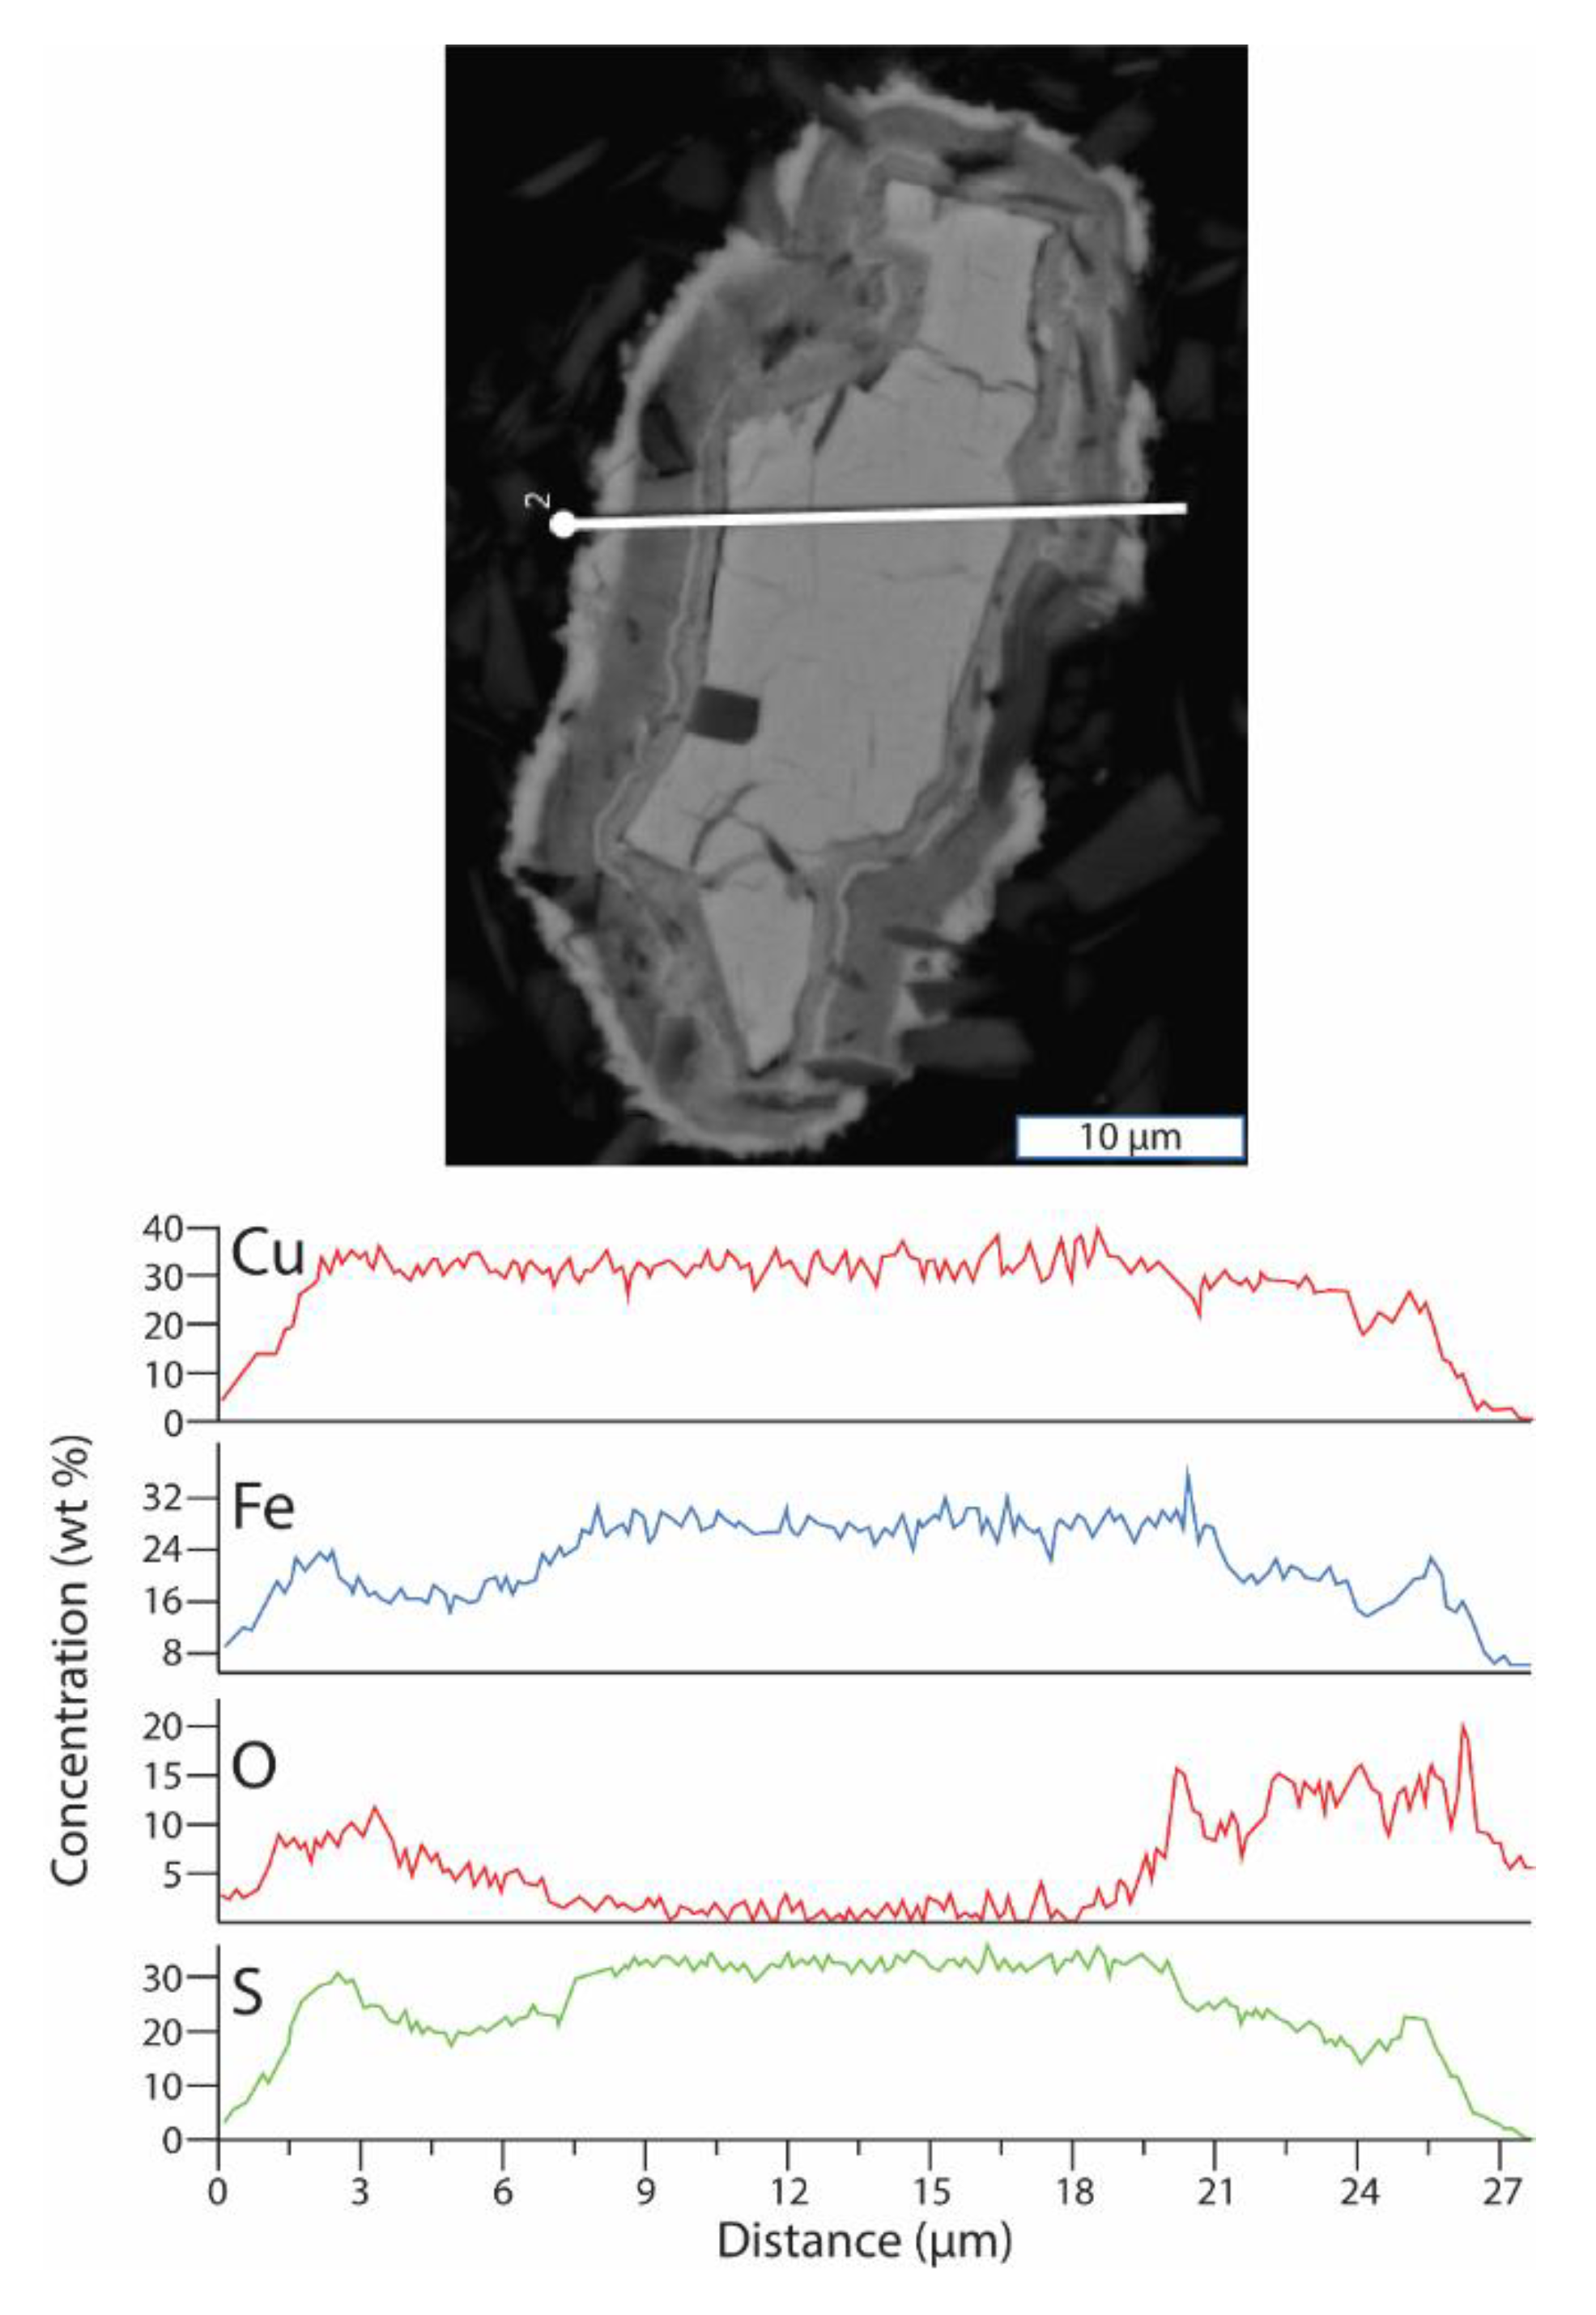
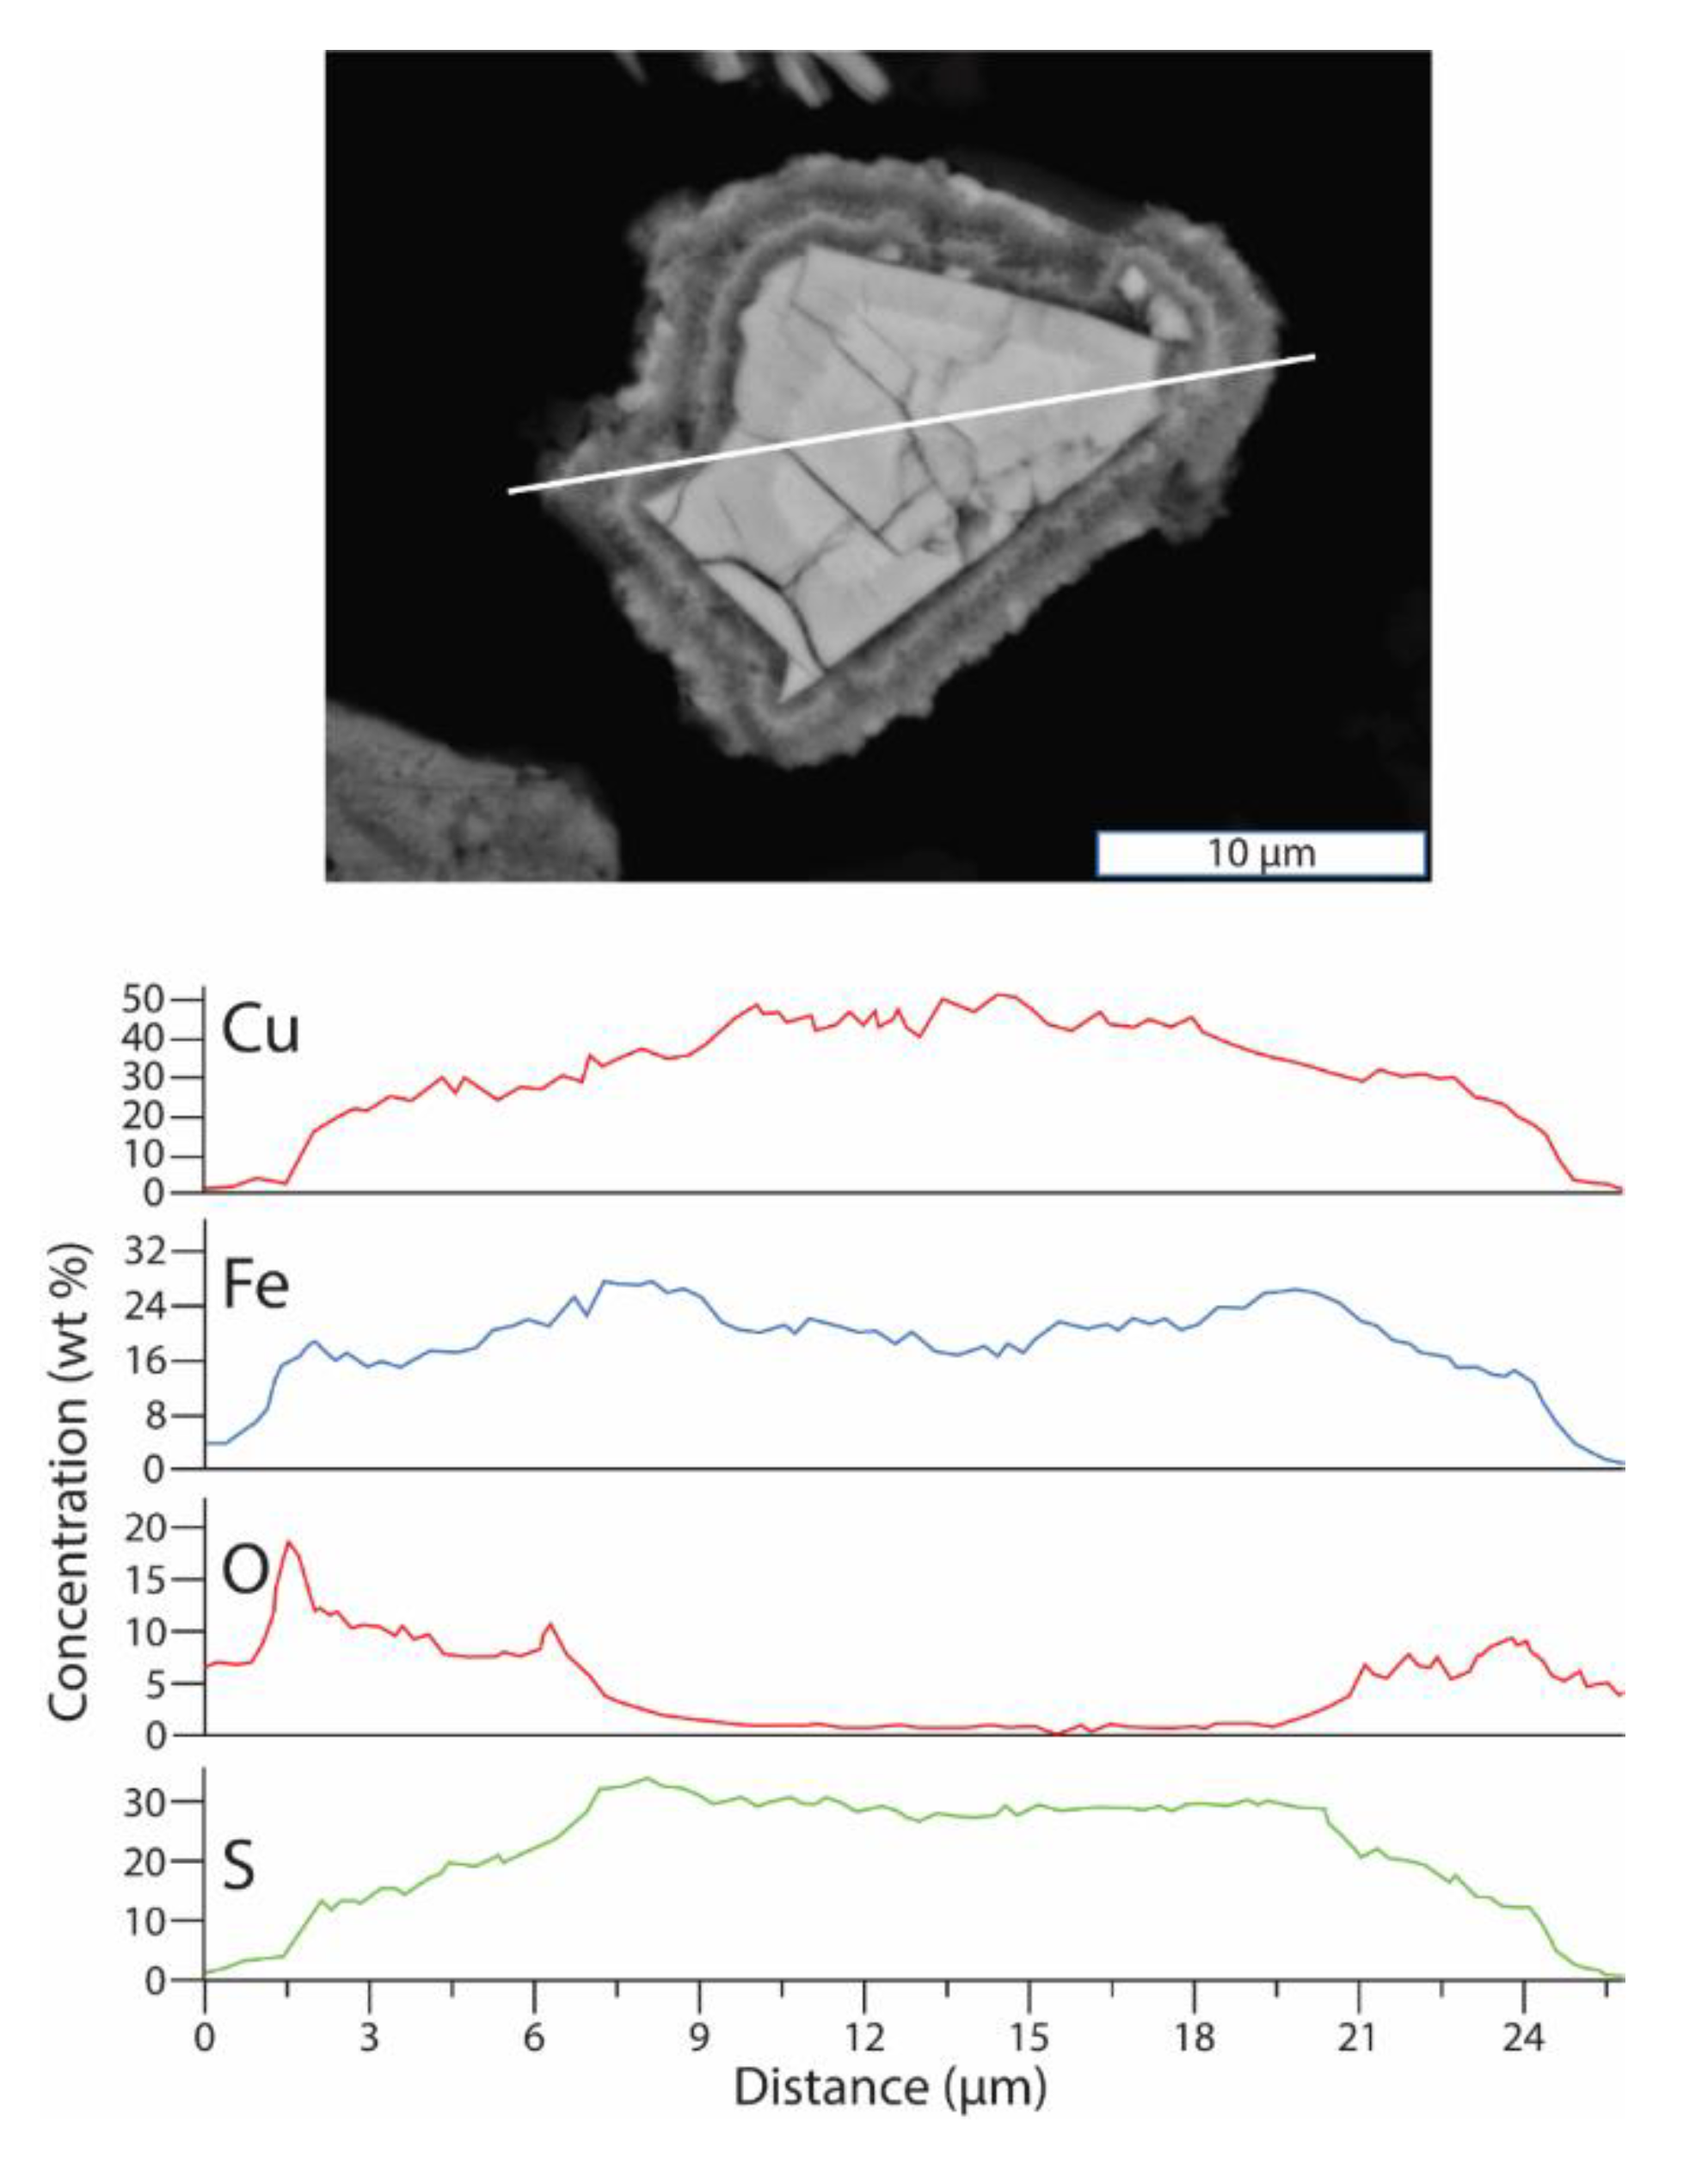
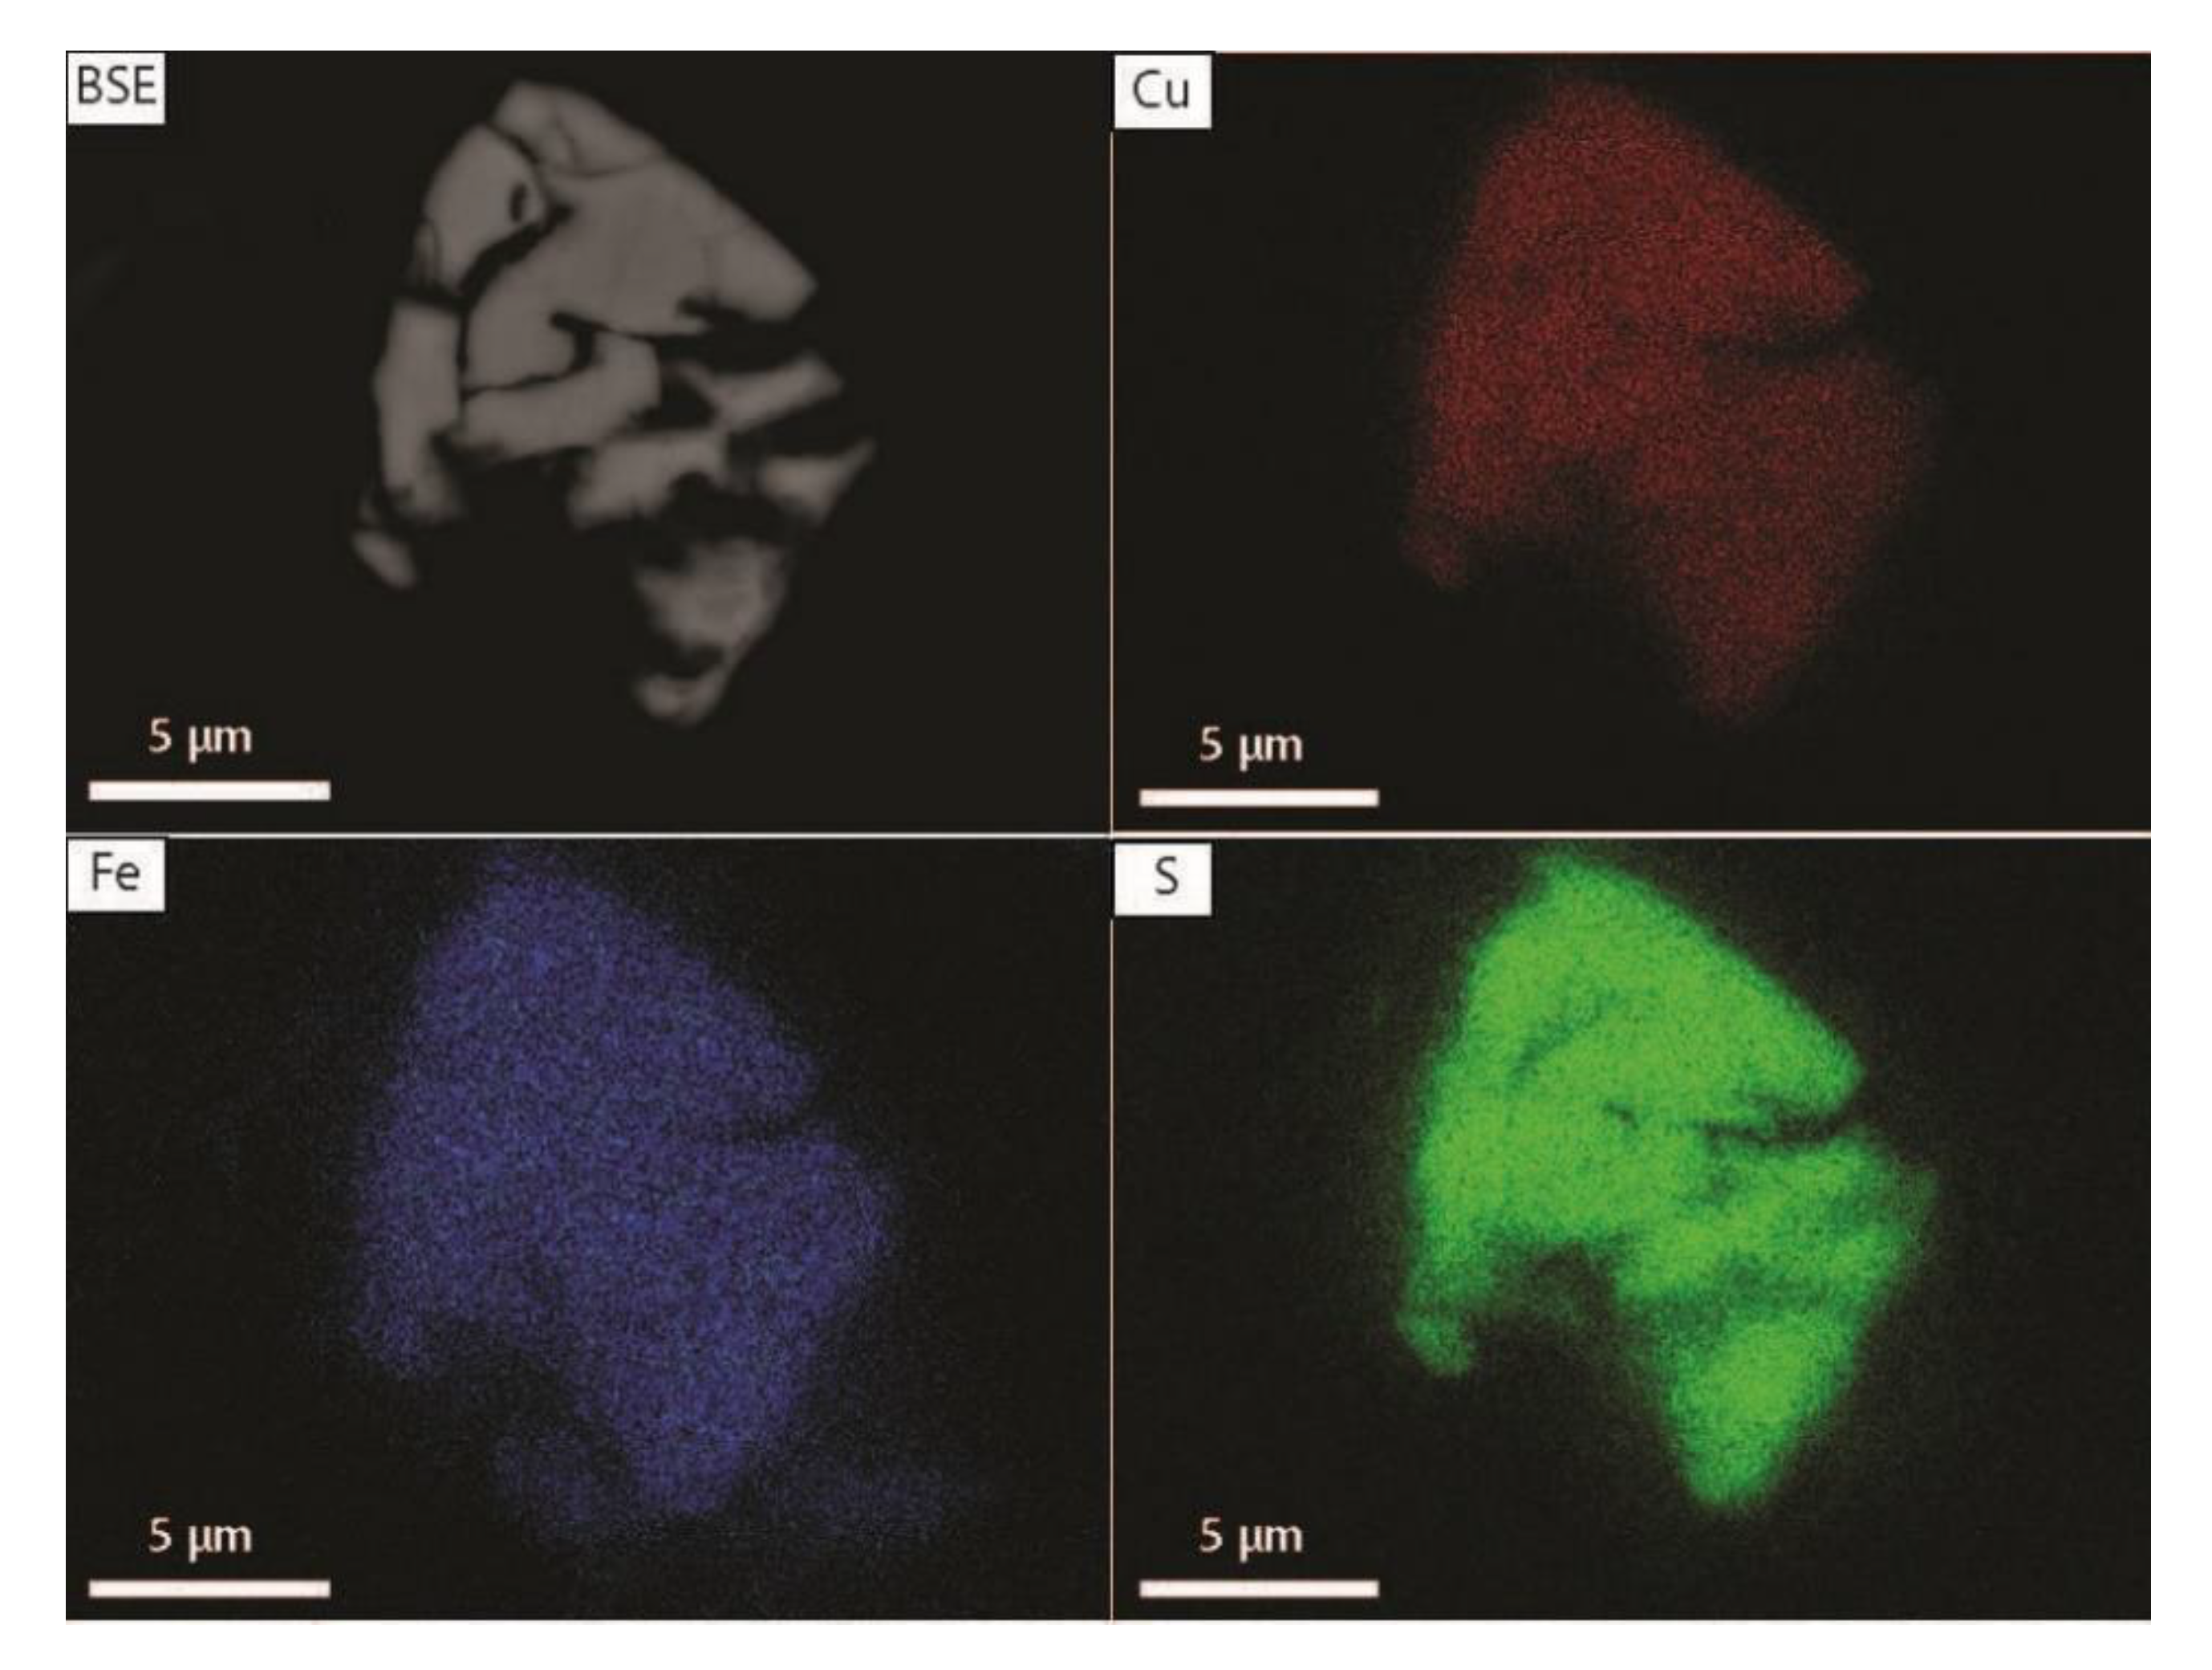
3.2.5. Sulfides Mineral Chemistry

The analyses of the heavy mineral fraction of core HH-12-004-GC revealed that the sizes of the sulfides varied between 5 to 35 µm. In the uppermost part of the core (3–4 cm), chalcopyrite was present in a form of fresh, but also partly oxidized, grains composed of an oxidized rim and well-preserved cores (Figure 8, Figure 9 and Figure 10). In contrast, signs of weathering are absent in bornite and pyrite (Figure 11 and Figure 12). In the samples from deeper parts of the core, all Cu-sulfides are well-preserved (Figure 13). At the depths of 167 and 216 cm, pyrite, chalcopyrite, sphalerite, as well as native Au are present (Figure 13B–D). Their grain sizes vary from 1 up to 50 µm. There are no signs of weathering on the grains from deeper depths. Additional SEM investigations of mounted heavy concentrates from multi-cores IG15-1-1079/1089MC and IG15-1-1039BC at 3–4/7–8/8–9/11–12/14–14.5 cm depth showed similar results to that from gravity core HH12-004-GC at 0–4/3–4/7–8/8–9/11–12 cm depth (Figure 14 and Figure 15).

3.2.6. Sequential Extraction

Sequential extraction demonstrates that metal partitioning is different in sediments affected by mine tailings compared to those that are unaffected (Appendix D; Figure 16). In the upper part of the core (3–4 cm), 45% of Cu is bounded with the acid-soluble fraction, i.e., Cu is incorporated in carbonates. Reducible, oxidizable, and exchangeable fractions each contain 15 wt.% of total Cu. In the reducible fraction Cu is incorporated into Fe/Mn hydroxides, oxyhydroxides and/or oxides. Copper bounded in organic matter or sulfides represent the oxidizable fraction that dissolves under oxidizing conditions. The oxidizable fraction becomes more stable deeper in the sediment due to the availability of oxygen. The residual fraction is represented by stable, hardly soluble minerals such as ex. silicates, accommodating approximately 10 wt.% of total Cu. In contrast, at 43, 100, 155, 167, 181 and 216 cm depth, 45–67 wt.% of total Cu is bound in the residual fraction while the acid-soluble fraction hosts 5 to 20 wt.% of total Cu. Bonding to the oxidizable fraction is slightly higher at 100 cm depth (approximately 27 wt.% of total Cu).
In the samples from 3–4, 43 cm and 216 cm depths, the accommodation of total Ba by the residual fraction is 31 wt.%, 47 wt.%, and 50 wt.%, respectively, whereas it is 80 wt.% to 87 wt.% at 100, 155, 167 and 181 cm (Figure 16). In the 3–4 cm interval, 30 wt.% of Ba is bound to the reducible fraction and around 20 wt.% to the exchangeable fraction. The partitioning of Zn among different fractions is relatively similar at the different depths. Approximately 43 wt.% to 63 wt.% of total Zn is accommodated within the residual fraction, 15 wt.% to 25 wt.% is bound in the oxidizable fraction, and about 10 wt.% to 12 wt.% to the reducible and acid-soluble fractions, respectively. The exchangeable fraction hosts around 7 wt.% of total Zn in the 3–4 cm interval, while the values do not exceed 2 wt.% in all other intervals. Manganese, Mg, Al, K, Cr, Ni and Fe are predominantly hosted by the residual fraction regardless of the depth (Appendix D).

3.2.7. Thermodynamic Modelling

Thermodynamic modelling was performed for Cu speciation in carbonate-free and carbonate-buffered submarine systems, as well as in atmospheric conditions. The results indicate that the Cu speciation in aqueous solutions is controlled by the pH value and available complexation ligands (Figure 17). In the carbonate-free system, Cu2+ is the predominant Cu species at pH values below 8, while CuCl+ and CuSO4(aq) contribute with approximately up to 17% and 15% respectively (Figure 17A). In the pH range between 8 and 11, Cu3(OH)42+ and CuOH+ are the most abundant species, whereas Cu(OH)3− would prevail in a more alkaline environment (Figure 17A). If the submarine tailing system is rich in carbonates, the main Cu species in acid conditions would be Cu2+ and CuHCO3+ (Figure 17B). In near-neutral solutions CuCO3(aq) represents the main species. In alkaline solutions various Cu–hydroxide complexes prevail (Figure 17B).
The calculations performed for on-land disposal conditions (t = 5 °C, oxygen saturated solution, no carbonates presented, low total salinity) revealed that at low to neutral pH conditions Cu2+ is the prevailing Cu species. At pH values between approximately 8 to 10, Cu(OH)2(aq) is dominant, whereas in more alkaline solutions Cu(OH)3 is the prevailing species (Figure 15).
The solubility of Cu-sulfides is controlled by the pH value and redox potential of infiltrating waters (Figure 18), and chalcopyrite solubility is negligible in anoxic carbonate-free marine sediments over the whole range of pH values (Figure 18A). In contrast, thermodynamic modelling suggests that in a carbonate-buffered anoxic system the solubility of chalcopyrite is slightly greater in the acid and near-neutral pH range, due to the stabilization of CuHCO3+ and CaCO30 complexes (Figure 18B). In on-land conditions, where Cu-sulfides are in contact with oxygen-rich meteoric waters, their solubility is very high, especially in the low pH range (Figure 18C).

4. Discussion

4.1. Geochemistry of the Repparfjorden Submarine Tailings

The submarine tailings in Repparfjorden are limited to the inner fjord and can be traced up to 9 cm depth below the seafloor ([24,27] and this study). As previously discussed, they contain mine waste from historic mining activities in the Ulveryggen deposit. The Ulveryggen ore mineralogy is characterized by the domination of sulfides, a low carbonate content and high Fe2+/Fe3+ and S2−/SO42− ratios (e.g., [30,32]). All these features classify Ulveryggen to a group of deposits with a high risk for the generation of acid rock drainage (Equation (1); [48]):
4 FeS2 + 15 O2 + 14 H2O 4 Fe(OH)3 + 16 H+ + 8 SO42−.
Chemical analyses of ore minerals from the Ulveryggen and Nussir deposits (Table 1) revealed that most of the potentially toxic metals and metalloids, including As, Cd, Se, Sb, and Hg, are below their detection limits.
The grain-size and TOC analyses of the gravity core HH-12-004-GC (Figure 4B,C; Appendix B and Appendix C) revealed that the mine tailing affected sequence is dominated by silty material with a relatively low TOC content. In contrast, natural marine sediments below the tailing are composed of more coarse-grained sandy silt and contain more organic material (Figure 4B,C; Appendix C). Low TOC content, accompanied by elevated Cu concentration (Figure 4), suggests that the mine tailing disposal led to diminished biological activity and/or was a result of physical distortion of mostly benthic fauna created by artificial placement of large masses of fine-grained material (see ex. [49,50,51]). The SEM analyses revealed that the main sulfide minerals such as chalcopyrite, bornite, and pyrite are mostly well-preserved in the submarine tailings, as well as in the underlying marine sediments (Figure 8; Figure 11, Figure 12 and Figure 13A,D; Figure 14 and Figure 15). Only chalcopyrite sampled from the uppermost sequence of the tailing occasionally shows traces of oxidation (Figure 9 and Figure 10). A potential reason for the selective oxidation could be a faster reaction of chalcopyrite with oxygen dissolved in the water column along the path between the discharge pipeline outlet and the sea bottom, compared to other sulfide minerals [52] or even during mineral processing.
The lithogeochemical data revealed high Cu concentrations in sediments between the seafloor and approximately 10 cm depth, with a maximum concentration at 6 cm (Table 2, Figure 4D). Iron, Ni, Cr and Ba are enriched in this part of the sequence, compared to uncontaminated marine sediments (Table 1). Other potentially toxic elements such as Zn, As, Pb, Cd, and Hg are comparable to background concentrations (Table 2; [28,53]). Comparison to the geochemistry of riverine sediments from the Repparfjordelva (Table 2), as well as till and stream sediments reported for Finnmark County [27], and references therein) reveal that the relatively high concentrations of Ni and Cr are typical for bedrocks in the area. These two elements derive from mafic metavolcanics that represent the main lithology of the Repparfjord Tectonic Window [30,31,32,54,55,56]. In contrast, Ba can originate from multiple sources, both anthropogenic and natural. [23] considered that Ba in the mine tailing sediments was released from minerals during the mineral processing activity. [24] links elevated Ba contents to primary mineralization in the Repparfjord Tectonic Window [56,57]. Furthermore, [32] have found that barren carbonate–siliciclastic rocks of the Repparfjord Tectonic Window are enriched in Ba and may contain up to 3500 ppm of Ba.
Fe-rich hardpan, found locally at depths of approximately 20 cm below seafloor, are composed of Fe-oxy-hydroxides (Figure 7) and enriched in immobile elements [27]. Their high Fe3+/Fe2+ ratio requires formation in oxidative conditions unrealistic for organic matter bearing marine sediments. Alternatively, Fe-rich hardpan enriched in immobile elements can be a product of descending pore waters that carry Fe3+ and other immobile elements from seafloor in contact with oxygen-rich seawater, but such transport would require acidic conditions that are not possible in seabeds infiltrated with seawater (e.g., [58,59]). Therefore, their origin remains unknown.
The SEM analyses of heavy mineral concentrates from deeper marine sediments (up to 216 cm depth) demonstrated that natural marine sediments in Repparfjorden contain the same sulfide minerals as the submarine tailings (i.e., chalcopyrite, bornite, pyrite), but in significantly lower concentrations. These sulfide minerals are well-preserved with no signs of oxidation processes (Figure 11). Their trace element chemistry corresponds to the trace element content of the primary sulfide mineralization in the Repparfjord Tectonic Window [32].
Sequential extraction was performed to get a better insight into the geochemical behavior of the selected suite of elements, including potentially toxic metals (Figure 14, Appendix D). Copper is the only analyzed element that shows a significant difference in its distribution between the tailings (sample from 3–4 cm depth) and uncontaminated marine sediments. Copper is predominately bound to the acid-soluble phase in the tailings, whereas it is mostly associated with the inert residual phase in the uncontaminated sediments. Although Ni and Cr show elevated concentrations in both the tailings and the marine sediment samples, they are bound to the residual phase, and represent constituents of mafic silicate minerals such as olivine, pyroxenes and amphiboles. In contrast, Ba is predominantly hosted within the reducible phase in the uppermost part of the sequence, suggesting BaSO4 as its main mineral phase. The negligible solubility of BaSO4 in seawater makes Ba immobile and reduces its bioavailability. In contrast, in deeper (anoxic) sediments in environments influenced by sulphate-reducing bacteria Ba may become mobilized and bioavailable [60,61]. The uncontaminated sediments mostly host Ba bonded to the residual phase (i.e., within a crystal lattice of feldspars).

4.2. Thermodynamic Modelling of Cu Sulfide Stability in Submarine vs. On-Land Tailing Disposal Sites

The historical tailings site contains waste material from the carbonate-poor Ulveryggen deposit, whereas future mining activities are planned at the carbonate-rich Nussir deposit. In both cases, chalcopyrite and bornite are the main ore minerals, and the tailings site will be infiltrated with seawater with a limited oxygen fugacity (e.g., [62]). Thus, we performed thermodynamic modelling to predict solubility of Cu sulfides in both carbonate-free and carbonate-buffered systems. The results demonstrated that pH and available ligands control the complexation of Cu (Figure 15). On-land disposal of future mine tailings from the Nussir and Ulveryggen deposits was one of the alternatives having little consequences for marine environment [26]. Therefore, we have performed the thermodynamic modeling of chalcopyrite oxidation in atmospheric conditions. Here we do not consider the terrain, structural control on rock sliding, and high precipitation in the Repparfjord area.
In near-neutral to slightly alkaline conditions buffered with carbonates, CuCO3(aq) is the main the Cu species (Figure 15). The presence of carbonates increases the solubility of Cu sulfides. Therefore, the formation of bicarbonate- and carbonate-Cu complexes and their role in the stability of Cu-minerals should be taken into consideration in the planning of future submarine tailings from the Nussir carbonate-rich Cu deposit. For comparison, excessive amounts of dissolved oxygen and resulting low pH of infiltrating waters are typical for on-land tailings. These conditions dramatically increase the solubility of copper sulfides, indicating that the prevention of ARD is the most critical factor in chemical stabilization of on-land disposal sites (Figure 16).

4.3. Physicochemical Factors that Control the Oxidation of Sulfides

In addition to pH, redox potential, and temperature of aqueous solutions, the grain size is an important factor that controls sulfide oxidation kinetics [7,63]. In general, fine-grained sulfides react faster than coarse-grained sulfides due to an exponential increase in their surface areas [64]. The mineral processing of Cu ores requires grinding of the ore prior to flotation and extraction [65], and the historical tailings in Repparfjorden contain mostly silt-sized sulfide particles (mean 7.6 to 11.6 µm; Appendix C). In addition to sulfides, the tailings contain silty silicates and rare carbonates that may buffer the system and prevent the formation of ARD. However, the acid formation due to sulfide oxidation is a fast process that starts within the first hours to weeks after the exposure of sulfides to an oxygen-saturated aqueous solution (e.g., [6]). The initial dissolution of carbonates is also a relatively fast process that may buffer the system. In contrast, although some silicate minerals have a high buffering capacity (e.g., [66,67,68]), weathering of silicates takes much longer, from decades to hundreds of years [63,64].
According to laboratory simulations [69], the tailing material from the future planned operations in the Nussir and Ulveryggen deposits will contain 90% of grains with sizes between 100–130 µm and 10% of the material with grain sizes of 4–6 µm. The Nussir ore will be grinded to finer fractions than the Ulveryggen ore due to softer materials being enriched in the carbonates, in contrast to Ulveryggen where quartz and feldspar dominate ([27] and references therein). However, according to the thermodynamic modelling presented in this study (Figure 17B), the presence of carbonates in submarine tailings may lead to the formation of Cu-bicarbonate and carbonate complexes, and increase their solubility (Figure 17B and Figure 18B).
The presence of impurities and/or intergrowth of two or more sulfide minerals may result in galvanic reactions and promote the dissolution of sulfide minerals even in near-neutral solutions (e.g., [64,70,71]). The mineral parageneses of the Ulveryggen and Nussir deposits are relatively simple, and apart from intergrowth of chalcopyrite with sphalerite and bornite, other intergrowths are not common (Figure 3). However, the disposed waste material contains a fine-grained mixture of several sulfides with very different rest potentials, including pyrite (0.63 V; [72], chalcopyrite (0.54 V; [73] and sphalerite (–0.24 V; [74]). In interactions with oxygen-rich seawater sphalerite may act as an anode (Equation (2)):
ZnS Zn2+ + S0 + 2e
and prevents oxidation of Cu-sulfides reacting with oxygen adsorbed on their surface:
½ O2 (aq) + 2H+ + 2e H2O
but at the same time this process increases leaching of Zn into the tailing pore water. From this aspect, the submarine disposal sites must be kept in anoxic conditions, regardless of the pH value of infiltration aqueous solutions.

5. Conclusions

Multi-proxy analyses of sediment cores from Repparfjorden, a historical submarine disposal locality in northern Norway, as well as primary ore and thermodynamic modelling of sulfide oxidation were undertaken with the purpose of obtaining a better insight into potential environmental impacts of Cu-sulfide tailings disposed in submarine conditions. Our study complements previous studies from [23,24] and [27]. The main Cu sulfides present at the Nussir and Ulveryggen deposits are chalcopyrite and bornite, which contain low amounts of potentially toxic elements such as Cd, As, Hg, Sb, and Bi, diminishing the environmental threat of these deposits. In addition, some deposits, including the Ulveryggen sediment-hosted Cu deposit, have a low carbonate content. Galvanic interaction between sulfide minerals is negligible due to relatively simple mineral assemblages. Redox potential and pH of the infiltrating aqueous solutions are the key factors that control the stability of Cu sulfides in on-land tailings, as well as in submarine tailings. In addition, the presence of carbonates in submarine anoxic conditions may lead to the formation of soluble Cu-bicarbonate and carbonate complexes and promote Cu-sulfide solubility in acid and near-neutral conditions. This factor should be considered when planning the disposal of mine tailings generated from the Nussir deposit that is predominantly hosted by dolomites.
The historical submarine tailings contain elevated concentrations of Cu. The concentrations of Pb, Zn, As, Hg and Cd are close to the background values and those found in riverine sediments from Repparfjordelva (Repparfjord River) entering the fjord from the east. The presence of these elements in marine sediment can be, therefore, explained by their compatibility with mafic host rocks widely spread in the Repparfjord Tectonic Window. Copper in the mine tailings is predominantly bound to acid soluble phase while in the deeper natural marine sediments it is bound to residual phase. The sulfide minerals found in the marine sediments are generally well-preserved except for chalcopyrite, which shows the signs of incipient weathering that might have occurred before the deposition, during mineral processing. The locally present hardpan is likely the product of sliding of previously oxidized host rocks.

Author Contributions

Investigation, Y.M., S.S.P.; analysis, Y.M., K.B.P., K.N., D.T.; data curation, B.S., Y.M.; resources, S.S.P., J.J., M.F.; writing—original draft preparation, Y.M.; writing—review and editing, B.S., K.B.P., J.J., M.F., S.S.P., K.K.; supervision, S.S.P.; funding acquisition, K.K. All authors have read and agreed to the published version of the manuscript.”

Funding

This research was funded by Troms Fylkeskommune, as well as SINTEF through the PhD project of the main author (RDA12/167). The publication was funded by UiT Arctic University of Norway.

Acknowledgments

We thank the crews and participants during the scientific cruises on RV Helmer Hanssen in 2012 and 2015 for support during data collection, the laboratory staff at the Department of Geosciences at the UiT, The Arctic University of Norway for their support during data analyses, as well as Torger Grytå for his help with the maps. Furthermore, we thank the Norwegian Geological Survey for providing us with samples from Repparfjordelva. We also thank Calvin Shackleton for the help with correction of the text. The publication charges for this article have been funded by a grant from the publication fund of UiT The Arctic University of Norway.

Conflicts of Interest

The authors declare no conflict of interest.

Appendix A

Table A1. List of samples of marine sediment retrieved from Repparfjorden: location, depths and methods applied. A–F tube cores were obtained from MC and A–B/C from BC. (B) means that B cores were used for this study.
Repparfjord
Coordinates Methods
Core #Core TypeDate of RetreavalLatitude [N]Longitude [E]Water Depth [m]Length (cm)Sample #/Depth (cm)Grain SizeTOCXRD BulkXRD ClayLithogeochemistrySequential ExtractionSEM Heavy Concentrates
H12-004-GC MF0312GC2012/3/1770°28.191′024°17.248′612220-0.5 ٧٧٧ ٧
0.5–1.0٧٧
1.0–1.5٧٧
1.5–2.0٧٧
2.0–2.5٧٧٧ ٧
2.5–3.0٧٧
3.0–3.5٧٧ ٧ ٧
3.5–4.0٧٧ ٧ ٧٧
4.0–4.5٧٧
4.5–5.0٧٧
5.0–5.5٧٧
5.5–6.0٧٧٧ ٧
6.0–6.5٧٧
6.5–7.0٧٧
7.0–7.5٧٧
7.5–8.0٧٧٧ ٧
8.0–8.5٧٧ ٧ ٧
8.5–9.0٧٧ ٧ ٧
9.0–9.5٧٧
9.5–10.0٧٧٧ ٧
10.0–10.5٧٧
10.5–11.0٧٧
11.0–11.5٧٧
11.5–12.0٧٧٧ ٧
12.0–12.5٧٧
12.5–13.0٧٧
13.0–13.5٧٧
13.5–14.0٧٧
14.0–14.5٧٧
14.5–15.0٧٧
15.0–15.5٧٧
15.5–16.0٧٧
16.0–16.5٧٧
16.5–17.0٧٧
17.0–17.5٧٧
17.5–18.0٧٧
18.0–18.5٧٧
18.5–19.0٧٧
19.0–19.5٧٧
19.5–20.0٧٧
20.0–20.5٧٧
22.0–22.5٧٧
25.0–25.5٧٧
27.0–27.5٧٧
30.0–30.5٧٧
32.0–32.5٧
35.0–35.5٧
37.0–37.5٧
40.0–40.5٧
42.0–42.5٧
43 ٧ ٧ ٧٧
45.0–45.5٧
47.0–47.5٧
50.0–50.5٧
52.0–52.5٧
55.0–55.5٧
57.0–57.5٧
60.0–60.5٧
62.0–62.5٧
65.0–65.5٧
67.0–67.5٧
70.0–70.5٧
72.0–72.5٧
74.5–75.0٧
77.0–77.5٧
80.0–80.5٧
82.0–82.5٧
85.0–85.5٧
87.0–87.5٧
90.0–90.5٧
92.0–92.5٧
95.0–95.5٧
97.0–97.5٧
100.0–100.5٧٧ ٧ ٧٧
128 ٧ ٧
155٧٧ ٧ ٧٧
160 ٧ ٧
167٧ ٧ ٧٧
181 ٧ ٧٧
188 ٧
216 ٧ ٧ ٧٧
IG-15-1-1039 (B)BC2015/6/2370°27.566′024°17.178′4414.5*3–4 ٧
7–8 ٧
8–9 ٧
11–12 ٧
14–14.5 ٧
IG-15-1-1079 (B)MC2015/6/2470°28.153′024°17.530′61203–4 ٧
7–8 ٧
8–9 ٧
11–12 ٧
14–14.5 ٧
IG15-1-1089 (B)MC2015/6/2470°28.397′024°18.000′57203–4 ٧
7–8 ٧
8–9 ٧
11–12 ٧
14–14.5 ٧
IG15-1-1106-GCGC2015/6/2470°28.201′024°17.200′62core catcher ٧

Appendix B

Table A2. Total organic carbon (TOC) content in core HH12-004-GC.
Sample Mass (g)Sample Depth (cm)TOC (%)
0.49090–10.8909
0.47851–20.4123
0.46442–30.4439
0.45093–40.3519
0.46154–50.3816
0.45185–60.3842
0.46956–70.1502
0.46617–80.1647
0.45948–90.6465
0.45079–101.044
0.466010–110.8656
0.469611–120.9594
0.458512–130.8393
0.454913–140.8016
0.461714–150.7526
0.493615–160.7796
0.478516–170.8708
0.475017–180.9035
0.463218–190.9467
0.472219–200.8281
0.471720–210.8283
0.457521–220.8204
0.470922–230.8456
0.457023–240.9155
0.455924–250.7628
0.459325–260.7681
0.488226–270.7248
0.451627–280.6990
0.453728–290.6321
0.459929–300.6052
0.494943–440.5989
0.45711000.5086
0.47361550.2574
0.45431670.2643
0.48431880.1327
0.45052160.1614

Appendix C

Table A3. Grain-size distribution of gravity core HH12-004-GC.
Depth [cm]Textural Group:% Sand:% Mud:% Silt:% Clay:
0−0.5Sandy Silt13.3786.6377.688.95
0.5–1.0Silt8.4191.5981.919.69
1.0–1.5Silt6.5593.4582.8210.63
1.5–2.0Silt7.1192.8981.3211.57
2.0–2.5Silt4.6995.3183.3211.99
2.5–3.0Silt4.4295.5884.2011.38
3.0–3.5Silt7.0992.9182.5810.33
3.5–4.0Silt5.2394.7783.4411.33
4.0–4.5Silt6.3793.6382.8310.79
4.5–5.0Silt7.3892.6281.1011.52
5.0–5.5Silt4.2695.7484.2011.54
5.5–6.0Silt4.4195.5984.0911.50
6.0–6.5Silt4.8095.2083.3811.82
6.5–7.0Silt4.0995.9183.6012.31
7.0–7.5Silt1.9698.0485.3012.74
7.5–8.0Silt8.9591.0580.7510.30
8.0–8.5Sandy Silt19.3680.6474.406.24
8.5–9.0Sandy Silt22.0977.9172.555.36
9.0–9.5Sandy Silt25.0574.9570.334.62
9.5–10.0Sandy Silt26.9373.0768.834.24
10.0–10.5Sandy Silt29.8470.1666.193.97
10.5–11.0Sandy Silt26.9173.0968.854.24
11.0–11.5Sandy Silt26.5573.4569.024.43
11.5–12.0Sandy Silt27.7972.2167.784.43
12.0–12.5Sandy Silt28.0871.9267.684.24
12.5–13.0Sandy Silt26.5973.4169.274.14
13.0–13.5Sandy Silt24.0975.9170.625.29
13.5–14.0Sandy Silt29.0670.9466.384.56
14.0–14.5Sandy Silt24.6975.3169.645.67
14.5–15.0Sandy Silt24.3175.6970.285.41
15.0–15.5Sandy Silt24.1275.8871.054.83
15.5–16.0Sandy Silt23.3376.6771.205.47
16.0–16.5Sandy Silt25.2074.8069.854.95
16.5–17.0Sandy Silt24.8375.1770.614.56
17.0–17.5Sandy Silt25.0174.9970.154.83
17.5–18.0Sandy Silt24.3075.7071.244.46
18.0–18.5Sandy Silt23.7776.2371.454.78
18.5–19.0Sandy Silt26.1473.8669.554.31
19.0–19.5Sandy Silt27.9572.0567.914.14
19.5–20.0Sandy Silt29.0670.9466.824.12
20.0–20.5Sandy Silt28.7171.2967.174.12
22.0–22.5Sandy Silt27.0272.9868.804.18
25.0–25.5Sandy Silt22.9377.0772.234.83
27.0–27.5Sandy Silt24.3375.6771.304.37
30.0–30.5Sandy Silt24.4275.5871.074.51
32.0–32.5Sandy Silt25.9874.0269.814.21
35.0–35.5Sandy Silt28.0671.9468.033.92
37.0–37.5Sandy Silt33.5866.4262.933.48
40.0–40.5Sandy Silt30.5869.4265.673.75
42.0–42.5Sandy Silt36.3263.6860.103.58
45.0–45.5Sandy Silt43.8856.1253.252.87
47.0–47.5Sandy Silt32.7667.2463.453.79
50.0–50.5Sandy Silt31.0968.9164.973.95
52.0–52.5Sandy Silt31.8368.1764.433.74
55.0–55.5Sandy Silt32.2067.8063.853.96
57.0–57.5Sandy Silt32.3867.6263.753.87
60.0–60.5Sandy Silt37.0562.9559.543.41
62.0–62.5Sandy Silt34.3865.6261.703.91
65.0–65.5Sandy Silt34.3465.6662.103.57
67.0–67.5Sandy Silt32.7267.2863.533.75
70.0–70.5Sandy Silt30.6669.3465.523.82
72.0–72.5Sandy Silt36.5763.4359.743.69
74.5–75.0Sandy Silt33.9966.0162.463.55
77.0–77.5Sandy Silt35.8864.1260.523.61
80.0–80.5Sandy Silt30.5269.4865.523.96
82.0–82.5Sandy Silt29.6770.3366.643.69
85.0–85.5Sandy Silt29.3670.6466.723.93
87.0–87.5Sandy Silt32.1567.8564.033.82
90.0–90.5Sandy Silt36.4263.5859.903.68
92.0–92.5Sandy Silt38.0062.0058.413.59
95.0–95.5Sandy Silt38.6761.3357.713.62
97.0–97.5Sandy Silt35.9964.0160.393.62
100.0–100.5Sandy Silt34.8565.1561.503.65

Appendix D

Table A4. Metal concentrations at different stages of the sequential extraction of metals from HH12-004-GC from corresponding depths. Step 1: reaction of sample with acetic acid; Step 2: hydroxylammonium chloride; Step 3: hydrogen peroxide; Step 4: ammonium acetate; Step 5: full digestion in autoclave with subsequent vacuum filtering. See [75] for detailed description of methods applied.
mg/kgAlBaCrCuFeKMgMnNiZn
HH12-004 3-4 Step 12.5600.7565.615325302.61.22.1
HH12-004 3-4 Step 249221.018837679111.60.44.1
HH12-004 3-4 Step 32031012.664172353555.20.63.5
HH12-004 3-4 Step 42244817571271051655.72.25.3
HH12-004 3-4 Step 551821056842874125052913712214
3-4 total5660337894071097242743674862629
HH12-004 43 Step 11.42.70.70.90.06195160.50.90.8
HH12-004 43 Step 2460.80.50.8156771446.51.34.3
HH12-004 43 Step 32340.90.80.752927894.30.85.6
HH12-004 43 Step 42431.44.02.5214691336.02.07.6
HH12-004 43 Step 597261610858277533247.931
43 total1497112215175810691415411349
HH12-004 100 Step 12.02.40.70.90.05565430.51.20.9
HH12-004 100 Step 2360.80.50.8153731628.01.64.1
HH12-004 100 Step 32110.90.80.761934944.51.05.4
HH12-004 100 Step 42611.34.93.1375771225.92.19.3
HH12-004 100 Step 5353926156.2591116681654561015
100 total4050312212705824082574751635
HH12-004 155 Step 14.25.20.61.32.18705231.11.80.7
HH12-004 155 Step 2481.30.51.4305112268181.84.0
HH12-004 155 Step 32731.50.91.5737511327.81.25.0
HH12-004 155 Step 43572.13.63.24941661679.12.47.3
HH12-004 155 Step 5620641279937328473093951523
155 total688851331610911404741831312240
HH12-004 167 Step 19.23.20.70.96.112596851.21.10.8
HH12-004 167 Step 2791.10.62.3368186257171.85.1
HH12-004 167 Step 33932.41.02.376168156101.15.6
HH12-004 167 Step 45872.73.04.2680216228122.09.3
HH12-004 167 Step 5908956351213015348847891421828
167 total1015965412214830521561141832449
HH12-004 181 Step 14.93.10.71.12.410544821.41.20.6
HH12-004 181 Step 2831.00.53.6362165184191.55.1
HH12-004 181 Step 33771.80.92.858163142111.04.5
HH12-004 181 Step 43262.02.21.5199156192112.05.3
HH12-004 181 Step 5701456239.29476339231821221324
181 total780464271810621483041821641939
HH12-004 216 Step 16.74.50.61.13.913517141.61.51.1
HH12-004 216 Step 2851.40.53.9424222230381.95.3
HH12-004 216 Step 34193.11.03.791389165201.45.6
HH12-004 216 Step 45653.12.72.2378257261162.29.3
HH12-004 216 Step 5226113118.9151010281043638.637
216 total33372516203228294724131381658

References

  1. Dold, B. Submarine tailings disposal (STD)—A review. Minerals 2014, 4, 642–666. [Google Scholar] [CrossRef]
  2. Elshkaki, A.; Graedel, T.E.; Ciacci, L.; Reck, B.K. Copper demand, supply, and associated energy use to 2050. Glob. Environ. Chang. 2016, 39, 305–315. [Google Scholar] [CrossRef] [Green Version]
  3. LePan, N. The Base Metal Boom: The Start of New Bull Market? Available online: https://www.visualcapitalist.com/base-metal-boom/2018 (accessed on 11 February 2020).
  4. Lombrana, L.M.; Farchy, J. A Million Tons of Copper is on the Way: It May not be Enough. Available online: https://www.bloomberg.com/news/articles/2019-04-07/a-million-tons-of-copper-is-on-the-way-it-may-not-be-enough (accessed on 11 February 2020).
  5. Lottermoser, B.G. Mine Wastes: Characterization, Treatment and Environmental Impacts, 3rd ed.; Springer-Verlag: Berlin/Heidelberg, Germany, 2010; p. 400. [Google Scholar]
  6. Rzepka, P.; Walder, I.F.; Aagaard, P.; Bożęcki, P.; Rzepa, G. Sub-sea tailings deposition leach modeling. Geol. Geophys. Environ. 2014, 40, 123–124. [Google Scholar]
  7. Embile, R.F., Jr.; Walder, I.F.; Mahoney, J.J. Forsterite and pyrrhotite dissolution rates in a tailings deposit obtained from column leaching experiments and inverse modelng: A novel method for a mine tailings sample. Appl. Geochem. 2018, 98, 65–74. [Google Scholar] [CrossRef]
  8. Lottermoser, B.G.; Glass, H.J.; Page, C.N. Sustainable natural remediation of abandoned tailings by metal-excluding heather (Calluna vulgaris) and gorse (Ulex europaeus), Carnon Valley, Cornwall, UK. Ecol. Eng. 2011, 37, 1249–1253. [Google Scholar] [CrossRef]
  9. Ramirez-Llodra, E.; Trannum, H.C.; Evenset, A.; Levin, L.A.; Andersson, M.; Finne, T.E.; Hilario, A.; Flem, B.; Christensen, G.; Schaanning, M.; et al. Submarine and deep-sea mine tailings placements: A review of current practices, environmental issues, natural analogs and knowledge gaps in Norway and internationally. Mar. Pollut. Bull. 2015, 97, 13–35. [Google Scholar] [CrossRef] [PubMed]
  10. Al Rawashdeh, R.; Campbell, G.; Titi, A. The socio-economic impacts of mining on local communities: The case of Jordan. Extr. Ind. Soc. 2016, 3, 494–507. [Google Scholar] [CrossRef]
  11. Merciu, G.-L.; Merciu, F.-C.; Cercleux, A.-L. The assessment of social and economic impacts associated to an abandoned mining site. Case study: Ciudanovita (Romania). Procedia Environ. Sci. 2016, 32, 420–430. [Google Scholar]
  12. Mwakumanya, M.A.; Maghenda, M.; Juma, H. Socio-economic and environmental impact of mining on women in Kasigau mining zone in Taita Taveta County. J. Sustain. Min. 2016, 15, 197–204. [Google Scholar] [CrossRef]
  13. Obiri, S.; Mattah, P.A.D.; Mattah, M.M.; Armah, F.A.; Osae, S.; Adu-kumi, S.; Yeboah, P.O. Assessing the environmental and socio-economic impacts of artisanal gold mining on the livehoods of communities in the Tarkwa Nsuaem Municipality in Ghana. Environ. Res. Public Health 2016, 13, 160. [Google Scholar] [CrossRef] [Green Version]
  14. Grimalt, J.O.; Ferrer, M.; Macpherson, E. The mine tailing accident in Aznacollar. Sci. Total Environ. 1999, 242, 3–11. [Google Scholar] [CrossRef]
  15. Rico, M.; Benito, G.; Salgueiro, A.R.; Díez-Herrero, A.; Pereira, H.G. Reported tailings dam failures. A review of the European incidents in the worldwide context. J. Hazard. Mater. 2008, 152, 846–852. [Google Scholar] [CrossRef] [PubMed] [Green Version]
  16. Macklin, M.G.; Brewer, P.A.; Balteanu, D.; Coulthard, T.J.; Driga, B.; Howard, A.J.; Zaharia, S. The long term fate and environmental significance of contaminant metals released by the January and March 2000 mining tailings dam failures in Maramureş Country, upper Tisa Basin, Romania. Appl. Geochem. 2003, 18, 241–257. [Google Scholar] [CrossRef]
  17. Fernandes, G.W.; Goulart, F.F.; Ranieri, B.D.; Coelho, M.S.; Dales, K.; Boesche, N.; Bustamante, M.; Carvalho, F.A.; Dirzo, R.; Fernandes, S.; et al. Deep into the mud: Ecological and socio-economic impacts of the dam breach in Mariana, Brazil. Nat. Conserv. 2016, 14, 35–45. [Google Scholar] [CrossRef]
  18. Espaňa, J.S.; López Pamo, E.; Santofimia, E.; Aduvire, O.; Reyes, J.; Barettino, D. Acid mine drainage in the Iberian Pyrite Belt (Odiel river watershed, Huelva, SW Spain): Geochemistry, mineralogy and environmental implications. Appl. Geochem. 2005, 20, 1320–1356. [Google Scholar] [CrossRef]
  19. Simate, G.S.; Ndlovu, S. Acid mine drainage: Challenges and opportunities. J. Environ. Chem. Eng. 2014, 2, 1785–1803. [Google Scholar] [CrossRef]
  20. Kefeni, K.K.; Msagari, T.A.M.; Mamba, B.B. Acid mine drainage: Prevention, treatment options, and resource recovery: A review. J. Clean. Prod. 2017, 151, 475–493. [Google Scholar] [CrossRef]
  21. Chapman, P.M.; Wang, F.; Janssen, C.; Persoone, G.; Allen, H.E. Ecotoxicology of metals in aquatic sediments: Binding and release, bioavailability, risk assessment, and remediation. Can. J. Fish. Aquat. Sci. 1998, 55, 2221–2243. [Google Scholar] [CrossRef]
  22. Larsen, T.S.; Kristensen, J.A.; Asmund, G.; Bjerregaard, P. Lead and zinc in sediments and biota from Maarmorilik, West Greenland: An assessment of the environmental impact of mining wastes on an Arctic fjord system. Environ. Pollut. 2001, 114, 275–283. [Google Scholar] [CrossRef]
  23. Pedersen, K.B.; Jensen, P.E.; Sternal, B.; Ottosen, L.M.; Vesterskov Henning, M.; Kudahl, M.M.; Junttila, J.; Skirbekk, K.; Frantzen, M. Long-term dispersion and availability of metals from submarine mine tailing disposal in a fjord in Arctic Norway. Environ. Sci. Pollut. Res. 2017, 25, 32901–32912. [Google Scholar] [CrossRef] [Green Version]
  24. Sternal, B.; Junttila, J.; Skirbekk, K.; Forwick, M.; Caroll, J.; Pedersen, K.B. The impact of submarine copper mine tailing disposal from the 1970s on Repparfjorden, northern Norway. Mar. Pollut. Bull. 2017, 120, 136–153. [Google Scholar] [CrossRef] [PubMed] [Green Version]
  25. Sandstad, J.S.; Viola, G.; Nilsson, L.P. Reconnaissance Structural Geological Mapping and Field XRF-Analyses of the Ulveryggen Copper Deposit, Finnmark, Norway; NGU Report no. 2007.064; Geological Survey of Norway: Trondheim, Norway, 2007; p. 16. [Google Scholar]
  26. Christensen, G.N.; Kvassnes, A.J.S.; Tjomsland, T.; Leikvin, Ø.; Kempa, M.; Kollru, V.; Velvin, R.; Dahl-Hansen, G.A.P.; Jørgensen, N.M. Konsekvenser for det marine miljøet i Repparfjorden ved etablering av sjø- eller landdeponi for gruveavgang fra Nussir og Ulveryggen i Kvalsund kommune, Finnmark. Akvaplan-Niva Rapport Nr. 2011, 5249, 214. [Google Scholar]
  27. Andersson, M.; Finne, T.E.; Jensen, L.K.; Eggen, O.A. Geochemistry of a copper mine tailings deposit in Repparfjorden, northern Norway. Sci. Total Environ. 2018, 644, 1219–1231. [Google Scholar] [CrossRef] [PubMed]
  28. Miljødirektoratet. Quality Standards for Water, Sediment and Biota; M-608; Norwegian Environment Agency (NEA): Trondheim, Norway, 2016; p. 24. (In Norwegian) [Google Scholar]
  29. Torske, T.; Bergh, S.G. The Caravarri Formation of the Kautokeino Greenstone Belt, Finnmark, North Norway Palaeoproterozoic foreland basin succession. Nor. Geol. Unders. Bull. 2004, 442, 5–22. [Google Scholar]
  30. Perelló, J.; Clifford, J.A.; Creaser, R.A.; Valencia, V.A. An example of synorogenic sediment-hosted copper Mineralization: Geologic and geochronologic evidence from the Paleoproterozoic Nussir deposit, Finnmark, Arctic Norway. Econ. Geol. 2015, 110, 677–689. [Google Scholar] [CrossRef]
  31. Torgersen, E.; Viola, G.; Sandstad, J.S. Revised structure and stratigraphy of the northwestern Repparfjord Tectonic Window, Northern Norway. Norw. J. Geol. 2015, 95, 397–421. [Google Scholar] [CrossRef] [Green Version]
  32. Mun, Y.; Strmić Palinkaš, S.; Kullerud, K.; Nilsen, K.S.; Neufeld, K.; Bekker, A. Evolution of metal-bearing fluids at the Nussir and Ulveryggen sediment-hosted Cu deposits, Repparfjord Tectonic Window, Northern Norway. Norw. J. Geol. (under review).
  33. Sandstad, J.S.; Bjerkgård, T.; Boyd, R.; Ihlen, P.; Korneliussen, A.; Nilsson, L.P.; Often, M.; Eilu, P.; Hallberg, A. Metallogenic areas in Norway. In Mineral Deposits and Metallogeny of Fennoscandia. 53; Eilu, P., Geol, S., Eds.; Geological Survey of Finland: Espoo, Finland, 2012; pp. 35–138. [Google Scholar]
  34. Nussir ASA. Available online: www.nussir.no (accessed on 30 July 2019).
  35. Sandstad, J.S. Microscope and SEM (Scanning Electron Microscope) Investigations of Thin Sections from the Nussir Copper Deposit; NGU Report no. 2010.025; Geological Survey of Norway: Trondheim, Norway, 2010; p. 55. [Google Scholar]
  36. Falk, A.H.; Christensen, G.N. Gruvedrift i Nussir og Ulveryggen i Kvalsund kommune, Finnmark—Konsekvenser av landdeponi og sjødeponi for marin fisk og fiskeri i Repparfjorden. Akplan-Niva Rapport Nr. 2011, 5249, 59. [Google Scholar]
  37. Bureau Veritas Laboratories. Available online: acmelab.com/ (accessed on 13 Juanury 2020).
  38. Activation Laboratories Ltd. (Actlabs). Available online: actlabs.com/ (accessed on 13 Juanury 2020).
  39. Dijkstra, N.; Junttila, J.; Skirbekk, K.; Carroll, J.; Husum, K.; Hald, M. Benthic foraminifera as bio-indicators of chemical and physical stressors in Hammerfest harbour (Northern Norway). Mar. Pollut. Bull. 2017, 114, 384–396. [Google Scholar] [CrossRef] [Green Version]
  40. Blott, S.J.; Pye, K. Gradistat: A grain size distribution and statistics package for the analysis of unconsolidated sediments. Earth Surf. Process. Landf. 2001, 26, 1237–1248. [Google Scholar] [CrossRef]
  41. Starkey, H.C.; Blackmon, P.D.; Hauff, P.L. The routine mineralogical analysis of clay-bearing samples. Geol. Surv. Bull. USA 1984, 1563, 1–32. [Google Scholar]
  42. Rauret, G.; Lopez-Sanchez, F.J.; Sahuquillo, A.; Rubio, R.; Davidson, C.; Ure, A.; Quevauviller, P. Improvement of the BCR three step sequential extraction procedure prior to the certification of new sediment and soil reference material. J. Environ. Monit. 1999, 1, 57–61. [Google Scholar] [CrossRef] [PubMed]
  43. Quevauviller, P.; Rauret, G.; Muntau, H.; Ure, A.M.; Rubio, R.; López-Sánchez, J.F.; Fiedler, H.D.; Griepink, B. Evaluation of a sequential extraction procedure for the determination of extractable trace metal contents in sediments. Fresenius J. Anal. Chem. 1994, 349, 808. [Google Scholar] [CrossRef]
  44. Visual Minteq 3.1. Available online: https://vminteq.lwr.kth.se/ (accessed on 11 February 2020).
  45. Gustafsson, J.P.; Mwamila, L.B.; Kergoat, K. The pH dependence of phosphate sorption and desorption in Swedish agricultural soils. Geoderma 2012, 189–190, 304–311. [Google Scholar] [CrossRef] [Green Version]
  46. Parkhurst, D.L.; Appelo, C.A.J. Description of Input and Examples for PHREEQC Version 3—A Computer Program for Speciation, Batch-Reaction, One-Dimensional Transport, and Inverse Geochemical Calculations; USGS Chapter 43, Section A Groundwater. Book 6, Modeling Techniques; USGS: Denver, CO, USA, 2013; 497p.
  47. Pérez-Barnuevo, L.; Pirard, E.; Castroviejo, R. Automated characterisation of intergrowth textures in mineral particles. A case study. Min. Eng. 2013, 52, 136–142. [Google Scholar] [CrossRef] [Green Version]
  48. Akcil, A.; Koldas, S. Acid Mine Drainage (AMD): Causes, treatment and case studies. J. Clean. Prod. 2006, 14, 1139–1145. [Google Scholar] [CrossRef]
  49. Boyle, E.A. Cadmium, zinc, copper, and barium in foraminifera tests. Earth Planet. Sci. Lett. 1981, 53, 11–35. [Google Scholar] [CrossRef]
  50. Flemming, C.A.; Trevors, J.T. Copper toxicity and chemistry in the environment: A review. Water Air Soil Pollut. 1989, 44, 143–158. [Google Scholar] [CrossRef]
  51. Morello, E.B.; Haywood, M.D.E.; Brewer, D.T.; Apte, S.C.; Asmund, G.; Kwong, Y.T.J.; Dennis, D. The ecological impacts of submarine tailings placement. In Oceanography and Marine Biology: An Annual Review; Hughes, R.N., Hughes, D.J., Smith, I.P., Dale, A.C., Eds.; Taylor & Francis Group: Boca Raton, FL, USA, 2016; Volume 54, pp. 315–366. [Google Scholar]
  52. Luther III, G.W.; Findlay, A.J.; MacDonald, D.J.; Owings, S.M.; Hanson, T.E.; Beinart, R.A.; Girguins, P.R. Thermodynamics and kinetics of sulfide oxidation by oxygen: A look at inorganically controlled reactions and biologically mediated processes in the environment. Front. Microbiol. 2011, 2, 62. [Google Scholar] [CrossRef] [Green Version]
  53. Bakke, T.; Källqvist, T.; Ruus, A.; Breedveld, G.D.; Hylland, K. Development of sediment quality criteria in Norway. J. Soils Sediments 2010, 10, 172–178. [Google Scholar] [CrossRef]
  54. Pharaoh, T.C. Volcanic and Geochemical Stratigraphy of the Nussir Group of Arctic Norway—An Early Proterozoic Greenstone Suite. J. Geol. Soc. 1985, 142, 259–278. [Google Scholar] [CrossRef]
  55. Pharaoh, T.C.; Warren, A.; Walsh, N.J. Early Proterozoic metavolcanic suites of the northernmost part of the Baltic Shield. J. Geol. Soc. Lond. Spec. Pub. 1987, 33, 41–58. [Google Scholar] [CrossRef]
  56. Viola, G.; Sandstad, J.S.; Nilsson, L.P.; Heincke, B. Structural and ore geological studies in the northwestern part of the Repparfjord Window, Kvalsund, Finnmark, Norway. NGU Report no. 2008.029; Norwegian Geological Survey: Trondheim, Norway, 2008; 93p. [Google Scholar]
  57. Vokes, F.M. Some copper sulfide parageneses from the Raipas formation of Northern Norway. In Norges Geologiske Undersøkelse Årbok; Norwegian Geological Survey: Trondheim, Norway, 1956; Volume 200, pp. 74–111. [Google Scholar]
  58. Ben-Yaakov, S. pH Buffering of pore water of recent anoxic marine sediments. 1. Limnol. Oceanogr. 1973, 18, 86–94. [Google Scholar] [CrossRef]
  59. Taylor, P.L.; Lichtschlag, A.; Toberman, M.; Sayer, M.D.; Reynolds, A.; Sato, T.; Stahl, H. Impact and recovery of pH in marine sediments subject to a temporary carbon dioxide leak. Int. J. Greenh. Gas Control 2015, 38, 93–101. [Google Scholar] [CrossRef]
  60. Phillips, E.J.P.; Edward, R.L.; Kraemer, T.; Zielinski, R. Sulfate-reducing bacteria release barium and radium from naturally occurring radioactive material in oil-field barite. Geomicrobiol. J. 2001, 18, 167–182. [Google Scholar] [CrossRef]
  61. Antler, G.; Turchyn, A.V.; Rennie, V.; Herut, B.; Sivan, O. Coupled sulfur and oxygen isotope insight into bacterial sulfate reduction in the natural environment. Geochim. Cosmochim. Acta 2013, 118, 98–117. [Google Scholar] [CrossRef] [Green Version]
  62. Glud, R.N. Oxygen dynamics of marine sediments. Mar. Biol. Res. 2008, 4, 243–289. [Google Scholar] [CrossRef]
  63. Strömberg, B.; Banwart, S.A. Experimental study of acidity-consuming processes in mine waste rock; some influence of mineralogy and particle size. Appl. Geochem. 1999, 14, 1–16. [Google Scholar] [CrossRef]
  64. Plumlee, G.S. The environmental geology of mineral deposis. In The Environmental Geochemistry of Mineral Deposits. Part A: Processes, Techniques and Health Issues; Plumlee, G.S., Longsdon, M.S., Eds.; Society of Economic Geologists: Littleton, CO, USA, 1999; pp. 71–116. [Google Scholar]
  65. Smolinski, T.; Wawszczak, D.; Deptula, A.; Lada, W.; Olczak, T.; Rogowski, M.; Pyszynska, M.; Chmielewski, A.G. Solvent extraction of Cu, Mo, V, and U from leach solutions of copper ore and flotation tailings. J. Radioanal. Nucl. Chem. 2017, 314, 69–75. [Google Scholar] [CrossRef] [Green Version]
  66. Blowes, D.W.; Ptacek, C.J.; Jurjovec, J. Mill tailings: Hydrogeology and geochemistry. In Environmental Aspects of Mine Wastes; Jambor, J.L., Blowes, D.W., Ritchie, A.I.M., Eds.; Mineralogical Association of Canada: Ottawa, ON, Canada, 2003; Volume 31. [Google Scholar]
  67. Jambor, J.L. Mine-waste mineralogy and mineralogical perspectives of acid-base accounting. In Environmental Aspects of Mine Wastes; Jambor, J.L., Blowes, D.W., Ritchie, A.I.M., Eds.; Mineralogical association of Canada: Quebec, QC, Canada, 2003; Volume 31, pp. 117–146. [Google Scholar]
  68. Brough, C.P.; Warrender, R.; Bowell, R.J.; Barnes, A.; Parbhakar-Fox, A. The process mineralogy of mine wastes. Min. Eng. 2013, 52, 125–134. [Google Scholar] [CrossRef]
  69. Kleiv, R.A. Fysiske og kjemiske egenskaper til flotasjonsavgang fra Nussir- og Ulveryggen-forekomstene—En supplert sammenstilling av laboratorieresultater fra SGS Mineral Services, Canada, 2011. NTNU Rapport #M-RAK 2011, 7, 25. [Google Scholar]
  70. Kwong, Y.T.; Swerhone, G.W.; Lawrence, J.R. Galvanic sulfide oxidation as a metal-leaching mechanism and its environmental implications. Geochem. Explor. Environ. Anal. 2003, 3, 337–343. [Google Scholar] [CrossRef] [PubMed]
  71. Li, Z.; Li, H.; Xu, L. Galvanic interaction between galena and pyrite in an open system. Chin. J. Geochem. 2006, 25, 230–237. [Google Scholar] [CrossRef]
  72. Biegler, T.; Swift, D.A. Anodic behaviour of pyrite in acid solutions. Electrochim. Acta 1979, 24, 415–422. [Google Scholar] [CrossRef]
  73. Warren, G.W. The Electrochemical Oxidation of CuFeS2. Ph.D. Thesis, University of Utah, Salt Lake City, UT, USA, 1978. [Google Scholar]
  74. Chizhikov, D.M.; Kovylina, V.N. Investigation of potentials and anodic polarization of the sulfides and their alloys. In Trudy Chetvertogo Soveshchaniya po Electrokhimii Akademii Nauk SSSR, Proceedings of the 4th Conference on Electrochemistry; Akademii Nauk SSSR: Moscow, USSR, 1956; pp. 715–719. [Google Scholar]
  75. Simonsen, A.M.T.; Pedersen, K.B.; Jensen, P.E.; Elberling, B.; Bach, L. Lability of toxic elements in submarine tailings disposal: The relationship between metal fractionation and metal uptake by sandworms (Alitta virens). Sci. Total Environ. 2019, 696, 133903. [Google Scholar] [CrossRef]
Figure 1. (A) Overview map of Norway; (B) Regional map of the Repparfjorden area, including hydrological systems (light blue); the locations of the Nussir and Ulveryggen deposits (crossed hammers); the location of Rpelv sample (X); (C) map of Repparfjorden showing the location of six cores used in this study. The maps are modified after [24]. Vinous dashed line outlines the distribution of marine sediments that are affected by mine tailings. The line is constructed based on [23,24,27], taking into account Cu concentration higher than the background values, >35 ppm (after [28]).
Minerals 10 00169 g001
Figure 2. Simplified geological map of the Repparfjord Tectonic Window (modified after [31,32]).
Minerals 10 00169 g002
Figure 3. Photographs of ore mineral assemblage from the Nussir (A) and Ulveryggen (B) deposits under reflected light; as well as backscatter electron images (BSE) of typical ore mineral assemblages from the Nussir (C) and Ulveryggen (D) deposits. Bn—bornite, Ccp—chalcopyrite, Cct—chalcocite, Gn—galena, FeO—iron oxides.
Minerals 10 00169 g003
Figure 4. (A) Photograph of gravity core HH-12-004-GC, combined with diagrams demonstrating: (B) TOC % up to 30 cm depth; (C) frequency curves of grain-size distributions; (D) the distribution of trace elements and major oxides along the vertical profile. The scale of Cu ecotoxicity is modified from [28]; brcd—background.
Minerals 10 00169 g004
Figure 5. X-ray diffraction (XRD) analyses of marine sediments from core HH-12-004-GC. (A) Secondary electron image of the mine tailing sediments from 3 cm depth is taken under Zeiss Merlin Compact VP field emission scanning electron microscope (SEM); XRD analysis of bulk samples at indicated depths; (B) XRD analysis of clay minerals. EG—ethylene glycol.
Minerals 10 00169 g005
Figure 6. X-ray diffraction of clay minerals from deeper, natural marine sediments unaffected by mine tailings. The numbers above the curves and vertically located correspond to the depth in cm in core (HH12-004-GC-MF-0312). EG—ethylene glycol.
Minerals 10 00169 g006
Figure 7. X-ray diffraction of the Fe crust, hardpan obtained from 20 cm depth in core IG-15-1-1106 (GC).
Minerals 10 00169 g007
Figure 8. Backscatter electron image (BSE) and elemental (Cu, S, Fe) maps of a well-preserved chalcopyrite grain from 3–4 cm depth in core HH12-004-GC.
Minerals 10 00169 g008
Figure 9. Backscatter electron image of partly oxidized chalcopyrite grain from 3–4 cm depth in core HH12-004-GC accompanied by geochemical profiles obtained by using EDS line scan.
Minerals 10 00169 g009
Figure 10. Backscatter electron image of chalcopyrite with weathering rim from 3–4 cm depth in HH12-004-GC accompanied by geochemical profiles obtained by using EDS line scan.
Minerals 10 00169 g010
Figure 11. Backscatter electron image (BSE) and elemental maps (Cu, Fe, S) of bornite from 0–2 cm depth (core HH12-004-GC).
Minerals 10 00169 g011
Figure 12. (A,B) Backscatter electron image (BSE) and elemental (Fe, S) maps of pyrite grains in 0–2 cm depth (HH12-004-GC).
Minerals 10 00169 g012
Figure 13. Backscatter electron image (BSE) of ore minerals in core HH-12-004-GC: (A) chalcopyrite grain (ccp) within Fe oxide (FeO). Sample is taken from 167 cm depth (sample #167); (B) native gold (Au) in the vicinity of framboidal pyrite (Py, sample #167); (C) sphalerite (sph) grain in marine sediments from 216 cm depth (sample #216); (D) chalcopyrite (ccp) grain in marine sediments (sample #216).
Minerals 10 00169 g013
Figure 14. Backscatter electron image (BSE) and elemental (Cu, Fe, S, Ti, O) maps of chalcopyrite within the rutile grain from marine sediments (IG-15-1-1039-MC, 14–14.5 cm depth).
Minerals 10 00169 g014
Figure 15. Backscatter electron image (BSE) and elemental (Cu, Fe, S) maps of unaltered chalcopyrite from marine sediments (IG-15-1-1089-MC, 7–8 cm depth).
Minerals 10 00169 g015
Figure 16. Metal partitioning of selected metals within core HH-12-004-GC-MF0312. See main text for explanation.
Minerals 10 00169 g016
Figure 17. Thermodynamic modelling of Cu speciation in (A) Repparfjord carbonate-free conditions; (B) carbonate-buffered Repparfjord conditions; (C) on-land atmospheric condition. Modelling is undertaken for the temperature of 2 °C. See main text for further explanation.
Minerals 10 00169 g017
Figure 18. Thermodynamic modelling of chalcopyrite solubility. (A) Low Eh, seawater infiltrated, no carbonates (log c(Fe2+) = 10−3 M; log c(HS) = 10−3 M); (B) Low Eh, seawater infiltrated, buffered with carbonates (log c(Fe2+) = 10−3 M; log c(HS-) = 10−3 M; log c(HCO3) = 0.1 M); (C) High Eh, meteoric infiltrated, no carbonates (log c(Fe2+) = 10−12 M; log c(HS-)=10-12 M). See main text for further discussion.
Minerals 10 00169 g018
Table 1. Trace element contents (ppm/ppb) in major copper sulfides from the Nussir and Ulveryggen Cu sediment-hosted ore deposits.
Element, ppmLDNS-35-ccpUlv-2-bn
Ag0.50.5LLD
As5LLDLLD
Au, ppb0.5NDND
Ba312527
Bi0.10.30.1
Cd0.1LLDLLD
Co1852
Cr20LLD140
Cs0.1LLD0.4
Cu10>10,000>10,000
Ga1LLD6
Ge0.5LLD0.6
Hg0.01LLDLLD
Mo2LLD5
Nb0.2LLD1.6
Ni0.1100LLD
Pb5LLDLLD
Rb1LLD24
Sb0.2LLDLLD
Se0.5NDND
Sn1LLDLLD
Sr248186
Ta0.01LLD0.13
Th0.05LLD3
Tl0.053.690.96
U0.010.053.02
V5527
W0.50.6LLD
Y0.52.76.7
Zn30310LLD
Zr1LLD49
NS—Nussir, Ulv—Ulveryggen; Bn—bornite, ccp—chalcopyrite, LD—limit of detection, LLD—lower than limit of detection, ND—no data.
Table 2. Lithogeochemistry of bulk marine sediments (HH12-004-GC) from Repparfjorden and Repparfjordelva. The scale of toxicity is taken from [28]. Rpelv—Repparfjordelva.
LDHH12-004-GC LDRpelv
Major Elements, %Interval, cm02.5681012MVSD
Al2O30.0111.8112.4112.0812.7210.9610.6011.760.760.019.82
CaO0.011.140.500.510.601.821.941.090.600.011.65
Fe2O30.044.574.144.445.054.303.734.370.400.013.66
K2O0.013.193.413.263.422.462.212.990.480.012.02
MgO0.011.781.811.812.171.701.551.800.190.010.95
MnO0.010.030.030.020.030.040.040.030.010.0010.077
Na2O0.012.842.832.802.702.872.822.810.050.012.01
P2O50.010.090.070.060.060.130.130.090.030.010.14
SiO20.0168.1069.8970.8268.6569.4271.2669.691.120.0170.69
TiO20.010.440.430.380.410.620.650.490.110.0010.714
Trace Elements, ppm
Ag0.1LLDLLDLLDLLDLLDLLD 0.50.6
As0.553.82.123.93.93.51.15< 5
Au0.53.43.24.83.52.52.83.40.7
Ba1121613561377109761853610333372561
Be14113LLD12111
Bi0.10.30.40.40.40.1<0,10.30.10.1LLD
Cd0.1LLDLLDLLDLLDLLDLLD
Co0.213.613.412.61611.41012.81.9111
Cr 3423974044171519630112920100
Cs0.11.62.01.61.72.02.21.90.20.11.9
Cu0.1640.8518747.7486.6237.686.6452.9226.61010
Ga0.514.916.115.216.413.011.514.51.7113
Hf0.13.73.02.52.96.77.94.52.10.19.0
Hg0.010.020.040.040.020.020.030.030.01
Mo0.11.71.80.61.11.11.11.20.42LLD
Nb0.16.65.34.44.58.910.16.62.20.27.7
Ni2049524959872754182050
Pb0.17.45.33.23.48.78.76.12.3518
Rb0.193.097.987.595.080.376.088.37.9174
Sb0.10.20.10.1<0,10.10.10.10.00.21.4
Sc1888910109119
Se0.5LLDLLDLLDLLD0.80.80.40.3
Sn1221122201LLD
Sr0.5109.482.072.362.8179.6186.6115.549.92189
Ta0.10.60.60.30.40.70.70.60.20.010.87
Th0.26.76.45.96.57.06.96.60.40.057.85
Tl0.10.20.20.10.10.10.20.20.10.050.06
U0.12.02.21.81.82.62.92.20.40.013.45
V8869286968171858560
W0.5LLD0.6LLDLLDLLD0.70.40.20.54.5
Y0.112.810.98.710.719.822.714.35.10.528.4
Zn13121211933372773040
Zr0.1142116.491.3107.4265.1297.9170.080.81344
IBackground
IIGood
IIIModerate
IVBad
VVery bad
LD—limit of detection, LLD—lower than limit of detection, MV—mean value, SD—standard deviation; Rpelv—Repparfjordelva River sediments.

