Article

High-Pressure Sound Velocity Measurements of Liquids Using In Situ Ultrasonic Techniques in a Multianvil Apparatus

1
Department of Earth and Space Sciences, Southern University of Science and Technology, Shenzhen 518055, China
2
Department of Earth, Environmental, and Planetary Sciences, Case Western Reserve University, Cleveland, OH 44106, USA
3
Center for Advanced Radiation Sources, The University of Chicago, Chicago, IL 60637, USA
4
Unité Matériaux Et Transformations, Bâtiment C6, University of Lille, 59000 Lille, France
*
Author to whom correspondence should be addressed.
Minerals 2020, 10(2), 126; https://doi.org/10.3390/min10020126
Submission received: 30 December 2019 / Revised: 28 January 2020 / Accepted: 29 January 2020 / Published: 31 January 2020
(This article belongs to the Special Issue Mineral Physics—In Memory of Orson Anderson)

Abstract

:
Sound velocity and equation of state of liquids provide important constraints on the generation, presence, and transport of silicate and metallic melts in the Earth’s interior. Unlike their solid counterparts, these properties of liquids pose great technical challenges to high-pressure measurements and are poorly constrained. Here we present the technical developments that have been made at the GSECARS beamline 13-ID-D of the Advanced Photon Source for the past several years for determination of sound velocity of liquids using the ultrasonic techniques in a 1000-ton Kawai-type multianvil apparatus. Temperature of the sound velocity measurements has been extended to ~2400 K at 4 GPa and ~2000 K at 8 GPa to enable studies of liquids with very high melting temperatures, such as the silicate liquids.

1. Introduction

Liquids with a range of chemical compositions, including silicates, carbonates, and iron alloys, are present in the Earth’s deep mantle. Examples of such liquids include dehydration-induced silicate melts either above [1] or below the mantle transition zone [2], carbonatite melts in the asthenosphere [3] or the mantle transition zone [4], primordial silicate melts [5] or metallic melts [6] in the deep mantle, and slab-derived metallic liquids in the lowermost mantle [7]. The presence of liquids can dramatically modify the density and seismic wave velocities of the mantle, resulting in low-velocity anomalies and high VP/VS ratios [8]. Thus, knowledge of sound velocity and equation of state (EOS) of liquids is fundamental in modeling the gravitational stability, migration, and seismic signature of liquids in the mantle.
Unlike solids, for which the X-ray diffraction (XRD) technique can provide easy and accurate measurements to determine the equation of state, the lack of long-range order in liquid structures makes determination of liquid density by XRD virtually impossible. Furthermore, the high mobility and reactivity of liquids at temperatures above the liquidus make it challenging to maintain the pressure and temperature conditions as well as the sample composition during experimental measurements. A number of techniques have been developed for determining the high-pressure density of liquids, including sink/float densitometry [9,10,11], X-ray absorption/radiography [12,13], X-ray scattering [14], and shock-wave measurements [15]. However, the density data obtained are often sparse and are likely more uncertain than that of their solid counterparts. Due to the well-known strong trade-off between the fitting parameters such as the bulk modulus K and its pressure derivative K [16], the large errors in density data make determination of the liquid EOS uncertain. The errors would then be propagated to the sound velocities of liquids when these properties are calculated from the EOS [17]. Extrapolating laboratory results to deeper mantle conditions is thus faced with increasingly greater uncertainties.
The sound velocity of liquids can be directly measured in situ using the ultrasonic technique. If combined with a reference density, sound velocity measurements can provide tight constraints on the bulk modulus and the pressure derivative of the bulk modulus, which are critical when extrapolating an EOS to high pressures [18,19]. With recent technical developments, several groups have successfully applied the ultrasonic technique to determine the sound velocity of liquids with relatively low liquidus temperatures, specifically the Fe-light element alloying liquids including Fe-S [18,20,21,22], Fe-C [23], and Fe-Si [21]. Recently, we have made a series of improvements to enable high-pressure sound velocity measurements for other liquid compositions such as silicates [19] at higher temperatures. In this paper, we present details of the experimental techniques developed at the GSECARS (GeoSoilEnviro-Center for Advanced Radiation Sources) beamline 13-ID-D of the Advanced Photon Source (APS), Argonne National Laboratory, Lemont, IL, USA. We will first describe the overall experimental setup focusing on the improvements of cell assemblies, and then the experimental procedures focusing on the realization of the automated data acquisition system, and finally the data analysis focusing on an interactive data analysis procedure.

2. Experimental Setup for In Situ Sound Velocity Measurements

Figure 1 shows the experimental setup employed in the ultrasonic measurements. This setup was originally developed in [18] for studying Fe-alloying liquids and later modified by [19] for silicate liquids. Here we present some details of the setup and new improvements to the system for better performance and faster data acquisition at very high temperatures (up to ~2400 K).

2.1. High-Pressure Multianvil Experiments

We employed the 1000-ton Kawai-type multianvil apparatus (T-25, Rockland Research Corporation, West Nyack, NY, USA) equipped in 13-ID-D [24] to generate high pressures up to ~8 GPa at ~2000 K and ~4 GPa at ~2400 K. Tungsten carbide (WC) second-stage anvils with 25.4 mm edge length and 8 mm truncation edge lengths (TEL) were used to compress the sample cell assemblages. An MgO-MgAl2O4 octahedron with 14 mm edge length was used as the pressure medium in each experiment [25]. A sleeve furnace made of high-purity graphite was used to provide heating of the sample, with two ZrO2 sleeves placed outside the furnace for thermal insulation and an MgO sleeve for the passage of X-rays. The chemical inertness of the graphite furnace ensured the stability of heating during the measurements even at 2400 K. However, the pressure of this cell assembly is limited to ~8–10 GPa, beyond which the graphite heaters may transform to diamond at high temperatures and become unstable. The sample temperature was monitored using a C-type W-5%Re-W-26%Re thermocouple, inserted from one end of the cell. A mixture of MgO and h-BN (MgO:h-BN = 3:1 by weight) was used as the pressure standard. Under normal conditions, the pressure was calculated from the cell volume determined by energy dispersive X-ray diffraction, using a P-V-T equation of state of MgO [26]. However, at high temperatures above 1900 K, it was often difficult to identify MgO peaks due to the grain growth of MgO. In this situation, the pressure was estimated by extrapolating the P-T relation obtained at lower temperatures. The determined pressure was cross-checked using the melting curve of diopside and the uncertainty in pressure was estimated to be less than 0.3 GPa when the MgO peaks were identifiable, and about 0.5 GPa at ~2400 K [19].

2.2. Setup for Ultrasonic Measurements

We applied the pulse-echo overlap technique [27] for the ultrasonic measurements. The connection diagram for the ultrasonic measurement system is shown in Figure 1. Electric signals of two to three cycles of sine waves at frequencies of 20 MHz, 25 MHz, 30 MHz, 40 MHz, 50 MHz, and 60 MHz were generated by a programmable function generator (AFG 3252C, bandwidth 250 MHz, Tektronix, Inc., Beaverton, OR, USA) and were sent to a directional bridge (86205A, Keysight Technologies, Santa Rosa, CA, USA) and synched to an oscilloscope (MSO 54, bandwidth 1 GHz, Tektronix, Inc.). The directional bridge guided the input signals from the waveform generator to the piezoelectric transducer rigidly attached to the back of the bottom WC anvil and the output signals from the transducer to an amplifier (Ultrasonic Preamplifier Model 5678, bandwidth 50 kHz–40 MHz, 40 dB, Olympus Corporation, Shinjuku, Japan) and then the oscilloscope. The entire ultrasonic measurement system was physically placed next to the high-pressure device inside the 13-ID-D hutch to reduce cable lengths and hence signal loss. Both the waveform generator and the oscilloscope were connected through the Ethernet and were controlled remotely by a desktop computer outside the hutch.
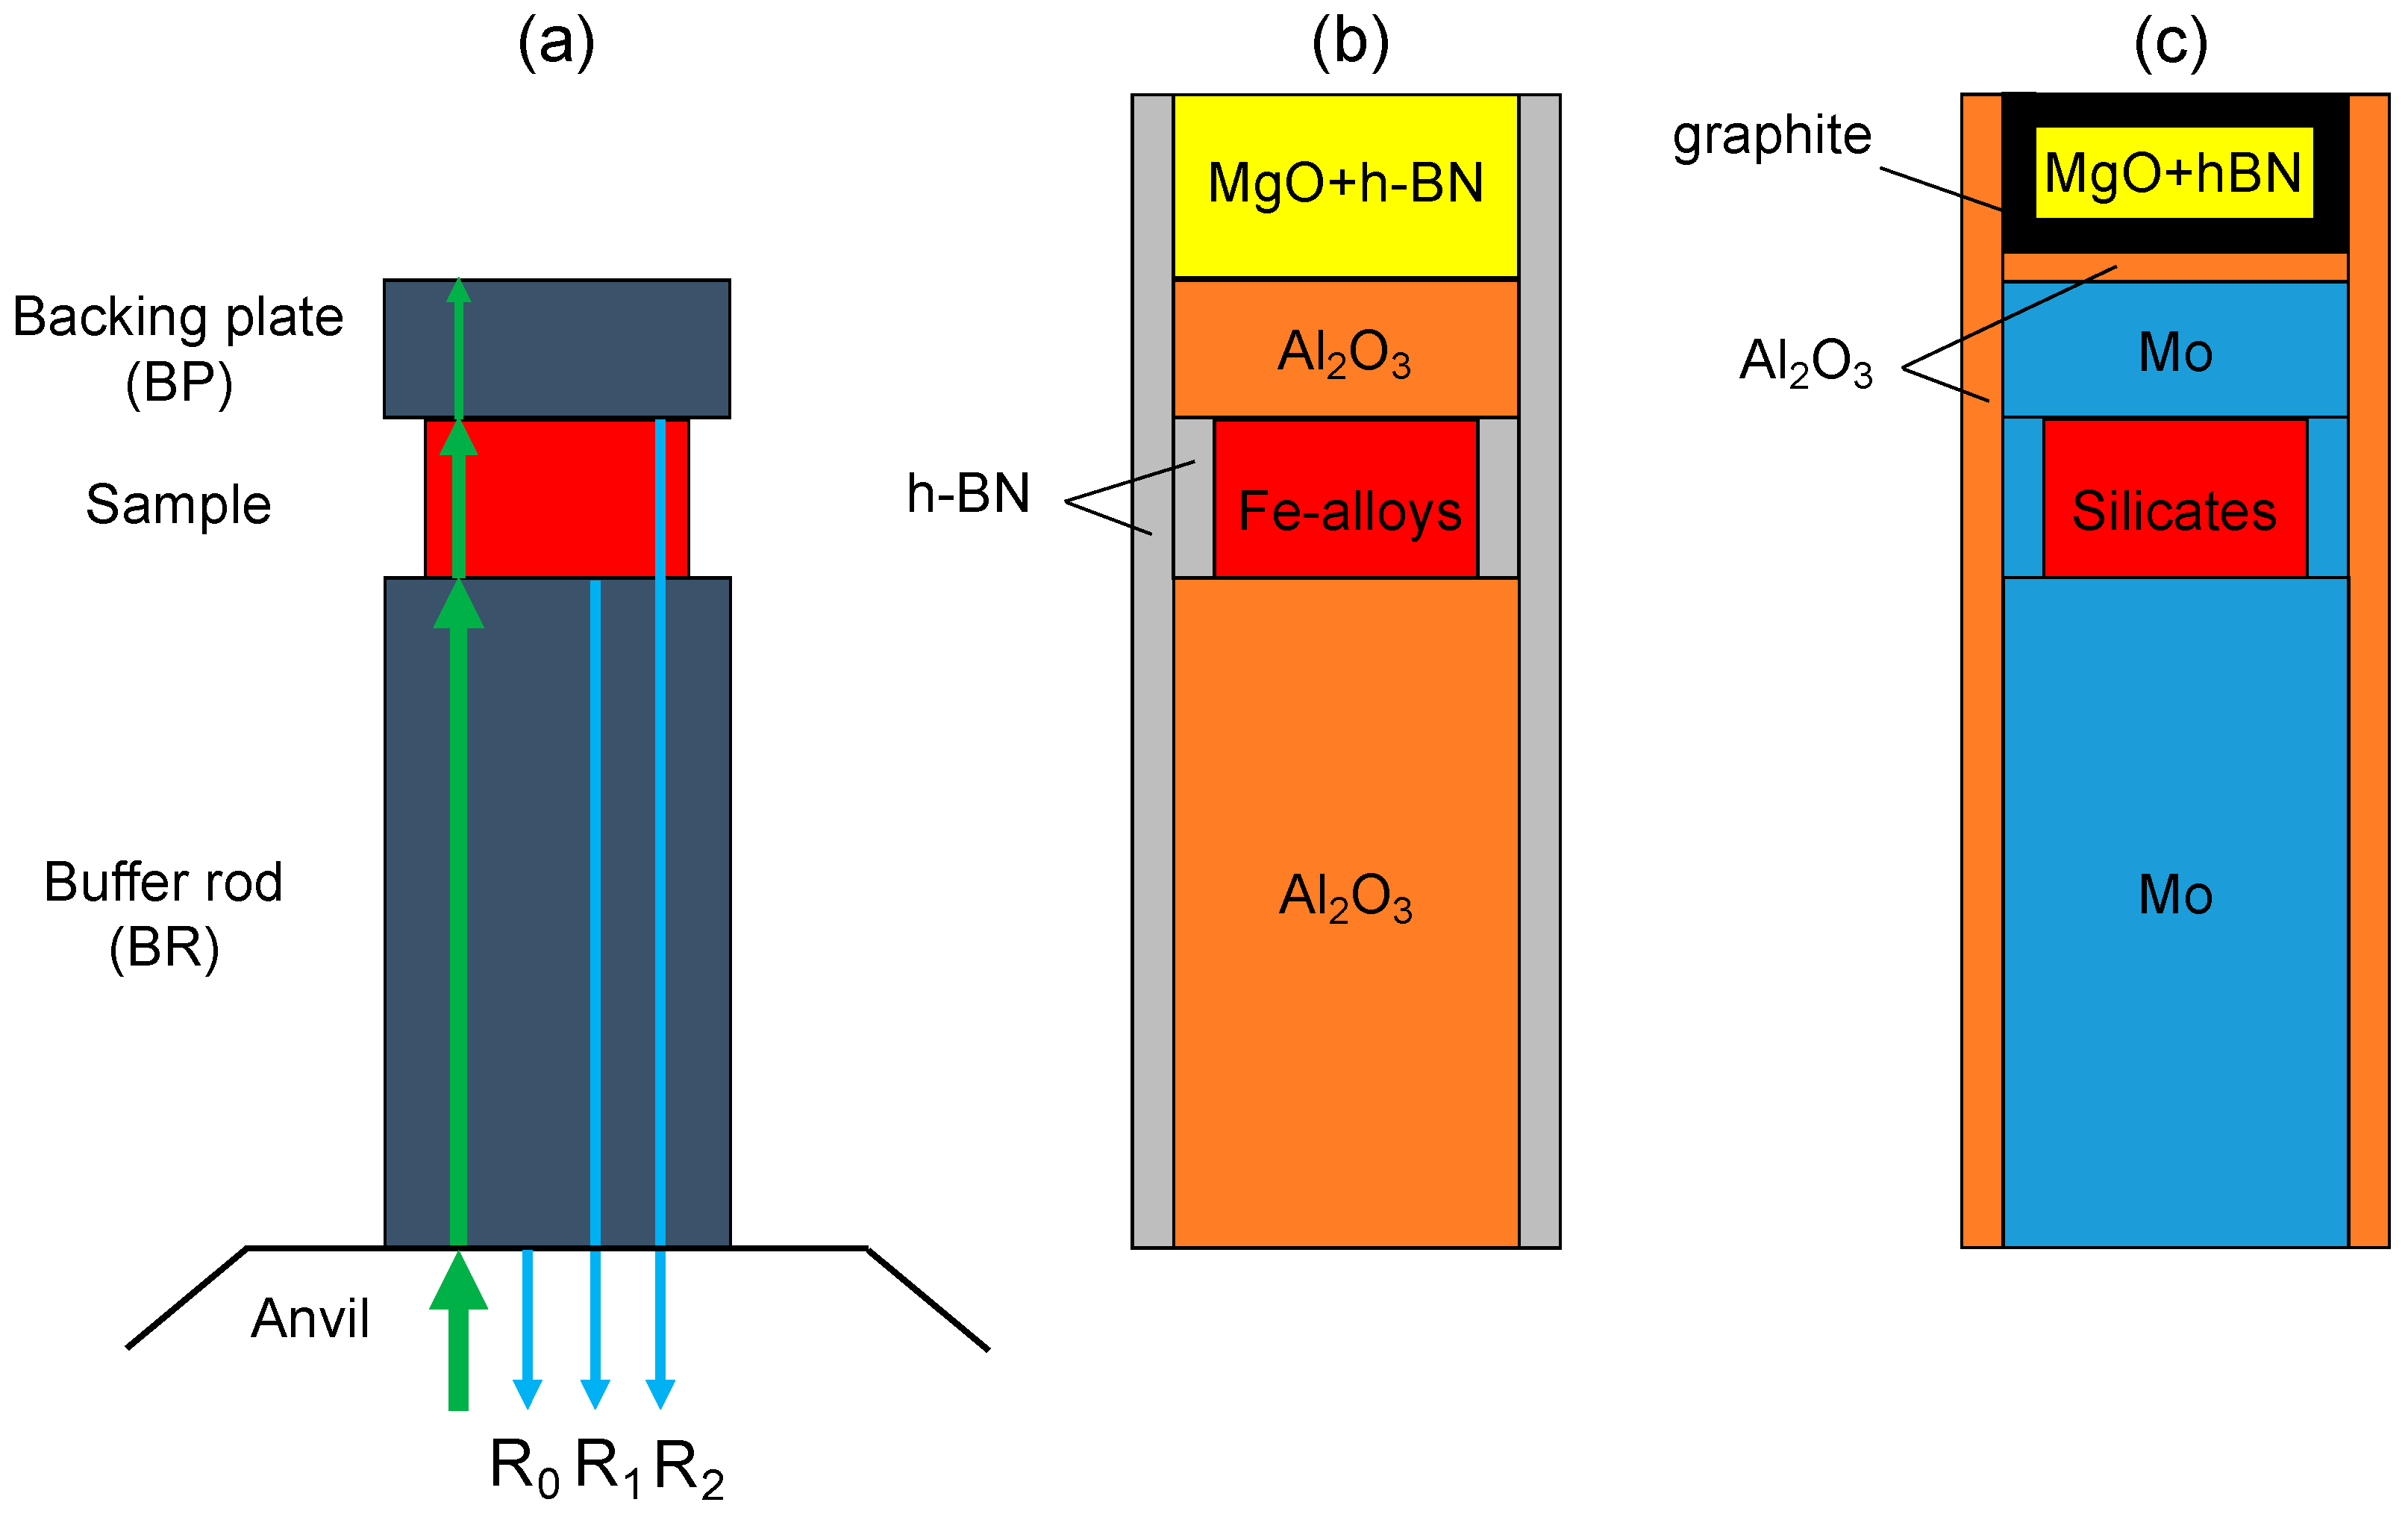
Both longitudinal (P-) and shear (S-) waves were generated by converting input electric signals using a dual-mode piezoelectric transducer made of an LiNbO3 single crystal (10° Y-cut). The transducer had resonant frequencies of 50 MHz for the P-wave and 30 MHz for the S-wave, but was capable of generating forced oscillations between 20 and 60 MHz with significant amplitudes. Elastic waves propagated through the WC anvil, the buffer rod (BR), the sample, and the backing plate (BP), and were reflected back at the anvil–BR, BR–sample, sample–BP, and other interfaces inside the cell assembly due to the impedance (velocity times density) contrasts between materials across various interfaces (Figure 2a). The reflected elastic waves were converted back to electrical signals by the transducer and were received, displayed, and saved by the oscilloscope. Round-trip travel times of sound waves in the sample were determined by the time difference between the reflected echoes from the BR–sample (R1 echo in Figure 2a) and the sample–BP interfaces (R2 echo in Figure 2a).
Sample lengths were determined by white-beam X-ray radiographic imaging. While in the imaging mode, the entrance slits were taken out of the X-ray path. Transmitted X-rays passing through the sample cell were converted to visible light by a YAG scintillator and received by a CMOS camera (Pointgrey Grasshopper 3, FLIR, Richmond, BC, Canada). The pixel length of the camera was calibrated by (1) taking an image of a WC sphere of known size, or (2) taking a series of sample images at different camera vertical positions that were numerically controlled by a motorized stage and then making a plot showing the relation between image position and camera position; the slope of the plot corresponded to the pixel size. Both methods gave consistent calibration results within uncertainties and averaged at 2.425 ± 0.005 µm/pixel if a four-inch-long tubing was used for the camera lens.

3. Improvements for Measurements at High Temperatures

Most of the technical challenges for sound velocity measurements of liquids under high pressures are due to the high mobility and reactivity of the liquids. The liquidus temperatures for Earth and planetary materials are quite high and usually increase with increasing pressure. For example, the melting temperature of diopside (CaMgSi2O6) is ~1670 K at ambient pressure and raises quickly to ~2177 K at 5 GPa [28]. Such high temperatures would: (1) reduce the viscosity of the liquid and increase mobility, making it difficult to confine the liquid and maintain parallelism of the sample surfaces for sound wave reflection; (2) significantly enhance chemical reactions between the liquid sample and the sample container (including BR and BP) as well as reactions between other cell parts; (3) heat up the transducer crystal, causing thermal stress or phase transitions in the crystal that may weaken the piezoelectric effect. To solve these problems, we made the following technical improvements to enable measurements at high temperatures up to 2400 K.

3.1. Sample Preparations

We are interested in two broad types of liquids: Fe-light element alloying liquids and silicate liquids, relevant to planetary molten cores and mantle melts, respectively. Ultrasonic measurements require that all the interfaces in the cell assembly are perpendicular to the incident waves and hence are parallel to each other, so that reflected waves would be guided directly back to the transducer to maximize the reflected acoustic energy and minimize deviations of the actual lengths of wave path from sample thickness. The shape of a liquid sample confined at high pressures depends highly on the shape and strength of the starting solid sample during the very early stage of compression. If the starting sample is soft or not in perfect shape, the nonsymmetrical deviatoric stress during compression would deform the sample nonuniformly and create tilted surfaces that would significantly deteriorate the signal-to-noise ratio of reflected waves. It is therefore critical to prepare a starting sample that has a relatively high strength and a homogeneous composition that is the same as the target liquid composition. For Fe-alloy compositions, this can be achieved by hot-pressing powder mixtures of Fe and Fe-light element compounds with appropriate ratios in a large-volume device such as a piston-cylinder apparatus at a temperature ~100 K below the solidus temperature of the system. For silicate compositions, depending on the viscosity of the corresponding liquids, it is best to premelt the sample powder mixture at ambient conditions and quench it into a glass. Sometimes multiple cycles of melting and quenching are required to remove bubbles to make a transparent and homogeneous glass. The hot-pressed samples or quenched glasses need to be machined into a cylindrical disk of 1.6–2 mm outer diameter (OD) and ~1–1.2 mm thickness to fit into the cell assembly. Among the several techniques we tested, the best result was achieved by machining the sample piece using a computer numerically controlled (CNC) milling machine (MDX 540S, Roland DGA Corporation, Irvine, CA, USA). Both end surfaces of the sample disks were then carefully polished down to a roughness of 1 µm using diamond paste to achieve optimal mechanical coupling at the BR–sample or sample–BP interfaces.

3.2. Sample Environments for High Temperatures

Two different cell assemblies have been developed to accommodate both Fe-alloy liquids and silicate liquids, separately, aiming at minimizing chemical reactions between the liquid sample and the sample container as well as reactions between other cell parts. The key to a successful cell assembly is to find a suitable BR and BP material that: (1) has a high melting point and does not chemically react with the liquid sample; (2) has a significantly different acoustic impedance and a significantly different X-ray absorption coefficient than the liquid sample, so that the sample can be seen from both ultrasonic measurements and X-ray imaging; (3) is strong enough so that the BR–sample and sample–BP surfaces remain relatively flat and parallel.
Figure 2b shows the cell assembly developed for determining the sound velocity of Fe-alloy liquids. In this case, densified Al2O3 is an ideal BR/BP material that satisfies all the requirements listed above. Because of the hardness of Al2O3, it is best to use a soft material that has relatively small grain size to help seal the liquid sample. Here we chose an h-BN sleeve sandwiched between BR and BP to confine the sample, and another long h-BN sleeve to protect the graphite furnace from being crushed by the sharp edges of the hard Al2O3 parts. This cell assembly has been applied to ultrasonic measurements in Fe-S [18] and Fe-P [29] liquids up to 8 GPa and 2000 K. Chemical analysis using a scanning electron microscope (SEM) from our previous study [29] showed essentially no chemical reactions between these liquids, the h-BN sleeve, and the Al2O3 parts. However, such analyses should always be performed when this assembly is applied as potential chemical reactions between h-BN, Al2O3, and Fe-alloys are possible depending on experimental conditions and melt compositions [22].
Figure 2c shows the cell assembly developed for silicate liquids. Molybdenum (Mo) BR, BP, and sleeve-shaped sample container were used for their low reactivity and high impedance and absorption contrasts with the sample. We have observed, through many tests, chemical reactions between Mo and many materials including graphite, h-BN, and MgO, but not Al2O3, at temperatures higher than ~2000 K. We therefore used a crushable Al2O3 sleeve and an Al2O3 disk to insulate the Mo parts from the graphite heater and MgO in the pressure standard. An additional layer of graphite was used to prevent the spinel-forming reaction between MgO and Al2O3. This cell assembly has been applied to determining sound velocity of diopside liquid up to ~4 GPa and ~2400 K [19]. For this Fe-free system, limited chemical reaction between the melt and Mo was observed in the sample even at 2400 K, based on X-ray imaging and the SEM analysis of three recovered samples (see supporting information in [19]). Among these samples, one contained 1.5 wt % MoO2 in the quench product and the other two contained essentially no Mo. Reactivity of Mo with Fe-bearing silicate melts and the effect of the Mo-MoO2 system as an oxygen fugacity buffer on the oxidation state of Fe-components in Fe-bearing melts remain to be tested in the future.
The temperature gradients in both cell assemblies shown in Figure 2b,c were determined at relevant pressure and temperature conditions in offline calibration experiments in a Walker-type multianvil apparatus (Rockland Research Corporation) at Case Western Reserve University, using the spinel layer growth kinetics method described in the studies of [30] and [31]. The calibration experiments and results for the temperature distributions in the assemblies are detailed in the supplementary materials of [29] and [19], respectively, for the cells using Al2O3 and Mo BR/BP. For the cell with Al2O3 BR/BP (Figure 2b), the temperature of the sample was about 60 K higher than the thermocouple reading, with a temperature variation of about 100 K across the sample. The real temperature gradient in the sample for this assembly, in fact, should be smaller, considering the high thermal conductivity of the metallic sample. For the cell with Mo BR/BP (Figure 2c), on the other hand, the temperature of the sample was about ~160–200 K lower than the thermocouple reading owing to the high thermal conductivity of the Mo BR. There existed a ~100 K temperature difference across the sample in this cell under high pressure and temperature conditions. The highest sample temperature we reached for velocity measurements of liquids was ~2400 K at ~4 GPa using Mo as BR/BP, with a thermocouple reading of 2573 K.

3.3. Protecting the Transducer from High Temperature

The effect of high temperature on the piezoelectric transducer crystal was successfully reduced by the following cooling strategies: (1) A tubing was inserted into the press to guide cooling air directly to the transducer crystal to prevent overheating; (2) a cooling nozzle was used to blow focused cooling air to the cell assembly through gaps between first-stage anvils; and (3) a high-power exhaust fan was used to cool down the entire Kawai module.

3.4. Fast Data Acquisition

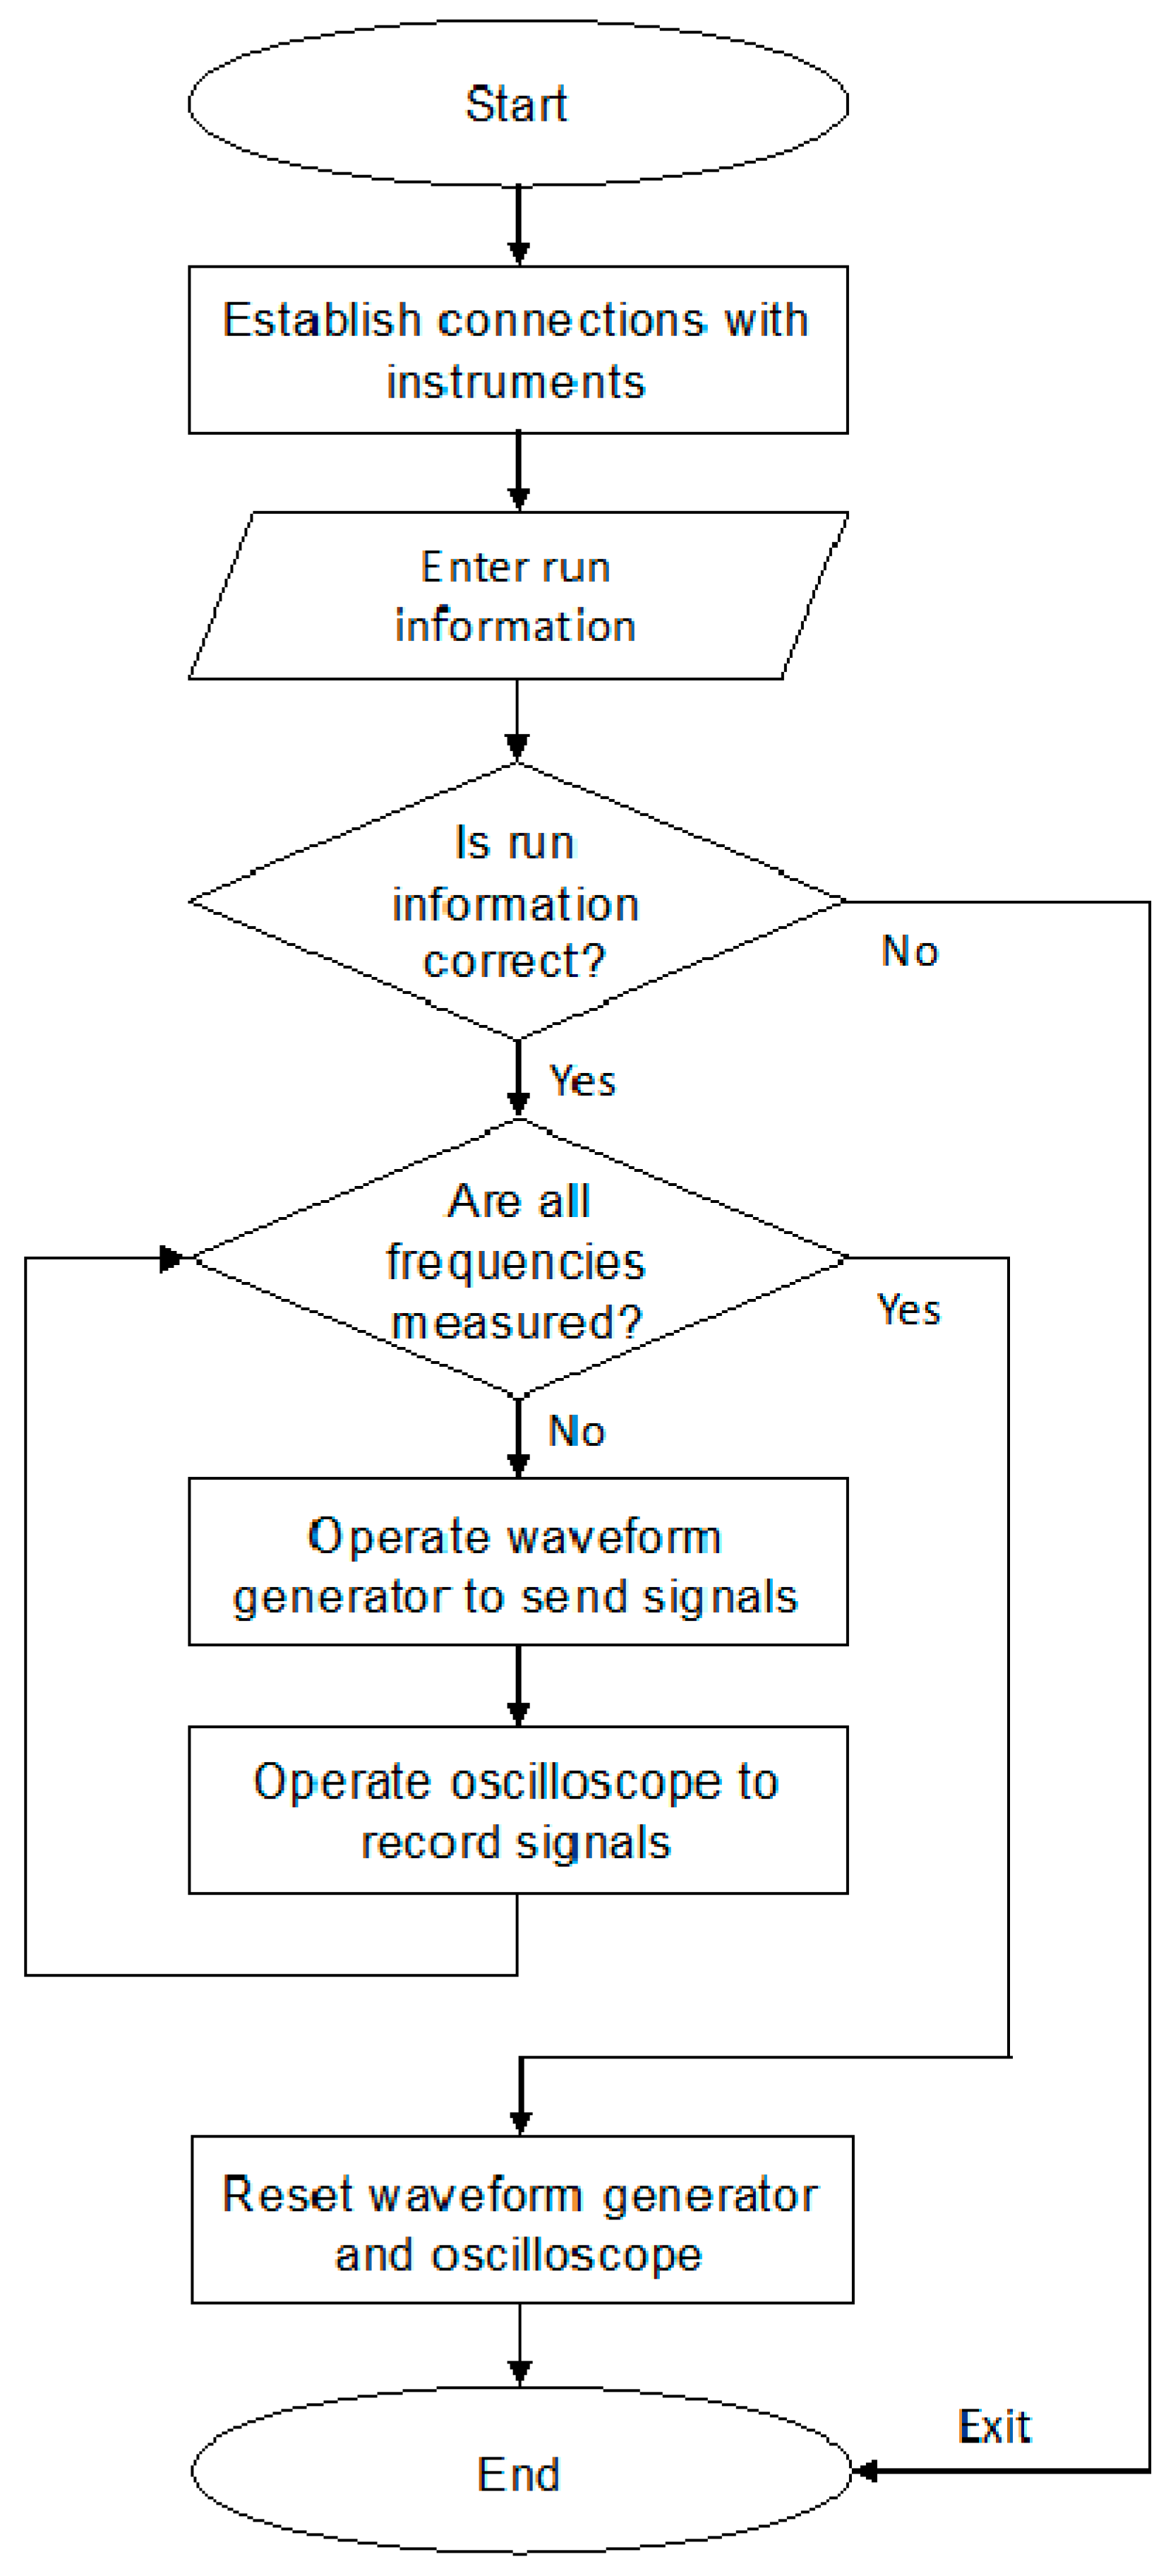
Reducing data collection time is also important for measurements at very high temperatures. For each pressure–temperature condition, we need to take ultrasonic measurements at six different frequencies between 20 and 60 MHz to make sure that there is no frequency dependence of the velocity and the sample is relaxed. However, each measurement at a given frequency requires ~60–90 s to complete if the waveform generator and oscilloscope are operated manually. In total, the whole set of measurements at six frequencies plus X-ray diffraction and imaging would take about 12–15 min, and often require two people working simultaneously to operate X-ray diffraction, imaging, and ultrasonic measurements simultaneously. We have recently developed an automated data collection system to minimize human intervention. In this system, both the waveform generator and the oscilloscope are connected through the Ethernet, and are controlled by a desktop computer through TekVISA, the Tektronix implementation of the standard VISA communication protocol. A python procedure (see Supplementary Materials for the python script) using the PyVISA library has been developed to automate the entire ultrasonic measurement process. Figure 3 shows the flow chart for the python procedure. This procedure shortens the operation time of ultrasonic measurements to less than 6–8 min, and reduces human operation errors at the same time. Potentially, the ultrasonic data collection time may be further shortened by using the transfer function method described in [32], in which the response of the system (transfer function) to an input signal of any frequency can be obtained by determining the system response to a single input sinc function ( sin x / x ). So far, we have not tested the transfer function method at Beamline 13-ID-D of APS as the current function generator (Tektronix AFG 3252C) available cannot be programmed to generate a sinc function, but this could be a future development.

4. Experimental Procedure for Velocity Measurements at High Pressures

In each experimental run, the sample is initially compressed to a target load by increasing the oil pressure in the hydraulic ram. Once the target load is reached, the temperature of the sample is raised by increasing the heating power output at a rate of about 100–200 K/min to a temperature of a few hundred degrees below the solidus temperature of the sample, say 1073 K for Fe-alloys and 1273 K for silicates, at which the sample is annealed for 30–60 min to relax the deviatoric stress in the cell assembly. Manual heating (in contrast to feedback-controlled automated heating) and current control heating mode are used to prevent super heating from potential breaking of the thermocouple or a sudden drop of heater resistance caused by liquid sample leakage. After taking the XRD, X-ray imaging, and ultrasonic measurements, the sample is heated up by 100 K and stopped again for another round of measurements. This heating and measuring cycle continues in temperature intervals of 100 K to a final temperature at a few hundred degrees above the liquidus temperature of the sample, before decreasing to ambient temperature to complete this heating cycle at the first target load.
At each temperature condition, the ultrasonic measurements can be started first by running the automated data acquisition procedure. Then, a sample X-ray image is taken before moving the press and entrance slits to the positions for X-ray diffraction. It takes about 30 s to move all the slits and press motors, 100 s for the XRD of the sample, and 200 s for the XRD of the pressure standard. The press is then moved back and slits out to the imaging position for another image of the sample. The ultrasonic measurements and the X-ray diffraction and imaging can be operated completely independently and in parallel, and therefore the overall time required at each temperature condition is mostly determined by the ultrasonic data collection, which is about 6–8 min.
The complete melting of the sample can be clearly identified from the ultrasonic signals. The P-wave signal from the sample (R2 echo in Figure 2a) is significantly weakened upon initial melting of the sample due to the scattering/attenuating effect of the partial melts. Immediately after the complete melting of the sample, the amplitude of the R2 echo increases dramatically to indicate the disappearance of the scattered crystals in the melt. In addition, the S-wave signal of the sample disappears completely once the sample is fully molten. The detailed evolution of ultrasonic signals for an Fe-alloy (Fe-5 wt %P) and a silicate sample (CaMgSi2O6) across the entire temperature range covering the solidus and liquidus are described in [29] and [19], respectively. For the case of Fe-alloys, the melting of the sample can also be cross-checked by XRD measurements of the sample [29].
Once a heating cycle is completed, if the sample remains in good shape without obvious chemical reactions and leakage, the sample can be compressed more for another one or more heating and measuring cycles. Three or four heating cycles at different loads are typical for an Fe-alloy sample, and two or three heating cycles are possible for silicate samples. The sample is usually quenched by shutting off the heating power at the highest temperature reached in the final heating cycle. The quenched product can then be sectioned and polished for chemical analysis using, for example, SEM.

5. Data Analysis

5.1. Travel Time Analysis

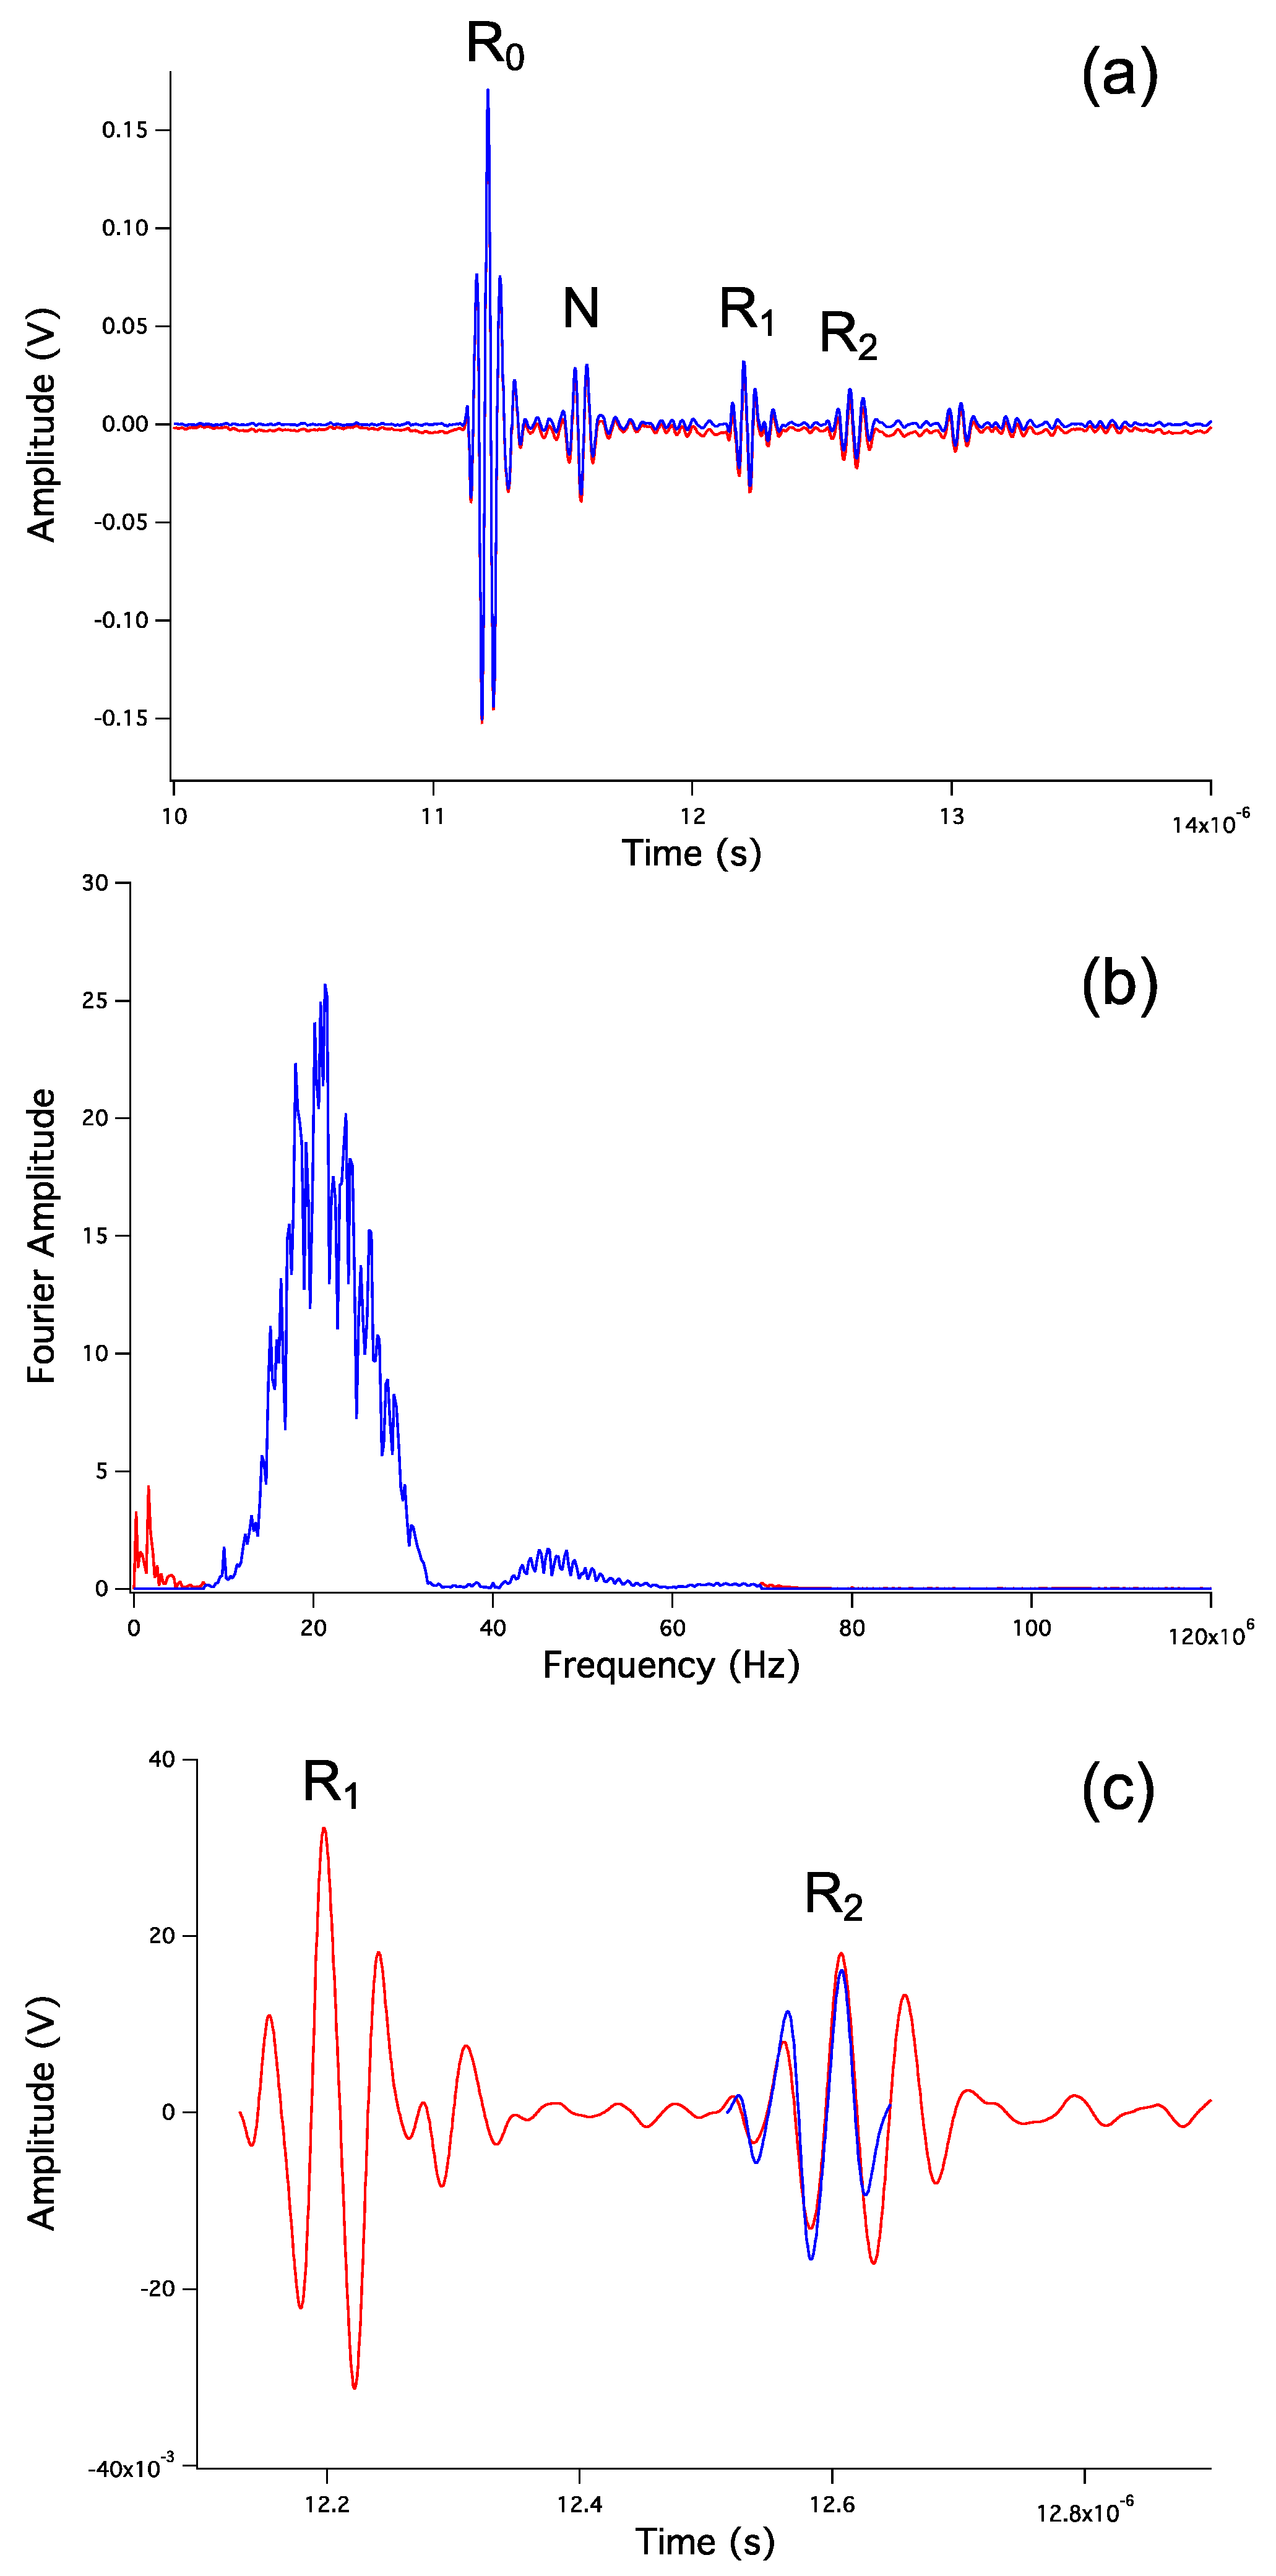
As an example, Figure 4a shows the signals recorded by the oscilloscope for the diopside liquid at ~3.8 GPa and ~2400 K [19]. The echoes reflected at the anvil–BR, BR–sample, and sample–BP interfaces are represented by R0, R1, and R2, respectively. We have developed an interactive program using the Igor Pro package (WaveMetrics, Inc., Portland, OR, USA). The source code of the Igor procedures and the user’s manual for the procedures are also provided in the Supplementary Materials. Here we describe the basic steps performed in the program.
(1) The raw signal recording (red curve in Figure 4a) was first corrected to remove the offset in amplitude such that the average amplitude was set to zero.
(2) The raw signals were then Fourier transformed using the Fast Fourier Transform (FFT) algorithm to obtain its frequency characteristics. Because the input signal for this particular measurement was a sine wave of 20 MHz, we see that a large fraction of energy was centered at about 20 MHz. However, there were some low-frequency noises below 10 MHz (and sometimes some high-frequency noises above 70 MHz) caused by the environment as those seen in Figure 2b. Some of these noises can be traced to the high AC currents from the stepper motors that drive the 1000-ton press to the desired position to collect radiographic image or diffraction data. To remove these low- and high-frequency noises, a band-pass filter was applied to remove unwanted information below 10 MHz and above 70 MHz. The resulting signals in the frequency domain (blue curve in Figure 2b) were then back transformed to the time domain. The resulting signals with noises removed are shown as the blue curve in Figure 2a. Further analyses of travel time were based on the corrected signals.
(3) The BR–sample echo (R1) was selected interactively using cursors from the beginning to the end of the echo. We then took a cross-correlation between the R1 echo and the R2 echo to determine the time lag that maximized the absolute value of the correlation. This time lag was the round-trip travel time for the sound wave to propagate through the liquid sample. It should be noted that for the sample cells described in this study, there was a 180° phase shift between the R1 and R2 echoes. This was because both BR and BP were made of the same material and depending on the impedance contrast between the sample and BR/BP, either R1 or R2 should have a negative reflection coefficient (i.e., a 180° phase shift from the incident signal), resulting in a 180° phase shift between R1 and R2. Therefore, the time lag at which the correlation is minimized (a negative value) should be chosen. Figure 2c shows that the R1 echo, when corrected for the time lag and flipped for the 180º phase shift, correlated with the R2 echo very well.

5.2. Sample Length Analysis

Figure 5a shows a raw sample image of diopside liquid at 3.8 GPa and ~2400 K. The sample was sandwiched by Mo BR and BP, and was enclosed by a sleeve also made of Mo. The wall of the Mo sleeve was thin enough for white X-ray beams to go through, hence creating an absorption contrast between the sample and the BR/BP rods. Because of the plastic deformation of Mo at very high temperatures, the Mo sleeve and the sample–BP interface were somewhat deformed close to the contact area between the sleeve and BP. This deformation is shown as a shaded area right below the sample–BP interface and has a brightness between the sample and the BP. Such a deformation, however, did not affect the sample length measurements much as most of the interface remained flat and identifiable in the image. The image was then processed by taking derivatives to find edges (Figure 5b) using the software package ImageJ [33]. Finally, the intensity of the image was integrated along the horizontal direction to obtain an intensity profile as a function of the vertical pixel position. The details of the sample length determination procedure are provided in the Ultrasonic Data Analysis Manual in the Supplementary Materials. As shown in Figure 5c, the BR–sample and sample–BP interfaces can be identified as the sharp peaks in the intensity profile. The pixel distance of the two interfaces multiplied by the length/pixel ratio from the camera calibration gives the sample lengths. The sound velocity of the liquid can then be calculated from the travel time and sample length. Tilting of the sample/BR and sample/BP interfaces can sometimes be identified from the sample images by observing the orientation and sharpness of the interfaces, but for most cases, it is less than 3°. The uncertainty in sample length measurements caused by such a small tiling angle would be only 0.14% (that is ( 1 cos 3 ° ) ) and is negligible. Severe tilting (larger than 10°) can be caused by compressing a very soft/porous sample between hard BR and BP. When that happened, the sound velocity data were discarded although the uncertainty in sample length is still only 1.5% at a 10° tilting angle.

5.3. Sound Velocity at High Pressures

The uncertainties in sound velocities are propagated from the uncertainties in travel time and sample length analyses. Because of the high sampling rate of the oscilloscope (6.25 GS/s), the uncertainty in travel time measurements was less than 0.2 ns, or only about 0.16%. The uncertainties in sample length measurements therefore dominated the overall uncertainty. Depending on how much the BR-sample and sample–BP interfaces have deformed, the uncertainty ranges between 0.5% and 2% [18,19].
The high-pressure velocity data can be combined with any number of density data points (at least one) to fit an EOS (e.g., the Birch–Murnaghan EOS) for a liquid. Thermodynamic properties including the thermal expansion coefficient and specific heat are required to relate the sound velocity and the adiabatic bulk modulus to the isothermal bulk modulus of the liquid. This type of fitting has been performed in several studies [18,19,21] and demonstrated tight constraints on the bulk modulus and the pressure derivative of the bulk modulus of the liquid. For example, Xu et al. [19] constrained the bulk modulus and the pressure derivative of the bulk modulus of diopside liquid to be 23.8 ± 0.4 GPa and 7.5 ± 0.5, respectively.

6. Conclusions

We have made a series of technical improvements to the in situ ultrasonic velocity measurements in the multianvil press at GSECARS beamline 13-ID-D at the Advanced Photon Source. With carefully prepared starting samples, suitable cell assemblies, sufficient cooling, and an automated data acquisition system, the current setup enables velocity measurements of Fe-alloying liquids up to ~2000 K at 8 GPa and silicate liquids up to ~2400 K at 4 GPa, and can be readily extended to measurements on other solid or liquid materials of geological or industrial interest. An interactive program has also been developed for the travel time data analysis. The experimental setup and software developed in this study have been made available at the GSECARS facility to the high-pressure mineral physics and materials science communities.

Supplementary Materials

The following are available online at https://www.mdpi.com/2075-163X/10/2/126/s1. File 1: Ultrasonic_Data_Acquisition.py; File 2: Travel_Time_In_Phase_2.ipf; File 3: Travel_Time_Out_Phase_2.ipf; File 4: Button.ipf; File 5: Ultrasonic_Data_Analysis_Manual.pdf.

Author Contributions

Conceptualization, Z.J., Y.W.; Methodology, Z.J., T.Y., M.X., J.C., Y.W.; Software, Z.J., T.Y.; Validation, Z.J.; Investigation, Z.J., M.X., J.C.; Resources, Z.J., T.Y., Y.W.; Data Curation, Z.J., T.Y., M.X.; Writing—Original Draft Preparation, Z.J.; Writing—Review & Editing, all authors; Visualization, Z.J.; Project Administration, Z.J., Y.W.; Funding Acquisition, Z.J., Y.W. All authors have read and agreed to the published version of the manuscript.

Funding

This work was partially supported by the National Aeronautics and Space Administration (NNX14AN01G), the National Science Foundation (EAR 1619964 and 1620548), and the National Natural Science Foundation of China (41974098). Experiments were performed at GeoSoilEnviroCARS (Sector 13), Advanced Photon Source (APS), Argonne National Laboratory. GeoSoilEnviroCARS is supported by the National Science Foundation - Earth Sciences (EAR-1128799) and Department of Energy-GeoSciences (DE-FG02-94ER14466). This research used resources of the Advanced Photon Source, a U.S. Department of Energy (DOE) Office of Science User Facility operated for the DOE Office of Science by Argonne National Laboratory under Contract No. DE-AC02-06CH11357.

Acknowledgments

We thank Yoshio Kono for his assistance with the ultrasonic setup and data analysis software.

Conflicts of Interest

The authors declare no conflicts of interest.

References

  1. Revenaugh, J.; Sipkin, S.A. Seismic evidence for silicate melt atop the 410 km mantle discontinuity. Nature 1994, 369, 474–476. [Google Scholar] [CrossRef]
  2. Schmandt, B.; Jacobsen, S.D.; Becker, T.W.; Liu, Z.; Dueker, K.G. Dehydration melting at the top of the lower mantle. Science 2014, 344, 1265–1268. [Google Scholar] [CrossRef] [PubMed]
  3. Gaillard, F.; Malki, M.; Iacono-Marziano, G.; Pichavant, M.; Scaillet, B. Carbonatite Melts and Electrical Conductivity in the Asthenosphere. Science 2008, 322, 1363–1365. [Google Scholar] [CrossRef] [PubMed] [Green Version]
  4. Rohrbach, A.; Schmidt, M.W. Redox freezing and melting in the Earth’s deep mantle resulting from carbon–iron redox coupling. Nature 2011, 472, 209–212. [Google Scholar] [CrossRef]
  5. Labrosse, S.; Hernlund, J.W.; Coltice, N. A crystallizing dense magma ocean at the base of the Earth’s mantle. Nature 2007, 450, 866–869. [Google Scholar] [CrossRef]
  6. Zhang, Z.; Dorfman, S.M.; Labidi, J.; Zhang, S.; Li, M.; Manga, M.; Stixrude, L.; McDonough, W.F.; Williams, Q. Primordial metallic melt in the deep mantle. Geophys. Res. Lett. 2016, 43, 3693–3699. [Google Scholar] [CrossRef] [Green Version]
  7. Liu, J.; Li, J.; Hrubiak, R.; Smith, J.S. Origins of ultralow velocity zones through slab-derived metallic melt. Proc. Natl. Acad. Sci. USA 2016, 113, 5547–5551. [Google Scholar] [CrossRef] [Green Version]
  8. Chantel, J.; Manthilake, G.; Andrault, D.; Novella, D.; Yu, T.; Wang, Y. Experimental evidence supports mantle partial melting in the asthenosphere. Sci. Adv. 2016, 2. [Google Scholar] [CrossRef] [Green Version]
  9. Agee, C.B.; Walker, D. Olivin flotation in mantle melt. Earth Planet. Sci. Lett. 1993, 114, 315–324. [Google Scholar] [CrossRef]
  10. Balog, P.S.; Secco, R.A.; Rubie, D.C.; Frost, D.J. Equation of state of liquid Fe-10 wt % S: Implications for the metallic cores of planetary bodies. J. Geophys. Res. 2003, 108, 2124. [Google Scholar] [CrossRef] [Green Version]
  11. Jing, Z.; Karato, S. Effect of H2O on the density of silicate melts at high pressures: Static experiments and the application of a modified hard-sphere model of equation of state. Geochim. Cosmochim. Acta 2012, 85, 357–372. [Google Scholar] [CrossRef]
  12. Sakamaki, T.; Ohtani, E.; Urakawa, S.; Suzuki, A.; Katayama, Y. Density of dry peridotite magma at high pressure using an X-ray absorption method. Am. Mineral. 2010, 95, 144–147. [Google Scholar] [CrossRef]
  13. Nishida, K.; Ohtani, E.; Urakawa, S.; Suzuki, A.; Sakamaki, T.; Terasaki, H.; Katayama, Y. Density measurement of liquid FeS at high pressures using synchrotron X-ray absorption. Am. Mineral. 2011, 96, 864–868. [Google Scholar] [CrossRef]
  14. Morard, G.; Siebert, J.; Andrault, D.; Guignot, N.; Garbarino, G.; Guyot, F.; Antonangeli, D. The Earth’s core composition from high pressure density measurements of liquid iron alloys. Earth Planet. Sci. Lett. 2013, 373, 169–178. [Google Scholar] [CrossRef]
  15. Asimow, P.D.; Ahrens, T.J. Shock compression of liquid silicates to 125 GPa: The anorthite-diopside join. J. Geophys. Res. 2010, 115, B10209. [Google Scholar] [CrossRef] [Green Version]
  16. Jing, Z.; Karato, S. Compositional effect on the pressure derivatives of bulk modulus of silicate melts. Earth Planet. Sci. Lett. 2008, 272, 429–436. [Google Scholar] [CrossRef]
  17. Weber, R.C.; Lin, P.-Y.; Garnero, E.J.; Williams, Q.; Lognonné, P. Seismic detection of the lunar core. Science 2011, 331, 309–312. [Google Scholar] [CrossRef] [Green Version]
  18. Jing, Z.; Wang, Y.; Kono, Y.; Yu, T.; Sakamaki, T.; Park, C.; Rivers, M.L.; Sutton, S.R.; Shen, G. Sound velocity of Fe–S liquids at high pressure: Implications for the Moon’s molten outer core. Earth Planet. Sci. Lett. 2014, 396, 78–87. [Google Scholar] [CrossRef]
  19. Xu, M.; Jing, Z.; Chantel, J.; Jiang, P.; Yu, T.; Wang, Y. Ultrasonic Velocity of Diopside Liquid at High Pressure and Temperature: Constraints on Velocity Reduction in the Upper Mantle Due to Partial Melts. J. Geophys. Res. Solid Earth 2018, 123, 8676–8690. [Google Scholar] [CrossRef]
  20. Nishida, K.; Kono, Y.; Terasaki, H.; Takahashi, S.; Ishii, M.; Shimoyama, Y.; Higo, Y.; Funakoshi, K.-I.; Irifune, T.; Ohtani, E. Sound velocity measurements in liquid Fe-S at high pressure: Implications for Earth’s and lunar cores. Earth Planet. Sci. Lett. 2013, 262, 182–186. [Google Scholar] [CrossRef]
  21. Terasaki, H.; Rivoldini, A.; Shimoyama, Y.; Nishida, K.; Urakawa, S.; Maki, M.; Kurokawa, F.; Takubo, Y.; Shibazaki, Y.; Sakamaki, T.; et al. Pressure and Composition Effects on Sound Velocity and Density of Core-Forming Liquids: Implication to Core Compositions of Terrestrial Planets. J. Geophys. Res. Planets 2019, 124. [Google Scholar] [CrossRef]
  22. Nishida, K.; Suzuki, A.; Terasaki, H.; Shibazaki, Y.; Higo, Y.; Kuwabara, S.; Shimoyama, Y.; Sakurai, M.; Ushioda, M.; Takahashi, E.; et al. Towards a consensus on the pressure and composition dependence of sound velocity in the liquid Fe–S system. Phys. Earth Planet. Int. 2016, 257, 230–239. [Google Scholar] [CrossRef]
  23. Kuwabara, S.; Terasaki, H.; Nishida, K.; Shimoyama, Y.; Takubo, Y.; Higo, Y.; Shibazaki, Y.; Urakawa, S.; Uesugi, K.; Takeuchi, A.; et al. Sound velocity and elastic properties of Fe–Ni and Fe–Ni–C liquids at high pressure. Phys. Chem. Miner. 2015, 43, 229–236. [Google Scholar] [CrossRef]
  24. Wang, Y.; Rivers, M.L.; Sutton, S.R.; Nishiyama, N.; Uchida, T.; Sanehira, T. The large-volume high-pressure facility at GSECARS: A “Swiss-army-knife” approach to synchrotron-based experimental studies. Phys. Earth Planet. Int. 2009, 174, 270–281. [Google Scholar] [CrossRef]
  25. Leinenweber, K.D.; Tyburczy, J.A.; Sharp, T.G.; Soignard, E.; Diedrich, T.; Petuskey, W.B.; Wang, Y.; Mosenfelder, J.L. Cell assemblies for reproducible multi-anvil experiments (the COMPRES assemblies). Am. Mineral. 2012, 97, 353–368. [Google Scholar] [CrossRef]
  26. Tange, Y.; Nishihara, Y.; Tsuchiya, T. Unified analyses for P-V-T equation of state of MgO: A solution for pressure-scale problems in high P-T experiments. J. Geophys. Res. 2009, 114, B03208. [Google Scholar] [CrossRef]
  27. Kono, Y.; Park, C.; Sakamaki, T.; Kenny-Benson, C.; Shen, G.; Wang, Y. Simultaneous structure and elastic wave velocity measurement of SiO2 glass at high pressures and high temperatures in a Paris-Edinburgh cell. Rev. Sci. Instrum. 2012, 83, 033905. [Google Scholar] [CrossRef] [Green Version]
  28. Williams, D.W.; Kennedy, G.C. Melting curve of diopside to 50 kilobars. J. Geophys. Res. 1969, 74, 4359–4366. [Google Scholar] [CrossRef]
  29. Chantel, J.; Jing, Z.; Xu, M.; Yu, T.; Wang, Y. Pressure Dependence of the Liquidus and Solidus Temperatures in the Fe-P Binary System Determined by In Situ Ultrasonics: Implications to the Solidification of Fe-P Liquids in Planetary Cores. J. Geophys. Res. Planets 2018, 123, 1113–1124. [Google Scholar] [CrossRef]
  30. van Westrenen, W.; Van Orman, J.A.; Watson, H.; Fei, Y.; Watson, E.B. Assessment of temperature gradients in multianvil assemblies using spinel layer growth kinetics. Geochem. Geophys. Geosyst. 2003, 4, 1036. [Google Scholar] [CrossRef] [Green Version]
  31. Watson, E.B.; Wark, D.A.; Price, J.D.; Van Orman, J.A. Mapping the thermal structure of solid-media pressure assemblies. Contrib. Mineral. Petrol. 2002, 142, 640–652. [Google Scholar] [CrossRef]
  32. Li, B.; Chen, K.; Kung, J.; Liebermann, R.C.; Weidner, D.J. Sound velocity measurement using transfer function method. J. Phys. Condens. Matter 2002, 14, 11337–11342. [Google Scholar] [CrossRef]
  33. Schneider, C.A.; Rasband, W.S.; Eliceiri, K.W. NIH Image to ImageJ: 25 years of image analysis. Nat. Methods 2012, 9, 671–675. [Google Scholar] [CrossRef] [PubMed]
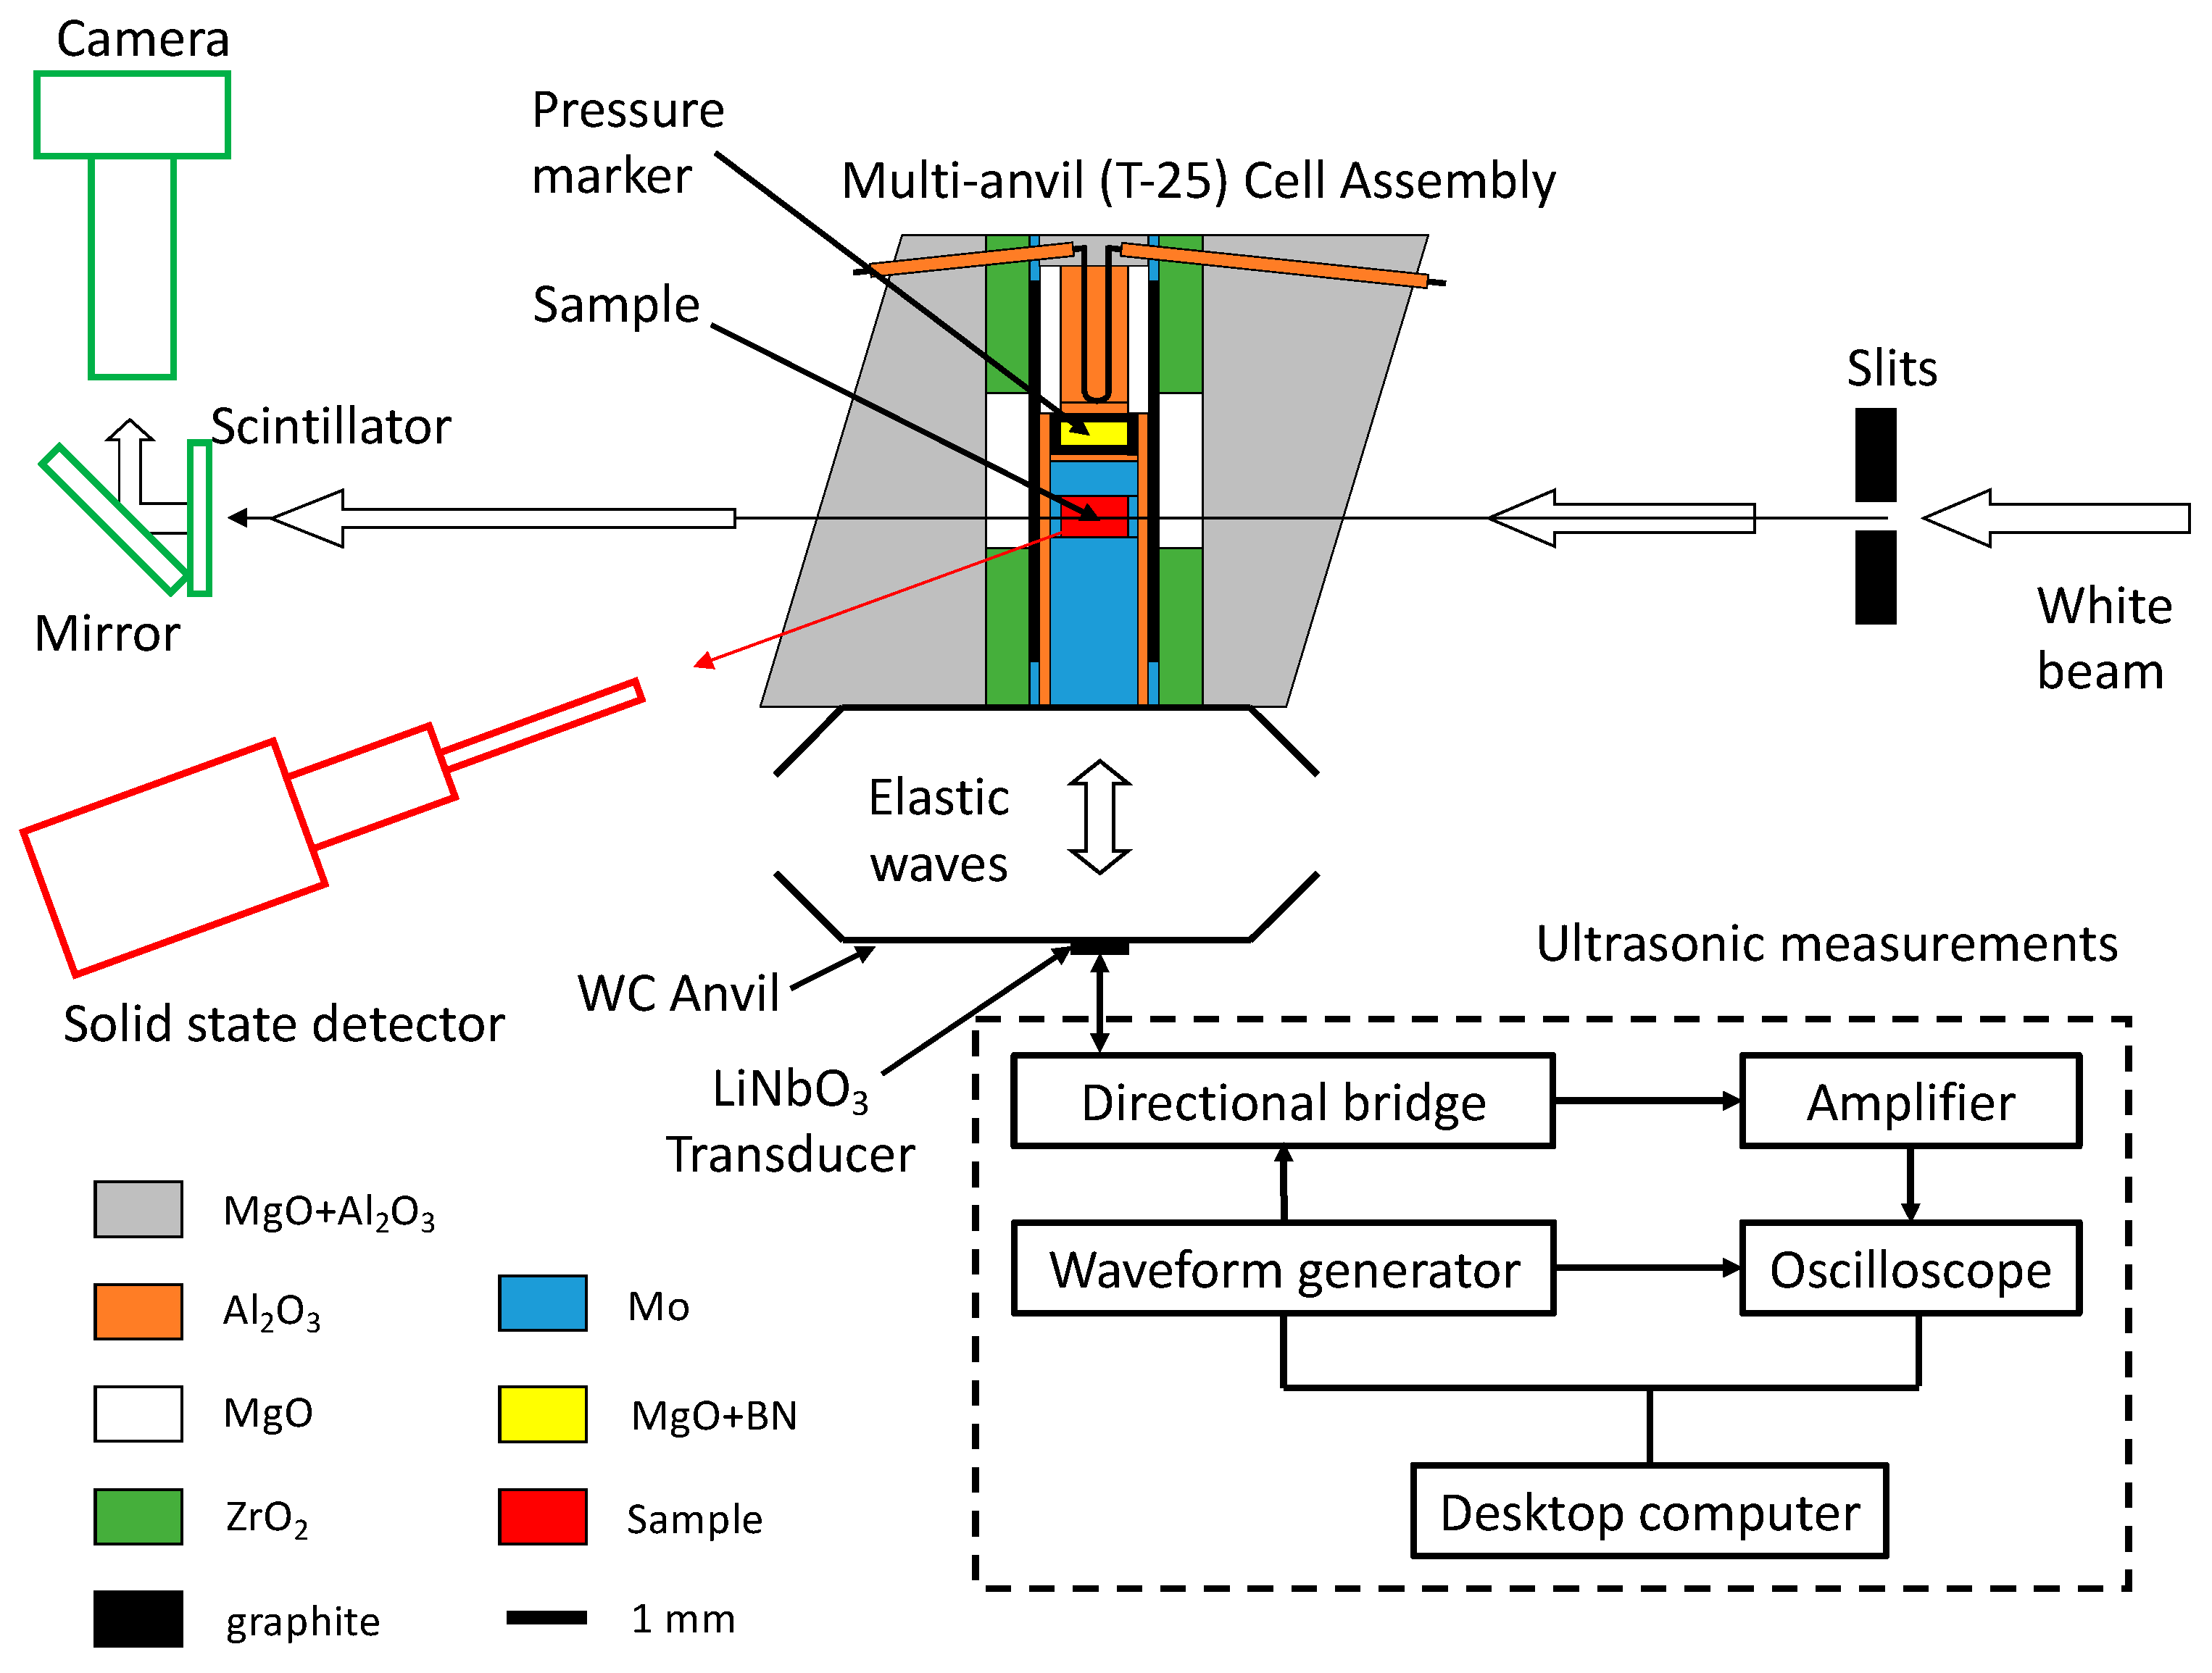
Figure 1. Experimental setup at the GSECARS beamline 13-ID-D of APS for high-pressure ultrasonic sound velocity measurements of liquids in a Kawai-type multianvil apparatus (T-25).
Minerals 10 00126 g001
Figure 2. (a) Schematic diagram for the sound velocity travel paths in the cell assembly. R0, R1, and R2 represent reflected sound waves from the anvil–BR, BR–sample, and sample–BP interfaces, respectively. (b) and (c) Schematic drawings of cell assemblies used for sound velocity measurements on Fe-alloying liquids and silicate liquids, respectively.
Minerals 10 00126 g002
Figure 3. Flowchart for the automated data acquisition program used for ultrasonic sound velocity measurements.
Minerals 10 00126 g003
Figure 4. (a) P-wave ultrasonic signals of diopside (CaMgSi2O6) liquid at 3.8 GPa and ~2400 K. R0, R1, and R2 represent reflected sound waves from the anvil–BR, BR–sample, and sample–BP interfaces, respectively. N represents an artificial echo that resulted from the unmatched impedance between the coaxial cable. The time delay between R0 and N does not depend on the changes that happen in the cell assembly, and is small enough that N does not interfere with R1 and R2. The raw data are shown in red. The blue curve shows the data corrected for offset in voltage and band-pass filtered to remove low- and high-frequency noises. (b) The Fourier transformed signals in the frequency domain. The red curve shows the entire transformed waveform and the blue curve shows the waveform after removing the low- and high-frequency noises. (c) The segment of P-wave signals showing the R1 and R2 echoes (red). The blue curve shows the shifted and flipped R1 echo that results in the maximum correlation between the flipped R1 and R2. This time shift is the round-trip travel time for sound waves propagating through the liquid sample.
Minerals 10 00126 g004
Figure 5. (a) Raw image of the liquid diopside sample and cell assembly at 3.8 GPa and ~2400 K. The image is partially saturated on the rightmost part to show the details of the sample–BP interface. (b) Processed image to find edges in the image by taking derivatives in the ImagJ software. (c) Integrated intensity of the processed image along the horizontal direction as a function of the vertical position. The BR–sample and sample–BP interfaces are identified as sharp peaks in the plot. Red dashed lines indicate the positions of the BR-sample and sample–BP interfaces.
Minerals 10 00126 g005