Article

A New Reference for the Thermal Equation of State of Iron

1
Sorbonne Université, UMR CNRS 7590, Muséum National d’Histoire Naturelle, Institut de Minéralogie, de Physique des Matériaux et de Cosmochimie, IMPMC, 75005 Paris, France
2
Laboratoire de Géologie de Lyon, Université de Lyon, UMR CNRS 5276, 69007 Lyon, France
3
Synchrotron SOLEIL, L’Orme des Merisiers, 91192 Gif-sur-Yvette, France
4
Université de Paris, Institut de physique du globe de Paris, CNRS, 1 rue Jussieu, 75005 Paris, France
5
École Polytechnique Fédérale de Lausanne, CH-1015 Lausanne, Switzerland
*
Author to whom correspondence should be addressed.
Minerals 2020, 10(2), 100; https://doi.org/10.3390/min10020100
Submission received: 23 December 2019 / Revised: 17 January 2020 / Accepted: 18 January 2020 / Published: 24 January 2020
(This article belongs to the Special Issue Mineral Physics—In Memory of Orson Anderson)

Abstract

:
The high-pressure, high-temperature behavior of iron was investigated to 140 GPa and 3500 K with in situ synchrotron X-ray diffraction. Iron samples were compressed in diamond-anvil cells and heated up with the double-sided laser-heating system installed at the high-pressure ID27 of the European Synchrotron Radiation Facility (ESRF). Three different structures, namely α-bcc, γ-fcc or ε-hcp Fe were identified as a function of pressure and temperature in the domain we explored. At pressures above 90 GPa, it is clearly shown that ε-iron is the single stable solid phase up to 160 GPa at high temperatures. The analysis of the P-V-T relationship allows us to propose a reliable experimental thermal equation of state (EoS) for iron. We also show that the addition of low pressure points to our EoS refinement yields more robust constrain on the determination of the reference volume V0 of the ε-hcp structure, which has important implications on the final parametrization of the equation of state. The extrapolation of the proposed EoS to core pressure conditions indicates that a pure iron core would have an excess of density of 3% compared to the PREM density profile.

1. Introduction

Iron is considered to be the main constituent of the Earth’s core. Cosmochemical abundances and iron meteorites also support the idea that iron is present in numbers of planetary cores. Since the first pioneering work [1], a wealth of data has been produced on iron structure at extreme pressure and temperature, elastic properties or transport properties [2,3,4,5,6], so as to yield a precise model of the structure, composition and dynamics of the Earth’s core. A lot of studies focus on the determination of a phase diagram for iron at relevant pressure and temperature conditions [4,6,7,8,9]. Light elements have also been shown to be incorporated in the core (see [10] for a review), in order to match density and sound waves velocities obtained by seismological modelling. These light elements produce significant variations of density and elastic properties of the alloys. The nature and amount of light elements has been recently re-examined and models built on a comparison of elastic properties of alloys with those of the Earth’s core [11,12]. These studies indicate that silicon (with ca 2–3 wt %) is the main alloying element in the Earth’s inner core, and oxygen likely to be the main light element of the Earth’s liquid outer core, in agreement with cosmochemical abundances [13,14]. This exercise, however, can only be done when reliable thermal equations of state are available. In this respect, because high pressure and temperature experiments on relevant metallic alloys are not available, most constraints arise from measurements carried out on pure iron. The latest measurements carried out on the structure of iron at pressure and temperature conditions of the Earth’s center have shown the ε-hcp structure (defined hereafter as hcp) is favored [6], provided light elements or nickel content is not too large [15]. As for other properties, a wealth of ambient temperature and thermal equations of state has been reported for hcp Fe. These equations of state have been established either using first principles calculations [16,17,18]. Experiments were carried out at moderate pressures (20–30 GPa) and temperatures between 300 and 1500 K [19,20,21] in multi-anvils large volume devices. The investigated pressure range was extended up to 300 GPa with the use of diamond anvil cells [22,23,24,25,26], however, when reliable measurements are available to 200 GPa at room temperature, the thermal component of the equation of state is either calculated so as to provide a thermal equation of state [24] or constrained by a limited number of data points collected simultaneously at high pressure and temperature [25]. In the existing literature several sets of parameters of the ambient temperature equation of state (V0, K0, and K0’, see also Table 3 in [26]) and the thermal model (θ, γ, q) were proposed. In particular, V0 has values that spans from 22.15 Å3 [21] to 22.7 Å3 [26], K0 is comprised between 202 GPa [21] and 135 GPa [320] and K0’ between 4.5 [21] and 6 [20].
In this study, we conducted a series of experiments in order to establish a new experimental thermal equation of state of iron, built on a large number of experimental points collected simultaneously at high pressure and high temperature. Measurements of molar volume of hcp iron are reported to 140 GPa and temperatures up to 3500 K. These experiments have been performed at the high-pressure beamline ID27 of the ESRF. Combined with measurements obtained at room-temperature, it allows us to establish a reliable thermal equation of state that can be extrapolated to core conditions Our results are discussed in the light of measurements obtained for pure iron at core conditions [6] and compared to recent melting line data and reference thermal equations of state from the literature [20,24,25].

2. Methods

2.1. Samples

We prepared a mixture of fine grained iron (source 99.999% purity, 1–2 μm grain size) which was dispersed in a matrix of MgO (Prolabo, spectroscopic grade). MgO powder was first fired at temperatures above 1000 °C during several hours before being mixed with about 10% iron in weight and subsequently hot-pressed for 24 h at 1.5 GPa and 800 K in a piston cylinder under reducing conditions so as to obtain a compact composite polycrystalline sample, free from any iron oxides. This sample was then subsequently thinned down to a 15 μm thick wafer in which discs of 30 μm in diameter were shaped using femtosecond laser micromachining, and finally loaded in a diamond-anvil cell under a dry neon atmosphere in a 2000 bar gas vessel. In our experiments, neon acted as a pressure transmitting medium and thermal insulation. A combination of flat (culets 300 microns in size) and beveled diamonds (150–300 and 100–300 µm in size) were used for these experiments. Gaskets were made from a rhenium foil initially 200 microns in thickness, pre-indented to thicknesses of 30 to 20 µm before pressure chambers were drilled. A set of low-pressure measurements was also carried out using helium as a pressure transmitting medium so as to add solid constraints on the determination of the reference volume V0 for the hcp structure. In this set of measurements, pressure measurements were provided by the fluorescence of ruby in perfect hydrostatic and quasi-hydrostatic conditions pressures up to 40 GPa and back down to 10 GPa.

2.2. High Pressure Laser Heating

Diamond-anvil cell samples kept at high-pressure within neon pressure medium were then heated up using two infrared lasers sources, composed of two vertically polarized high power–high stability Nd-YAG diode pumped lasers from Spectra Physics. These lasers operate in the TEM00 mode and are able to generate a continuous total laser power of 80 W (40 W for each laser) at a wavelength of 1.064 μm. This very high power is largely sufficient to heat any metals or opaque materials well above 3000 K in the megabar regime. The IR beams were focused onto the sample through the diamonds at an angle of 16° from the normal of the diamond-anvil surface with aplanatic objectives (f = 120 mm). These lasers also provide an excellent power and beam pointing stability; the peak-to-peak power variation is indeed better than 0.2% in the 0.1–1000 Hz frequency domain; and the pointing variations are better than 100 μrad. These two parameters are crucial because the sample temperature and temperature distribution are directly correlated to their variation.

2.3. Temperature Measurement

As for temperature profile and peak temperatures measurements, we used optimized Schwarzschild-type reflecting microscope objectives totally free of chromatic aberrations. The two reflective objectives are vertically and horizontally mounted on high-precision translations. Temperatures are classically measured using the multi-wavelength spectral radiometry, where the emitted light is analyzed using a Jobin-Yvon CCD camera (model ATE-1024 × 256) mounted on an Acton spectrograph (model SP556i,). This spectrometer is equipped with a grating optimized for the temperature measurements. The grating is 150 gr/mm blazed at 500 nm and covers the wavelength domain 480–820 nm, with a central wavelength at 650 nm. The sample temperature is measured on an image spatially filtered by a pinhole positioned in front of the entrance slit to avoid any temperature errors induced by the spatial nonlinearity of the CCD camera. The spatial resolution is fixed by the pinhole entrance, and corresponds to a spatial resolution of about 4 μm on the sample.
In practice, the temperatures are measured using the multi-wavelength radiometry method. The collected thermal radiation is analysed over a wavelength domain of 500–800 nm and is fitted to a Planck law (Equation (1)), which expresses the spectral intensity I(λ,T) as a function of the emissivity ε(λ,T) and the temperature T:
I ( λ , T ) = ε ( λ , T ) c 1 λ 5 [ e ( c 2 / λ T ) 1 ] 1
where λ is the wavelength and c1 and c2 are two constants.
It is necessary to determine the system response R(λ,Tref) at a fixed temperature Tref in order to extract the correct temperature and emissivity. The system response has the following expression:
R ( λ , T 0 ) = S ( λ ) ε ( λ , T ref ) c 1 λ 5 [ e ( c 2 / λ T ref ) 1 ] 1
where S(λ) is the normalized system response.
In our experiments, the normalized system response S(λ) has been obtained from the measured intensities of a tungsten lamp that is calibrated to temperature (Tref was set at 2650 K in this experiment). Details about our calibration lamp and procedures are provided in [27].

2.4. X-Ray Optics and Diffraction

The X-ray optical elements are composed of a nitrogen-cooled channel-cut Si(111) monochromator located in the optics hutch at 30 m from the source and a pair of multilayer mirrors in the KB geometry are installed in the experimental hutch to focus the monochromatic beam on the pressurized sample. As already mentioned, the quality of focusing optics at high X-ray energies is of primary importance in high-pressure experiments because of the very small sample volume. KB mirrors made of iridium–alumina multilayers deposited on silicon wafers have a maximum of 80% reflectivity at 30 keV (see [28] for more details). Large focal distances of 800 mm and 1200 mm are used for the horizontal and the vertical mirrors, respectively, in order to avoid serious loss of spatial resolution on the detector. A wavelength of 0.26472 Å (samarium k-edge @ 46.8 keV) has been chosen for this experiment. At such energy, the focal spot at sample location is 2.7 × 1.8 μm2 (full width at half maximum). With such a spatial resolution, we are confident we can eliminate most radial temperature gradients. As iron particles dispersed in MgO platelets have grain size of 1–2 µm, axial temperature gradients are expected to be as reduced as possible. As a matter of a fact, X-ray diffraction pattern presented in Figure 1 does not show any peak broadening compared to ambient temperature data.
The present data set has been collected in a former configuration of the ID27 beamline at the ESRF and is presently re-analyzed in this paper. X-ray images were recorded on a MAR345 image-plate scanner, with acquisition time varying between 15 and 120 s. Diffraction images were integrated with Fit2D software [29]. The integrated one-dimensional diffraction patterns were analyzed with the General Structure Analysis System (GSAS) software package [30] using the Le Bail method to refine lattice parameters (see Figure 1a,b).

2.5. Pressure Measurements

MgO was used as pressure calibrant in all runs, exception made for the room-temperature low-pressure experiments for which helium was used as a pressure medium. The volumes, obtained with a Le Bail fit made on the diffraction patterns, were subsequently used in a thermal equation of state with a Mie Grüneisen Debye formalism to obtain accurate pressure measurements at high-temperature. In particular, after careful evaluation of the results obtained employing two different MgO EoS [31,32] (see details and Figure S1 in Supplementary Materials) and following the discussion in [33] we opted for the one proposed by Speziale et al. [31]. The pressure measurements with the MgO thermal EoS is of course central to our exercise. We thus analyzed some recovered samples with TEM microscopy (JEOL 2100F, see details and Figure S2 in Supplementary Materials). to check the integrity of MgO and the absence of chemical reaction/diffusion between MgO and iron. These measurements, available in Supplementary Materials, show that iron diffusion into MgO never exceeds 1 at% when detected. For the room-temperature low-pressure measurements carried out using helium as pressure transmitting medium, we used the combination of two gauges: ruby with the hydrostatic scale (exponent 7.665 for the power law) [34] and SrB4O7:Sm2+ [35].

2.6. Equation of State and Thermal Model

Several formalisms are classically proposed to express the variation of a volume with pressure. Here we used a Birch Murnaghan EoS at the third order, defined as:
P = 3 2 K 0 [ ( V 0 V ) 7 3 ( V 0 V ) 5 3 ] { 1 + 3 4 [ K 0 4 ] [ ( V 0 V ) 2 3 1 ] }
With V the unit cell volume, V0 the unit cell volume at ambient pressure, K0 the bulk modulus, and K0’ its pressure derivative.
The high-temperature behaviour is described by the thermal pressure (ΔPth).
P ( V , T ) = P ( V , 300 K ) + Δ P th ( V , T )
The thermal pressure takes in account the vibrational energy of the lattice and is written as:
Δ P th ( V , T ) = γ ( V ) γ [ E th ( V , T ) , E th ( V , 300 K ) ]
where γ stands for the Grüneisen parameter, θD the Debye temperature and R is the ideal gas constant. The Grüneisen parameter (γ) is expressed as
γ ( V ) = γ 0 ( V V 0 ) q
with q corresponding to the logarithmic volume dependence of γ(V).
The internal energy is defined as:
E t h ( V , T ) = 9 R [ θ D 8 + T ( T θ D ) 0 θ 0 , D / T x 3 exp ( x ) 1 dx ]
The Debye temperature is a function of the Grüneisen parameter (γ)
θ D = θ D , 0 exp [ ( γ 0 γ ( V ) ) q ]
All refinements were carried out using EosFit-7c [36].

3. Results and Discussion

3.1. Iron Structure at High-Pressure and High-Temperature

The diffraction patterns recorded between 30 GPa and 140 GPa at temperatures varying from ambient temperature to 3400 K, display how the face centered cubic (fcc) structure is stable at low pressure and high temperature and further transforms into the hexagonal closed packed (hcp) structure above 60 GPa. The recorded transition is consistent with most recent experimental results [9]. The cell parameters for the hexagonal closed packed structure have a linear and monotonous evolution with temperature, with no kink or inversion in the axial compressibility of c and a axis as a function of pressure.

3.2. Room Temperature Equation of State

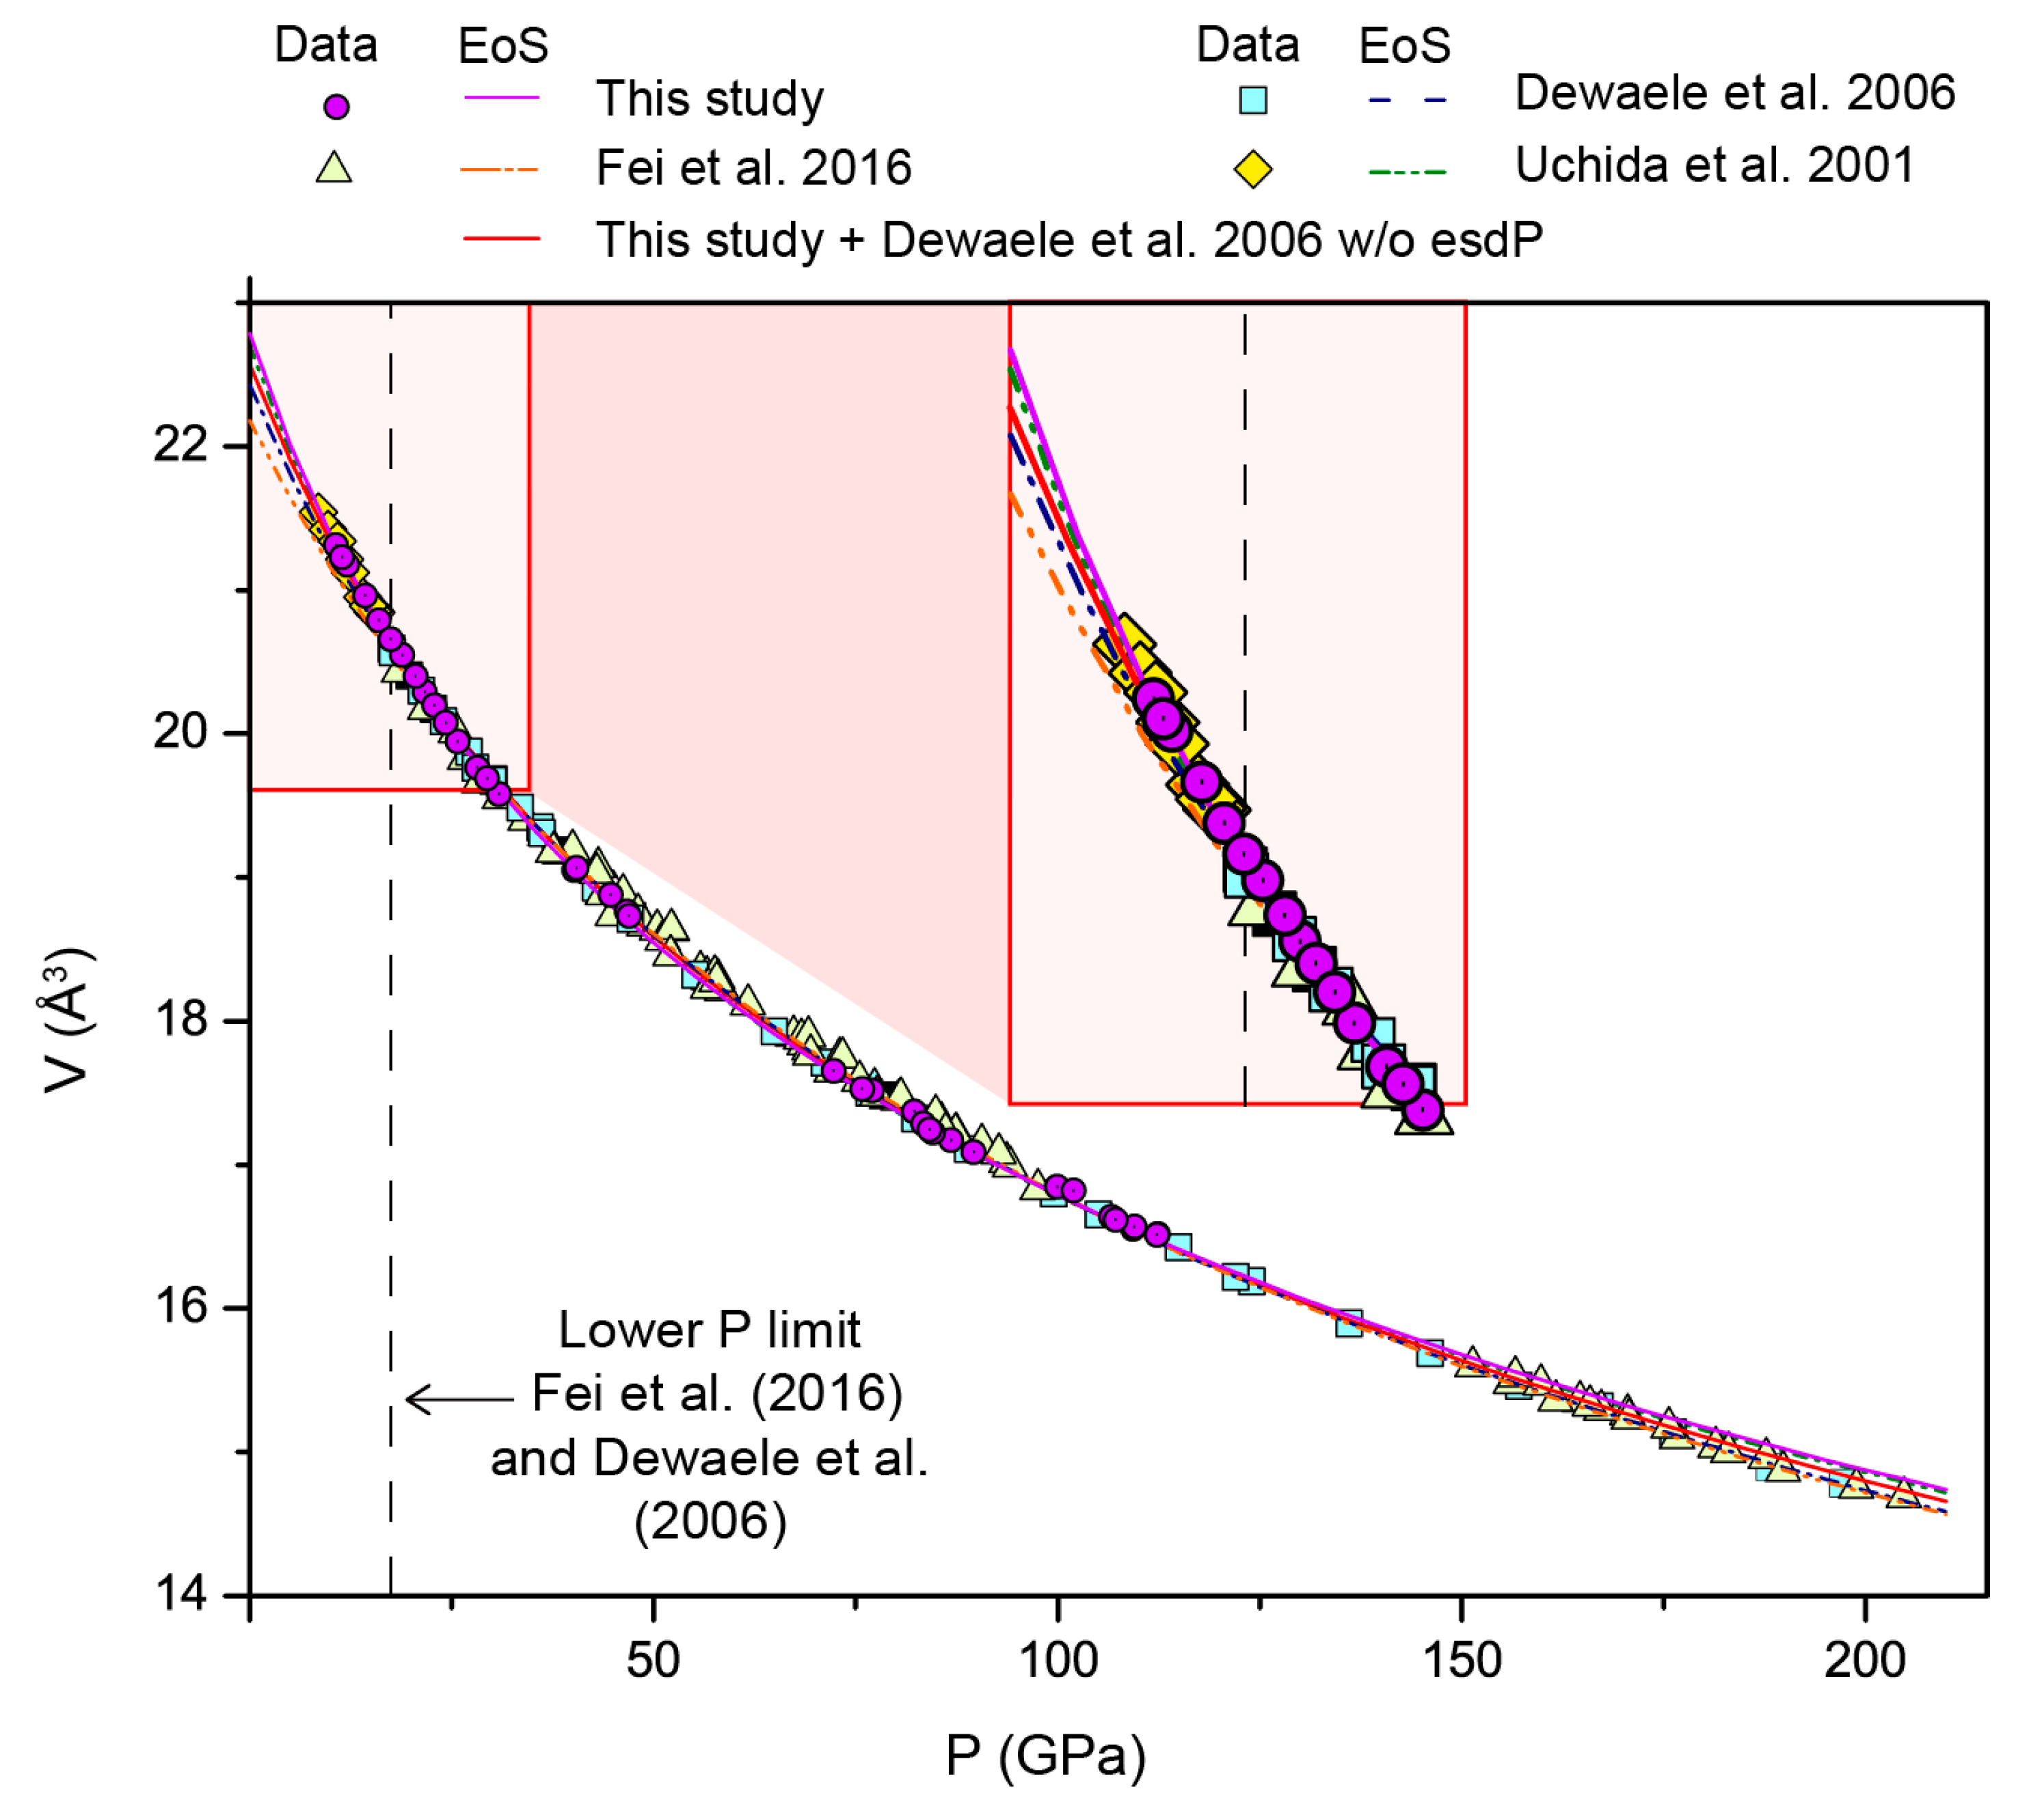
The ambient temperature EoS was refined with data points from both the P–V and P–V–T data sets. The collected volumes are in good agreement with the diamond anvil cell data recorded from previous studies [24,25] as well as with the multi anvil data from [20] (see Figure 2).
A Birch Murnaghan and a Vinet equations of state at the third order were fitted to the experimental data. Refined values are reported in Table 1. The results obtained with the two EoS formalisms are in agreement within the error bars.
When compared with the existing equations of state determined with diamond anvil cell data only [20,21], our results indicate a lower K0 and higher K0’ and V0. We are instead in agreement within the error bars with the parameters proposed combining data from multi anvil press [20] and former DAC studies [24,25] (Figure 2). In all these studies the results from fitting procedures have to be considered as fitting parameters and should be used carefully when used to extrapolate materials properties.
We evaluated if the different pressure ranges of the available sets of data had an effect on the value of the EoS parameters. Excluding the points at lower pressures from our data set (in particular the points collected below 30 GPa in helium), the refinement of the EoS produces a set of parameters with a high V0 and K0’ (respectively 23.31 Å3 and 7.03) and low K0 (104 GPa).
The outcome is different if we consider our full dataset (with the low pressure data) and include those from Dewaele and co-authors [24] in the refinement procedure, to extend the covered pressure range. In this case we obtain an equation of state consistent within the error bars with our results (i.e., 129 ± 6 GPa and 134 ± 5 GPa). However, the extrapolated EoS (solid purple line in Figure 2) shows a small offset above 150 GPa compared to the experimental data [24,25]. A better agreement between the volumes extrapolated and the high-pressure data is obtained when the uncertainties in pressures are excluded during the EoS refinement. The refinement then converges toward a higher K0 and lower V0 and K0’ (see Table 1—column w/o esdP). When plotted (red solid line in Figure 2), it reproduces the high-pressure evolution of the experimental volumes of reference [20]. This observation points out some limitations of the experimental approach and leaves some room for discussion about combining datasets using different pressure standards (MgO and ruby versus ruby and tungsten [20]), and about the way how uncertainties are taken into account in the refinement procedure.
It is noteworthy how a significant shift in the refined parameters is induced by a difference in the volume at zero pressure, resulting from the different pressure range examined. Indeed, the presence of our low pressure data collected with helium as pressure transmitting medium yields a much better constraint on the refinement of the V0 of the hcp structure that has in turn a significant effect on the refined EoS and on the possibility of establishing material properties.
This is clearly shown in Figure 2, where different data sets and refined equations of state are reported. The lower pressure part is upscaled to enhance the different EoS and V0 obtained, when data collection starts above 20 GPa only [24,25] or when the refinement includes data down to 10 GPa in hydrostatic conditions. Like other studies, the present results confirm the existence of a significant trade-off between the EoS parameters representing volume at zero pressure and the bulk modulus. It also points out that EoS fitting parameters obtained by different studies should be used with caution when extrapolating material properties outside the pressure and temperature range studied experimentally. The choice of V0 has a strong effect on the values of the EoS, stronger than the addition of high-pressure points. It has therefore a significant effect on the extrapolation of the properties of iron. As a matter of a fact, if we choose to fix the reference volume V0 at 22.43 Å3 as in [24], the fit made to our own set of data then converges to a bulk modulus in perfect agreement with this latter set of measurements and refined ambient temperature EoS parameters.
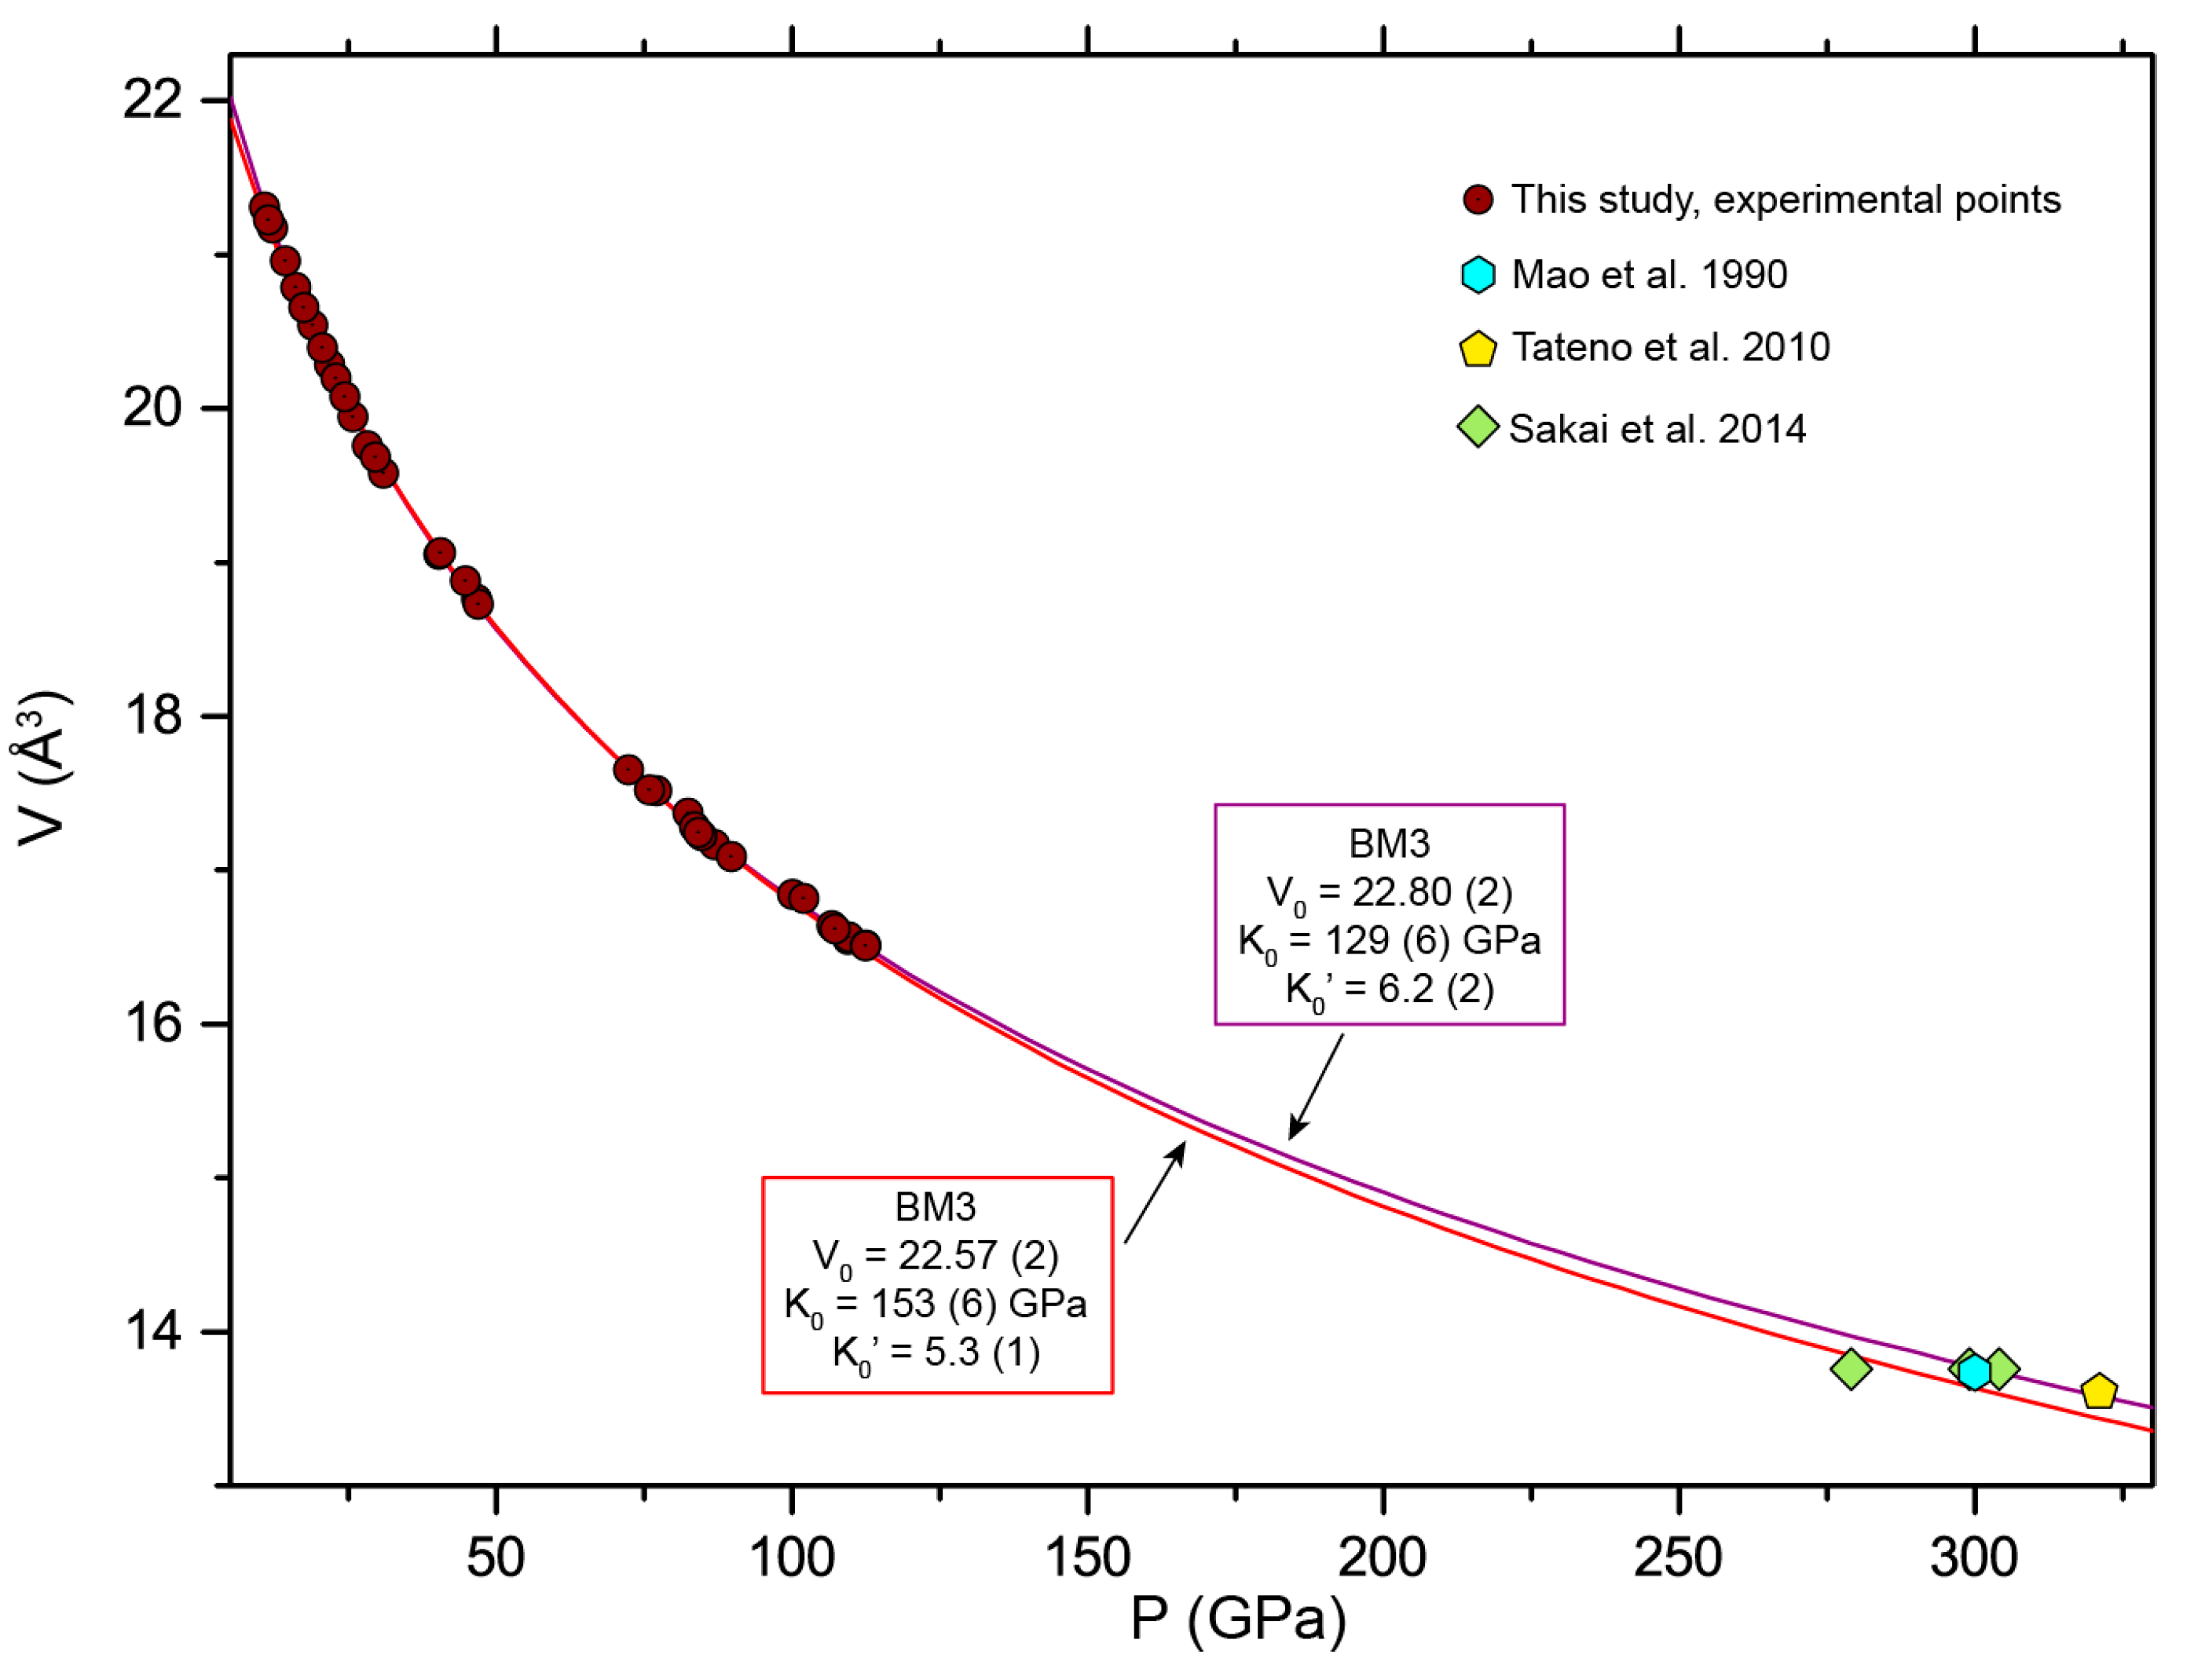
Finally we tested the EoS obtained with the present dataset, and the one determined adding the values from [24] and determined without the uncertainties in pressure, against measurements carried out at inner core pressures [6,22,26]. This test is presented in Figure 3.
When compared to experimental data collected at the highest pressures [6,22,26], the extrapolation with the alternate EoS (K0 = 153 GPa, K’0 = 5.3, V0 = 22.57 Å3) produces smaller volumes, in agreement with the point obtained by Sakai et al. [26] using the P1 calibration (see details in [26]) but fails to reproduce other measurements. The extrapolation with the EoS obtained using only the dataset from the present study (K0 = 129 GPa, K’0 = 6.2, V0 = 22.80 Å3) perfectly matches the measurements published so far at conditions close to the actual pressure and temperature of the inner core / outer core boundary [6,22,26]. Accordingly, we retain the EoS obtained with our experimental data only as the best solution.

3.3. Thermal Model

P–V–T data were collected at temperatures comprised between 1300 and 3300 K and pressures between 45 and 135 GPa. We used the parameters refined with the Birch Murnaghan at 3rd order discussed above (K0 = 129 GPa, K’0 = 6.2, V0 = 22.80 Å3) as a reference for the room temperature EoS and the Mie Grüneisen Debye formalism for the thermal model.
A stepwise regression refinement procedure was used: we first refined the parameters of the thermal model only (θD, γ, q) with the others fixed (V0, K0, K0’). We then determined also bulk modulus and first pressure derivative through an iterative procedure. We kept the V0 fixed to the value obtained at room temperature and identified several solutions, either keeping θD fixed to a commonly accepted value (i.e., 420 K) or including it in the refined parameters. However, in the latter case, it was difficult to find a univocal solution and convergence was not always achieved. Conversely, with a fixed θD, the refinement cycles ran smoothly and produced accurate results as shown by the low chi2 and pressure residuals.
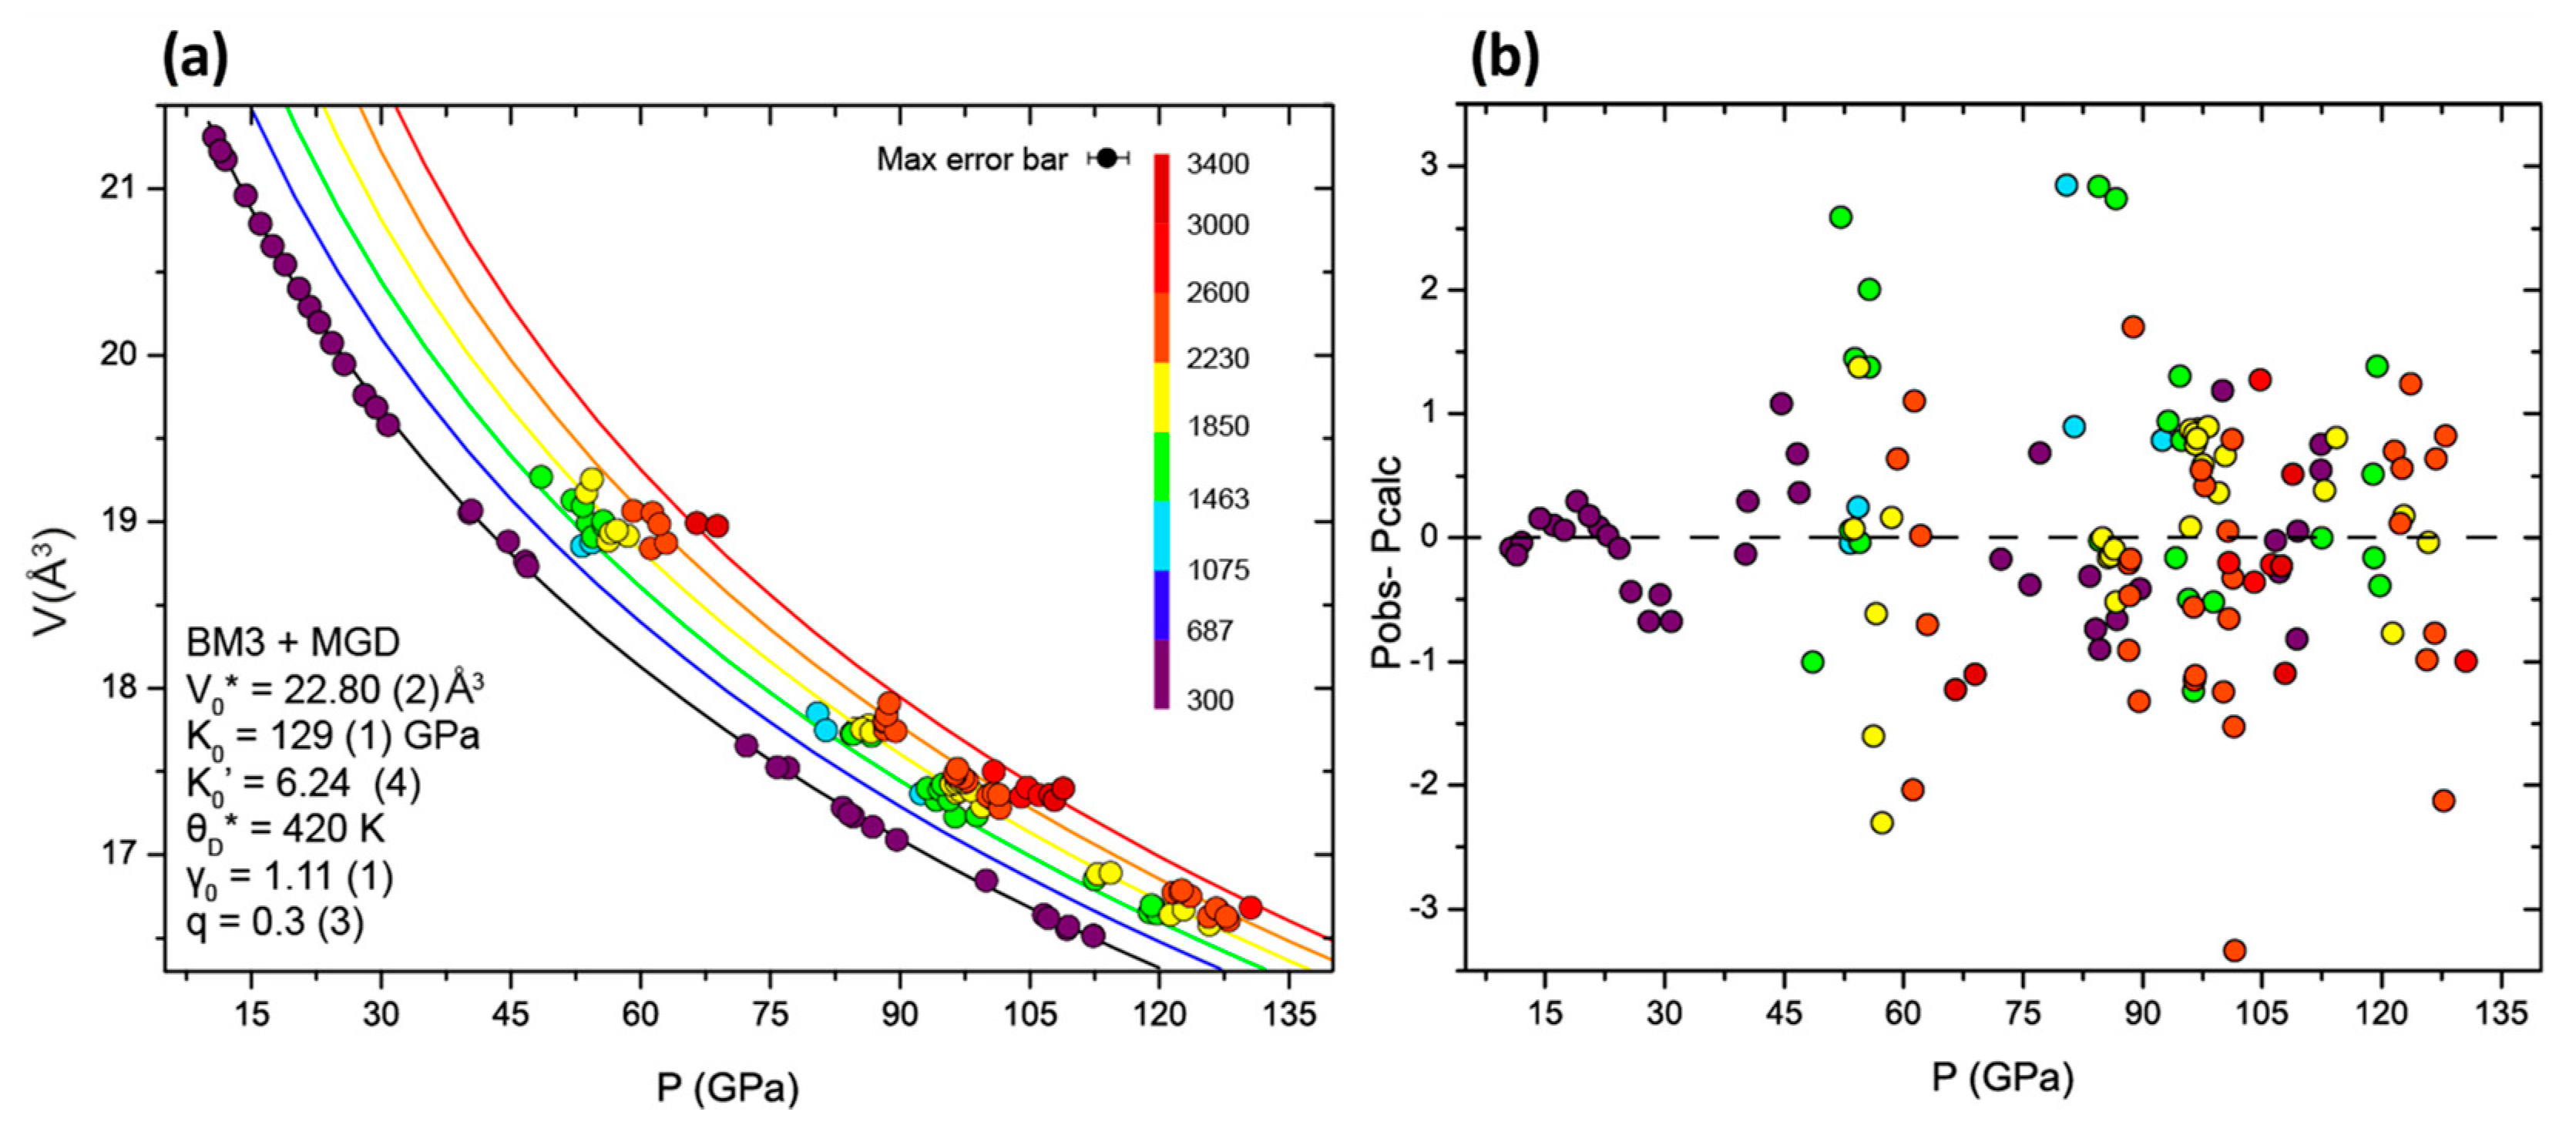
The best fit to our experimental data (and preferred solution) converges to V0 = 6.87 (2) cm3/mol (V0 = 22.81 Å3), K0 = 129 (1) GPa and K0’ = 6.24 (4) with θD = 420 K, γ0 = 1.11 (1) and q = 0.3 (3), the resulting chi2 is 1.79. Alternatively, we also provide the fit to our experimental data coupled with those of Dewaele and co-authors [24] (w/o esdP) with V0 = 6.79 (1) cm3/mol (V0 = 22.57 Å3), K0 = 153 (1) GPa and K0’ = 5.39 (4), with θD = 420 K, γ0 = 1.09 (1) and q = 0.26 (4).
The results are shown in Figure 4a, where the experimental data are reported along with the calculated isotherms as well as with the pressure residuals for the fit. The good agreement between the calculated isotherms and the experimental data and the symmetric distribution around 0 of the pressure residuals (Figure 4b) and their low value (−3 < ΔP < 3 GPa) attest the quality of the fit.
As demonstrated by the refinements, the current dataset can be reliably fitted with a standard vibrational model. The consistency of the volume and axial compressibility data over the whole pressure and temperature range, and the absence of specific features such as volume jumps or inversions in the axial compressibility permit to exclude the presence of strong magnetic effects.
Previously determined thermal equations of state for iron also considered some additional terms to account for other contributions such as electronic or anharmonic contributions, in addition to the thermal pressure described with the standard vibrational model presented in Equations (5)–(7). To test the influence of these parameters, we used the parameterization proposed in [24] to compute the values of the two contributions for the present data set. The maximum contribution is obtained for the higher temperature data (i.e., 3399 K at 68 GPa) and amounts 1.3 GPa and 5.2 GPa for the electronic and anharmonic term respectively. If these values are subtracted from the total thermal pressure term (in order to keep the pure vibrational part only), and the data set fitted again using the Mie Grüneisen Debye model, we do not have a noticeable difference in the refined parameters.
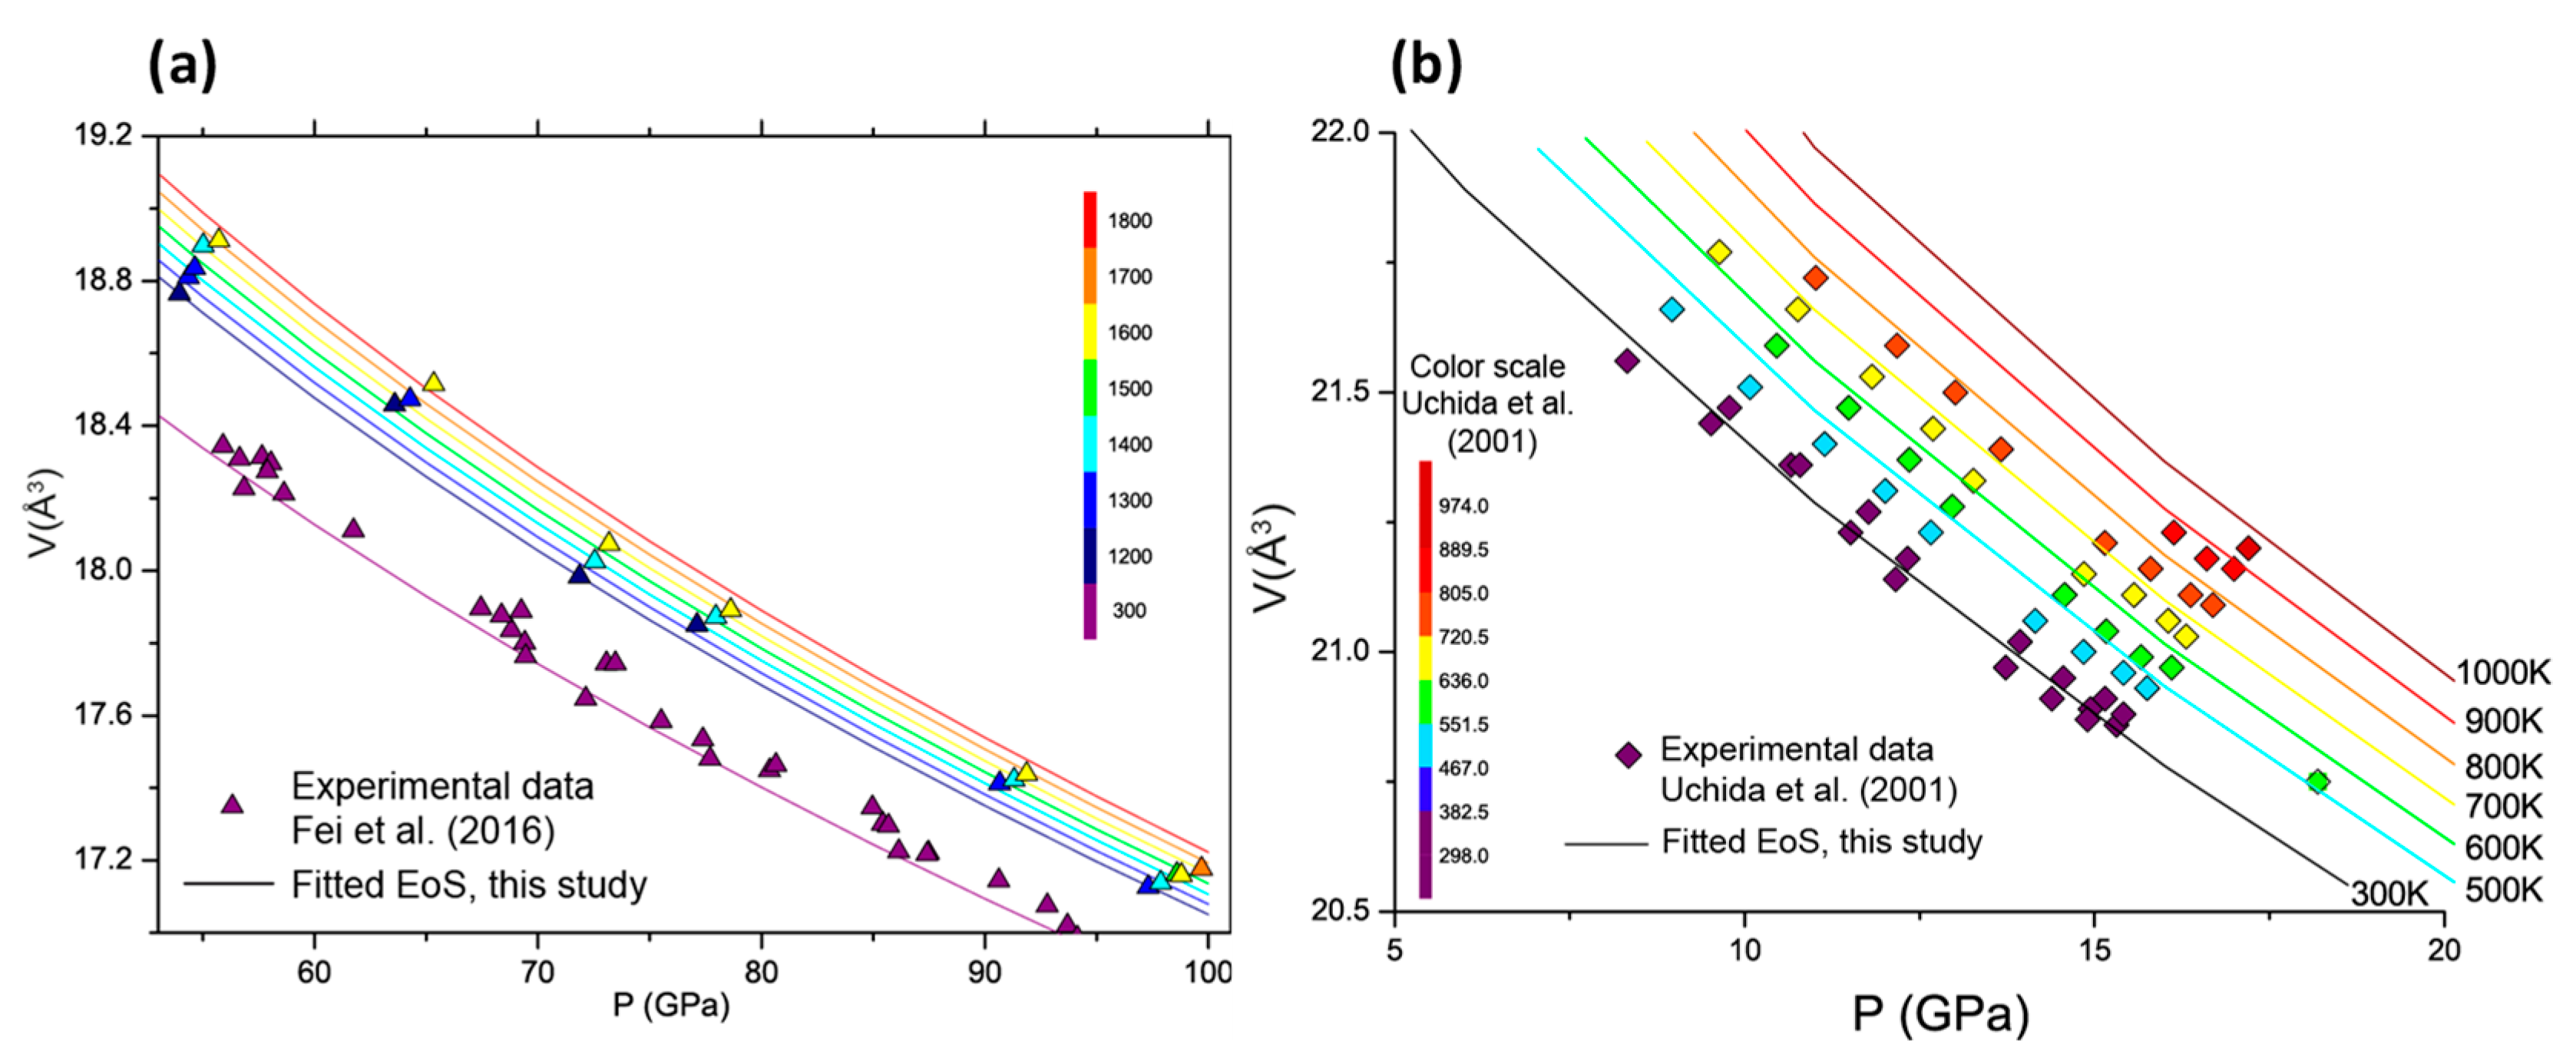
To further test our results, the current thermal EoS is also plotted against high pressure and temperature experimental data available from literature. In Figure 5a the calculated isotherms are compared with the HP-HT data points from [25]. The present model satisfactorily describes this dataset, the main discrepancies arising from the scatter of the data themselves. Furthermore, the isotherms extrapolated at lower pressures also show a good agreement with the multi-anvil data [20] (Figure 5b).
Ultimately, the available parameterizations for the electronic and anharmonic terms used in [24,25] result in a significant difference in density once thermodynamic quantities are calculated from the volumes extrapolated at P-T conditions relevant for the inner core. Constraining these parameters with only one dataset thus appears to be very difficult.

4. Discussion

The thermal equation of state of iron has a critical role in the evaluation of the chemical and physical state of the Earth’s solid inner core. As a matter of fact, such a thermal EoS is required to extrapolate the densities of iron at relevant P-T conditions and provides a reference for the comparison with models from seismology. The density deficit shown in the preliminary reference Earth model (i.e., the PREM [37]) with respect to the extrapolated densities of pure Fe, implies the incorporation of light elements in the solid inner core. It is therefore essential to assess a reference density profile for pure iron to identify the nature and the amount of such light elements. As such, the accuracy of the Fe thermal EoS, and deduced parameters representing material properties, has great influence on the interpretation of geophysical data.
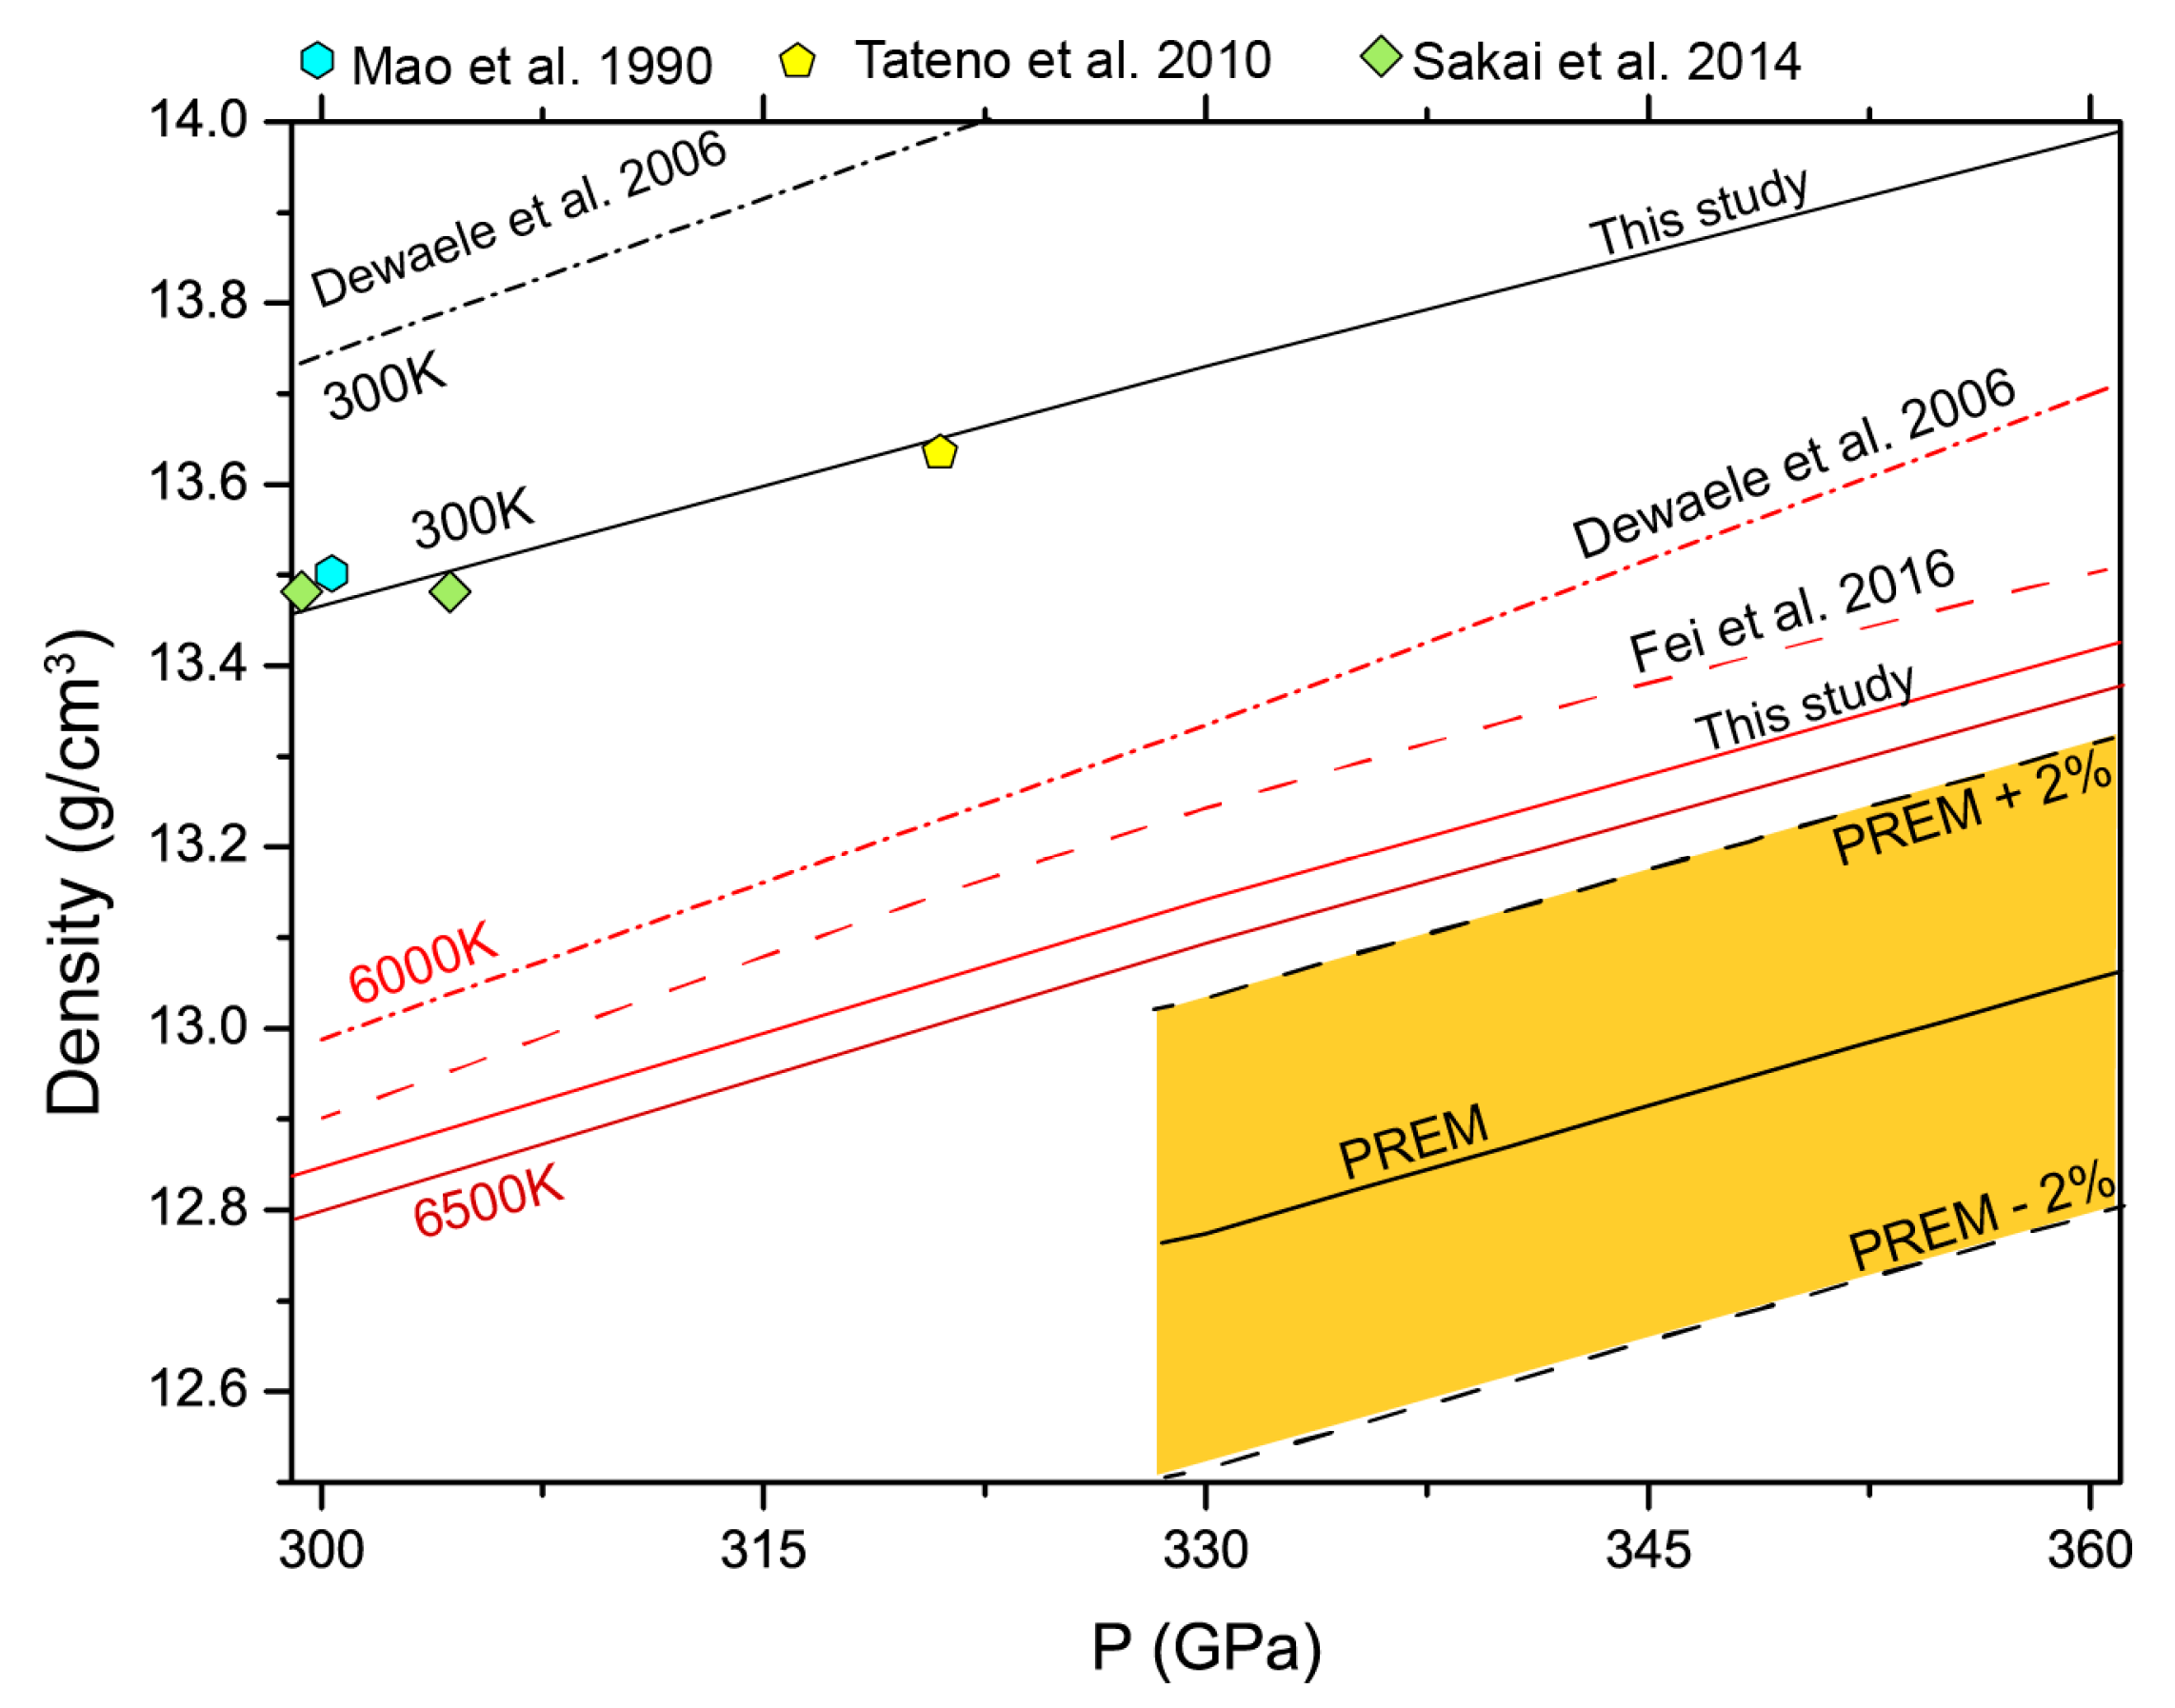
We used the best matching thermal EoS to extrapolate the densities of iron at inner core pressures (330–360 GPa) and a temperature of 6000 K, 6500 K, as well as at room temperature. The results are shown along the PREM model and the values from previous studies [24,25] in Figure 6. At room temperature the densities calculated in the present study are lower than the values from Dewaele and co-authors [24] and in agreement with the experimental data from Mao et al. [22], Tateno et al. [6] and Sakai et al. [26]. The difference in the refined parameters lead to 1.8% density difference 300 GPa and 300 K between the two extrapolated EoS. As previously discussed, this difference has its origin in the incorporation of low-pressure data in the refinement, which allows us to have better constraints on the reference volume V0, with consequences on the couple K0 and K0’.
At high temperature as well, the densities calculated in the present study are lower compared to those reported in literature. The higher difference is obtained when the present data are compared with those from [24], showing a 1.5% density difference at the ICB (inner core boundary).
The reduction is 0.5% when our results are compared to the values obtained by [25]. It is noteworthy that the shift in density between the present study and the one from Fei et al. [25] is similar to the one existing between their data and those of Dewaele and coauthors [24]. Hence, the difference between our results obtained using a simple standard vibrational model and another model including the electronic term, is of the same order as the difference induced by using two different parameterizations to account for the same electronic term.
According to our preferred EoS parameters, a pure iron core would be 3% denser than the density profile in PREM if the core temperature is assumed to be 6000 K, thus possibly revising the amount of light elements needed to match the seismological inferred densities. This density difference progressively diminishes if the temperature of the core is increased, though at 6500 K there is still a 2.5% difference and extreme temperatures would be needed to have a match with the seismological reference. As well, a different density of solid iron changes the estimate of the density jump between the liquid outer core and the solid inner core at the ICB. We estimate a 1.1% density contrast between solid and liquid iron [38] at the ICB. The present value is lower than the 2% difference predicted in [38] and increases the divergence from the seismological reference [37], proposed to be 4.5%. Accordingly, the estimates on the amount of light elements in the core need to be reassessed. In particular, the amount of oxygen, considered as the most elegant solution to account for the ICB density contrast due to its incompatibility with solid iron [12] might be higher than expected.

5. Conclusions

We presented an in situ X-ray diffraction study of iron at high pressure and temperature. The present data extends the temperature range previously investigated with static compression techniques. The results highlight that the study of the hexagonal close packed structure at the lowest possible pressure is a critical step to constrain the refinement of the ambient temperature equation of state, due to the trade-off between the V0, K0 and K0’. The value of V0 has indeed a strong incidence on the room-temperature EoS, with significant consequences when the EoS is extrapolated to core pressures. We propose a set of parameters refined with a 3rd order Birch Murnaghan equation and the thermal contribution is described with a standard Mie Grüneisen Debye vibrational model, without the need of additional electronic or anharmonic terms. Our thermal equation of state extrapolated at core pressures yields a +3% density difference for a pure iron core compared to the density profile of PREM, assuming a core temperature of 6000 K. Hence, this suggest to re-evaluate the amount of light elements in the Earth’s core and/or the effects of light elements on the physical properties of iron. For instance the 1.1% density contrast between solid and liquid iron at the ICB, estimated from the present equation of state, suggests the presence of a higher amount of oxygen in the liquid outer core.

Supplementary Materials

The following are available online at https://www.mdpi.com/2075-163X/10/2/100/s1. Figure S1: Eos for iron and extrapolations made using different MgO pressure scales [31,32]; Figure S2: ATEM analyses on a FIB prepared recovered sample after diamond anvil cell experiment. The two data sets used for the refinement are attached as separate files.

Author Contributions

Investigation, G.F., J.B., J.S., N.G. and J.M.; formal analysis, F.M., G.F.; writing—original draft preparation, F.M. and G.F.; writing—review and editing, F.M., G.F., J.B., J.M., and N.G. All authors have read and agreed to the published version of the manuscript.

Funding

F.M. and G.F. have received funding from the European Research Council (ERC) under the European Union’s Horizon 2020 research and innovation Programme, grant agreement No 670787 to Guillaume Fiquet

Acknowledgments

We thank Eugene Gregoryanz for his assistance during the X-ray data acquisition and Anne-Line Auzende for her help with the TEM examination of the recovered sample. Francesca Miozzi thanks G. Morard and R.J. Angel for fruitful discussions.

Conflicts of Interest

The authors declare no conflict of interest. The funders had no role in the design of the study; in the experiments reported; in the writing of the manuscript, or in the decision to publish the results.

References

  1. Birch, F. Elasticity and constitution of the Earth’s interior. J. Geophys. Res. 1952, 57, 227–286. [Google Scholar] [CrossRef]
  2. Anderson, O.L. Mineral physics of iron and of the core. Rev. Geophys. 1995, 33, 429. [Google Scholar] [CrossRef]
  3. Boehler, R. Temperatures in the Earth’s core from melting-point measurements of iron at high static pressures. Nature 1993, 363, 534–536. [Google Scholar] [CrossRef]
  4. Ma, Y.; Somayazulu, M.; Shen, G.; Mao, H.; Shu, J.; Hemley, R.J. In situ X-ray diffraction studies of iron to Earth-core conditions. Phys. Earth Planet. Inter. 2004, 143, 455–467. [Google Scholar] [CrossRef]
  5. Fiquet, G. Sound Velocities in Iron to 110 Gigapascals. Science 2001, 291, 468–471. [Google Scholar] [CrossRef] [PubMed] [Green Version]
  6. Tateno, S.; Hirose, K.; Ohishi, Y.; Tatsumi, Y. The structure of iron in earth’s inner core. Science 2010, 330, 359–361. [Google Scholar] [CrossRef] [PubMed]
  7. Yoo, C.S.; Akella, J.; Campbell, A.J.; Mao, H.K.; Hemley, R.J. Phase Diagram of Iron by in Situ X-ray Diffraction: Implications for Earth’s Core. Science 1995, 270, 1473–1475. [Google Scholar] [CrossRef]
  8. Dubrovinsky, L.S.; Saxena, S.K.; Tutti, F.; Rekhi, S.; LeBehan, T. In Situ X-Ray Study of Thermal Expansion and Phase Transition of Iron at Multimegabar Pressure. Phys. Rev. Lett. 2000, 84, 1720–1723. [Google Scholar] [CrossRef]
  9. Morard, G.; Boccato, S.; Rosa, A.D.; Anzellini, S.; Miozzi, F.; Henry, L.; Garbarino, G.; Mezouar, M.; Harmand, M.; Guyot, F.; et al. Solving Controversies on the Iron Phase Diagram Under High Pressure. Geophys. Res. Lett. 2018, 45, 11074–11082. [Google Scholar] [CrossRef] [Green Version]
  10. Poirier, J. Light elements in the Earth’s outer core: A critical review. Phys. Earth Planet. Inter. 1994, 85, 319–337. [Google Scholar] [CrossRef]
  11. Antonangeli, D.; Siebert, J.; Badro, J.; Farber, D.L.; Fiquet, G.; Morard, G.; Ryerson, F.J. Composition of the Earth’s inner core from high-pressure sound velocity measurements in Fe–Ni–Si alloys. Earth Planet. Sci. Lett. 2010, 295, 292–296. [Google Scholar] [CrossRef] [Green Version]
  12. Badro, J.; Cote, A.S.; Brodholt, J.P. A seismologically consistent compositional model of Earth’s core. Proc. Natl. Acad. Sci. 2014, 111, 7542–7545. [Google Scholar] [CrossRef] [Green Version]
  13. McDonough, W.F.; Sun, S.-S. The composition of the Earth. Chem. Geol. 1995, 120, 223–253. [Google Scholar] [CrossRef]
  14. Allègre, C.J.; Poirier, J.-P.; Humler, E.; Hofmann, A.W. The chemical composition of the Earth. Earth Planet. Sci. Lett. 1995, 134, 515–526. [Google Scholar] [CrossRef]
  15. Kuwayama, Y.; Hirose, K.; Sata, N.; Ohishi, Y. Phase relations of iron and iron–nickel alloys up to 300 GPa: Implications for composition and structure of the Earth’s inner core. Earth Planet. Sci. Lett. 2008, 273, 379–385. [Google Scholar] [CrossRef]
  16. Belonoshko, A.B. Equation of state for ∈-iron at high pressures and temperatures. Condens. Matter Phys. 2010, 13, 23605–23615. [Google Scholar] [CrossRef] [Green Version]
  17. Sha, X.; Cohen, R.E. First-principles thermal equation of state and thermoelasticity of hcp Fe at high pressures. Phys. Rev. B 2010, 81, 094105. [Google Scholar] [CrossRef] [Green Version]
  18. Dorogokupets, P.I.; Dymshits, A.M.; Litasov, K.D.; Sokolova, T.S. Thermodynamics and Equations of State of Iron to 350 GPa and 6000 K. Sci. Rep. 2017, 7, 41863. [Google Scholar] [CrossRef] [Green Version]
  19. Funamori, N.; Yagi, T.; Uchida, T. High-pressure and high-temperature in situ x-ray Diffraction study of iron to above 30 Gpa using MA8-type apparatus. Geophys. Res. Lett. 1996, 23, 953–956. [Google Scholar] [CrossRef]
  20. Uchida, T.; Wang, Y.; Rivers, M.L.; Sutton, S.R. Stability field and thermal equation of state of ε-iron determined by synchrotron X-ray diffraction in a multianvil apparatus. J. Geophys. Res. Solid Earth 2001, 106, 21799–21810. [Google Scholar] [CrossRef] [Green Version]
  21. Yamazaki, D.; Ito, E.; Yoshino, T.; Yoneda, A.; Guo, X.; Zhang, B.; Sun, W.; Shimojuku, A.; Tsujino, N.; Kunimoto, T.; et al. P-V-T equation of state for ε -iron up to 80 GPa and 1900 K using the Kawai-type high pressure apparatus equipped with sintered diamond anvils. Geophys. Res. Lett. 2012, 39, 2012GL053540. [Google Scholar] [CrossRef]
  22. Mao, H.K.; Wu, Y.; Chen, L.C.; Shu, J.F.; Jephcoat, A.P. Static compression of iron to 300 GPa and Fe 0.8 Ni 0.2 alloy to 260 GPa: Implications for composition of the core. J. Geophys. Res. 1990, 95, 21737. [Google Scholar] [CrossRef]
  23. Jephcoat, A.P.; Mao, H.K.; Bell, P.M. Static compression of iron T78 GPa with rare gas solids as pressure-transmitting media. In Elastic Properties and Equations of State; American Geophysical Union: Washington, DC, USA, 1988; Volume 91, pp. 524–531. [Google Scholar]
  24. Dewaele, A.; Loubeyre, P.; Occelli, F.; Mezouar, M.; Dorogokupets, P.I.; Torrent, M. Quasihydrostatic Equation of State of Iron above 2 Mbar. Phys. Rev. Lett. 2006, 97, 215504. [Google Scholar] [CrossRef]
  25. Fei, Y.; Murphy, C.; Shibazaki, Y.; Shahar, A.; Huang, H. Thermal equation of state of hcp-iron: Constraint on the density deficit of Earth’s solid inner core. Geophys. Res. Lett. 2016, 43, 6837–6843. [Google Scholar] [CrossRef] [Green Version]
  26. Sakai, T.; Takahashi, S.; Nishitani, N.; Mashino, I.; Ohtani, E.; Hirao, N. Equation of state of pure iron and Fe0.9Ni0.1 alloy up to 3Mbar. Phys. Earth Planet. Inter. 2014, 228, 114–126. [Google Scholar] [CrossRef]
  27. Schultz, E.; Mezouar, M.; Crichton, W.; Bauchau, S.; Blattmann, G.; Andrault, D.; Fiquet, G.; Boehler, R.; Rambert, N.; Sitaud, B.; et al. High Pressure–High Temperature Monochromatic X-Ray Diffraction At the Esrf. High Press. Res. 2005, 25, 71–83. [Google Scholar] [CrossRef]
  28. Mezouar, M.; Crichton, W.A.; Bauchau, S.; Thurel, F.; Witsch, H.; Torrecillas, F.; Blattmann, G.; Marion, P.; Dabin, Y.; Chavanne, J.; et al. Development of a new state-of-the-art beamline optimized for monochromatic single-crystal and powder X-ray diffraction under extreme conditions at the ESRF. J. Synchrotron Radiat. 2005, 12, 659–664. [Google Scholar] [CrossRef] [Green Version]
  29. Hammersley, A.P. FIT2D: A multi-purpose data reduction, analysis and visualization program. J. Appl. Crystallogr. 2016, 49, 646–652. [Google Scholar] [CrossRef]
  30. Larson, A.C.; Von Dreele, R.B.; Alamos, L. Gsas. Rep. lAUR 1994, 1994, 86–748. [Google Scholar]
  31. Speziale, S.; Zha, C.-S.; Duffy, T.S.; Hemley, R.J.; Mao, H. Quasi-hydrostatic compression of magnesium oxide to 52 GPa: Implications for the pressure-volume-temperature equation of state. J. Geophys. Res. Solid Earth 2001, 106, 515–528. [Google Scholar] [CrossRef]
  32. Tange, Y.; Nishihara, Y.; Tsuchiya, T. Unified analyses for P-V-T equation of state of MgO: A solution for pressure-scale problems in high P-T experiments. J. Geophys. Res. 2009, 114, B03208. [Google Scholar] [CrossRef]
  33. Dorogokupets, P.I. P–V–T equations of state of MgO and thermodynamics. Phys. Chem. Miner. 2010, 37, 677–684. [Google Scholar] [CrossRef]
  34. Mao, H.K.; Xu, J.; Bell, P.M. Calibration of the ruby pressure gauge to 800 kbar under quasi-hydrostatic conditions. J. Geophys. Res. 1986, 91, 4673. [Google Scholar] [CrossRef]
  35. Datchi, F.; LeToullec, R.; Loubeyre, P. Improved calibration of the SrB4O7:Sm2+optical pressure gauge: Advantages at very high pressures and high temperatures. J. Appl. Phys. 1997, 81, 3333–3339. [Google Scholar] [CrossRef]
  36. Gonzalez-Platas, J.; Alvaro, M.; Nestola, F.; Angel, R. EosFit7-GUI: A new graphical user interface for equation of state calculations, analyses and teaching. J. Appl. Crystallogr. 2016, 49, 1377–1382. [Google Scholar] [CrossRef]
  37. Dziewonski, A.M.; Anderson, D.L. Preliminary reference Earth model. Phys. Earth Planet. Inter. 1981, 25, 297–356. [Google Scholar] [CrossRef]
  38. Alfè, D.; Gillan, M.; Price, G. Composition and temperature of the Earth’s core constrained by combining ab initio calculations and seismic data. Earth Planet. Sci. Lett. 2002, 195, 91–98. [Google Scholar] [CrossRef]
Figure 1. Example of the collected data at high pressure and high temperature. (a) Two dimensional (2D) diffraction image recorded on the MAR 345 image plate; (b) integrated diffraction pattern of hcp iron along with the Le Bail refinement with the General Structure Analysis System (GSAS) package, presented here after background subtraction.
Minerals 10 00100 g001
Figure 2. Compression data at room temperature with the fitted equations of state. Symbols represent the experimental points from different studies; lines are the fitted equations of state. The error bars on the data from the present study are within the dimension of the symbol. Relative to the present study, purple lines represent the equation of state obtained accounting for the errors on pressure, volume and temperature. The red line instead stands for the EoS obtained when the errors in pressure are not taken in account.
Minerals 10 00100 g002
Figure 3. Extrapolation of the two room-temperature equations of state discussed at pressures compatible with the experimental data from [6]. The experimental data from the present study are added as well.
Minerals 10 00100 g003
Figure 4. Results obtained fitting our data with the Mie Grüneisen Debye thermal model. (a) Experimental points with the isotherms calculated between 300 and 3500 K; (b) pressure residuals for the fit in GPa, colors correspond to the inset in (a).
Minerals 10 00100 g004
Figure 5. Volume over pressure plots of the isotherms from the present study compared with experimental data points from literature. (a) Data points from diamond anvil cell experiments [21]; (b) data points from multi anvil experiments [19].
Minerals 10 00100 g005
Figure 6. Density over pressure plot in the pressure range representative of the Earth’s inner core. Densities calculated from the present thermal equation of state are compared those from literature. Densities from the seismological reference of the PREM are shown with a 2% error bar. For [29] only points at or above 300 GPa are shown.
Minerals 10 00100 g006
Table 1. Pressure volume equations of state fit results. Values in parenthesis are the published error bars.
This StudyThis Study + Data from Dewaele et al. 2006 [24]Fei et al. 2016 [25]Dewaele et al. 2006 [24]Uchida et al. 2001 [20]
with esdPw/o esdP
FormalismBMVinetBMBM BMVinetBM
V03)22.80 (2)22.8122.75 (1)22.57 (1)22.1822.4722.4322.7 (3)
K0 (GPa)129 (6)125 (5)134 (5)153 (3)191 (5)165 *163 (8)135 (19)
K06.2 (2)6.5 (2)6.1 (2)5.3 (1)4.5 (1)4.97 (4)5.4 (2)6 (0.4)
* Fixed values; BM = Birch Murnaghan formalism; esdP = estimated standard deviation for pressures.