Kishonite, VH2, and Oreillyite, Cr2N, Two New Minerals from the Corundum Xenocrysts of Mt Carmel, Northern Israel

 ,
,  , , , , and
Abstract
1. Introduction
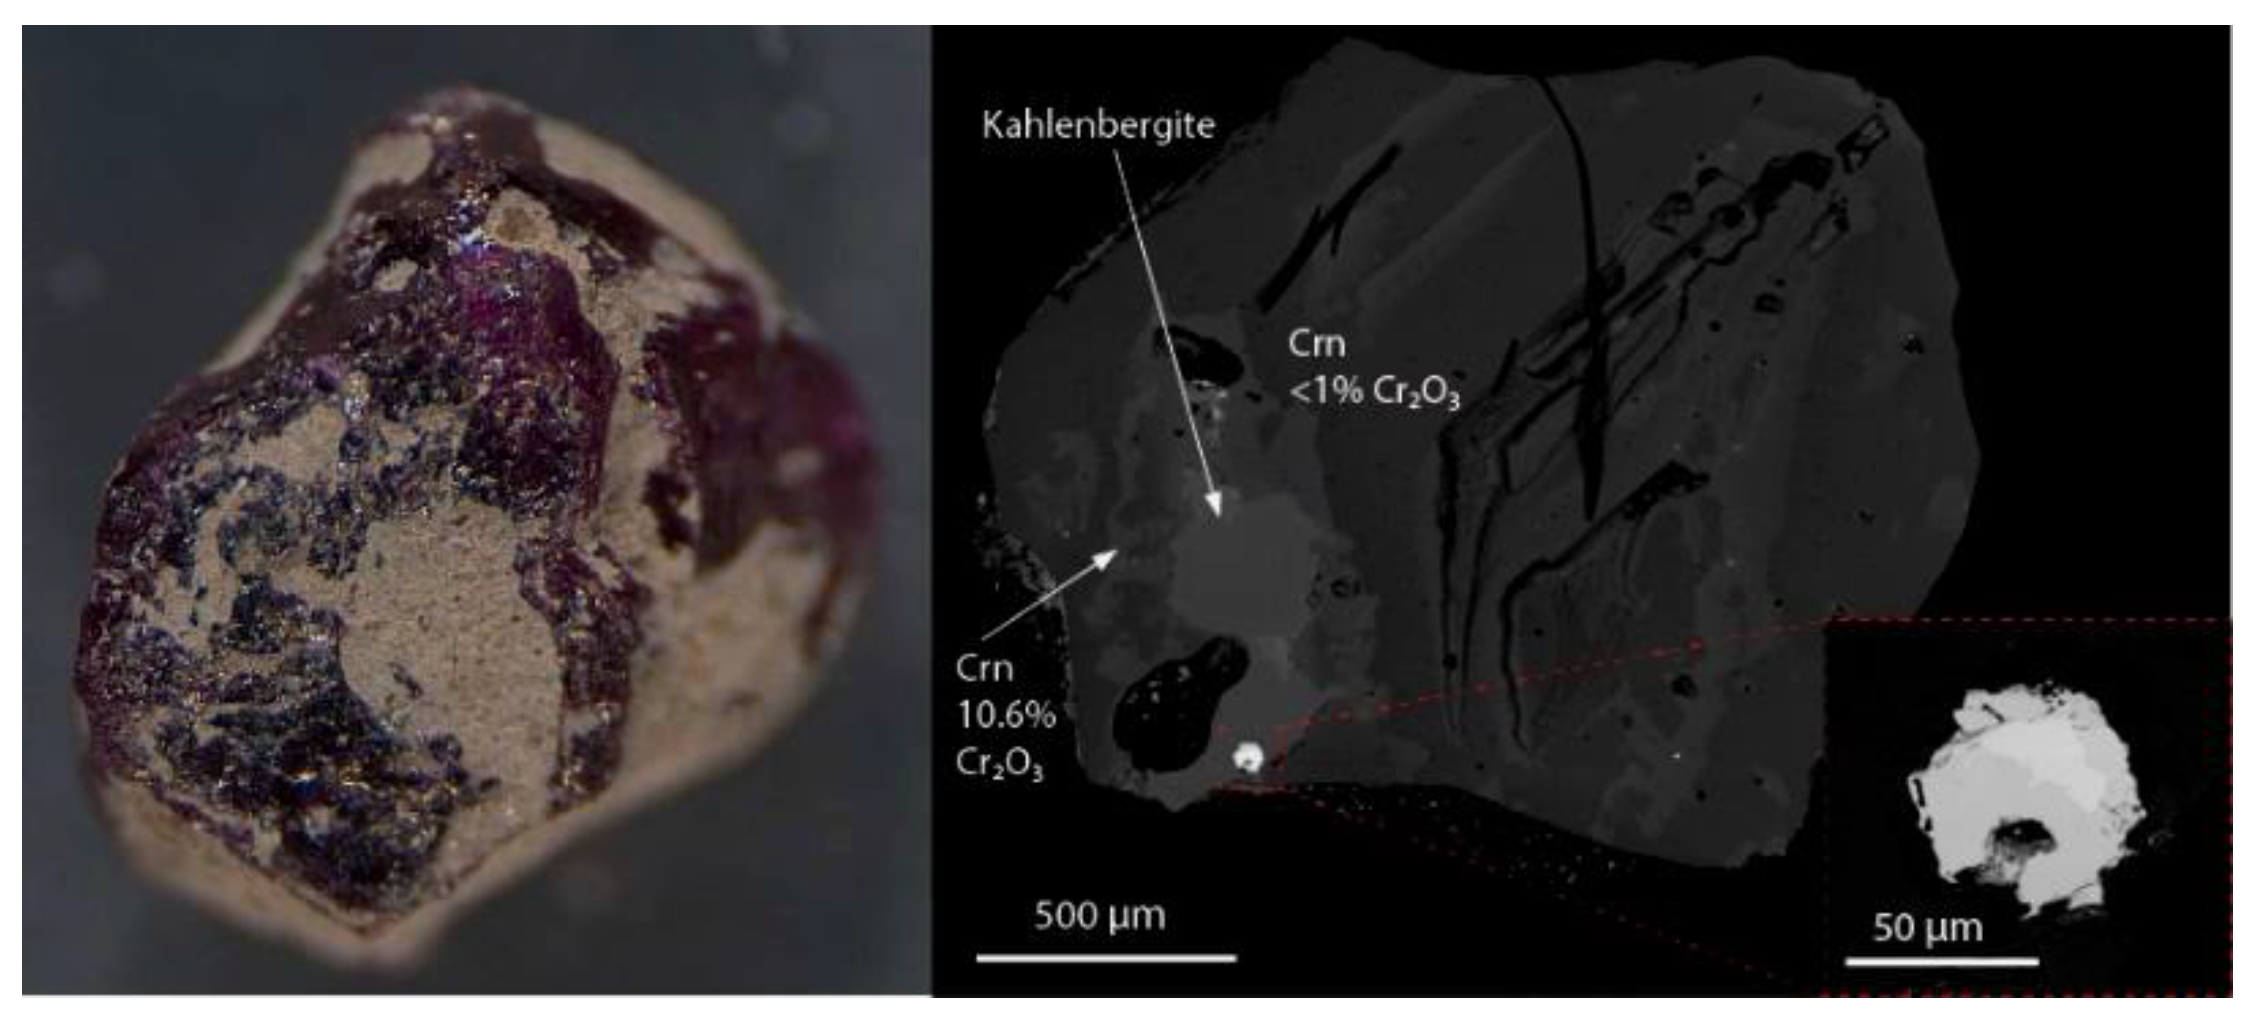
2. Description and Physical Properties
3. Chemical Composition
4. X-ray Crystallography
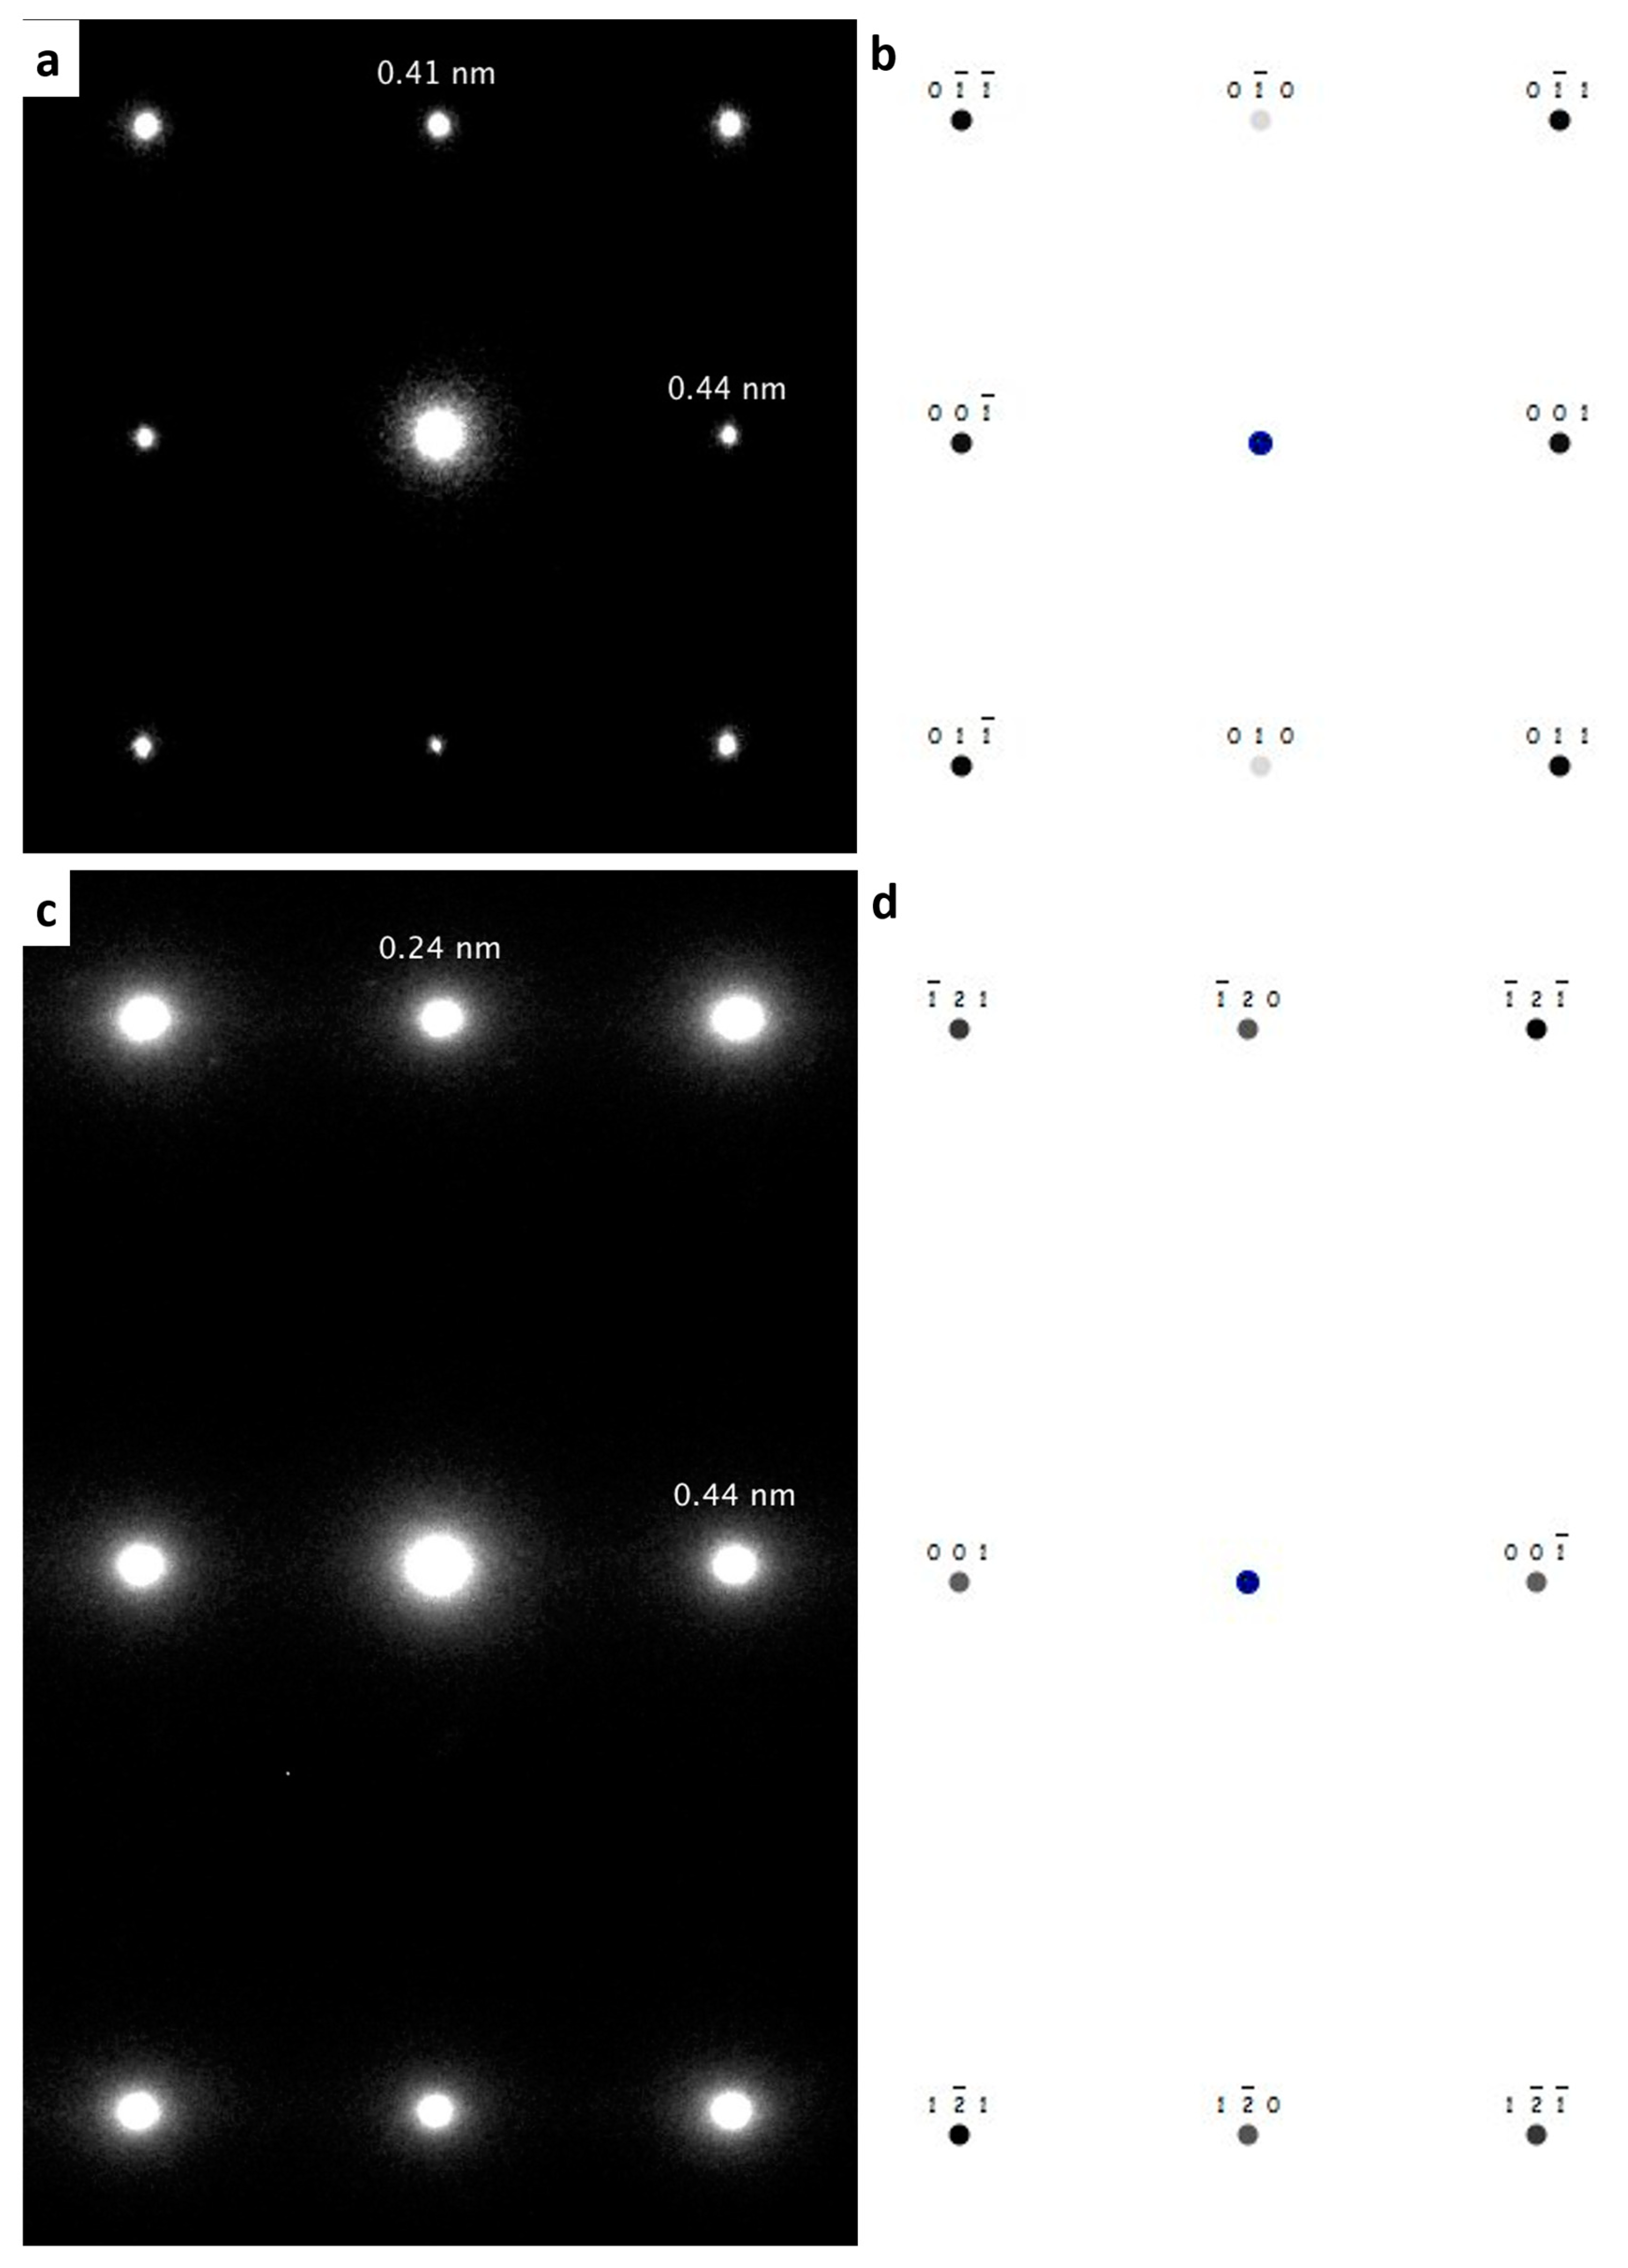
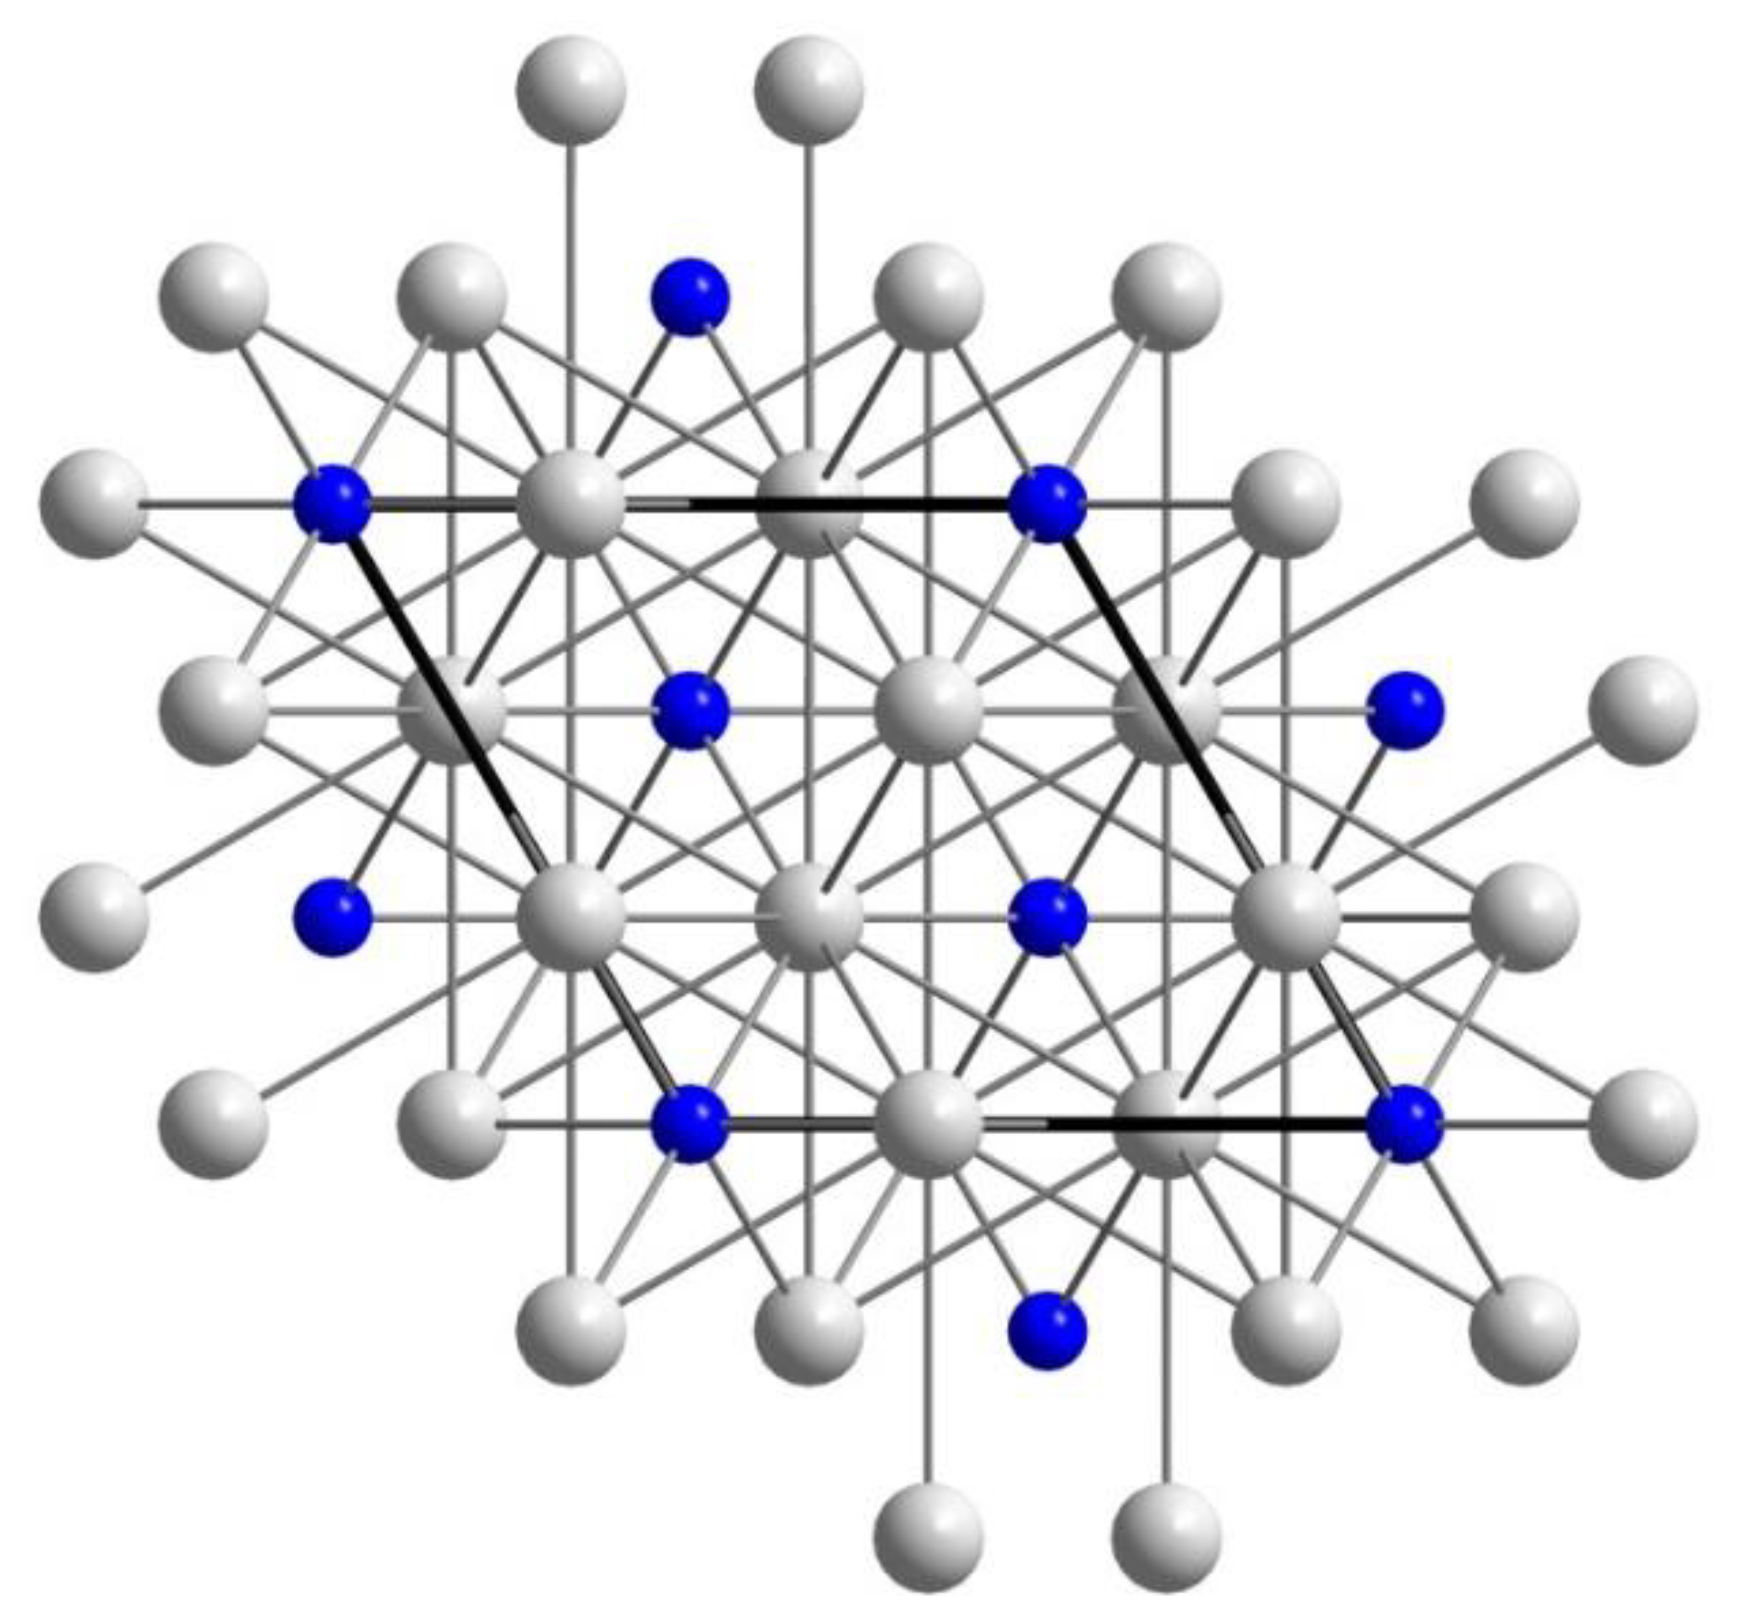
5. Transmission Electron Microscopy (TEM) for Oreillyite
6. Remarks on the Origin of Kishonite and Oreillyite
Supplementary Materials
Author Contributions
Funding
Acknowledgments
Conflicts of Interest
References
- Griffin, W.L.; Gain, S.E.M.; Adams, D.T.; Huang, J.-X.; Saunders, M.; Toledo, V.; Pearson, N.J.; O’Reilly, S.Y. First terrestrial occurrence of tistarite (Ti2O3): Ultra-low oxygen fugacity in the upper mantle beneath Mt. Carmel, Israel. Geology 2016, 44, 815–818. [Google Scholar] [CrossRef]
- Griffin, W.L.; Gain, S.E.M.; Huang, J.-X.; Saunders, M.; Shaw, J.; Toledo, V.; O’Reilly, S.Y. A terrestrial magmatic hibonite-grossite-vanadium assemblage: Desilication and extreme reduction in a volcanic plumbing system, Mt Carmel, Israel. Am. Mineral. 2019, 104, 207–219. [Google Scholar] [CrossRef]
- Griffin, W.L.; Huang, J.-X.; Thomassot, E.; Gain, S.E.M.; Toledo, V.; O’Reilly, S.Y. Super-reducing conditions in ancient and modern volcanic systems: Sources and behaviour of carbon-rich fluids in the lithospheric mantle. Min. Petrol. 2018, 112, 1–14. [Google Scholar] [CrossRef]
- Griffin, W.L.; Gain, S.E.M.; Camara, F.; Bindi, L.; Shaw, J.; Alard, O.; Saunders, M.; Huang, J.-X.; Toledo, V.; O’Reilly, S.Y. Extreme reduction: Mantle-derived oxide xenoliths from a hydrogen-rich environment. Lithos 2020, 358–359, 105404. [Google Scholar] [CrossRef]
- Griffin, W.L.; Gain, S.E.M.; Saunders, M.; Cámara, F.; Bindi, L.; Spartà, D.; Toledo, V.; O’Reilly, S.Y. Cr2O3 in Corundum: Ultra-high contents under reducing conditions. Am. Mineral. 2020, in press. [Google Scholar]
- Griffin, W.L.; Gain, S.E.M.; Saunders, M.; Bindi, L.; Alard, O.; Toledo, V.; O’Reilly, S.Y. Parageneses of TiB2 in corundum xenoliths from Mt Carmel, Israel: Siderophile behaviour of boron under reducing conditions. Am. Mineral. 2020, 105, 1609–1621. [Google Scholar] [CrossRef]
- Xiong, Q.; Griffin, W.L.; Huang, J.-X.; Gain, S.E.M.; Toledo, V.; Pearson, N.J.; O’Reilly, S.Y. Super-reduced mineral assemblages in "ophiolitic" chromitites and peridotites: The view from Mt. Carmel. Eur. J. Min. 2017, 29, 557–570. [Google Scholar] [CrossRef]
- Huang, J.-X.; Xiong, Q.; Gain, S.E.M.; Griffin, W.L.; Murphy, T.D.; Shiryaev, A.A.; Li, L.; Toledo, V.; Tomshin, M.D.; O’Reilly, S.Y. Immiscible metallic melts in the deep Earth: Clues from moissanite (SiC) in volcanic rocks. Chin. Sci. Bull. 2020, 65, 1479–1488. [Google Scholar] [CrossRef]
- Bindi, L.; Cámara, F.; Griffin, W.L.; Huang, J.-X.; Gain, S.E.M.; Toledo, V.; O’Reilly, S.Y. Discovery of the first natural hydride. Am. Mineral. 2019, 104, 611–614. [Google Scholar] [CrossRef]
- Sheldrick, G.M. A short history of SHELX. Acta Crystallogr. 2008, A64, 112–122. [Google Scholar] [CrossRef]
- Wilson, A.J.C. (Ed.) International Tables for Crystallography; Volume C: Mathematical, physical and chemical tables; Kluwer Academic: Dordrecht, The Netherlands, 1992. [Google Scholar]
- Müller, H.; Weymann, K. Investigation of the ternary systems Nb-V-H and Ta-V-H. J. Less Common Metals 1986, 119, 115–126. [Google Scholar] [CrossRef]
- Zhu, M.Y.; Liu, Y. Discovery of native chromium in Xizang (Tibet). Chin. Sci. Bull. 1981, 26, 1014–1017. [Google Scholar]
- Andrews, K.W.; Dyson, D.J.; Keown, S.R. Interpretation of Electron Diffraction Patterns; Hilger: London, UK, 1971; p. 203. [Google Scholar]
- Kikuchi, M.; Kajihara, M.; Choi, S.K. Cellular precipitation involving both substitutional and interstitial solutes: Cellular precipitation of Cr2N in Cr-Ni austenitic steels. Mater. Sci. Eng. A 1991, 146, 131–150. [Google Scholar] [CrossRef]
- Presser, R.; Silcock, J.M. Aging behaviour of 18Mn-18Cr high nitrogen austenitic steels for end rings. Met. Sci. 1983, 17, 241–247. [Google Scholar] [CrossRef]
- The Bristol Group. Convergent Beam Electron Diffraction of Alloy Phases; Adam Hilger: Bristol, UK; Boston, MA, USA, 1984; p. 61. [Google Scholar]
- Vanderschaeve, F.; Taillard, R.; Foct, J. Discontinuous precipitation of Cr2N in a high nitrogen, chromium-manganese austenitic stainless steel. J. Mater. Sci. 1995, 30, 6035–6046. [Google Scholar] [CrossRef]
- Vallas, P.; Calvert, L.D. Pearson’s Handbook of Crystallographic Data for Intermediate Phases; ASM Metals Park: Cleveland, OH, USA, 1985; Volume 2, p. 1877. [Google Scholar]
- Sundararaman, D.; Shankar, P.; Raghunathan, V.S. Electron microscopic study of Cr2N formation in thermally aged 316ln austenitic stainless steels. Metall. Mater. Trans. A 1996, 27, 1175–1186. [Google Scholar] [CrossRef]
- Cabana, J.; Ling, C.D.; Oró-Solé, J.; Gautier, D.; Tobías, G.; Adams, S.; Canadell, E.; Palacín, M.R. Antifluorite-type lithium chromium oxide nitrides: Synthesis, structure, order, and electrochemical properties. Inorg. Chem. 2004, 43, 7050–7060. [Google Scholar] [CrossRef]
- Lee, T.-H.; Kim, S.-J.; Takaki, S. On the crystal structure of Cr2N precipitates in high-nitrogen austenitic stainless steel. II. Order-disorder transition of Cr2N during electron irradiation. Acta Crystallogr. 2006, B62, 190–196. [Google Scholar] [CrossRef]
- Ma, S.; Liu, Y.; Ye, J.; Zhang, H.; Pang, J. Theoretical study on the elastic, electronic and thermodynamic properties of trigonal-type Cr2N under high pressures. Comp. Mater. Sci. 2014, 5, 620–625. [Google Scholar] [CrossRef]
- Ballhaus, C.; Wirth, R.; Fonseca, R.O.C.; Blanchard, H.; Pröll, W.; Bragagni, A.; Nagel, T.; Schreiber, A.; Dittrich, S.; Thome, V.; et al. Ultra-high pressure and ultra-reduced minerals in ophiolites may form by lightning strikes. Geoch. Perspect. Lett. 2017, 5, 42–46. [Google Scholar] [CrossRef]
- Smith, E.M.; Shirey, S.B.; Nestola, F.; Bullock, E.S.; Wang, J.; Richardson, S.H.; Wang, W. Large gem diamonds from metallic liquid in Earth’s deep mantle. Science 2016, 354, 1403–1405. [Google Scholar] [CrossRef] [PubMed]
- Smith, E.M.; Shirey, S.B.; Richardson, S.H.; Nestola, F.; Bullock, E.S.; Wang, J.; Wang, W. Blue boron-bearing diamonds from Earth’s lower mantle. Nature 2018, 560, 84–87. [Google Scholar] [CrossRef] [PubMed]
- Rohrbach, A.; Ballhaus, C.; Golla-Schindler, U.; Ulmer, P.; Kamenetsky, V.S.; Kuzmin, D.V. Metal saturation in the upper mantle. Nature 2007, 449, 456–458. [Google Scholar] [CrossRef] [PubMed]
- Frost, D.J.; McCammon, C.A. The redox state of Earth’s mantle. Ann. Rev. Earth Plan. Sci. 2008, 36, 389–420. [Google Scholar] [CrossRef]
- Stagno, V.; Ojwang, D.O.; McCammon, C.A.; Frost, D.J. The oxidation state of the mantle and the extraction of carbon from Earth’s interior. Nature 2013, 493, 84–88. [Google Scholar] [CrossRef]


| Site | x | Y | z | Ueq | s.o.f. |
|---|---|---|---|---|---|
| V | 0 | 0 | 0 | 10(2) | V0.96(7)Al0.04 V0.96(7)Al0.04 |
| H | 1/4 | 1/4 | 1/4 | 38(17) | 1 |
| Site | x | Y | z | Ueq | s.o.f. |
|---|---|---|---|---|---|
| Cr | 1/3 | 2/3 | 1/4 | 12(2) | 1 |
| N | 0 | 0 | 0 | 15(11) | N0.47(9) |
| h | k | l | dcalc | Icalc | h | k | l | dcalc | Icalc |
|---|---|---|---|---|---|---|---|---|---|
| 1 | 1 | 1 | 24.641 | 100 | 1 | 0 | 1 | 30.501 | 3 |
| 2 | 0 | 0 | 21.340 | 42 | 1 | 1 | 0 | 24.055 | 14 |
| 2 | 2 | 0 | 15.090 | 27 | 0 | 0 | 2 | 22.387 | 21 |
| 3 | 1 | 1 | 12.869 | 26 | 2 | −1 | 1 | 21.190 | 45 |
| 2 | 2 | 2 | 12.321 | 7 | 1 | 1 | 1 | 21.190 | 55 |
| 4 | 0 | 0 | 10.670 | 3 | 1 | 1 | 2 | 16.388 | 9 |
| 3 | 3 | 1 | 0.9791 | 10 | 2 | −1 | 2 | 16.388 | 10 |
| 4 | 2 | 0 | 0.9544 | 10 | 3 | 0 | 0 | 13.888 | 16 |
| 4 | 2 | 2 | 0.8712 | 10 | 1 | 1 | 3 | 12.682 | 6 |
| 2 | −1 | 3 | 12.682 | 7 | |||||
| 3 | 0 | 2 | 11.802 | 11 | |||||
| 2 | 2 | 1 | 11.616 | 4 | |||||
| 4 | −2 | 1 | 11.616 | 5 | |||||
| 0 | 0 | 4 | 11.193 | 2 | |||||
| 4 | −2 | 3 | 0.9365 | 3 | |||||
| 2 | 2 | 3 | 0.9365 | 3 | |||||
| 4 | 1 | 1 | 0.8910 | 2 | |||||
| 3 | 0 | 4 | 0.8715 | 10 |
Publisher’s Note: MDPI stays neutral with regard to jurisdictional claims in published maps and institutional affiliations. |
© 2020 by the authors. Licensee MDPI, Basel, Switzerland. This article is an open access article distributed under the terms and conditions of the Creative Commons Attribution (CC BY) license (http://creativecommons.org/licenses/by/4.0/).
Share and Cite
Bindi, L.; Cámara, F.; Gain, S.E.M.; Griffin, W.L.; Huang, J.-X.; Saunders, M.; Toledo, V. Kishonite, VH2, and Oreillyite, Cr2N, Two New Minerals from the Corundum Xenocrysts of Mt Carmel, Northern Israel. Minerals 2020, 10, 1118. https://doi.org/10.3390/min10121118
Bindi L, Cámara F, Gain SEM, Griffin WL, Huang J-X, Saunders M, Toledo V. Kishonite, VH2, and Oreillyite, Cr2N, Two New Minerals from the Corundum Xenocrysts of Mt Carmel, Northern Israel. Minerals. 2020; 10(12):1118. https://doi.org/10.3390/min10121118
Chicago/Turabian StyleBindi, Luca, Fernando Cámara, Sarah E. M. Gain, William L. Griffin, Jin-Xiang Huang, Martin Saunders, and Vered Toledo. 2020. "Kishonite, VH2, and Oreillyite, Cr2N, Two New Minerals from the Corundum Xenocrysts of Mt Carmel, Northern Israel" Minerals 10, no. 12: 1118. https://doi.org/10.3390/min10121118
APA StyleBindi, L., Cámara, F., Gain, S. E. M., Griffin, W. L., Huang, J.-X., Saunders, M., & Toledo, V. (2020). Kishonite, VH2, and Oreillyite, Cr2N, Two New Minerals from the Corundum Xenocrysts of Mt Carmel, Northern Israel. Minerals, 10(12), 1118. https://doi.org/10.3390/min10121118