Micro-Raman—A Tool for the Heavy Mineral Analysis of Gold Placer-Type Deposits (Pianu Valley, Romania)

 ,
, 
Abstract
1. Introduction
2. Geological Setting
3. Materials and Methods
4. Results and Discussion
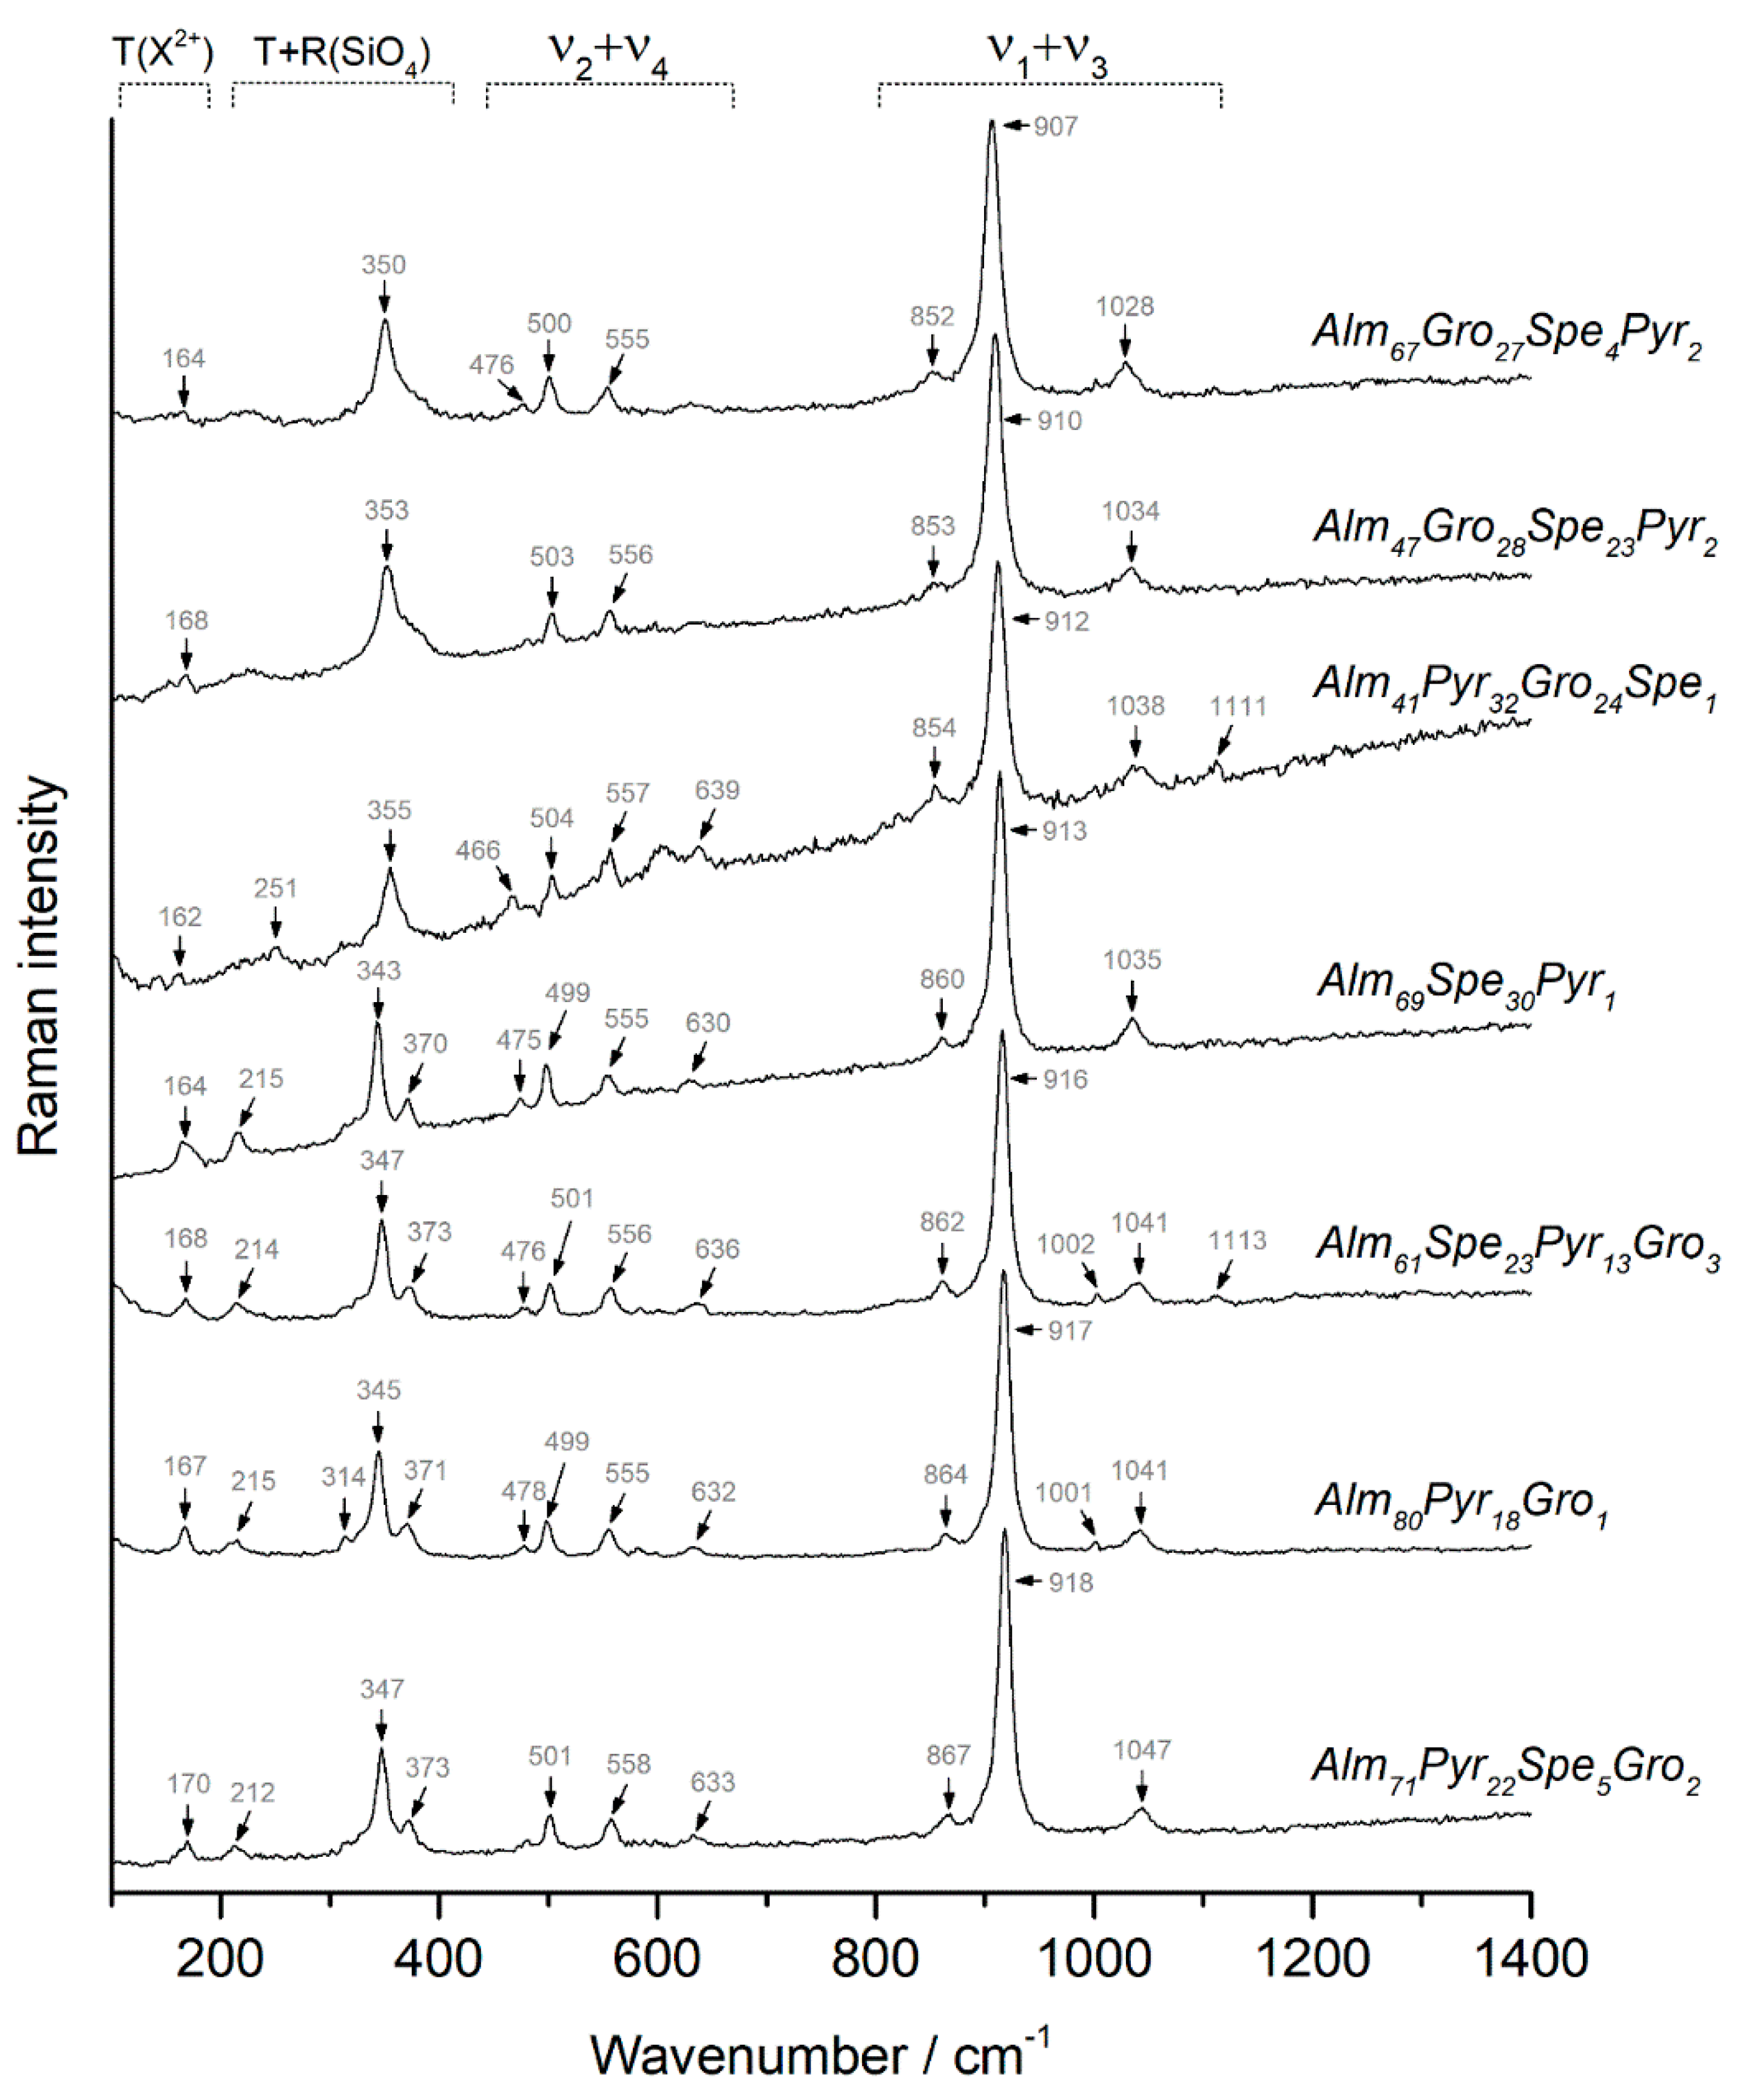
4.1. Garnets
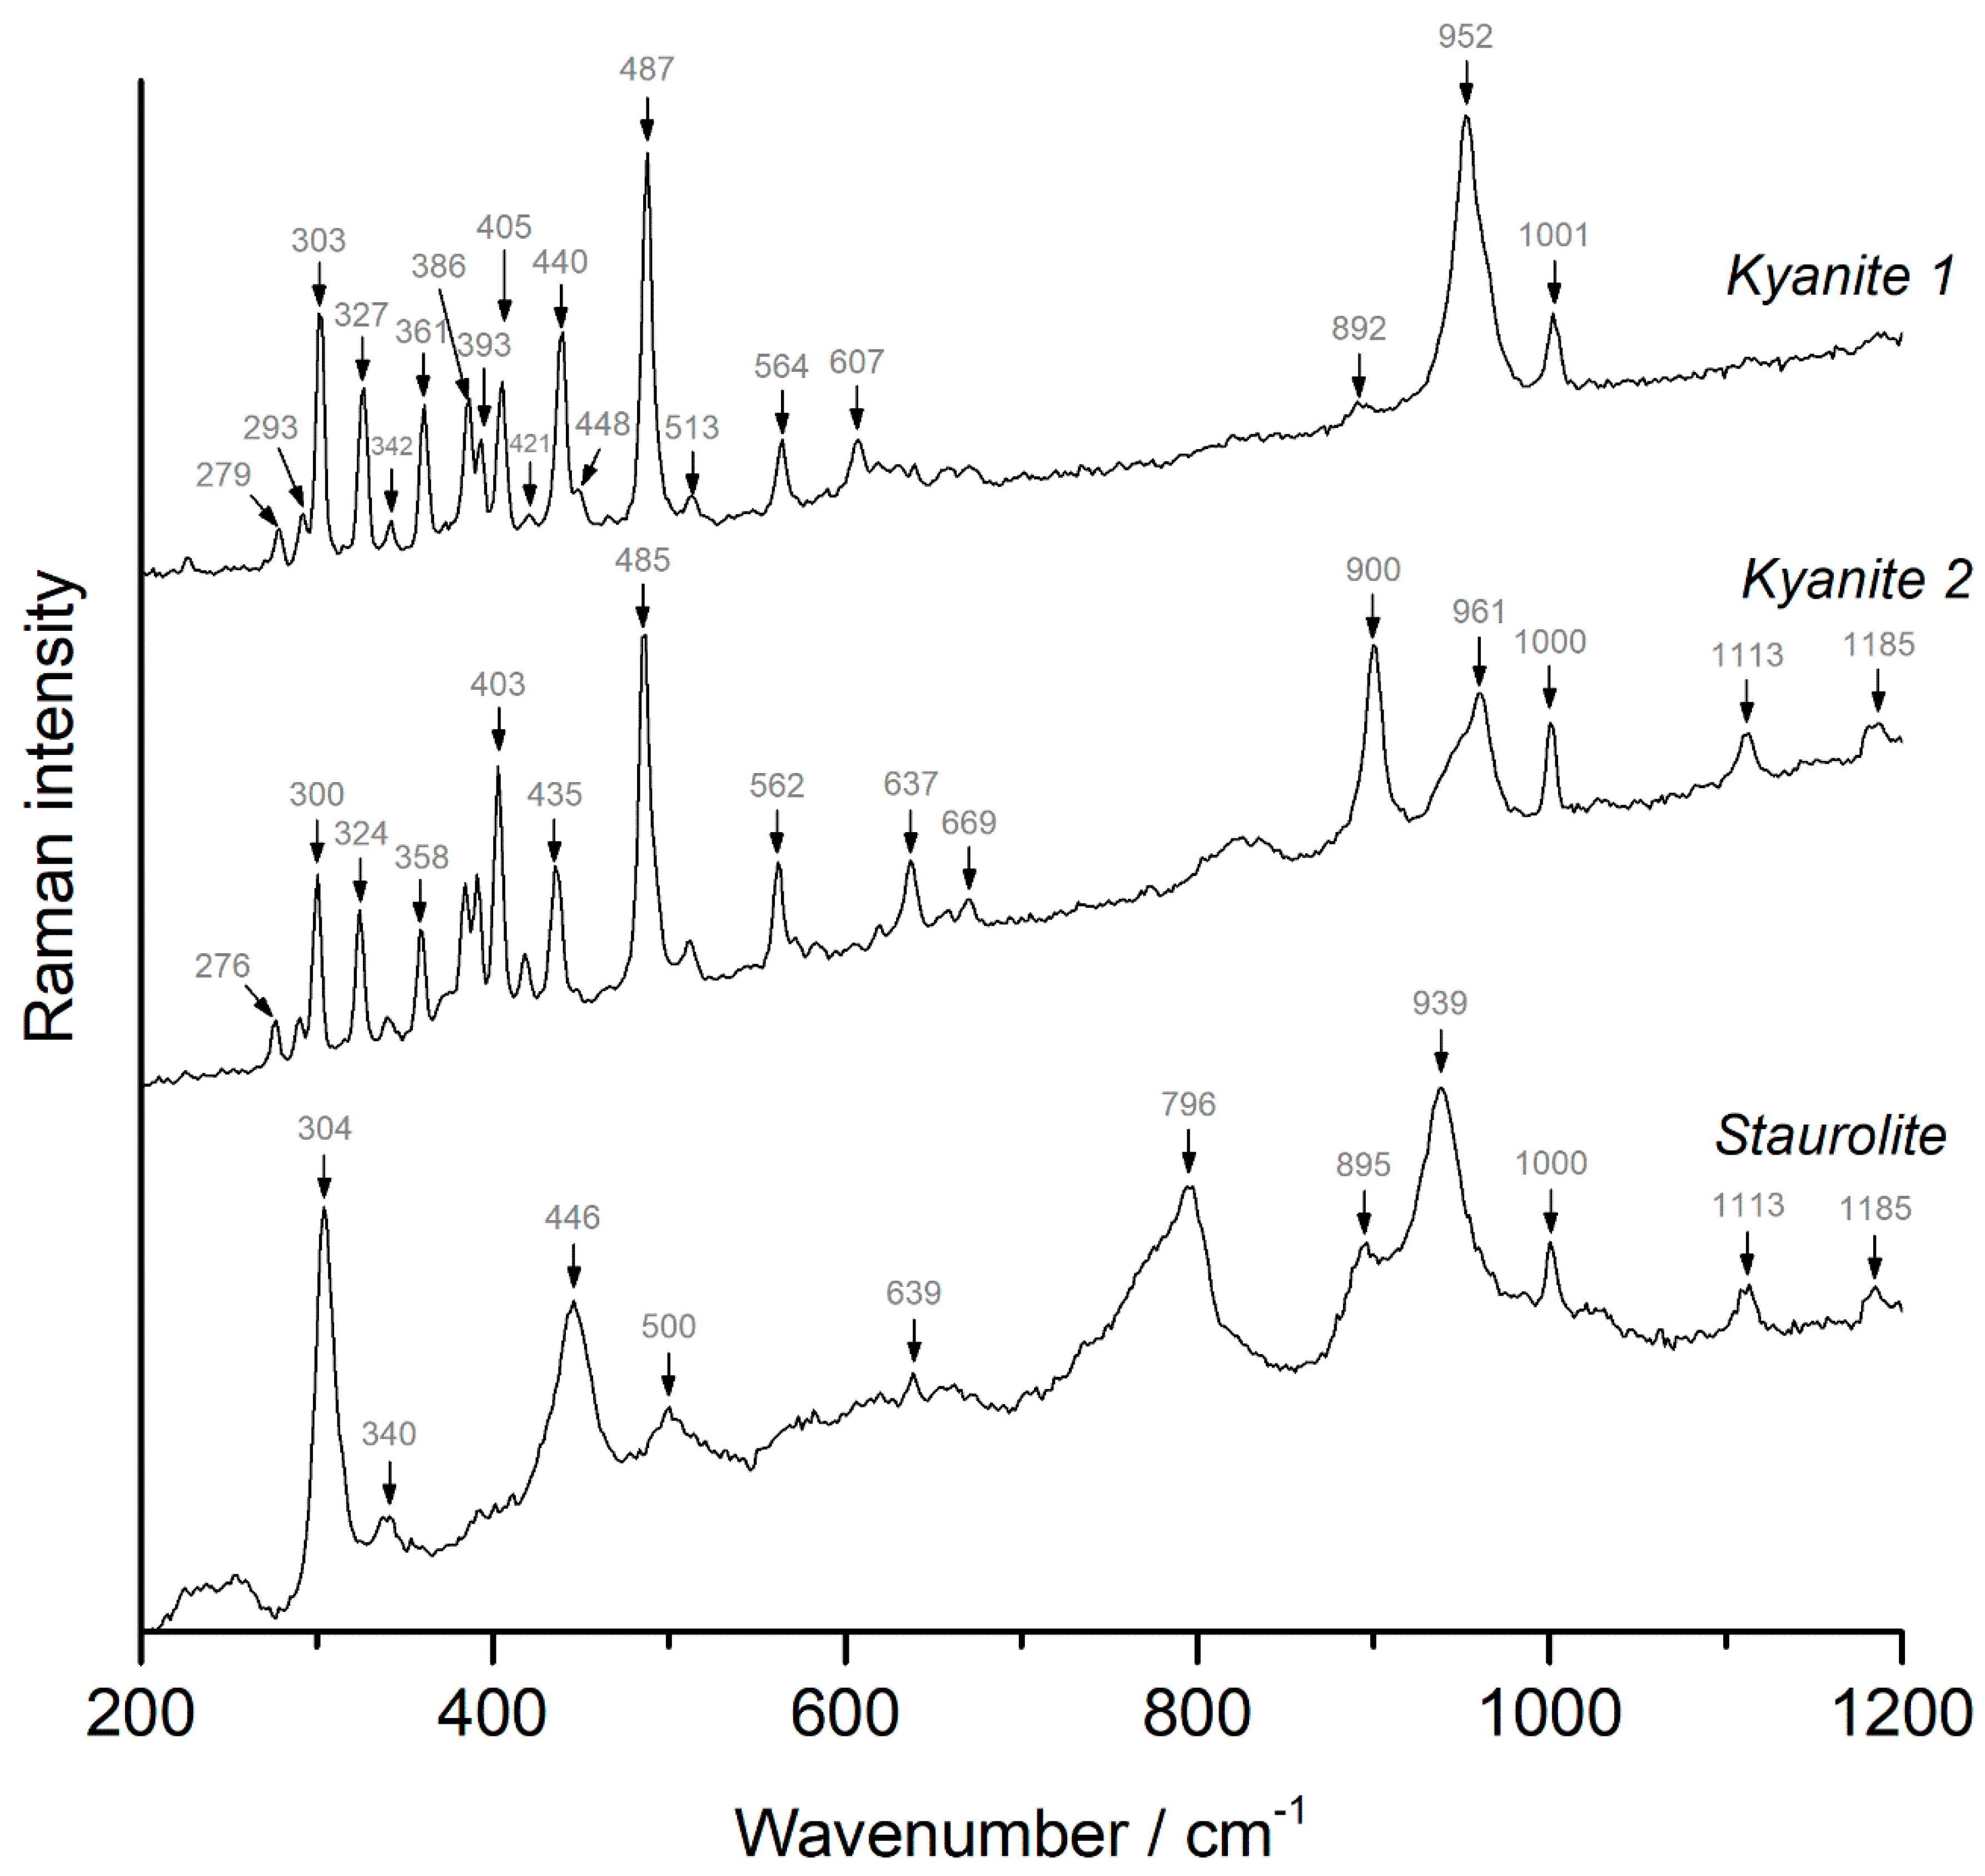
4.2. Kyanite and Staurolite
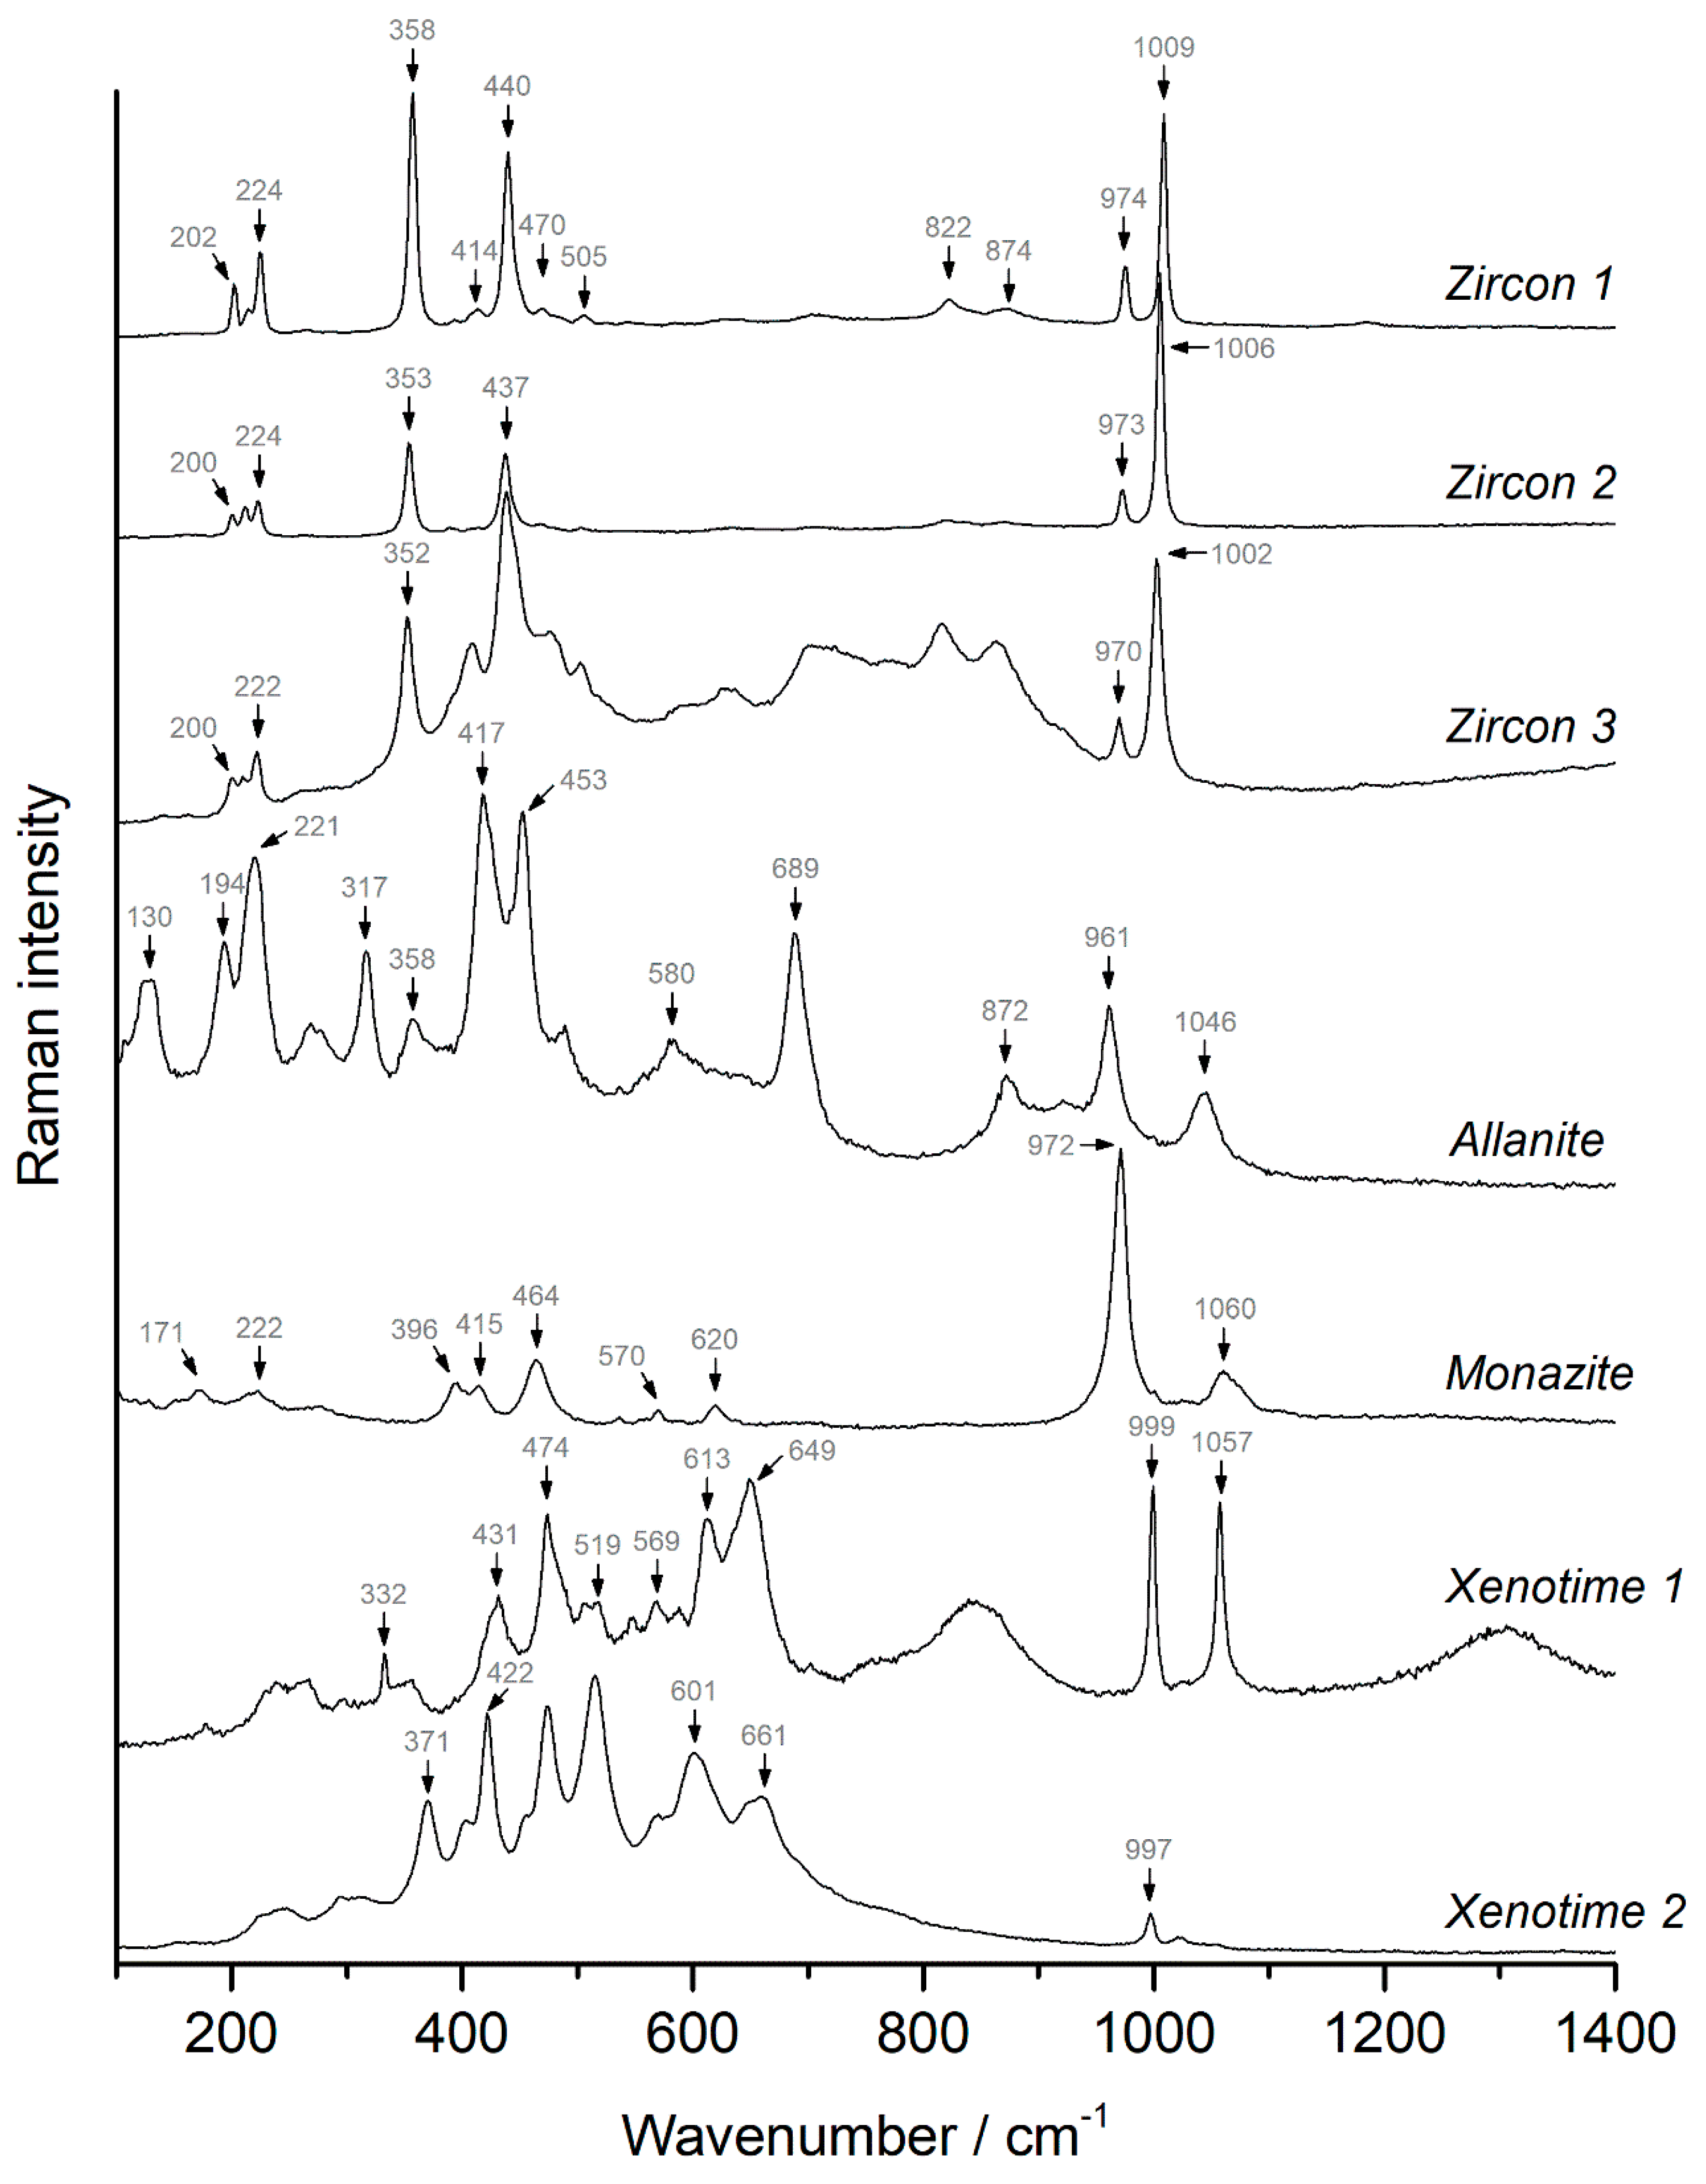
4.3. REE Minerals
4.3.1. Zircon
4.3.2. Allanite
4.3.3. Monazite
4.3.4. Xenotime
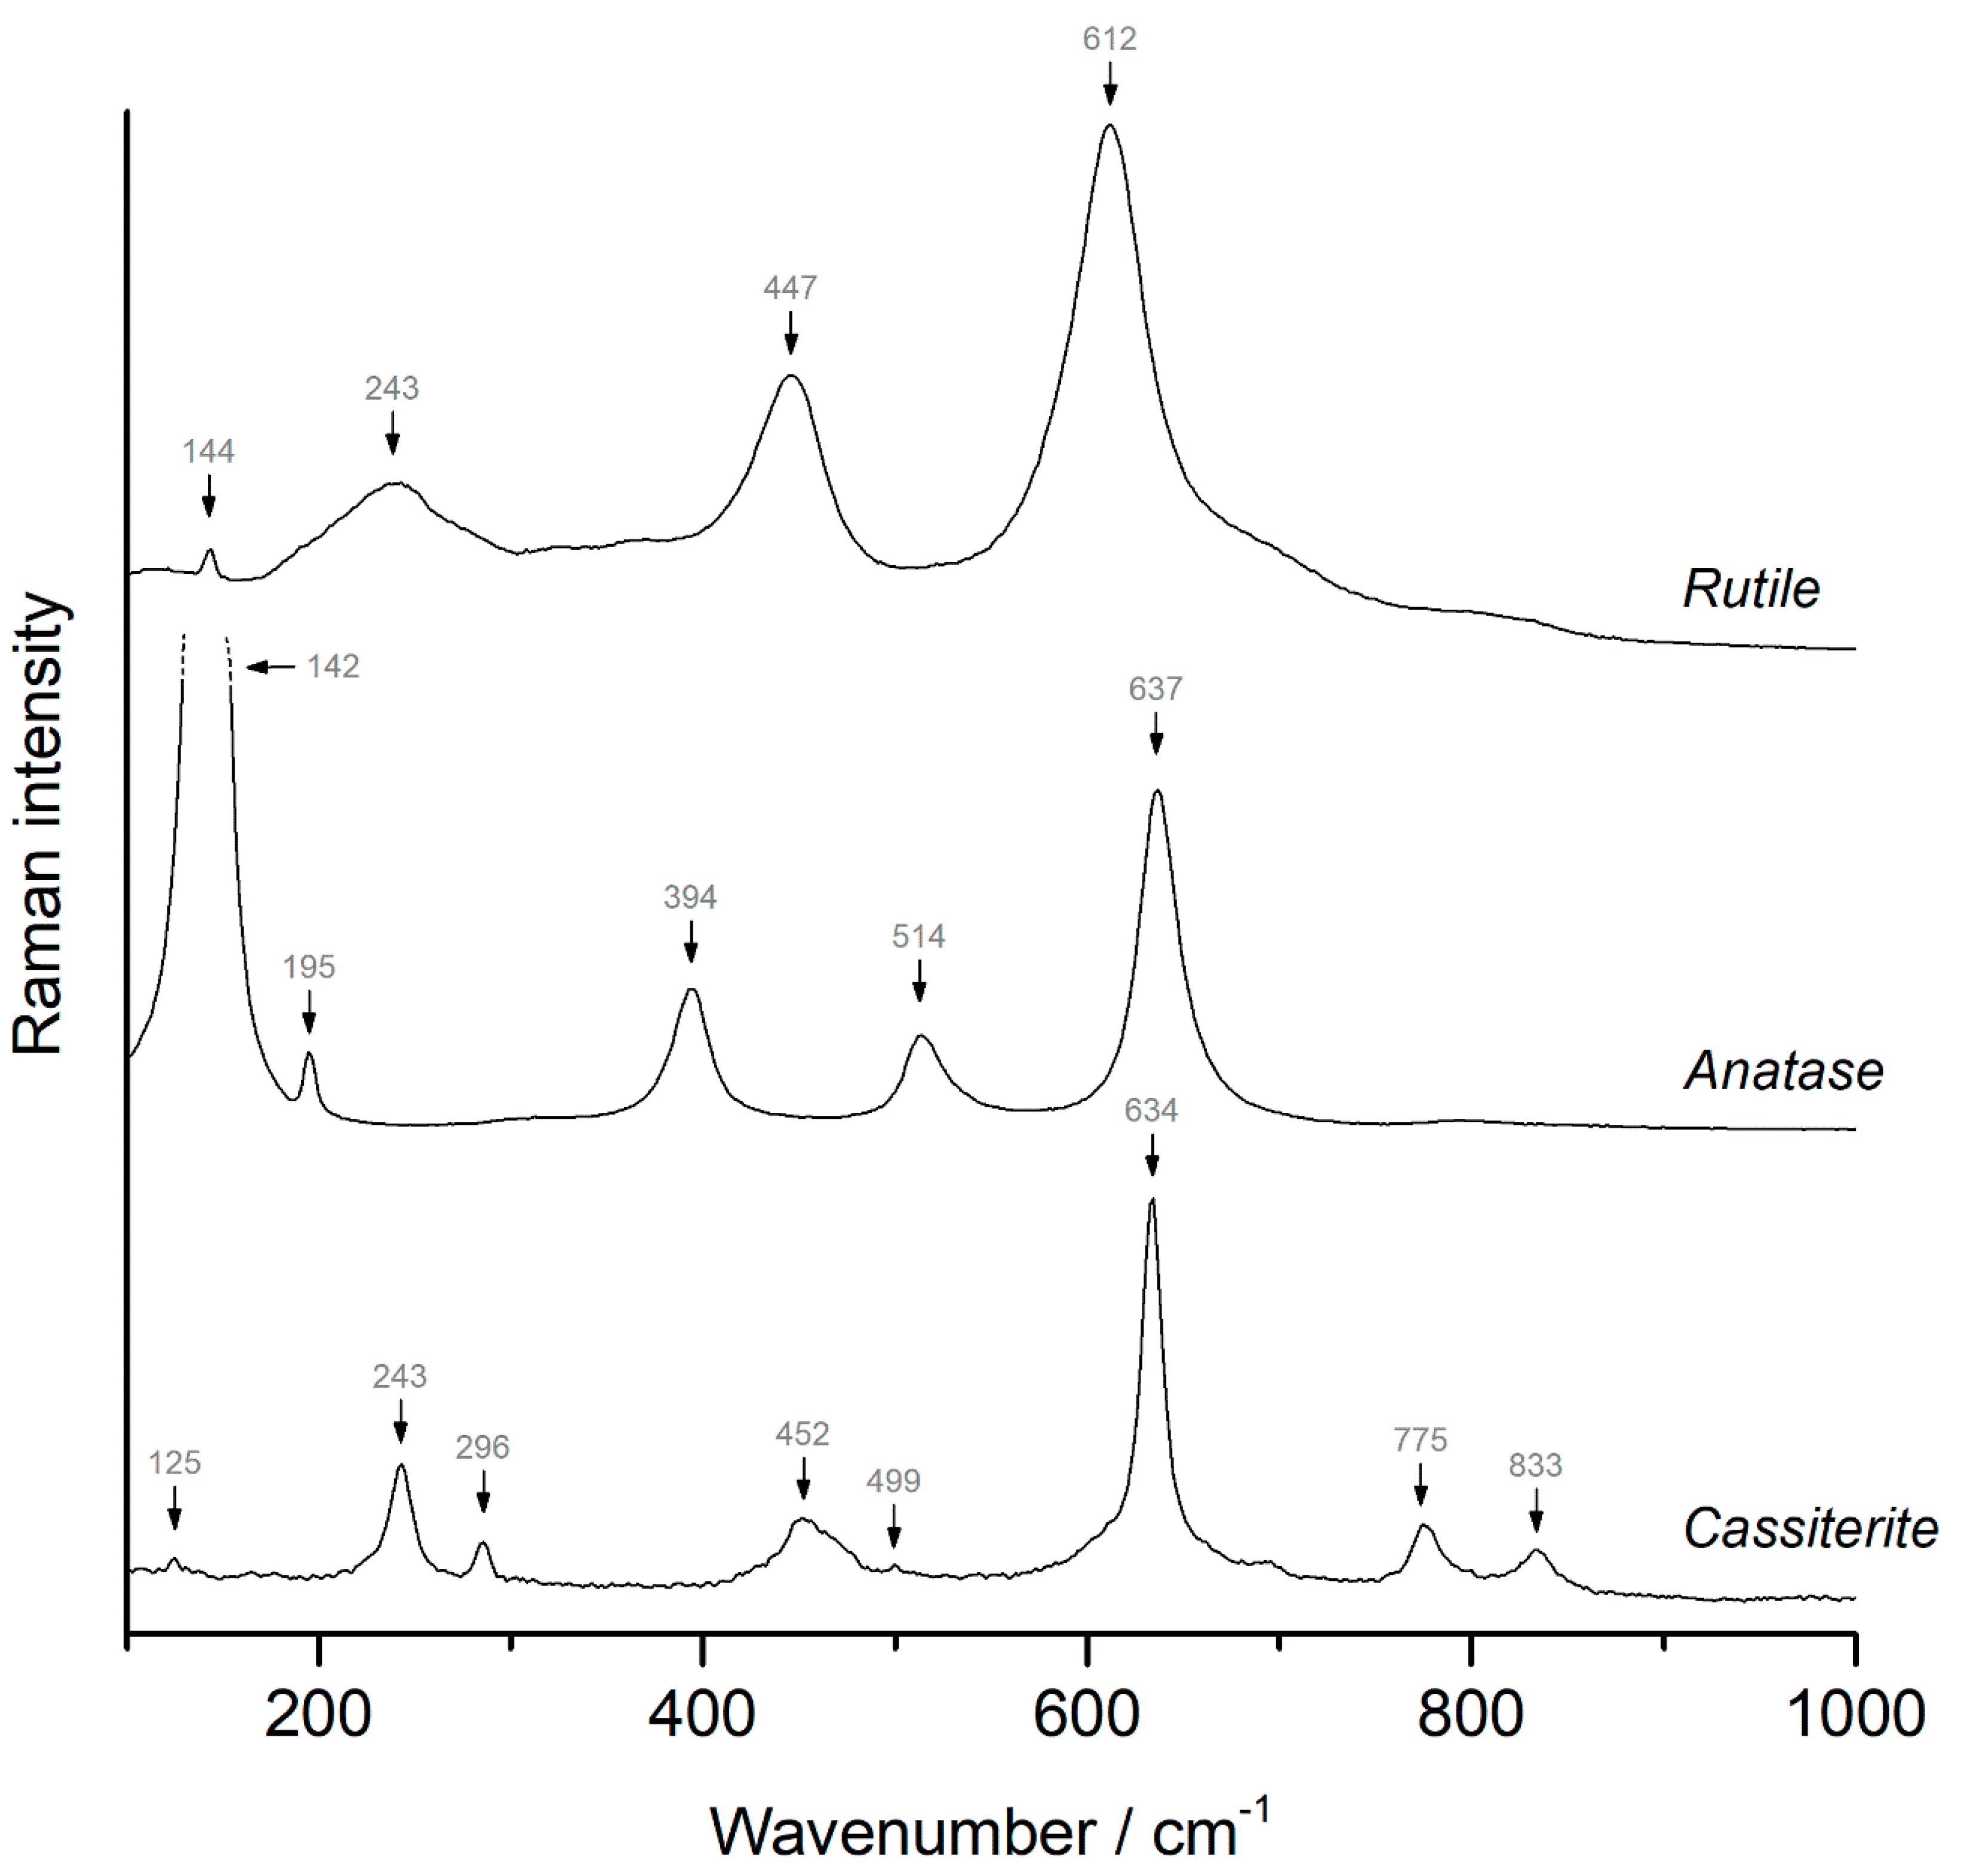
4.4. Oxides
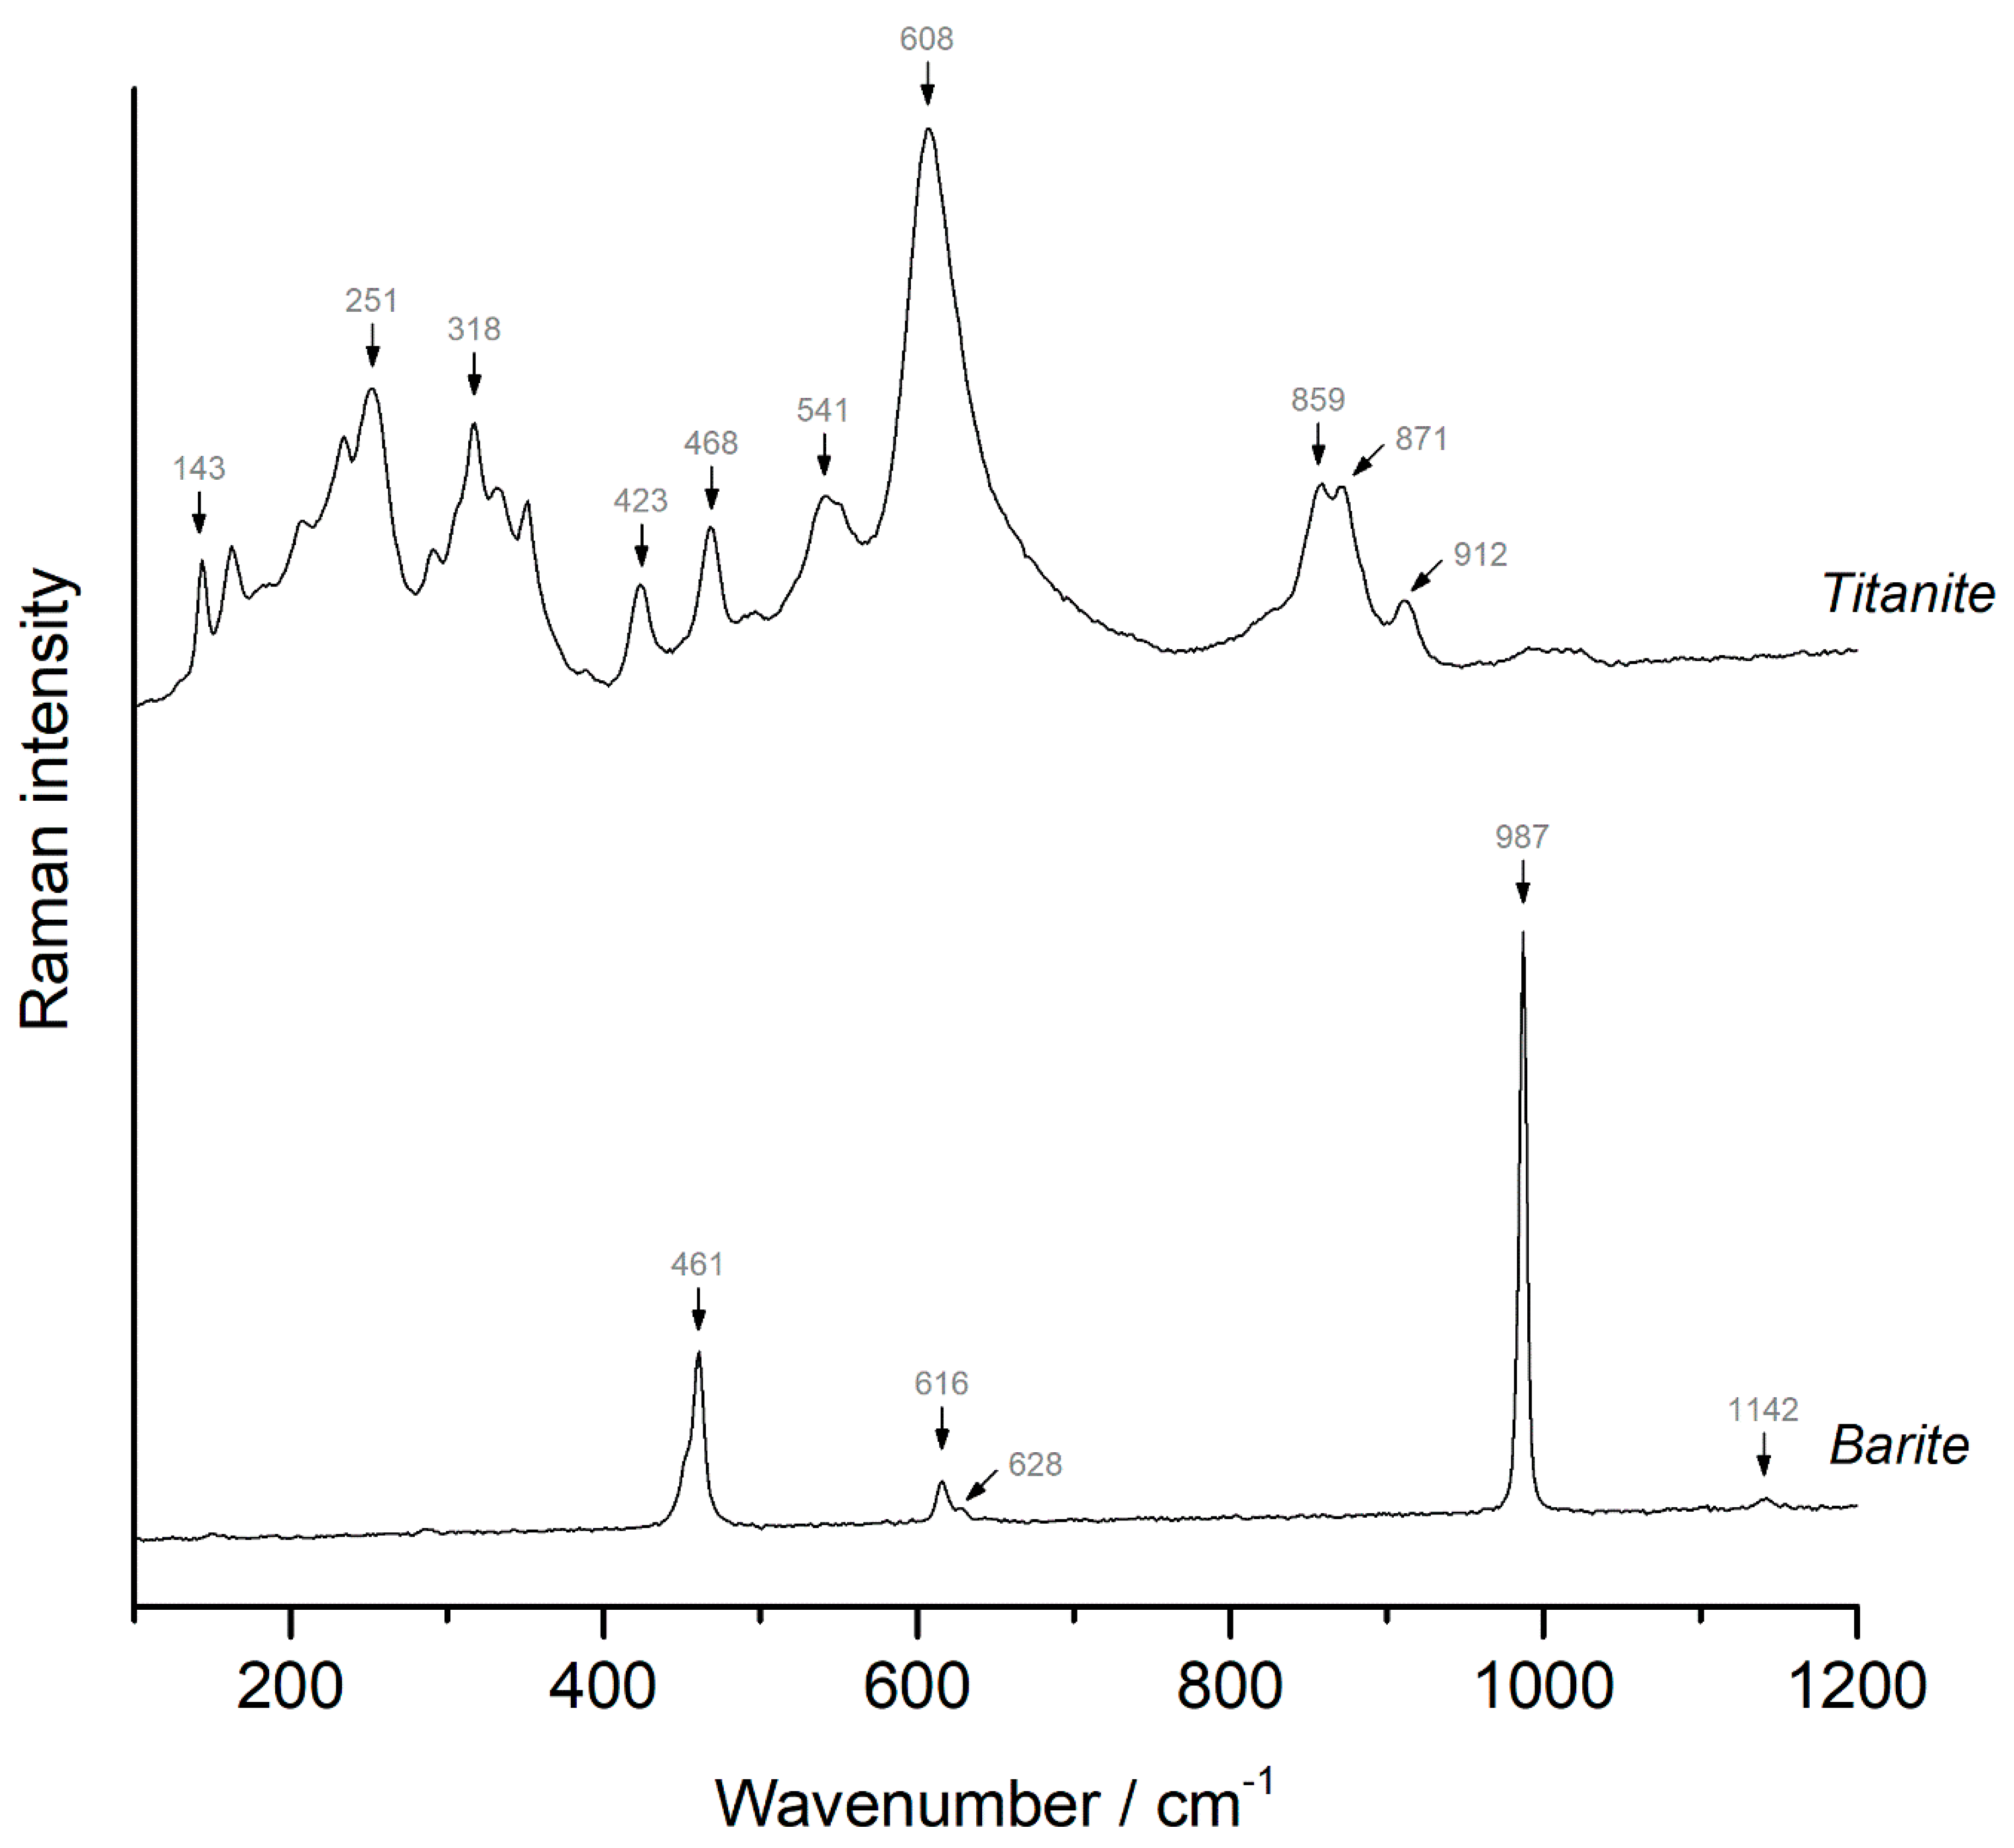
4.5. Titanite and Barite
5. Conclusions
Supplementary Materials
Author Contributions
Funding
Acknowledgments
Conflicts of Interest
References
- Dill, H. A review of heavy minerals in clastic sediments with case studies from the alluvial-fan through the nearshore-marine environments. Earth Sci. Rev. 1998, 45, 103–132. [Google Scholar] [CrossRef]
- Dill, H.G.; Goldmann, S.; Cravero, F. Zr-Ti-Fe placers along the coast of NE Argentina: Provenance analysis and ore guide for the metallogenesis in the South Atlantic Ocean. Ore Geol. Rev. 2018, 95, 131–160. [Google Scholar] [CrossRef]
- Maftei, A.E.; Dill, H.G.; Buzatu, A.; Iancu, G.; Buzgar, N.; Andráš, P. Chemical and mineralogical composition of fluvial sediments (Bistrita River, Romania): Geogenic vs. anthropogenic input into rivers on its way through mining areas. Geochemestry 2018, 78, 385–395. [Google Scholar] [CrossRef]
- Mange, M.A.; Morton, A.C. Geochemistry of Heavy Minerals. In Developments in Sedimentology; Elsevier BV: Amsterdam, The Netherlands, 2007; Volume 58, pp. 345–391. [Google Scholar]
- Sevastjanova, I.; Hall, R.; Alderton, D. A detrital heavy mineral viewpoint on sediment provenance and tropical weathering in SE Asia. Sediment. Geol. 2012, 280, 179–194. [Google Scholar] [CrossRef]
- Ali, M.Y.; Hibberd, P.; Stoikovich, B. Origin and prospectivity of heavy mineral enriched sand deposits along the Somaliland coastal areas. J. Afr. Earth Sci. 2018, 140, 60–75. [Google Scholar] [CrossRef]
- Dill, H.G. Gems and Placers—A Genetic Relationship Par Excellence. Minerals 2018, 8, 470. [Google Scholar] [CrossRef]
- Williams, G.; Gilman, S.K.; Marlowe, Z. Geometallurgy in Mineral Sands Deposits—Linking Geological Artifacts to Metallurgy and Mine Planning; The Australasian Institute of Mining and Metallurgy: Carlton, VI, Australia, 2011; pp. 383–392. [Google Scholar]
- Li, G.; Yan, W.; Zhong, L.; Xia, Z.; Wang, S. Provenance of heavy mineral deposits on the northwestern shelf of the South China Sea, evidence from single-mineral chemistry. Mar. Geol. 2015, 363, 112–124. [Google Scholar] [CrossRef]
- Nyobe, J.M.; Sababa, E.; Bayiga, E.C.; Ndjigui, P.-D. Mineralogical and geochemical features of alluvial sediments from the Lobo watershed (Southern Cameroon): Implications for rutile exploration. Comptes Rendus Geosci. 2018, 350, 119–129. [Google Scholar] [CrossRef]
- Pirkle, F.L.; Pirkle, W.A.; Pirkle, E. Heavy-Mineral Sands of the Atlantic and Gulf Coastal Plains, USA. In Developments in Sedimentology; Elsevier BV: Amsterdam, The Netherlands, 2007; Volume 58, pp. 1144–1232. [Google Scholar]
- Smith, E.; Dent, G. Modern Raman Spectroscopy–A Practical Approach; Wiley: Hoboken, NJ, USA, 2004. [Google Scholar]
- Worobiec, A.; Stefaniak, E.A.; Potgieter-Vermaak, S.; Sawlowicz, Z.; Spolnik, Z.; Van Grieken, R. Characterisation of concentrates of heavy mineral sands by micro-Raman spectrometry and CC-SEM/EDX with HCA. Appl. Geochem. 2007, 22, 2078–2085. [Google Scholar] [CrossRef]
- Chew, D.; O’Sullivan, G.; Caracciolo, L.; Mark, C.; Tyrrell, S. Sourcing the sand: Accessory mineral fertility, analytical and other biases in detrital U-Pb provenance analysis. Earth Sci. Rev. 2020, 202, 103093. [Google Scholar] [CrossRef]
- Lünsdorf, N.K.; Kalies, J.; Ahlers, P.; Dunkl, I.; Von Eynatten, H. Semi-Automated Heavy-Mineral Analysis by Raman Spectroscopy. Minerals 2019, 9, 385. [Google Scholar] [CrossRef]
- Bersani, D.; Andò, S.; Vignola, P.; Moltifiori, G.; Marino, I.-G.; Lottici, P.P.; Diella, V. Micro-Raman spectroscopy as a routine tool for garnet analysis. Spectrochim. Acta Part A Mol. Biomol. Spectrosc. 2009, 73, 484–491. [Google Scholar] [CrossRef]
- Smith, D.C. The RAMANITA© method for non-destructive and in situ semi-quantitative chemical analysis of mineral solid-solutions by multidimensional calibration of Raman wavenumber shifts. Spectrochim. Acta Part A Mol. Biomol. Spectrosc. 2005, 61, 2299–2314. [Google Scholar] [CrossRef]
- Titorenkova, R.; Mihailova, B.; Konstantinov, L. Raman spectroscopic study of variably recrystallized metamict zircon from amphibolite-facies metagranites, Serbo-Macedonian massif, Bulgaria. Can. Miner. 2006, 44, 1357–1366. [Google Scholar] [CrossRef]
- Zhai, K.; Xue, W.; Wang, H.; Wu, X.; Zhai, S. Raman spectra of sillimanite, andalusite, and kyanite at various temperatures. Phys. Chem. Miner. 2020, 47, 1–11. [Google Scholar] [CrossRef]
- Ruschel, K.; Nasdala, L.; Kronz, A.; Hanchar, J.M.; Többens, D.M.; Škoda, R.; Finger, F.; Möller, A. A Raman spectroscopic study on the structural disorder of monazite–(Ce). Miner. Pet. 2012, 105, 41–55. [Google Scholar] [CrossRef]
- Silva, E.; Ayala, A.; Guedes, I.; Paschoal, C.; Moreira, R.; Loong, C.-K.; Boatner, L. Vibrational spectra of monazite-type rare-earth orthophosphates. Opt. Mater. 2006, 29, 224–230. [Google Scholar] [CrossRef]
- Buzatu, A.; Dill, H.G.; Buzgar, N.; Damian, G.; Maftei, A.E.; Apopei, A.I. Efflorescent sulfates from Baia Sprie mining area (Romania)—Acid mine drainage and climatological approach. Sci. Total. Environ. 2016, 542, 629–641. [Google Scholar] [CrossRef]
- Buzgar, N.; Buzatu, A.; Sanislav, I.V. The Raman study on certain sulfates. An. St. Univ. Al. I. Cuza Iasi Geol. 2009, 1, 5–23. [Google Scholar]
- Apopei, A.I.; Damian, G.; Buzgar, N.; Buzatu, A. Mineralogy and geochemistry of Pb–Sb/As-sulfosalts from Coranda-Hondol ore deposit (Romania)—Conditions of telluride deposition. Ore Geol. Rev. 2016, 72, 857–873. [Google Scholar] [CrossRef]
- Apopei, A.I.; Damian, G.; Buzgar, N.; Buzatu, A.; Andráš, P.; Milovská, S. The determination of the Sb/As content in natural tetrahedrite–tennantite and bournonite–seligmannite solid solution series by Raman spectroscopy. Min. Mag. 2017, 81, 1439–1456. [Google Scholar] [CrossRef]
- Buzatu, A.; Damian, G.; Buzgar, N.; Andráš, P.; Apopei, A.I.; Maftei, A.E.; Milovska, S. Structural key features of bismuth and Sb-As sulfosalts from hydrothermal deposits—micro-Raman spectrometry. Vib. Spectrosc. 2017, 89, 49–56. [Google Scholar] [CrossRef]
- Diéguez, A.; Rodríguez, A.R.; Vilà, A.; Morante, J.R. The complete Raman spectrum of nanometric SnO2 particles. J. Appl. Phys. 2001, 90, 1550–1557. [Google Scholar] [CrossRef]
- Ekoi, E.; Gowen, A.; Dorrepaal, R.; Dowling, D. Characterisation of titanium oxide layers using Raman spectroscopy and optical profilometry: Influence of oxide properties. Results Phys. 2019, 12, 1574–1585. [Google Scholar] [CrossRef]
- Frank, O.; Zukalova, M.; Laskova, B.; Kürti, J.; Koltai, J.; Kavan, L. Raman spectra of titanium dioxide (anatase, rutile) with identified oxygen isotopes (16, 17, 18). Phys. Chem. Chem. Phys. 2012, 14, 14567–14572. [Google Scholar] [CrossRef]
- Nakamoto, K. Infrared and Raman Spectra of Inorganic and Coordination Compounds Part A: Theory and Applications in Inorganic Chemistry; John Wiley and Sons: New Jersey, NJ, USA, 2009. [Google Scholar]
- Bedelean, H.; Bedelean, A. Contributions to the Study of the Alluvial Gold from Valea Pianului Area (Alba District). Stud. Univ. Babes-Bolyai, Geol. 2001, 46, 161–169. [Google Scholar] [CrossRef][Green Version]
- Udubașa, G.; Udubașa, S.S. Native platinum in Romania: The single occurrence—Pianu Valley, Sebeș Mts. Pangeea 2015, 15, 5–8. [Google Scholar]
- Saulea Bocec, E. The mineralogical constitution of the alluvial sand from Pianu de sus, Alba District, Romania. An. Sci. Univ. Iasi 1934, 9, 514–523. [Google Scholar]
- Udubașa, G.; Pop, D.; Costea, C. Native platinum at Pianu, Sebeș county, Romania. Rom. J. Min. Dep. 2004, 81, 192–194. [Google Scholar]
- Săndulescu, M. Geotectonics of Romania; Ed. Tehnică: București, Romania, 1984. (In Romanian) [Google Scholar]
- Popa, S.; Popa, T.; Jianu, A.; Puiu, S.; Franchi, R.; Gobbi, L.; Puglisi, D. Preliminary data about the chemical composition of alluvial gold from Pianu Valley (Sebeș Mountains, Southern Carpathians, Romania). Proc. Rom. Acad. 2006, 1, 17–21. [Google Scholar]
- Iancu, V.; Berza, T.; Seghedi, A.; Marunțiu, M. Palaeozoic rock assemblages incorporated in the South Carpathian alpine thrust belt (Romania and Serbia): A review. Geol. Belg. 2005, 8, 48–68. [Google Scholar]
- Iancu, V.; Seghedi, A. The South Carpathians: Tectono-metamorphic units related to Variscan and Pan-African inheritance. Geo. Eco. Marina 2017, 23, 245–262. [Google Scholar]
- Cristea-Stan, D.; Constantinescu, B.; Udubașa, S.S.; Udubașa, G. Alluvial gold in the South Carpathians: Analytical data on some new occurences. Rom. J. Min. Dep. 2016, 89, 35–40. [Google Scholar]
- Stoica, A.M.; Ducea, M.N.; Roban, R.D.; Jianu, D. Origin and evolution of the South Carpathians basement (Romania): A zircon and monazite geochronologic study of its Alpine sedimentary cover. Int. Geol. Rev. 2015, 58, 510–524. [Google Scholar] [CrossRef]
- Grew, E.S.; Locock, A.J.; Mills, S.J.; Galuskina, I.O.; Galuskin, E.V.; Hålenius, U. Nomenclature of the garnet supergroup. Am. Miner. 2013, 98, 785–811. [Google Scholar] [CrossRef]
- Deer, F.W.A.; Howie, R.A.; Zussman, J. An Introduction to the Rock-Forming Minerals; Mineralogical Society: London, UK, 2013; Volume 1A. [Google Scholar]
- Mingsheng, P.; Mao, H.K.; Dien, L.; Chao, E.C.T. Raman spectroscopy of garnet-group minerals. Chin. J. Geochem. 1994, 13, 176–183. [Google Scholar] [CrossRef]
- Hofmeister, A.M.; Chopelas, A. Vibrational spectroscopy of end-member silicate garnets. Phys. Chem. Miner. 1991, 17, 503–526. [Google Scholar] [CrossRef]
- Kolesov, B.A.; Geiger, C.A. Raman spectra of silicate garnets. Phys. Chem. Miner. 1998, 25, 142–151. [Google Scholar] [CrossRef]
- Kos, S.; Dolenec, M.; Lux, J.; Dolenec, S. Raman Microspectroscopy of Garnets from S-Fibulae from the Archaeological Site Lajh (Slovenia). Minerals 2020, 10, 325. [Google Scholar] [CrossRef]
- Makreski, P.; Jovanovski, G.; Stojančeska, S. Minerals from Macedonia XIII: Vibrational spectra of some commonly appearing nesosilicate minerals. J. Mol. Struct. 2005, 79–92. [Google Scholar] [CrossRef]
- Kolesov, B.A.; Geiger, C.A.; Armbruster, T. The dynamic properties of zircon studied by single-crystal X-ray diffraction and Raman spectroscopy. Eur. J. Miner. 2001, 13, 939–948. [Google Scholar] [CrossRef]
- Zhang, M.; Salje, E.; Farnan, I.; Graeme-Barber, A.; Daniel, P.; Ewing, R.C.; Clark, A.M.; Leroux, H. Metamictization of zircon: Raman spectroscopic study. J. Physics: Condens. Matter 2000, 12, 1915–1925. [Google Scholar] [CrossRef]
- Bouvier, A.-S.; Ushikubo, T.; Kita, N.T.; Cavosie, A.J.; Kozdon, R.; Valley, J.W. Li isotopes and trace elements as a petrogenetic tracer in zircon: Insights from Archean TTGs and sanukitoids. Contrib. Miner. Pet. 2011, 163, 745–768. [Google Scholar] [CrossRef]
- López, A.; Frost, R.L. Identification of allanite (Ce, Ca, Y)2(Al, Fe3+)3(SiO4)3OH found in marble from Chillagoe, Queensland using Raman spectroscopy. Spectrochim. Acta Part A Mol. Biomol. Spectrosc. 2015, 138, 229–233. [Google Scholar] [CrossRef]
- Švecová, E.; Čopjaková, R.; Losos, Z.; Škoda, R.; Nasdala, L.; Cícha, J. Multi-stage evolution of xenotime–(Y) from Písek pegmatites, Czech Republic: An electron probe micro-analysis and Raman spectroscopy study. Miner. Pet. 2016, 110, 747–765. [Google Scholar] [CrossRef]
- Anderson, A.J.; Hanchar, J.M.; Hodges, K.V.; Van Soest, M.C. Mapping radiation damage zoning in zircon using Raman spectroscopy: Implications for zircon chronology. Chem. Geol. 2020, 538, 119494. [Google Scholar] [CrossRef]
- Kaulina, T.; Lyalina, L.; Kamenetsky, V.; Il’Chenko, V.; Bocharov, V.; Gannibal, M. Composition and Structure of Zircon from Hydrothermal Uranium Occurrences of the Litsa Ore Area (Kola Region, Russia). Geosciences 2020, 10, 278. [Google Scholar] [CrossRef]
- Dawson, P.; Hargreave, M.M.; Wilkinson, G.R. The vibrational spectrum of zircon (ZrSiO4). J. Phys. C Solid State Phys. 1971, 4, 240–256. [Google Scholar] [CrossRef]
- Dill, H.; Weber, B. Accessory minerals of fluorite and their implication regarding the environment of formation (Nabburg–Wölsendorf fluorite district, SE Germany), with special reference to fetid fluorite (“Stinkspat”). Ore Geol. Rev. 2010, 37, 65–86. [Google Scholar] [CrossRef]
- Varlamov, D.A.; Ermolaeva, V.N.; Chukanov, N.V.; Jančev, S.; Vigasina, M.F.; Plechov, P.Y. New Data on Epidote-Supergroup Minerals: Unusual Chemical Compositions, Typochemistry, and Raman Spectroscopy. Geol. Ore Deposits 2019, 61, 827–842. [Google Scholar] [CrossRef]
- Chukanov, N.V.; Vigasina, M.F. Vibrational (Infrared and Raman) Spectra of Minerals and Related Compounds; Springer International Publishing: New York, NY, USA, 2020. [Google Scholar]
- Makreski, P.; Jovanovski, G.; Kaitner, B.; Gajović, A.; Biljan, T. Minerals from Macedonia. Vib. Spectrosc. 2007, 44, 162–170. [Google Scholar] [CrossRef]
- Clavier, N.; Mesbah, A.; Szenknect, S.; Dacheux, N. Monazite, rhabdophane, xenotime & churchite: Vibrational spectroscopy of gadolinium phosphate polymorphs. Spectrochim. Acta Part A Mol. Biomol. Spectrosc. 2018, 205, 85–94. [Google Scholar] [CrossRef]
- Wu, L.-G.; Li, C.-F.; Ling, X.-X.; Yang, Y.-H.; Mao, Q.; Putlitz, B. Further Characterization of the RW-1 Monazite: A New Working Reference Material for Oxygen and Neodymium Isotopic Microanalysis. Minerals 2019, 9, 583. [Google Scholar] [CrossRef]
- Begun, G.M.; Beall, G.W.; Boatner, L.A.; Gregor, W.J. Raman spectra of the rare earth orthophosphates. J. Raman Spectrosc. 1981, 11, 273–278. [Google Scholar] [CrossRef]
- Balachandran, U.; Eror, N. Raman spectra of titanium dioxide. J. Solid State Chem. 1982, 42, 276–282. [Google Scholar] [CrossRef]
- Sekiya, T.; Ohta, S.; Kamei, S.; Hanakawa, M.; Kurita, S. Raman spectroscopy and phase transition of anatase TiO2 under high pressure. J. Phys. Chem. Solids 2001, 62, 717–721. [Google Scholar] [CrossRef]
- Beattie, I.R.; Gilson, T.R. Single crystal laser Raman spectroscopy. Proc. R. Soc. London Ser. A Math. Phys. Sci. 1968, 307, 407–429. [Google Scholar] [CrossRef]
- Scott, J.F. Raman Spectrum of SnO2. J. Chem. Phys. 1970, 53, 852–853. [Google Scholar] [CrossRef]
- Heller, B.M.; Lünsdorf, N.K.; Dunkl, I.; Molnár, F.; Von Eynatten, H. Estimation of radiation damage in titanites using Raman spectroscopy. Am. Miner. 2019, 104, 857–868. [Google Scholar] [CrossRef]
- Zhang, M.; Salje, E.; Redfern, S.A.; Bismayer, U.; Groat, L.A. Intermediate structures in radiation damaged titanite (CaTiSiO5): A Raman spectroscopic study. J. Physics: Condens. Matter 2013, 25, 115–402. [Google Scholar] [CrossRef]
- Heyns, A.M.; Harden, P.M. The temperature dependence of the Raman spectra of chromium-doped titanite (CaTiOSiO4). J. Raman Spectrosc. 2013, 44, 1615–1624. [Google Scholar] [CrossRef]
- Salje, E.; Schmidt, C.; Bismayer, U. Structural phase transition in titanite, CaTiSiO5: A ramanspectroscopic study. Phys. Chem. Miner. 1993, 19, 502–506. [Google Scholar] [CrossRef]


| Samples/Assignment | 01 | 02 | 03 | 04 | 05 | 06 | 07 | 08 | 09 | 10 | 11 |
|---|---|---|---|---|---|---|---|---|---|---|---|
| T(X2+) | 164 | 168 | 162 | 168 | 167 | 164 | 168 | 170 | 167 | 167 | 170 |
| T(SiO4) | 225 | 251 | 214 | 215 | 215 | 214 | 218 | 211 | 215 | 212 | |
| R(SiO4) | 316 | 314 | 318 | 314 | 314 | ||||||
| 350 | 353 | 355 | 351 | 347 | 343 | 347 | 347 | 345 | 345 | 347 | |
| 369 | 370 | 373 | 373 | 371 | 371 | 373 | |||||
| ν2 | 476 | 466 | 477 | 478 | 475 | 476 | 479 | 478 | 478 | 482 | |
| ν4 | 500 | 503 | 504 | 501 | 500 | 499 | 501 | 501 | 499 | 499 | 501 |
| ν2 | 555 | 556 | 557 | 556 | 555 | 555 | 556 | 558 | 555 | 555 | 558 |
| ν4 | 639 | 634 | 630 | 630 | 636 | 633 | 633 | 632 | 633 | ||
| ν3 | 852 | 853 | 854 | 858 | 861 | 860 | 862 | 863 | 861 | 864 | 867 |
| ν1 | 907 | 910 | 912 | 915 | 912 | 913 | 916 | 916 | 915 | 917 | 918 |
| ν3 | 1002 | 1002 | 1002 | 1001 | |||||||
| ν3 | 1028 | 1034 | 1038 | 1039 | 1035 | 1035 | 1041 | 1041 | 1038 | 1041 | 1047 |
| ν3 | 1110 | 1111 | 1113 | ||||||||
| Pyr% | 2 | 2 | 32 | 18 | 11 | 1 | 13 | 12 | 16 | 18 | 22 |
| Alm% | 67 | 47 | 41 | 66 | 74 | 69 | 61 | 79 | 78 | 80 | 71 |
| Spe% | 4 | 23 | 1 | 2 | 2 | 30 | 23 | 2 | 0 | 0 | 5 |
| Gro% | 27 | 28 | 24 | 14 | 12 | 0 | 3 | 6 | 5 | 1 | 2 |
Publisher’s Note: MDPI stays neutral with regard to jurisdictional claims in published maps and institutional affiliations. |
© 2020 by the authors. Licensee MDPI, Basel, Switzerland. This article is an open access article distributed under the terms and conditions of the Creative Commons Attribution (CC BY) license (http://creativecommons.org/licenses/by/4.0/).
Share and Cite
Maftei, A.E.; Buzatu, A.; Damian, G.; Buzgar, N.; Dill, H.G.; Apopei, A.I. Micro-Raman—A Tool for the Heavy Mineral Analysis of Gold Placer-Type Deposits (Pianu Valley, Romania). Minerals 2020, 10, 988. https://doi.org/10.3390/min10110988
Maftei AE, Buzatu A, Damian G, Buzgar N, Dill HG, Apopei AI. Micro-Raman—A Tool for the Heavy Mineral Analysis of Gold Placer-Type Deposits (Pianu Valley, Romania). Minerals. 2020; 10(11):988. https://doi.org/10.3390/min10110988
Chicago/Turabian StyleMaftei, Andreea Elena, Andrei Buzatu, Gheorghe Damian, Nicolae Buzgar, Harald G. Dill, and Andrei Ionut Apopei. 2020. "Micro-Raman—A Tool for the Heavy Mineral Analysis of Gold Placer-Type Deposits (Pianu Valley, Romania)" Minerals 10, no. 11: 988. https://doi.org/10.3390/min10110988
APA StyleMaftei, A. E., Buzatu, A., Damian, G., Buzgar, N., Dill, H. G., & Apopei, A. I. (2020). Micro-Raman—A Tool for the Heavy Mineral Analysis of Gold Placer-Type Deposits (Pianu Valley, Romania). Minerals, 10(11), 988. https://doi.org/10.3390/min10110988