Article

Influence of Salinity on the Removal of Ni and Zn by Phosphate-Intercalated Nano Montmorillonite (PINM)

School of Architecture, Civil, Environmental, and Energy Engineering, Kyungpook National University, Daegu 41566, Korea
*
Author to whom correspondence should be addressed.
Minerals 2020, 10(11), 980; https://doi.org/10.3390/min10110980
Submission received: 21 September 2020 / Revised: 30 October 2020 / Accepted: 31 October 2020 / Published: 2 November 2020
(This article belongs to the Special Issue Environmental Applications of Chemically Modified Clay Minerals)

Abstract

:
The salinity influence on the adsorptions of Ni and Zn onto phosphate-intercalated nano montmorillonite (PINM) were investigated. Single adsorption isotherm models fitted the single adsorption data well. The adsorption capacity of Ni was higher than that of Zn onto PINM at different salinities. The single adsorption parameters from Langmuir model (QmL and bL) were compared with the binary adsorption ( Q m L * and b L * ). The Q m L * of Zn was lower than that of Ni. The simultaneous presence of Ni and Zn decreased the adsorption capacities. The single and binary adsorptions onto PINM were affected by the salinity. The competitive Langmuir model (CLM), P-factor, Murali and Aylmore (M−A) models, and ideal adsorbed solution theory (IAST) were satisfactory in predicting the binary adsorption data; the CLM showed the best fitting results. Our results showed that the PINM can be used as an active Ni and Zn adsorbent for a permeable reactive barrier (PRB) in the remediation of saline groundwater.

1. Introduction

Removal of heavy metal-contaminated groundwater in coastal regions has become an urgent issue due to overuse of the limited amount of freshwater by industrial activities [1]. As industrial activities increase, demand for clean water is also expanding, causing a shortage of freshwater supplies and an increase in wastewater containing heavy metals into the surrounding environment [1,2]. Ni and Zn are commonly found heavy metals in wastewaters from industrial activities including mining, steel processing, electroplating and the production of batteries and paints [2]. Ni and Zn were found at alarming quantities around a metal refinery factory in Korea [3,4]. Furthermore, the Ni was detected up to 171 ppb in the Nakdong River, where refinery wastewater was discharged. Besides Korea, a health risk assessment has been conducted to the Ni- and Zn-contaminated groundwaters from the surrounding industrial areas, steel refineries, and mining sites in the other countries, in order to determine the Ni and Zn concentration limits according to the chronic daily intake (CDI) and the health risk index (HRI) [5,6,7]. Human body Ni and Zn exposures are strongly related to various health effects, ranging from common symptoms such as dermatitis, nausea, and diarrhea [8], to chronic symptoms such as cancer when the Ni and Zn concentration are above their threshold (>3000 µg·L−1) [9,10]. In order to meet the need for clean fresh water, several technologies for Ni- and Zn-contaminated groundwater remediation, such as chemical treatment (oxidation), biological processes using bacteria or plants, and physical treatment using permeable reactive barriers (PRBs), have been developed on full-scale [11]. Among these, the physical treatment using PRB is the most cost-effective technique (USD 60–245/ton) compared to the chemical treatment (USD 60–290/ton) and the biological processes (USD 50,000–200,000/acre), respectively [11]. PRB is a passive remediation technology installed along the way of groundwater flows, where it has the ability to retain heavy metal contaminants [12]. PRBs contain various low-cost reactive adsorbents such as zeolite, hydroxyapatite, or limestone [11,12], creating the system that can stop the mobilization of Ni and Zn in the groundwater.
Montmorillonite has been used to remove Ni and Zn from wastewater through an ion exchange mechanism [2,13]. Its specific surface area and cation exchange capacity (CEC) play more important role in increasing the removal efficiency of Ni at the initial concentration (C0) of 5.87 mg·L–1 (% removal > 99%) and Zn at the C0 of 6.54 mg·L–1 (% removal > 99%) [13], than other adsorbents such as zeolite (% removal of Ni = 86.5%, % removal of Zn = 71% [14]), bentonite (% removal of Ni = 29.8% [15], % removal of Zn = 82.4% [16]), and vermiculate (% removal of Ni = 33%, % removal of Zn = 32% [13]). To increase the heavy metal adsorption capacity, several studies have reported techniques for montmorillonite modification, such as modifications using sodium dodecyl sulfate [17] and montmorillonite modified with sodium [18] for Cu and Zn adsorption. Recently, hydroxyiron-modified montmorillonite [19] and ammonium cations-montmorillonite [20] were also developed for As and Cr removal, respectively, with satisfactory results owing to the increase of montmorillonite surface area after modification. In our previous study, the phosphate-intercalated nano montmorillonite (PINM) successfully removed the radioactive waste of Cs+, Sr2+, and Co2+ from aqueous solution [21]. However, the application of PINM in the Ni and Zn-contaminated groundwater has not been investigated.
The Ni and Zn removal from groundwater in the vicinity of coastal regions was studied, where the seawater intrusion and salinization continuously affected the groundwater quality [22]. The Ni and Zn binary system can also affect the use of PINM as a reactive adsorbent in the PRB system. Therefore, it is crucial to study the adsorption of Ni and Zn binary system onto the PINM in the saline water.
We focus on the investigation of single and binary adsorption of Ni and Zn onto PINM. For single adsorption, the Langmuir, Feundlich, Dubinin Radushkevich (D−R), Sips, Kargi and Ozmihci (K−O), and Holl-Kirch (H−K) models were used. To the author’s knowledge, this is the first attempt to study the influence of salinity on the adsorption of Ni and Zn onto PINM in the binary system. The competitive Langmuir model (CLM), P-factor, Murali and Aylmore (M−A) models, and ideal adsorbed solution theory (IAST) were applied to the binary adsorption data. The feasibility of PINM as a PRB material was evaluated by correlating its physicochemical properties with the parameters of single and binary adsorption.

2. Experimental

2.1. Chemicals

The montmorillonite-KSF (Sigma-Aldrich Chemical Co., St. Louis, MO, USA) was used to prepare PINM. Zinc nitrate (Zn(NO3)2, <98%, Kanto Chemical Co., Tokyo, Japan) and nickel nitrate (Ni(NO3)2, Aldrich Chemical Co. <98%) were used as adsorbates. NaCl (Sigma-Aldrich, 99.5%), KCl (99.0%, OCI Company Ltd., Seoul, Korea), CaCl2·2H2O (Yakuri Pure Chemicals Co., Kyoto, Japan, 70.0–78.0%), MgCl2 (98%, Duksan Pure Chemicals Co., Ltd., Ansan-si, Korea), NaHCO3 (99.5%, Sigma-Aldrich), and MgSO4 (99.0%, Duksan Pure Chemicals Co., Ltd.) were used to prepare artificial seawater. The chemical compositions of artificial seawater (30‰) were demonstrated in Table 1 [23].

2.2. The Adsorbent Preparation and Characterization

The montmorillonite–KSF was purified using hydrogen peroxide (H2O2; 30%, Duksan Chemical Co.) followed by washing using distilled and deionized (DDI) water (MilliporeSigma™ Synergy™ Ultrapure Water Purification System, Thermo Fisher Scientific, Waltham, MA, USA) at 60 °C, and drying at 60 °C for 24 h. PINM was synthesized from the purified montmorillonite mixed with 2000 mg/L of PO43− (KH2PO4; >98%, Yakuri Pure Chemicals Co.) using a rotary agitator in room temperature at 200 rpm for 24 h, followed by three times washing using 1 L of DDI water to remove excess H2PO4 ions, and air-dried for 3 days [21].
The physicochemical properties of the adsorbents were characterized. Determination of pH of point of zero charge (pHPZC) of PINM was conducted by following the method by Ma et al. [21]. Cation exchange capacity (CEC) of PINM and montmorillonite were measured by the standard method [24]. Brunauer–Emmett–Teller (BET) surface area (ABET) was determined from N2 adsorption/desorption isotherm data (ASAP-2010 specific surface area analyzer, Micromeritics, Norcross, GA, USA) and fitted to the BET model. Pore size distribution was calculated using the Barrett Joyner Halenda (BJH) adsorption model (Quantachrome, Autosorb-iQ & Quadrasorb Si, Boynton Beach, FL, USA) and a specific surface area analyzer (Quantachrome, Nova, 2000, Boynton Beach, FL, USA). Scanning electron microscopy (SEM, Hitachi S−4200, Chiyoda City, Tokyo, Japan) was used to determine the morphology of montmorillonite before and after modification. The chemical composition of PINM and montmorillonite were characterized by EDS analysis (E−MAX EDS detector, Horiba, Kyoto, Japan). X−ray diffraction (XRD) patterns were measured using an X-ray diffractometer (PW2273 diffractometer, Philips, Guildford, UK) using Cu Kα radiation (λ = 1.54 Å) in the range from 5° to 50° of 2θ at a step size of 0.02° and a step time of 1 s.

2.3. Adsorption Isotherm Experiments

For single adsorption, the experiments were performed in 50 mL conical centrifuge tube (polyethylene, SPL Labware, Pocheon-si, Gyeonggi-do, Korea) at 25 °C. Firstly, 1.0 g of PINM was prepared in 50 mL tubes. The solution of Ni2+ and Zn2+ dissolved in artificial seawater (30‰) and DDI water (0‰), respectively, were added into the tubes. Eight heavy metal solutions (Ni: 0.017, 0.085, 0.170, 0.340, 0.681, 1.022, 1.363 and 1.704 mM; Zn: 0.015, 0.076, 0.153, 0.306, 0.612, 0.918, 1.224 and 1.530 mM) were used. For controlling the solution pH at 5.0, 0.05 M MES buffer (2-[N-morpholino]ethanesulfonic acid hydrate; 99.5%, ACROS Organics, Morris Plains, NJ, USA) was used. The NaNO3 (≥99%, Sigma–Aldrich) at the concentration of 0.01 M was used as a background electrolyte. The use of MES buffer did not form complexation reactions with heavy metals as confirmed by the results of others [25]. To prevent the formation of metal hydroxides and carbonates, the solution pH was controlled. The program of MINEQL+ version 4.6 for Windows (Environmental Research Software, Hallowell, ME, USA) was used to predict the molar distributions of nickel and zinc species at pH 5.0. To eliminate the carbon dioxide effect on adsorption, the headspace in the vials were minimized. The sample was mixed using a tumbler at 10 rpm for 24 h. Preliminary kinetic experiments showed that adsorption equilibrium was reached within 3 h. However, adsorption experiments were conducted for 24 h throughout this study to ensure adsorption equilibrium. The vials were collected and followed by the centrifugation at 3000 rpm (=1977 g) for 20 min. Then, the supernatant was filtered using 0.2 µm syringe filter (Whatman, cellulose nitrate membrane filter, ϕ = 25 mm). The preliminary study showed that the cellulose nitrate membrane filter had no effect on sorption of the Ni and Zn. The Ni and Zn concentration in the aqueous phase was analyzed using an inductively coupled plasma optical emission spectrometry (ICP-OES, Optima 2100 DV, Perkin-Elmer Co., Industry Drive Pittsburgh, PA, USA). Duplicate experiments were performed.
Metal solution at the same molar concentration (0.0170, 0.085, 0.170, 0.340, 0.681, 1.022, 1.363 and 1.704 mM) in a 1:1 volume ratio for each solute were prepared for binary adsorption experiments (Ni/Zn). The adsorption experiment in the binary system were performed in the same manner as those in the single system.

2.4. Isotherm Equations and Fitting Method

Single and binary adsorption models are summarized in Table 2.

3. Results and Discussion

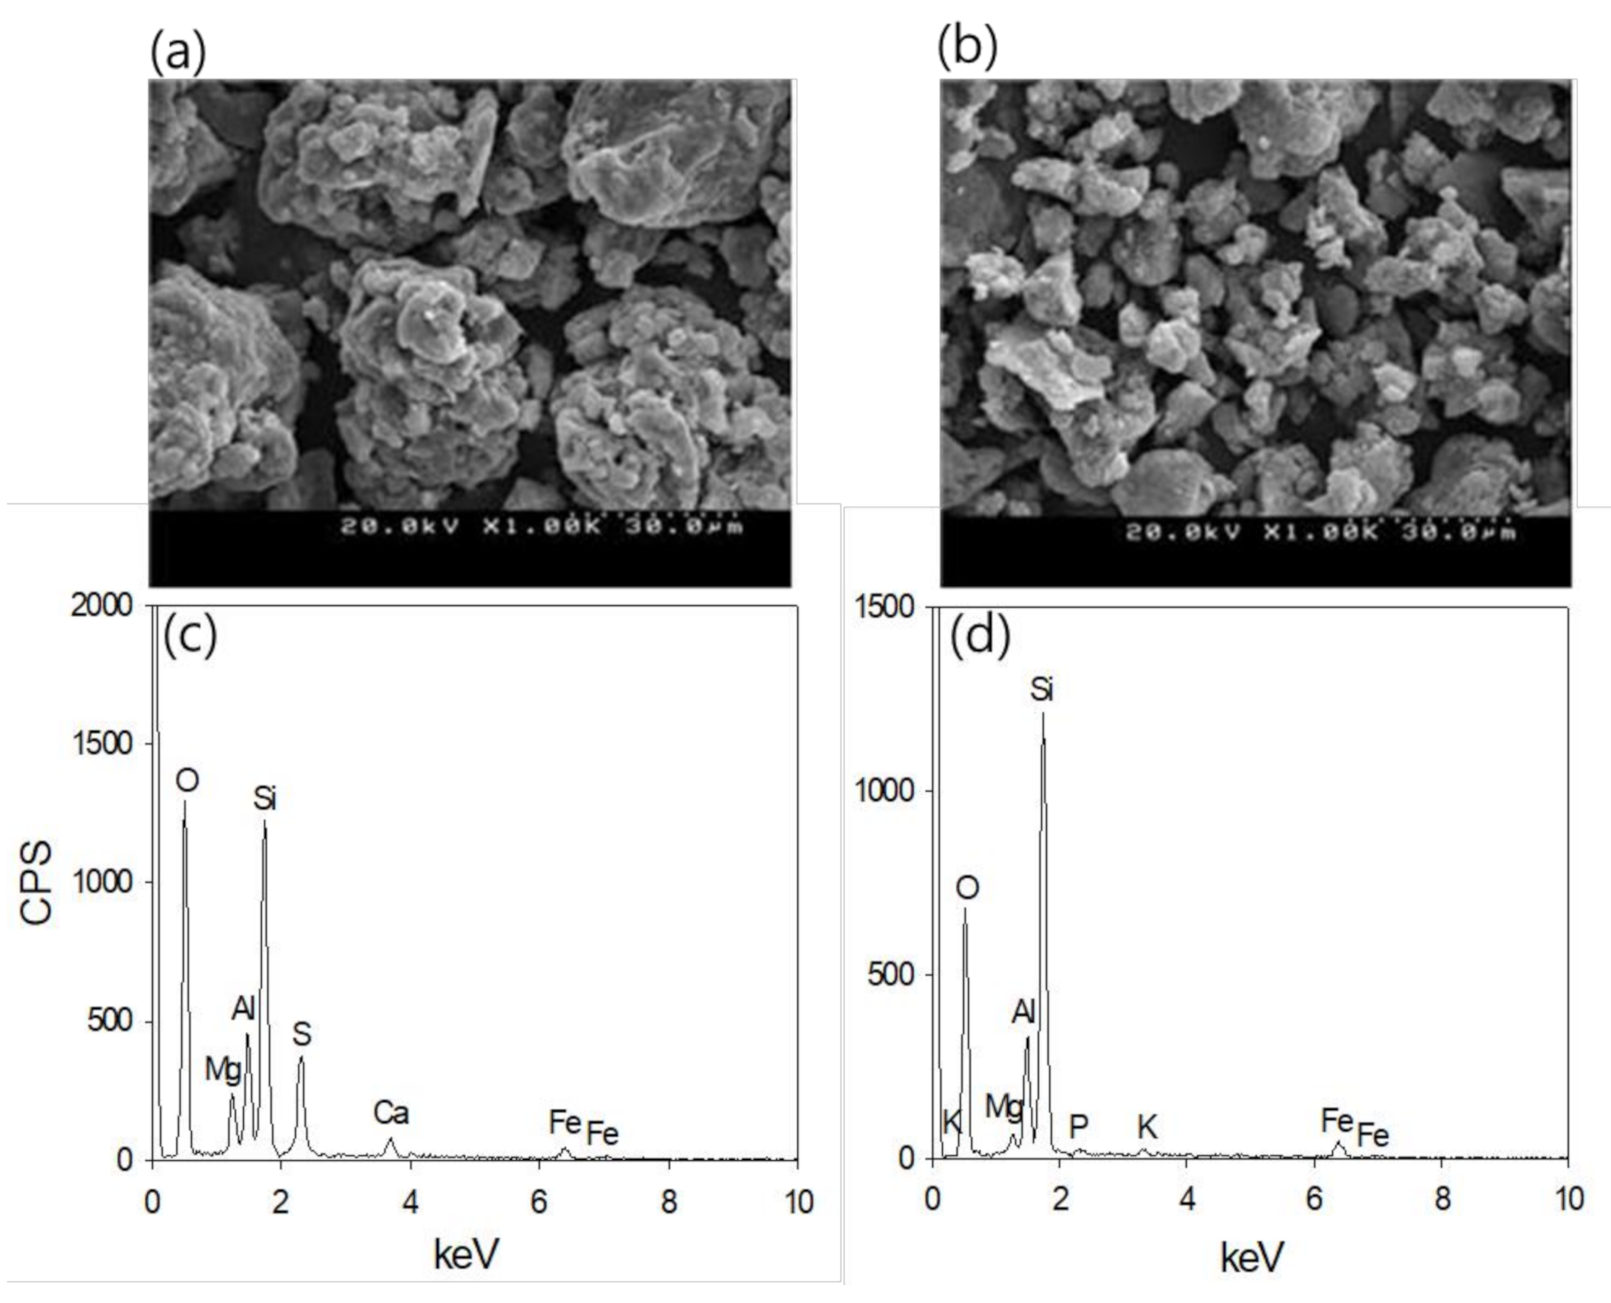
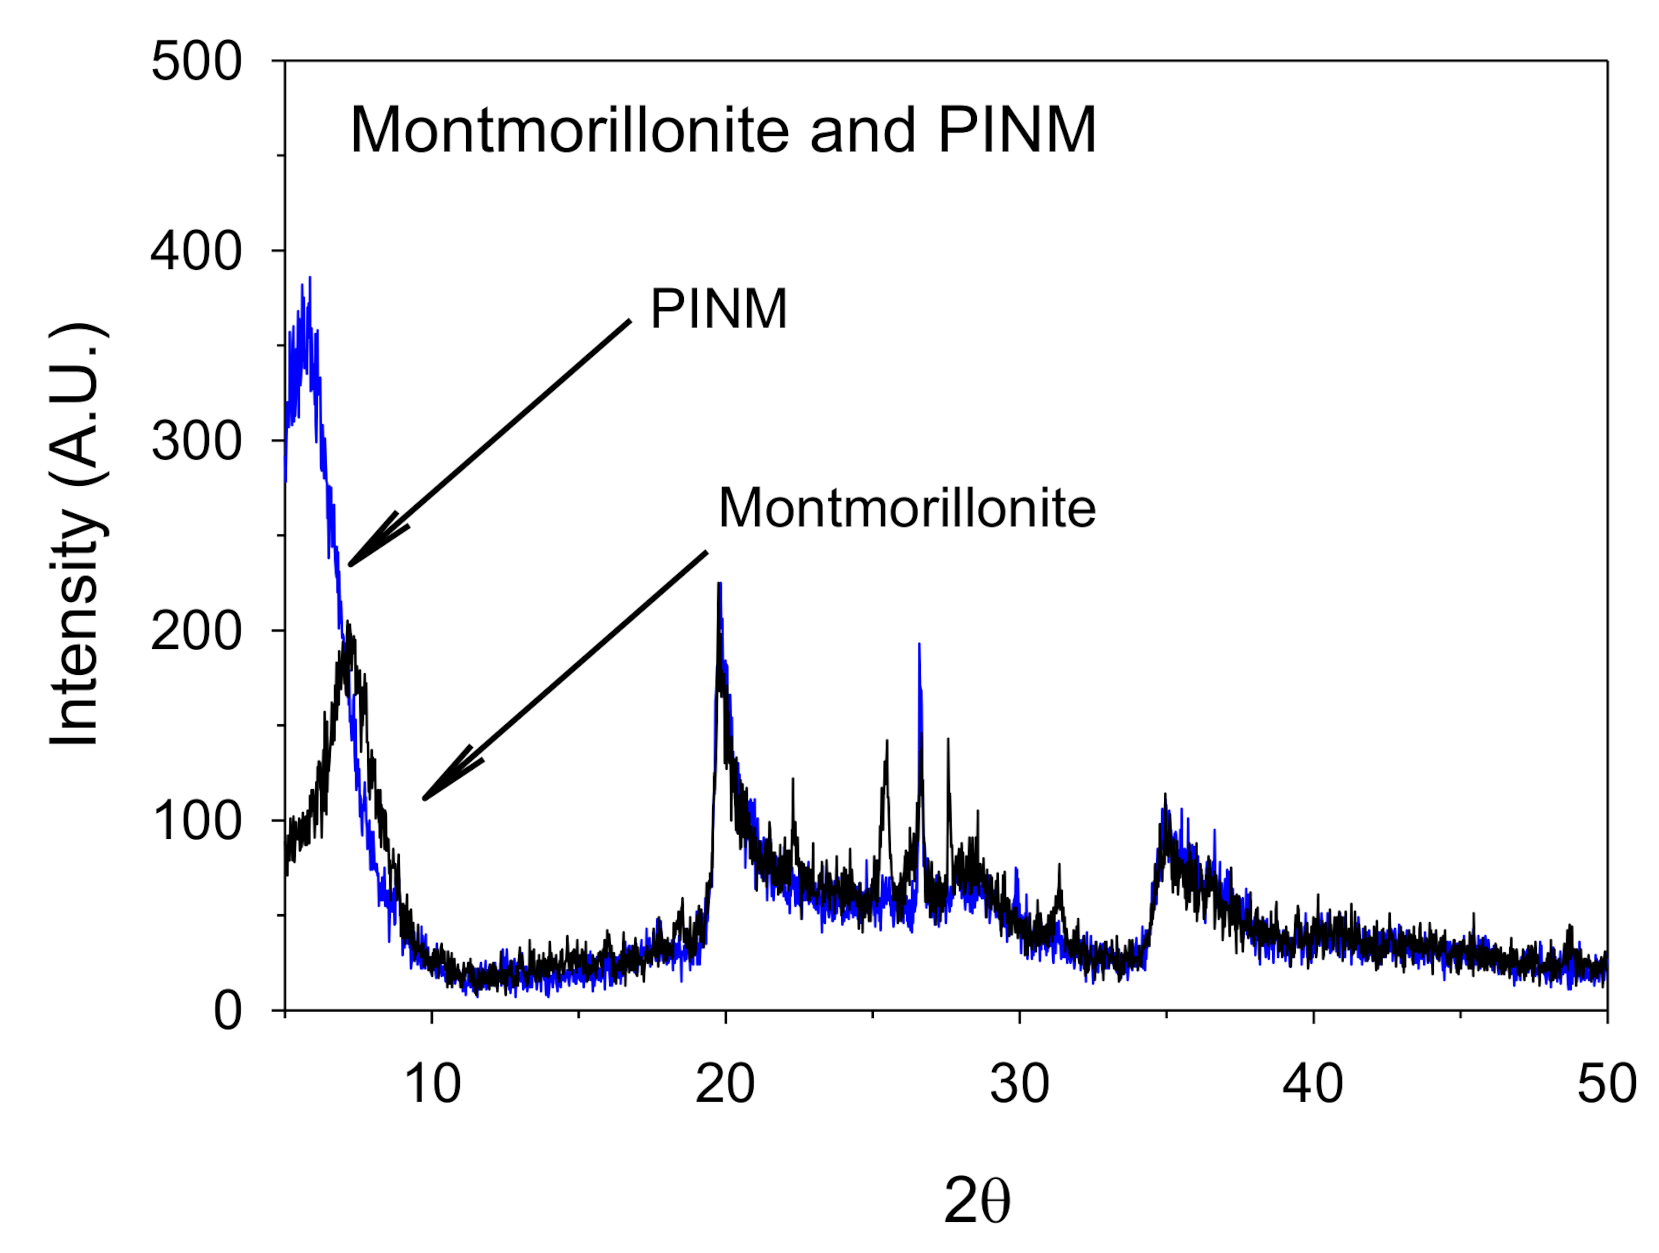
3.1. Adsorbent Characteristics

The raw montmorillonite and PINM physicochemical properties were compared. The ABET and pore volume remarkably increased from 2.6 m2/g to 115.9 m2/g and from 0.011 cm3/g to 0.1 cm3/g, respectively, due to the strongly adsorbed phosphate ions through the formation of Al-O-P-OH surface precipitates and an inner–sphere complex [32]. The pore size also slightly increased from 38.05 Å to 40.73 Å. As shown in Figure 1, SEM images showed that the raw montmorillonite particle size was bigger than that of PINM. However, the CEC of PINM (58.1 meq/100 g) was higher than that of raw montmorillonite (52.7 meq/100 g). Due to the H+ displacement, the pHPZC values of raw montmorillonite decreased from pH 5.5 to 4 after phosphate-intercalation. The results of chemical analysis were obtained by EDS data, presented in Figure 1. In the intercalation process, Ca in the montmorillonite (Figure 1c) disappeared and was replaced by P in the PINM (Figure 1d). The O in the montmorillonite was slightly reduced in the PINM. However, the Si spectra did not change. This result indicated a successful modification of montmorillonite to become PINM, which was in good agreement with the literature [21].
The X−ray diffraction (XRD) patterns of the PINM and montmorillonite are illustrated in Figure 2. As the phosphate-intercalation expanded the interlayer spaces [21], the basal spacing of PINM (15.33 Å) was larger than that of raw montmorillonite (12.07 Å). These results successfully confirm the phosphate-intercalated nano montmorillonite. Crystal size of montmorillonite and PINM were calculated at optimum peak intensity of montmorillonite (19.8°) and PINM (19.8°) using the Scherrer equation, where the crystal size of montmorillonite (322.7 nm) was bigger than that of PINM (34.2 nm). This result suggests that the modification using phosphate decreased the montmorillonite crystal size.

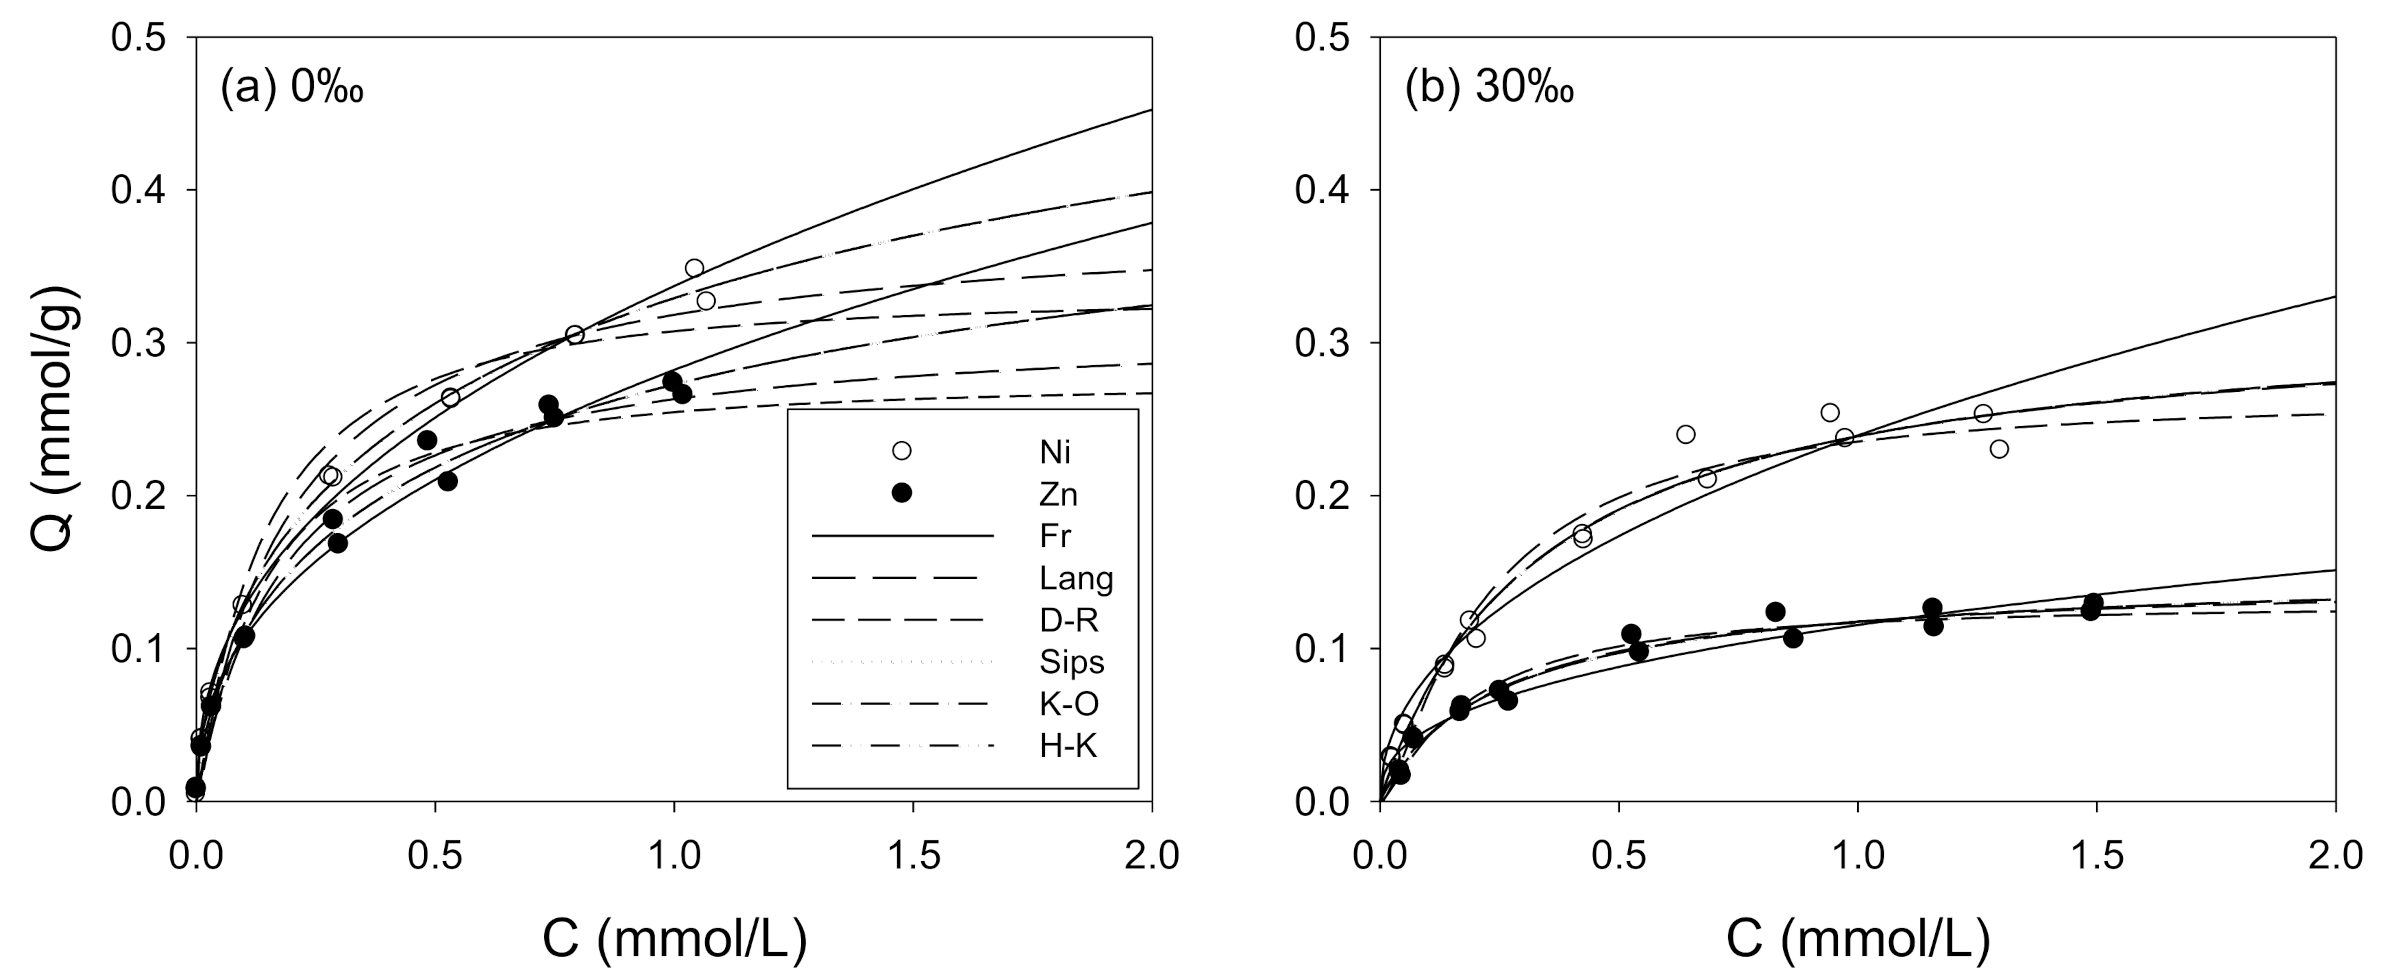
3.2. Ni and Zn Adsorption

The effects of saline water on the adsorption capacities of single adsorption, Ni and Zn onto PINM at pH 5.0 were expressed in Figure 3. The single adsorption data were fitted by 2-parameter isotherm models (the Freundlich, Langmuir, and D−R models) and the model parameters for PINM are listed in Table 3. All models were fitted well to the experimental data (Freundlich: 0.95 < R2 < 0.99, Langmuir: 0.98 < R2 < 0.99, and DR: 0.97 < R2 < 0.98).
The Freundlich isotherm has been extensively used to define adsorption of heavy metal ions onto clay [38] and considers the adsorption affinity and nonlinearity. This shows that the adsorption of Ni and Zn mainly occurred onto the PINM surface active sites. The KF value for 0‰ was higher than KF value for 30‰ at pH 5.0 due to less solubility in saline water. The KF values of Zn were consistently higher than those of Ni. The Freundlich exponent, NF, is the heterogeneity factor indicate as 0.1 < NF < 1; favorable adsorption process [39,40]. The NF values for adsorptions of Ni and Zn onto adsorbents were in the range of 0.39−0.46, indicating that both Ni and Zn adsorption was favorable [41].
In the previous studies, the adsorption capacities of montmorillonite and various modified montmorillonite were compared in Table 4. The maximum adsorption capacity (QmL) of Ni and Zn at 0‰ in this study was higher than that of Ni and Zn at 30‰. The QmL values of Ni were higher than those of Zn. The Langmuir parameter, named separation factor (Sf) describes that adsorption isotherm can be favorable (0 < Sf < 1), unfavorable (Sf > 1), linear (Sf = 1), or irreversible (Sf = 0) [42,43]:
S f = 1 1 + b L C w , 0
The calculated values of Sf ranged 0.90 and 0.94 (Table 3), indicating that adsorptions of Ni and Zn onto PINM are favorable.
The D−R model parameter also fitted well to the single adsorption data (0.97 < R2 < 0.98). The QmD value of the D−R model increased in the order of 0‰ > 30‰ for both Ni and Zn at pH 5.0. The QmD values of D−R model were slightly less than the QmL values of the Langmuir model (Table 3). The value of E in D−R model can be used to differentiate the adsorption mechanisms (physical or chemical). When the E value is in the range of 8 to 16 kJ/mol, the adsorption occurs by ion-exchange. The E value less than 8 kJ/mol indicates the physical adsorption process, whereas E value greater than 16 kJ/mol, the adsorption is chemical [44]. The calculated E values in this study were less than 4.6 kJ/mol indicating that adsorption of Ni and Zn onto PINM occurs via physical adsorption in nature [27].
By using the nonlinear regression method, three-parameters adsorption models such as Sips, K−O and H−K models were fitted to the adsorption data (Table 3). In terms of R2 values, the Sips (0.97 < R2 < 0.99), K−O (0.97 < R2 < 0.99) and H−K (0.97 < R2 < 0.99) models were slightly better than the Freundlich (0.95 < R2 < 0.99), Langmuir (0.98 < R2 < 0.99), and D−R (0.97 < R2 < 0.98) models.
The comparison of adsorption capacity by Freundlich adsorption coefficient (KF), Langmuir adsorption capacity (QmL) and D−R adsorption capacity (QmD) in Table 3, Ni was higher than Zn for both 0‰ and 30‰ containing PINM at pH 5.0. The maximum adsorption capacity (QmS of the Sips model, QmK of K−O model and QmK of H−K model) at 0‰ was higher than those of 30‰ for both metals. The maximum capacity of values of Ni were higher than Zn at the same salinity. Several literatures have reported similar results (adsorption capacities of Ni > that of Zn) for adsorbents such as Na-montmorillonite [18]. The adsorption affinity of Ni and Zn decreased with the increase salinity (30‰) owing to competition between the added metals and cations in background solution by the limited cation exchange sites [45,46,47]. Table 3 summarizes the comparison of Ni and Zn sorption capacities of Langmuir model for various adsorbents found in literature. The QmL values of Ni onto PINM in this study were slightly higher than those of Ni onto montmorillonite in the literature [48,49].
Table 4. Adsorption capacity of Ni and Zn by various adsorbents.
Heavy MetalsAdsorbentsAdsorption Capacity
(QmL, mmol/g)
Reference
NiPINM0.383This study
Montmorillonite0.360[48]
Na-Montmorillonite0.002[50]
ZnPINM0.314This study
Na-montmorillonite0.001[50]

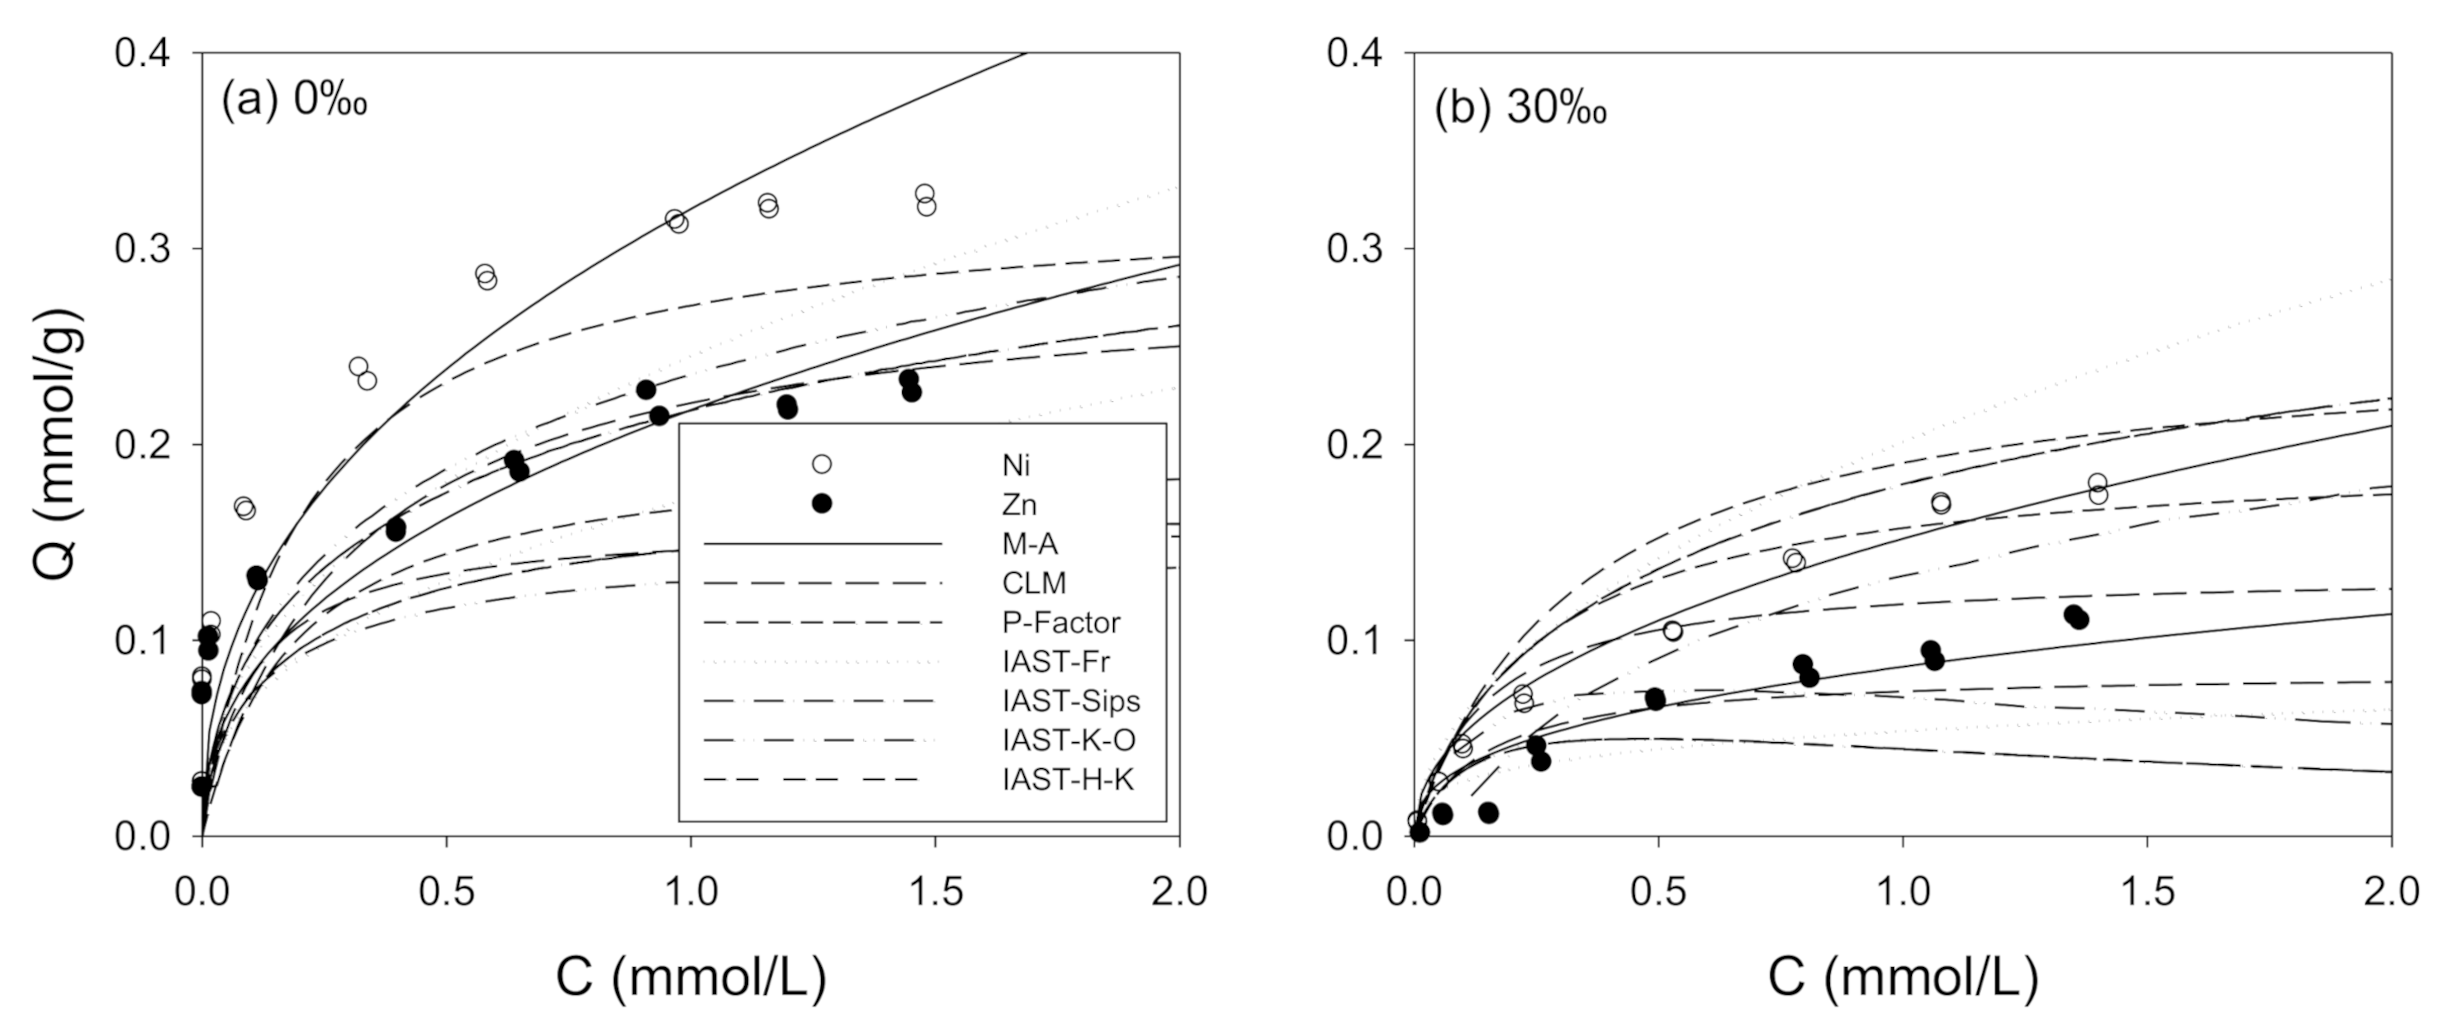
3.3. Ni/Zn Adsorption

Binary adsorption of Ni and Zn onto PINM at different salinities were presented in Figure 4. The binary adsorption data of Ni and Zn onto PINM and the predictions of M−A, CLM, P-factor and IAST models are shown in Figure 4 (Table 5).
In Table 5, the M−A model predicted the binary adsorption well (0.75 < R2 < 0.98). In the M−A model fitting results, the competition factor (aij) of Zn (a21 = 0.30) was consistently higher than that of Ni (a12 = 0.05) at 0‰, which explains that Zn was more affected than Ni in binary competitive adsorption. In contrast to the results at 0‰, the a12 (0.58) was higher than the a21 (0.33) at 30‰. The values of a12 and a21 increased from 0.05 to 0.58 and from 0.30 to 0.33 as the salinity increased from 0 to 30‰. This indicates that the competition effect between the two metals are more affected by the presence of co-solutes (Na+, K+, Ca2+, and Mg2+) in the seawater [51]. The CLM prediction was well fitted with the binary adsorption in terms of R2 values (0.86 < R2 < 0.93). The same is true for the P-factor model prediction (R2 > 0.89), except Zn at 30‰. The prediction using IAST varied with single adsorption model and metal solution. For the most binary adsorptions, the IAST predictions were in good agreement with data (Table 5).
Compared to the single adsorptions (Table 3), the QmL values of binary adsorptions were reduced due to competition (Table 6). In both single and binary adsorptions, the Langmuir parameters, QmL and bL, were not correlated. In Table 7, the estimated maximum adsorption capacity values of binary adsorption ( Q m L * ) were compared with those of single adsorption (QmL). The QmL,Ni/QmL,Zn and Q m L , N i * / Q m L , Z n * ratios were higher than unity at both 0‰ and 30‰. This suggests the higher adsorption affinity of Ni than Zn, regardless of salinity. The QmL,i/ Q m L , i * ratios were mostly less than unity, indicating the simultaneous presence of both Ni and Zn reduced adsorption due to competition for adsorption sites in the adsorbent. In addition, Q m L , N i / Q m L , N i * > Q m L , Z n / Q m L , Z n * at 0‰ but vice versa at 30‰ indicates that Ni adsorption was more affected than Zn adsorption at 0‰ but vice versa at 30‰ in binary adsorption process in the simultaneous presence of a co-solute.
The affinity constant (bL) of Langmuir model was calculated from adsorption isotherm data to estimate the free energy change of adsorption [38,52]. Higher bL values are related to specifically adsorbed metals at high energy surfaces with low dissociation constants. Meanwhile, lower bL values were related to adsorption at low energy surfaces with high dissociation constants [53]. The binding energy coefficient (bL,Ni and bL,Zn for single adsorption and b L , N i * and b L , Z n * for binary adsorption, respectively) varied with salinity and metal solution. In the single adsorption, the adsorption affinity of Zn was higher than Ni (bL,Zn > bL,Ni) at both 0‰ and 30‰. On the other hand, b L , Z n * > b L , N i * at 0‰ and b L , Z n * < b L , N i * at 30‰ were observed for binary competitive adsorption. It was also found that bi > b i * at 0‰, whereas bi < b i * at 30‰. This indicates that co-solute present in the seawater may affect the adsorption affinity of the metals onto PINM.

4. Conclusions

Effect of salinity on the adsorptions of Ni and Zn onto PINM have been investigated using single and bimary systems at pH 5. In single adsorption, Freundlich, Langmuir, D−R, Sips, K−O and H−K models were fitted well. The adsorption affinity (KF) and capacities (QmL, QmD, QmS, QmKO, and QmHK) of Ni were consistently higher than Zn at different salinities. The adsorption capacities of Ni and Zn at 0‰ were slightly higher than at 30‰, mainly owing to the competition between the metals and cations in solution and solubility. Binary competitive adsorptions were analyzed by the Langmuir model, M−A model, CLM, P-Factor model and IAST predictions. Adsorption capacities of Ni for Langmuir, D−R, Sips, K−O and H−K models are higher than Zn. The competition between Ni and Zn decreased the adsorption retention on the specific sites in the adsorbents. The adsorption capacities of Ni and Zn in the Ni/Zn binary system were lower than those in the single system due to competition. The PINM could be used as a sustainable reactive medium in the PRB application for removing Ni and Zn in the presence of salinity.

Author Contributions

Conceptualization, J.C., A.S., and W.S.S.; methodology, J.C., A.S., and W.S.S.; software, W.S.S.; validation, W.S.S.; investigation, J.C. and A.S.; data curation, J.C., A.S., and W.S.S.; writing—original draft preparation, J.C. and A.S.; review and editing, A.S. and W.S.S.; supervision, W.S.S.; project administration, W.S.S.; funding acquisition, W.S.S. All authors have read and agreed to the published version of the manuscript.

Funding

This research received no external funding.

Acknowledgments

This work was supported by Korea Environment Industry and Technology Institute (KEITI) through The Chemical Accident Prevention Technology Development Project, funded by Korea Ministry of Environment (MOE) (2019001960002).

Conflicts of Interest

The authors declare no conflict of interest.

Nomenclature

Ainterfacial area between the solution and solid adsorbent
aijcompetition coefficient between the solutes; subscripts i and j denote the solutes
bHKconstant in the H−K model [(L/mmol) N H K ]
bLsite energy factor (L/mmol)
bL,iLangmuir model parameter obtained from single adsorption (L/mmol)
bSSips isotherm constant (L/mmol)
βconstant related to the mean free energy of adsorption per mole of the adsorbate (mol2/J2)
Ciaqueous solution concentration of solute i at multi-solute competitive adsorption equilibrium (mmol/L)
Cssolid-phase equilibrium concentration (mmol/g)
Cs,iadsorbed amount of solute i at multi-solute competitive adsorption equilibrium (mmol/g)
Cwaqueous-phase equilibrium concentration (mmol/g)
Emean free energy [(2β)−0.5] (kJ/mol)
εadsorption potential [=RT ln(1 + 1/Cw)] (J/mol)
Ksaturation constant (mmol/L)
KFFreundlich adsorption coefficient (sorption affinity) [(mmol/kg)/(mmol/L) N F ]
Ntotal number of solutes
NFlinearity coefficient (−)
NGcooperative binding constant (–)
NHKconstant in the H−K model (−)
NS(−) is Sips isotherm exponential constant
Rideal gas constant (J/mol·K)
Tabsolute temperature (K)
QmDtheoretical saturation capacity (mg/kg)
QmGmaximum adsorption capacity of the adsorbent (mmol/g)
QmHKconstant in the H−K model [ ( L N K C mmol 1 N K C / g ) ]
QmLmaximum adsorption capacity (mmol/kg)
QmL,Imaximum adsorption capacity for component i in a single system (mmol/g)
Q m L , i * maximum adsorption capacity for component i in a single system (mmol/g)
QmSmaximum adsorption capacity (mmol/g)
πspreading pressure.

References

  1. Vardhan, K.H.; Kumar, P.S.; Panda, R.C. A review on heavy metal pollution, toxicity and remedial measures: Current trends and future perspectives. J. Mol. Liq. 2019, 290, 111197. [Google Scholar] [CrossRef]
  2. Malamis, S.; Katsou, E. A review on zinc and nickel adsorption on natural and modified zeolite, bentonite and vermiculite: Examination of process parameters, kinetics and isotherms. J. Hazard. Mater. 2013, 252–253, 428–461. [Google Scholar] [CrossRef] [PubMed]
  3. Liu, P.; Hu, W.; Tian, K.; Huang, B.; Zhao, Y.; Wang, X.; Zhou, Y.; Shi, B.; Kwon, B.-O.; Choi, K.; et al. Accumulation and ecological risk of heavy metals in soils along the coastal areas of the Bohai Sea and the Yellow Sea: A comparative study of China and South Korea. Environ. Int. 2020, 137, 105519. [Google Scholar] [CrossRef] [PubMed]
  4. Kabir, E.; Ray, S.; Kim, K.-H.; Yoon, H.-O.; Jeon, E.-C.; Kim, Y.S.; Cho, Y.-S.; Yun, S.-T.; Brown, R.J.C. Current status of trace metal pollution in soils affected by industrial activities. Sci. World J. 2012, 916705. [Google Scholar] [CrossRef] [PubMed] [Green Version]
  5. Hussain, S.; Habib-Ur-Rehman, M.; Khanam, T.; Sheer, A.; Kebin, Z.; Jianjun, Y. Health risk assessment of different heavy metals dissolved in drinking water. Int. J. Environ. Res. Public Health 2019, 16, 1737. [Google Scholar] [CrossRef] [PubMed] [Green Version]
  6. Wongsasuluk, P.; Chotpantarat, S.; Siriwong, W.; Robson, M. Heavy metal contamination and human health risk assessment in drinking water from shallow groundwater wells in an agricultural area in Ubon Ratchathani province, Thailand. Environ. Geochem. Health 2014, 36, 169–182. [Google Scholar] [CrossRef] [PubMed]
  7. Fajčíková, K.; Cvečková, V.; Stewart, A.; Rapant, S. Health risk estimates for groundwater and soil contamination in the Slovak Republic: A convenient tool for identification and mapping of risk areas. Environ. Geochem. Health 2014, 36, 973–986. [Google Scholar] [CrossRef]
  8. Kurniawan, T.A.; Chan, G.Y.S.; Lo, W.H.; Babel, S. Physico-chemical treatment techniques for wastewater laden with heavy metals. Chem. Eng. J. 2006, 118, 83–98. [Google Scholar] [CrossRef]
  9. Wu, J.; Lu, J.; Li, L.; Min, X.; Luo, Y. Pollution, ecological-health risks, and sources of heavy metals in soil of the northeastern Qinghai-Tibet Plateau. Chemosphere 2018, 201, 234–242. [Google Scholar] [CrossRef] [PubMed]
  10. Vetrimurugan, E.; Brindha, K.; Elango, L.; Ndwandwe, O.M. Human exposure risk to heavy metals through groundwater used for drinking in an intensively irrigated river delta. Appl. Water Sci. 2017, 7, 3267–3280. [Google Scholar] [CrossRef] [Green Version]
  11. Mulligan, C.N.; Yong, R.N.; Gibbs, B.F. Remediation technologies for metal-contaminated soils and groundwater: An evaluation. Eng. Geol. 2001, 60, 193–207. [Google Scholar] [CrossRef]
  12. Oliva, J.; De Pablo, J.; Cortina, J.-L.; Cama, J.; Ayora, C. The use of Apatite IITM to remove divalent metal ions zinc(II), lead(II), manganese(II) and iron(II) from water in passive treatment systems: Column experiments. J. Hazard. Mater. 2010, 184, 364–374. [Google Scholar] [CrossRef] [PubMed] [Green Version]
  13. Abollino, O.; Giacomino, A.; Malandrino, M.; Mentasti, E. Interaction of metal ions with montmorillonite and vermiculite. Appl. Clay Sci. 2008, 38, 227–236. [Google Scholar] [CrossRef]
  14. Cabrera, C.; Gabaldon, C.; Marzal, P. Sorption characteristics of heavy metal ions by a natural zeolite. J. Chem. Technol. Biotechnol. 2005, 80, 477–481. [Google Scholar] [CrossRef]
  15. Katsou, E.; Malamis, S.; Haralambous, K.J.; Loizidou, M. Use of ultrafiltration membranes and aluminosilicate minerals for nickel removal from industrial wastewater. J. Membr. Sci. 2010, 360, 234–249. [Google Scholar] [CrossRef]
  16. Katsou, E.; Malamis, S.; Haralambous, K.J. Examination of zinc uptake in a combined system using sludge, minerals and ultrafiltration membranes. J. Hazard. Mater. 2010, 182, 27–38. [Google Scholar] [CrossRef]
  17. Lin, S.H.; Juang, R.S. Heavy metal removal from water by sorption using surfactant-modified montmorrilonite. J. Hazard. Mater. 2002, 92, 315–326. [Google Scholar] [CrossRef]
  18. Abollino, O.; Aceto, M.; Malandrino, M.; Sarzanini, C.; Mentasti, E. Adsorption of heavy metals on Na-montmorillonite: Effect of pH and organic substances. Water Res. 2003, 37, 1619–1627. [Google Scholar] [CrossRef]
  19. Almasri, D.A.; Rhadfia, T.; Atieh, M.A.; McKay, G.; Ahzi, S. High performance hydroxyiron modified montmorillonite nanoclay adsorbent for arsenite removal. Chem. Eng. J. 2018, 335, 1–12. [Google Scholar] [CrossRef]
  20. Yang, J.; Yu, K.; Liu, C. Chromium immobilization in soil using quaternary ammonium cations modified montmorillonite: Characterization and mechanism. J. Hazard. Mater. 2017, 321, 73–80. [Google Scholar] [CrossRef]
  21. Ma, B.; Oh, S.; Shin, W.S.; Choi, S.-J. Removal of Co2+, Sr2+ and Cs+ from aqueous solution by phosphate-modified montmorillonite (PMM). Desalination 2011, 276, 336–346. [Google Scholar] [CrossRef]
  22. Wen, X.; Lu, J.; Wu, J.; Lin, Y.; Luo, Y. Influence of coastal groundwater salinization on the distribution and risks of heavy metals. Sci. Total Environ. 2019, 652, 267–277. [Google Scholar] [CrossRef]
  23. Kester, D.R.; Duedall, I.W.; Connors., D.N.; Pytkowicz, R.M. Preparation of artificial seawater. Limno. Oceanogr. 1967, 12, 176–179. [Google Scholar] [CrossRef]
  24. U.S. EPA. Method 9081: Cation-Exchange Capacity (Sodium Acetate), Test Methods for the Evaluation of Solid Waste: Laboratory Manual Physical Chemical Methods; SW 846; U.S. EPA, Office of Solid Waste: Washington, DC, USA, 2003.
  25. Wolff-Boenisch, D.; Traina, S.J. A comparative study of the effect of desferrioxamine B, oxalic acid, and Na-alginate on the desorption of U(VI) from goethite at pH 6 and 25 °C. Geochim. Cosmochim. Acta 2006, 70, 4356–4366. [Google Scholar] [CrossRef]
  26. Dubinin, M.M. The potential theory of adsorption of gases and vapors for adsorbents with energetically non-uniform surface. Chem. Rev. 1960, 60, 235–266. [Google Scholar] [CrossRef]
  27. Kundu, S.; Gupta, A.K. Arsenic adsorption onto iron oxide-coated cement (IOCC): Regression analysis of equilibrium data with several isotherm models and their optimization. Chem. Eng. J. 2006, 122, 93–106. [Google Scholar] [CrossRef]
  28. Ko, D.C.K.; Cheung, C.W.; Choy, K.K.H.; Porter, J.F.; McKay, G. Sorption equilibria of metal ions on bone char. Chemosphere 2004, 54, 273–281. [Google Scholar] [CrossRef] [PubMed]
  29. Kargi, F.; Ozmıhci, S. Biosorption performance of powdered activated sludge for removal of different dyestuffs. Enzym. Microb. Technol. 2004, 35, 267–271. [Google Scholar] [CrossRef]
  30. Parker, G.R., Jr. Optimum isotherm equation and thermodynamic interpretation for aqueous 1,1,2-trichloroethene adsorption isotherms on three adsorbents. Adsorption 1995, 1, 113–132. [Google Scholar] [CrossRef]
  31. Khan, A.R.; Ataullah, R.; Al-Haddad, A. Equilibrium adsorption studies of some aromatic pollutants from dilute aqueous solutions on activated carbon at different temperatures. J Colloid Interface Sci. 1997, 194, 154–165. [Google Scholar] [CrossRef]
  32. Srivastava, V.C.; Mall, I.D.; Mishra, I.M. Equilibrium modelling of single and binary adsorption of cadmium and nickel onto bagasse fly ash. Chem. Eng. J. 2006, 117, 79–91. [Google Scholar] [CrossRef]
  33. Choy, K.K.H.; Porter, J.F.; McKay, G. Langmuir isotherm models applied to the multicomponent sorption of acid dyes from effluent onto activated carbon. J. Chem. Eng. Data 2000, 45, 575–584. [Google Scholar] [CrossRef]
  34. Murali, V.; Aylmore, A.G. Competitive adsorption during solute transport in soils: 1. Mathematical models. Soil Sci. 1983, 135, 143–150. [Google Scholar] [CrossRef]
  35. Radke, C.J.; Prausnitz, J.M. Thermodynamics of multi-solute adsorption from dilute liquid solutions. AIChE J. 1972, 18, 761–768. [Google Scholar] [CrossRef]
  36. Yen, C.-Y.; Singer, P.C. Competitive adsorption of phenols on activated carbon. J. Environ. Eng. 1984, 110, 976–983. [Google Scholar] [CrossRef]
  37. Shin, W.S. Competitive sorption of anionic and cationic dyes onto cetylpyridinium-modified montmorillonite. J. Environ. Sci. Heal. A 2008, 43, 1459–1470. [Google Scholar] [CrossRef]
  38. Sparks, D.L. Environmental Soil Chemistry, 2nd ed.; Academic Press: Cambridge, MA, USA, 2003. [Google Scholar]
  39. Suteu, D.; Bilba, D.; Dan, F. Synthesis and characterization of polyamide powders for sorption of reactive dyes from aqueous solutions. J. Appl. Polym. Sci. 2007, 105, 1833–1843. [Google Scholar] [CrossRef]
  40. Hilal, N.; Busca, G.; Rozada, F.; Hankins, N. Use of activated carbon to polish effluent from metalworking treatment plant: Comparison of different streams. Desalination 2005, 185, 297–306. [Google Scholar] [CrossRef]
  41. Ghosh, G.C.; Chakraborty, T.K.; Zaman, S.; Nahar, M.N.; Kabir, A.H.M.E. Removal of Methyl Orange Dye from Aqueous Solution by a Low-Cost Activated Carbon Prepared from Mahagoni (Swietenia mahagoni) Bark. Pollution 2020, 6, 171–184. [Google Scholar] [CrossRef]
  42. McKay, G.; Blair, H.S.; Gardner, J.R. Adsorption of dyes on chitin. I. Equilibrium studies. J. Appl. Polym. Sci. 1982, 27, 3040–3057. [Google Scholar] [CrossRef]
  43. Adlnasab, L.; Nader, D.; Akram, M. A new magnetic bio-sorbent for arsenate removal from the contaminated water: Characterization, isotherms, and kinetics. Environ. Health Eng. Manag. J. 2020, 7, 49–58. [Google Scholar] [CrossRef] [Green Version]
  44. Apiratikula, R.; Pavasant, P. Sorption of Cu2+, Cd2+, and Pb2+ using modified zeolite from coal fly ash. Chem. Eng. J. 2008, 144, 245–258. [Google Scholar] [CrossRef]
  45. Rivas, B.L.; Quilodrán, B.; Quiroz, E. Removal properties of crosslinked poly(2-acrylamidoglycolic acid) for trace heavy metal ions: Effect of pH, temperature, contact time, and salinity on the adsorption behavior. J. Appl. Polym. Sci. 2003, 88, 2614–2621. [Google Scholar] [CrossRef]
  46. Phillips, I.R.; Lamb, D.T.; Hawker, D.W.; Burton, E.D. Effects of pH and salinity on copper, lead, and zinc sorption rates in sediments from Moreton bay, Australia. Bull. Environ. Contam. Toxicol. 2004, 73, 1041–1048. [Google Scholar] [CrossRef]
  47. Choi, J.; Septian, A.; Shin, W.S. The influence of salinity on the removal of Ni and Zn by sorption onto iron oxide- and manganese oxide-coated sand. Sustainability 2020, 12, 5815. [Google Scholar] [CrossRef]
  48. Bhattacharyya, K.G.; Gupta, S.S. Uptake of Ni(II) ions from aqueous solution by kaolinite and montmorillonite: Influence of acid activation of the clays. Sep. Sci. Technol. 2008, 43, 3221–3250. [Google Scholar] [CrossRef]
  49. Gupta, S.S.; Bhattacharyya, K.G. Immobilization of Pb(II), Cd(II) and Ni(II) ions on kaolinite and montmorillonite surfaces from aqueous medium. J. Environ. Manag. 2008, 87, 46–58. [Google Scholar] [CrossRef]
  50. Baeyens, B.; Bradbury, M.H. A mechanistic description of Ni and Zn sorption on Na-montmorillonite Part I: Titration and sorption measurements. J. Contam. Hydrol. 1997, 27, 199–222. [Google Scholar] [CrossRef]
  51. Musso, T.B.; Parolo, M.E.; Pettinari, G. pH, ionic strength, and ion competition effect on Cu(II) and Ni(II) sorption by a Na-bentonite used as liner material. Pol. J. Environ. Stud. 2019, 28, 2299–2309. [Google Scholar] [CrossRef]
  52. Van Riemsdijk, H.; Bolt, G.H.; Koopel, L.K.; Blaakmeer, J. Electrolyte adsorption on heterogeneous surfaces: Adsorption models. J. Colloid Interface Sci. 1985, 109, 219–228. [Google Scholar] [CrossRef]
  53. Adhikari, R.; Singh, M.V. Adsorption characteristics of lead and cadmium in some soils of India. Geoderma 2003, 114, 81–92. [Google Scholar] [CrossRef]
Figure 1. SEM images of (a) montmorillonite and (b) PINM, and EDS spectra of (c) montmorillonite and (d) PINM.
Minerals 10 00980 g001
Figure 2. XRD analyses of montmorillonite and PINM.
Minerals 10 00980 g002
Figure 3. Single adsorption of Ni and Zn onto PINM at different salinities (pH = 5.0). (a) 0‰ and (b) 30‰. Lines represent adsorption models.
Minerals 10 00980 g003
Figure 4. Binary adsorption of Ni and Zn onto PINM at different salinities (pH = 5.0). (a) 0‰ and (b) 30‰. Lines represent model predictions.
Minerals 10 00980 g004
Table 1. The chemical compositions of artificial seawater (30‰).
IngredientConcentration (g/L)
NaCl24.72
KCl0.67
CaCl2⋅2H2O1.36
MgCl22.18
MgSO43.07
NaHCO30.18
Table 2. Adsorption isotherm models.
ModelEquationReference
Single Adsorption
Freundlich
C s = K F C w N F
(1)
Langmuir
C s = Q m L b L C w 1 + b L C w
(2)
Dubinin-Radushkevich
(D−R) C s = Q m D exp ( β ε 2 )
(3)[26,27]
E = 1 2 β (4)
Sips
C s = Q m S ( b S C w ) N S 1 + ( b S C w ) N S
(5)[28]
Kargi–Ozmıhci (K–O)
C s = Q m G C N G K + C N G
(6)[29]
Holl-Kirch (H−K)
C s = Q m H K b H K C w N H K 1 + b H K C w N H K
(7)[30,31]
Binary Adsorption
Competitive Langmuir model (CLM)
C s , i = Q m L , i b L , i C w , i 1 + j = 1 N b L , j C w , j
(8)[32]
P-factor
P i = Q m L , i Q m L , i *
C s , i = 1 P i b L , i Q m L , i C w , i 1 + b L , i C w , i
(9)
 
(10)
[33]
Murali−Aylmore (M−A)
C s , i = K F i C w , i N i + 1 j = 1 N a i j C w , j
(11)[34]
Ideal adsorbed solution theory (IAST)
π = R T A 0 q 1 * ln C 1 ln q 1 d q 1 = R T A 0 q 1 * ln C 2 ln q 2 d q 2 = = R T A 0 q N * ln C N ln q N d q N
or
π = R T A 0 C 1 * q 1 C 1 d C 1 = R T A 0 C 2 * q 2 C 2 d C 2 = = R T A 0 C N * q N C N d C N
(12)[35,36,37]
Table 3. Adsorption model parameters for single adsorption of Ni and Zn onto PINM at pH 5. * Calculated at Cw,0 = 0.02 mM.
FreundlichMetalSalinity (‰) K F [ ( mmol / g ) / ( mmol / L ) N F ] NF (-)R2SSE
Ni00.337 ± 0.0050.425 ± 0.0160.9940.001
300.239 ± 0.0080.464 ± 0.0380.9570.006
Zn00.282 ± 0.0060.423 ± 0.0210.9870.002
300.115 ± 0.0030.392 ± 0.0330.9500.002
LangmuirMetalSalinity (‰)QmL (mmol/g)bL (L/mmol)R2SSESf
Ni00.383 ± 0.0174.937 ± 0.7670.9860.0030.910
300.319 ± 0.0152.988 ± 0.3780.9820.0020.944
Zn00.314 ± 0.0145.171 ± 0.7510.9830.0030.906
300.147 ± 0.0054.055 ± 0.4900.9770.0010.925
D−RMetalSalinity (‰)QmD (mmol/g)β (mol2/J2, ×10−8),R2SSEE (kJ/mol)
Ni00.330 ± 0.0112.394 ± 0.2640.9750.0064.57
300.263 ± 0.0083.799 ± 0.3190.9720.0043.63
Zn00.274 ± 0.0092.443 ± 0.2420.9730.0044.52
300.128 ± 0.0043.170 ± 0.2510.9700.0013.97
SipsMetalSalinity (‰)QmS (mmol/g)bS (L/mmol)NSR2SSE
Ni00.670 ± 0.0870.945 ± 0.3870.604 ± 0.0360.9980.000
300.323 ± 0.0412.897 ± 0.9110.982 ± 0.1470.9790.002
Zn00.492 ± 0.0961.407 ± 0.8540.640 ± 0.0690.9930.001
300.153 ± 0.0173.627 ± 1.0940.928 ± 0.1500.9720.001
K−OMetalSalinity (‰)QmKO (mmol/g)bKO (L/mmol)NKOR2SSE
Ni00.670 ± 0.0871.034 ± 0.2540.604 ± 0.0360.9980.000
300.323 ± 0.0410.352 ± 0.1600.982 ± 0.1470.9780.002
Zn00.492 ± 0.0960.804 ± 0.3300.640 ± 0.0690.9930.001
300.153 ± 0.0170.303 ± 0.1390.928 ± 0.1500.9720.001
H−KMetalSalinity (‰)QmHK (mmol/g)bHK (L/mmol)NHKR2SSE
Ni00.670 ± 0.0870.967 ± 0.2370.604 ± 0.0360.9980.000
300.323 ± 0.0412.844 ± 1.2920.982 ± 0.1470.9780.002
Zn00.492 ± 0.0961.244 ± 0.5110.640 ± 0.0690.9930.010
300.153 ± 0.0173.305 ± 1.5180.928 ± 0.1500.9720.001
Note: SSE = sum of squared estimate of error.
Table 5. M-A model, CLM, P-factor model and IAST coupled to single adsorption model parameters for binary adsorption of Ni(1) and Zn(2) onto PINM at pH 5.
M−A modelSalinity (‰)a12a21R2SSERMSE
00.053 ± 0.0420.297 ± 0.0690.866/0.7490.028/0.0210.041/0.035
300.576 ± 0.0280.333 ± 0.0900.984/0.8200.001/0.0040.008/0.017
CLMSalinity (‰) - - R2SSERMSE
0 0.869/0.861 0.128/0.0670.090/0.065
30 0.934/0.9080.013/0.0060.030/0.021
P−Factor modelSalinity (‰)Pi - R2SSERMSE
01.175/1.570 0.948/0.894 0.050/0.0510.058/0.058
301.253/0.747 0.929/0.2990.014/0.0480.033/0.061
IAST−FrSalinity (‰) - - R2SSERMSE
0 0.918/0.9240.080/0.0370.073/0.049
30 0.881/0.8090.091/0.0130.084/0.032
IAST−SipsSalinity (‰) - - R2SSERMSE
0 0.882/0.8670.115/0.0640.088/0.065
30 0.964/0.6990.007/0.0210.023/0.040
IAST−K−OSalinity (‰) - - R2SSERMSE
0 0.905/0.8230.093/0.0850.079/0.075
30 0.965/0.8320.007/0.0120.023/0.030
IAST−H−KSalinity (‰) - - R2SSERMSE
0 0.882/0.8670.115/0.0640.088/0.065
30 0.964/0.7000.007/0.0210.023/0.040
Note: SSE = sum of squared estimate of error, RMSE = root mean square error.
Table 6. Langmuir model parameters for binary adsorption of Ni and Zn onto the sorbents at pH 5.
Salinity (‰)Solute Q m L * (mmol/g) b L * (L/mmol)R2SSE
0Ni in Ni/Zn0.326 ± 0.01514.38 ± 3.9460.9180.017
Zn in Ni/Zn0.200 ± 0.01164.31 ± 28.610.7940.017
30Ni in Ni/Zn0.254 ± 0.0161.616 ± 0.2320.9860.001
Zn in Ni/Zn0.196 ± 0.0260.922 ± 0.2270.9730.001
Q m L * and b m L * indicates QmL value and bmL value for binary competitive adsorption, respectively.
Table 7. Comparison of QmL and bL values of single and binary adsorption of Ni and Zn at pH 5.
Salinity (‰)QmL,Ni/QmL,Zn Q m L , N i * / Q m L , Z n * Q m L , N i / Q m L , N i * Q m L , Z n / Q m L , Z n *
01.2191.6300.8510.637
302.1751.2970.7981.338
Salinity (‰)bL,Ni/bL,Zn b L , N i * / b L , Z n * b L , N i / b L , N i * b L , Z n / b L , Z n *
00.9550.2242.91312.44
300.7371.7520.5410.228
Publisher’s Note: MDPI stays neutral with regard to jurisdictional claims in published maps and institutional affiliations.

