Article

Structure and Mineralogy of Hydrophilic and Biwettable Sub-2 µm Clay Aggregates in Oil Sands Bitumen Froth

1
National Research Council Canada, Energy, Mining and Environment Research Centre, Ottawa, ON K1A 0R6, Canada
2
Syncrude Canada Ltd., R&D Center, Edmonton, AB T6N 1H4, Canada
*
Author to whom correspondence should be addressed.
Retired.
Minerals 2020, 10(11), 1040; https://doi.org/10.3390/min10111040
Submission received: 14 October 2020 / Revised: 13 November 2020 / Accepted: 14 November 2020 / Published: 21 November 2020
(This article belongs to the Special Issue Mineral-Organic Interactions Related to Oil Sands Processing)

Abstract

:
A primary concern of commercial mined oil sands operations is the extent to which one can minimize the content of water and solids contaminants in the solvent-diluted bitumen products resulting from the bitumen production processes. During bitumen production, particles of about 2 µm or less may be responsible for the stabilization of water-in-bitumen emulsions that form during aqueous extraction of bitumen and purification of bitumen froth subsequently during the froth treatment processes, thus leading to the presence of those contaminants in solvent-diluted bitumen products. In this study, we separate and analyze sub-2 µm clay solids isolated from typical bitumen froth fed to a froth treatment plant at a commercial mined oil sands operation. Analytical transmission electron microscopy (TEM) with spatially-resolved energy-dispersive X-ray spectroscopy (EDX) and electron energy-loss spectroscopy (EELS) demonstrate key differences in morphology and composition between sub-2 µm clay aggregates with two distinct wettability characteristics: hydrophilic vs. biwettable particle surfaces. In particular, clay platelets with <200 nm lateral dimensions and thicknesses of a few atomic layers, which are intermixed within coarser sub-2 µm clay aggregates, are found to confer clear differences in morphological characteristics and wettability behaviors to the sub-2 µm clay aggregates. The <200 nm clay platelets found within sub-2 µm biwettable clays tend to arrange themselves with random orientations, whereas <200 nm clay platelets within sub-2 µm hydrophilic clays typically form well-ordered face-to-face stacks. Moreover, in biwettable sub-2 µm clay aggregates, <200 nm clay platelets often cover the surfaces of ~1–2 µm sized mineral particles, whereas similarly sized mineral particles in hydrophilic sub-2 µm clay aggregates, in contrast, generally have exposed surfaces without clay platelet coverage. These biwettable vs. hydrophilic behaviors are attributed to a difference in the surface characteristics of the <200 nm clay platelets caused by toluene-unextractable organic carbon coatings. Nanometer-scale carbon mapping reveals an inhomogeneous toluene-unextractable organic carbon coating on the surfaces of <200 nm platelets in biwettable clays. In contrast, hydrophilic clays have a significantly lower amount of toluene-unextractable organic carbon, which tends to be concentrated at steps or near metal oxide nanoparticles on clay particle surfaces. Mixing surface-active organic species, such as asphaltene, resin, or carboxylic organic acids of various types with inorganic solids can lead to a dramatically enhanced emulsion stability. Consequently, understanding the origin and characteristics of sub-2 µm clay solids in bitumen froth is important to (i) clarify their potential role in the formation of stable water-in-oil emulsions during bitumen production and (ii) improve froth treatment process performance to further reduce contaminant solids in solvent-diluted bitumen products. We discuss the implications of our results from these two perspectives.

1. Introduction

Currently, commercial oil sands surface mining operations use an aqueous extraction process, usually with chemical addition such as caustic, to liberate and extract bitumen from mostly unconsolidated bituminous ore, consisting of bitumen, water, sand, clay, and other mineral solids [1,2]. Primary separation of bitumen is accomplished first by gravity aqueous flotation of bitumen from coarser settling solids, followed by secondary flotation of middlings carried out in separate vessels, where air is injected to form bitumen–air aggregates that rise to the top of those vessels [3,4,5]. The resulting bitumen froth produced at commercial operations typically contains ~60 wt % bitumen, ~30 wt % water, and ~10 wt % solids [4,5,6]. Bitumen froth treatment processes [6] are then applied by mixing the froth with naphtha or paraffinic solvents to remove the majority of solids and water in order to produce a solvent-diluted bitumen product that is sent for upgrading or pipelining to refineries. The quality of the bitumen froth impacts the performance of the overall operations, because water and solids are contaminants affecting the downstream processes from the pipeline transport through the upgrading to synthetic crude oil [7,8] to the final processing into marketable products at refineries.
A major concern in surface mined bitumen production processes is the formation of water-in-bitumen emulsions as sub-µm/µm water droplets stabilized by surface-active species found naturally in the bitumen. These include asphaltenes, resins, carboxylic organic acids of various types (i.e., naphthenic acids), and fine inorganic particles, along with combinations of these types of materials [9]. Recent studies have emphasized the role of asphaltene [10,11,12,13,14] in the bitumen extraction from oil sands, and in particular, a certain component of the asphaltene fraction—the so-called “bad asphaltene”—which is believed to be responsible in part for emulsion stabilization in bitumen extraction [15]. We recall that asphaltene is defined as a solubility class corresponding to the toluene-soluble, but heptane- or pentane-insoluble, fraction of petroleum. As a result, many distinct types of molecular structures are comprised in the asphaltene fraction, some of which may be surface-active and as such stabilize water-in-oil emulsions.
Fine mineral solids were also reported to be a likely component responsible for the stabilization of water-in-bitumen emulsion [16,17,18,19,20,21,22]. Furthermore, mixing fine solids with asphaltene or other surface-active species can enhance emulsion stability [9]. Sullivan and Kilpatrick [22] demonstrated that fine inorganic particles stabilized water-in-oil emulsions when suitably modified through asphaltene and resin adsorption. For oil sand solids, Sztukowski and Yarranton [21] found that clay platelets of 100–500 nm were very effective at enhancing emulsion stability, and emphasized the role of the adsorption of crude oil components, such as asphaltene or resin. Intermixing surface-active species (often carbon based) with minerals basically affects the wettability of the mineral particles. In particular, an inhomogeneous organic coverage of clay platelet surfaces may result in a biwettable character for the platelets, favoring their accumulation at bitumen–water interfaces [23]. Such a patchy coating has been inferred from various surface science methods [24], and directly mapped using transmission electron microscopy [25] and atomic force microscopy [26] analysis. The organic carbon was assigned to humic and asphaltene-like substances [24,27].
Residual organic matter (ROM) associated with oil sands solids following extensive Soxhlet extraction with toluene has been referred to as “toluene-insoluble organic matter (TIOM)” or as “toluene-insoluble organic carbon (TIOC)” when referring specifically to the residual organic carbon [28,29,30,31]. However, in a recent review by Chen and Liu [16], the term “toluene-unextractable organic matter” was suggested instead, to reflect that such ROM cannot be removed by common organic solvent extraction treatment, and some portion of ROM is likely irreversibly adsorbed to the solid particulate surfaces/interfaces within oil sands.
In this paper, we separate and analyze sub-2 µm contaminant solids present in a typical bitumen froth studied previously [32] produced at a commercial plant while the plant was running in steady-state operations with typical froth treatment feed and operating conditions and not undergoing any process upset. Sub-2 µm solids are selected, as those are suspected to be partly responsible for emulsion stabilization. During bitumen production, particles < 2 µm in size may be responsible in stabilizing water-in-bitumen emulsions forming during aqueous flotation of the bitumen and subsequent cleaning during the bitumen froth treatment process, thus leading to the presence of those contaminants in solvent-diluted bitumen products. Solids wettability and particle size are important factors when considering the ability of sub-2 µm solids to stabilize emulsions, as well as for determining how to improve froth treatment process performance to further reduce contaminant solids in solvent-diluted bitumen products. In addition, removing these contaminant solids could have a potential of water reduction in froth treatment products, if the assumption of solids-stabilized water-in-bitumen emulsion is valid.
The analysis presented here reveals a contrasting difference in morphology and composition between sub-2 µm clay solid fractions with two different wettability characteristics: hydrophilic vs. biwettable surfaces. Kaolinite and illite-smectite are found to be the predominant clay minerals in both wettability fractions, but the behavior of <200 nm clay platelets is remarkably different. For sub-2 µm hydrophilic solids, clay platelets tend to stack in an orderly face-to-face configuration, whereas for sub-2 µm biwettable solids, <200 nm clay platelets adopt random orientations, tend to occur as delaminated layers with thicknesses of few atomic planes, and often cover the surface of micron-sized mineral particles. The difference in behavior is attributed to presence or absence of tightly-bound organic matter coating the clay platelets. Hydrophilic clay platelets are intermixed with a much lower amount of carbon, found primarily at edges and steps and also associated with the presence of Fe- and Ti-bearing nanoparticles, while their surfaces remain mostly exposed. In contrast, biwettable clays are found to contain significantly more toluene-unextractable organic carbon, and the analysis clearly demonstrates a patchy carbon coating on the surfaces of <200 nm clay platelets.

2. Experimental Section

2.1. Samples Studied

The sub-2 µm clay solids characterized in this work were obtained from a typical bitumen froth sample produced at a commercial mined oil sands plant during steady state operations. Four distinct sub-2 µm clay solid fractions were isolated from the bitumen froth sample using two quantitative separation techniques described in detail elsewhere [32]. The first is the clay–ultrafines separation technique which allows the fractionation of solids in a given sample into four distinct particle-size fractions: coarser solids, >2 µm; total clays, <2 µm; coarse clays, 0.2‒2 µm; and ultrafines, <0.2 µm. We note that this technique identifies the clay fraction as solids with particle sizes less than 2 µm, and is not based on the type of clay minerals found in this fraction [33]. The second technique is the toluene/water (T/W) interfacial solids wettability separation technique that enables separation of solids in a given sample into four distinct fractions: hydrophilic solids partitioning into the aqueous phase (carbon <5% w/w), intermediate solids only weakly held at the T/W interface (carbon 6–10% w/w), biwettable organic-rich solids remaining strongly held at the T/W interface (carbon 15–20% w/w), and high-speed centrifugation solids remaining dispersed in the bitumen-toluene phase (carbon >20% w/w).
As mentioned above, four distinct sub-2 µm clay solids fractions were isolated from the bitumen froth sample for advanced analytical characterization of their structure and composition. The two first solid fractions analyzed are the total clay (<2 µm solids) and ultrafines (<0.2 µm solids) fractions obtained after clay–ultrafines separation of the bitumen froth sample. We also performed toluene/water interfacial solids wettability separation of the bitumen froth sample, followed by clay–ultrafines separation of the hydrophilic and biwettable (organic-rich solids) fractions, in order to further separate and characterize these two wettability fractions according to particle size. Detailed analytical characterization is performed here for the total clays and ultrafines, as well as hydrophilic coarse clays and biwettable coarse clays solids fractions, representing solids with size range from 0.2 to 2 µm isolated using the procedures just described.
To isolate the ultrafines fraction, slight modifications were applied here compared to the analytical procedures given in “Appendix A.1 Clay–ultrafines separation technique” of Mercier et al. [32] Referring to this section A.1, rather than using deionized water at Steps H and M, sodium pyrophosphate solution (0.1% w/w Na4P2O7∙10H2O in deionized water) was used. This ensures maximal dispersion conditions to liberate fine mineral solids (such as clays and ultrafines) from the consolidated mineral–organic mixtures present in oil sand solids [34]. In addition, at Step P, rather than drying ultrafines supernatant suspensions directly following centrifugation at Step N, the ultrafines suspensions were transferred to high speed centrifugation (HSC) tubes and then spun at 60,000 RPM for 30 min in a high speed centrifuge. After pipetting off the supernatant solution resulting at the top of HSC tubes following the high speed centrifugation, the solid pellets of ultrafines accumulating at the bottom of the HSC tubes were then transferred to a 100-mL jar and dried separately at 60 °C in order to isolate the ultrafines fraction.

2.2. Analytical Methods

Bulk analyses of the elemental and mineralogical compositions of the four sub-2 µm clay solid fractions isolated as explained above were obtained as described in Couillard and Mercier [25] using: (i) Rietveld analysis of the mineral contents by powder X-ray diffraction (XRD), (ii) elemental analyses of metal concentrations (Si, Al, K, Mg, Fe, Ti, Zr, Mg, Ca, and P) by X-ray fluorescence (XRF) spectrometry, and (iii) measurements of total contents of carbon and sulfur. Commercial equipment and associated software were used for XRD profile collection (Bruker AXS D8 Advance system-powder diffractometer, Bruker, Billerica MA, USA), Rietveld analysis with TOPAS 5.1 (Bruker AXS, Karlsruhe, Germany), XRF elemental analysis (Bruker AXS S4 Pioneer XRF Spectrometer), and carbon and sulfur measurements (Elementar vario EL cube); see Couillard and Mercier [25] for details on sample preparation and instrumental conditions. The bulk mineralogical compositions of the sub-2 µm clay solid fractions were quantified using the singular-value decomposition quantitative phase analysis (SVD-QPA) methodology described previously [25,35,36]. Table 1 lists the mineral and amorphous (i.e., poorly-crystalline or finely dispersed) phases included for quantitative determination of the mineralogical compositions of the sub-2 µm clay solid fractions using the SVD-QPA mineralogy.
For the SEM sample preparation, particles were collected on graphitic carbon tape by contacting the tape and sample with light hand pressure. The analysis was performed on a Hitachi SU5000 (Hitachi, Tokyo, Japan) analytical scanning electron microscope (SEM) equipped with an Oxford Instruments X-Maxn 80mm energy dispersive X-ray (EDX) spectrometer. EDX analyses were carried out in low vacuum mode using an analysis chamber pressure of 50 Pa and accelerating voltage of 20 kV using AZtecEnergy EDX acquisition software. EDX spectra were collected over an energy range of 20 keV at a resolution of 10 eV per channel and a live time of 30 s per analysis.
Two TEM sample preparation methods were used in this study. In the first method, TEM specimens were prepared by dispersing the solid powder in deionized water, and sonicating for 15 min. One drop of the solution was then placed onto a 200 mesh TEM copper grid coated with a lacey carbon support film (Ted Pella) and dried in air. The holes in the lacey films allow for the acquisition of spectroscopy signals without interference signals from the carbon support. In the second method, referred to as freeze-dry preparation in this article, an aqueous solid suspension is nebulized on a 200 mesh TEM copper grid coated with a uniform carbon support film. The grid is then immediately plunged into an isopentene liquid held at liquid-nitrogen temperature. Using a Tissue Dryer ETD4 (Edwards HighVacuum Ltd., Burgess Hill, UK) the grid is then held overnight in vacuum at −80 °C. With this approach, the water is removed by sublimation, and drying effects are avoided [37].
A FEI Titan3 80–300 TEM operated at 300 keV, and equipped with a CEOS aberration corrector for the probe forming lens and a monochromated field-emission gun was used to acquire both high-resolution TEM (HRTEM) and annular dark-field (ADF) images. ADF images were collected using a high-angle annular dark-field (HAADF) Fischione detector in scanning transmission electron microscopy (STEM) mode. This technique provides signal intensity related mainly to the atomic number (Z) and the thickness of the region analyzed. When combined with an aberration corrector, ADF-STEM can reach a sub-Angstrom resolution [38] and single-atom sensitivity [39]. The TEM instrument is also equipped with an energy-dispersive X-ray (EDX) spectrometer (EDAX Analyzer, DPP-II) and an electron energy-loss spectrometer (EELS). The EELS analysis was performed on a Gatan Tridiem 866 Image Filter. To optimize the signal intensity, EDX spectra were acquired with the specimen tilted at 15 degrees. Chemical maps are extracted from spectrum images, which consist of two dimensional images with a full EELS spectrum acquired at each pixel. The ADF signal is also collected simultaneously with the spectroscopy signal. The elemental maps are then obtained by integrating edges in EELS following a background subtraction [40].

3. Results and Discussion

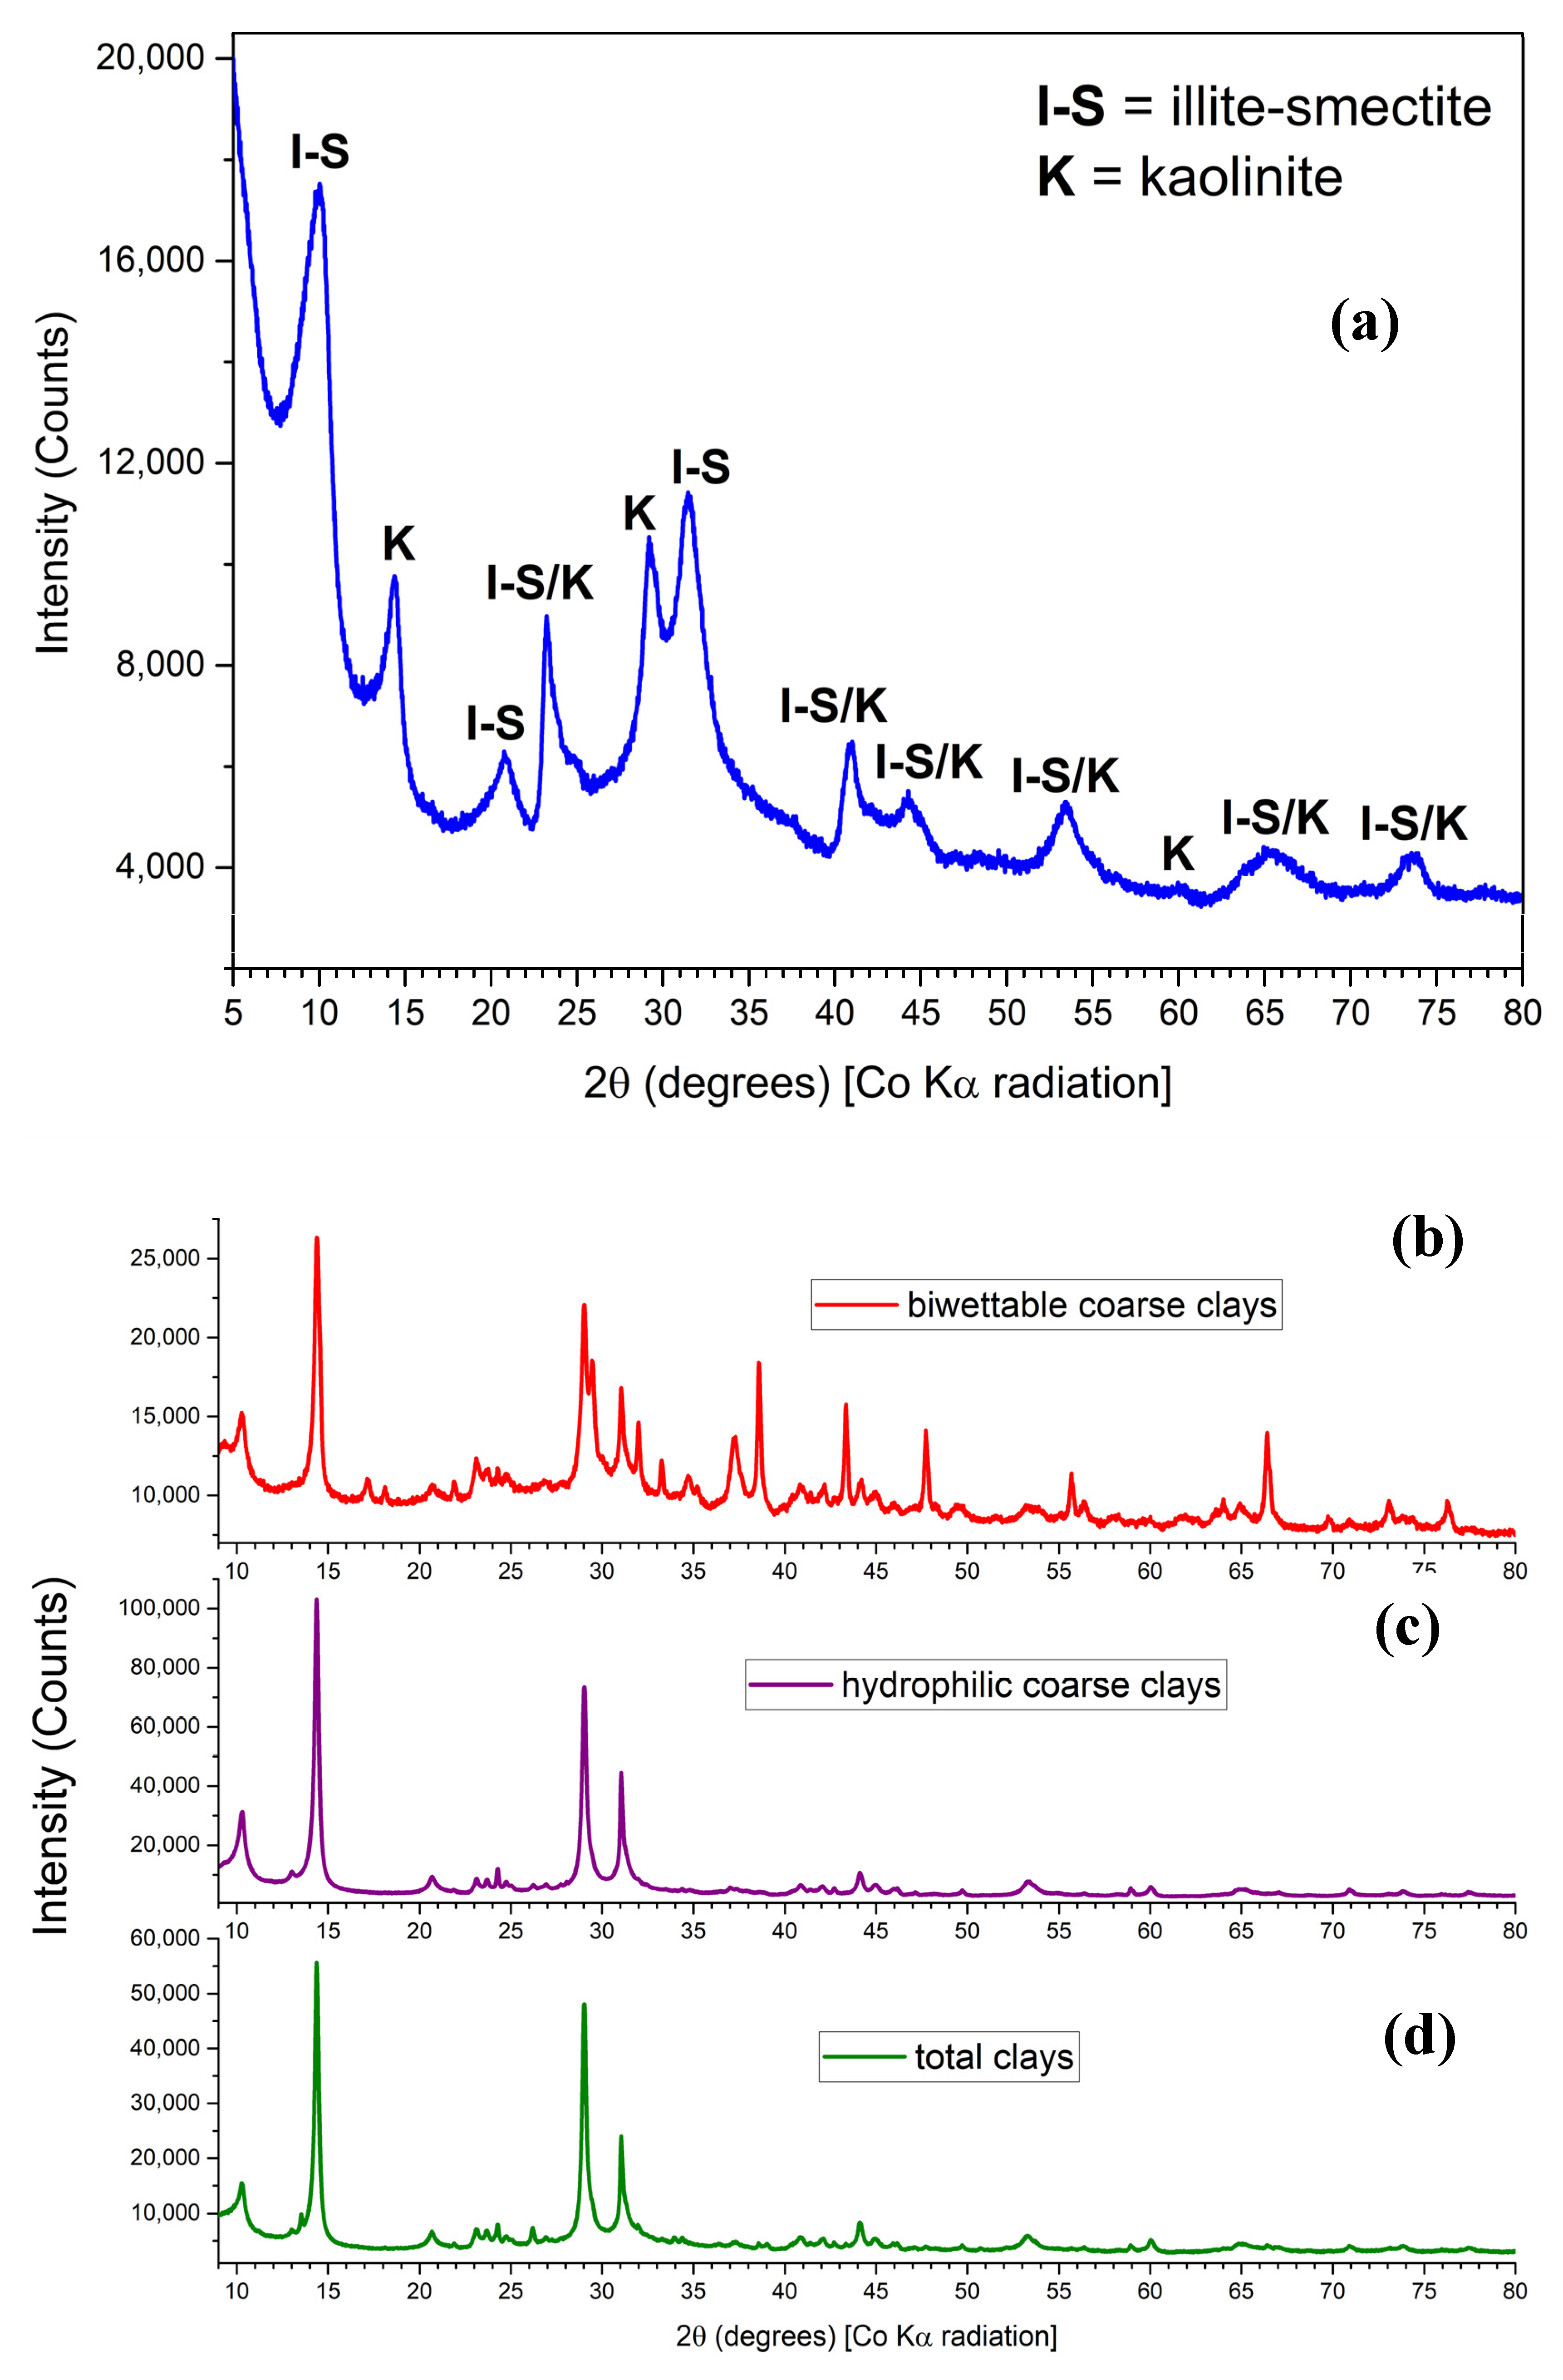
3.1. Analytical Characterization of Sub-2 µm Total Clay Fraction of Contaminant Solids

Table 2 summarizes the elemental and mineralogical compositions determined for the total clay (<2 µm solids) fraction separated from the contaminant solids present in the bitumen froth sample. A large proportion of clay minerals is present (61.8 wt %), with kaolinite (KAO = 37.4 wt %) and illite-smectite (ILL = 23.0 wt %) as the two prevalent phyllosilicate phases. The most common element is Si (18.67 wt %), arising partly from a non-negligible amount of quartz and silica (QTZ + SIL = 10.8 wt %) found as contaminant solids. The second most abundant element is Al (12.38 wt %), which occurs almost exclusively in the clay minerals. The third most abundant metallic elements are Fe (2.84 wt %), found mainly in pyrite (PYR = 5.3 wt %), and siderite+ iron-oxide-hydroxide (SID + AFE = 1.1 wt %). Ti, in the form of rutile or anatase, and Ca, in the form of apatite, carbonates, and sulphates, are also present. The analysis also confirms the presence of a non-negligible amount of carbon (7.67 wt %), which is expected to be found in carbonates, as well as toluene-unextractable organic carbon in micron-sized carbonaceous particles and intermixed with clay minerals [25].
The morphology of the sub-2 µm mineral particles observed in SEM (Figure 1) clearly indicates the presence of clay mineral platelets. Minerals containing metal-bearing elements are also observed and appear as bright features. SEM-EDX analysis confirms kaolinite and illite-smectite, and to a lesser extent quartz and pyrite, as the dominant minerals present in the sample. Rutile and anatase are also frequently observed. Ti and Fe were also detected together in a few occurrences, suggesting trace quantities of ilmenite, although no distinctive grains were identified. In addition, the presence of phosphorous suggests that trace quantities of very fine-grained apatite may also be distributed within the clays.
TEM images of the (<2 µm) clay solids dispersed on a lacey-carbon support clearly show, as labeled in Figure 2a, two distinct clay aggregates: randomly oriented platelets (region of type A), and large ordered stacks (region of type B). As visible on higher resolution images (Figure 2b), the large ordered stacks (type B) also have <200 nm clay platelets stacked face-to-face on their surfaces. The quasi-hexagonal facets observed for platelets lying flat on the carbon support are consistent with the expected morphology from the atomic structures of clay minerals, and suggest that in this case (Figure 2b) those particles are likely kaolinite. Nanometer-scale metal-bearing particles are also found dispersed on the clay mineral particle surfaces and accumulate preferentially at steps. The two clay-mineral-rich aggregates are also clearly visible on ADF-STEM images (Figure 3a). Spatially-resolved EDX analysis confirms the composition of the clay minerals. Both illite-smectite, containing potassium (spectrum 1 in Figure 3b), and kaolinite, without potassium (spectrum 2, Figure 3b), are observed. Interestingly, EDX spectra, acquired over a hole in the support, indicate that clay minerals in region of type A (spectrum 3) contain significant amount of carbon, whereas no carbon signal is detected in region of type B (spectra 1 and 2). This result suggests that regions of type A correspond to organo-clay aggregates. Bright features in the images correspond to the metal-bearing nanoparticles, containing Ti, as confirmed by EDX in spectrum, but also Fe and Ca elsewhere. For a region of type A (spectrum 3), Ca, Ti, and Fe are detected, suggesting the presence of small dispersed metal-bearing nanoparticles.

3.2. Analytical Characterization of Sub-200 nm Ultrafines Fraction of Contaminant Solids

Table 3 summarizes the elemental and mineralogical compositions determined for the ultrafines (<0.2 µm solids) fraction of the contaminant solids present in the bitumen froth sample. As demonstrated in Figure 4, the X-ray diffraction powder pattern measured for the separated sub-200 nm ultrafines proves this fraction to consist entirely of a mixture of illite-smectite and kaolinite, at least from a diffraction standpoint.
However, considering a range of chemical formulae for the illite-smectite phase consistent with those reported in Srodon et al. [41] for a large number of pure illite and illite-smectite samples, a more elaborate quantitative phase analysis estimation of the mineralogical composition of the ultrafines was attempted, as shown in Table 3. By arbitrarily assuming chemical formulae corresponding to four distinct atomic fractions of potassium of 0.8, 0.6, 0.4 and 0.3 atoms per formula unit, this reveals that the mass ratio of illite-smectite to kaolinite present in the ultrafines is highly dependent on the chemical formulae assumed for the illite-smectite phase. Moreover, to fully account for the bulk elemental concentrations of K and Si determined by XRF analysis, it was also necessary to infer the presence of poorly-crystalline or finely dispersed silica for the three cases with higher atomic fractions of K (i.e., 0.8, 0.6 and 0.4). For the chemical formulae with the lowest atomic fraction of K equal to 0.3, it was not necessary to infer the presence of silica; however, this yielded a concentration of kaolinite that seems abnormally low. For the four different assumptions of chemical formulae for the illite-smectite phase, the proportion of silica determined in the ultrafines is thus shown to decrease as the atomic fraction of K assumed for the illite-smectite phase decreases.
For the results of mineralogical compositions of the ultrafines fraction reported in Table 3, other assumptions were also made that warrant discussion. Specifically, we assumed that Na, Ca, Mg, and some portion of Fe were present in ionic form, either as fixed cations corresponding to the atomic fractions of those elements associated with the precise chemical formulae of the illite-smectite phase, or as exchangeable cations intercalated in-between composite layers within the illite-smectite phase. This is consistent with the results by Srodon et al. [41] mentioned above. Similarly, we also assumed that S and P occurred in ionic form as SO4 and PO4 anions. Lastly, we assumed that the vast proportion of Fe occurred as poorly crystalline or finely-dispersed iron oxide-hydroxide, and similarly, Ti and Zr were also deemed to occur as poorly-crystalline or finely-dispersed phases of titanium oxide (TiO2) and zircon (ZrSiO4). This is consistent with the TEM observations.
Overall, from the X-ray diffraction evidence (Figure 4) and the quantitative phase analysis results obtained here (Table 3), we thus conclude that at the bulk-measurement level, the ultrafines fraction separated here consists entirely of a mixture of illite-smectite and kaolinite. However, the mass ratio of illite-smectite to kaolinite and the precise chemical formulae of the illite-smectite phase existing in the ultrafines are uncertain.
At the microscopic level, for the ultrafines (<0.2 µm) solid fraction, the ADF-STEM image shown in Figure 5a display large mineral aggregates composed mainly of clay minerals, where each individual platelets are typically less than 0.2 µm in size. The formation of micron-sized aggregates is probably due to drying effects during the TEM specimen preparation. A closer look reveals, again, two characteristic regions; one with well-ordered face-to-face platelet stacking (arrow 1), and one with more randomly oriented platelets (arrow 2). A spatially-resolved EELS and corresponding extracted elemental map (Figure 5b) were acquired over the region identified by the white rectangle in the ADF-STEM image (Figure 5a). The elemental analysis confirms the presence of nanoparticles containing Ti, Fe, and Ca that are dispersed on the surface of the clay platelets. In Figure 5b, two Ti-containing nanoparticles appear prominently. The map shown in Figure 5b also highlights the presence of carbon in regions with randomly oriented clay platelets, whereas region with face-to-face platelets stacking have only very small or undetectable carbon content.

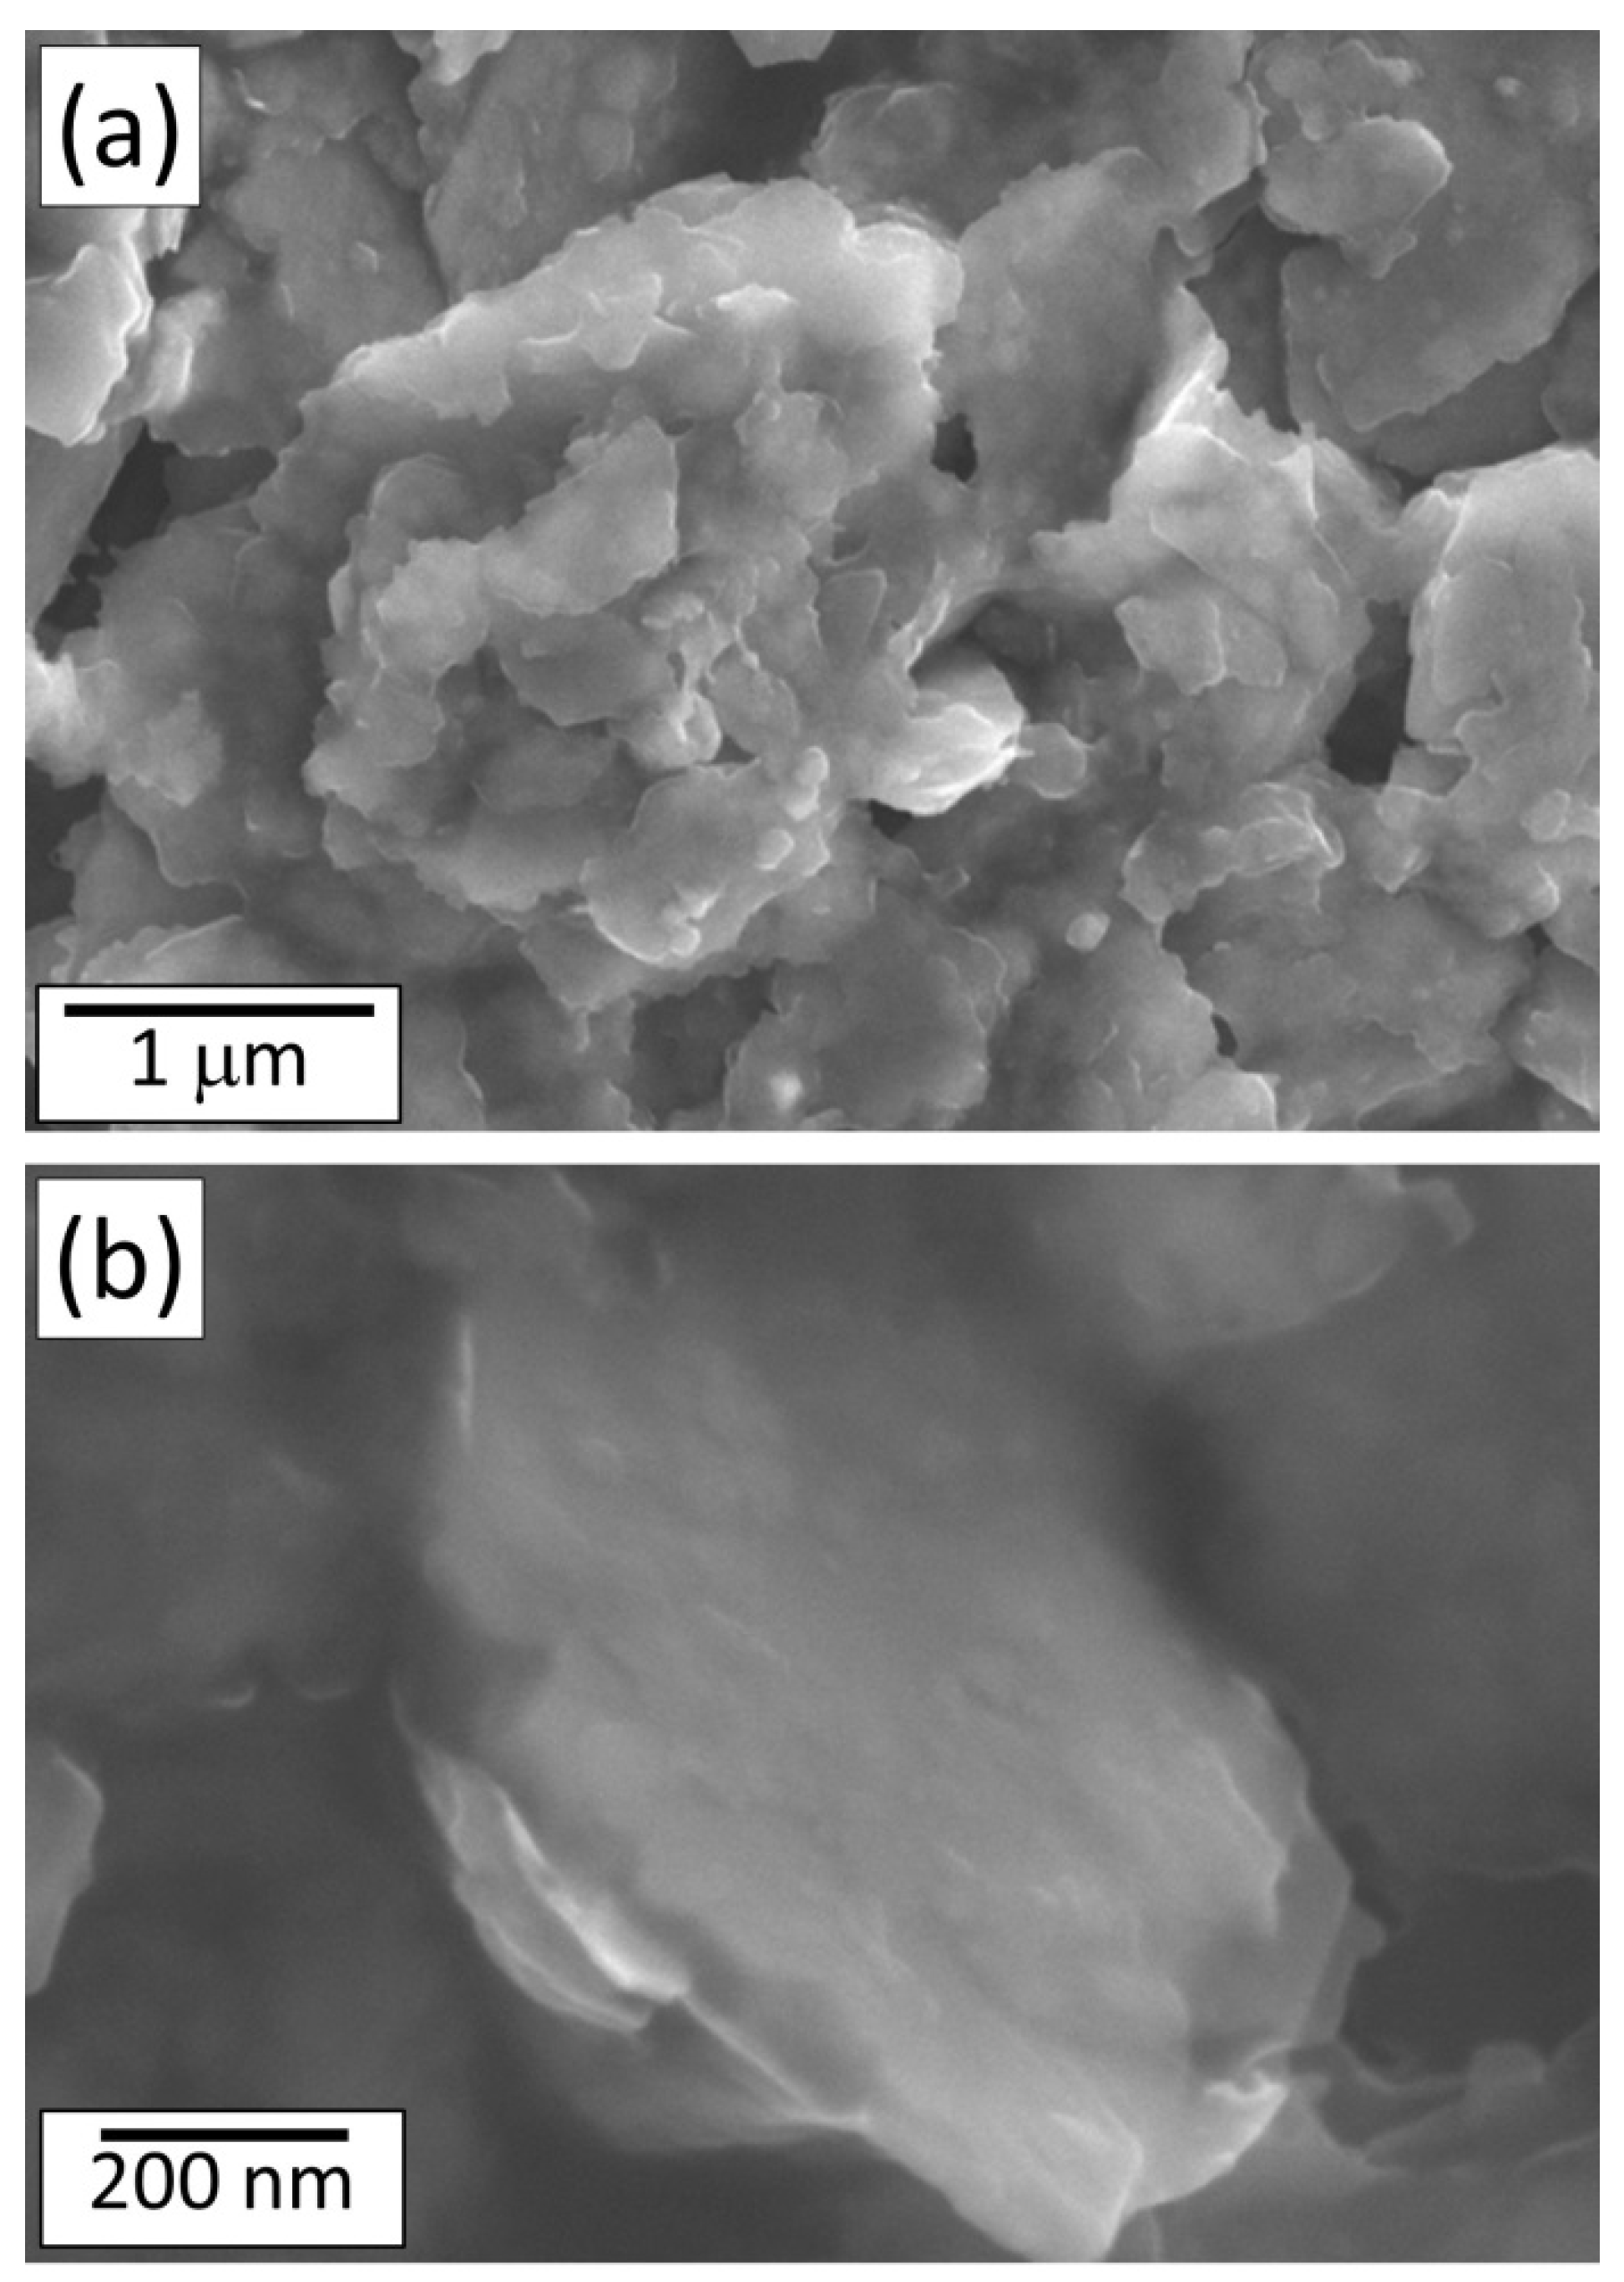
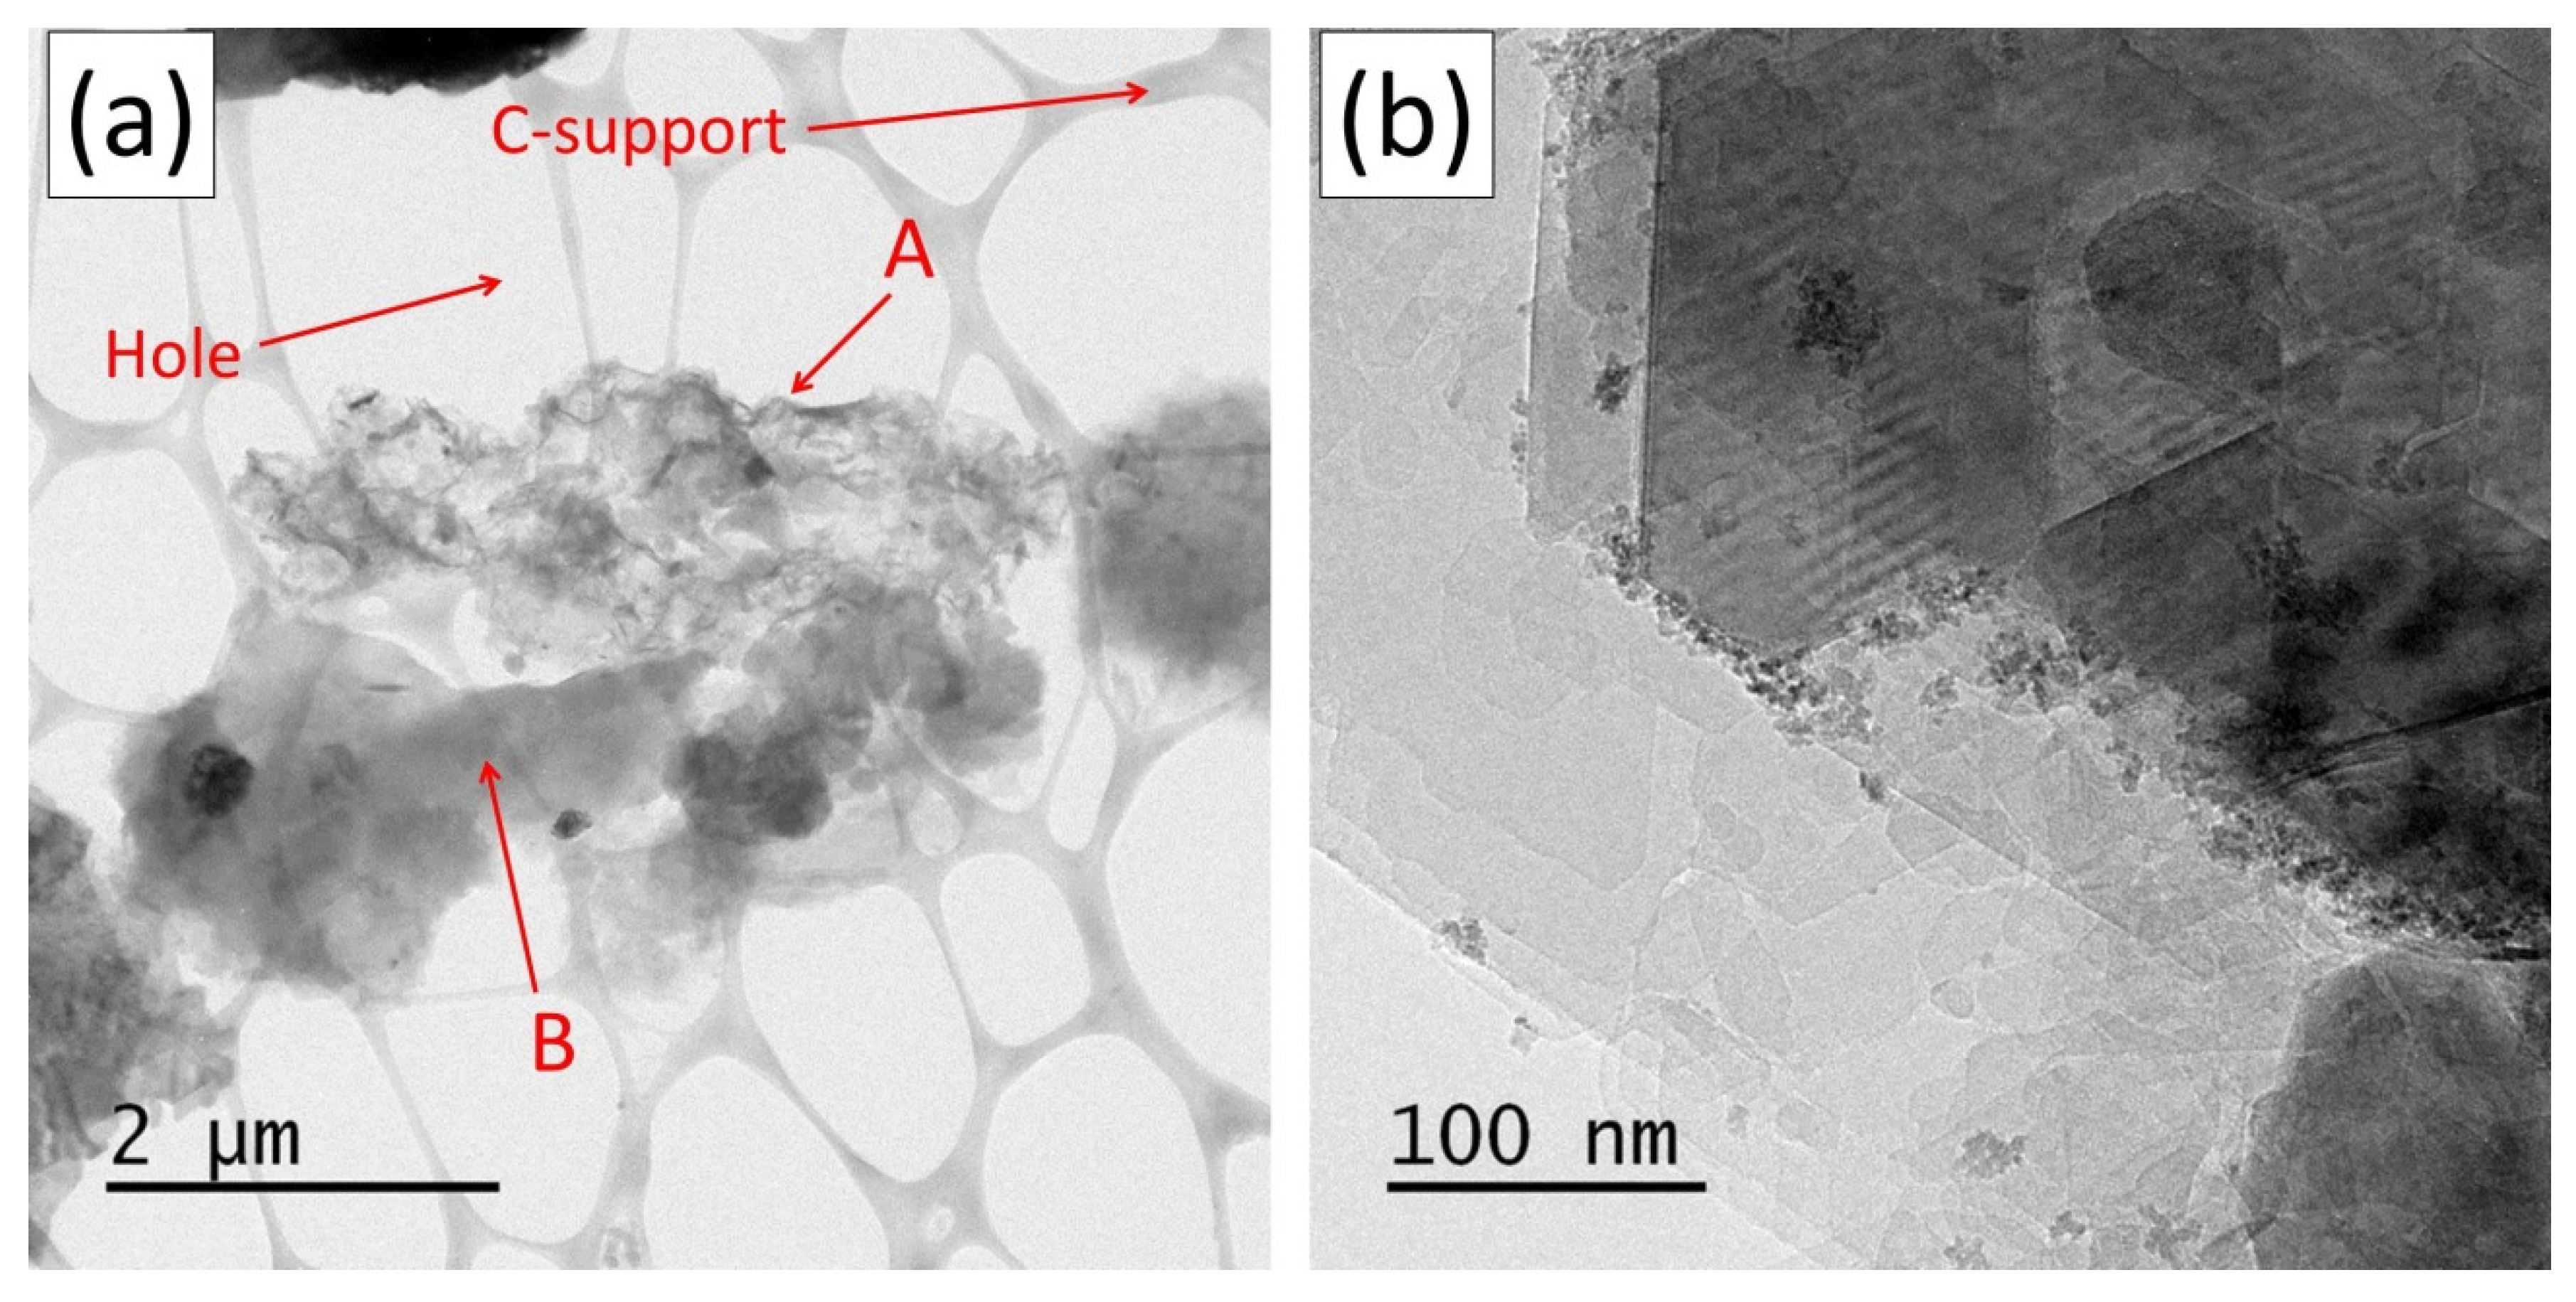
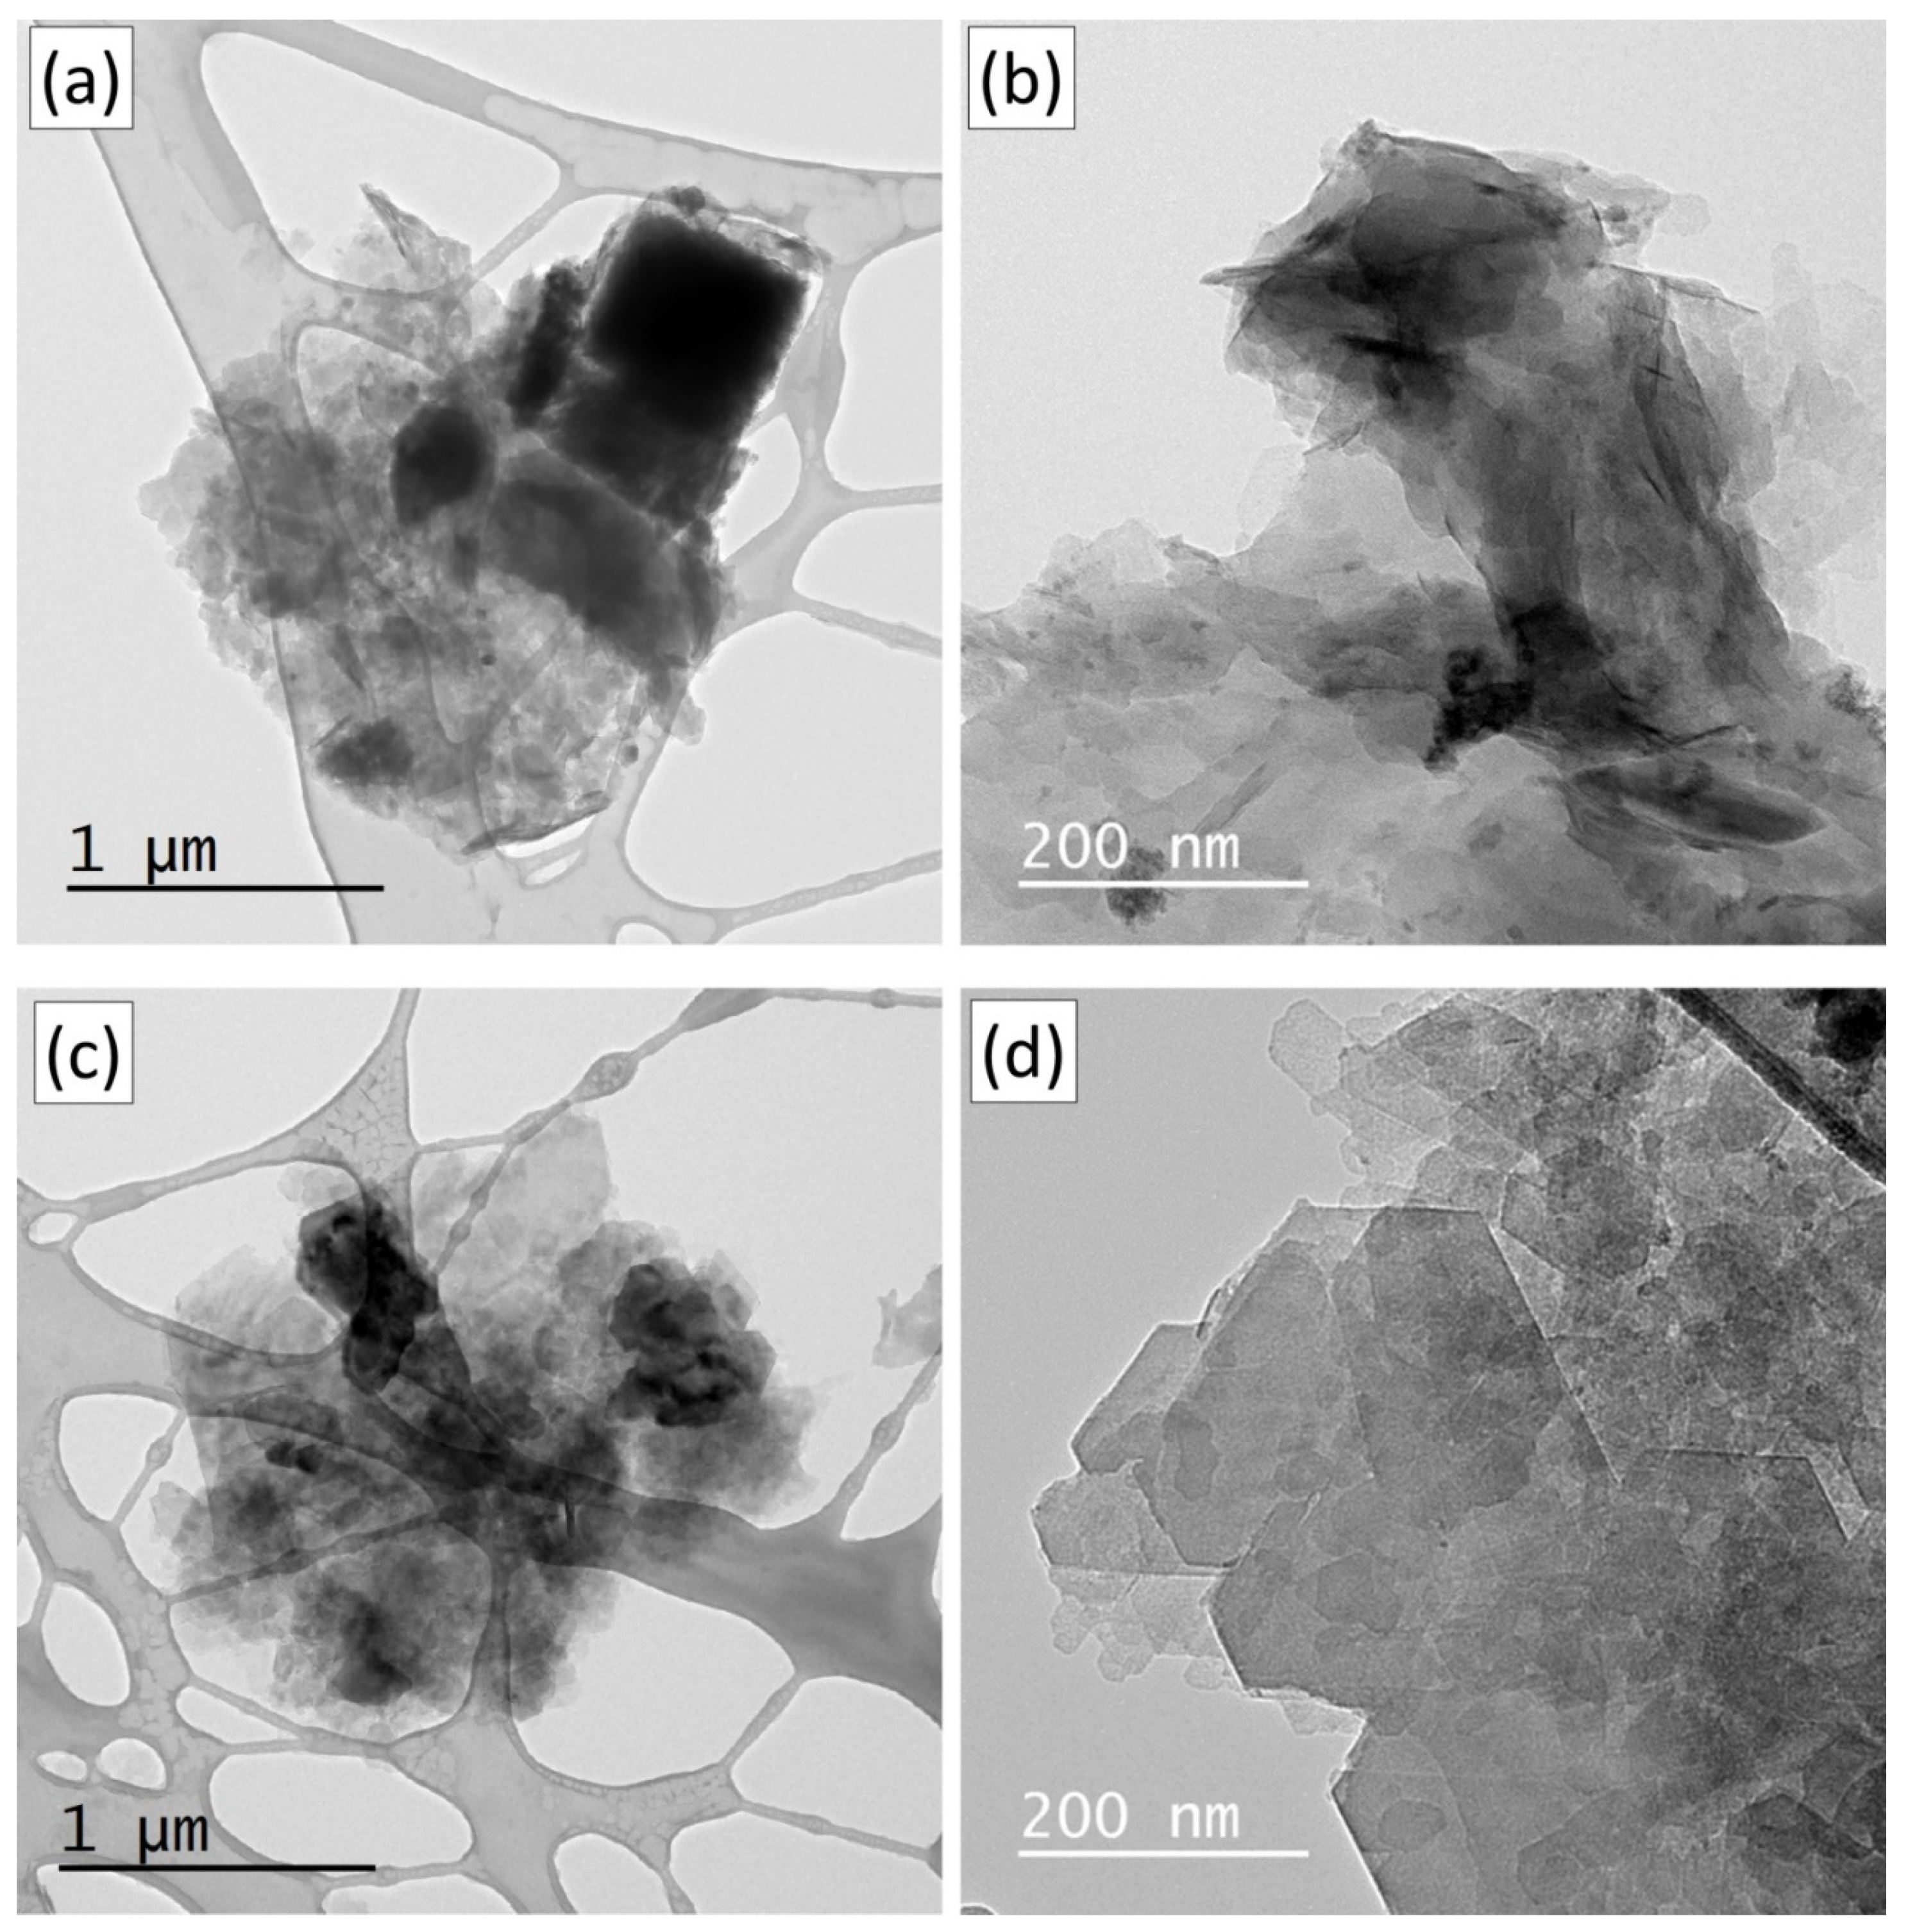
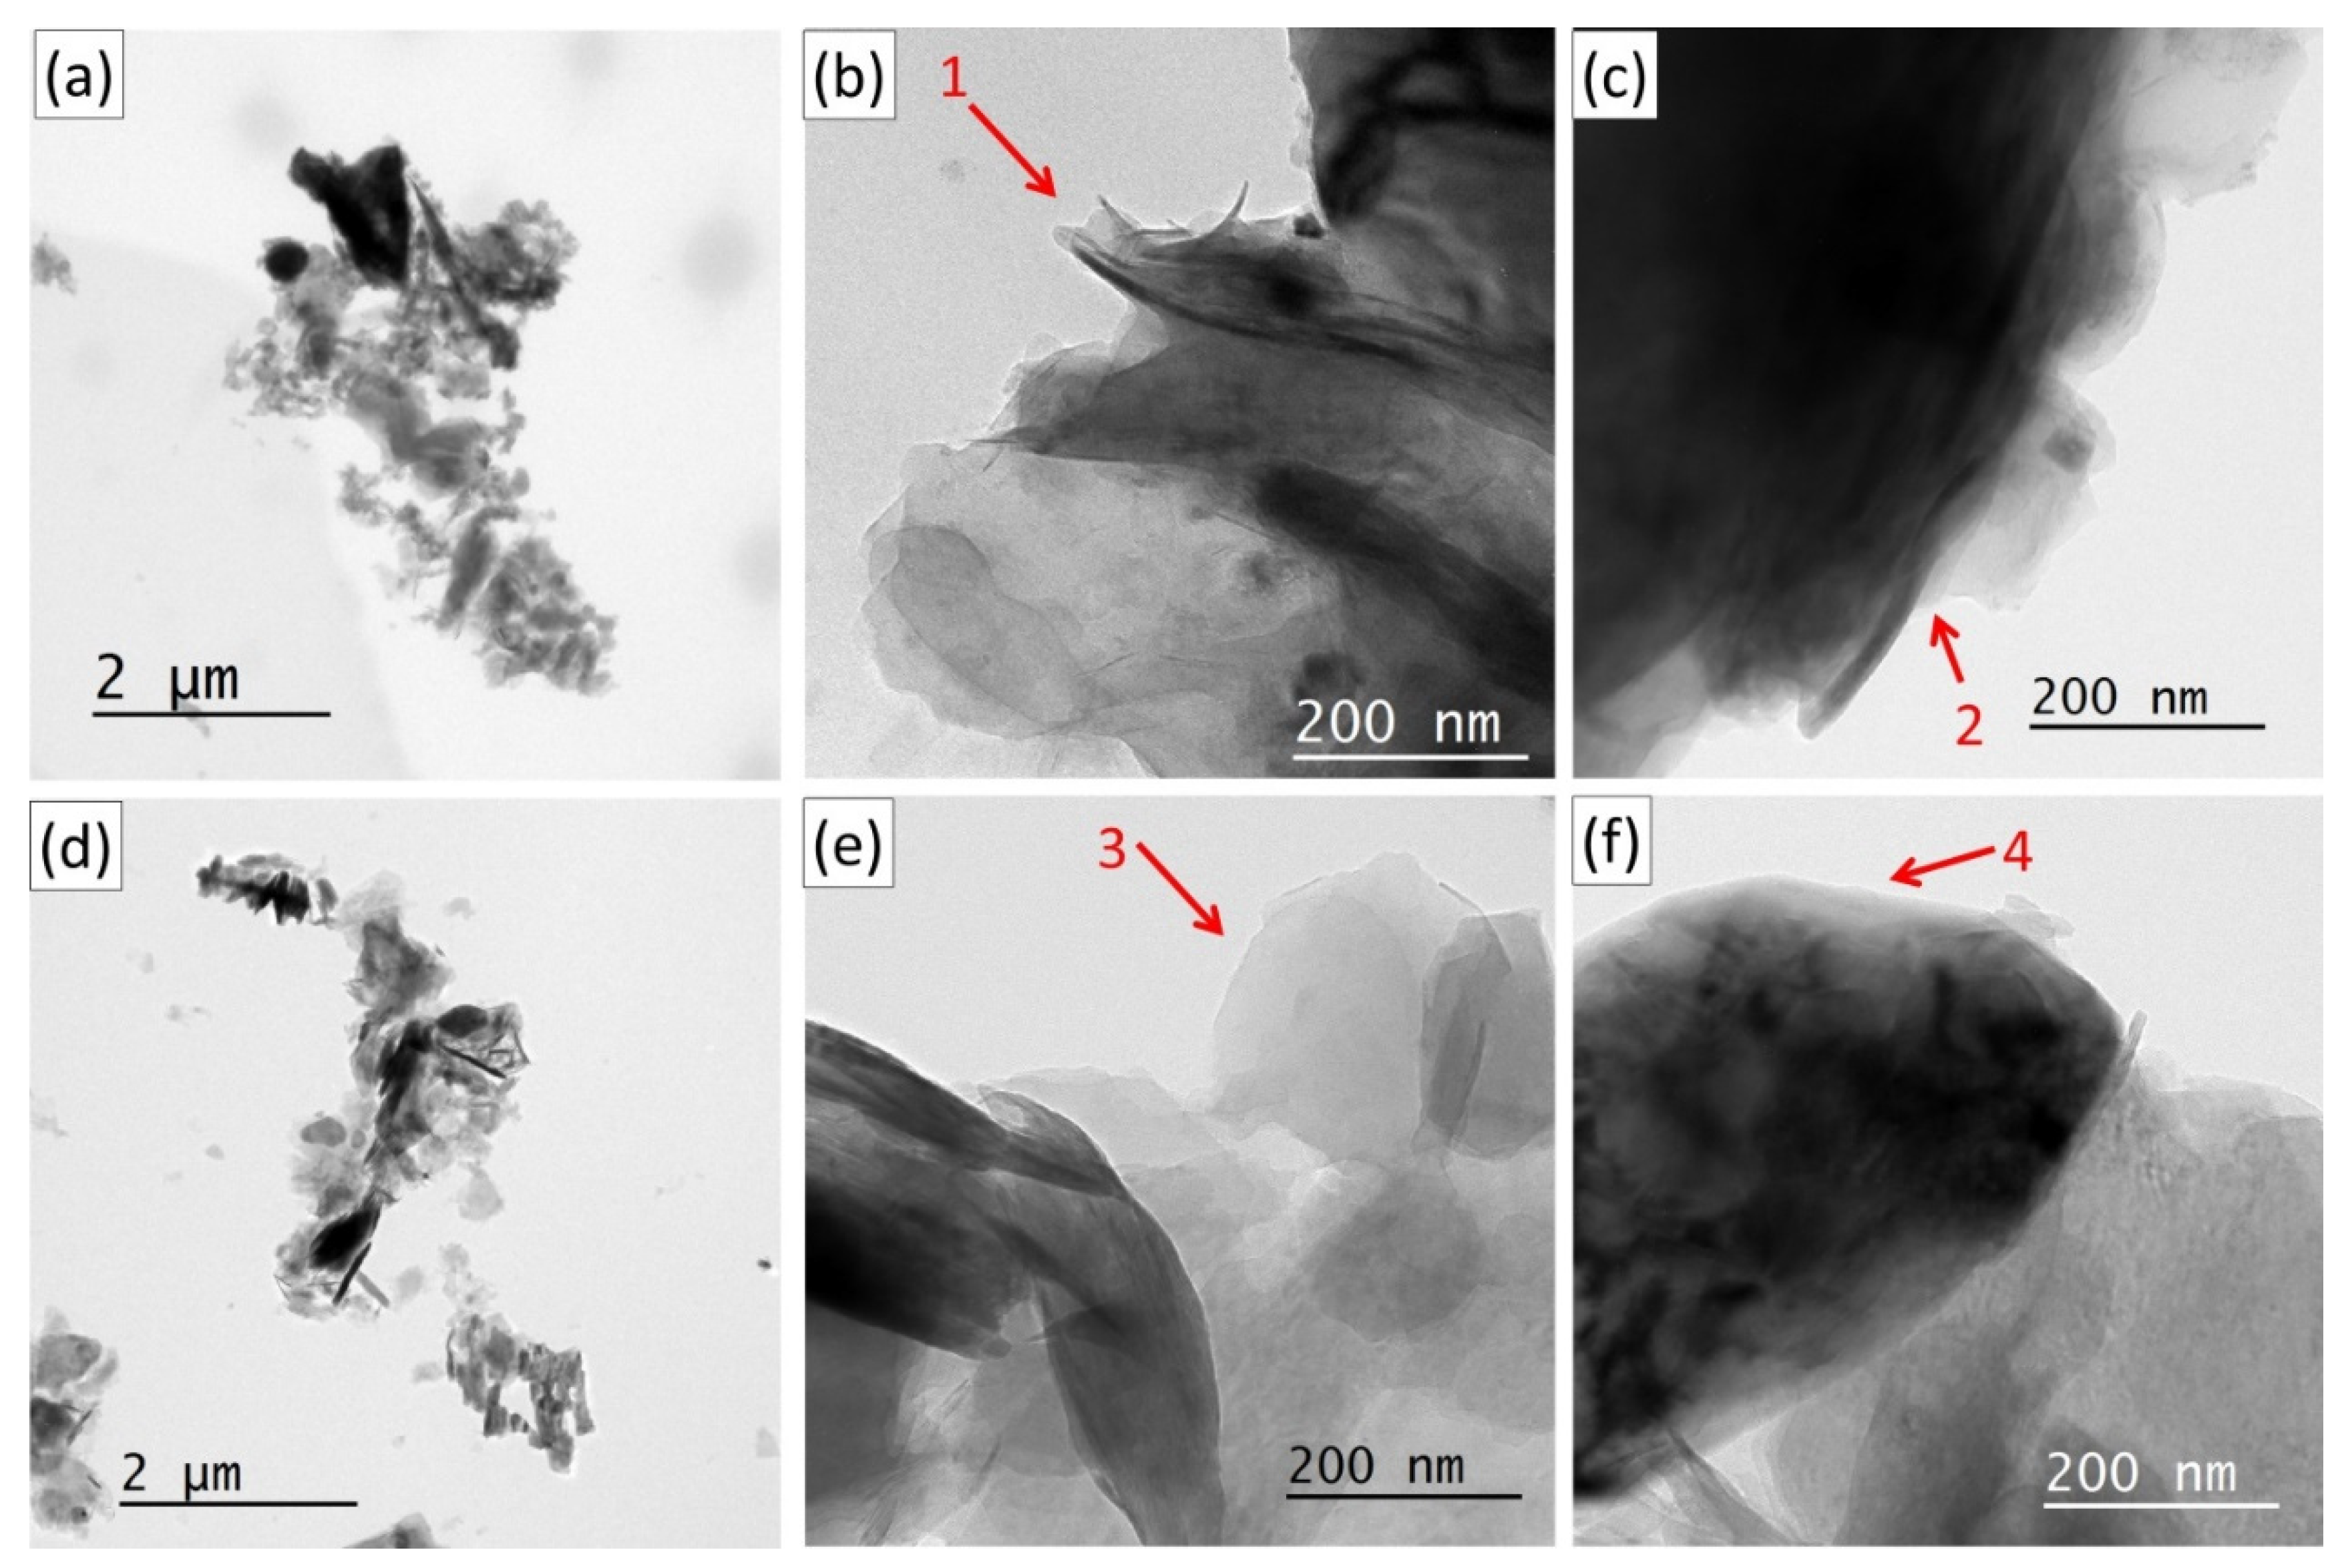
3.3. Morphology and Mineralogy of Hydrophilic vs. Biwettable Sub-2 µm Clay Aggregates

XRD patterns measured for hydrophilic and biwettable coarse clays (0.2–2 µm), as well as for total clays (<2 µm), are shown in Figure 4 in comparison to that from ultrafines (<0.2 µm). Table 2 presents the elemental and mineralogical compositions determined for the hydrophilic and biwettable coarse clay (0.2–2 µm) fractions isolated as described in Section 2.1 from the bitumen froth sample. In general, we observe clear systematics in the progression of phase abundances in going from hydrophilic coarse clays, through total clays, to biwettable coarse clays. Specifically, in the latter sequence, the following phase concentrations are distinguished: 13.2, 10.8, and 3.2 wt % for quartz + silica (QTZ + SIL); 72.6, 61.8, and 25.8 wt % for clay minerals; 0.8, 5.3, and 7.2 wt % for pyrite (PYR); and finally, 3.6, 6.7, and 27.4 wt % for toluene-unextractable organic carbon (ORC). Notably, significantly larger quantities of heavy minerals, especially pyrite and siderite+ iron-oxide-hydroxide (AFE), but also rutile (RUT), anatase (ANA), and zircon (ZIR), are present in biwettable coarse clays compared to total clays and hydrophilic coarse clays. Another observation is the progressive decrease in the mass ratio of kaolinite over illite-smectite, which varies from ~1.84 in hydrophilic coarse clays, to ~1.65 in total clays, and down to ~1.24 in biwettable coarse clays. In terms of clay mineralogy, it is also clear that chlorite is distinctively more abundant in biwettable coarse clays than in total clays and hydrophilic coarse clays.
At low magnifications, mineral aggregates for both fractions appear qualitatively similar (Figure 6a,c). In Figure 6, it is discernable that the aggregates contain clay platelets and various other minerals, such as the large pyrite particles visible in Figure 6a. Clear differences, however, are revealed more distinctly at higher magnifications (Figure 6b,d). Biwettable coarse clay aggregates contain mainly randomly oriented clay platelets, whereas for hydrophilic coarse clays, the clay platelets are predominantly found in ordered face-to-face stacking. Moreover, clay facets appear better defined in the hydrophilic fraction, with clearly visible sharp quasi-hexagonal facets.
Structural deformation of the mineral aggregates occurs in conventional TEM sample preparation due to the surface tension operating in the last stage of drying of the aqueous solution on the support. The two main alterations usually observed are a tendency of the aggregates to lie flat on the lacey-carbon support, and a clumping of the component particles. In Figure 6, the aggregates are compact, and large clay platelets tend to lie flat on the support. To avoid these air-drying effects, we have applied a freeze-drying preparation, as described in the experimental section. With this approach, the water is removed by sublimation instead of evaporation, and the structure of the mineral aggregates should be better preserved. Mineral associations should also appear more clearly. Figure 7a,d present low magnification images of biwettable and hydrophilic coarse clay aggregates prepared with the freeze-dry preparation. To emphasize the effect of mineral association, we display two of the larger aggregates observed in the samples, with dimensions on the order of (or slightly larger than) 2 µm. Compared to TEM specimens prepared with the conventional preparation (Figure 6), the aggregates observed in Figure 7 are less compact. This is an indication that the freeze-dry method successfully avoided drying artefacts. Furthermore, instead of lying mainly flat on the support, clay platelets are now randomly oriented. Typical thickness for the hydrophilic clay stacks can now be directly evaluated, and we observe a range from a few to ~50 nanometers. Clay mineral particles in the hydrophilic fraction display sharper contrast and appear more well-defined than in the biwettable fraction. In both parallel and perpendicular orientations, the edges are more clearly resolved.
For the biwettable fraction, smaller than 200 nm clay platelets protrude around the aggregates’ edges. This is visible at low magnification (Figure 7a), but appears more clearly at higher magnifications (Figure 7b,c). These <200 nm clay platelets, with lateral dimension less than a few hundreds of nanometers, are randomly oriented in the biwettable aggregates (Figure 7b, e.g., arrow 1), whereas they tend to be stacked face-to-face on larger clay stacks in the hydrophilic fraction (Figure 7e, e.g., arrow 3). Biwettable clays also tend to appear as delaminated layers, and some platelets have thicknesses of only a few atomic planes. Furthermore, <200 nm clay platelets often cover the surfaces of larger particles in the biwettable fraction (Figure 7c, arrow 2). Larger mineral particles in the hydrophilic fraction more often display exposed surfaces without clay platelets (Figure 7f, arrow 4). Further work would be needed to go beyond a qualitative description of the aggregate structure and to analyze mineral aggregates found in other environment than aqueous solutions, in particular, water-in-bitumen emulsions. The observations presented here, however, conclusively point to an important role played by <200 nm clay platelets in defining the wettability behaviors and morphological characteristics of heterogeneous coarse clay aggregates.

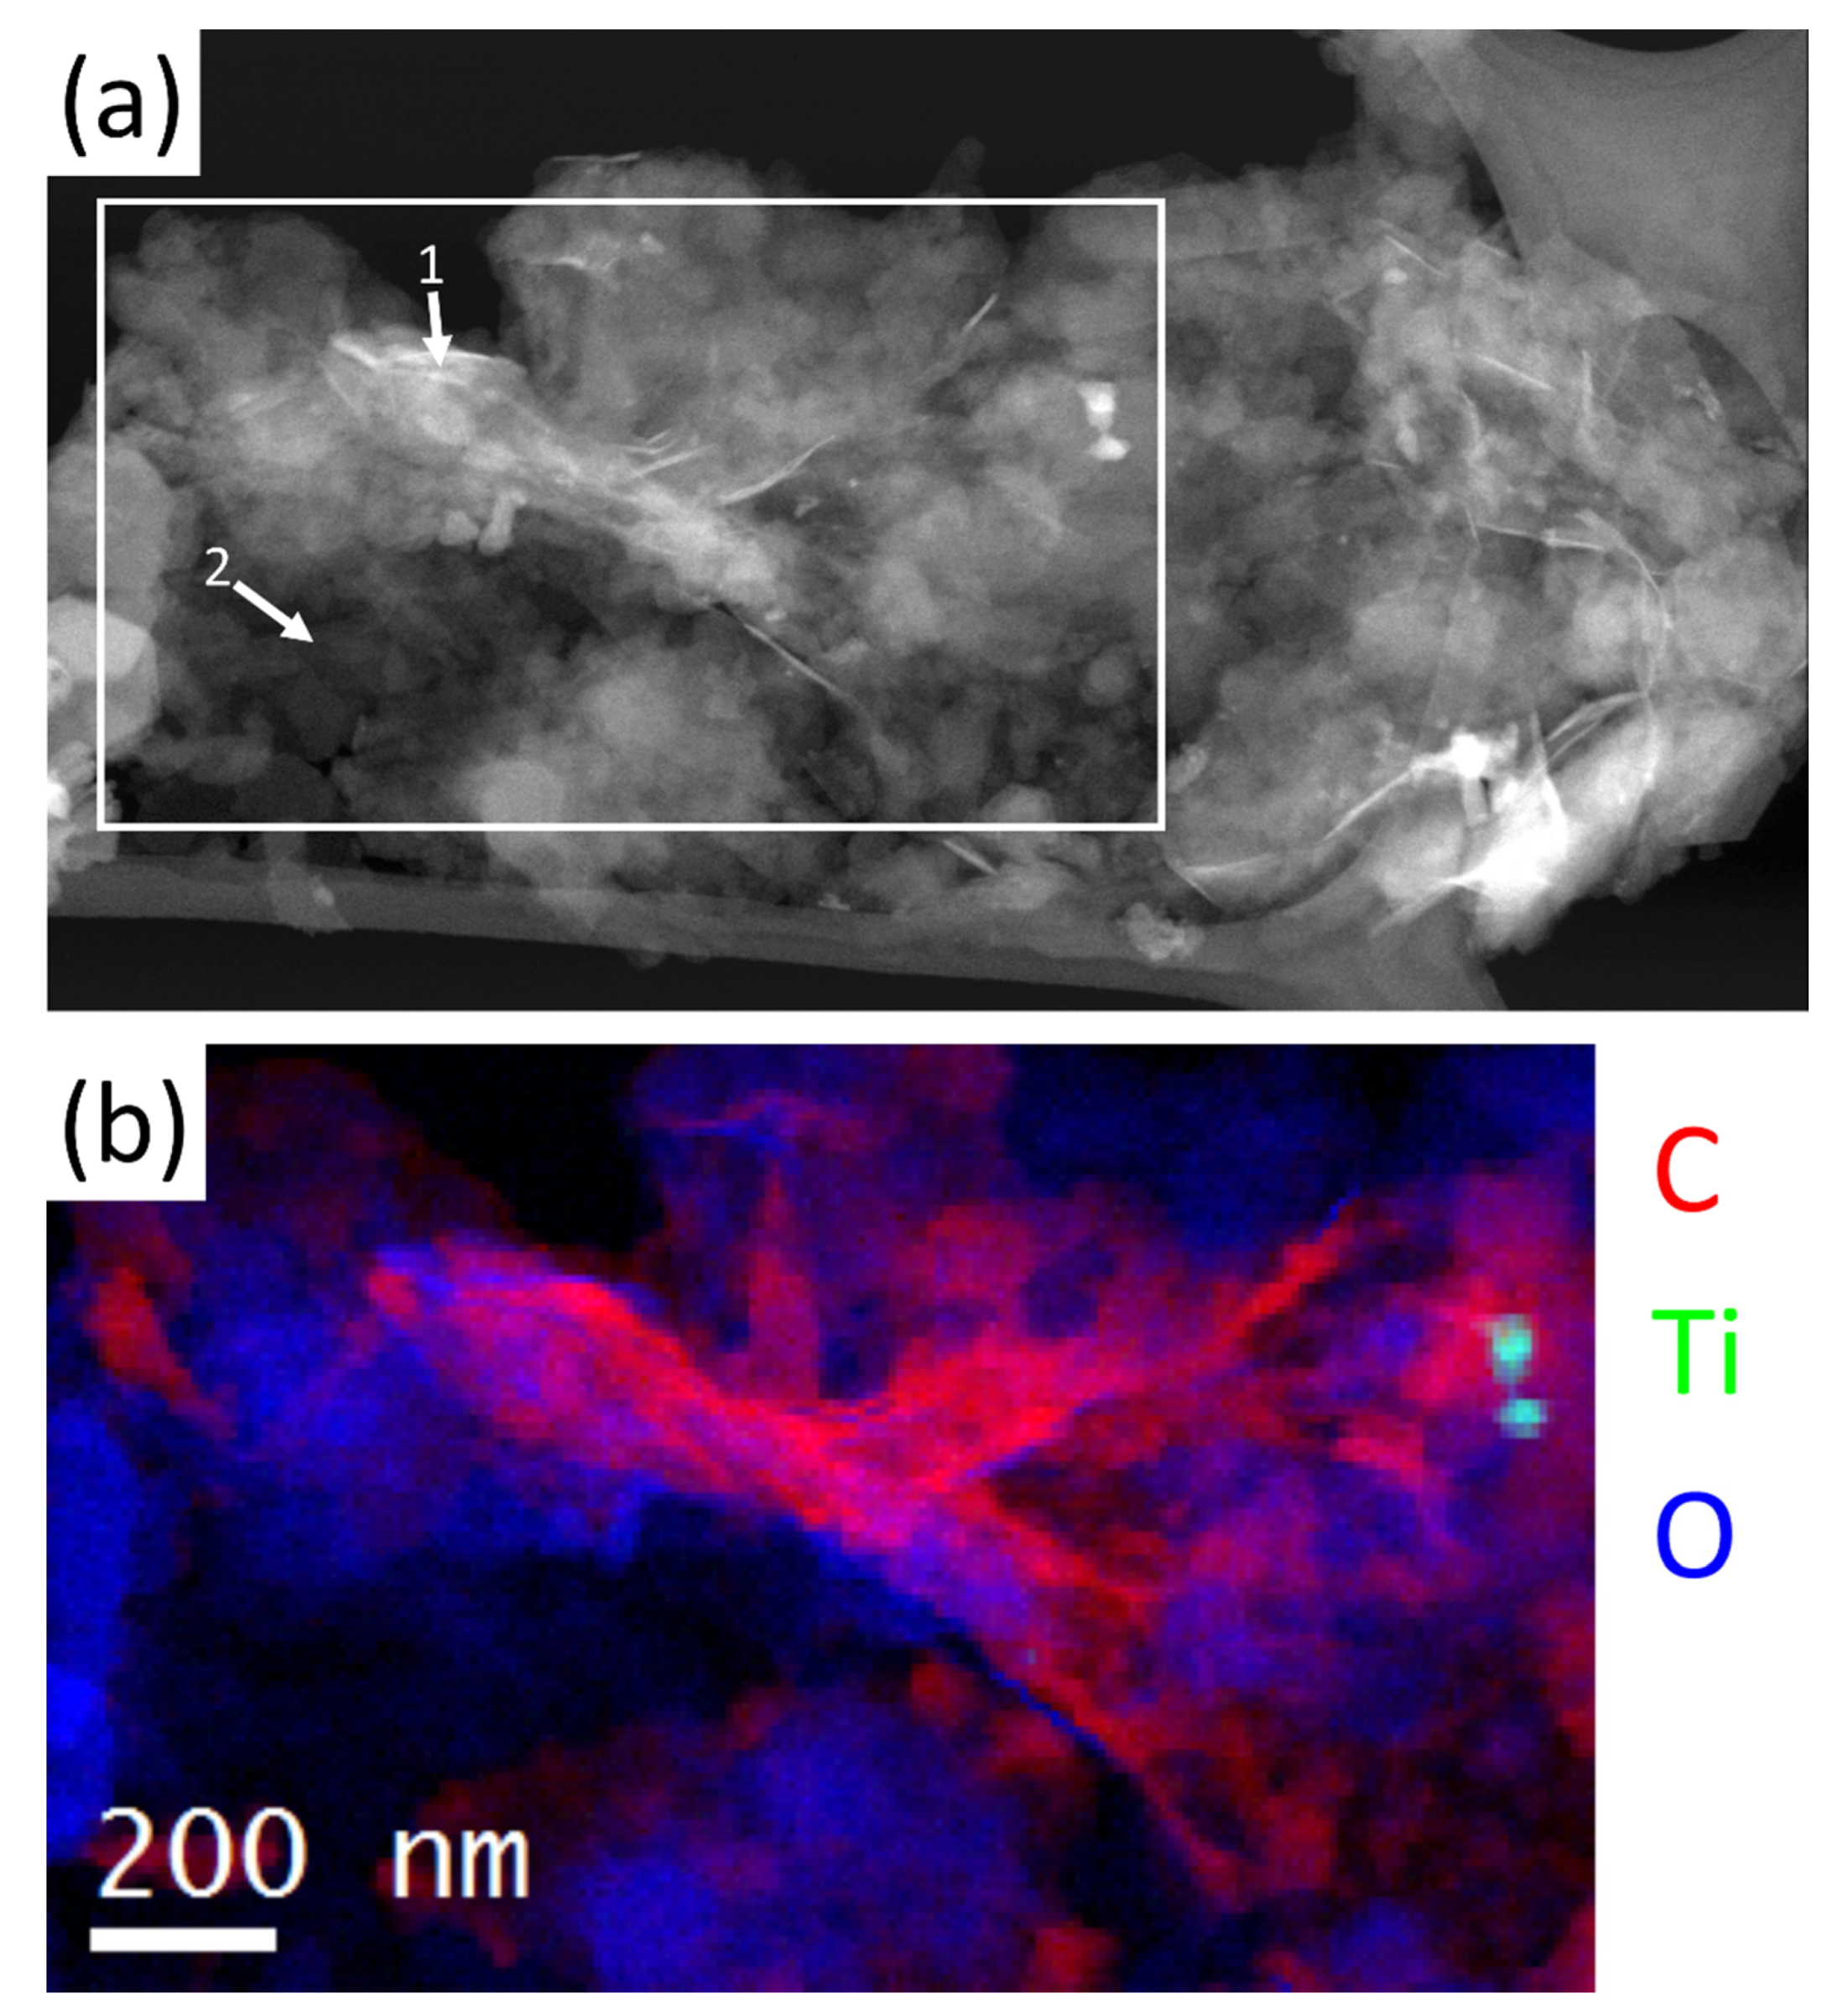
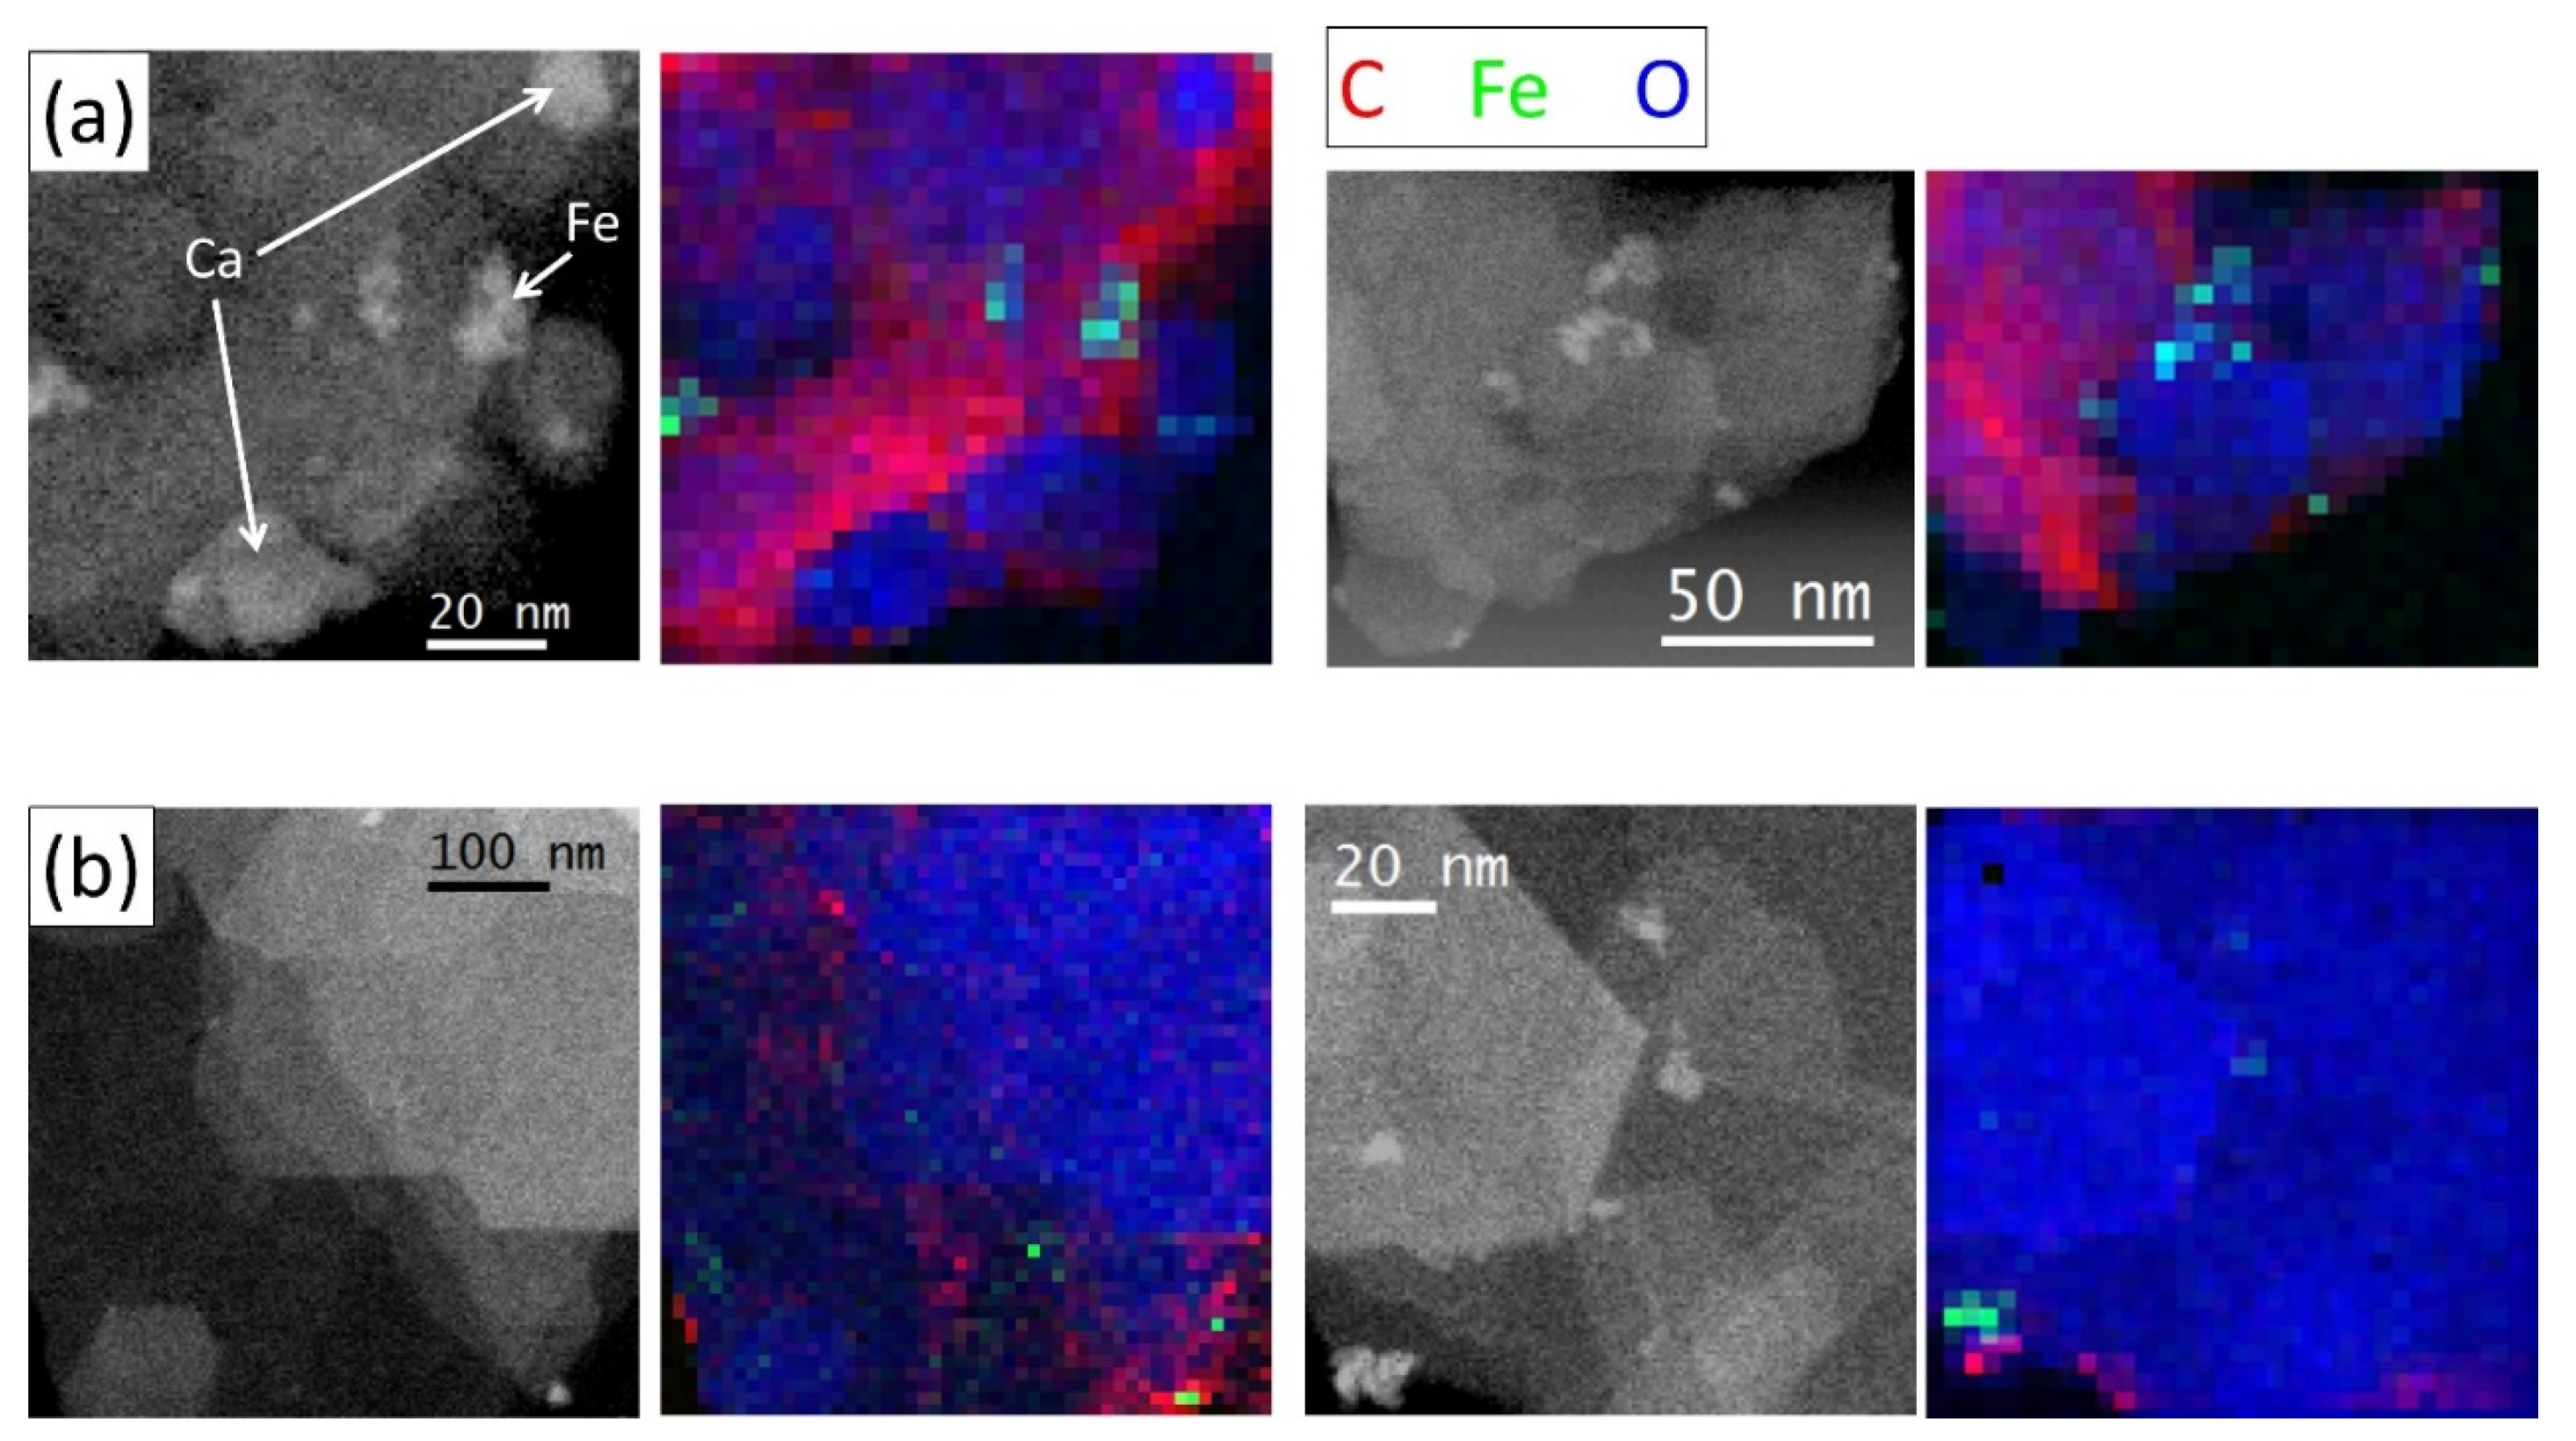
3.4. Interfacial Characteristics of <200 nm Clay Platelet Surfaces

Elemental maps were acquired using spatially-resolved EELS analysis to compare the organic coatings of clay minerals found in both hydrophilic and biwettable coarse clay fractions. Figure 8 presents ADF-STEM images and elemental maps for each of these two fractions, acquired at high magnification on <200 nm clay platelets with a field of view around 100 nm. The RGB contrast consists of: red = iron, green = carbon, and blue = oxygen. Interestingly, even at this scale, the clay platelets appear visually less well-defined in the biwettable solids. Clear quasi-hexagonal facets are observed for the hydrophilic coarse clays. Metal-bearing nanoparticles dispersed on the surfaces of the clay platelets are found in all the images, for both hydrophilic and biwettable fractions.
However, clear differences are observed in the carbon coverage between the two fractions. Comparing the distribution of oxygen (blue) and carbon (green) is indicative of the carbon coverage of clay platelets. The carbon tends to accumulate at steps or edges in both hydrophilic and biwettable clay aggregates, but in the case of the biwettable fraction, a carbon signal is also detected on the surfaces as well. However, the carbon coating is not uniform on the platelets’ surfaces. For hydrophilic coarse clays, carbon content is significantly lower on the surfaces of clay platelets. Some carbon was found at edges, or associated with Fe, which suggests that some nanoparticles might be siderite or carbon in association with nano-particulate iron oxide. We note that the carbon signal is more spatially diffused than the Fe signal, which indicates that some carbon is probably in the form of toluene-unextractable organic carbon accumulating around the nanoparticle, and not only included in the siderite or nano-particulate iron oxide structures.

3.5. Implications of Results for Emulsion Stabilization and Bitumen froth Treatment Process

As per recent review by Kilpatrick [9], there are many factors influencing water-in-oil emulsion stabilization and many questions remain unanswered. Indeed, emulsions of water in petroleum or petroleum-derived liquids can be stabilized by a variety of chemical components present in petroleum and/or surface-active compounds with which petroleum comes into contact. The latter review discussed extensively the potential mechanisms by which asphaltenes, resins, carboxylic acids of various types, and fine inorganic particles, and combinations of these types of materials, may contribute to emulsion stabilization. In particular, it was noted that asphaltenes can adsorb and modify inorganic fine solid particle surfaces, thereby enhancing emulsion stability. This has been demonstrated using emulsion model systems of asphaltene reacted with clays (kaolin, montmorillonite) and iron oxide [22], as well as with model water-in-hydrocarbon emulsions consisting of toluene, heptane, water, asphaltenes, and native oil sands solids including mostly clays [21]. Most notably, these studies showed that, as the inorganic particle size decreases and/or the wettability coverage of particle surfaces by asphaltene varies, there is a much steeper enhancement of emulsion stability. The most effective particles at dramatically enhancing emulsion stability were those in the range of 100–500 nm in size. Additionally, there also appeared to be a limit and optimal range to the asphaltene surface coverage of particles, suggesting that asphaltene and fine solids likely compete between each other for the oil/water interface of the emulsions when they are being formed. The review by Kilpatrick [9] concluded that: “The mechanism of stabilization of water-in-crude oil emulsions by inorganic solid particles thus appears to be primarily through the enhancement of asphaltene and/or resin or crude oil acid-stabilized emulsions through the absorption of surface-modifying components in the crude oil to the particles that render them interfacially active”.
In the present work, however, for three sub-2 µm solid fractions isolated from a typical bitumen froth produced commercially from aqueous extraction of bitumen from oil sands, we demonstrated key differences in morphology and composition between sub-2 µm clay aggregates with two distinct wettability characteristics: hydrophilic vs. biwettable particle surfaces. In particular, clay platelets with <200 nm lateral dimensions and thicknesses of a few atomic layers, which are intermixed within coarser sub-2 µm clay aggregates, were found to confer clear differences in morphological characteristics and wettability behaviors to the sub-2 µm clay aggregates. The <200 nm clay platelets found within biwettable coarse clays (0.2–2 µm) tended to arrange themselves with random orientations, whereas <200 nm clay platelets within hydrophilic coarse clays typically formed well-ordered face-to-face stacks. Moreover, in biwettable coarse clay aggregates, <200 nm clay platelets often covered the surfaces of micron-sized mineral particles, whereas larger mineral particles in hydrophilic coarse clay aggregates, in contrast, generally had exposed surfaces without clay platelet coverage. These biwettable vs. hydrophilic behaviors are attributed to a difference in the surface characteristics of the <200 nm clay platelets caused by toluene-unextractable organic carbon coatings. Nanometer-scale carbon mapping revealed an inhomogeneous toluene-unextractable organic carbon coating on the surfaces of <200 nm platelets in biwettable clays. In contrast, hydrophilic clays have a significantly lower amount of toluene-unextractable organic carbon, which tends to be concentrated at steps or near metal oxide nanoparticles on clay particle surfaces.
In context of the bitumen froth treatment process, we suggest that the inherent morphological characteristics and wettability behaviors of hydrophilic and biwettable sub-2 µm clay aggregates caused by toluene-unextractable carbon coatings will be sufficient to enable the formation and enhancement of solid-stabilized water-in-oil emulsions with differing extent of emulsion stability. In other words, the absorption of surface-modifying components (such as asphaltenes, resins, or carboxylic acids of various types) during bitumen production and especially in froth treatment, is not a necessary condition for the hydrophilic and biwettable sub-2 µm clay aggregates to enhance emulsion stabilization. However, the emulsion enhancement effect may be further exacerbated by the adsorption of surface-active species onto the toluene-unextractable organic carbon revealed here to be comprised in both hydrophilic and biwettable coarse clay aggregates separated from a typical bitumen froth produced at commercial operations.

4. Summary and Conclusions

In summary, we have analyzed with nanometer precision the structure and composition of sub-2 µm heterogeneous clay aggregates present in a typical bitumen froth produced commercially at a mined oil sands operation, with an emphasis on clarifying the composition, morphology, and wettability. Whereas pyrite, siderite, quartz/silica, and various metal-bearing minerals are present, the mineralogy of sub-2 µm contaminant solids is dominated by clay minerals, in particular illite-smectite and kaolinite. From X-ray diffraction evidence and quantitative phase analysis results obtained here, we also showed that, the <0.2 µm solids ultrafines fraction separated consists entirely of a mixture of illite-smectite and kaolinite. However, the mass ratio of illite-smectite to kaolinite and the precise chemical formulae of the illite-smectite phase existing in the ultrafines are uncertain. Furthermore, by separating sub-2 µm contaminant solids according to their wettability, we observed that illite-smectite and kaolinite are present in both biwettable and hydrophilic fractions. The spatial distribution of <200 nm clay platelets within sub-2 µm clay aggregates, however, is remarkably different. Orderly stacked clay platelets are typically observed in the hydrophilic solid fraction, whereas randomly oriented <200 nm clay platelets are found in the biwettable fraction. Moreover, larger mineral particles had their surfaces mostly exposed in the hydrophilic fraction, and covered with clay minerals in the biwettable fraction. We attribute this difference in behavior of <200 nm clay platelets to their surface characteristics, and in particular to the presence or absence of a tightly-bound toluene-unextractable organic matter coating. An organic coating is revealed on the <200 nm clay platelet surfaces present in the biwettable fraction, and is found to be inhomogeneous at the nanometer scale. This contrasts with the much lower carbon content observed on <200 nm clay platelets in the hydrophilic fraction. We suggest that these inherent morphology and wettability characteristic differences of organo-clay arrangements between hydrophilic and biwettable sub-2 µm clay aggregates present in the bitumen froth will enable the formation and enhancement of solid-stabilized water-in-oil emulsions with differing extent of emulsion stability during the bitumen froth treatment process.

Author Contributions

Conceptualization, M.C. and P.H.J.M.; methodology, M.C. and P.H.J.M.; formal analysis, M.C., D.D.T., D.M.K., B.P., A.Z. and P.H.J.M.; investigation, P.H.J.M. and S.N.; writing—original draft preparation, M.C.; writing—review and editing, M.C., S.N. and P.H.J.M.; visualization, M.C. and P.H.J.M.; supervision, P.H.J.M.; project administration, P.H.J.M.; funding acquisition, P.H.J.M. All authors have read and agreed to the published version of the manuscript.

Funding

This research was funded partly by Syncrude Canada Ltd.

Acknowledgments

The authors thank Syncrude for permission to publish these results. This work was performed under the High Efficiency Mining program currently in place at the National Research Council of Canada. The authors also thank Denise Chabot (Agriculture Canada) for carrying out the freeze-dry preparation of the TEM specimens.

Conflicts of Interest

The authors declare no conflict of interest.

References

  1. Takamura, K. Microscopic structure of Athabasca oil sand. Can. J. Chem. Eng. 1982, 82, 538–545. [Google Scholar] [CrossRef]
  2. Gray, M.; Xu, Z.; Masliyah, J. Physics in the oil sands of Alberta. Physics Today 2009, 62, 31–35. [Google Scholar] [CrossRef]
  3. Masliyah, J.; Zhou, Z.; Xu, Z.; Czarnecki, J.; Hamza, H. Understanding water-based bitumen extraction from Athabasca oil sands. Can. J. Chem. Eng. 2004, 82, 628–654. [Google Scholar] [CrossRef]
  4. Shaw, R.C.; Schramm, L.L.; Czarnecki, J. Suspensions in the hot water flotation process for Canadian oil sands. In Suspensions: Fundamentals and Applications in the Petroleum Industry; Advances in Chemistry Series 251; American Chemical Society: Washington, DC, USA, 1996; pp. 639–656. [Google Scholar]
  5. Masliyah, J.; Czarnecki, J.; Xu, Z. Handbook of Theory and Practice of Bitumen Recovery from Athabasca Oil Sands; Theoretical Basis; Kingsley: Calgary, AB, Canada, 2011; Volume 1. [Google Scholar]
  6. Rao, F.; Liu, Q. Froth treatment in Athabasca oil sands bitumen recovery process: A review. Energy Fuels 2013, 27, 7199–7207. [Google Scholar] [CrossRef]
  7. Kotlyar, L.S.; Sparks, B.D.; Woods, J.R.; Chung, K.H. Solids associated with the asphaltene fraction of oil sands bitumen. Energy Fuels 1999, 13, 346–350. [Google Scholar] [CrossRef]
  8. Yan, N.; Gray, M.R.; Masliyah, J.H. On water-in-oil emulsions stabilized by fine solids. Colloids Surf. A Physicochem. Eng. Asp. 2001, 193, 97–107. [Google Scholar] [CrossRef]
  9. Kilpatrick, P.K. Water-in-crude oil emulsion stabilization: Review and unanswered questions. Energy Fuels 2012, 26, 4017–4026. [Google Scholar] [CrossRef]
  10. McLean, J.D.; Kilpatrick, P.K. Effects of asphaltene solvency on stability of water-in-crude-oil emulsions. J. Colloid Interface Sci. 1997, 189, 242–253. [Google Scholar] [CrossRef] [Green Version]
  11. Taylor, S.D.; Czarnecki, J.; Masliyah, J. Disjoining pressure isotherms of water-in-bitumen emulsion films. J. Colloid Interface Sci. 2002, 252, 149–160. [Google Scholar] [CrossRef]
  12. Saraka, C.; Xu, R.; Machado, M.B.; Bhattacharya, S.; Ng, S.; Kresta, S. Dewatering of Poor-Quality Bitumen Froth: Induction Time and Mixing Effects. Energy and Fuels 2018, 32, 9–10032. [Google Scholar] [CrossRef]
  13. Yang, F.; Tchoukov, P.; Pensini, E.; Dabros, T.; Czarnecki, J.; Masliyah, J.; Xu, Z. Asphaltene subfractions responsible for stabilizing water-in-crude oil emulsions. Part 1: Interfacial behaviors. Energy Fuels 2014, 28, 6897–6904. [Google Scholar] [CrossRef]
  14. Kiran, S.K.; Ng, S.; Acosta, E.J. Impact of asphaltenes and naphthenic amphiphiles on the phase behavior of solvent− bitumen− water systems. Energy Fuels 2011, 25, 2223–2231. [Google Scholar] [CrossRef]
  15. Xu, Y.; Dabros, T.; Hamza, H.; Shefantook, W. Destabilization of water in bitumen emulsion by washing with water. Pet. Sci. Technol. 1999, 17, 1051–1070. [Google Scholar] [CrossRef]
  16. Chen, Q.; Liu, Q. Bitumen Coating on Oil Sands Clay Minerals: A Review. Energy Fuels 2019, 33, 5933–5943. [Google Scholar] [CrossRef]
  17. Yan, Z.; Elliot, J.A.; Masliyah, J.H. Roles of various bitumen components in the stability of water-in-diluted-bitumen emulsions. J. Colloid Interface Sci. 1999, 220, 329–337. [Google Scholar] [CrossRef]
  18. Kotlyar, L.S.; Sparks, B.D.; Woods, J.R.; Raymond, S.; Le Page, Y.; Shelfantook, W. Distribution and types of solids associated with bitumen. Pet. Sci. Technol. 1998, 16, 1–19. [Google Scholar] [CrossRef]
  19. Gu, G.; Zhiang, Z.; Xu, Z.; Masliyah, J.H. Role of fine kaolinite clay in toluene-diluted bitumen/water emulsion. Colloids Surf. A Physicochem. Eng. Asp. 2003, 215, 141–153. [Google Scholar] [CrossRef]
  20. Chen, Q.; Stricek, I.; Gray, M.R.; Liu, Q. Influence of hydrophobicity distribution of particle mixtures on emulsion stabilization. J. Colloid Interface Sci. 2017, 491, 179–189. [Google Scholar] [CrossRef]
  21. Sztukowski, D.M.; Yarranton, H.W. Oilfield solids and water-in-oil emulsion stability. J. Colloid Interface Sci. 2005, 285, 821–833. [Google Scholar] [CrossRef]
  22. Sullivan, A.P.; Kilpatrick, P.K. The effects of inorganic solid particles on water and crude oil emulsion stability. Ind. Eng. Chem. Res. 2002, 4, 3389–3404. [Google Scholar] [CrossRef]
  23. Sparks, B.; Kotlyar, L.; O’Carroll, J.; Chung, K. Athabasca oil sands: Effect of organic coated solids on bitumen recovery and quality. J. Pet. Sci. Eng. 2003, 39, 417–430. [Google Scholar] [CrossRef]
  24. Bensebaa, F.; Kotlyar, L.S.; Sparks, B.D.; Chung, K.H. Organic coated solids in Athabasca bitumen: Characterization and process implications. Can. J. Chem. Eng. 2000, 78, 610–616. [Google Scholar] [CrossRef] [Green Version]
  25. Couillard, M.; Mercier, P.H.J. Analytical electron microscopy of carbon-rich mineral aggregates in solvent-diluted bitumen products from mined Alberta oil sands. Energy Fuels 2016, 30, 5513–5524. [Google Scholar] [CrossRef] [Green Version]
  26. Chen, Q.; Liu, J.; Thundat, T.; Gray, M.R.; Liu, Q. Spatially resolved organic coating on clay minerals in bitumen froth revealed by atomic force microscopy adhesion mapping. Fuel 2017, 191, 283–289. [Google Scholar] [CrossRef]
  27. Omotoso, O.; Mikula, R.; Urquhart, S.; Sulimma, H.; Stephens, P. Characterization of clays from poorly processing oil sands using synchrotron techniques. Clay Science 2006, 12, 88–93. [Google Scholar]
  28. Kotlyar, L.S.; Sparks, B.D.; Kodama, H. Isolation of inorganic matter-humic complexes from Athabasca oil sands. AOSTRA J. Res. 1985, 2, 103–111. [Google Scholar]
  29. Kotlyar, L.; Kodama, H.; Sparks, B.; Grattan-Bellew, P. Non-crystalline inorganic matter-humic complexes in Athabasca oil sand and their relationship to bitumen recovery. Appl. Clay Sci. 1987, 2, 253–271. [Google Scholar] [CrossRef]
  30. Majid, A.; Sparks, B.D.; Ripmeester, J.A. Characterization of solvent-insoluble organic matter isolated from Alberta oil sands. Fuel 1991, 70, 78–83. [Google Scholar] [CrossRef] [Green Version]
  31. Dongbao, F.; Woods, J.R.; Kung, J.; Kingston, D.M.; Kotlyar, L.S.; Sparks, B.D.; Mercier, P.H.J.; McCracken, T.; Ng, S. Residual organic matter associated with toluene-extracted oil sands solids and its potential role in bitumen recovery via adsorption onto clay minerals. Energy Fuels 2010, 24, 2249–2256. [Google Scholar] [CrossRef] [Green Version]
  32. Mercier, P.H.J.; Tyo, D.D.; Zborowski, A.; Kung, J.; Patarachao, B.; Kingston, D.M.; Couillard, M.; Robertson, G.; McCracken, T.; Ng, S. First quantification of <2 μm clay, <0.2 μm ultrafines and solids wettability in process streams from naphthenic froth treatment plant at commercial mined oil sands operations. Fuel 2019, 237, 961–976. [Google Scholar] [CrossRef]
  33. Mercier, P.H.J.; Omotoso, O.; Hockley, D. Oil-sands Clays. In Introduction to Oil Sands Clays; Omotoso, O., Hockley, D., Eds.; CMS Workshop Lectures; The Clay Minerals Society: Chantilly, VA, USA, 2018; Volume 2, pp. 9–32. [Google Scholar]
  34. Kotlyar, L.S.; Sparks, B.D.; Kodama, H. Properties of fines size fractions in relation to the distribution of humic-Inorganic matter complexes in Athabasca oil sands. AOSTRA J. Res. 1988, 4, 277–285. [Google Scholar]
  35. Mercier, P.H.J.; Patarachao, B.; Kung, J.; Dongbao, F.; Kingston, D.M.; Le Page, Y.; Sparks, B.D.; Kotlyar, L.S.; Woods, J.R.; Toll, F.; et al. Novel mineralogical quantitative phase analysis methodology applied to Canadian oil sands for ore characterization, processability prediction and optimization of froth treatment technologies. In Proceedings of the 20th General Meeting of International Mineralogical Association, Budapest, Hungary, 21–27 August 2010. [Google Scholar]
  36. Mercier, P.H.J.; Patarachao, B.; Kingston, D.M.; Tyo, D.D.; Kung, J.; Le Page, Y.; Woods, J.R.; Sparks, B.D.; Kotlyar, L.S.; Toll, F.; et al. Novel mineralogical quantitative phase analysis of fines in oil sands. In Proceedings of the Oilsands 2011 Conference, Edmonton, Alberta, 22–24 February 2011. [Google Scholar]
  37. Williams, R.C. A method of freeze-drying for electron microscopy. Exp. Cell Res. 1953, 4, 188–201. [Google Scholar] [CrossRef]
  38. Couillard, M.; Radtke, G.; Botton, G.A. Strain fields around dislocation arrays in a Σ9 silicon bicrystal measured by scanning transmission electron microscopy. Philos. Mag. 2013, 93, 1250–1267. [Google Scholar] [CrossRef] [Green Version]
  39. Couillard, M.; Radtke, G.; Knights, A.P.; Botton, G.A. Three-dimensional atomic structure of metastable nanoclusters in doped semiconductors. Phys. Rev. Lett. 2011, 107, 186104. [Google Scholar] [CrossRef]
  40. Williams, D.B.; Carter, C.B. Transmission Electron Microscopy; Plenum: New York, NY, USA, 1996. [Google Scholar]
  41. Srodon, J.; Morgan, D.J.; Eslinger, E.V.; Eberl, D.D.; Karlinger, M.R. Chemistry of illite/smectite and end-member illite. Clays Clay Miner. 1986, 34, 368–378. [Google Scholar] [CrossRef]
Figure 1. SEM images of the sub-2 µm total clay fraction of the contaminant solids (a,b).
Minerals 10 01040 g001
Figure 2. TEM images of the sub-2 µm total clay fraction of the contaminant solids. (a) Low magnification image showing two types of clay aggregates (A and B, see text), (b) Higher magnification image showing face-to-face stacking of clay mineral platelets and the presence of metal oxide nanoparticles dispersed on the clay mineral surfaces.
Minerals 10 01040 g002
Figure 3. (a) ADF-STEM images, (b) spatially-resolved EDX spectra of the sub-2 µm total clay fraction of the contaminant solids. The locations for the EDX spectra in (b) are labelled in (a).
Minerals 10 01040 g003
Figure 4. X-ray diffraction powder patterns measured for (a) separated sub-200 nm ultrafines fraction, compared to those obtained for (b) biwettable and (c) hydrophilic coarse clays (0.2–2 µm), and (d) total clays (<2 µm).
Minerals 10 01040 g004
Figure 5. (a) High-resolution ADF-STEM image and (b) EELS elemental map for three elements (C, Ti, and O) acquired on sub-200 nm ultrafines fraction of contaminant solids. The EELS map shown in (b) is taken from the region identified by the white rectangle in (a). The RGB contrast consists of: red = carbon, green = titanium, and blue = oxygen.
Minerals 10 01040 g005
Figure 6. TEM images of (a,b) biwettable and (c,d) hydrophilic coarse clay aggregates at different magnifications.
Minerals 10 01040 g006
Figure 7. Low magnification TEM images of (ac) biwettable and (df) hydrophilic coarse clay aggregates. The specimens were prepared using a freeze-dry method (see text).
Minerals 10 01040 g007
Figure 8. High-resolution ADF-STEM images and EELS elemental maps for three elements (C, Fe, and O) acquired on (a) biwettable and (b) hydrophilic <200 nm clay platelets. The RGB contrast consists of: red = carbon, green = iron, and blue = oxygen.
Minerals 10 01040 g008
Table 1. List of mineral and amorphous phases included for determination of mineralogical composition using SVD-QPA methodology [25,35,36]. The term “amorphous” refers to poorly-crystalline or finely-dispersed phases not discernable in XRD powder patterns. As illite-smectite interstratification is known to occur in oil sands [33], we then identify the corresponding phase as “illite-smectite”; however, not knowing its chemical formulae, we assumed here a pure illite nominal stoichiometry for performing quantitative phase analysis.
PhasesAbbreviationChemical Formula
mineral phases
QuartzQTZSiO2
ApatiteAPACa5(PO4)3(OH)
Clay mineralsCLAY
Illite-smectiteILLK0.8Al2.8Si3.2O10(OH)2
KaoliniteKAOAl2Si2O5(OH)4
ChloriteCHLMg2.5Fe2.5Al2Si3O10(OH)8
Ca-Mg CarbonatesCBNT
calciteCALCaCO3
dolomiteDOLCaMg(CO3)2
ankeriteANKCaFe2/3Mg1/3(CO3)2
Heavy mineralsHEAVY
SideriteSIDFeCO3
PyritePYRFeS2
ZirconZIRZrSiO4
RutileRUTTiO2
AnataseANATiO2
IlmeniteILMFeTiO3
LepidocrociteLEPFeO(OH)
Calcium sulphates and salts
GypsumGYPCaSO4· 2 H2O
BassaniteBASCaSO4· 0.5 H2O
HaliteHALNaCl
Feldspars
AnorthiteANOCaAl2Si2O8
SanidineSANKAlSi3O8
amorphous phases
Organic carbonORCC
SilicaSILSiO2
Amorphous iron oxide-hydroxideAFEFe(OH)3 or FeO(OH)·H2O
Table 2. Elemental and mineralogical compositions determined for total clays (<2 µm solids) and hydrophilic and biwettable coarse clays (0.2–2 µm solids) separated from typical commercial oil sands bitumen froth. (See notes at bottom of table for explanations of the various acronyms used and data reported).
PhasesPhase Concentrations (wt %)
Total ClaysHydrophilic Coarse ClaysBiwettable Coarse Clays
conc.s.u.conc.s.u.conc.s.u.
QTZ+SIL10.81080.035013.16750.03453.20650.0346
ILL22.98280.021125.60170.02149.08820.0220
KAO37.38810.084746.96590.090811.30170.0885
CHL1.42140.06870.08040.00025.41990.0728
DOL+CAL+ANK5.27611.51144.55241.49620.03340.0001
SID+AFE1.12621.28291.99741.242810.96640.03094
PYR5.29361.50960.78170.01447.23090.0262
ZIR0.04020.00040.01430.00070.20090.0004
RUT0.69940.19930.42380.28861.54570.3003
ANA0.51780.19930.59270.28862.30630.3003
ILM0.00160.00020.00130.00010.00420.0003
LEP0.00210.00020.00050.00000.00400.0002
GYP0.03540.0059−0.00210.00712.10350.0084
BAS0.00040.00000.00860.00692.55180.0149
ANO0.00040.00000.00050.00000.00200.0003
SAN0.00040.00000.00050.00000.00290.0005
ORC6.65830.48343.57240.463627.40310.0654
APA1.02640.00410.91030.00402.64860.0057
HAL5.51640.00061.33360.00161.93200.0006
Clay minerals61.79230.077072.64800.040725.80970.0814
Total accounted97.28420.0564100.0030.000287.9520.055
Element concentrations (wt %)
Elementsmeas. s.u.recalc.meas.recalc.meas.recalc.meas.
Na0.102.17002.170.52460.530.76000.76
K0.041.84001.842.04962.050.72800.73
Si0.2218.670018.6722.276022.396.80006.80
Al0.1712.380212.3814.774614.914.58124.56
Fe0.272.84002.842.02842.1310.020010.02
Mg0.050.83730.840.65050.710.52090.76
Ca0.221.30061.300.78880.832.26022.26
Ti0.0320.73000.730.60960.612.31002.31
Zr0.0450.02000.020.00710.010.10000.10
P0.010.18990.190.16840.170.49000.49
C0.17.67007.674.16694.2228.110028.11
S0.12.02742.030.41930.434.82064.82
Notes: wt % = weight percent; conc. = concentration; s.u. = standard uncertainty; meas. = measured; recalc. = recalculated. The recalculated elemental composition is obtained from the mineralogical composition determined using SVD-QPA methodology.
Table 3. Elemental and mineralogical compositions determined for ultrafines (<0.2 µm solids) separated from typical commercial oil sands bitumen froth (acronyms used and data reported as per Table 2). The term “amorphous” refers to poorly-crystalline or finely-dispersed phases not discernable in XRD powder patterns. Again, as illite-smectite interstratification is known to occur in oil sands [33], we then identify the corresponding phase as “illite-smectite”; however, not knowing its chemical formulae, we assumed here pure illitic nominal stoichiometries for performing quantitative phase analysis.
PhasesChemical formulaPhase concentrations (wt %)
conc.s.u.conc.s.u.conc.s.u.conc.s.u.
Illite-smectiteK0.8Al2.8Si3.2O10(OH)228.97860.0053------------------
K0.6Al2.6Si3.4O10(OH)2 37.88560.0089------------
K0.4Al2.4Si3.6O10(OH)2 55.69690.0189------
K0.3Al2.3Si3.7O10(OH)2------------------72.70500.0287
KaoliniteAl2Si2O5(OH)432.13260.013625.75100.015812.98990.02250.27120.0320
Organic carbonC8.76000.00258.76000.00258.76000.00258.76000.0025
Amorphous iron oxide-hydroxideFe(OH)3 or FeO(OH)·H2O6.44110.03006.44110.03006.44110.03006.44110.0300
Ionic FeFe0.64410.01510.64410.01510.64410.01510.64410.0151
Ionic CaCa0.85000.00070.85000.00070.85000.00070.85000.0007
Ionic MgMg0.90000.00010.90000.00010.90000.00010.90000.0001
Ionic NaNa0.51000.00010.51000.00010.51000.00010.51000.0001
Ionic SO4SO42.06720.02242.06720.02242.06720.02242.06720.0224
Ionic PO4PO40.61320.00000.61320.00000.61320.00000.61320.0000
Amorphous TiO2TiO20.467180.000010.467180.000010.467180.000010.467180.00001
Amorphous zirconZrSiO40.040190.000020.040190.000020.040190.000020.039440.00002
Amorphous silicaSiO213.81270.007310.84190.00724.90100.0075------
Total accounted96.21680.039895.77140.039894.88070.039894.26840.0392
Element concentrations (wt %)
Elementsmeas.meas. s.u.recalc. recalc. recalc. recalc.
Na0.510.100.51000.51000.51000.5100
K2.320.042.31992.31982.31972.2942
Si20.120.2220.120020.120020.120020.3906
Al12.320.1712.320012.320012.320012.1948
Fe4.010.274.01004.01004.01004.0100
Mg0.900.050.90000.90000.90000.9000
Ca0.850.220.85000.85000.85000.8500
Ti0.2800.0320.28000.28000.28000.2800
Zr0.0200.0450.02000.02000.02000.0196
P0.200.010.20000.20000.20000.2000
C8.760.18.76008.76008.76008.7600
S0.690.10.69000.69000.69000.6900
Publisher’s Note: MDPI stays neutral with regard to jurisdictional claims in published maps and institutional affiliations.

