1. Introduction
Maintenance is attaining a more important role in organisations because it can affect productivity and profitability [
1,
2,
3], the useful lifespan of the facilities, the quality of the processes [
4] and the fulfilment of safety and environmental standards. This has brought about increasing concern over the performance maintenance measurement [
5], as shown by the abundant literature that analyses the matter (see [
6,
7,
8,
9,
10,
11,
12,
13,
14,
15,
16,
17]).
Different countries carry out surveys through their national maintenance associations. In the case of Spain, the Spanish Maintenance Association (SMA) carries out surveys every five years; these suggest how maintenance can contribute to improvement in the most immediate weaknesses of the Spanish productive sector, such as the lack of competitiveness and innovation [
18]. Other results from Spanish companies can be consulted in Conde [
19] and Álvarez [
20] in the chemical industry, and in Paredes [
21] in manufacturing. Although these national surveys intended to promote continuous improvement via benchmarking are applied extensively in the United States, Canada and New Zealand, in Spain its application has hardly begun [
22].
The literature analyses maintenance in a country mainly based on a set of KPIs, which are held to be of equal importance; however, some KPIs influence the competitiveness of a company while other only have slight implications for cost. A multicriteria model, then, allows for a more accurate assessment of the real situation in applied maintenance. Via a multicriteria model it is possible to obtain a grade for the overall state of maintenance, and for each criterion analysed. This shows the development over time of applied maintenance, the criteria with the highest valuation and those where there are deficiencies. Also, as described in Komonen [
23], the benchmarking procedure generally applied is the comparison of mean values of different indicators for a specific company with those of its industrial sector; however, in the area of maintenance this type of benchmarking is of little use [
23,
24]. Although maintenance benchmarking is recognised as a key element in achieving world-class maintenance performance levels [
25] and for the continuous improvement process [
26], only 11% of the literature reviewed by Simões et al. [
27] relates benchmarking to maintenance performance measurement.
There are very few precedents that build a model or framework to analyse maintenance performance or practices by means of indicators. Among these, Macchi and Fumagalli [
28] develop a scoring method for maturity assessment with five levels for evaluating maintenance practices in organisations and to improve the maintenance management system. On the same lines, Nachtmann et al. [
29] describe using a balanced scorecard for flight line maintenance activities in the U.S. Air Force. Van Horenbeek and Pintelon [
30] set out a maintenance performance measurement framework using the analytic network process (ANP) to assist maintenance managers in their choice of the relevant maintenance performance indicators. The model has been applied to five companies of different types. Muchiri et al. [
31] propose a framework for assessing and ranking maintenance practices. The framework comprises five-level evaluation criteria qua maintenance practices in any company with a maintenance department to be ranked, and the results compared with others.
In the fuzzy environment, the number of contributions is even more restricted. Carnero [
32] describes a fuzzy multicriteria model by which maintenance benchmarking can be applied among small businesses. Stefanovic et al. [
33] use fuzzy sets and genetic algorithms to design a model for ranking and optimisation of maintenance performance indicators in small and medium enterprises. There is, however, no model that analyses, via a multicriteria model in a fuzzy environment, the evolution of the state of maintenance before and after recession in a country.
Kubler et al. [
34], in their literature review of FAHP applications, concluded that it was predominantly applied in the areas of selection and evaluation and in the categories of manufacturing, industry and government. It was also seen that a large number of studies combine FAHP with other tools, mostly with Technique for Order of Preference by Similarity to Ideal Solution (TOPSIS), Quality Function Deployment (QFD) and Analytic Network Process (ANP). This can be justified by the natural flexibility of FAHP that enables it to be combined with a wide range of techniques and for very different purposes. However, this survey does not cover studies combining fuzzy analytic hierarchy process (FAHP) and Multi-Attribute Utility Theory (MAUT). Similar results can be seen in other multicriteria literature reviews carried out in the field of applications for solving energy management problems [
35], or aging-dam management [
36]. There are, therefore, very few precedents in the literature combining FAHP and MAUT. Among those that do exist are the following: Ashour and Okudan [
37] developed a triage algorithm that integrates FAHP and MAUT to rank the waiting emergency department patients according to their characteristics: chief complaint, gender, age, pain level and vital signs (temperature, breathing rate, pulse and blood pressure). The intuitive judgement and preferences of triage nurses have to be considered in this decision and therefore there are uncertainties involved; this is the reason that utility theory has been selected [
38]. A single utility function has been constructed for each criterion taking into account the risk attitude of the triage nurse for each attribute. The exponential distribution has been used, as the best for this approach, and multiplicative forms are applied to aggregate the single utility functions. In a latter study, Ashour and Okudan [
39] compared two triage systems using Discrete Event Simulation (DES): the typical Emergency Severity Index (ESI) and the proposed algorithm integrating FAHP and MAUT. As a result, it is seen that the FAHP-MAUT algorithm performs better in terms of minimizing the number of patients with longer than the allotted upper limits of waiting times, but it also reduces potential bias and errors in decision making in clinical settings. Johal and Sandhu [
40] constructed utility functions associated with the attributes: bandwidth, security, monetary cost and power consumption levels of the candidate network available for handover. The proposed algorithm uses FAHP to assign weights to the attributes and applies the utility functions to rank the alternatives using a simple weighted sum of the parameters with the objective of the level of satisfaction served by each network. With the same objective, Goyal et al. [
41] designed parameterised utility functions to model the different quality of service attributes, but in this case the network selection process considers three different applications: voice, video, and best-effort applications. Different attributes are considered depending on the application. To avoid the problems in obtaining weights caused by Chang’s extent analysis method, a min-max optimisation problem is presented to derive consistent weights. Final ranking is calculated with Simple Additive Weighting (SAW), TOPSIS and Multiplicative Exponential Weighting (MEW) methods. The results show that the utility-based MEW method gives more suitable final scores for each network than the utility based SAW and TOPSIS methods.
In [
42] a model is designed to apply benchmarking in large buildings integrating FAHP and MAUT. The maintenance department of a hospital and a department store were compared, with the results obtained from the building sector in the case of more than 500 workers for the years 2000, 2005 and 2010. This research used 50 subcriteria; however, some of them do not provide relevant information about the state of a maintenance department because they are related to the maintenance manager’s opinion about future trends in maintenance costs, outsourcing, collaboration of production workers, etc. These opinions can be applied or not in the future, but they are not considered to be relevant attributes in this model. Chang’s extent analysis method has been applied and the fuzzy scale used to make judgements has six values of preference. This led to problems in the process of obtaining judgements from the decision makers, since the preferences were very close. In the case of [
38,
39] only five fuzzy number for linguistic variables have been used.
Kubler et al. [
34] note in their survey that Chang’s extent analysis method is the most popular methodology in spite of a number of criticisms in recent years. Criticisms relate to the appearance of irrational zero weights and the fact that important criteria could not be considered in the decision-making process [
43]. Therefore, the relative importance of criteria or alternatives is not calculated appropriately, which may lead to poor robustness, unreasonable priorities and information loss in the models. The research presented in this paper applies the geometric-mean method suggested by Buckley [
44], because of its ease of application and comprehension in comparison with other methods [
45] and it provides a unique solution to the reciprocal comparison matrix [
46], avoiding the criticisms applicable to Chang’s extent analysis. It also uses a different means of obtaining the utility functions from the previous literature. That is because the utility functions are associated to attributes with constructed descriptors that have from two to ten qualitative scale levels, depending on the attribute. The data available via surveys of maintenance questions allow a probability to be associated with each scale level of a descriptor. MAUT [
47] allows scores to be turned into utility functions if the sum of the weighting is unity. Therefore, this research does not use a decision maker to find the probability value such that there is no difference between two choices, as for example in [
38] since the probabilities are calculated from the surveys. In these cases, the utility function is constructed form the mean value and in the current study the full data are used, without mean values.
Future trends in applying FAHP are related to [
34]:
- (a)
Comparing existing fuzzy pairwise comparison matrix weighting derivation methods with regard to efficiency and ease of use.
- (b)
Verifying mathematically that FAHP improves the results provided by AHP.
- (c)
FAHP could be combined with other pre-structure planning methods, such as Delphi, to identify all the relevant decision criteria to solve complex problems. All in an easy-to-use framework.
There is also a clear trend towards a hybridisation process, combining two or more Multi-Criteria Decision-Making methods, and, a fuzzification of these same models [
36]. This study is framed within both trends.
This article describes a multicriteria model that applies the analytic hierarchy process (AHP), fuzzy analytic hierarchy process (FAHP) and Multi-Attribute Utility Theory (MAUT) to assess the state of maintenance in Spain. FAHP allows weightings for criteria and subcriteria, and a hierarchy, to be obtained. The weightings are turned into utility functions that permit the final utility of an alternative to be calculated by a Multi-Measure Utility Function. From the data on the state of maintenance in Spain for different industrial sectors in the years 2005 and 2010, 2400 discrete probability distributions were derived. These distributions determine the behaviour of a sector with respect to a subcriterion. Finally, a Monte Carlo simulation is applied to estimate the uncertainty of a complex function resulting from several probability distributions. In this way, the level of excellence in applied maintenance in Spain has been determined, before and after the recession. Asymmetries in performance between different activity sectors have been identified, all analysed by different company sizes: up to 200 workers, from 201 to 500 workers, and over 500 workers. This, then, is the first multicriteria model used to assess the state of maintenance in a country.
The original contributions of this research are:
- (1)
An assessment of maintenance performance before and after the recession. There are no previous research studies that analyse this question.
- (2)
The prior assessment is carried out in 10 activity sectors and in large, medium and small enterprises in Spain. Therefore, the large number of scenarios used allows results and conclusions to be obtained with great precision and in great detail.
- (3)
The model constructed integrates AHP, FAHP and MAUT multicriteria techniques, guaranteeing that the criteria and subcriteria are relevant for maintenance assessment of companies. The Buckley method has been used instead of Chang’s extent analysis method to guarantee that priorities obtained are accurate and to avoid loss of information in the results.
- (4)
The model proposed uses the complete data from surveys about maintenance in Spain, rather than using mean values by activity sector or size of enterprise, as in the remaining studies about maintenance in other countries.
This article is structured as follows.
Section 2 reviews the state of maintenance in different countries.
Section 3 presents the FAHP methodology applied in this study.
Section 4 describes the fuzzy multicriteria model to evaluate the maintenance performance in Spanish industries.
Section 5 shows the results of the application of the model by company sizes in the years 2005 and 2010.
Section 6 presents the discussion.
2. Related Work
There are studies that analyse the state of maintenance in different countries. These show the deficiencies that exist in, for example, Saudi Arabia, where there is a lack of application of scientific principles in using real management support for maintenance departments, optimizing spare part provision, introducing computers into the maintenance systems and improving control of maintenance tasks by applying working orders and report production [
48]. Later, Assaf et al. [
49] analyse the efficiency of maintenance units in petrochemical companies in Saudi Arabia. They do this with three indicators and data envelopment analysis (DEA) approach that has enabled low- and high-performance maintenance units to be characterised. Jonsson [
50] and Alsyouf [
51], in their analysis of the state of maintenance management in companies in Sweden show the limited recognition that the function of maintenance receives. In Swedish companies, maintenance is seen as a source of expense, a third of maintenance time is spent on unplanned tasks, and there are deficiencies in the application of Total Productive Maintenance (TPM) or Reliability Centred Maintenance (RCM) and inefficiencies in the planning and programming of maintenance, which makes it harder to reach the set goals and so obtain a competitive advantage. Companies in Denmark, Norway, Sweden and Finland show deficiencies in maintenance resources, with a tendency to operate in the short term as opposed to considering the long-term planning of activity, and a lack of integration between corporate strategy and maintenance systems, and between production and maintenance departments [
52]; while studies exclusively in Norwegian organisations show that the percentage of applied maintenance time is still around 40%, with functional maintenance at 62.3% and functional development (which includes development of new systems and functional perfective maintenance) at 37.7% [
53]. The maintenance culture in a Nordic nuclear power plant has also been analysed, measuring perceived values, psychological characteristics of the job, individual conceptions of work and the organisation and perceptions of maintenance tasks [
54]. In Belgian and Dutch companies, it is seen that companies with different competitive priorities apply different maintenance strategies and that the most competitive apply more preventive and predictive maintenance policies, better planning and control systems and decentralised maintenance organisation structures when compared to the others [
55]. The use of Key Performance Indicators (KPI) in Belgian industries is analysed in Muchiri et al. [
56], which shows that equipment, maintenance cost and safety performance are the most commonly used indicators, while those related to maintenance work are less widely used; also, there is no correlation between the established maintenance objectives and the KPIs used, and in very few cases are the results of the KPIs used in decision making. It is precisely the effective use of KPIs, the use of predictive and proactive maintenance, TPM and RCM, with little corrective maintenance and applying high operational involvement in autonomous maintenance for root cause analysis, which most significantly determines an effective maintenance management programme among manufacturing companies in the United Kingdom [
57]. Forty percent of these companies apply good maintenance and are aware of the benefits it brings; also, on average U.K. companies apply some good maintenance practices and obtain advantages from them, but they still need to carry out improvements. In U.S. companies, it was found that there was no correlation between the structure of an organisation and the application of advanced maintenance methods, the wider application of technical methods such as vibration analysis, lubricants, etc., as opposed to methods that require the use of personnel, such as RCM, and deficiencies were also found in the planning and programming of maintenance [
58]. Related to RCM, Reliabilityweb [
59] shows the results obtained for the application of RCM, among which is that only 18.30% of the 601 companies surveyed completed a project to introduce this policy and obtained the expected results. Wireman [
60,
61] shows in detail how maintenance in the USA has evolved, giving performances of low range, high range and best practice in maintenance cost, maintenance labour cost, work order coverage, preventive maintenance compliance, stores investment, productivity rates, etc. The survey carried out by Tse [
62] in 21 companies in Hong Kong shows that corrective and preventive maintenance are most common, while there is a lack of advanced maintenance practices; also, in general, investment in maintenance is much lower than the assets of the company and the profits obtained. This situation is also found in medium-sized and large enterprises in Brazil, among which there is a need to reduce corrective maintenance, increase well-planned maintenance and introduce more predictive maintenance and RCM to gain competitive advantage [
63]. The situation in the maquiladora industry in Mexico is even worse, with a tendency to reactive maintenance, while preventive and predictive maintenance are not found in most of the companies surveyed [
64]. Modgil and Sharma [
65] analyse the impact of TPM and total quality management (TQM) on operational performance in Indian pharmaceutical plants. It is seen that TPM practices have a significant impact on plant-level operational performance, R&D, product innovation and technology management. TQM, on the other hand, gives significant support to a TPM programme. They show TPM assists in reducing the cost of quality through reduced scrap and fewer defective products. In Muchiri et al. [
66] a global evaluation index is obtained for the level of maintenance practices carried out by Kenyan companies. The results are that processes are partially planned, and performance depends on the operators’ competence and experience.
3. Fuzzy Analytic Hierarchy Process
Fuzzy numbers are usually used to capture the ambiguity, fuzziness or imprecision of the parameters related to the topic [
67] and, decision makers usually feel more confident in giving interval judgements rather than fixed value judgements [
68].
The model proposed in this research uses FAHP. represents a fuzzified reciprocal n-by-n judgment matrix con the pairwise comparisons between the element i and j .
A triangular fuzzy number
is defined on
by the membership function
[
69]
With . l and u are the lower and upper bounds of the fuzzy number and m the modal value. If then it is considered a crisp number by convention.
The operational laws for two triangular fuzzy numbers
and
are the following [
69,
70,
71]:
There are different fuzzy AHP methods, a description of which can be found in [
46,
72]. However, this paper will apply the geometric mean method suggested by Buckley [
44], because of its ease of application and comprehension in comparison with other methods [
44] and it provides a unique solution to the reciprocal comparison matrix [
46].
To calculate the fuzzy weights of each criterion/subcriterion is applied [
43,
73]:
Then the
must be defuzzified. Defuzzification is an inverse transformation that maps the output from the fuzzy domain back onto the crisp domain. This is done through a centroid method [
74,
75]:
The Consistency Index (
CI) is used as a measurement of the consistency of the judgements expressed [
76]:
The consistency ratio (RC) is defined as the quotient of the consistency index and the random consistency index (ICR) for a matrix of similar size [
77]. The judgements given are considered consistent if the RC is lower than 5% for a 3 × 3 matrix, 9% for a 4 × 4 matrix and 10% for larger matrices. To calculate the
CI with fuzzy numbers the central value of
λmax will be used because in the symmetry of a fuzzy number, the central value corresponds to the centroid of the triangular area [
78].
The FAHP-derived model is now described.
4. The Proposed Model
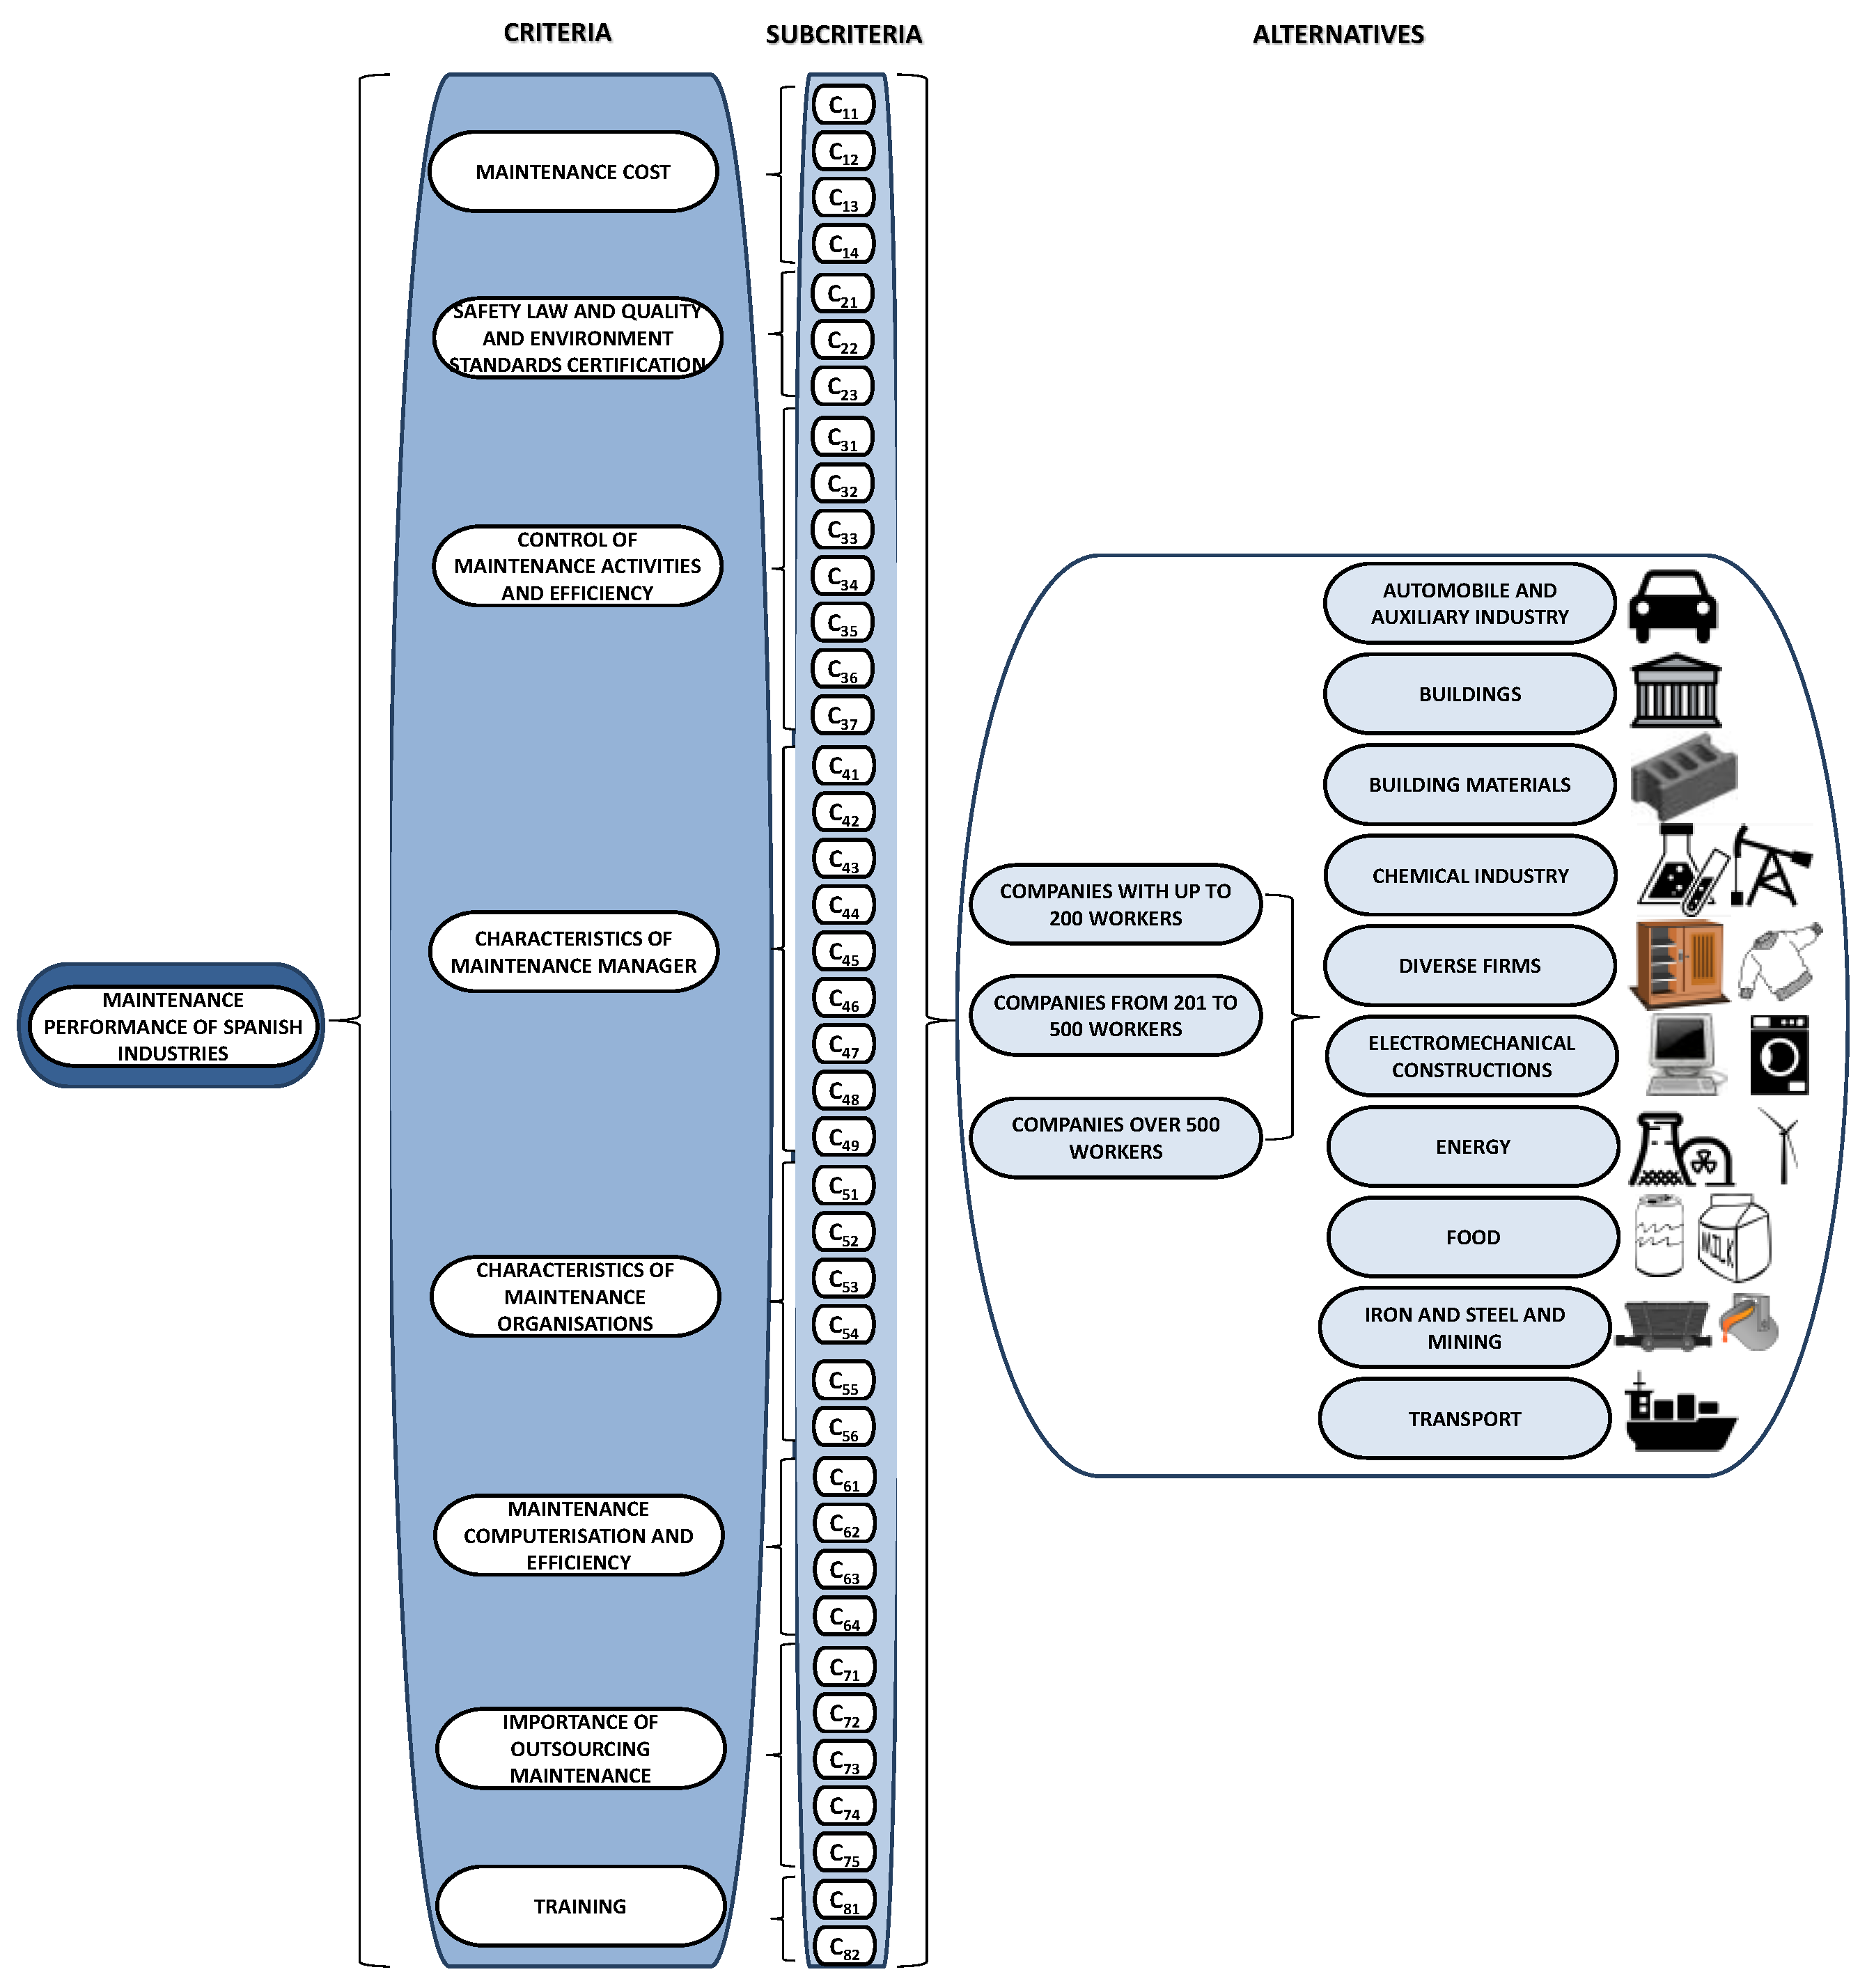
4.1. Description
From surveys carried out by the Spanish Maintenance Association a model structuring process has been developed in eight criteria: quality, environment and safety standards, maintenance organisation, maintenance cost, outsourcing maintenance, control, maintenance computerisation, training and maintenance management. Within each criterion there are a number of subcriteria. There is an associated descriptor for each subcriterion.
The weighting process uses FAHP to get the weightings for the criteria and subcriteria, from the judgements of two experts in maintenance. Fuzzy numbers were used to assign weightings to the criteria and subcriteria. To get the fuzzy numbers, two experts in maintenance were used as decision makers; these experts have approximately twenty years of experience in maintenance and knowledge of different sectors. The decision makers were asked to assess the importance of the criteria and subcriteria applying the triangular number scale set out in
Table 1.
AHP has been used to obtain the weightings between the levels of each descriptor. These weightings have been transformed to convert measure levels to utilities because measure levels are based on scales with different units, so before they can be combined they are converted to common scales with a range from 0 to 1. The utility of the preferred alternative of a criterion is 1 and the level for the least preferred alternative is 0.
To define the alternatives the probabilities of appearance of each of the scale measure levels is calculated, for each descriptor and each industrial sector; this used answers given in the 2005 and 2010 SMA surveys for different activity sectors. Because of the economic recession the survey was not carried out in 2015. The data used, therefore, are from 2005 to 2010. These probabilities are used to build discrete probability distributions for each descriptor. A discrete distribution has probabilities defined for several different levels so that the probabilities add up to 1.
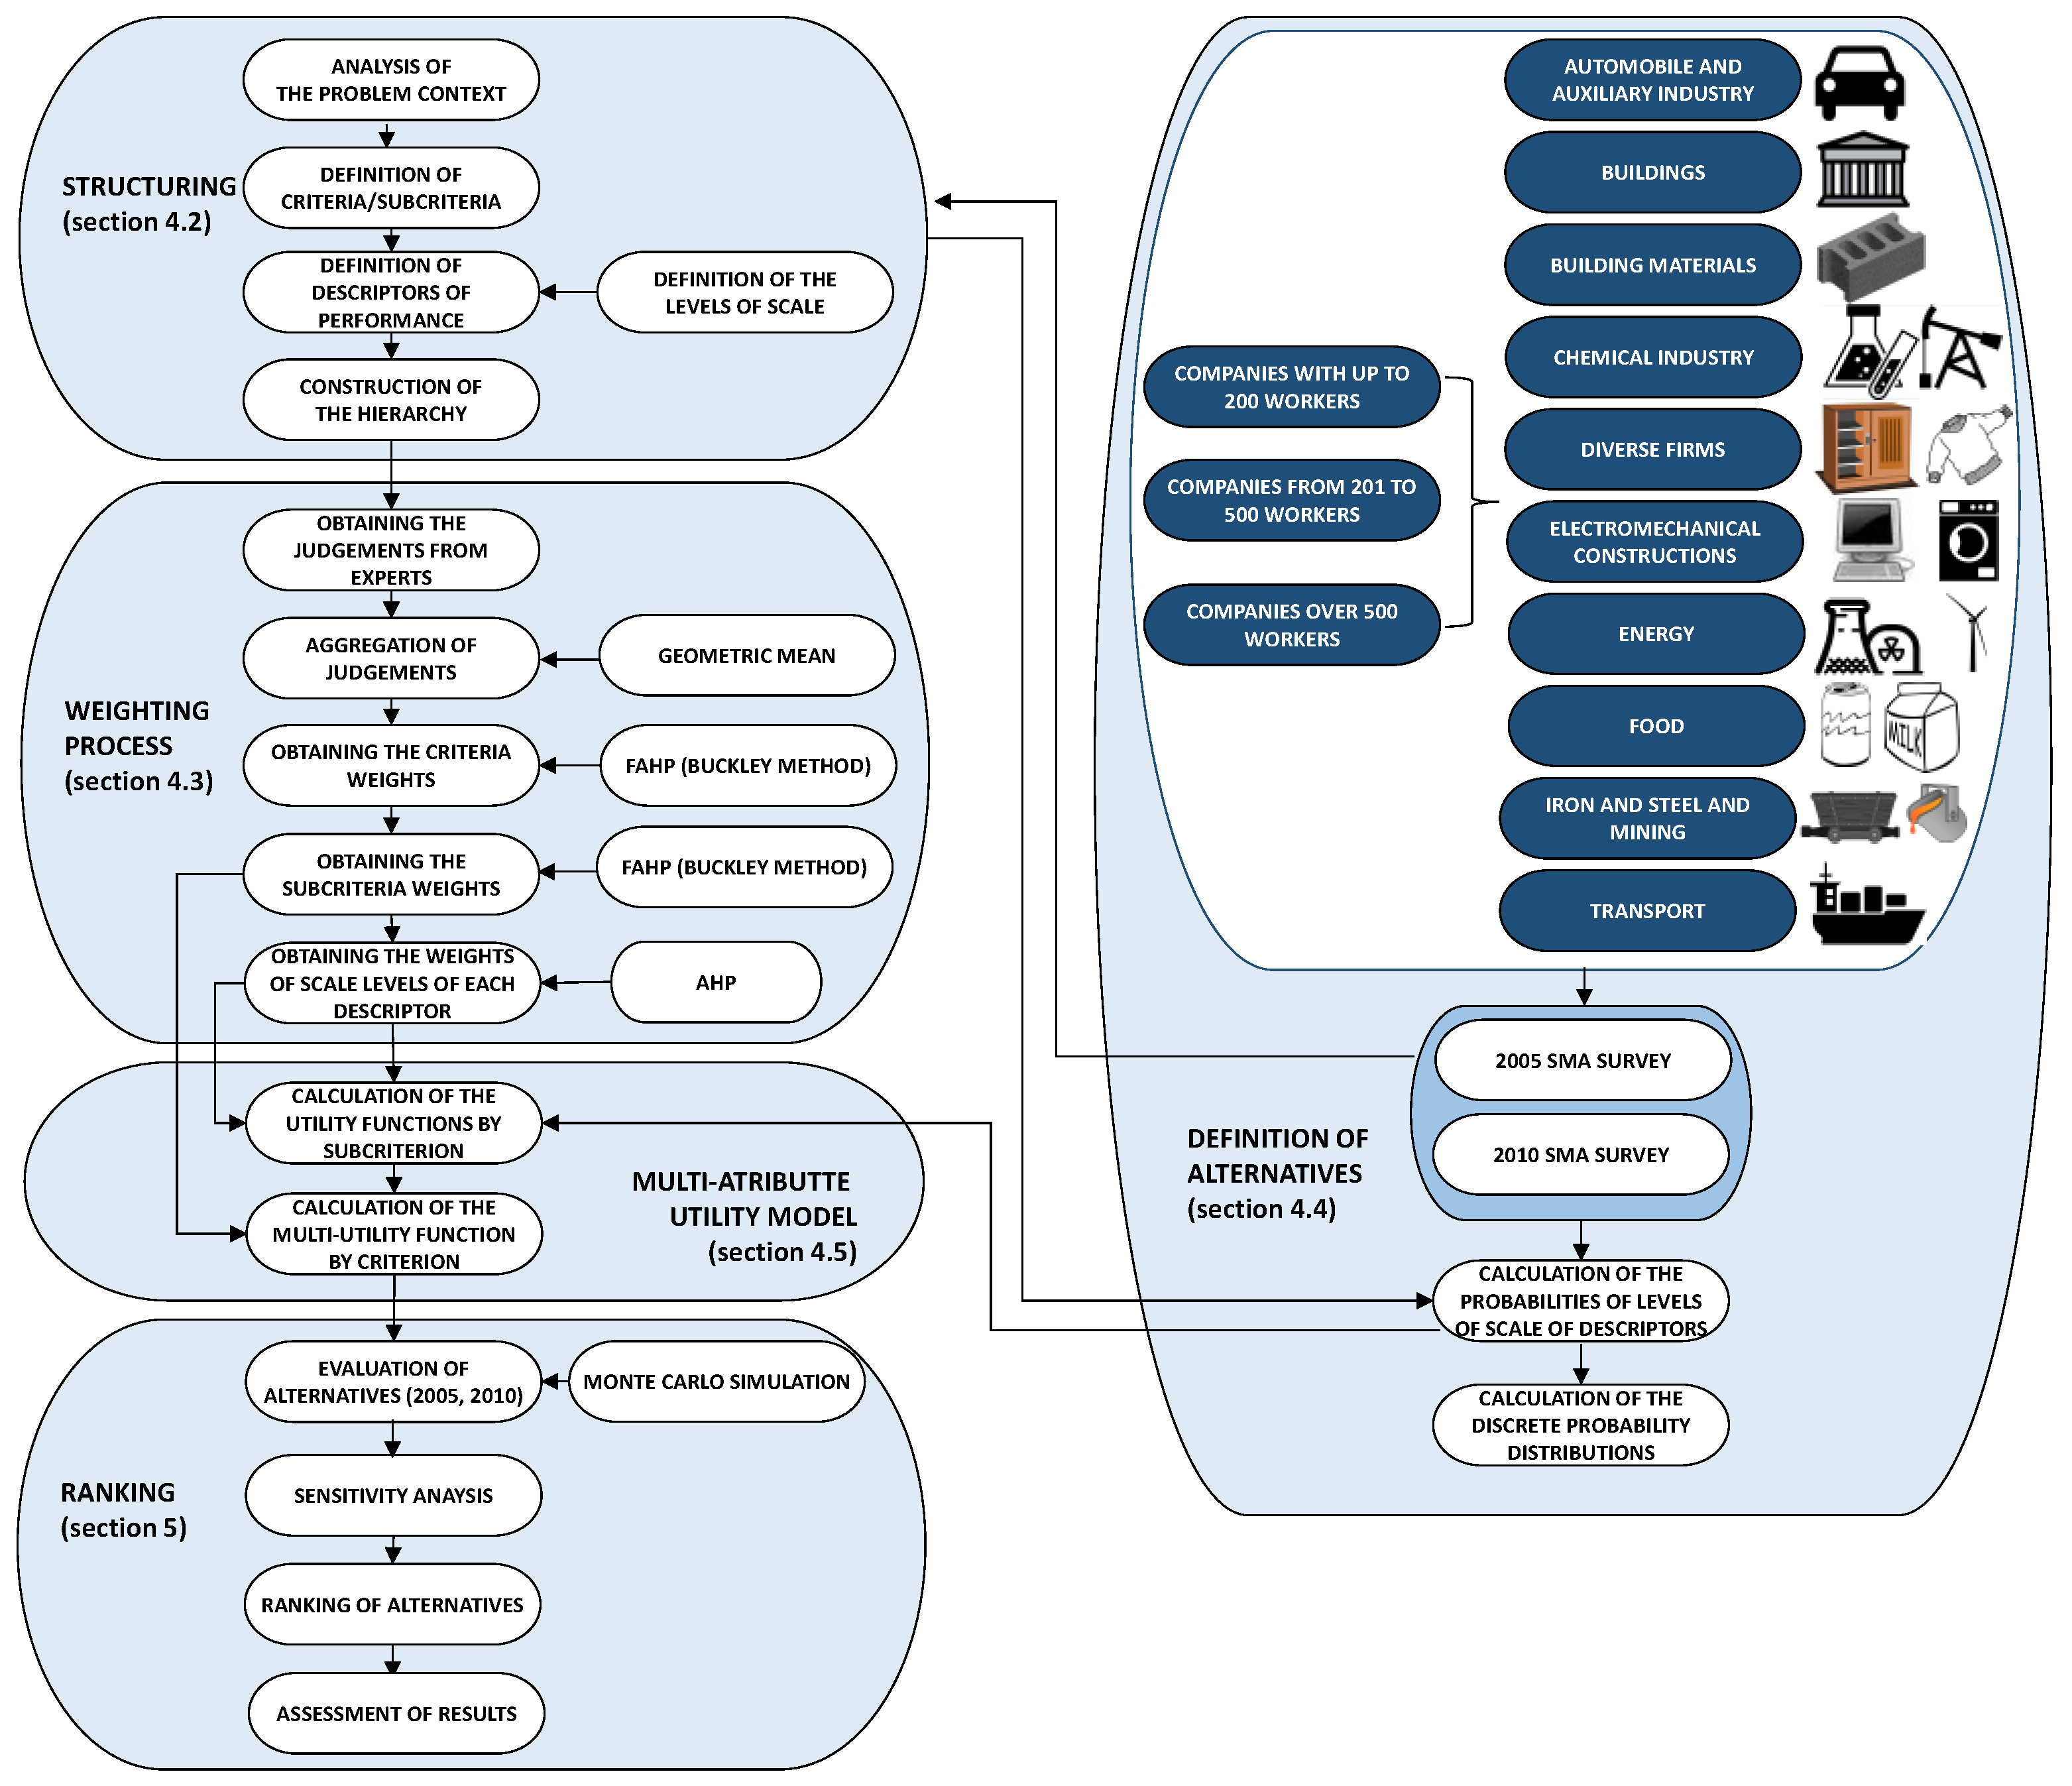
Figure 1 shows a flow diagram with the detailed procedure followed in this research.
There follows an explanation of each stage of the building of the model.
4.2. Structuring
There follows a description of the procedure used in the model to carry out the structuring stage:
Step 1. Analysis of the problem context.
Step 2. Analysis of the 2005 and 2010 SMA surveys.
Step 3. Selection, modification or linking of questions to get relevant and independent criteria and subcriteria.
Step 4. Definition of a descriptor for each subcriterion.
Step 5. Definition of levels of scale by subcriterion.
Step 6. Construction of a hierarchy.
The first step for structuring the multicriteria model was to choose the decision criteria and subcriteria for assessing the state of maintenance in Spain. To this end, the starting point was 64 questions from the survey carried out by the SMA [
79]. These 64 questions have been modified and turned into a form that may be considered decision criteria. These criteria are exhaustive, concise, non-redundant and independent [
80].
Within each criterion, a set of relevant subcriteria were grouped.
The final structure of the benchmarking model for maintenance evaluation has one goal, eight criteria and 40 subcriteria. The criteria and subcriteria used are:
C1. Budget preparation and measurement of annual maintenance cost and distribution. This comprises the subcriteria:
C11. Total annual maintenance costs of the company.
C12. Percentage of annual cost related to in-house staff.
C13. Percentage of annual cost related to outsourcing jobs.
C14. Percentage of annual cost related to spare parts and consumables.
C2. Certification of the company to international standards and compliance with Spanish regulations on health and safety at work. It comprises these subcriteria:
C21. Existence of a department in the company for compliance with Spanish regulations on health and safety at work. The values are whether there exists a department within the company, it is being set up, or it does not exist.
C22. Company certified to standard ISO 9000. The values here are whether the company has been audited by an external body to certify compliance with standard ISO 9000, it is in the process of gaining the certificate, or it is not certified.
C23. Company certified to standard ISO 14000. This assess whether the company has been audited by an external body to certify compliance with standard ISO 14000 so as to have introduced an effective environmental management system with the aim of reducing its impact on the environment and complying with the relevant legislation.
C3. Control of maintenance activity and efficiency:
C31. Organisation of work in work orders. Valuing of the use of work orders that include assignment of priority to the activities, material and labour required for each fault or breakdown and the time spent on each activity.
C32. Control indices used in systematic monitoring of maintenance management.
C33. Delay in receipt of information on costs. Time lag between spending on maintenance till account data is obtained about these costs and the rest of the departmental budget.
C34. Regularity of receipt of information on maintenance costs.
C35. Percentage of maintenance work carried out internally compared to outsourced.
C36. Percentage of urgent work received.
C37. Pending work. Time that would be needed to finish the maintenance jobs in progress and carry out the jobs pending.
C4. Characteristics of the head of maintenance and maintenance tasks carried out outside working hours. This includes the following subcriteria:
C41. Length of time as maintenance manager.
C42. Academic qualifications of head of maintenance.
C43. Length of time as member of a maintenance department.
C44. Frequency with which the head of maintenance is required to attend outside working hours to resolve maintenance incidents that cannot be sorted out by others, because they are not there or because of the difficulty of the incident.
C45. Remuneration for work in overtime or outside working hours. Existence and type of remuneration giving for working overtime, holidays, or being on call outside normal working hours.
C46. Attendance at conferences, talks, seminars, etc. on maintenance.
C47. Consulting Spanish technical journals on maintenance.
C48. Use of the internet to search for information to solve maintenance problems.
C49. Consulting international technical journals on maintenance.
C5. Organisational characteristics of the maintenance department. This comprises the following subcriteria:
C51. Existence of a maintenance department. This considers whether the company has a specific department or section whose main purpose is to take care of maintenance.
C52. Dependence on maintenance department manager. This considers who the maintenance manager is directly accountable to, for example the General Manager, the Production Manager, etc.
C53. Responsibilities of the maintenance department.
C54. Number of employees in the maintenance department.
C55. Incidents outside working hours. This identifies how maintenance problems are dealt with when they happen outside working hours.
C56. Collaboration of the production staff in maintenance activities.
C6. Characteristics of computerisation of maintenance in the organisation and the efficiency level. This includes the following subcriteria:
C61. Assessment of satisfaction in the application of computerisation.
C62. Number of activities in which computerisation is used.
C63. Type of computerised maintenance management system used.
C64. Hardware on which maintenance software runs.
C7. Importance and level of acceptance of outsourced maintenance carried out in the organisation. This comprises the following subcriteria:
C71. Percentage of corrective maintenance outsourced.
C72. Percentage of preventive maintenance outsourced.
C73. Percentage of work from programmed stoppages outsourced.
C74. Quality of work outsourced. The quality of outsourced maintenance services is evaluated.
C75. Percentage of outsourced personnel.
C8. Maintenance training given by the organisation and its results:
C81. Training courses. There are specified, current training programs for the staff of the maintenance department.
C82. Versatility of personnel. Ability of maintenance operatives to regularly carry out activities from two or more specialities.
To each subcriterion there is associated a descriptor. A descriptor is an ordered set of impact levels that can measure quantitatively or qualitatively the level of fulfilment of a criterion [
81]. Descriptor levels are used to describe plausible impacts of alternatives with respect to each criterion. Descriptors may be direct (the levels of the descriptor directly measure the effects) or indirect (the descriptor levels show causes rather than effects). When the criterion is intrinsically subjective or is made up of a set of interrelated, interdependent, elementary areas, the previously described descriptors are not suitable, and constructed descriptors are used. The levels of a constructed descriptor may be qualitative, quantitative or mixed, and they may be created using verbal descriptions of expected consequences, visual representations, indices, etc. [
82].
The descriptors applied in this model are constructed and generally qualitative although in some cases they are quantitative.
Table 2 shows the descriptors and measurement levels used in the criterion C
4 Characteristics of the head of maintenance and maintenance tasks carried out outside working hours.
4.3. Weighting Process
The steps used for the weighting phase are the following:
Step 1. Select the fuzzy scale.
Step 2. Select maintenance experts to provide the judgements in the decision-making process.
Step 3. Explain to the maintenance experts the process required to obtain crisp judgements (between the levels of scale of each subcriterion) and fuzzy judgements (between criteria and subcriteria) and provide support during the process.
Step 4. Check the consistency ratios.
Step 5. Aggregate the crisp and fuzzy judgements by geometric mean.
Step 6. Construct a program in Excel to calculate the fuzzy weights by criteria and subcriteria following the Buckley technique.
Step 7. Apply AHP to get weights associated with the levels of scale of each descriptor.
Step 8. Transform the crisp weights in utility functions.
Step 9. Obtain fuzzy weights by criteria and subcriteria. Defuzzify the weights and apply normalisation.
The scale of
Table 1 was chosen because it fits better with the original preference scale of the crisp AHP [
83].
The pairwise comparison matrices of the criteria provided by the decision makers are as follows:
To aggregate the judgements the geometric mean was applied to
lijk,
mijk and
uijk (see Equation (13)) [
84]; where (
lijk,
mijk,
uijk) is a fuzzy number associated with each decision maker
k (
k = 1, 2, …,
K).
The resulting matrix can be seen in
Table 3.
As shown in Buckley [
44], if the pairwise comparison matrices given for each decision maker are consistent, then the matrix resulting from the aggregation of the judgements is consistent. The matrices given for each decision maker have consistency ratios of 0.017 and 0.031. Therefore, the aggregated judgement matrix is consistent.
Applying Equations (9) and (10) to the pairwise comparison matrix of the experts' aggregated judgements gives the fuzzy weights of the criteria: , , , , , , and .
To get the weightings as a crisp number Equation (11) is applied, giving, after normalisation, the results: , , , , , , , .
A similar process is followed for the subcriteria associated with each criterion, giving the results shown in
Table 4.
Finally, a pairwise comparison matrix was produced between the scale levels of each descriptor. In this case crisp numbers have been used, obtaining the weightings of each scale level for each descriptor; these were turned into utility vectors, of which some examples can be seen in
Table 5; each component of the utility vector is associated with a level of the descriptor as shown in
Table 1.
All the pairwise comparison matrices used in the multicriteria model have consistency ratios below 10%.
4.4. Definition of Alternatives
The alternatives are the industrial sectors assessed in the questionnaire [
79]: Automobiles and auxiliary industry, Buildings, Building materials, Chemical industry, Diverse firms, Electromechanical constructions, Energy, Food, Iron and steel and Mining and Transport. In addition, in each sector, the companies were classified by size into: companies with up to 200 workers, from 201 to 500 workers, and over 500 workers.
The model uses the data collected by the SMA in the 2005 and 2010 surveys to construct the discrete probability distributions. In the 2005 survey, 2343 questionnaires were sent out, and 254 were completed and returned. If these, 113 were from companies with up to 200 workers, 85 from companies with from 201 to 500 workers, and 56 from companies with over 500 workers. In the 2010 survey 1648 questionnaires were sent out, of which 152 were completed and returned. Of these, 74 were from companies with up to 200 workers, 36 were from companies with from 201 to 500 workers, and 42 were from large companies with over 500 workers. The questionnaires were filled out by the heads of the maintenance department in each company.
The information obtained from the survey was turned into probabilities, and so each measurement level of a subcriterion is associated with the probability of appearance of each answer in the sector analysed. Since there are 40 subcriteria, 10 activity sectors and three company sizes, 1200 discrete probability distributions were calculated for each year evaluated (2400 discrete probability distributions in all).
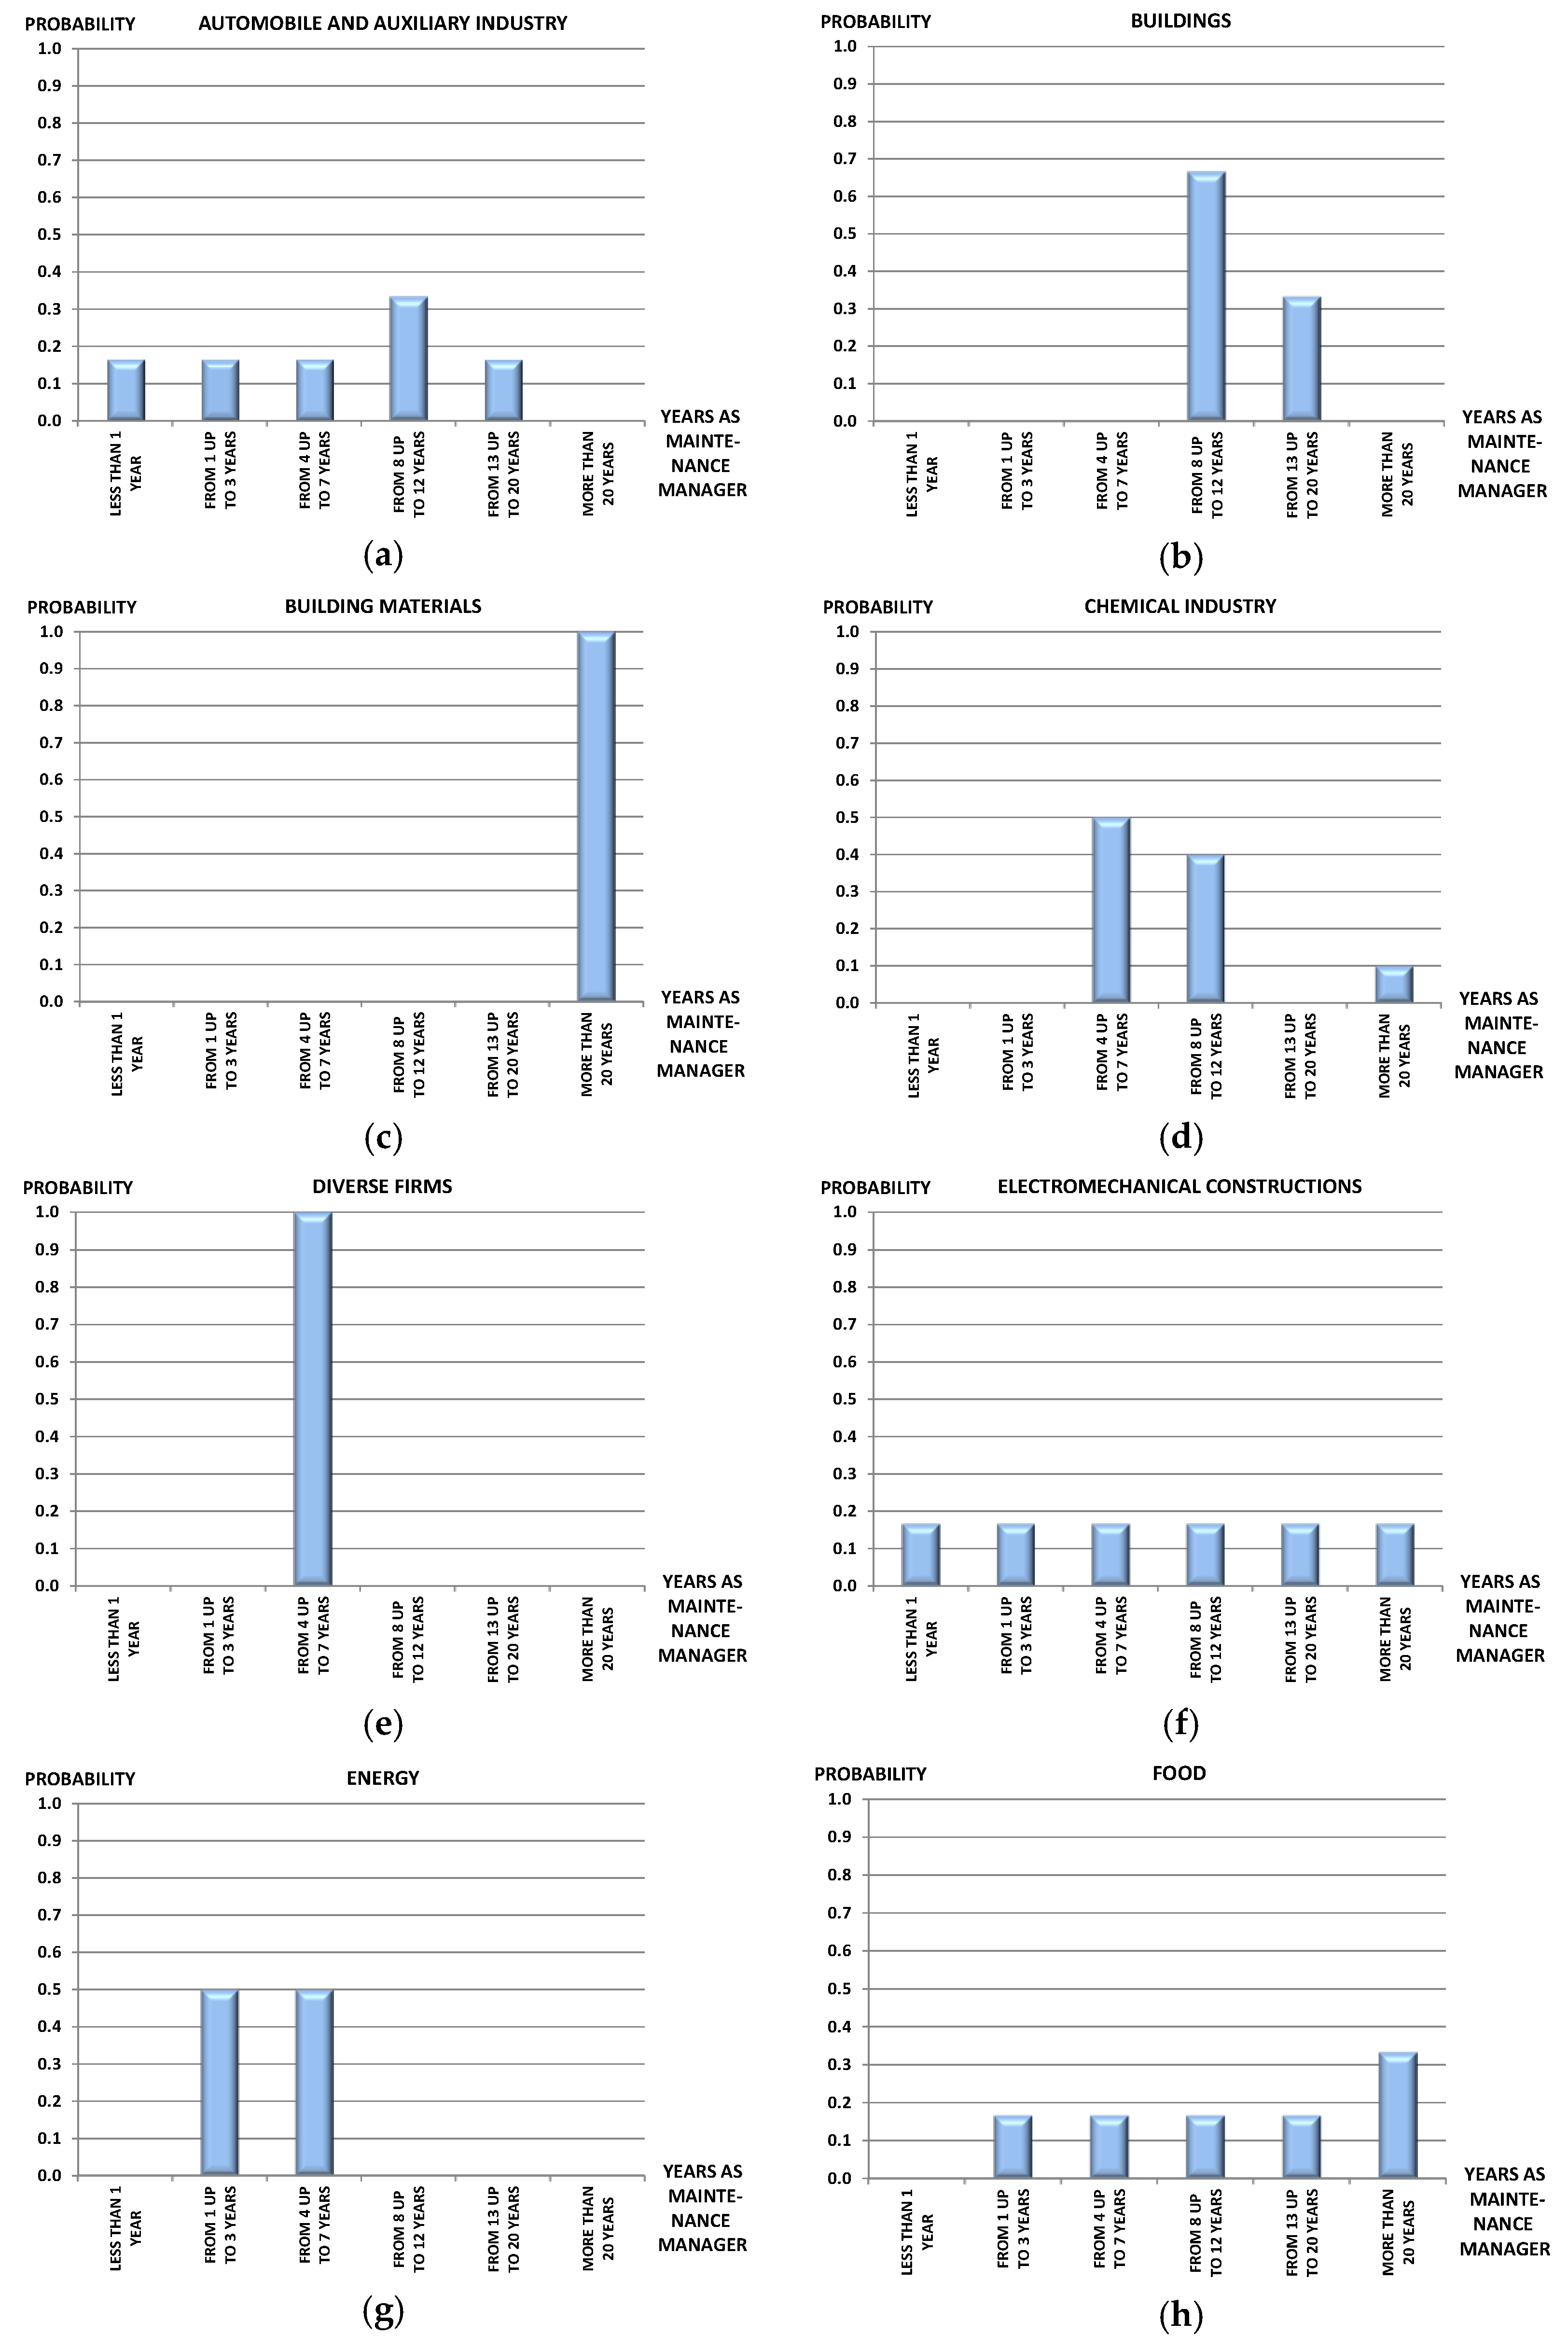
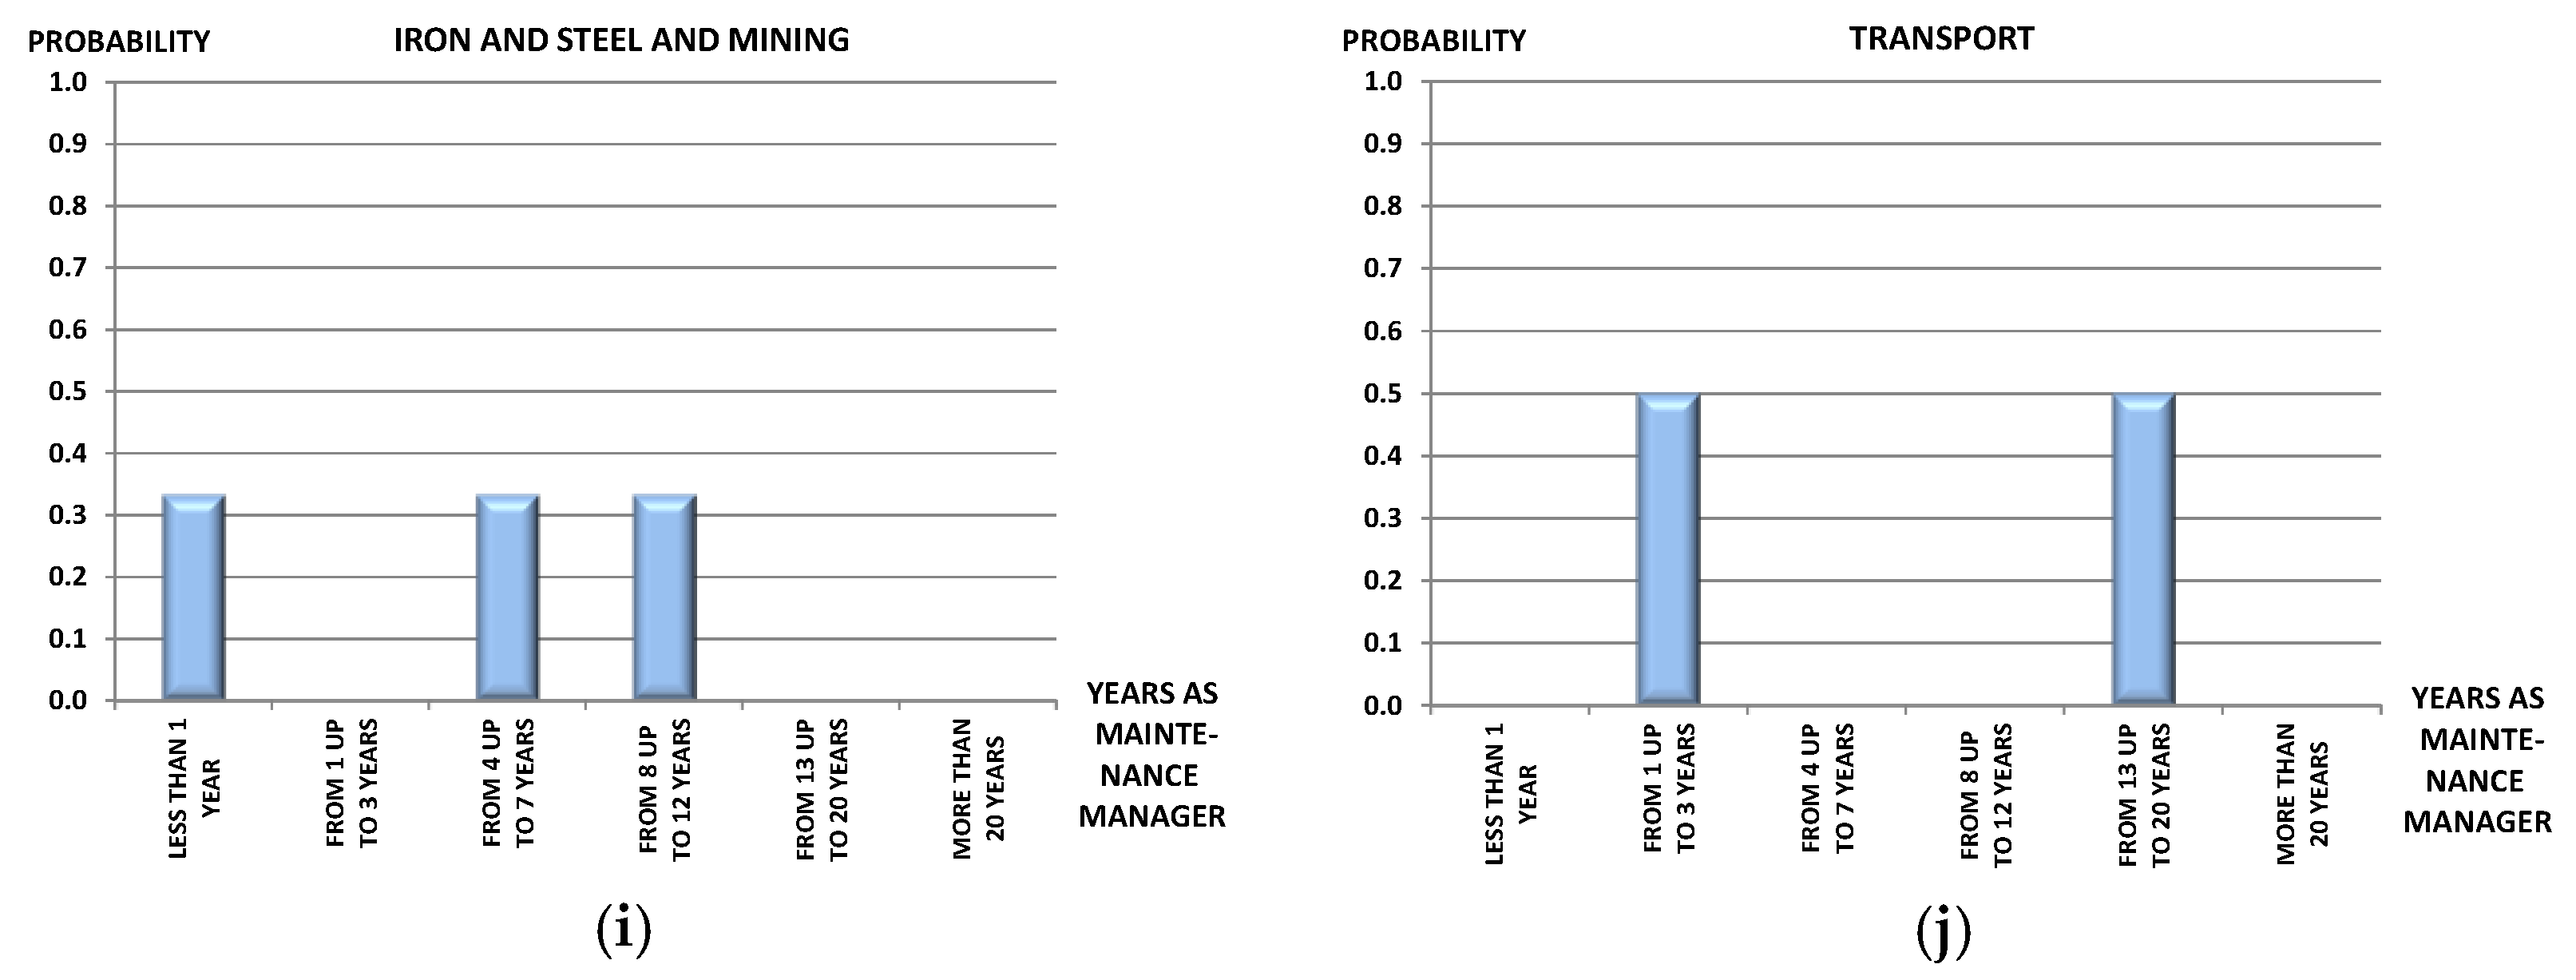
Figure 3 shows the discrete probability distribution for the subcriterion length of time as maintenance manager (C
41) in companies with from 201 to 500 workers for the year 2010.
Next the steps for developing the definition of alternatives are set out:
Step 1. Review the 2005 and 2010 SMA surveys.
Step 2. Check the data sample.
Step 3. Define the alternatives (10 activity sectors and three company sizes by sector, in total 30 alternatives).
Step 4. Calculate the probabilities by level of scale of each descriptor by alternative.
Step 5. Construct discrete probabilities distributions by alternative.
4.5. Multi-Attribute Utility Model
Multi-Attribute Utility Theory (MAUT) [
47] allows scores to be turned into utility functions. If
is the weighting associated with the criterion i and
is satisfied, an alternative has an additive utility function
U:
where
xi is typically normalised to a range from the worst to best possible values of an descriptor, and
ui ranging from 0 to 1 reflects the decision maker's attitude to risk within criterion
i.
If p(x) is the probability associated with each scale level of an descriptor in an alternative and, U(x) is the utility associated with that scale level, the value of equivalent certainty for each alternative is obtained from the expected utility summing p(x) × U(x) for all levels x with non-zero probability for the probability distribution. The equivalent certainty is the level estimated in which the utility function of the result U(y), is equal to the expected utility of the random utility. The final utility of a criterion in an alternative is calculated by a Multi-Measure Utility Function. The Multi-Measure Utility Function is obtained by multiplying the weights of each subcriterion by the U(y) previously obtained for each subcriterion.
The procedure followed in this stage, to obtain the final results is:
Step 1. Calculate the utility function by subcriterion.
Step 2. Calculate the Multi-Measure Utility Function by criterion.
Step 3. Construct a model with the intermediate results obtained in Logical Decisions.
Step 4. Apply a Monte Carlos simulation to get the final by alternative.
Step 5. Perform sensitivity analysis.
Step 6. Analyse the results.
The utility function of the subcriterion length of time as maintenance manager (C41), , is calculated:
= utility (best scale level) × probability (appearance of best scale level in sector) + … + utility (worst scale level) × probability (appearance of worst scale level in sector).
The best scale level of the subcriterion C
41 (see
Table 1) consists in the years of experience of the head of maintenance being more than 20; the worst level is less than one year of experience.
Figure 3 shows that a company with between 201 and 500 employees belonging to the Automobile and auxiliary industry in 2010 has a probability of 0.167 that the experience of the head of maintenance in that post is less than one year; a similar probability is found for experience between one and three years, between four and seven years, and between 13 and 20 years. The probability of having a head of maintenance with between eight and 12 years of experience is 0.333. The utility associated with each measurement level for each descriptor is shown in
Table 5. Thus, the resulting
is:
A similar process is followed with the subcriteria C
42, C
43, C
44, C
45, C
46, C
47, C
48 and C
49 giving (see utilities in
Table 5):
The weightings of the subcriteria included in criterion C
4 (Characteristics of the head of maintenance and maintenance tasks performed outside working hours) are (see
Table 4):
,
,
,
, respectively. The utility in the criterion characteristics of the head of maintenance and maintenance tasks performed outside working hours is calculated as follows:
A similar process is used for the other criteria.
The calculations related to the application of FAHP and the obtaining of the discrete probability distributions have been carried out using a program in Excel. The results obtained in both cases have been included in a model constructed by means of Logical Decision software. In this way it was possible to apply the Monte Carlo simulation to calculate the global results and the uncertainty associated.
The Monte Carlo simulation allows the estimation of the uncertainty of a number that is a complex function of one or more probability distributions. The Monte Carlo simulation uses random numbers to provide an estimation of the distribution. A generator of random numbers is used to produce random samples of the probability levels. Each set of samples is used to calculate the utility of a possible result of the uncertainties of each scale of the descriptor. The execution of a certain number of trials is used as an estimation of the accumulated probability distribution of the desired utility.
To apply the Monte Carlo simulation a different number of trials have been considered. After 5000 trials the results no longer change.
A sensitivity analysis was performed, increasing and decreasing the weightings of the decision criteria used in the model by 5%. The sensitivity analysis shows that there is only a change in the classification of alternatives in companies of up to 200 workers. The change appears when the weighting associated with the criteria Maintenance costs and Certification to international standards and compliance with the law on health and safety at work is reduced by 5%; in this case the alternatives Automobile and auxiliary industry and Building materials change positions, taking the fourth and fifth positions, respectively. In the case of increasing the weighting of the criterion Maintenance management by 5% a similar exchange is observed between the alternatives Automobile and auxiliary industry and Building materials. Companies with from 201 to 500 workers and companies with more than 500 workers see no change in the full classification of alternatives.
There are only eight modifications in the classification of alternatives (in all sizes of company) when the variation in the weightings of the criteria is 10%. In all cases the variation in the classification is simply a permutation of alternatives occupying adjacent positions. It can therefore be stated that the model is robust.
There follows an analysis of the development of maintenance in each size of company, the sectors with the best and worst performance before and after the economic crisis, and the results will be compared with those of the same sector in companies of different sizes.
5. Results
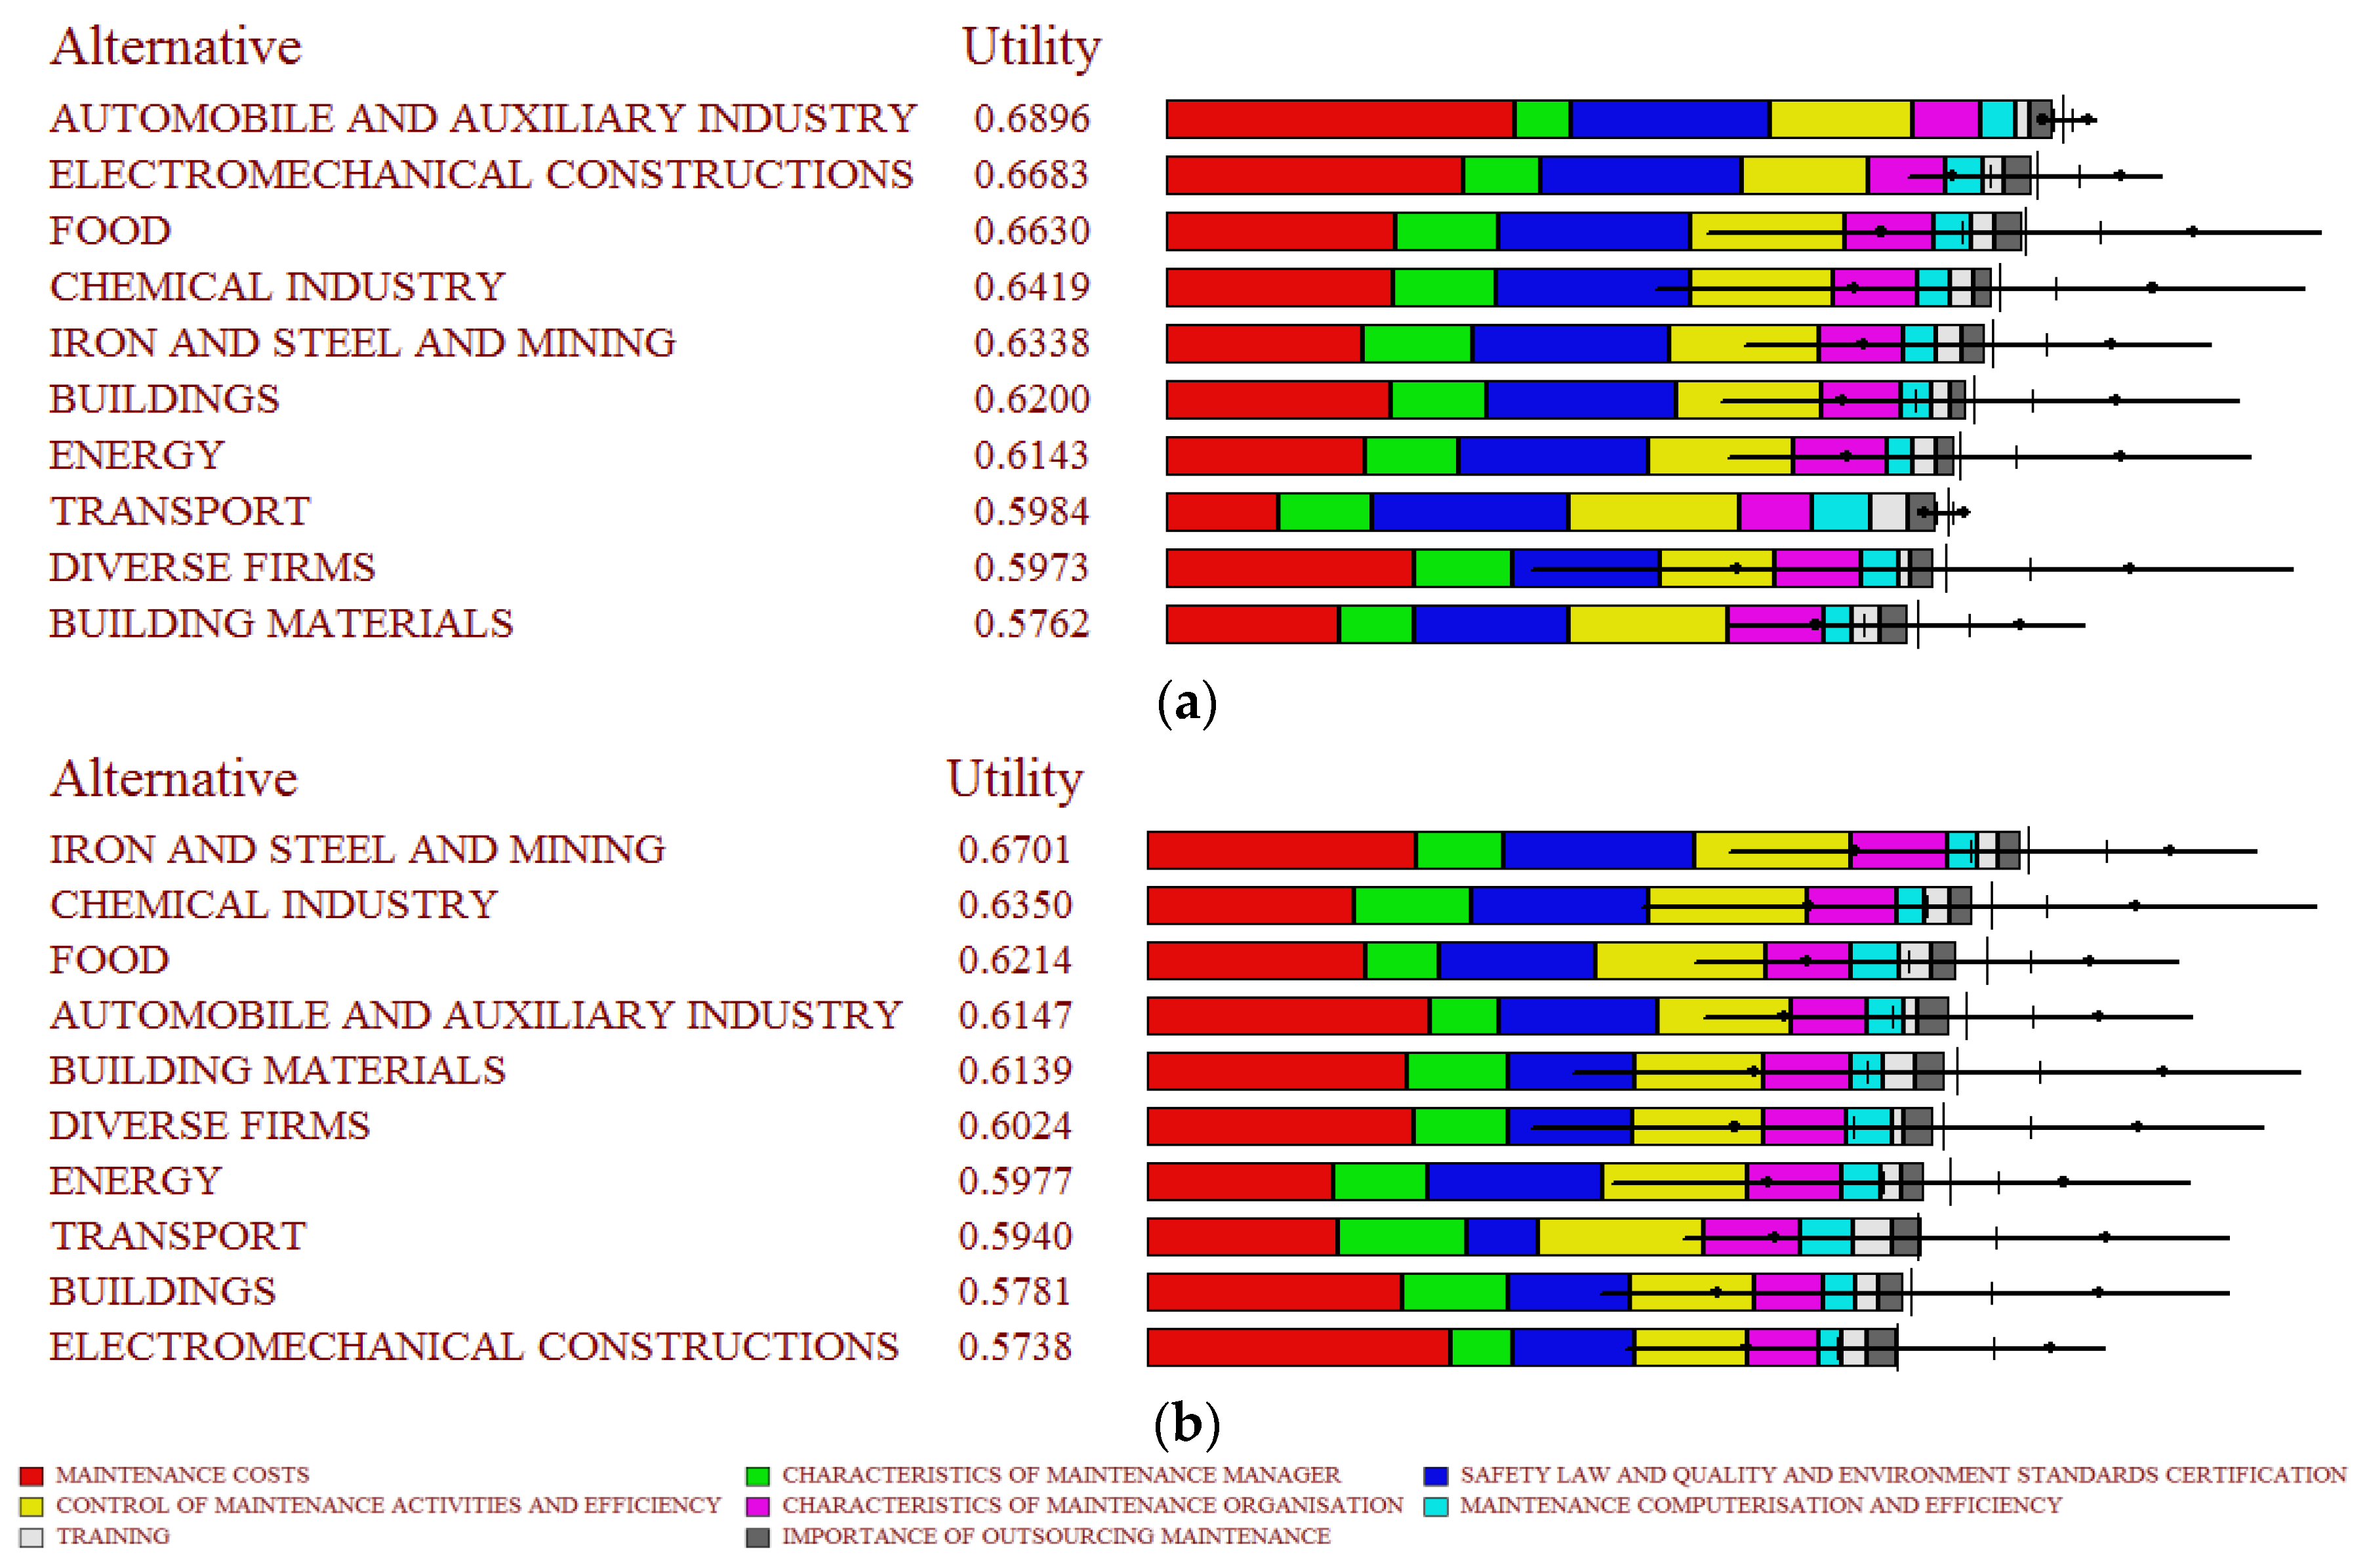
5.1. Companies with up to 200 Employees
Figure 4 shows the results for all sectors for companies with up to 200 workers in 2005 and 2010. In the results for 2005 it can be seen that the Automobile and auxiliary industry sector is in first place with a utility of 0.6896, followed by Electromechanical constructions (0.6683) and the Food sector (0.6630). The Iron and Steel and mining, Chemical industry and Food sectors are those that best apply maintenance in 2010, with utilities of 0.6701, 0.6350 and 0.6214, respectively.
It can be seen that there is a decrease in most sectors in the level of maintenance applied in Spain in 2010 with respect to 2005; Building Materials has an increase in utility of 6.54%, Iron and steel and mining have 5.72% and Diverse firms have 0.85%. The sectors Electromechanical constructions, Automobile and auxiliary industry and Buildings have had the greatest decrease in maintenance (−14.14%, −10.86% and −6.75%, respectively).
The sector Building Materials (cement, building steel, facilities, furniture, carpentry and medical apparatus), has an average number of workers of 25, that is, small businesses [
85]. This sector has been seriously affected by the economic recession, as it is directly related to the building industry. For example, consumption of cement has dropped by 50% in Spain since the second quarter of 2007. The improvement in maintenance undergone by the sector could be due to the essential optimisation carried out by companies which are still operating, which includes the area of maintenance.
Total maintenance costs is a criterion that clearly differentiates sectors. Building materials shows a rise in utility (reduction in total maintenance costs) in 2010 of 239.96%. In 2005, 75% of the companies surveyed in this sector had maintenance costs between €2,001,000 and €4,500,000; in 2010, however, 60% of companies in the sector were not above €900,000. The Iron and steel and Mining, Buildings, Transport, Diverse firms and Electromechanical constructions sectors had an increase in utility in this criterion of 87.57%, 38.93%, 31.58%, 24.73% and 13.29%. The most significant decrease in utility in total maintenance costs was in the Chemical industry with −22.72%, followed by the Automobile and auxiliary industry with −21%. In the Chemical industry, in 2005, 82.61% of companies had less than two million euros a year in maintenance costs; in 2010, however, only 58.82% of companies were below this figure.
The Building materials, Automobile and auxiliary industry, Electromechanical construction, Iron and Steel and mining sectors had a utility of 1.000 in 2005 and 2010 with respect to certification to standard ISO 9000. The Energy sector, on the other hand, had the worst results for 2005 as 50% of those surveyed were not certified, and in 2010 transport was worst with 66.67% of those surveyed not certified. In this last case, it may be due to the fact that companies are more concerned with the standard EN13816, which is specific to the sector.
Planned maintenance work is four to 12 times more efficient than unplanned work [
86]; therefore, the percentage of hours spent on corrective maintenance gives an idea of the efficiency of a sector in maintenance activity. From these results, it can be seen that the mode of all sectors in 2010 has levels of corrective maintenance higher than 15%; this the highest level permitted by the best practice benchmark [
87]. Diverse firms are the sector with the largest increase in utility (decrease in corrective action) in the percentage of corrective maintenance (127.01%), followed by Energy (95.03%) and Building materials (45.85%). Transport, Automobile and auxiliary industry and Electromechanical constructions, on the other hand, have seen the largest decrease in utility, with −91.73%, −84.76 and −74.58%, respectively. For example, in 2005 in the Automobile and auxiliary industry 100% of those surveyed applied 50% corrective maintenance, while in 2010, 100% of those surveyed applied more than 75%. This increase in corrective action means more and more serious breakdowns, higher spare part and labour costs, as well as having a negative effect on the availability, safety and quality of the plant.
The experience of the head of maintenance is vital to improvements in the state of maintenance. Building materials experienced an increase in utility from 2005 to 2010 of 800.68%. This is because, while in 2005 100% of those surveyed in the sector had less than three years of experience, in 2010, 60% of those surveyed had more than eight years of experience. Other sectors with a noteworthy increase in utility are Transport (198.62%), Automobile and auxiliary industry (56.72%), Buildings (41.61%), Electromechanical constructions (39.64%) and Chemical industry (28.24%). The Food sector, however, had a variation in utility of −56.51%.
It is seen that the level of qualification of heads of maintenance was, in general, higher in 2005 than in 2010. In 2005 in the Transport sector all those surveyed were industrial engineers, while in 2010 33.33% of the heads of maintenance had no qualifications. It should be noted that the Automobile and auxiliary industry has a much lower utility than the other sectors in this criterion in 2005 and 2010 (0.0362 and 0.0241) as, surprisingly, the heads of maintenance have no university qualifications; rather, they are industrial technicians and in some cases they have no qualifications at all. These results are much worse than those in Carnero [
88] for small businesses in Spain where only 20% of heads of maintenance has a university qualification.
A key aspect in maintenance is the level of satisfaction with a CMMS. In this matter, the Energy sector is the one with the biggest improvement, with an increase in utility in this criterion (C61) of 105.65%. This is clear because only 9.09% of those surveyed were very satisfied with the CMMS in 2005, while in 2010 40% of them were. Other sectors with an increase in utility in this criterion are the Automobile and auxiliary industry and Food with 43.19% and 20.13%, respectively. Buildings, on the other hand, was the sector with the biggest drop in utility in this criterion (−25.9%).
In the criterion outsourcing, there are small increases in utility in the Food and Transport sectors, while the other sectors show decreases in utility with Buildings having the highest value of −34.56%. Thus, companies in general have not worked on improving the outsourcing of maintenance.
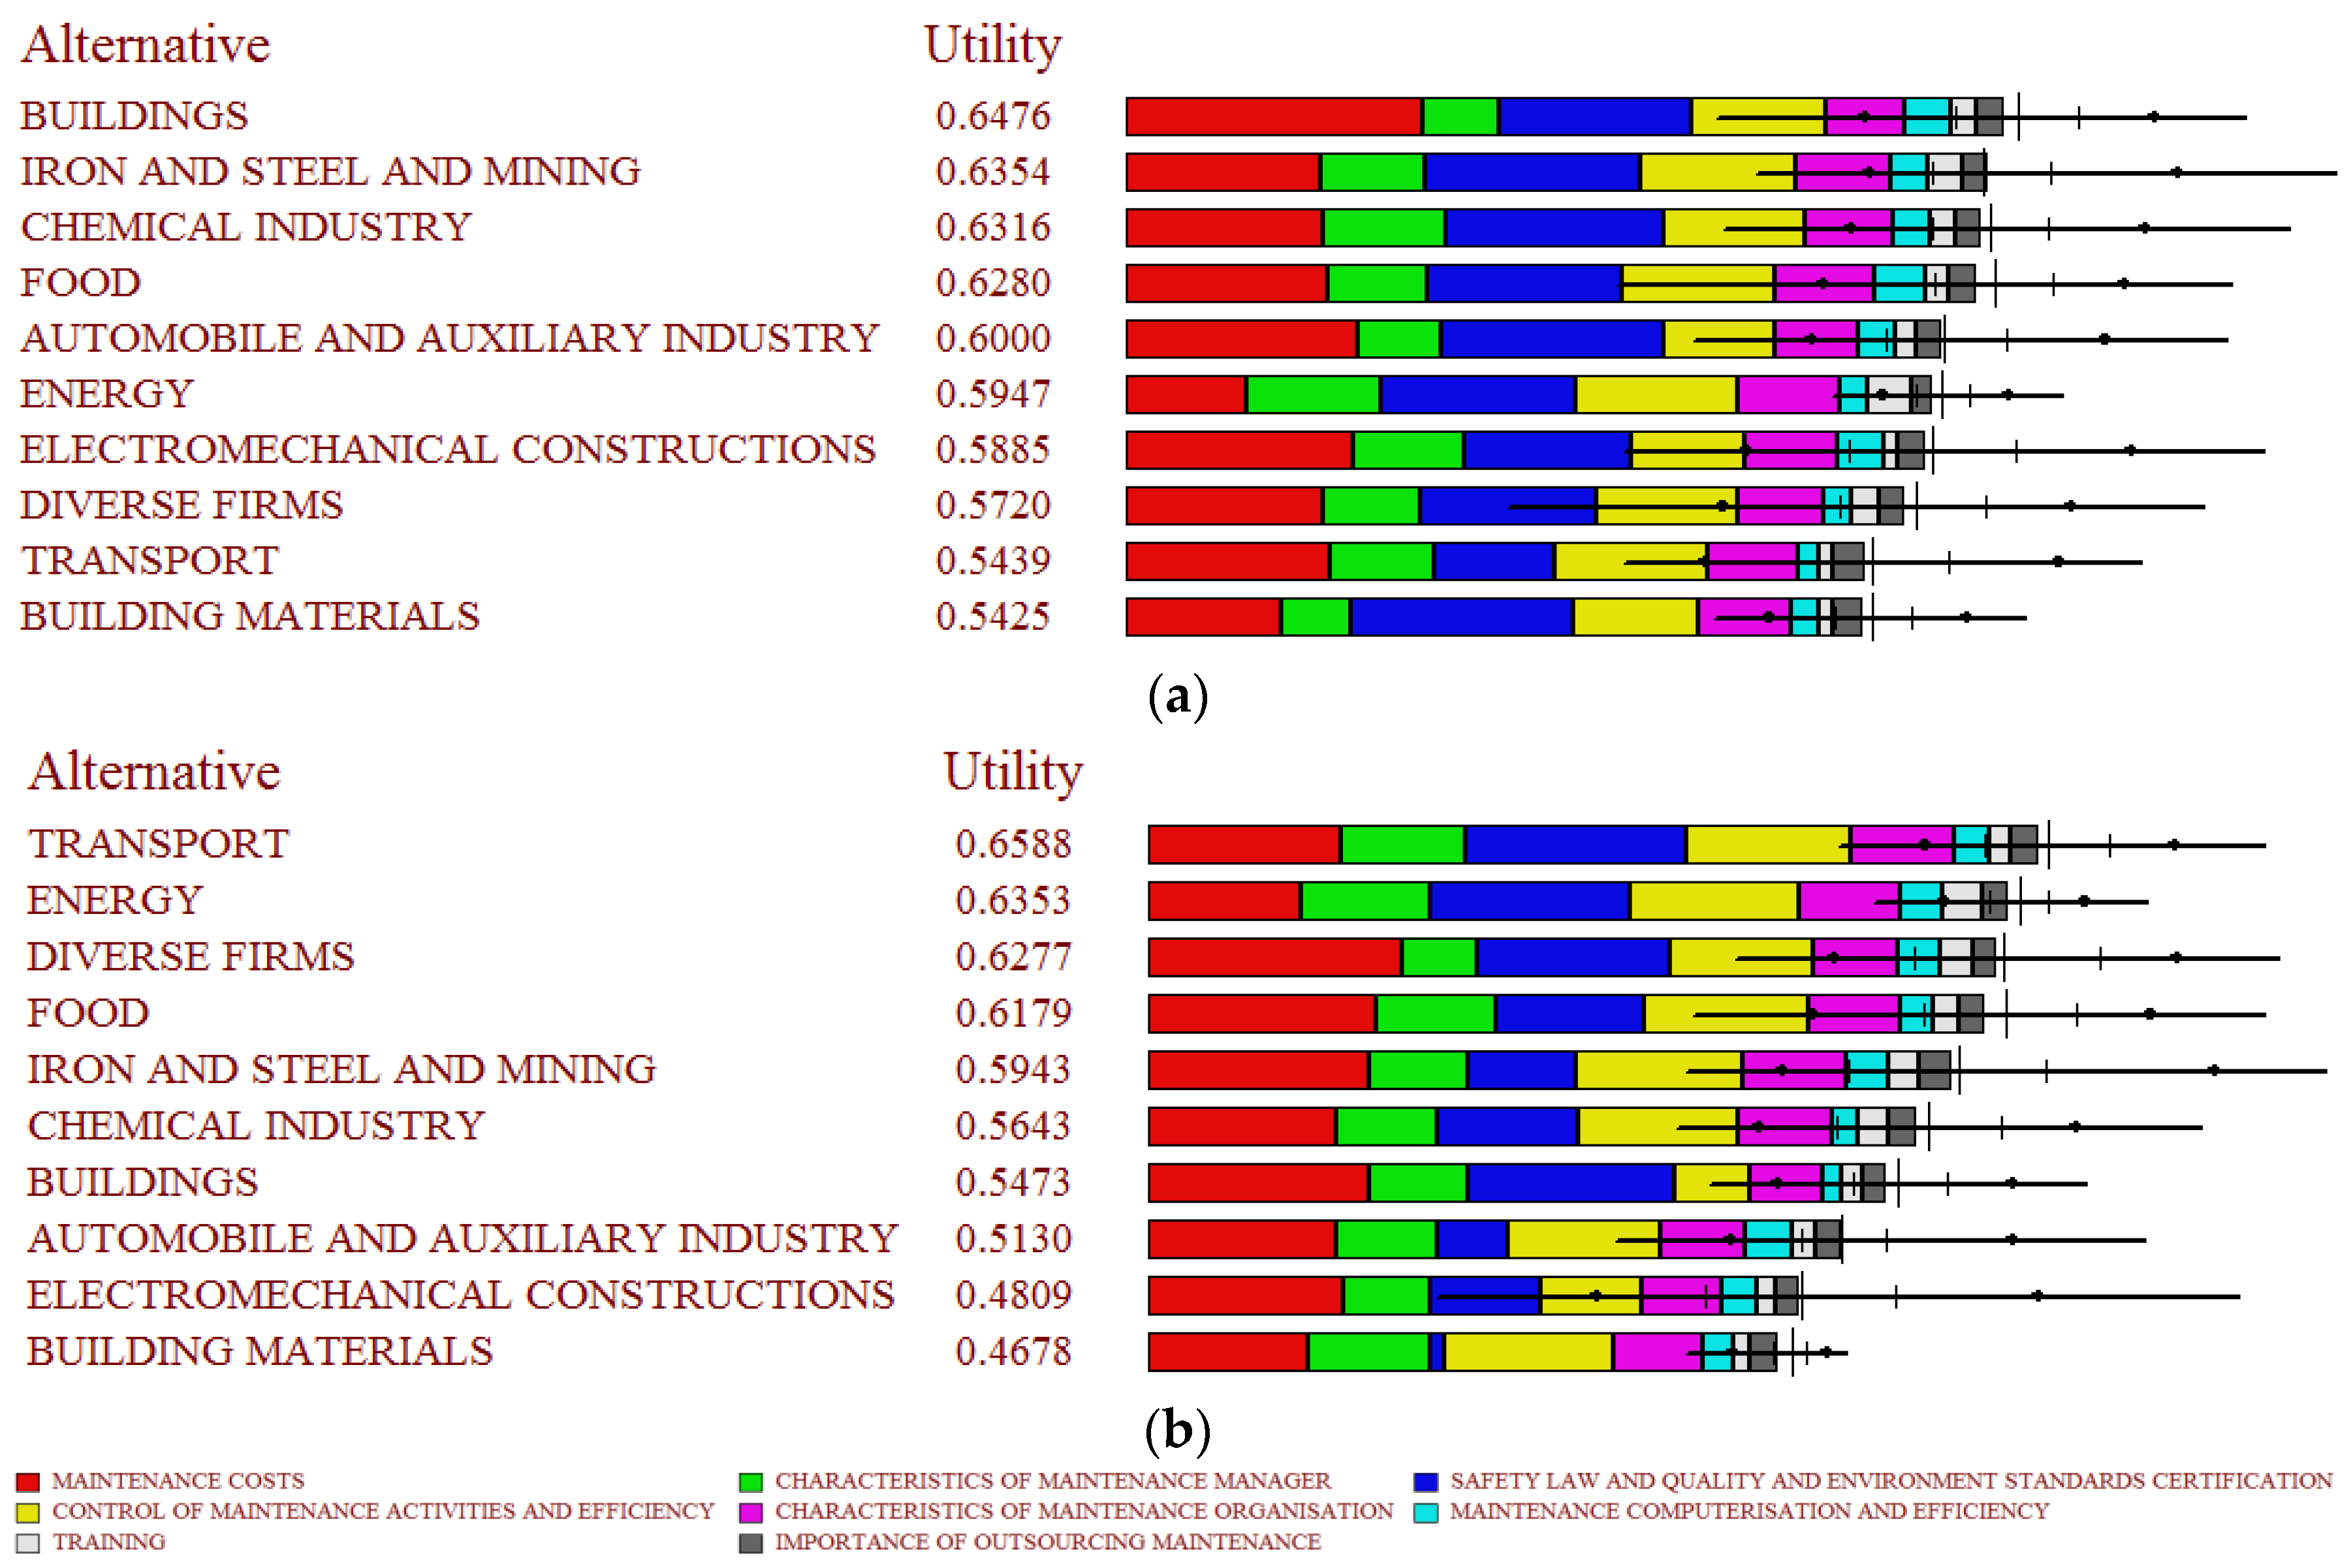
5.2. Companies with 201 to 500 Employees
Figure 5 shows the results for companies with between 201 and 500 employees in 2005 and 2010. The 2005 results show that the Building sector was in first place with a utility of 0.6476, followed by Iron and steel and mining (0.6354) and the Chemical industry (0.6316).
The Transport sector was in first place in 2010, followed by Energy and Diverse firms. The Chemical industry and Building sectors considerably reduce the level of maintenance, taking 6th and 7th place, respectively. Building materials, which was in last place in 2005 with a utility of 0.5425, retained that position in 2010, although the utility fell to 0.4678.
The Transport, Diverse firms and Energy sectors underwent improvements in maintenance (increased utility) from 2005 to 2010, which can be quantified as 21.13%, 9.73% and 6.82%, respectively. The remaining sectors see a drop in the level of maintenance, which is largest in Electromechanical constructions with −18.28%, Buildings with −15.49% and Automobile and auxiliary industry with −14.50%.
Despite the economic crisis in Spain that began in 2008, not all sectors have worked to reduce their total maintenance costs. The Energy sector had an improvement in utility in 2010 with respect to 2005 of 400.93%; despite this improvement, it is the sector with the lowest utility, that is, the worst behaviour in costs both in 2005 and 2010. Also, 80% of those surveyed had total maintenance costs above €9,000,000 in 2005, whereas 100% had costs between €4,501,000 and €9,000,000 in 2010. Nevertheless, the results would appear to show that they are aware of the need to continue working on this criterion. Other sectors that have improved in overall maintenance costs are Diverse firms (105.85%), Iron and steel and mining (43.72%), Building materials (40.54%) and Food (33.64%). Transport has seen no changes in costs. Buildings, on the contrary, has seen a decrease in utility of costs of 41.76%; this may be due to the changes in the laws on sustainable buildings in Spain, which state the minimum requirements for energy efficiency, but whose facilities may require more sophisticated and therefore more expensive maintenance. Despite this, it is one of the sectors with the lowest maintenance costs. Other sectors that have worsened with respect to costs are the Automobile and auxiliary industry, Chemical industry and Electromechanical constructions. Change in the behaviour of the Chemical industry in small companies is very similar to companies with from 201 to 500 employees, with decreases in the utility of total maintenance costs of approximately 20%; this could be because the Chemical industry sector is made up of increasingly complex plants, with an ever higher level of automation operating in extreme conditions, requiring high availabilities and where the regulations on safety and the environment require very precise and delicate maintenance activities. The results for this sector in Spain, however, are very varied; while most sectors are concentrated in relatively few measurement levels of the descriptor, the Chemical industry has companies with all the measurement levels.
The Buildings, Iron and Steel and mining and Transport sectors had a utility of 1.000 in 2005 and 2010 with respect to certification to standard ISO 9000. The Energy sector, on the other hand (the same as in companies with fewer than 200 workers), had the lowest utility in 2005 since 40% of those surveyed were not certified; in 2010, the utility was still low (0.5), with only 50% of companies certified to ISO 9000. Building materials, with excellent results in 2005 (utility 1.0) since 100% of those surveyed were certified, had none of them certified to ISO 9000 in 2010.
The experience of the head of maintenance is vital to improvement in the state of maintenance. Building materials shows a decrease in utility from 2005 to 2010 of 477.03% (similar results are found in companies with up to 200 workers). This is because, while in 2005 100% of those surveyed in this sector had from four to seven years of experience as head of maintenance, in 2010, 100% of those surveyed had more than 20 years of experience. Other sectors with significant improvement in utility in 2010 were Buildings (78.02%) and Food (15.81%). The other sectors saw a drop in utility, which was highest in Energy and Diverse firms with values of −60%.
It can be seen that the level of training of heads of maintenance was higher, in general, in 2010 than in 2005 (the opposite of the situation in companies with up to 200 workers). The highest utility (1.000) in 2005 and 2010 was in the Energy sector, as 100% of those surveyed had industrial engineers as heads of maintenance. Transport saw substantial improvement in utility from 2005 (0.0000) to 2010 (0.6095); this was because in 2005 the heads of maintenance surveyed had no qualifications, while in 2010 50% of them were industrial engineers and the other 50% were technical industrial engineers.
With respect to the criterion of satisfaction with a CMMS, the Energy sector had the highest improvement (the same was the case with companies of up to 200 workers), giving an increase in utility of 299.62% in 2010 over 2005. This is because in 2005, 40% of those surveyed were not satisfied with the CMMS, while in 2010 there were no dissatisfied companies. Other sectors with increased utility are Transport, Diverse Firms, Building materials, Iron and Steel and mining and Automobile and auxiliary industry with 139.77%, 144.79%, 49.97%, 23.90% and 16.68%, respectively. Buildings, on the other hand, was the sector with the highest drop in utility for this criterion (−75.09%), the same as in companies with up to 200 workers.
With regard to outsourcing of maintenance, the sector with the highest utility was Transport in 2005 and Iron and steel and mining in 2010. There was an increase in outsourcing in most sectors (Buildings, Electromechanical constructions, Transport, Automobile and auxiliary industry, Diverse firms and Food). The Iron and Steel and mining, Energy, and Chemical industry sectors had the highest increases in utility, with 29.03%, 16.97% and 5.53%, respectively.
With respect to the criterion of training; the Energy sector had excellent utilities (0.8905 in 2005 and 0.8310 in 2010). Electromechanical constructions, Building materials, and Transport, on the other hand, had very low utility in both 2005 and in 2010. There were, however, improvements in utility in the Transport sector (34.35%), and in the Automobile and auxiliary industry, Diverse firms, Chemical industry and Electromechanical constructions. Iron and steel and mining had the largest decrease in utility (−10.10%).
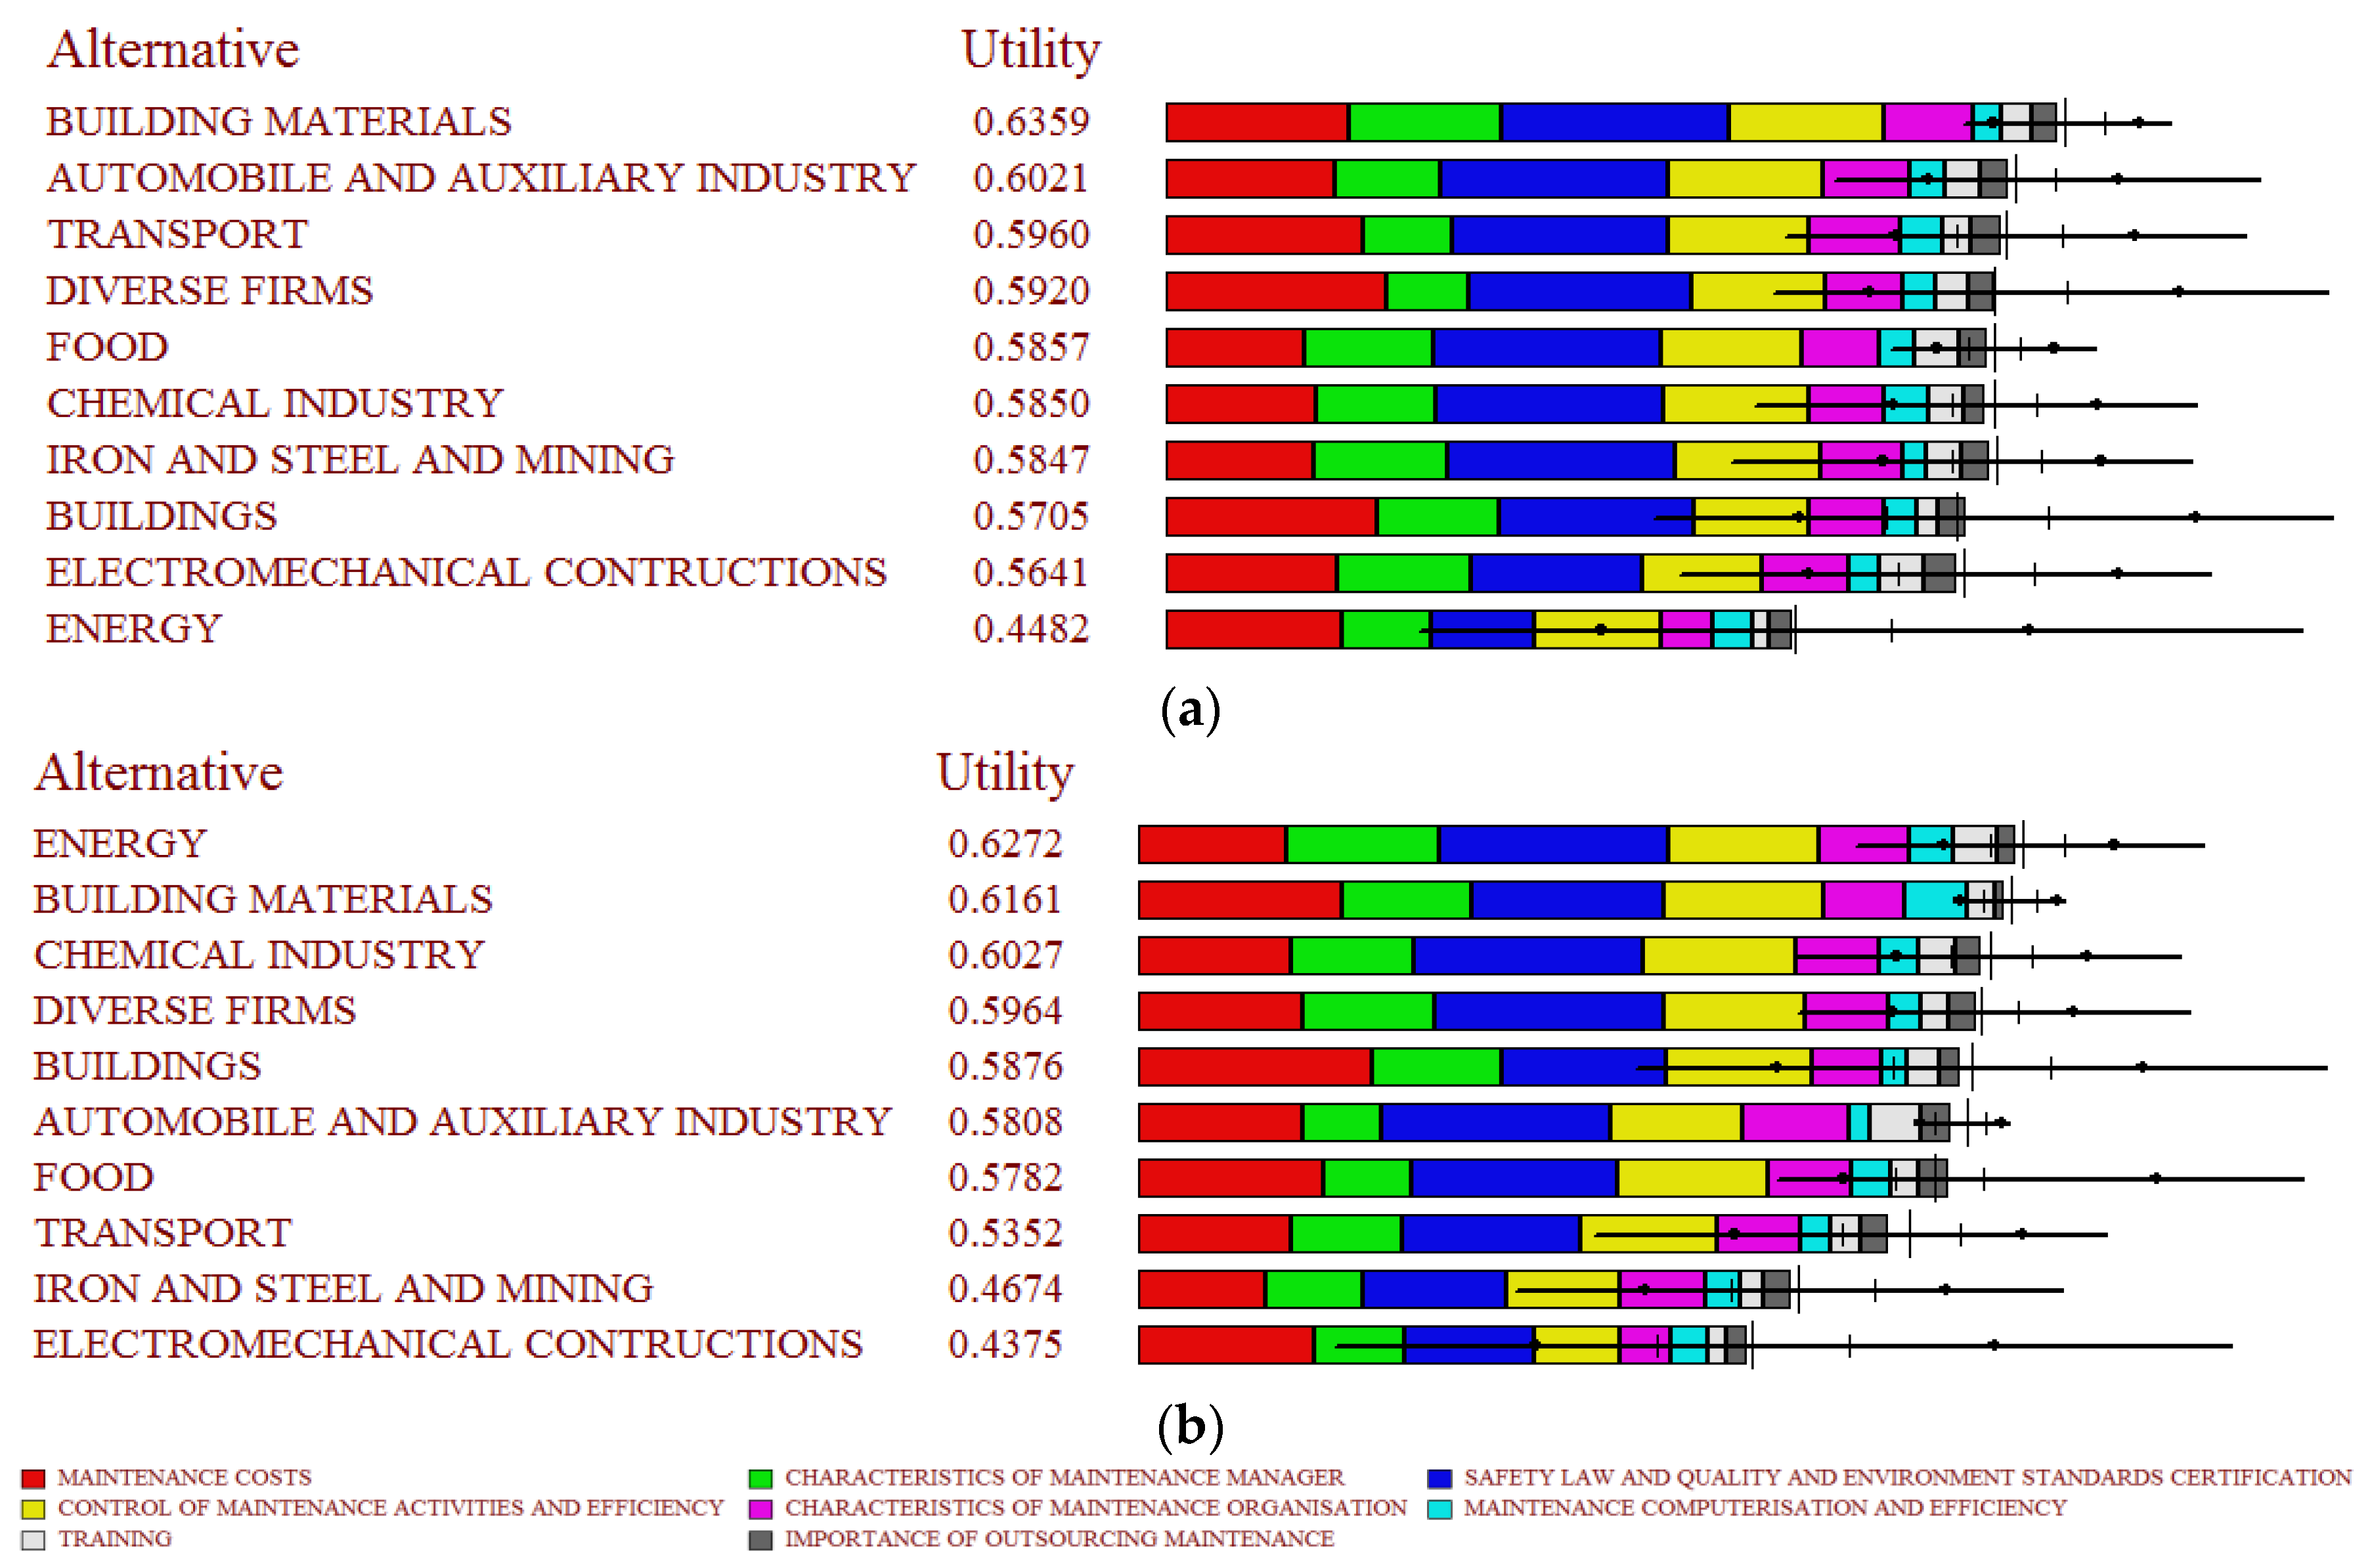
5.3. Companies with over 500 Employees
Figure 6 shows the results for companies with over 500 employees in 2005 and 2010. In 2005, Building materials had better maintenance, with a utility of 0.6359, followed by the Automobile and auxiliary industry (0.6021) and Transport (0.5960). The Energy sector had the worst results with a utility of 0.4482, but it can be seen that the uncertainty in the results is very high; this is due to the fact that no company from this sector filled out the questionnaire, so the results were obtained using constant probability distributions. However, in 2010, five companies filled out the survey, giving as a result the best level of maintenance with a utility of 0.6272.
Like in companies with up to 200 workers and with from 201 to 500 employees, the level of maintenance improved in a few sectors. Energy improved 39.94%. The Chemical industry had an improvement in maintenance of 3.03%, Buildings of 3.00% and Diverse Firms of 0.74%. However, the Electromechanical constructions, Iron and steel and mining and Transport sectors showed variations in the level of maintenance of −22.44%, −20.06% and −10.20%, respectively.
In general, the results are slightly poorer, as these companies have their own organisational structure for overseeing compliance with Spanish law on Health and Safety at work. This significantly affects maintenance since maintenance workers are more exposed to noise, vibrations, different kinds of radiation, dangerous substances, vapours and gases, heat in summer, cold in winter and high humidity than those in other occupations [
89]. In fact, 14–17% of accidents in Spain are related to maintenance activities (the only EU countries with a higher percentage are Belgium with 20% and Finland with 18–19%) [
90]. It should also be remembered that bad maintenance can cause accidents in the workplace. The sectors with the highest utility (1.000) in 2005 and 2010 were the Automobile and auxiliary industry, Building materials, Chemical industry, Diverse firms and Food. Energy also had the highest utility in 2010 (in 2005 there were no companies surveyed). The Electromechanical constructions sector had bad results in both 2005 and 2010, with a variation in utility of −14.92%.
In general, the utilities of the criterion total maintenance costs are worse in large companies than in other sizes of company; these results do not agree with Komonen (2002) [
23], who says that maintenance costs may triple as the size of a plant decreases; this could be caused by the fact that maintenance in Spain is considered a necessary evil instead of an area that can be optimised and can provide competitive advantage, and so by applying economies of scale, costs may be reduced. Energy was the sector with worst utility in 2010, a result that was repeated in companies with up to 200 workers. Food saw the most important reduction in maintenance costs, as 100% of those surveyed in 2005 had maintenance costs above nine million euros, while in 2010 50% had maintenance costs below 4.5 million euros. Other sectors that reduced their maintenance costs were Electromechanical constructions, Building materials, Chemical industry and Buildings with utility increases of 127.28%, 100%, 75.17% and 32.31%, respectively.
With regard to the percentage of corrective maintenance performed, the Building materials sector had the highest increase in utility (reduction in corrective maintenance) with 2444.53%, followed by Electromechanical constructions (248.71%) and Building (154.86%). Automobile and auxiliary industry, Transport (the same as in companies with up to 200 employees) and Diverse firms, on the other hand, are the sectors that had the biggest drop in this criterion (increase in corrective actions) with −88.13%, −42.62 and −25.61%, respectively.
In experience of heads of maintenance, Building materials had a significant increase in utility in the other company sizes, but did not show the same trend in large companies, where it decreased by −78.09%. It appears that this sector, one of those that has suffered the most in Spain in the recession, has replaced its heads of maintenance with more qualified professionals, as shown by the fact that 100% of heads of maintenance in 2010 were industrial engineers. The same applies to the Automobile and auxiliary industry. The sectors with significant increases in utility in 2010 were Transport, Diverse firms, Food, Energy, Chemical industry and Buildings.
As with companies with from 201 to 500 workers, in general a slight increase in utility can be seen in 2010 with respect to 2005 in the level of training of the heads of maintenance. As well as the Building materials and Automobile and auxiliary industry sectors, already referred to, the Energy (202.94%), Electromechanical constructions (108.92%), Diverse firms (67.65%) and Buildings (19.69%) sectors also underwent improvements in utility. The Food sector, however, showed a decrease in utility of 82.67%, as 25% of those surveyed do not have a university qualification.
Outsourcing has increased in utility in the Chemical industry (25.97%), Iron and steel and mining (11.30%), Food (10.17%) and Diverse firms (2.04%); as with other company sizes, the increase in utility is small compared with other criteria. Building materials had the largest drop in utility in this criterion (−63.61%), probably because of the serious recession in the sector, leading to a reduction in subcontracted services.
Satisfaction in the introduction of a CMMS saw an increase in utility of 279.51% in Building materials, 239.61% in Iron and steel and mining and 46.60% in the Food sector. The Automobile and auxiliary industry had the greatest decrease in utility (−100%) as 100% of those surveyed in 2010 state that the introduction has not achieved the expected results.
With respect to the criterion of qualifications, the Energy sector had the greatest increase in utility (119.49%) in 2010 with respect to 2005. The Automobile and auxiliary industry, Buildings, Transport and Chemical industry sectors also showed improvements with increases in utility of 46.67%, 31.52%, 17.20% and 6.31%, respectively. Electromechanical constructions, on the other hand, had the largest decrease in utility (−56.67%).
6. Discussion
The model presented in this article integrates fuzzy AHP and a Multi-Attribute Utility Theory to assess the state of maintenance in a country by industrial sectors and study its development both overall and by criteria and subcriteria. Furthermore, this model will facilitate the application of benchmarking by comparing the practice of the best sector for a criterion with other sectors. All of this could contribute to the application of tools like benchmarking in the area of maintenance, where the quality of contributions is lower than other areas, and especially in Spain, where the application of benchmarking is much poorer than in other countries.
It should also be noted that the multicriteria model described uses all the results obtained on maintenance in each sector of activity, instead of the mean values generally applied, favouring a more accurate assessment. The use of fuzzy AHP allows weightings to be obtained for the most suitable criteria and subcriteria, as the decision makers have doubts and uncertainties in their judgements, because the importance of the criteria can change slightly over time or by sector analysed.
In general, the level of maintenance is higher in small businesses than in medium and large businesses, where the utility values are lower; this was true both in 2005 and 2010. In large companies, Energy, Chemical industry, Buildings and Diverse Firms had improvements in utility, while this improvement is seen in the Building materials, Iron and Steel and mining and Diverse firms sectors in small enterprises and in Transport, Diverse firms and Energy in companies with from 201 to 500 employees.
Instead of improving maintenance in 2010 with respect to 2005, there is a reversal in some sizes of company. The economic crisis suffered in Spain since 2008 has, then, negatively affected the level of maintenance applied, instead of being considered an area that could provide cost reduction and improvements in productivity and quality to organisations. In general, behaviour with respect to maintenance is seen to be more similar in companies with up to 200 workers and with 201 to 500 workers than in large companies. As the size of a company increases, higher utility values are seen in both the 2005 and 2010 results.
By sectors, in the case of large companies it should be noted that Building materials had the highest utility in 2005 and the second highest in 2010. It should also be noted that the Energy sector had the highest utility in 2010.
Unlike the situation with large companies, in companies with from 201 to 500 employees, Building materials was the sector with the worst utility in 2005 and 2010, a position it also occupied in the case of small businesses in 2005. Thus, it seems that this sector, for small and medium enterprises, is where maintenance has suffered most as a result of the recession. Transport also has a very poor level of maintenance in small businesses and a variable situation in medium enterprises, where it occupied the penultimate position in 2005 and the top position in 2010. In large companies, it was in third place in 2005 and in last place in 2010. All this is worrying since maintenance applied in this sector can have an important influence on equipment anomalies that might affect a large number of users.
Electromechanical constructions is a sector where utility decreases as the size of the company increases. In 2010, in companies with up to 200 workers and large companies, it had the smallest utility and in companies with from 201 to 500 workers, only Building materials had lower utility.
The Automobile and auxiliary industry, a sector that has pioneered the application of maintenance policies like TPM, showed a worsening of behaviour in 2010. Thus, while in companies with up to 200 workers it had the highest utility in 2005 and the fourth place in 2010, in companies with from 201 and 500 employees it went from fifth place in 2005 to eighth place in 2010. In large companies it went from second place in 2005 to sixth place in 2010. So, although it is a sector with high dedication to maintenance, it suffered a significant decrease with respect to the pre-2005 levels.
In future work the intention is to update the model with the behaviour recorded in 2015 or 2020, if new national surveys are carried out. There is also an intention to ascertain whether other countries, particularly EU countries, have suffered the same decline in maintenance as Spain as a result of the economic crisis. There is a further idea of applying the Fuzzy TOPSIS technique instead of FAHP to the model to test the results obtained.


