1. Introduction
Graph theory provides for us a graphical approach to a system containing various elements with connections between them [
1,
2]. Chemical reaction networks are one such system, and small and simple reaction systems are visualized in linear or small graphs with sufficient understanding of reaction procedures [
3,
4,
5]. On the other hand, the networks of protein and metabolic systems in a biological cell are quite complicated due to their numbers of nodes (at least, more than 1000), so that not only visualization as a graph but also statistical properties such as degree distributions are representative for characterizing their complexity [
6,
7].
Recently, we performed graph visualization for plasma-enhanced chemical reactions [
8,
9]. In low-temperature reactive plasma, high-energy electrons trigger a number of simultaneous dissociations of mother molecules, and its chemistry is more complex than other chemical systems in artificial environments for chemical plants [
10,
11,
12]. After definitions of a node (for one species) and an edge (for each reaction) for a display in a graph, centrality indices of nodes derived from the graph work as representatives of chemical roles in the system, such as agents, intermediates, and products. However, except for such microscopic points of view, approaches have not been accomplished for describing macroscopic properties of graphs for chemical reaction networks that contain several tens of species.
Such relatively small-sized chemical network systems create rich outputs despite limited numbers of nodes and edges in a graph. For instance, information processing in biochemical reactions revealed collective behaviors that can be interpreted using interactions among analogical spins, leading to similar features to electronic information processing or mechanical systems [
13,
14]. Another example of graphical network approaches for medium-sized chemical complexity was on numerical calculations of rate equations in plasma-enhanced chemical reactions, and the calculated results were visualized in reaction pathways in a graph to summarize complicated time evolutions of densities of species [
15]. In comparison with the previous achievements based on numerical finite-difference methods [
10,
11,
12,
15], direct visualization of reactions based on graph theory is applied here, and we focus on graphical classification of nodes or species on statistical aspects that are missing in our previous studies [
8,
9].
In this study, for such systems as medium-sized chemical reaction networks, which are neither so small as several numbers of reactions nor too large with more than 1000 species, we demonstrate suitable macroscopic measures by graphical diagrams based on multi-centrality indices. Using such diagrams, semi-statistical properties with confirmation of systematic and global structures in the corresponding system can be deduced, even if the total number of nodes is limited to less than 100, as well as identifications of roles in each species, such as agents, intermediates and products. This method of classification of species in macroscopic points of view provides us with insight and understandings about predictions of global properties of chemical reactions for approximate designs of upcoming chemical reactors and rapid selection of mother chemicals for products when accurate computer aided designs are not available. In
Section 2, using reactions in silane and methane plasmas, we show the diagrams with axes of betweenness and closeness centrality indices. Using such a diagram, we can understand both macroscopic and microscopic properties of graphs with tens of nodes. In
Section 3, we compare these two examples with random graphs, and discuss the validities of this graphical characterization.
2. Analysis of Reaction Networks in Plasma Chemistry
As examples, we use two plasma-enhanced chemical networks reported in [
10,
11]. We performed some analyses of methane plasma [
8] and silane plasma [
9] using some centrality indices, but they did not include macroscopic measures of complex chemical networks. Here, we proceed to study them using the same reaction systems to obtain their macroscopic and microscopic properties simultaneously.
Table A1 in
Appendix A shows active species in silane plasma with temporary indicator numbers, where we use reaction sets in [
11]. There are a wide variety of species that originate initially from two species: SiH
4 and Ar. The number of species or nodes in the corresponding graph is 58, and that of reactions or edges is 222. The reason why we can observe such rich diversity is based on high-energy electrons whose energy spreads up to 20 eV with electron temperature of 1–5 eV; kinetic energy with 1–20 eV induces most of reactions of decomposition, dissociation and ionization [
16]. Almost all reactions are bi-molecule, and we treat all reactions as irreversible ones.
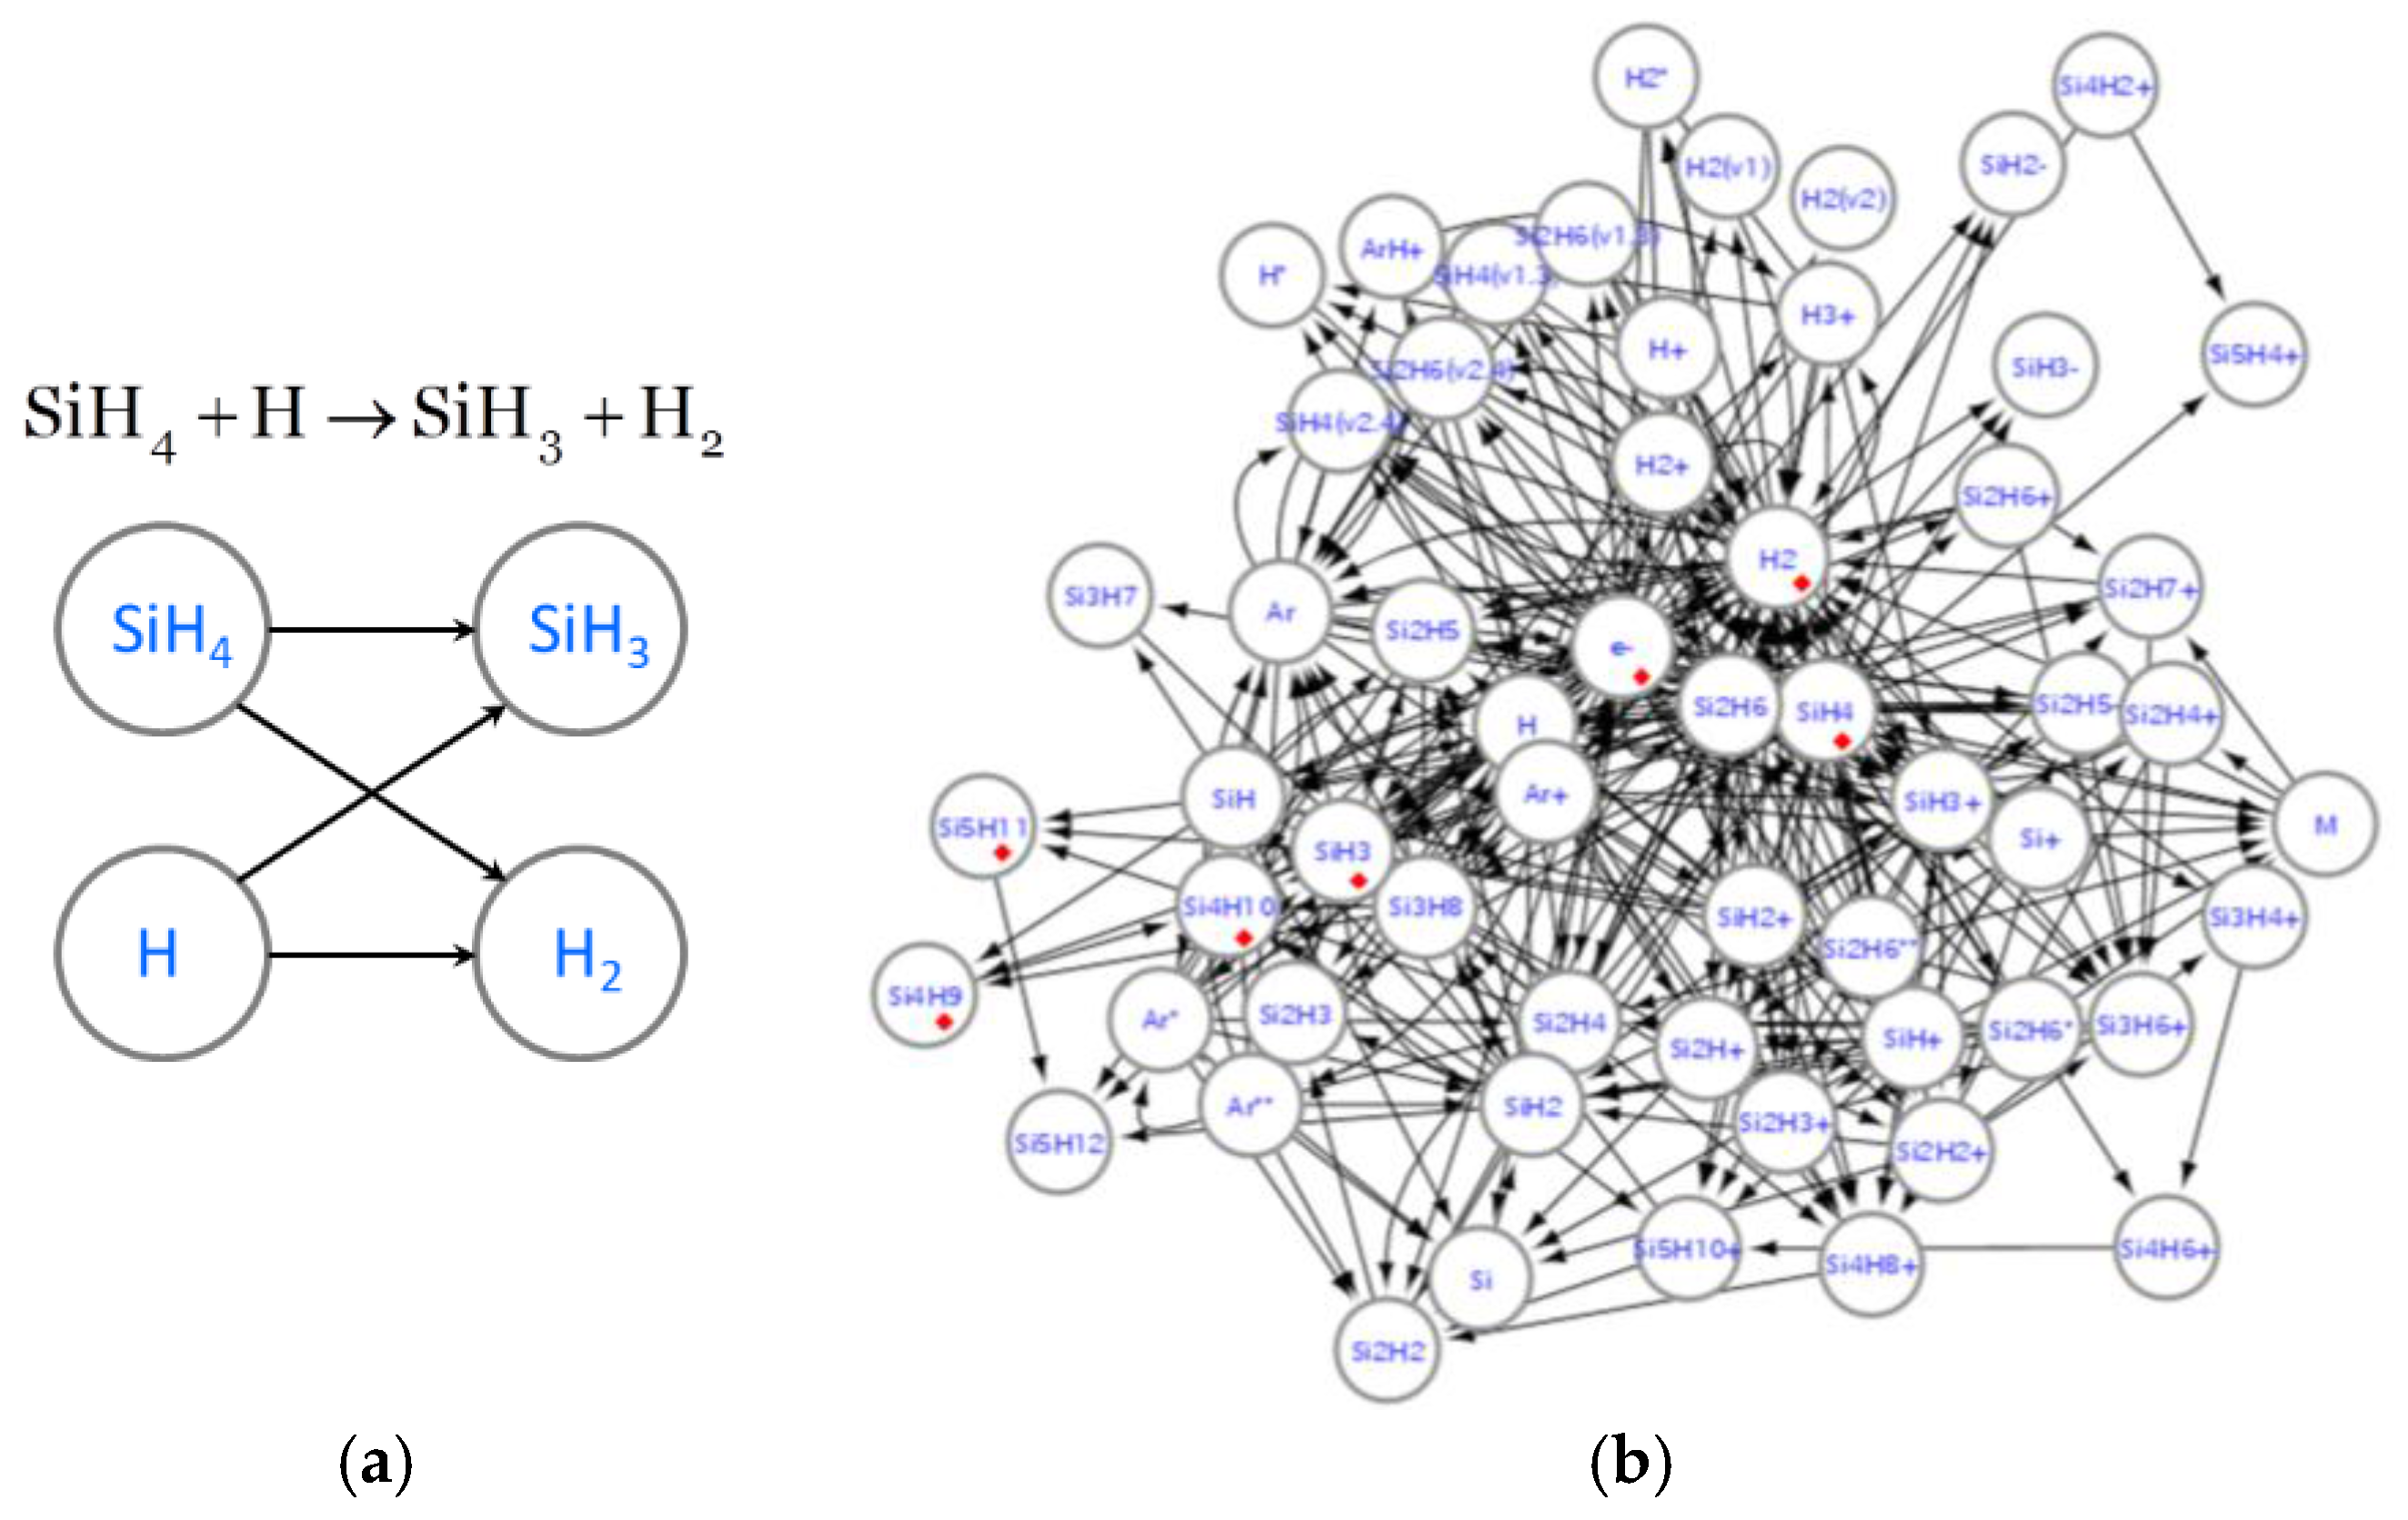
To convert a chemical reaction into a graph, when we handle the following reaction,
and use the names of species in reactions as node indicators, we set directed edges from node
to node
, from node
to node
, from node
to node
and from node
to node
, as shown in
Figure 1a. When one performs graph representation for an underlying system of interest, elements of the system becomes nodes and interactions between elements are displayed as edges. For chemical reactions, as interpreted in [
3], species becomes nodes, and not a simple co-existence but an agent-product relation is suitable for a directed edge, leading to a form of representation in
Figure 1a. In general chemical reactions for inorganic molecules, since roles of agents, intermediates and products are fairly clear with energy consumption as driving forces, regular graphs or graphs with frequent cycles are less important, and monotone graphs or trees with several nodes are sufficient in many cases [
3,
4,
5]. However, in reactions enhanced by energetic electrons in plasma, cycles appear with their various sizes with increasing values of clustering coefficients [
8], which makes a role of each species more complicated.
After completion of an edge list for a graph, we calculate several centrality indices. In this study, we use betweenness centrality index
and closeness centrality index
.
is defined as [
2]:
where
,
and
are species/node indicator numbers and
is number of the shortest paths between nodes
and
.
indicates number of
passing through node
.
is defined as [
2]:
where
is distance or edge numbers from node
to
along the shortest path. Since we consider directed graphs, no path may exist from node
to
; in such a case,
is defined as number of all nodes. This fact indicates that, although
represents one of the topological aspects, it includes a measure of agents in chemical reactions. In our previous studies [
8,
9], we calculated simplified PageRank values [
17], which represent information on roles of species, i.e., in a microscopic point of view. In this study, we put more emphasis on analysis of topological and statistical properties of graphs, and
and
are suitable for this purpose.
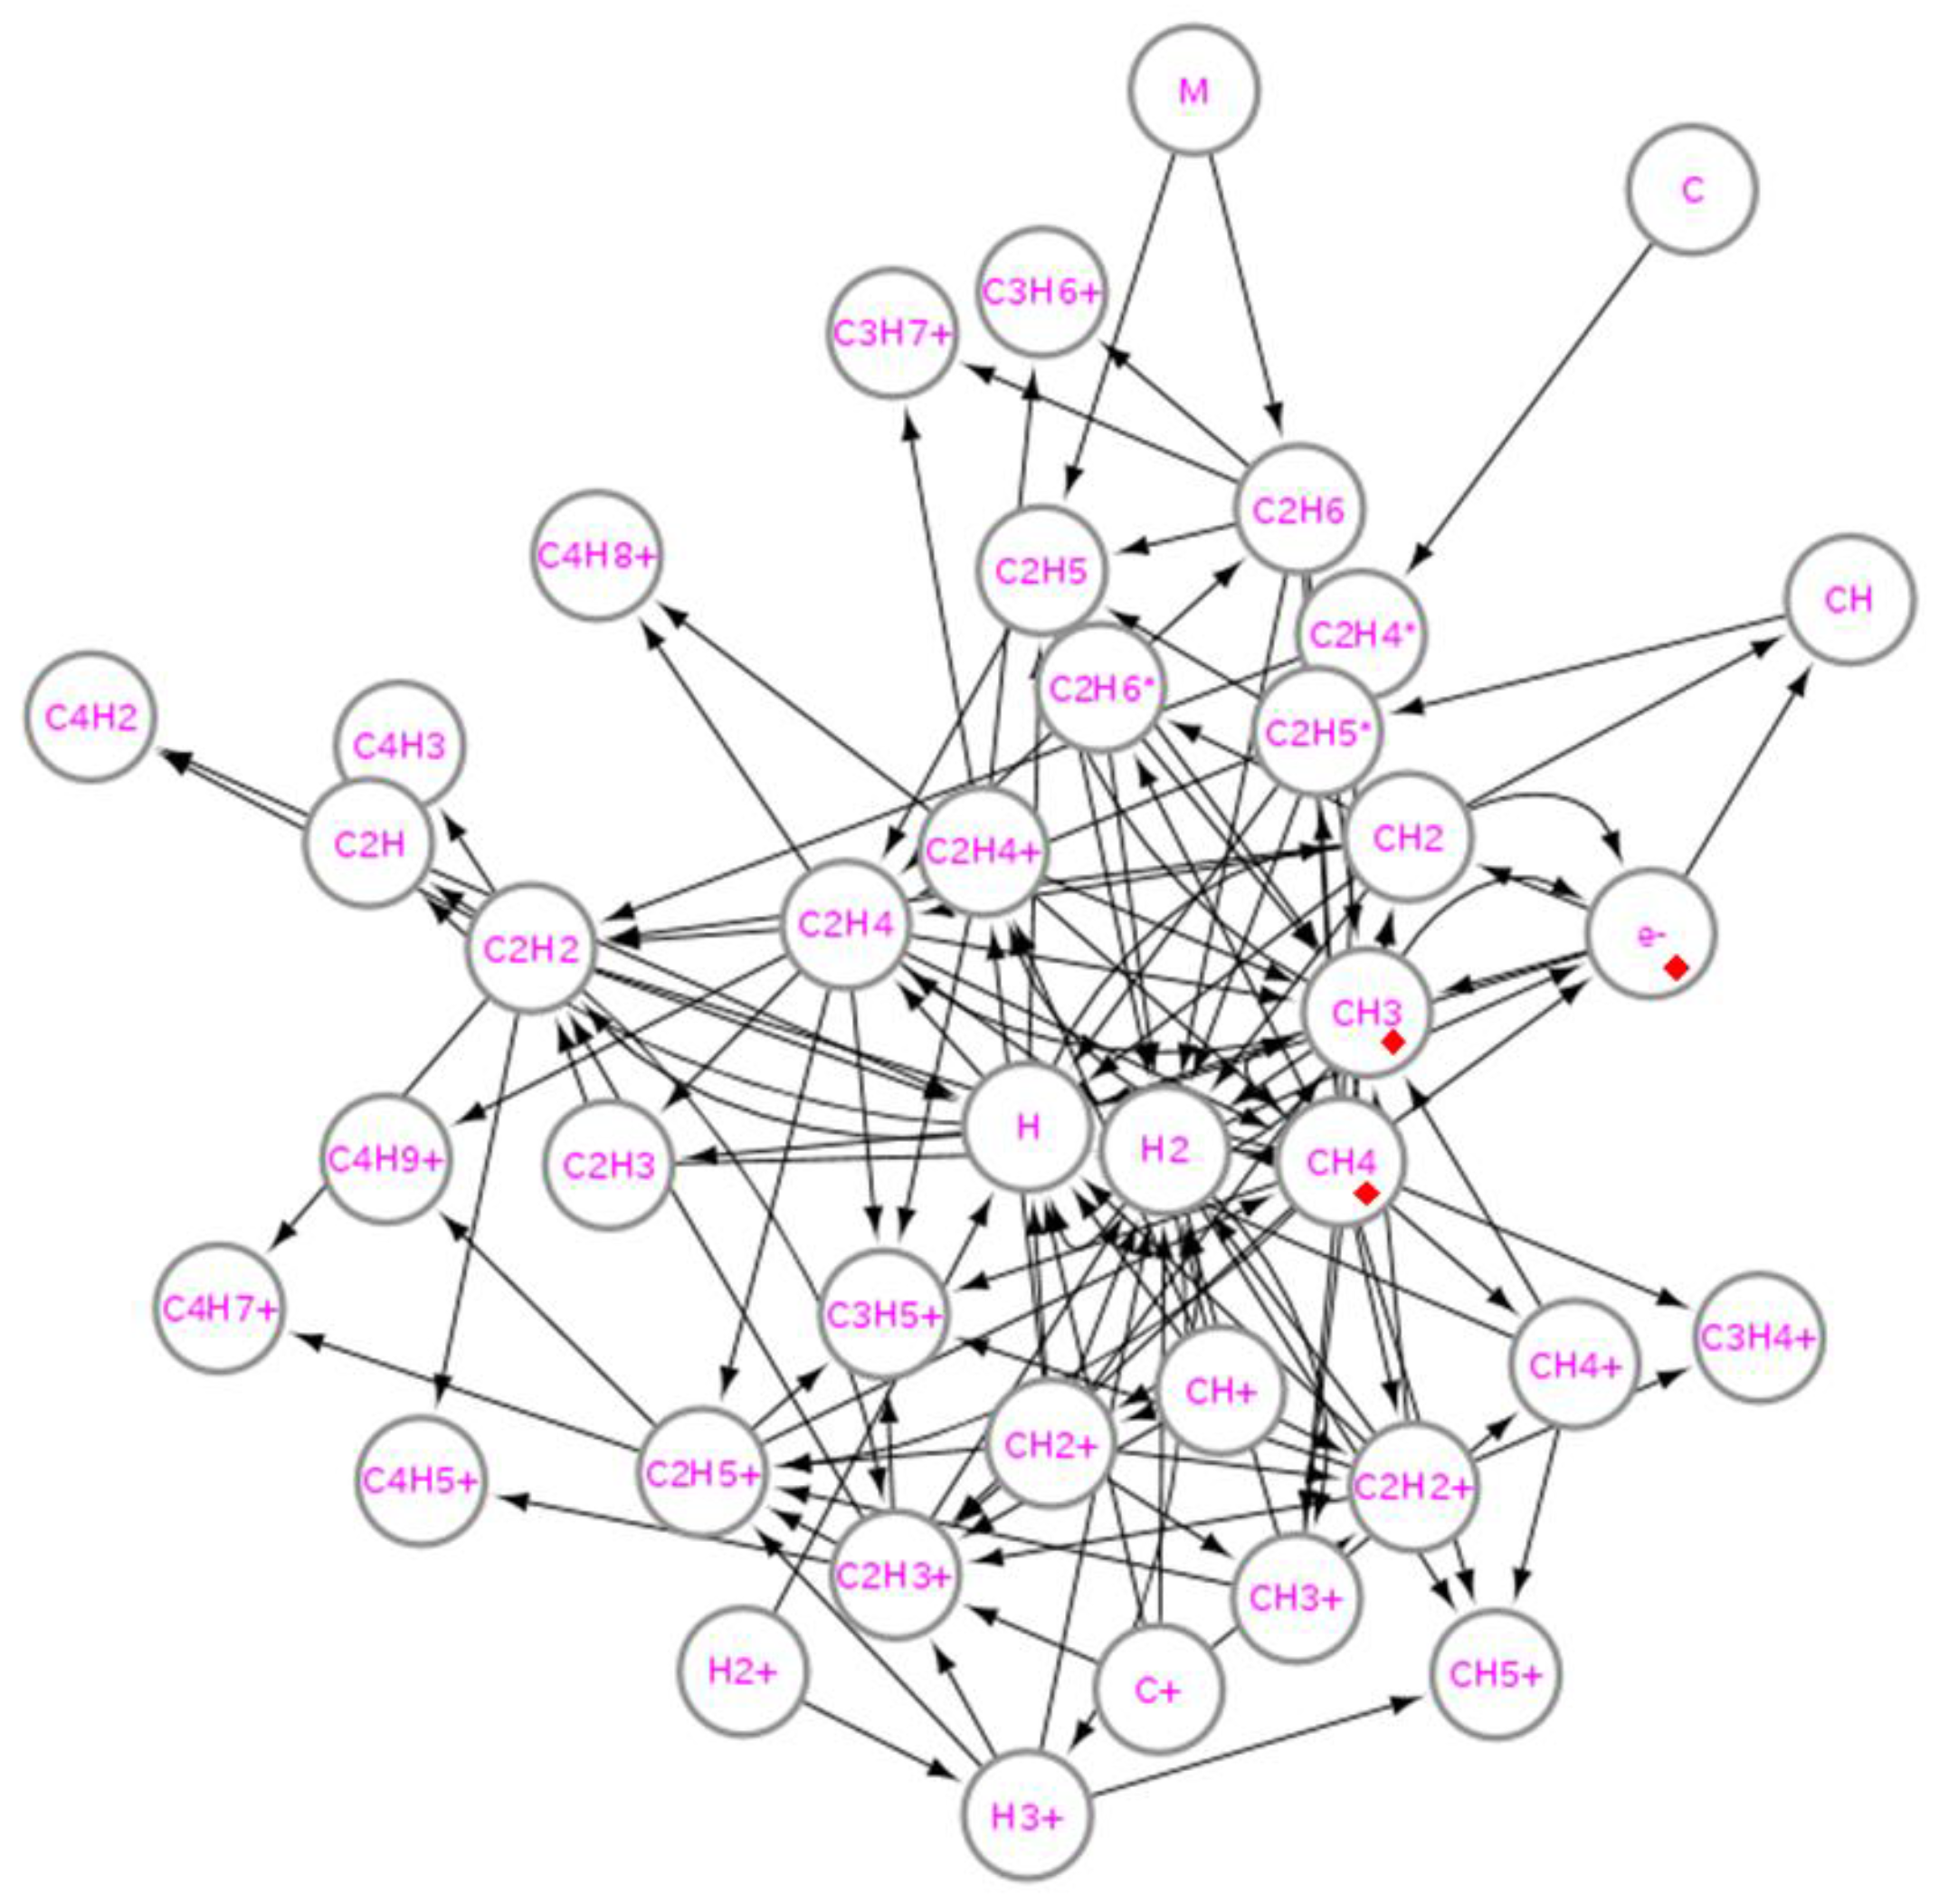
Figure 1b shows the graph of reactions with species in silane plasma. Since the number of nodes is not large, we can identify an individual species. On the other hand, the number of edges is pretty large, and we cannot trace all of them. For complex networks with huge size, one can recognize neither of them, and they are mainly analyzed using statistical properties (i.e., Power-law tails in degree distributions [
18]) from a macroscopic point of view, neglecting identification of microscopic roles of each species. In our case, however, the number of nodes is insufficient to obtain smooth statistical trends.
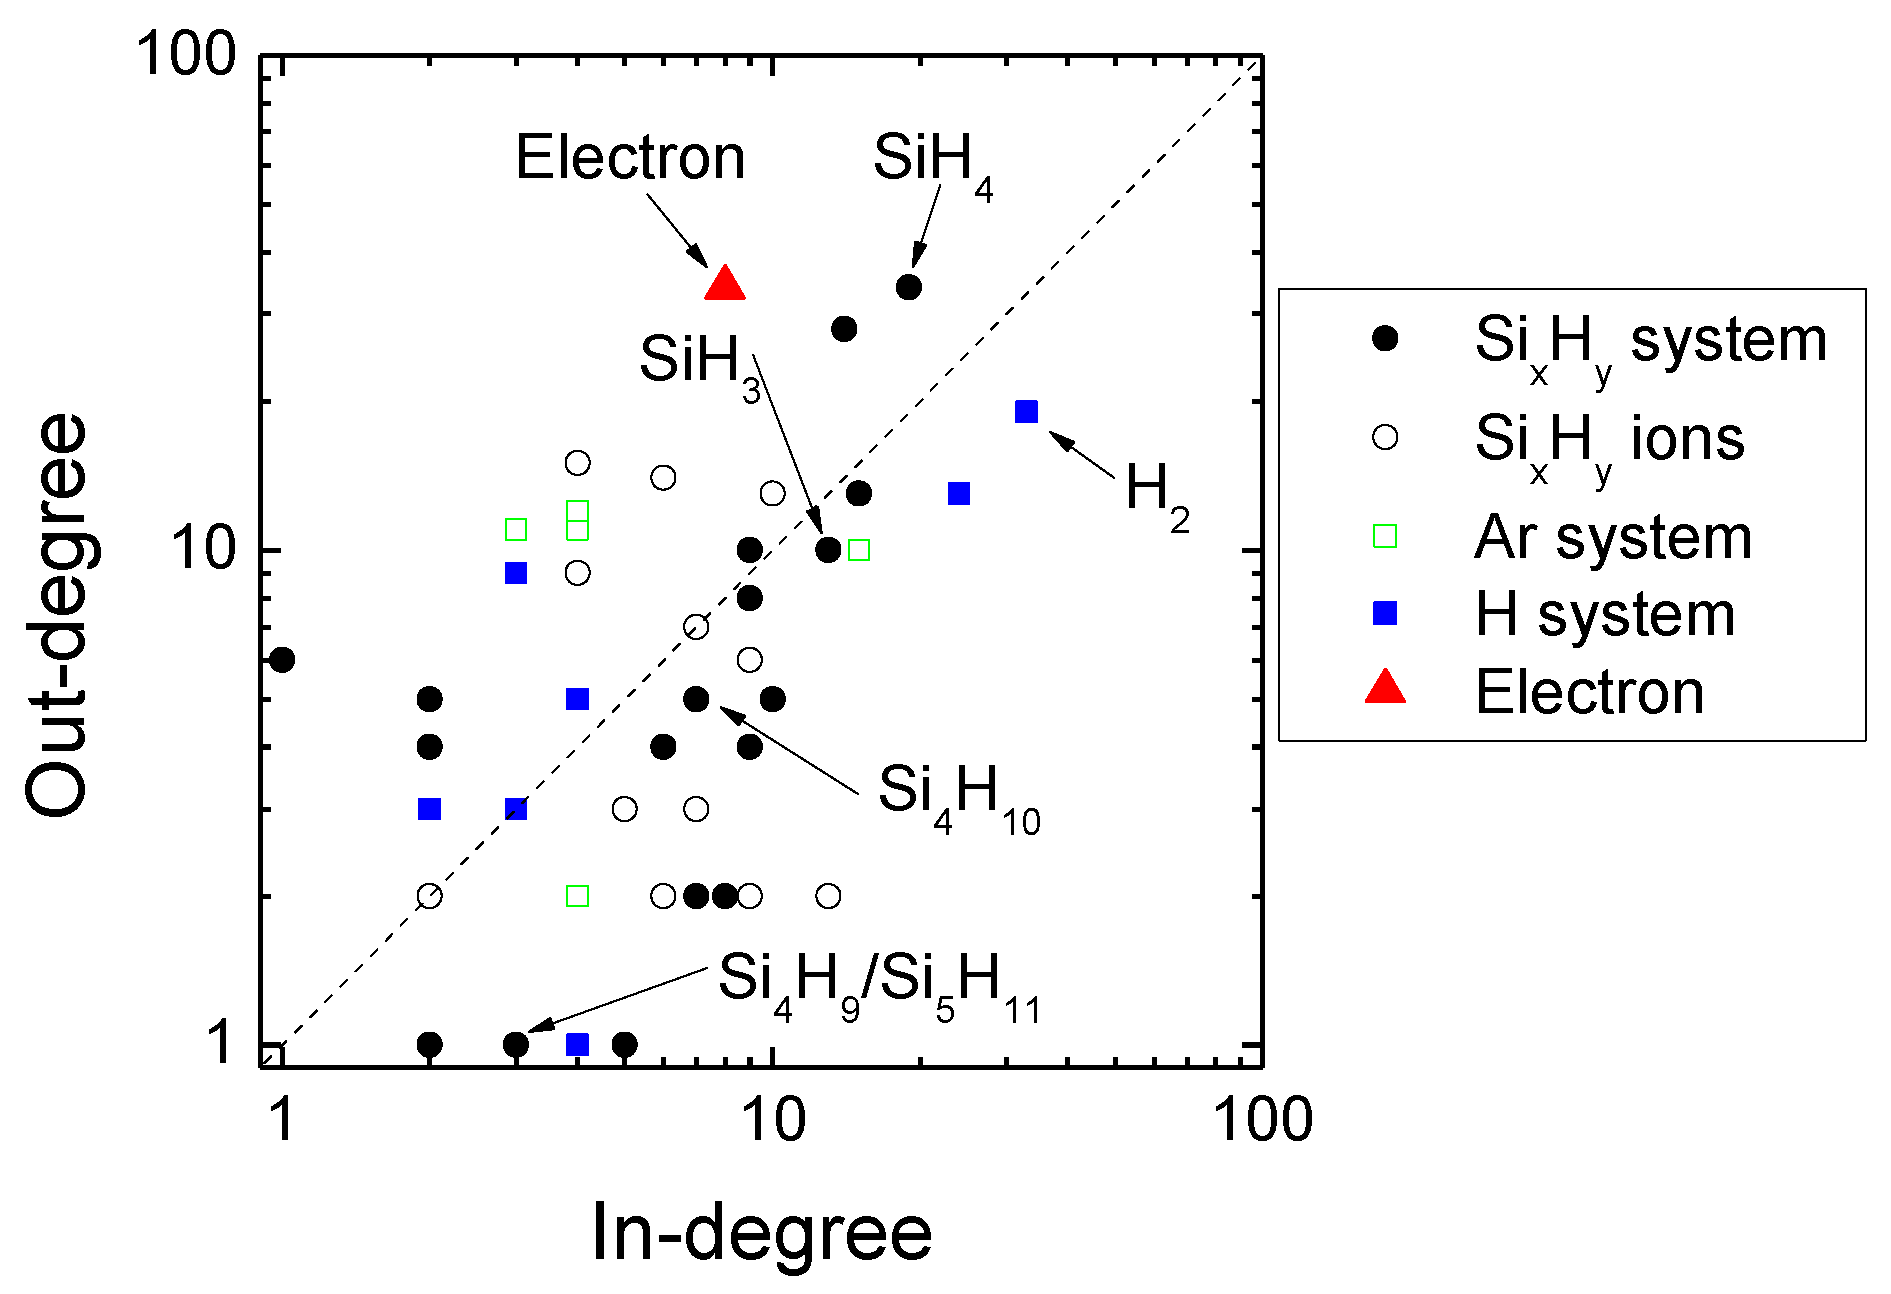
Figure 2 shows the in-degree and out-degree distribution. Nodes scatter broadly in both sides of the dashed line that shows equal numbers of the in-degrees and the out-degrees, which indicates both agents, with larger values of the out-degree, and products are present in balance. When we carry out searches for global information in
Figure 2, although it indicates that this degree distribution is not the Poisson one, we cannot clarify its statistical characteristic at this moment.
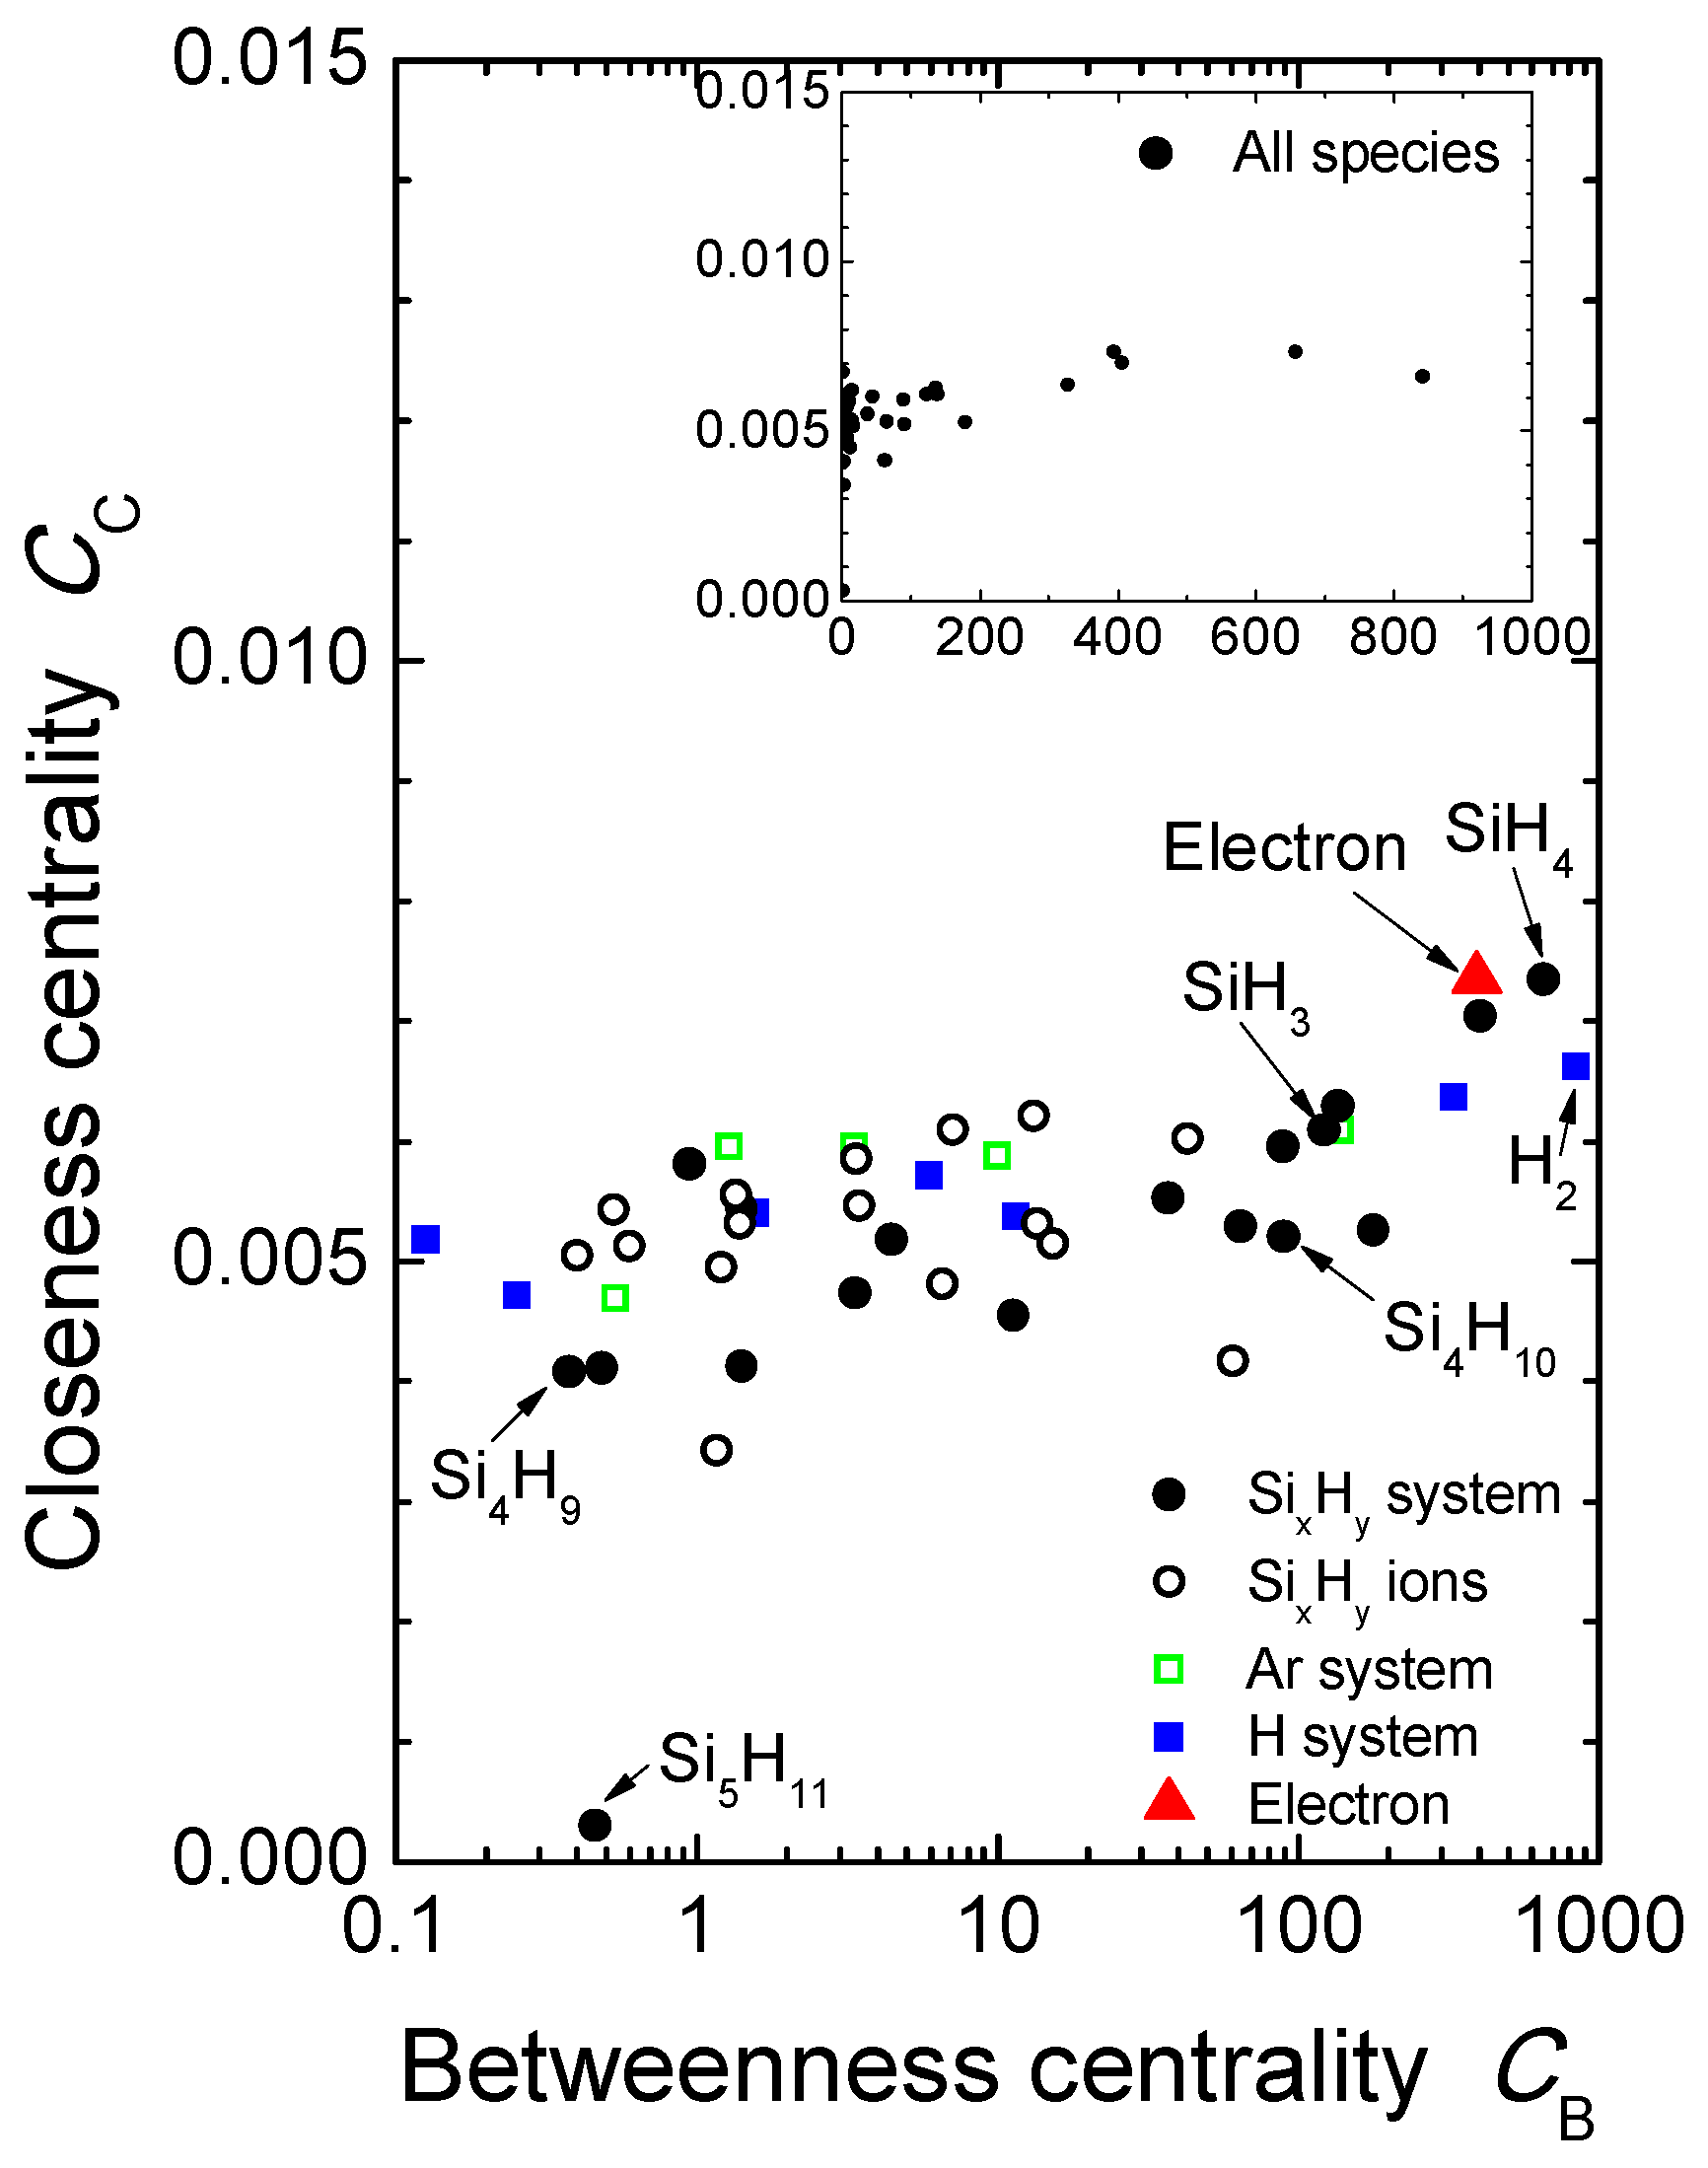
Here, we propose a diagram with
and
to analyze a macroscopic property of a graph and to obtain microscopic roles of species simultaneously, as shown in
Figure 3 for the graph in
Figure 1. In general, both
and
show centrality indices, and a node closer to the center has a higher value, and positive correlation is roughly expected between them. However, this diagram includes various types of information, as described below. For instance, nodes
and
are located in the periphery region of
Figure 1. Both of them are in the low-
area in
Figure 3, but their positions in the diagram are different.
has three directed paths from other species and another to
. The degree, the total number of edges, is limited to 4 as shown in
Figure 2, and we can recognize the edges and the nodes around
in
Figure 1. Consequently,
is not a significant species that affects many reactions, and it is located in the low-
area in
Figure 3, while
of
is in the middle range.
also has three directed paths from other species and one directed path to another species,
. It is in the low-
area with very low
. The difference of locations between
and
is destination of out-degree edges;
is more active in reactions than
in our model, and we can clarify such a point using this diagram. Note that both of them have the same statistical values of degrees, and they are in the same position in the degree distribution that is a conventional classification in theory of complex network [
2].
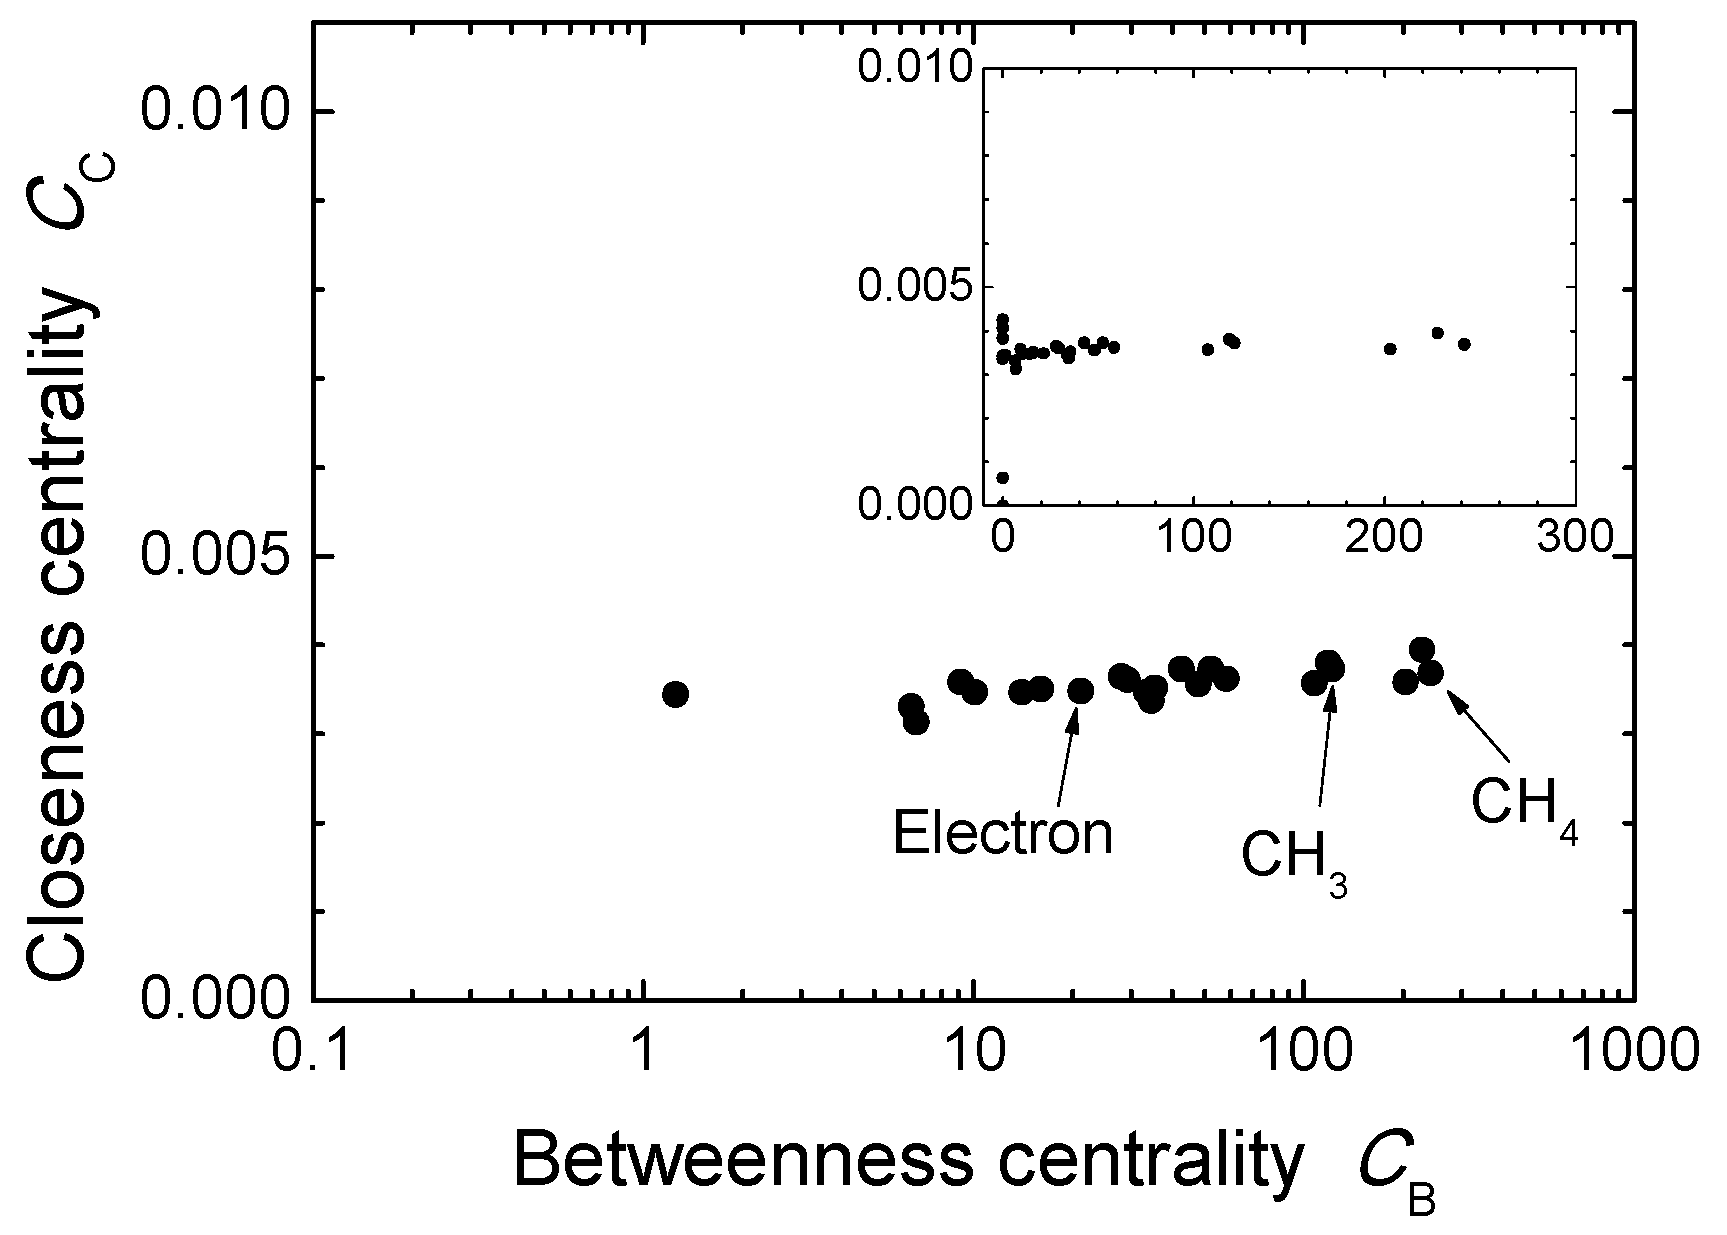
From a macroscopic point of view, this diagram displays semi-statistical properties of the graph as a visual classification tool. The overall distribution of data points displayed here is fairly uniform along the
axis, and it covers the range in 4 orders of magnitude of
. The
system, which includes main species coming from the mother gas,
, is distributed throughout the entire range. The H system, which also originates from
, scatters in all ranges. The Ar system is in a less important area as
values. In the area with high-value
, stable species such as
and
exist, and electrons are also one of the highest-value species both in
and
.
, which is the most important precursor for Si thin film deposition using silane plasma, is also in this high-value region. In the case of the linear
axis shown in the inset of
Figure 3, data points are concentrated around 0, and a few of them scatter in the area of high
, which is not a sufficient visualization of the graph. A logarithmic plot for
is a key manner for graphs for reaction paths and visual classifications of chemical reactions, in particular, in plasma-enhanced chemistry.
Another fact that we can deduce from this diagram is rough estimation on differences coming from roles of species. Values of
, which are shown along the vertical axis, become high when the out-degree of a given species is larger than its in-degree (see
Figure 2 to confirm these correspondences). For instance,
of
is larger than that of
: the ratio, in-degree/out-degree of
, is 19/34, while that of
is 33/19. Electrons have also unbalanced values: the ratio is 8/34. These facts indicate that species mainly working as agents (on the left-hand side of chemical reactions, such as
and
in Reaction (1), having larger out-degrees) are in the upper area of
. Products in chemical reactions tend to be in the lower area.
Figure 4 shows another example of chemical reactions,
system in methane plasma. In [
8], we treat species except ions, but here we include all species listed in Ref. [
10], shown in
Table A2 in
Appendix A. The
diagram for the graph in
Figure 4 is shown in
Figure 5, which is quite similar to that in
Figure 3; the area of
is quite wide in comparison with the width of the
range. Also, most of the species that have been so far pointed out on their importance of roles are located in the higher-
range. In a microscopic point of view, we can also find similar points to the case of silane plasma. For instance,
and
are in the similar locations to
and
in
Figure 3, respectively. Our previous report [
8] in which the centrality indices similar to PageRank [
17] indicate importance of
, and the result here is consistent with the one in Ref. [
8]. There are a few points that are different from the case of silane plasma, such as the location of electrons between
Figure 3 and
Figure 5, although such a feature may be a factor coming from each specific system.
Two results shown here indicate that complex reactions in plasma chemistry can be visualized in a diagram, and both macroscopic and microscopic properties are derived from it. In particular, since plasma chemistry includes various levels of roles as well as wide range of contribution frequencies to reactions, the range of node distributions along the axis is quite wide. , given by Equation (2), includes information as reaction connection between species, while indicates rather simple information about a location in a network.
3. Discussion
Figure 3 and
Figure 5 show wide-range distributions of nodes on the
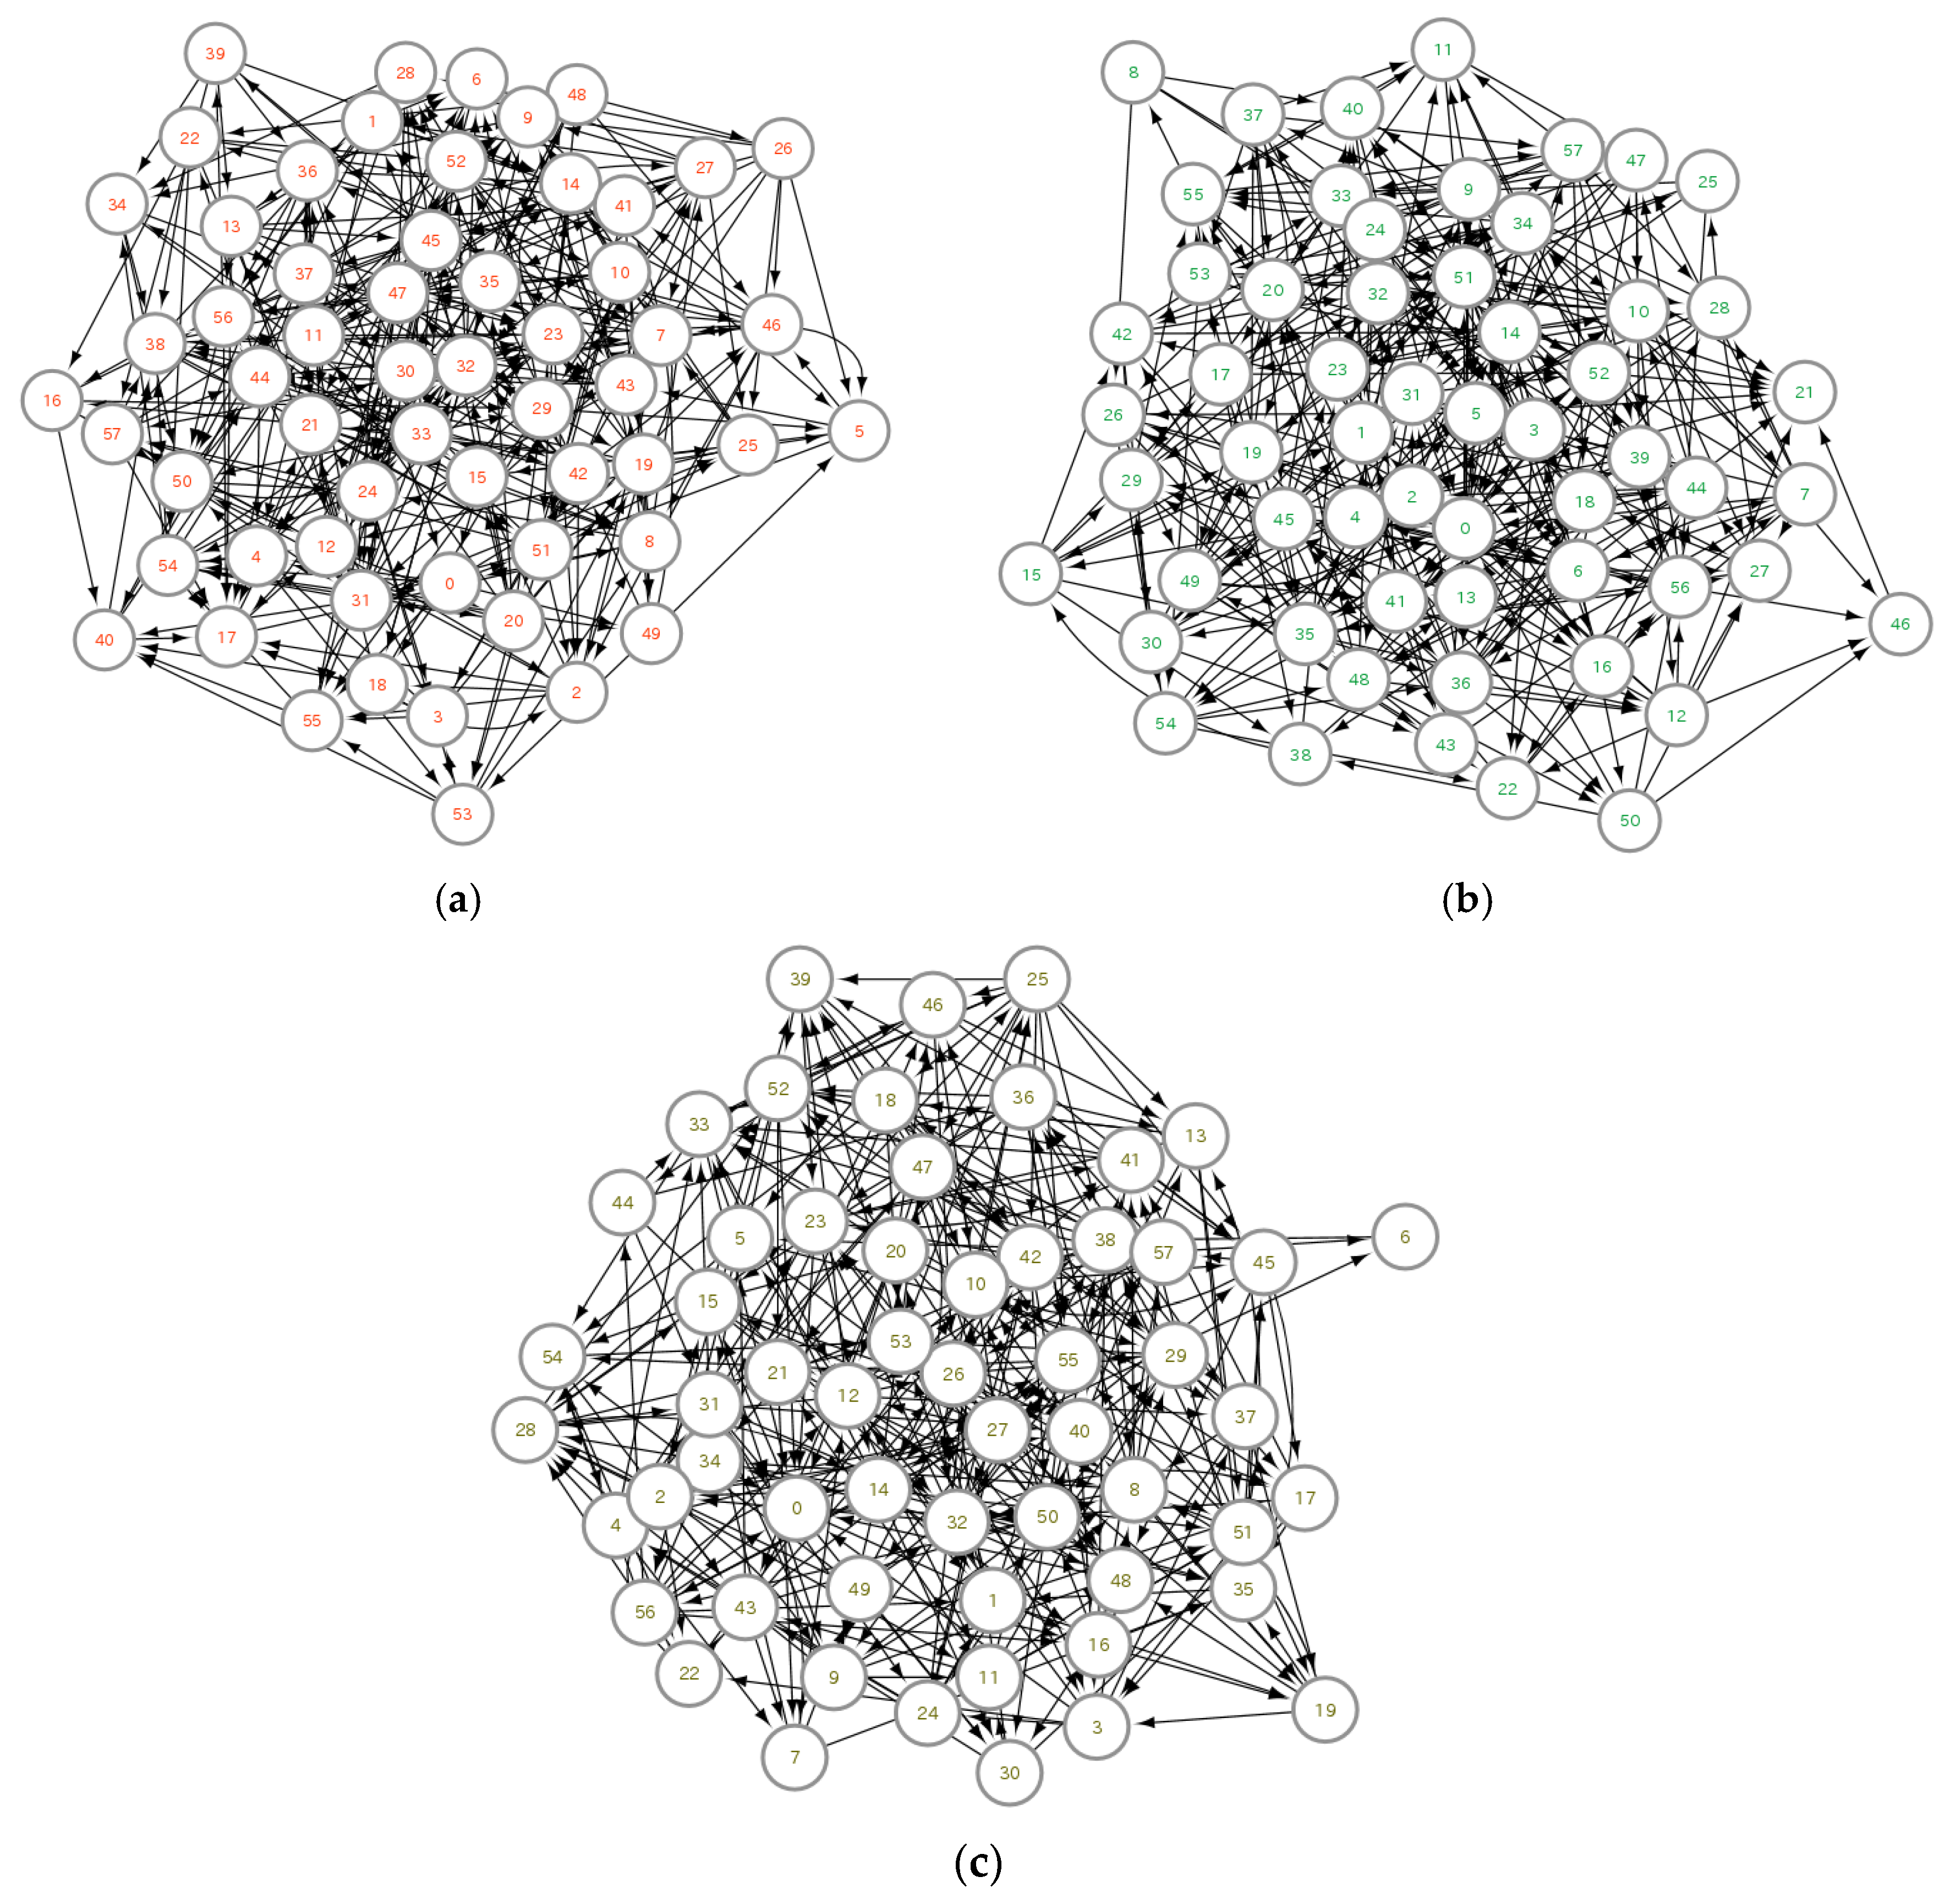
axis, but it might arise from simple randomness that also exists in random graphs. Here we compare such tendencies to those in arbitrary random graphs.
We fixed the numbers of nodes and edges to the ones in
Figure 1, and created random graphs with directed edges in computation.
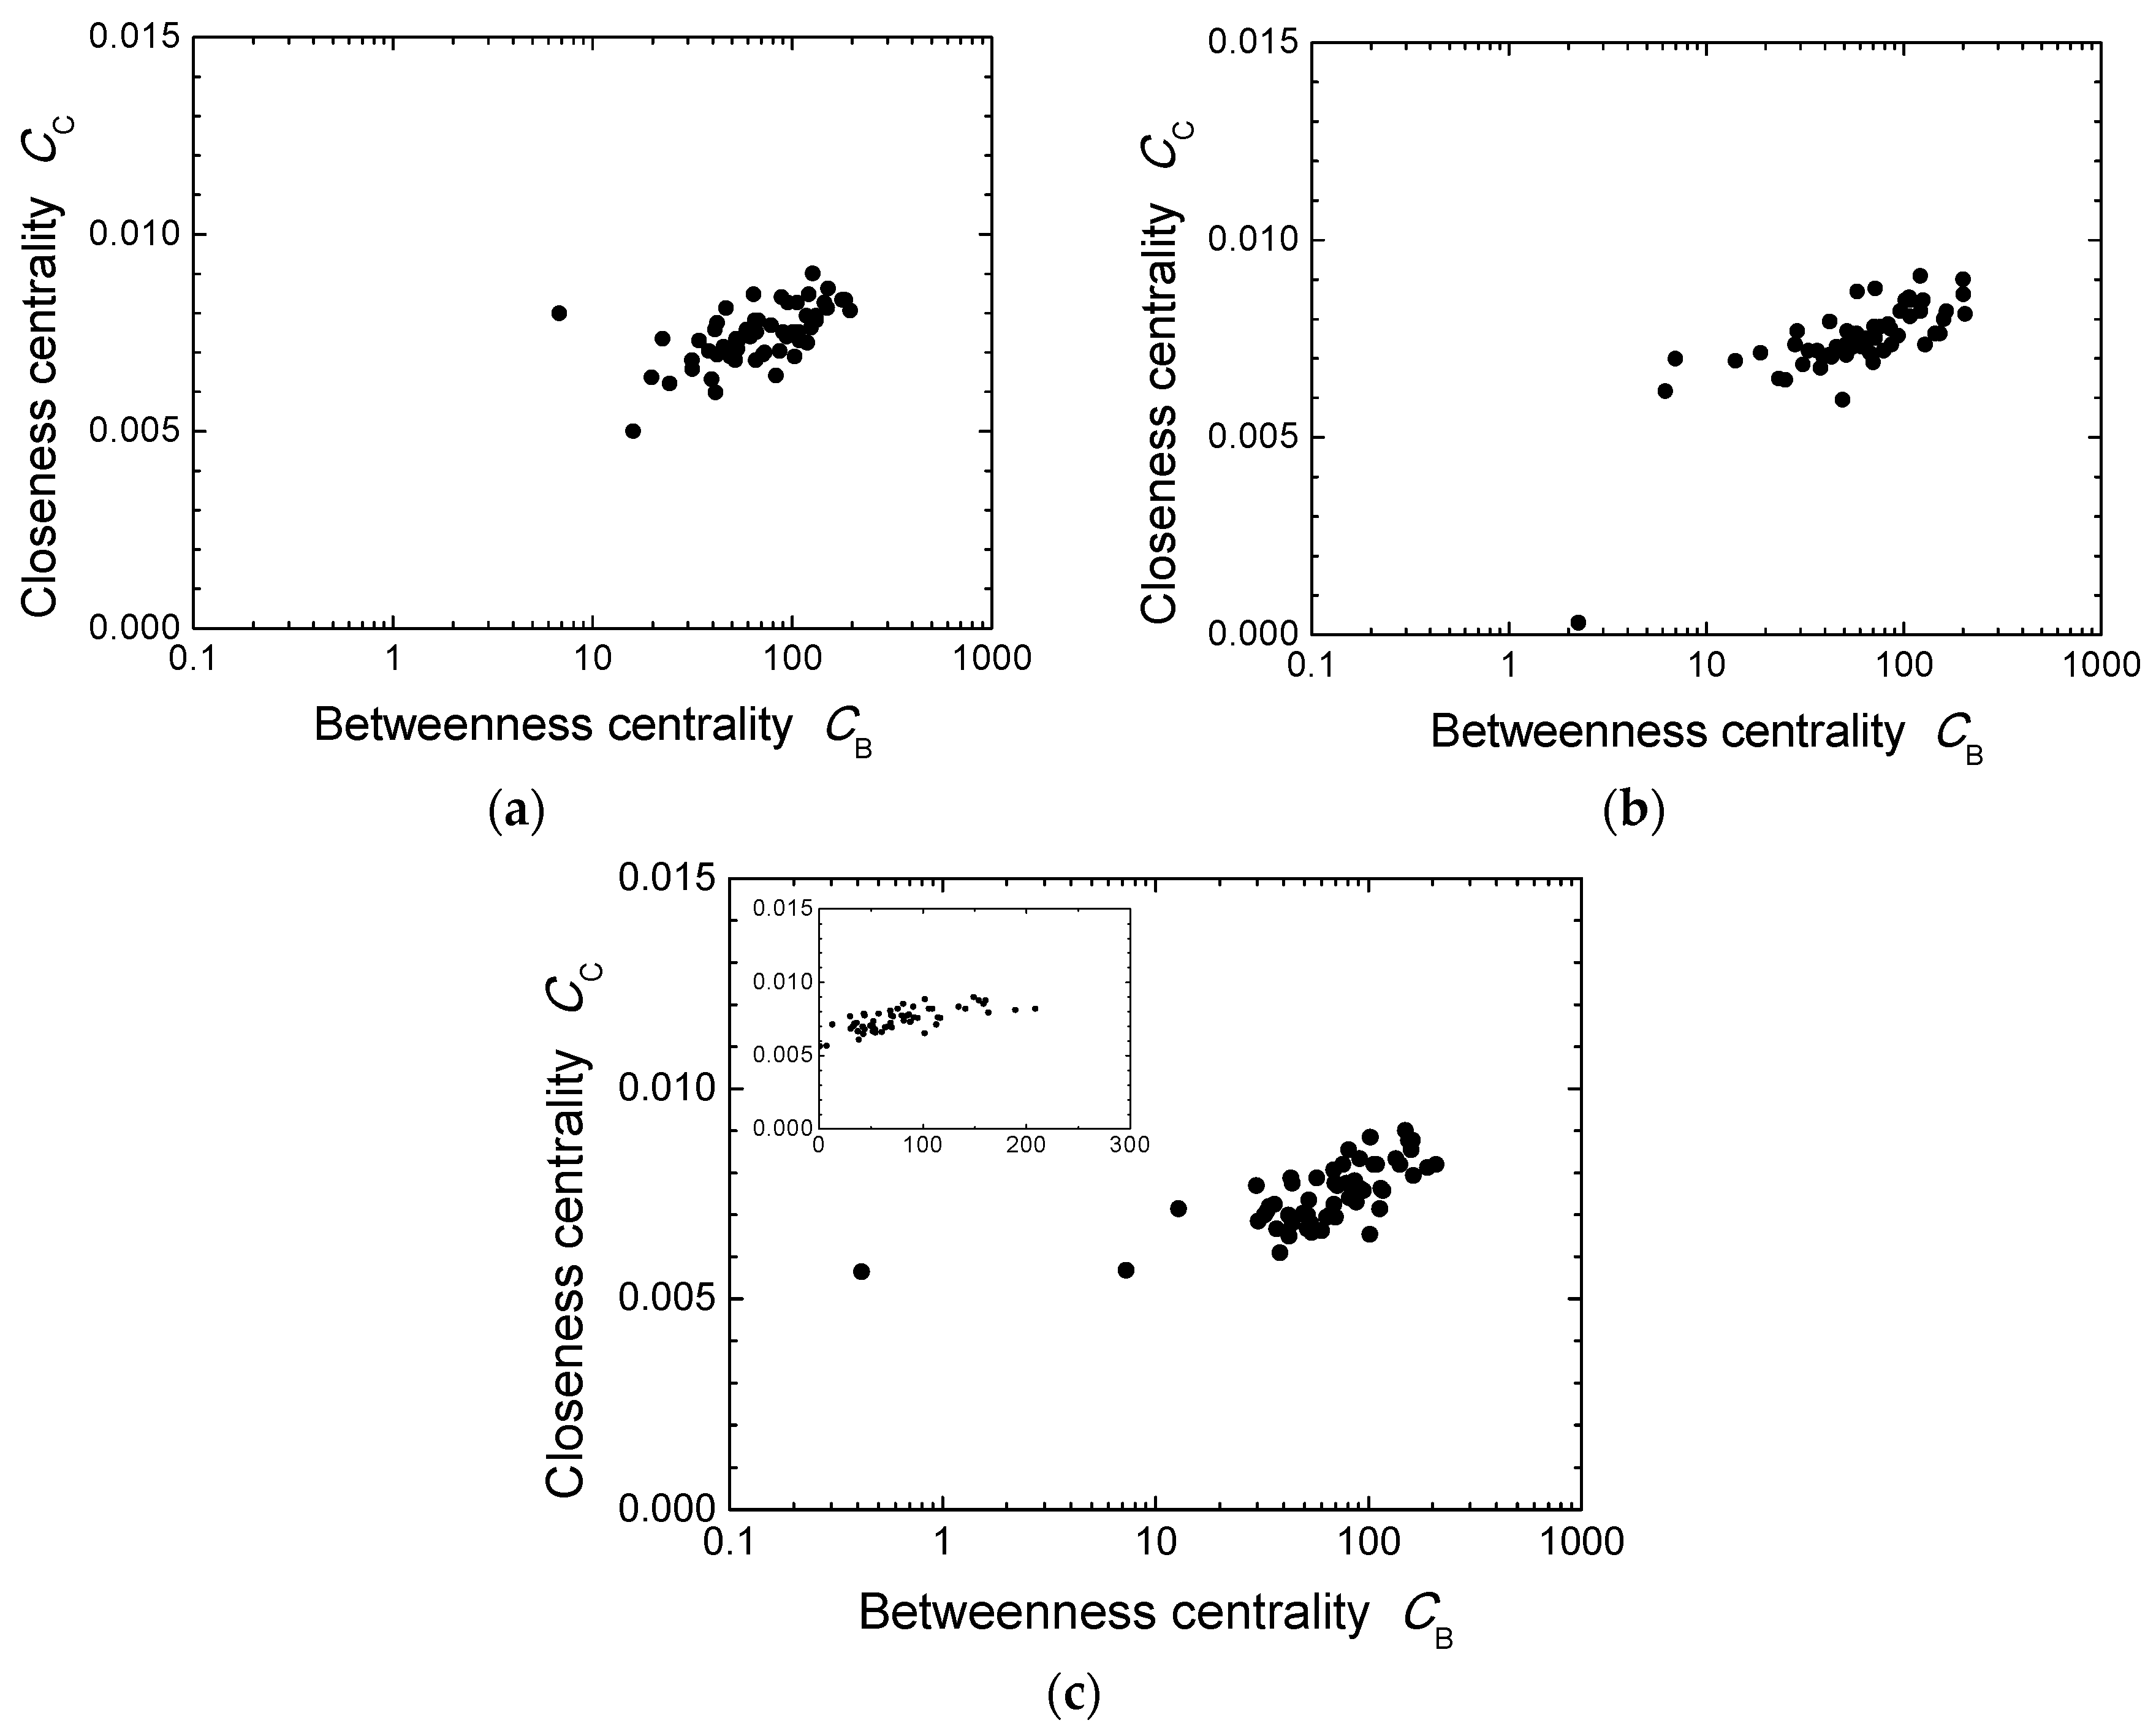
Figure 6 shows three examples, and we cannot see any common points in allocation of roles for specific species. In all
diagrams shown in
Figure 7, the values
and
for the nodes are around a certain area. In particular, the values of
is in a range with approximately one order of magnitude except for a few nodes. This is attributed to the fact that degrees of random graphs are in the Poisson distributions [
18].
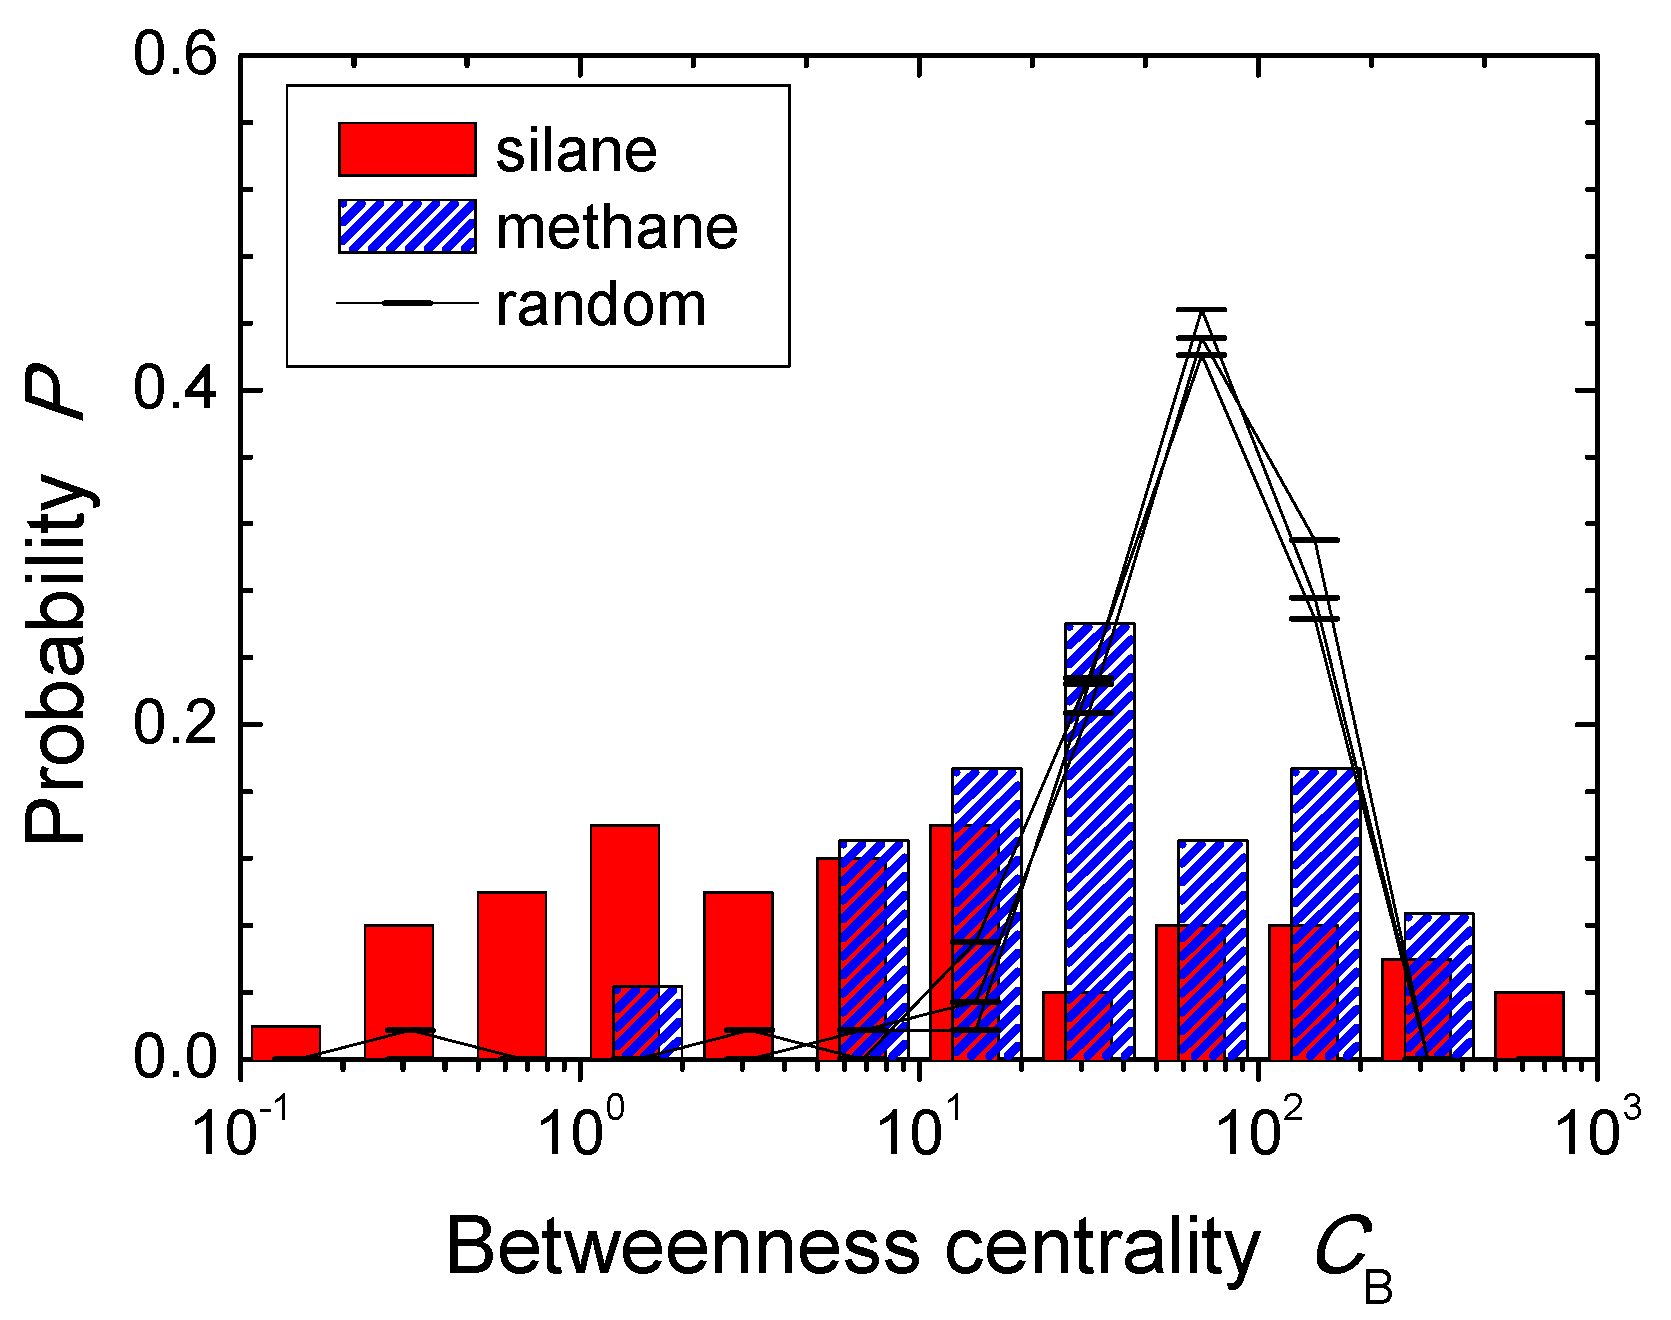
To compare spectra in the
scale, the data in
Figure 3,
Figure 5 and
Figure 7 are summarized as histograms of cumulative probabilities or relative densities
in
Figure 8. Values of the nodes in random graphs are localized around
, and almost no changes among these three plots. This is attributed to the fact that degrees of random graphs are in the Poisson distribution [
18], and these graphs have certain averaged profiles of parameters with some deviations. On the other hand, the spectrum of silane plasma chemistry with the same numbers of the nodes and the edges is quite broad. The case of methane plasma chemistry shows similar tendencies. This comparison implies that networks of complex plasma chemistry include self-arranged systematic roles in the constituent species. The roles of agents and products are partially distinguished from scattering along the
axis in the diagram. A wide range of
indicates a number of levels of intermediate roles from one species to another along successive sequential reactions, where the levels are from inevitable functions in reactions to less-frequent contributions for sub-products creations, etc.
The above descriptions are based on the data set on silane and methane plasma chemistry. If another sufficient set of reactions is available, one can perform similar data analysis on complex chemical networks. As shown here, approximate estimations of roles on species and global balance in the reaction system are beneficial for various purposes such as rapid analysis of robustness of a reaction system against impurity mixing. Another feasible and interesting contribution is selection of species for monitoring an industrial chemical reactor; behaviors of the limited number of the species detectable on the edge of reaction space can predict the ongoing entire system working on by comparing values of indices with the detected signals.
This kind of graph analysis using diagrams composed of multi-centrality indices is applicable for analyses of other networks. In particular, networks that include less than 100 nodes are suitable for this method to investigate both macroscopic topologies and microscopic identifications of nodes. This is also applicable for larger networks to clarify roles of nodes by specifying their positions in a rough distribution of node data in a diagram. For instance, other physical and chemical processes can be analyzed by this approach when they are described in rate equations, since chemical reactions are given in one type of rate equation and successfully interpreted in this study.


