1. Introduction
The increasing diffusion of sensing technologies has profoundly transformed the monitoring of engineering systems over recent decades. Continuous monitoring has become a fundamental component of modern maintenance strategies, enabling the transition from scheduled inspections toward condition-based and predictive maintenance. This evolution has driven the widespread adoption of Structural Health Monitoring (SHM) systems in civil infrastructures, transportation systems and industrial plants, where distributed sensor networks provide continuous information on structural integrity and operational conditions [
1,
2,
3].
Recent advances in wireless communication technologies and low-power embedded electronics have enabled the deployment of Wireless Sensor Networks (WSNs), significantly reducing installation costs and improving the scalability of monitoring systems. However, despite these technological improvements, the energy supply of distributed sensor nodes remains one of the principal limitations to long-term autonomous monitoring. Battery replacement is often impractical for large infrastructures or inaccessible environments, motivating the development of self-powered sensing technologies capable of harvesting energy directly from the surrounding environment [
1,
4].
Among the various ambient energy sources, mechanical vibrations are particularly attractive because they are naturally available in many engineering systems during normal operation. Railway vehicles, bridges, industrial machinery and transportation infrastructures continuously dissipate vibration energy that can be converted into electrical power for low-consumption electronic devices. Piezoelectric transducers have emerged as one of the most promising technologies for vibration energy harvesting owing to their compactness, high power density and ease of integration into existing structures [
2,
5].
The remainder of this paper is organised as follows.
Section 2 introduces the proposed multi-domain modelling framework and discusses the interaction among the different physical domains involved in piezoelectric energy harvesting systems.
Section 3 presents the coupled electromechanical model describing the energy conversion process, while
Section 4 illustrates the design of the electrical conditioning circuit developed within the MATLAB Simscape R2024B environment.
Section 5 reports the numerical simulations carried out to evaluate the behaviour of the integrated multi-domain model. Subsequently,
Section 6 discusses the potential application of the proposed framework to future self-powered monitoring systems. Finally,
Section 7 summarises the main findings of the study and outlines future research perspectives.
2. Multi-Domain Modelling of Piezoelectric Energy Harvesting Systems
Piezoelectric energy harvesting systems are inherently multi-domain systems in which mechanical, electromechanical, electrical and electronic phenomena simultaneously interact to determine the overall energy conversion process. Mechanical vibrations generated by the host structure induce the deformation of piezoelectric transducers, producing an electrical output that is subsequently processed by power conditioning circuits, energy storage devices and electronic loads. Since the behaviour of each subsystem directly affects the others, the overall performance cannot be accurately predicted through independent analyses of the individual domains. Consequently, the development of efficient energy harvesting systems requires modelling approaches capable of simultaneously representing the coupled interaction among all the physical domains involved in the conversion process [
6,
7,
8,
9,
10].
Conventional design procedures generally adopt different modelling environments for structural dynamics, electrical circuits and electronic systems. Mechanical behaviour is commonly analysed through analytical or finite element models, whereas electrical interface circuits and power management units are developed using dedicated circuit simulation software. Although this sequential approach has proven effective for subsystem-level analyses, it limits the possibility of investigating cross-domain interactions and often requires repeated transfer of model parameters between different simulation environments. As a consequence, the optimisation of the complete harvesting system becomes both time-consuming and computationally inefficient, particularly when iterative design procedures are required [
6,
7,
8,
9].
Recent developments in physical modelling environments have enabled a more integrated design methodology based on system-level simulation. In particular, MATLAB Simscape allows the simultaneous representation of heterogeneous engineering domains by connecting mechanical, electrical, electronic and control components through energy-conserving physical ports. Unlike conventional signal-flow approaches, all the governing equations describing the different physical domains are solved simultaneously within the same numerical framework. This unified representation considerably simplifies virtual prototyping, facilitates parameter optimisation and enables designers to evaluate the mutual influence between structural dynamics, piezoelectric transduction, electrical loading conditions and electronic power management before hardware implementation.
The modelling approach proposed in this work originates from a progressive research activity carried out by the authors on vibration energy harvesting for railway applications. An initial investigation introduced a resonant mechanical device integrated into the secondary pneumatic suspension of a railway vehicle to exploit suspension vibrations as an alternative energy source for autonomous monitoring systems [
11]. The concept was subsequently extended through the development of a vibration-based piezoelectric harvester embedded within the air spring, combining numerical modelling and preliminary experimental validation to assess the feasibility of the proposed solution [
12]. Successively, a comprehensive multi-physics optimisation methodology was developed to simultaneously optimise the mechanical configuration and the electromechanical conversion process, leading to the realization and experimental assessment of a full-scale prototype integrated into a railway pneumatic suspension [
13]. The resulting harvesting architecture was finally proposed as a potential enabling technology for future self-powered monitoring systems in railway vehicles [
14].
Despite these achievements, previous studies mainly focused on the mechanical design, prototype optimisation and experimental validation of the harvesting device. A unified modelling framework capable of simultaneously describing the mechanical subsystem, piezoelectric transduction, electrical interface, power conditioning electronics, energy storage and supervisory control logic within a single simulation environment has not yet been presented. The present work addresses this gap by proposing a comprehensive multi-domain modelling framework based on MATLAB Simscape, in which all physical domains are integrated into a single environment through physically consistent interfaces. The proposed methodology provides an effective virtual prototyping platform that supports the integrated design, optimisation and future development of piezoelectric energy harvesting systems intended for self-powered monitoring applications. Therefore, the novelty of the present work does not lie in the introduction of a new piezoelectric harvester geometry but in the development of a unified, energy-consistent multi-domain modelling framework for the complete harvester–conditioning–storage–load chain.
3. Coupled Electromechanical Model
The multi-domain modelling framework introduced in the previous section requires a physically consistent representation of the interaction between the mechanical and electrical domains governing the energy harvesting process. The development of such a coupled model is essential for accurately describing the conversion of ambient mechanical vibrations into electrical energy, while preserving the reciprocal interaction between structural dynamics and the electrical loading conditions. Unlike simplified approaches based on uncoupled analyses, the proposed formulation simultaneously considers the mechanical behaviour of the vibrating structure and the electrical response of the piezoelectric transducer, providing a unified description of the energy transfer mechanisms.
The modelling strategy adopted in this work is based on an energy-consistent formulation in which the piezoelectric transducer acts as the coupling element between the mechanical and electrical subsystems. Starting from the constitutive equations of the piezoelectric material, the model is progressively reformulated in terms of lumped parameters suitable for system-level simulations within the MATLAB Simscape environment. This approach allows the governing equations of the electromechanical system to be directly integrated with the electrical conditioning circuit presented in the following section, thereby enabling the implementation of a complete multi-domain numerical model.
The following subsections first introduce the constitutive relations governing the piezoelectric material, then derive the equivalent electromechanical representation of the cantilever-based harvester and finally describe the interface circuit and the associated energy balance adopted throughout the numerical simulations.
3.1. Transducer Constitutive Relations
The harvesting element is a piezoceramic patch bonded to a steel cantilever carrying a tip mass, operating in the 31 mode: the electrodes lie normal to the polar axis 3 while the strain is developed along axis 1. Reducing the linear constitutive relations to one dimension gives
where
denotes the absolute permittivity at constant stress. Recasting in terms of the macroscopic variables of force, elongation, voltage and current, and admitting a parasitic resistance
R to account for dielectric loss, yields
with
Here, kp is the axial stiffness along direction 1, Cp the clamped capacitance, and Γ the generalised electromechanical coupling factor.
3.2. The Cantilever as a Mechanical Transformer
The relations above refer to force and elongation along the patch axis, whereas the harvester is driven transversely at the clamped end. The cantilever therefore acts as a mechanical transformer between the two coordinate systems, with the transverse force
FT at the free end and the relative velocity of the tip mass related to their axial counterparts through
where Δ
h is the offset of the patch from the neutral surface and
L the beam length. Both coefficients follow from Euler–Bernoulli theory:
B by integrating the axial strain at offset Δ
h over the patch length, and
A by requiring that the equivalent tip force produce the same tip deflection as the moment
FΔ
h exerted by the patch. They are not independent. The coupling is a lossless kinematic constraint, so virtual work fixes the force ratio once the kinematic ratio is known
and direct evaluation confirms the identity: both coefficients equal 3Δ
h lp(
L −
lp/2)/
L3. This is Maxwell–Betti reciprocity expressed for the electromechanical transformer, and it holds for every admissible geometry rather than approximately or in a limit.
Defining the forward and reverse coupling coefficients as α =
AΓ and β =
BΓ, the governing system of the harvester becomes
with the equivalent mechanical properties
and
ks = 3
Es
Is/
L3. Multiplying the mechanical equation by the relative velocity and the electrical equation by
VT identifies the power leaving the mechanical domain and the power entering the electrical one as
The power leaving the mechanical domain therefore equals the power entering the electrical one, as it must for passive coupling. The transformer changes the scale of force and displacement but not the balance between them: the electromechanical coupling matrix is symmetric, and that symmetry is exact. This is worth stating explicitly because it constrains modelling. A lumped model that assigns different forward and reverse coefficients implies that the transformer dissipates or generates energy, which a rigid bonded patch cannot do; where such asymmetry appears in identified parameters, it indicates a mis-specified model rather than a physical effect.
3.3. Interface Circuit and Energy Budget
The patch delivers alternating voltage and must be rectified before storage. A full-wave bridge of Schottky diodes with forward drop
Vf feeds a storage capacitor
Cs, whose voltage is monitored by a comparator driving the enable line of a step-down converter. The converter is held off while the capacitor charges and is disabled again once the capacitor falls to the lower threshold. The usable energy per charge–discharge cycle is
3.4. Material Parameters
Table 1 collects the transducer properties of a representative commercial patch, used throughout as the reference material. The parametric study of
Section 5 is formulated in dimensionless groups and does not require device-specific lumped parameters.
4. Energy Harvesting Circuit Design
The electrical interface represents a key component of any piezoelectric energy harvesting system, since the alternating electrical signal generated by the piezoelectric transducer cannot be directly supplied to electronic devices. An appropriate conditioning stage is therefore required to convert the harvested energy into a stable and usable power source suitable for low-power monitoring applications. Besides improving the overall energy conversion efficiency, the electrical interface defines the operating conditions of the piezoelectric transducer and directly affects the amount of electrical energy that can be extracted from the mechanical excitation. Within the proposed multi-domain framework, the entire electrical architecture has been implemented in MATLAB Simscape Electrical and integrated with the coupled electromechanical model described in
Section 3, allowing the electromechanical conversion, the electrical conditioning, the energy storage and the power management stages to interact within a single numerical environment.
4.1. Reference Case and Equivalent Electrical Model of the Transducer
In order to provide a fully reproducible case study, the piezoceramic patch of
Table 1 is assumed to be bonded at the clamped end of a steel cantilever whose geometry is representative of typical laboratory-scale harvesters. The reference structural parameters are collected in
Table 2 together with the lumped electromechanical parameters derived from Equations (4), (6) and (9). The rationale for the assumed values is the following. The beam dimensions (250 × 20 × 1.5 mm) and the 30 g tip mass were selected so that the fundamental frequency falls in the 8–15 Hz range typical of railway secondary suspensions and of the first bending modes of medium-span civil structures, while keeping the tip deflection within the linear regime at the reference excitation (
Section 5.6). The material constants of
Table 1 correspond to a soft PZT-5A-type ceramic; the same material class is characterised by a dielectric loss factor tan δ ≈ 0.02, from which the parallel loss resistance is derived as R = 1/(ωn Cp tan δ) ≈ 20 MΩ. A mechanical damping ratio of 1% is representative of experimentally identified values for clamped steel cantilevers with bonded ceramic patches; since damping is the single most influential parameter on the harvested power, its effect is investigated parametrically in
Section 5.5.
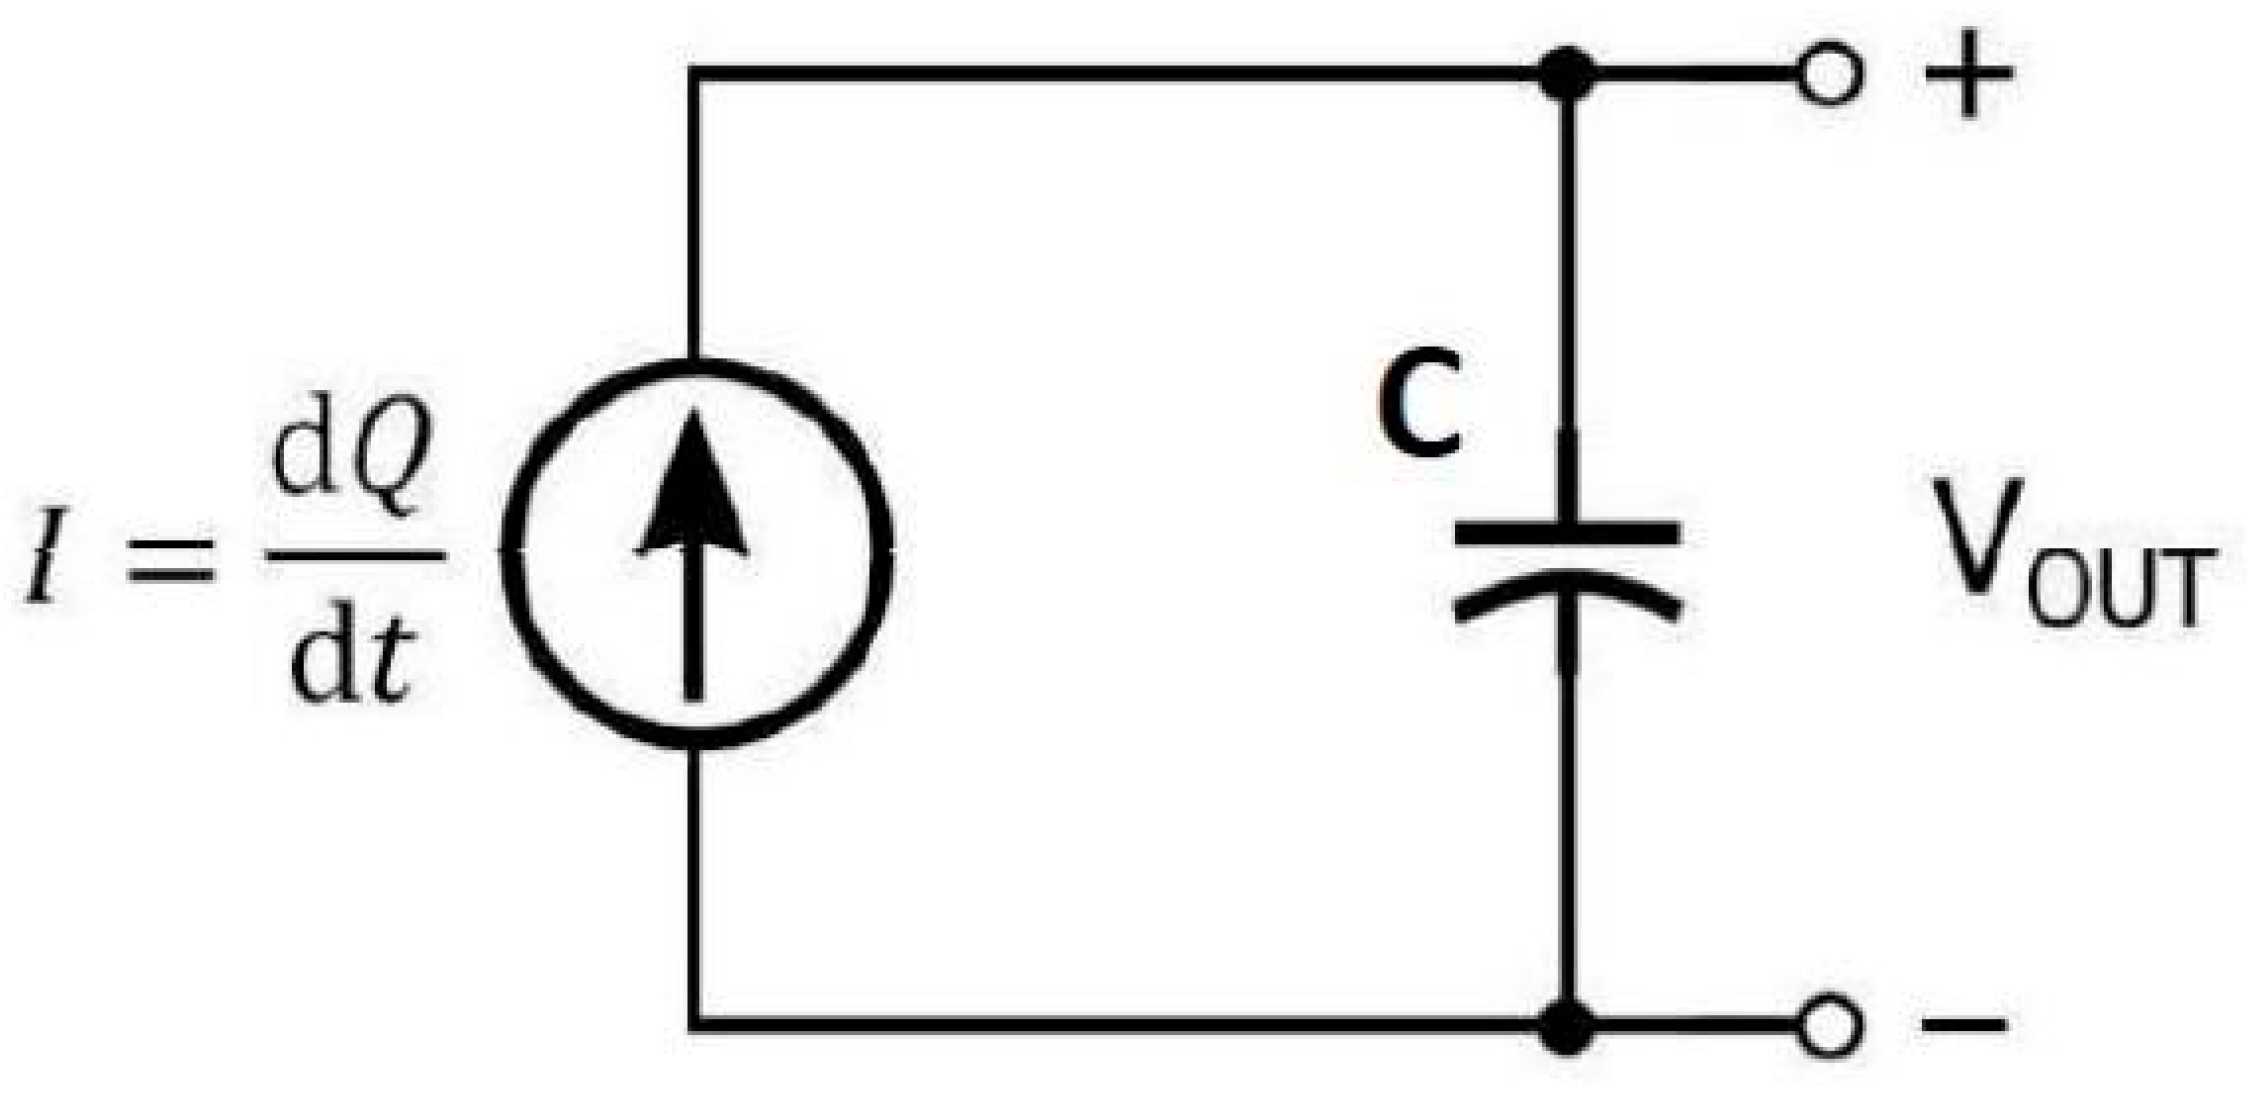
The electrical behaviour of the piezoelectric transducer is represented through the equivalent electrical circuit shown in
Figure 1, in which the mechanical branch is reflected into the electrical domain through the coupling coefficient α and the transducer appears, at its electrical port, as a current source proportional to the tip velocity in parallel with the clamped capacitance
Cp and the dielectric loss resistance R. The resulting natural frequency of the reference harvester,
fn = 11.4 Hz, is representative of the dominant vibration content of railway secondary suspensions and civil infrastructures, which is typically concentrated below 20 Hz. At the natural frequency, the internal impedance of the transducer is dominated by the clamped capacitance and amounts to
This large source impedance is the main constraint on the design of the conditioning electronics: the interface circuit must operate efficiently from a weak, high-impedance alternating source, which justifies the adoption of low-loss rectification and of a discontinuous, threshold-based power transfer strategy discussed in the following subsections. The value of Equation (12) also provides the first-order estimate of the optimal resistive load for maximum power transfer, whose validity is verified numerically in
Section 5.3.
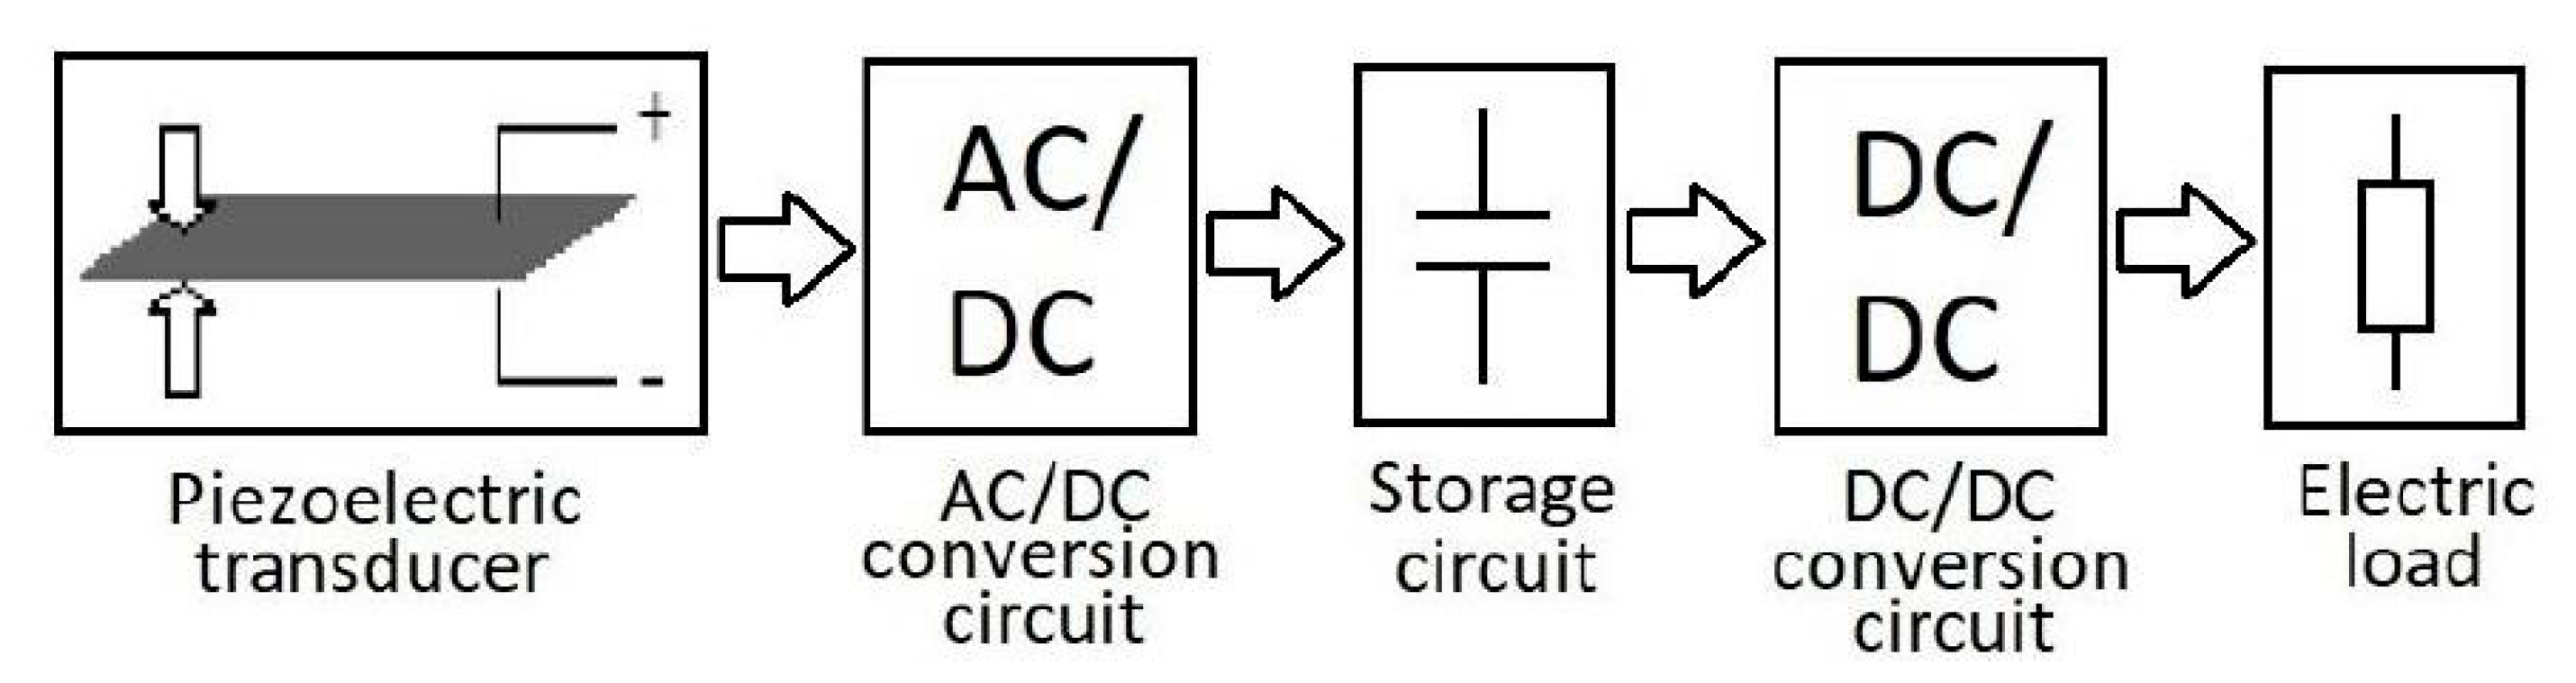
The complete conditioning circuit adopted in this work is illustrated in
Figure 2. The architecture consists of four functional stages: the piezoelectric transducer, a full-wave bridge rectifier, an energy storage subsystem and a DC/DC buck converter supplying the electronic load. The component values adopted for the reference case are summarised in
Table 3. The Schottky forward drop of 0.30 V is typical of small-signal Schottky diodes at the sub-milliampere currents involved; the storage capacitance and the comparator thresholds are compatible with the input range and undervoltage-lockout hysteresis of commercial energy-harvesting power management integrated circuits (PMICs), whose converter parameters are discussed in
Section 4.4; the reference electronic load corresponds to a low-power sensing node and is further detailed by the duty-cycled consumption profile of
Section 5.7.
4.2. Rectification Stage: Symmetry and Asymmetry Considerations
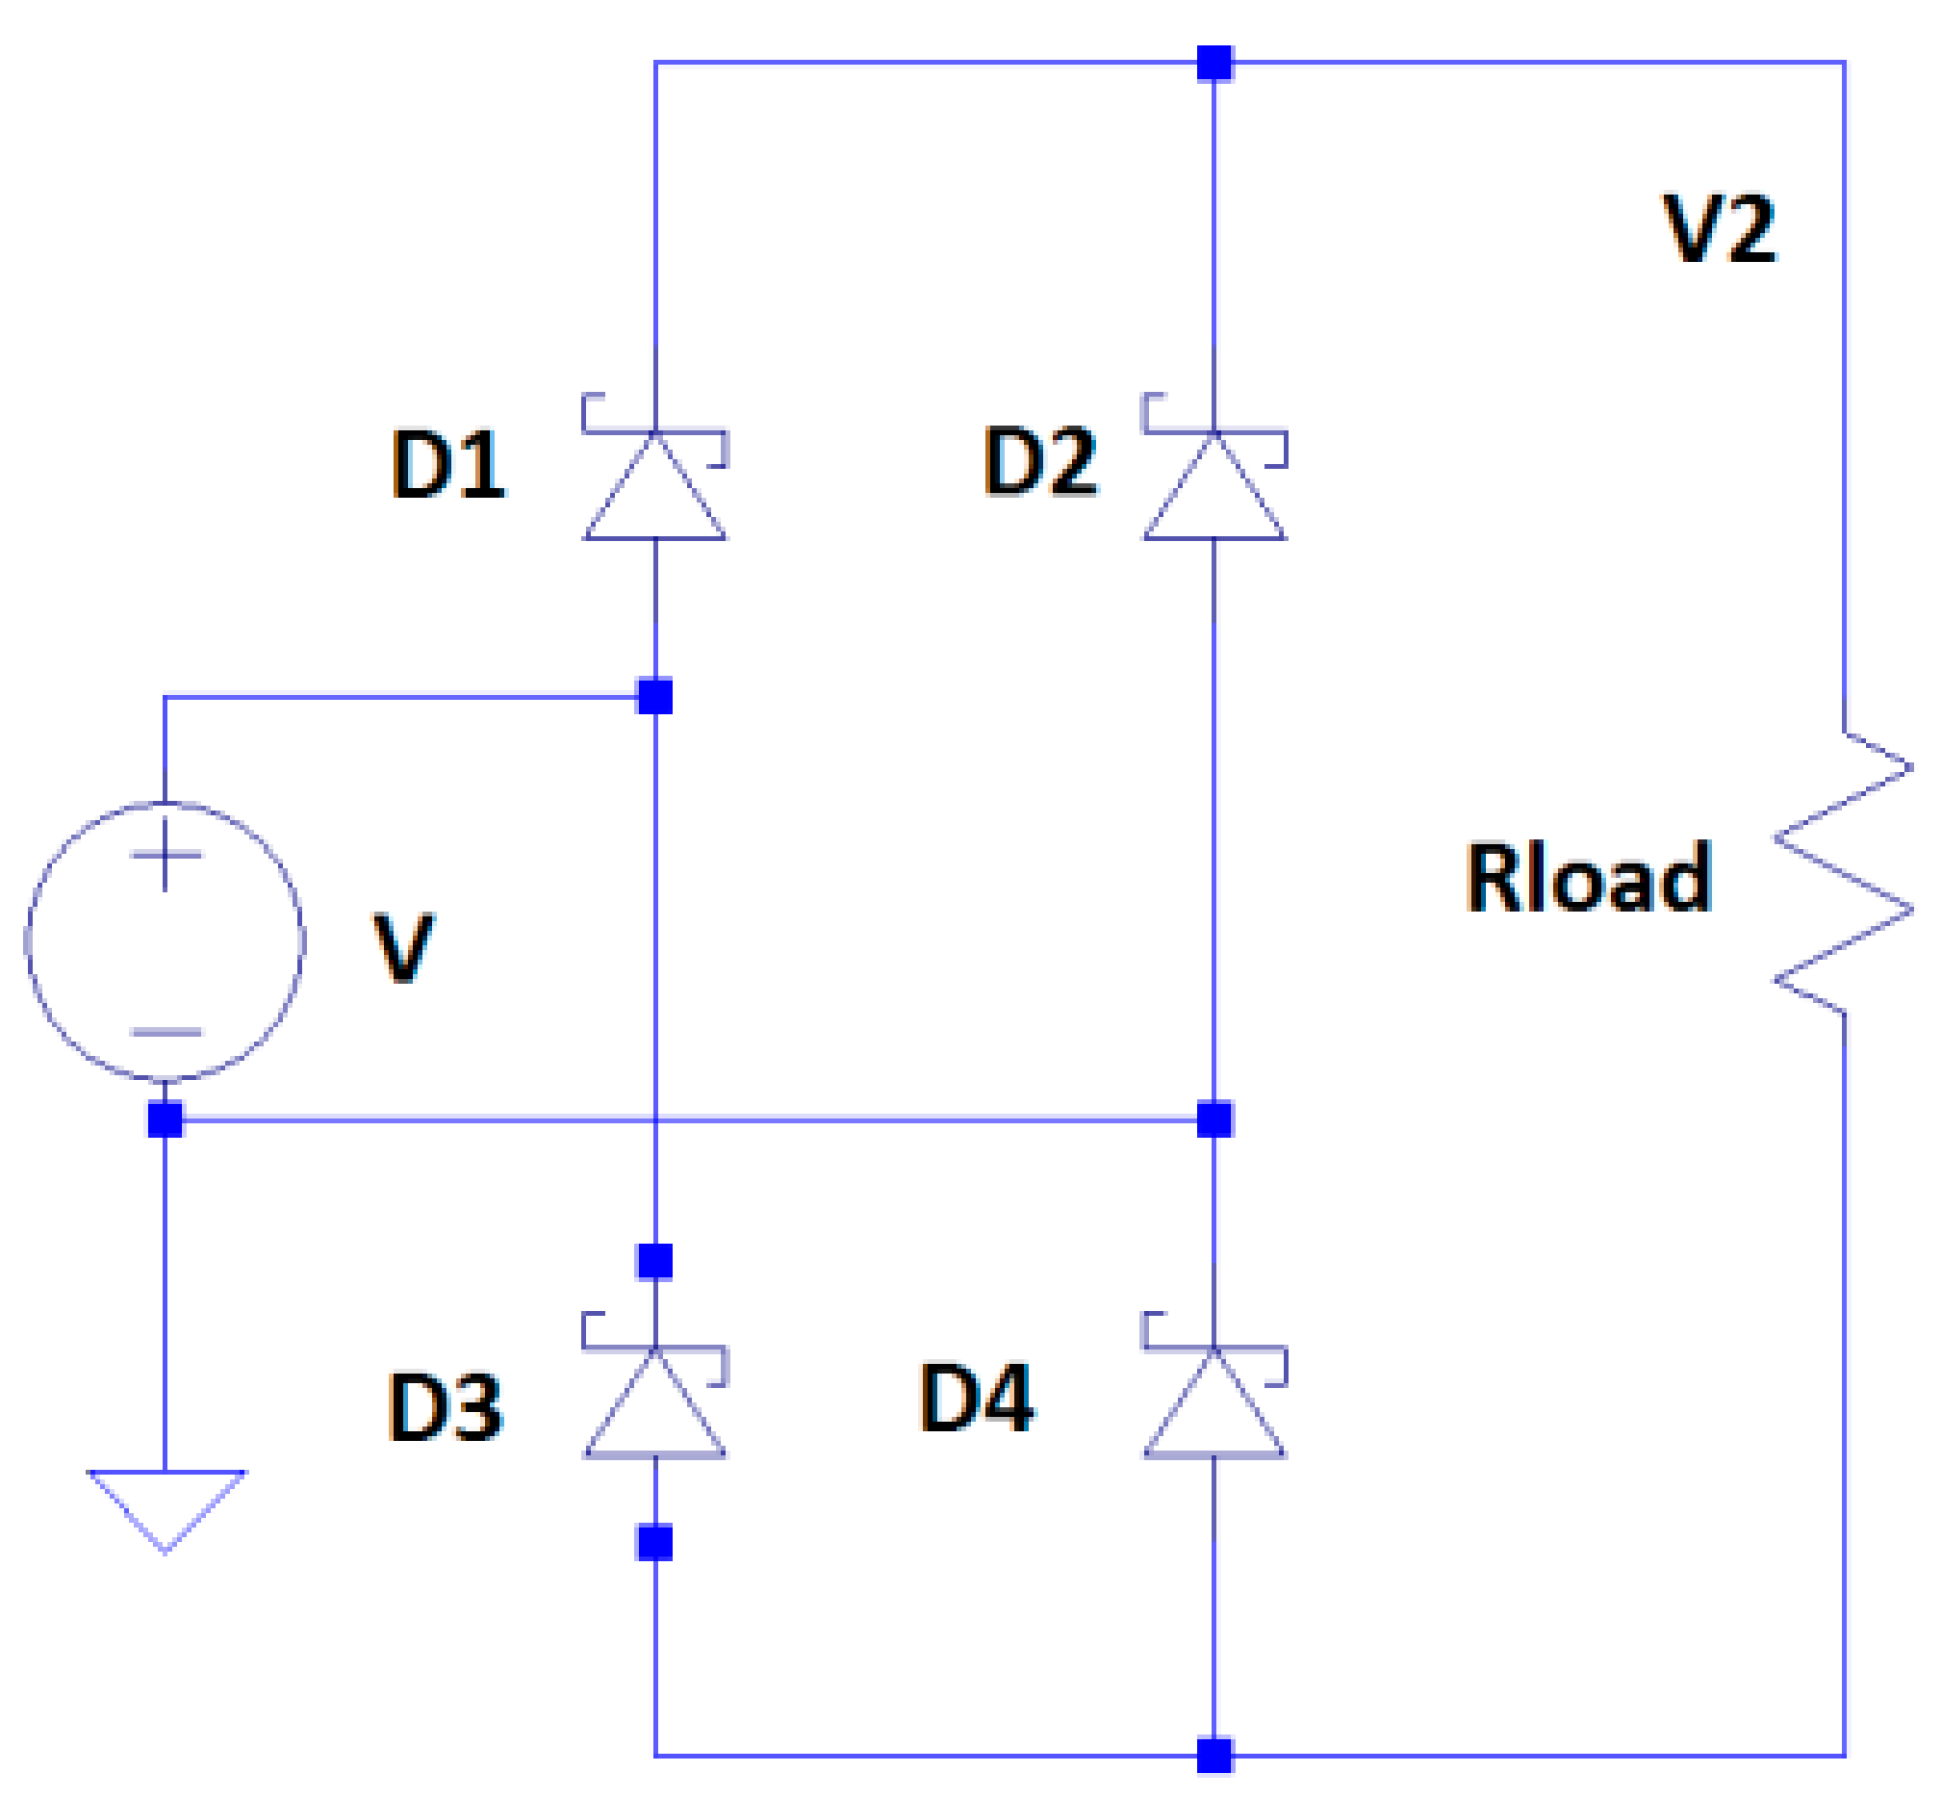
The first stage of the conditioning circuit is a full-wave bridge rectifier employing Schottky diodes, whose electrical schematic is reported in
Figure 3. The choice of a full-wave topology is directly related to the symmetry properties of the harvested signal. Under harmonic base excitation, the steady-state voltage generated by the transducer is an alternating waveform with half-wave symmetry, v(t + T/2) = −v(t): the two half-cycles carry, in principle, identical amounts of energy. The full-wave bridge exploits this symmetry by folding the negative half-cycles onto the positive ones, so that both halves of the mechanical oscillation contribute equally to the charging of the storage capacitor. In this sense, the rectifier can be regarded as the electrical counterpart of the symmetric electromechanical coupling discussed in
Section 3.2: just as the coupling matrix transfers power identically in the forward and reverse directions, an ideal bridge treats the two polarities of the electrical oscillation identically.
The non-idealities of the physical implementation introduce a controlled departure from this symmetric behaviour. Each conduction path of the bridge involves two diode drops, so that conduction only occurs when the instantaneous transducer voltage exceeds the rectified voltage by 2
Vf, and the fraction of the input amplitude lost in the rectification stage can be estimated as
where
Vp is the peak transducer voltage. With the adopted Schottky devices (
Vf = 0.30 V), a peak voltage of 6 V yields a rectification efficiency of approximately 90%, whereas the same bridge realised with standard silicon diodes (
Vf ≈ 0.7 V) would reduce this figure to about 77%. Moreover, any mismatch between the forward characteristics of the diodes belonging to the two conduction paths breaks the equal treatment of the two half-cycles and produces an asymmetric charging pattern, in which the positive and negative half-waves inject slightly different charge packets into the storage capacitor.
This asymmetry, which is quantified numerically in
Section 5, provides a useful diagnostic quantity: in the same way as an asymmetric identified coupling matrix reveals a mis-specified electromechanical model (
Section 3.2), an asymmetric contribution of the two half-cycles reveals unbalanced rectification paths rather than the physical property of the transducer.
4.3. Energy Storage Sizing
Following the rectification stage, the harvested energy is transferred to the storage capacitor
Cs, which acts as an intermediate energy buffer between the intermittent harvested power and the electronic load. The storage subsystem is sized on the basis of the usable energy per charge–discharge cycle defined by Equation (11). With the reference values of
Table 3, each cycle between the comparator thresholds makes available
Accounting for the conversion efficiency of the power management stage, the energy delivered to the load in each cycle sustains the reference electronic load for
where
ηDC ≈ 0.81 is the converter efficiency at the reference load (
Section 4.4). This duration is compatible with the duty-cycled operation of autonomous sensing nodes, in which measurement, processing, and wireless transmission burst are typically completed within a few hundred milliseconds. The selected thresholds also comply with the input voltage range of commercial low-power buck converters, while the hysteresis width VTH1 − VTH2 determines the trade-off between the energy released per cycle and the recharge time of the capacitor. It should be noted that the storage voltage also sets the operating point of the rectifier with respect to the transducer, and therefore the fraction of the available mechanical power that is actually extracted: the joint effect of the threshold values on load matching and on the harvested power is investigated in
Section 5.3 and
Section 5.4.
4.4. Power Management Stage
The final stage of the architecture consists of a high-efficiency DC/DC buck converter that regulates the output voltage delivered to the electronic load. The converter is governed by a hysteretic supervisory logic: a comparator monitors the storage voltage and enables the converter only when the upper threshold VTH1 is reached, disabling it again when the voltage falls to VTH2. This discontinuous power transfer strategy decouples the slow, weak charging process from the comparatively power-hungry operation of the load and ensures that the converter always operates within its admissible input range and at a favorable efficiency point.
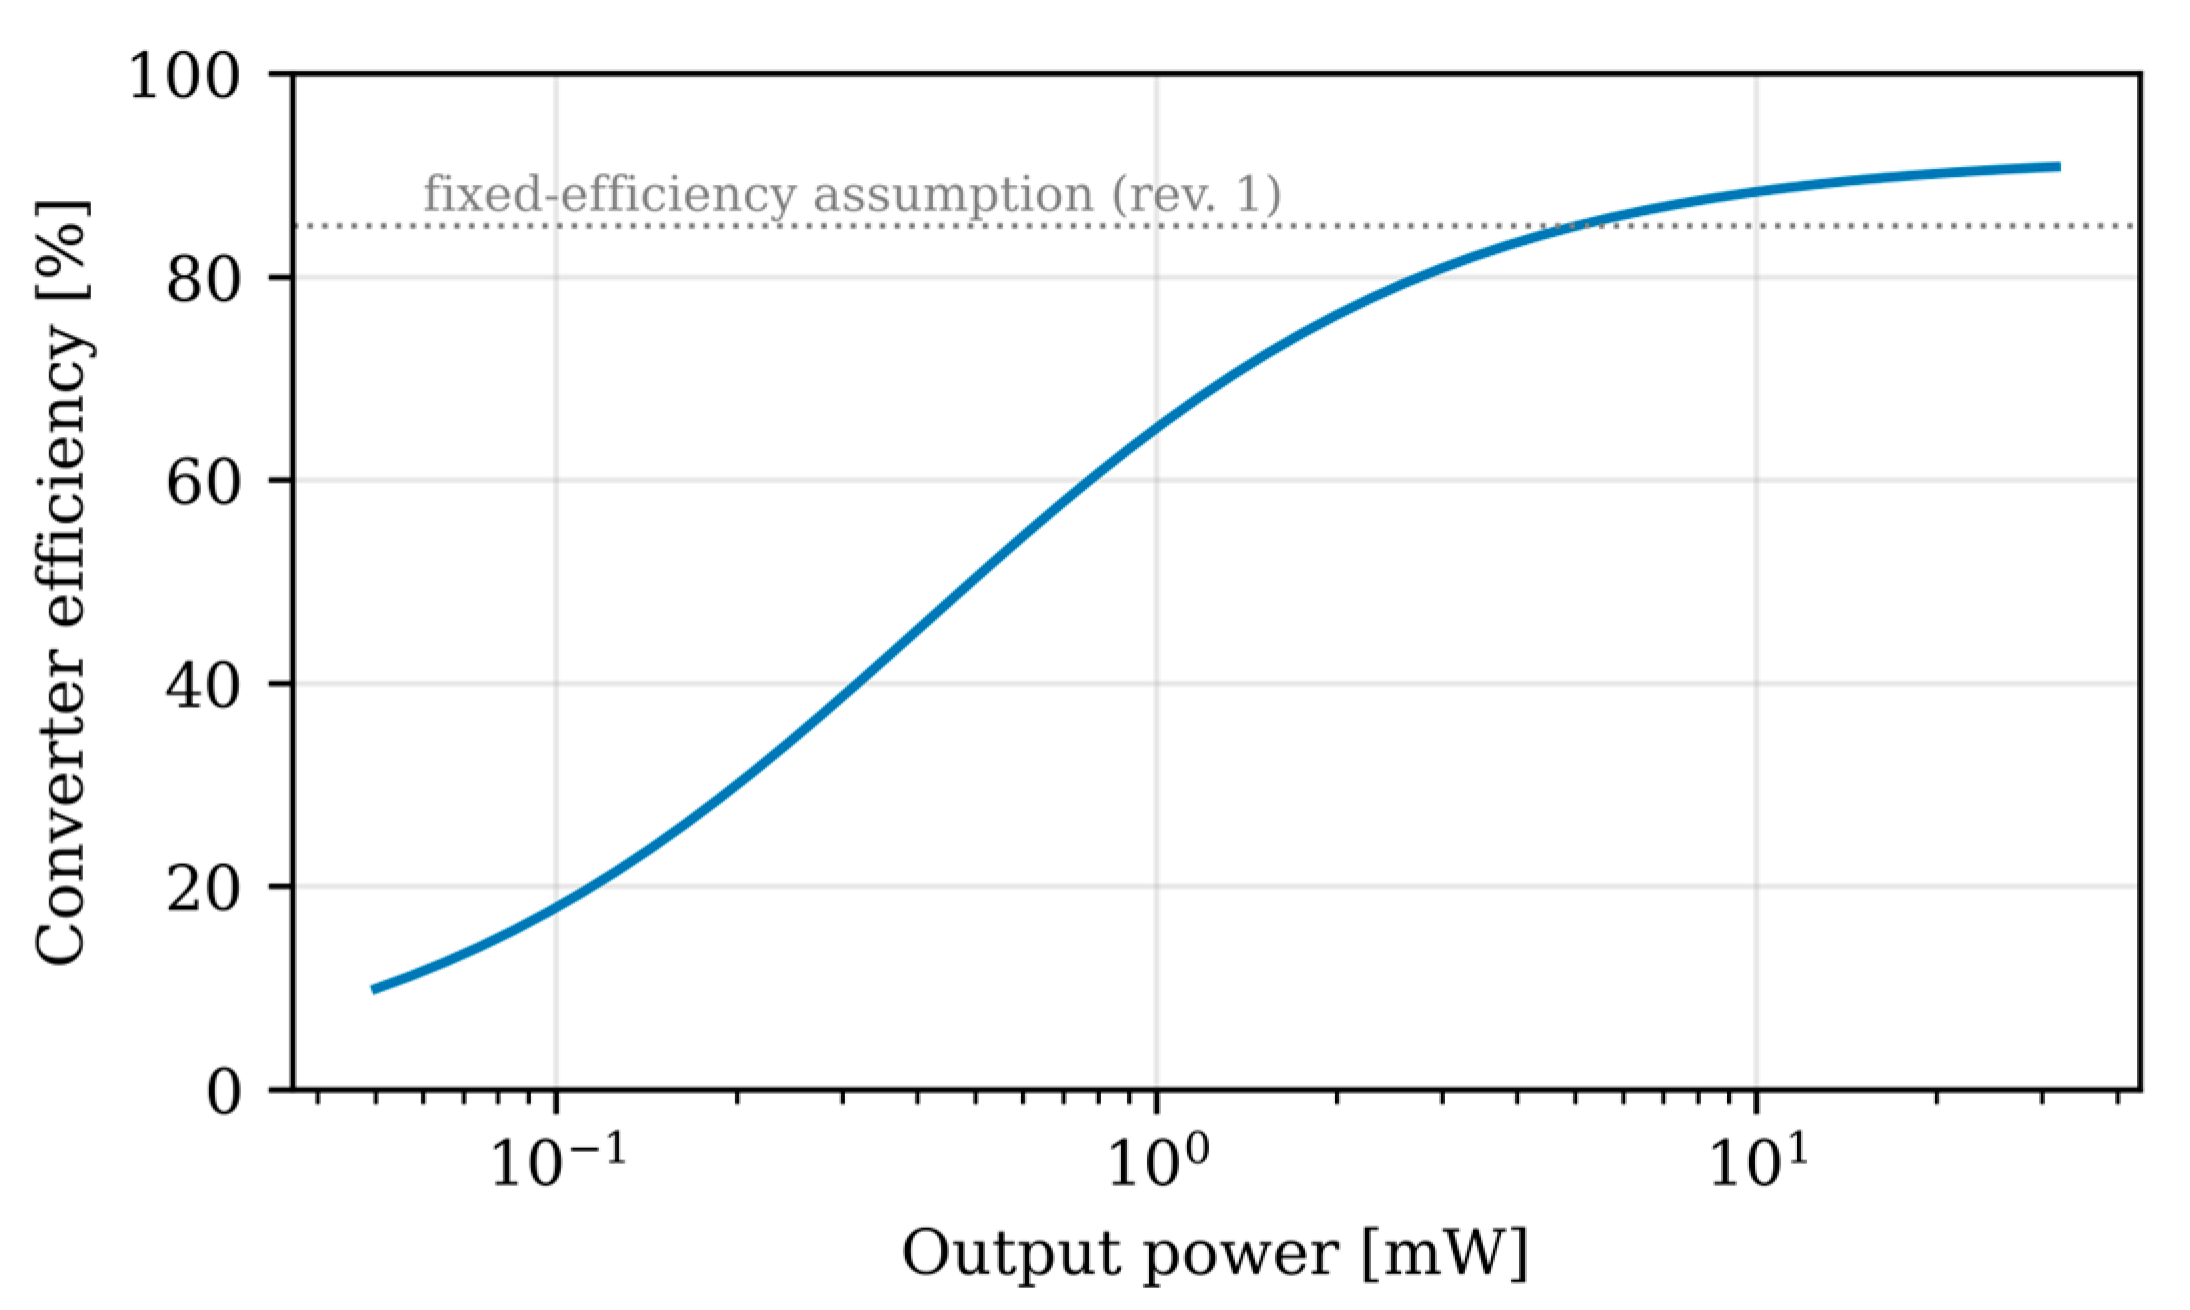
Real power management integrated circuits do not exhibit a constant conversion efficiency: at the sub-milliwatt power levels typical of energy harvesting, the quiescent consumption of the control circuitry and the fixed switching losses become comparable with the power delivered to the load, so that the efficiency depends strongly on the operating point. In the present model the converter is therefore described by a load-dependent efficiency model in which the input power drawn from the storage capacitor is
where
ηc accounts for the conduction and switching losses proportional to the throughput,
Iq,
on is the quiescent current of the enabled converter, drawn at the storage voltage
Vs, and
Psw represents the fixed losses of the switching stage. When the converter is disabled, only the supervisor sleep current
Iq,
off is drawn from the storage capacitor.
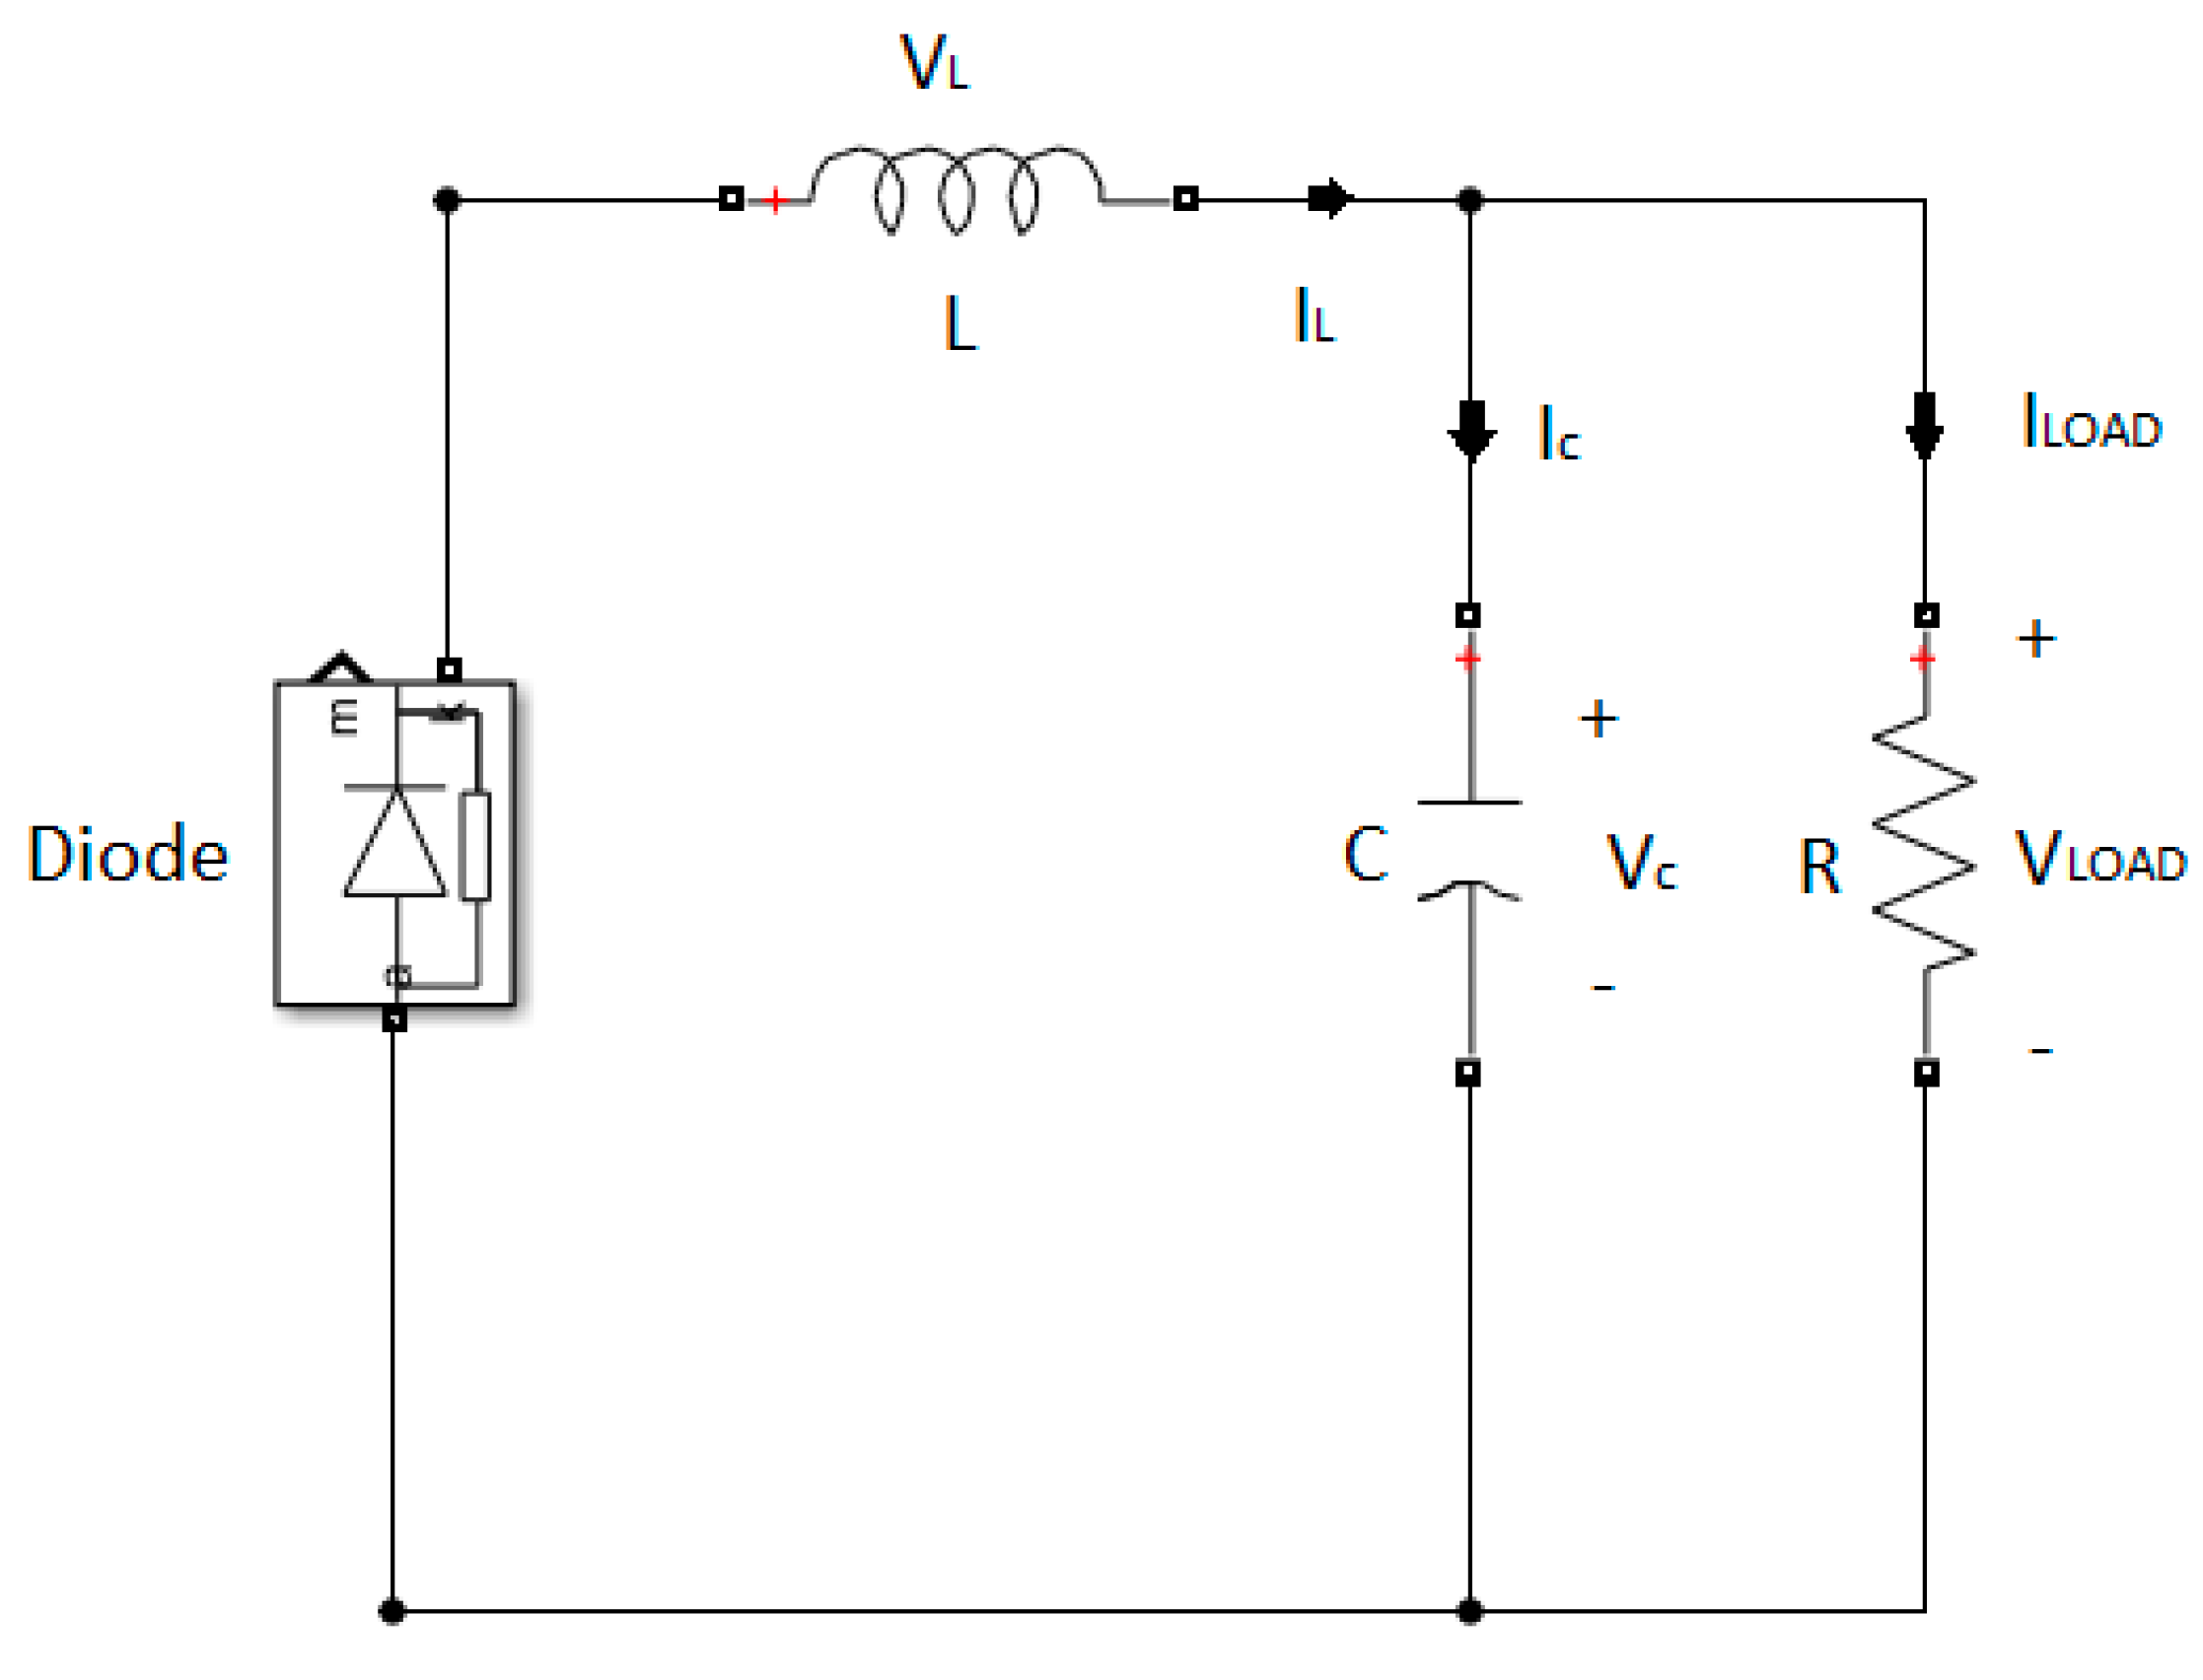
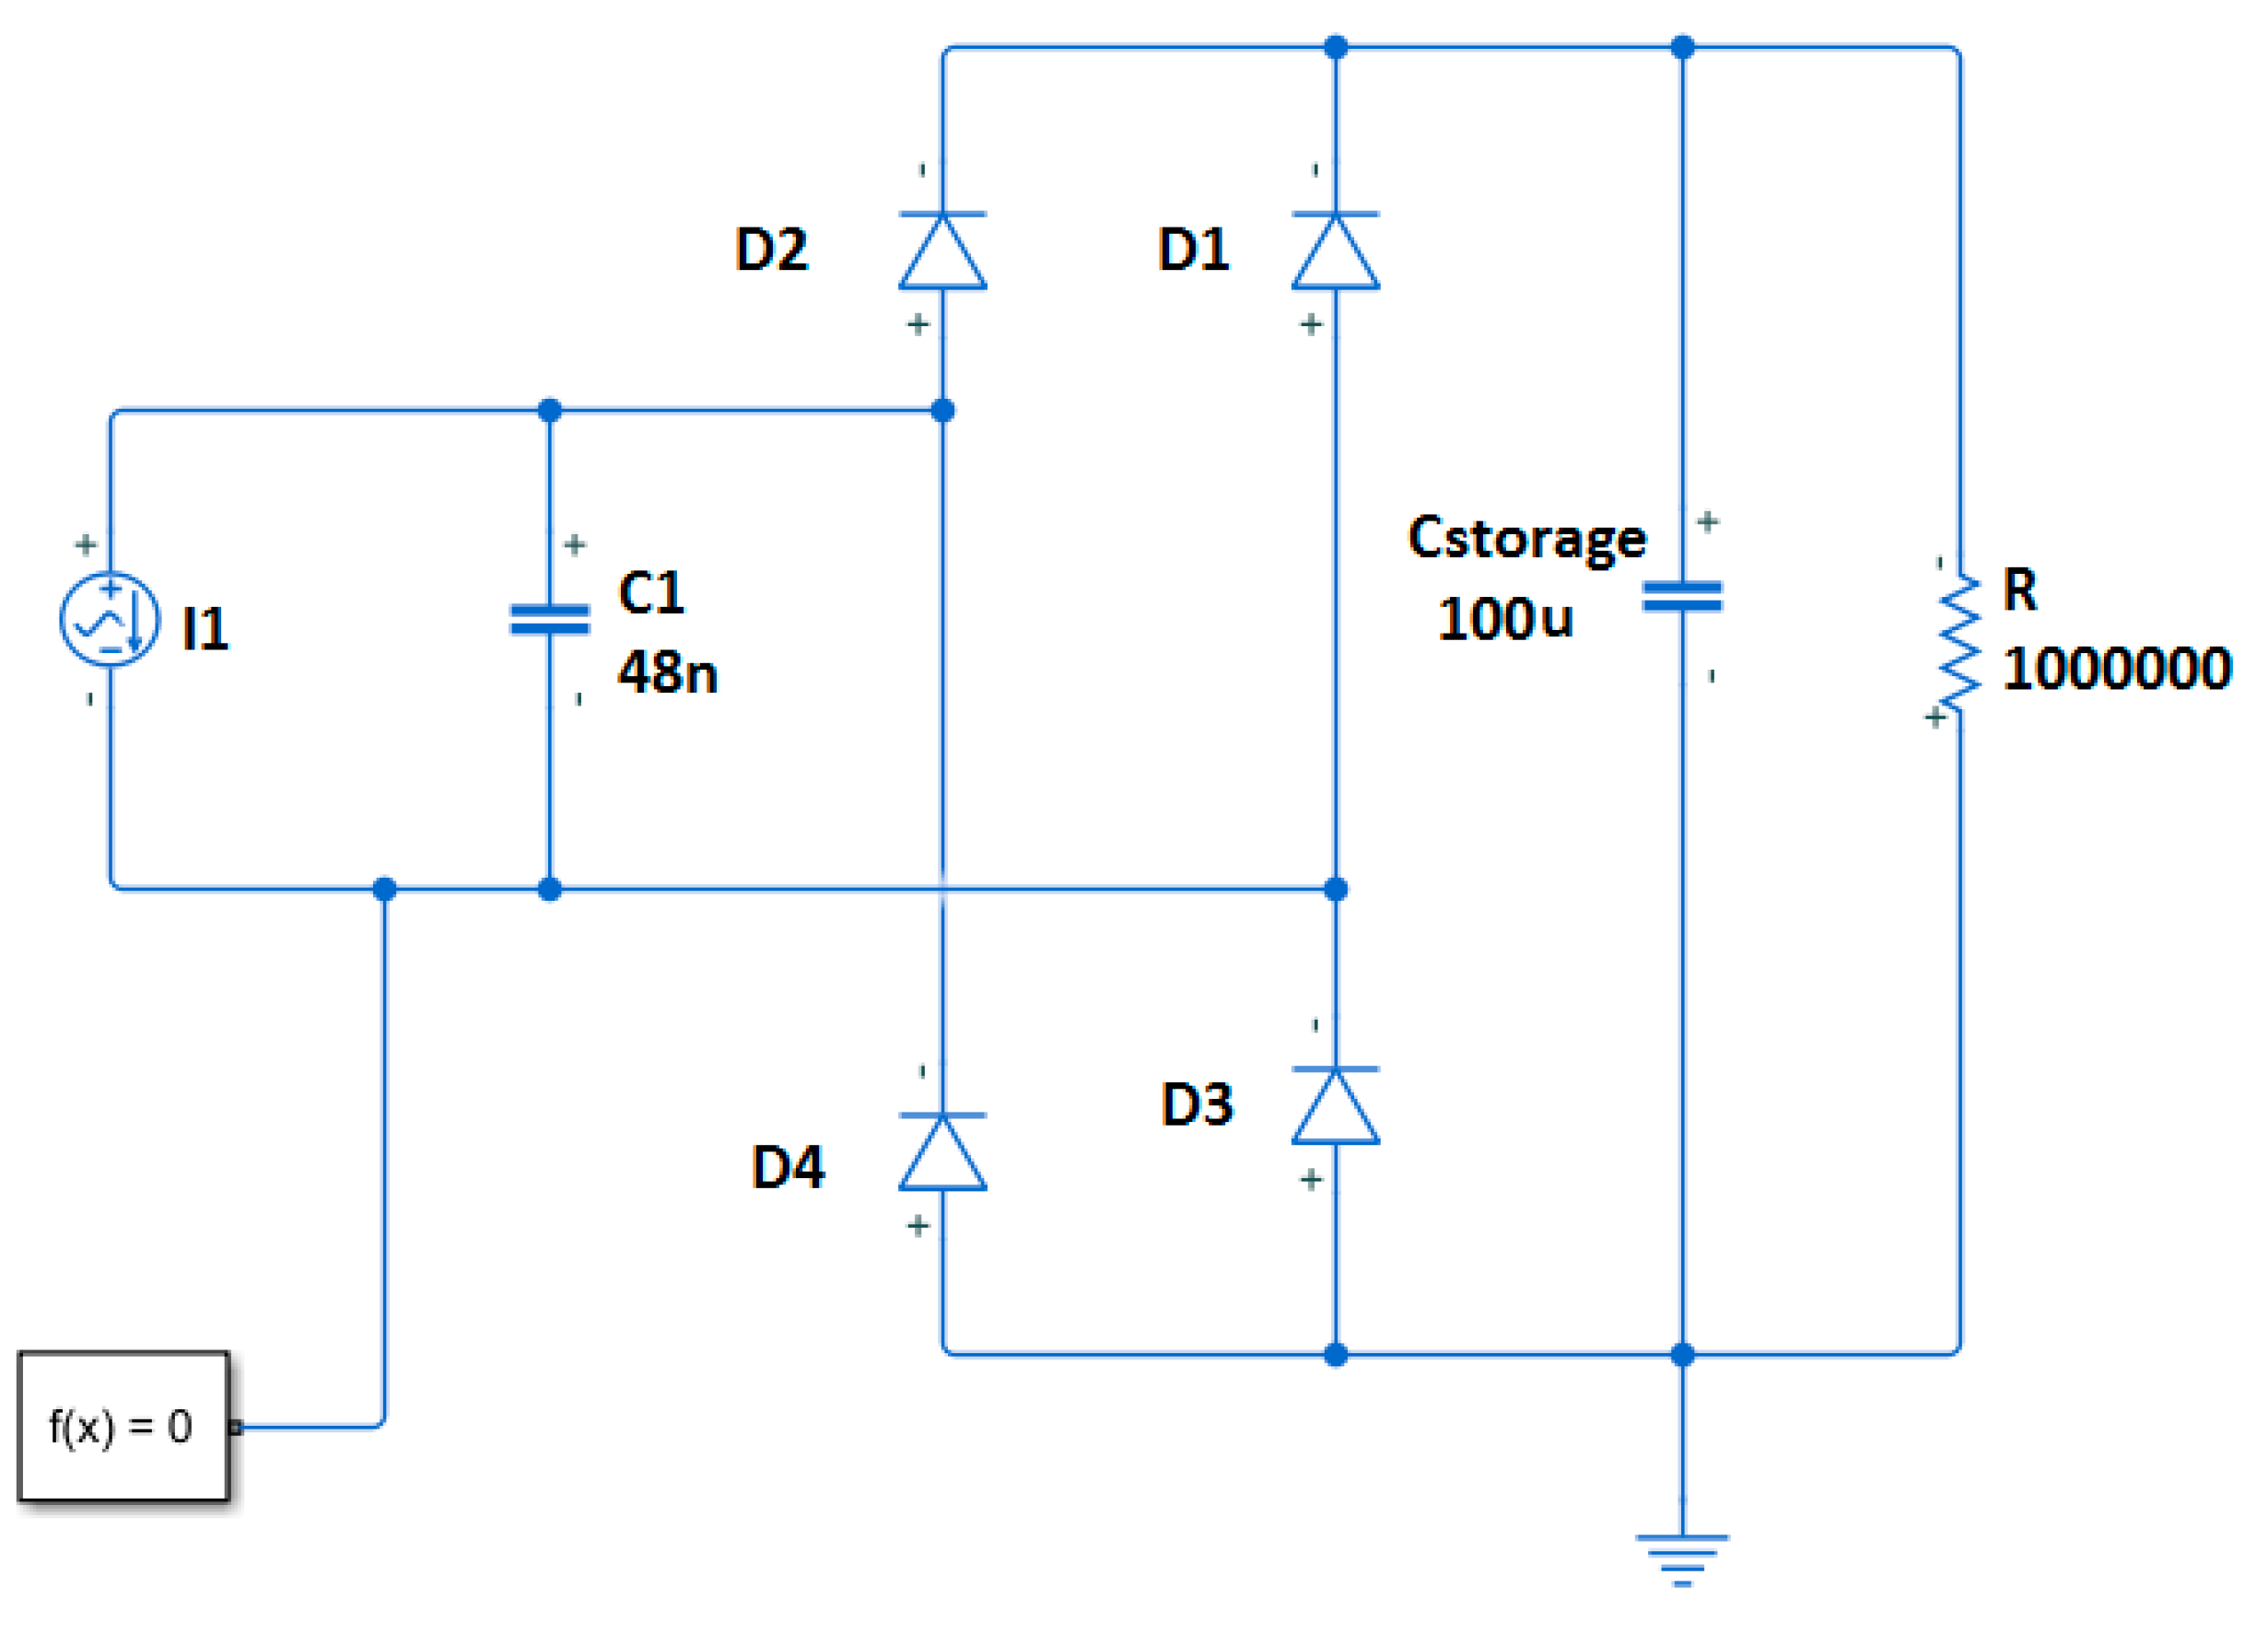
The complete electrical conditioning circuit has been implemented within MATLAB Simscape Electrical, as shown in
Figure 4, completing the multi-domain implementation of the proposed framework whose behaviour is investigated in
Section 5.
With the values of
Table 3, representative of commercial harvesting PMICs, the resulting efficiency curve is shown in
Figure 5: the efficiency drops below 20% at 0.1 mW, equals 65% at 1 mW, 82% at the reference load of 3.3 mW and approaches the asymptotic value ηc at loads above 10 mW. The consequences of this behaviour on the sizing of the load bursts are discussed in
Section 5.5.
5. Numerical Simulations
This section presents the numerical results obtained using the proposed multi-domain model. After describing the simulation setup (
Section 5.1), the steady-state behaviour of the reference case is analysed (
Section 5.2), including the numerical verification of the symmetry of the electromechanical coupling established in
Section 3.2. The model is then verified against a closed-form analytical solution and a step-size convergence study (
Section 5.3), and the question of impedance matching between the high-impedance transducer and the conditioning circuit is addressed (
Section 5.4). The influence of excitation frequency and amplitude, of the mechanical and geometrical parameters, and of the supervisory thresholds is investigated in
Section 5.5 and
Section 5.6; the feasibility of the self-powered monitoring concept is assessed with a realistic sensor-node consumption profile in
Section 5.7; and the results are compared with the literature in
Section 5.8.
Section 5.9 discusses the assumptions and limitations of the model.
5.1. Simulation Setup
The proposed framework was implemented using a hybrid Simulink–Simscape architecture (
Figure 6). The analytical relations describing the coupled electromechanical subsystem, Equations (3)–(11), and the behavioural power-management model of Equation (16) were implemented through MATLAB Function blocks, adopting the reference parameters of
Table 1,
Table 2 and
Table 3, whereas the electrical conditioning network was assembled using standard Simscape Electrical components. Therefore, no custom Simscape Language components were introduced. The interaction between the analytical blocks and the physical network is handled through PS–Simulink and Simulink–PS Converter blocks. In the electrical domain, voltage and current represent the across and through variables, respectively, whereas in the translational mechanical domain the corresponding conjugate variables are velocity and force. For the electromechanical coupling, the analytical subsystem evaluates the current
, which is transferred to the Simscape electrical network through a controlled source, while the transducer voltage
is measured from the physical network and returned to the analytical subsystem to evaluate the reaction force
. The power-management stage is implemented according to Equation (16) by converting the input power demand into the current drawn from the storage node. When the converter is enabled,
whereas, when disabled,
. The storage voltage
is measured from the Simscape electrical network and supplied to the analytical control block, while the resulting input current is imposed on the physical network through a controlled current source. In this way, custom analytical relations remain explicitly defined by the equations reported in
Section 3 and
Section 4, while the physical electrical network is represented directly within Simscape. A semi-implicit fixed-step scheme was employed, in which the mechanical state is advanced first and the electrical state is updated with the new velocity; the bridge rectifier is treated as a piecewise-linear clamp, so that during conduction the transducer voltage is constrained to ±(Vs + 2Vf) and the source current is routed to the storage capacitor. Following the convergence study of
Section 5.3, a time step of 5 × 10
−5 s was adopted for all the results reported below, and all physical domains are advanced simultaneously at every step, consistently with the unified modelling philosophy of the framework. Unless otherwise stated, the harvester is excited at its base by a harmonic acceleration of amplitude 0.05 g applied at the fundamental natural frequency fn = 11.4 Hz, representative of the low-frequency vibration content of railway secondary suspensions and civil infrastructures. The reference simulation covers 130 s of operation starting from a fully discharged storage capacitor, so that both the cold-start transient and the steady-state limit cycle of the supervisory logic are captured; parametric results are evaluated at steady state, starting from the lower threshold.
5.2. Reference Case: Rectification, Charging and Electromechanical Power Balance
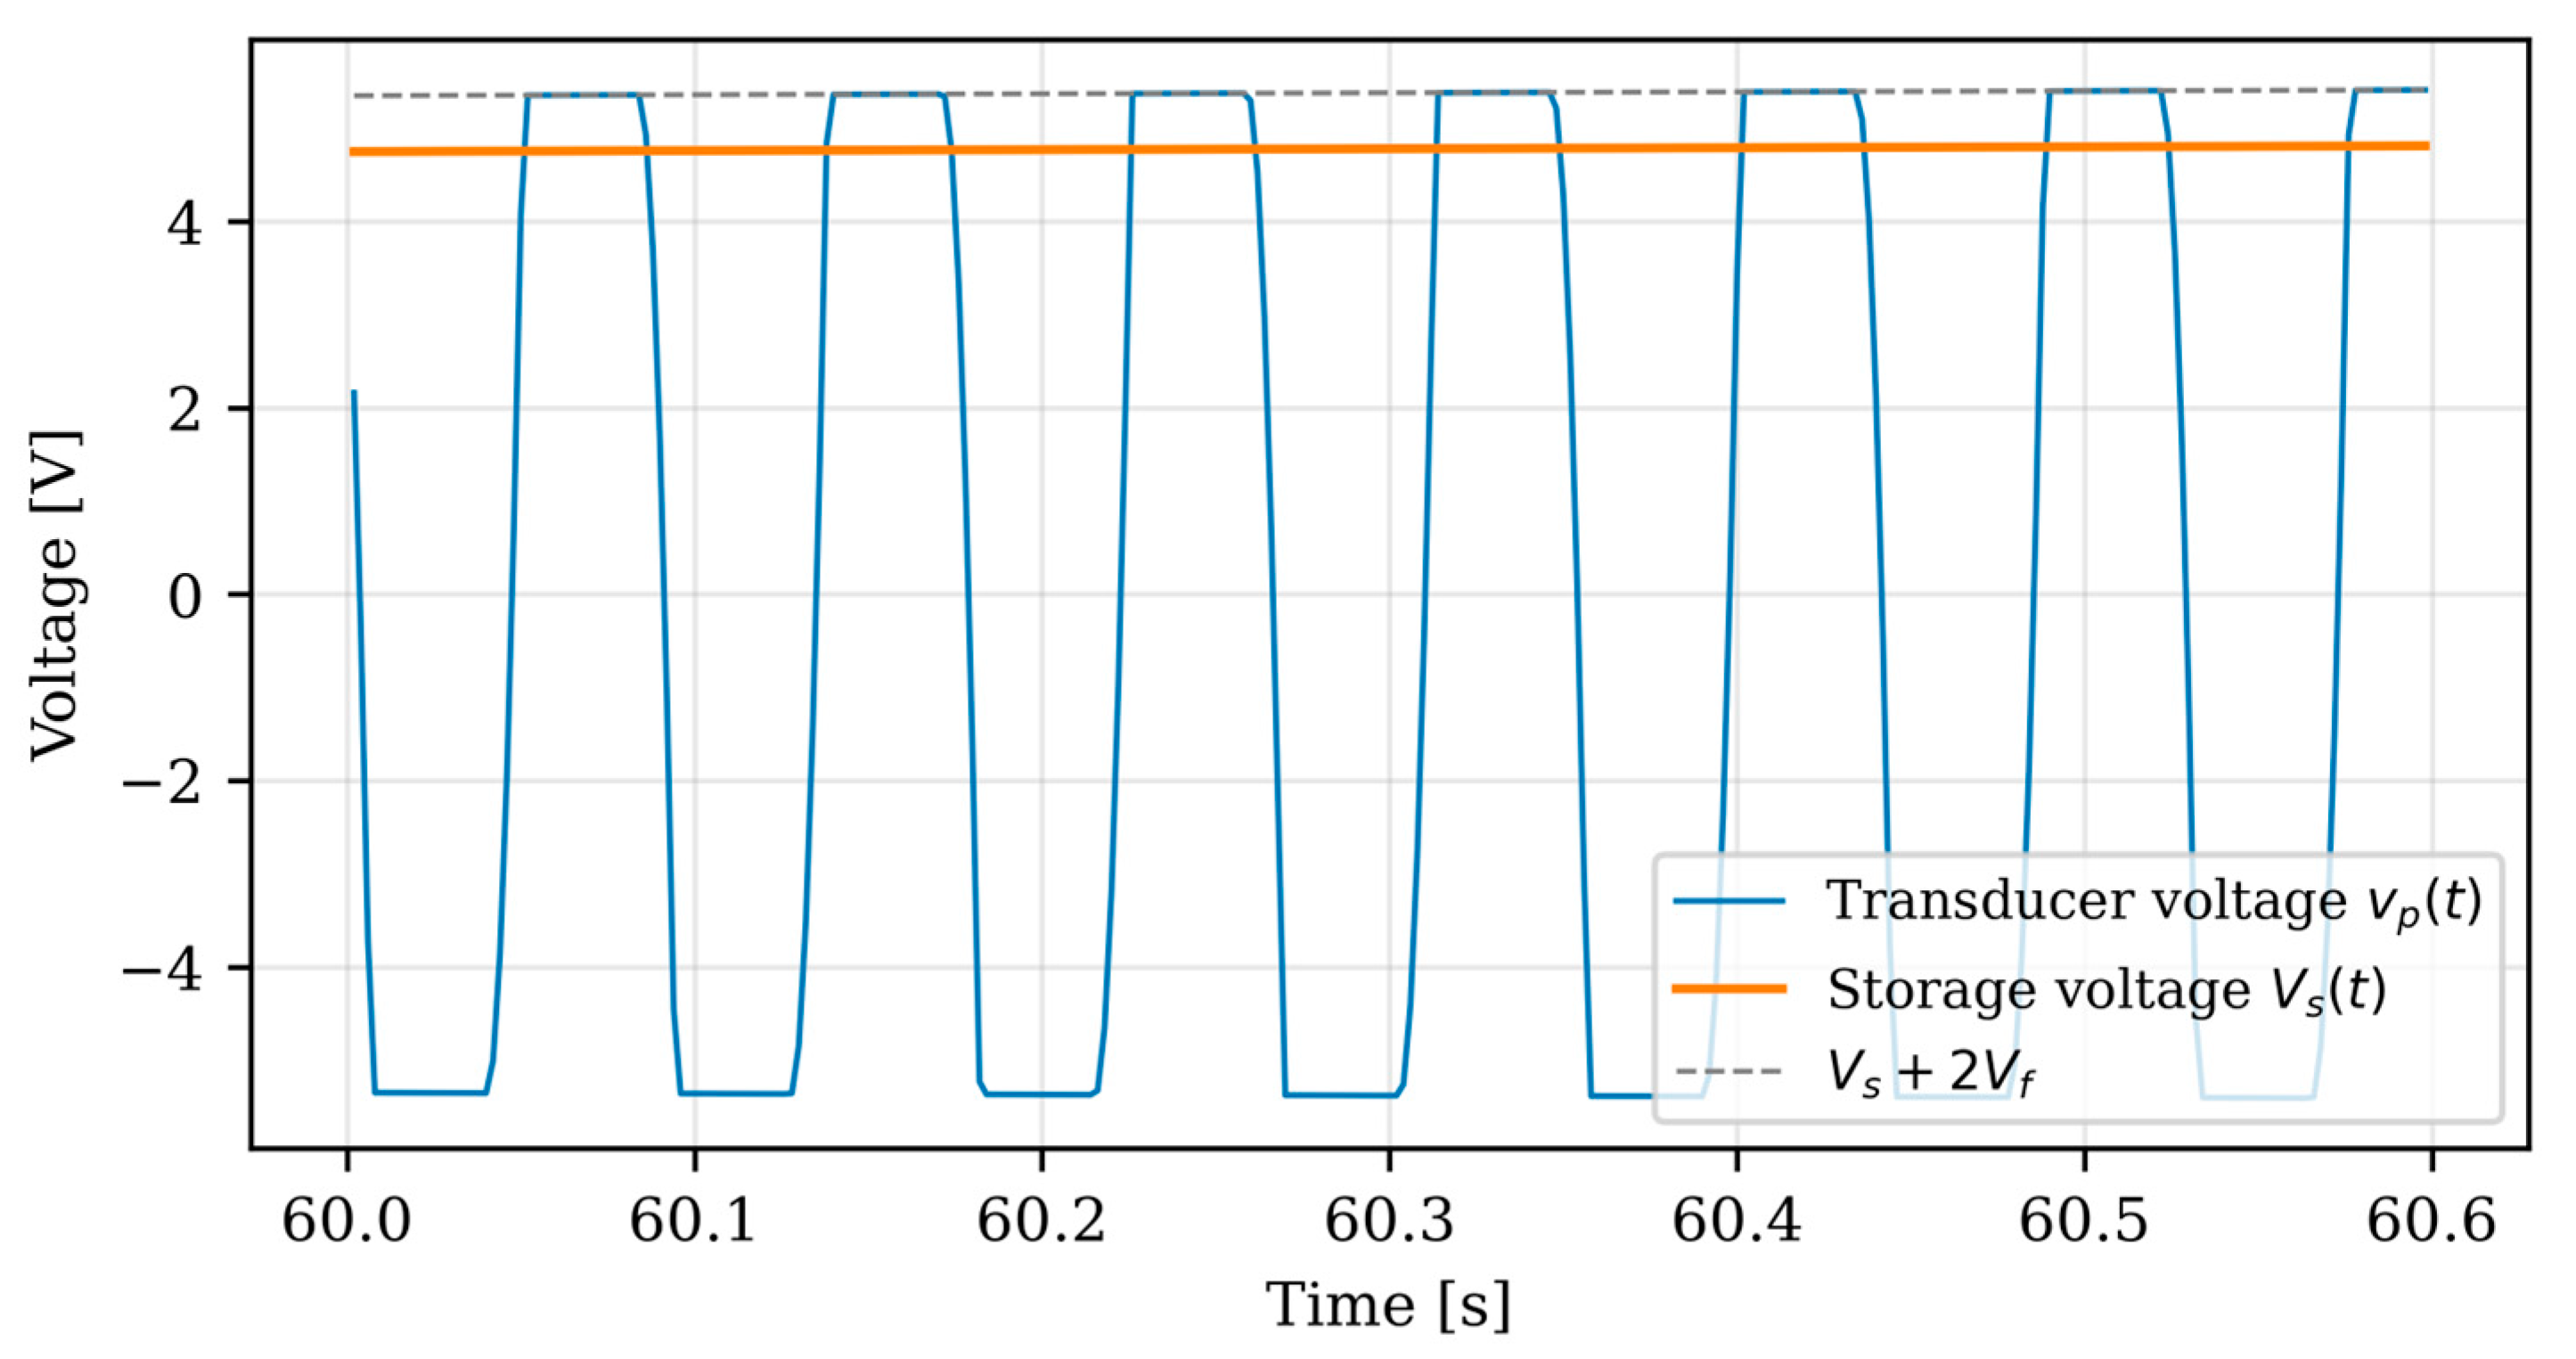
Figure 7 shows a detail of the steady-state electrical response before and after the rectification stage. The transducer voltage exhibits the expected clamped behaviour: during each half-cycle, conduction starts only when the instantaneous voltage exceeds the storage voltage by the double diode drop 2Vf = 0.6 V, and the voltage is then clamped at ±(Vs + 2Vf), with a steady-state peak of approximately 5.6 V. Consistently with the symmetry considerations of
Section 4.2, the two half-cycles inject equal charge packets into the storage capacitor: with matched diodes, the numerically evaluated charge unbalance between positive and negative half-waves is below 0.01%, i.e., within the integration tolerance. When a realistic mismatch of 40 mV is introduced between the forward drops of the two conduction paths, the charge unbalance rises to 0.04%, confirming that a measurable half-cycle asymmetry is a signature of unbalanced rectification paths rather than a property of the transducer.
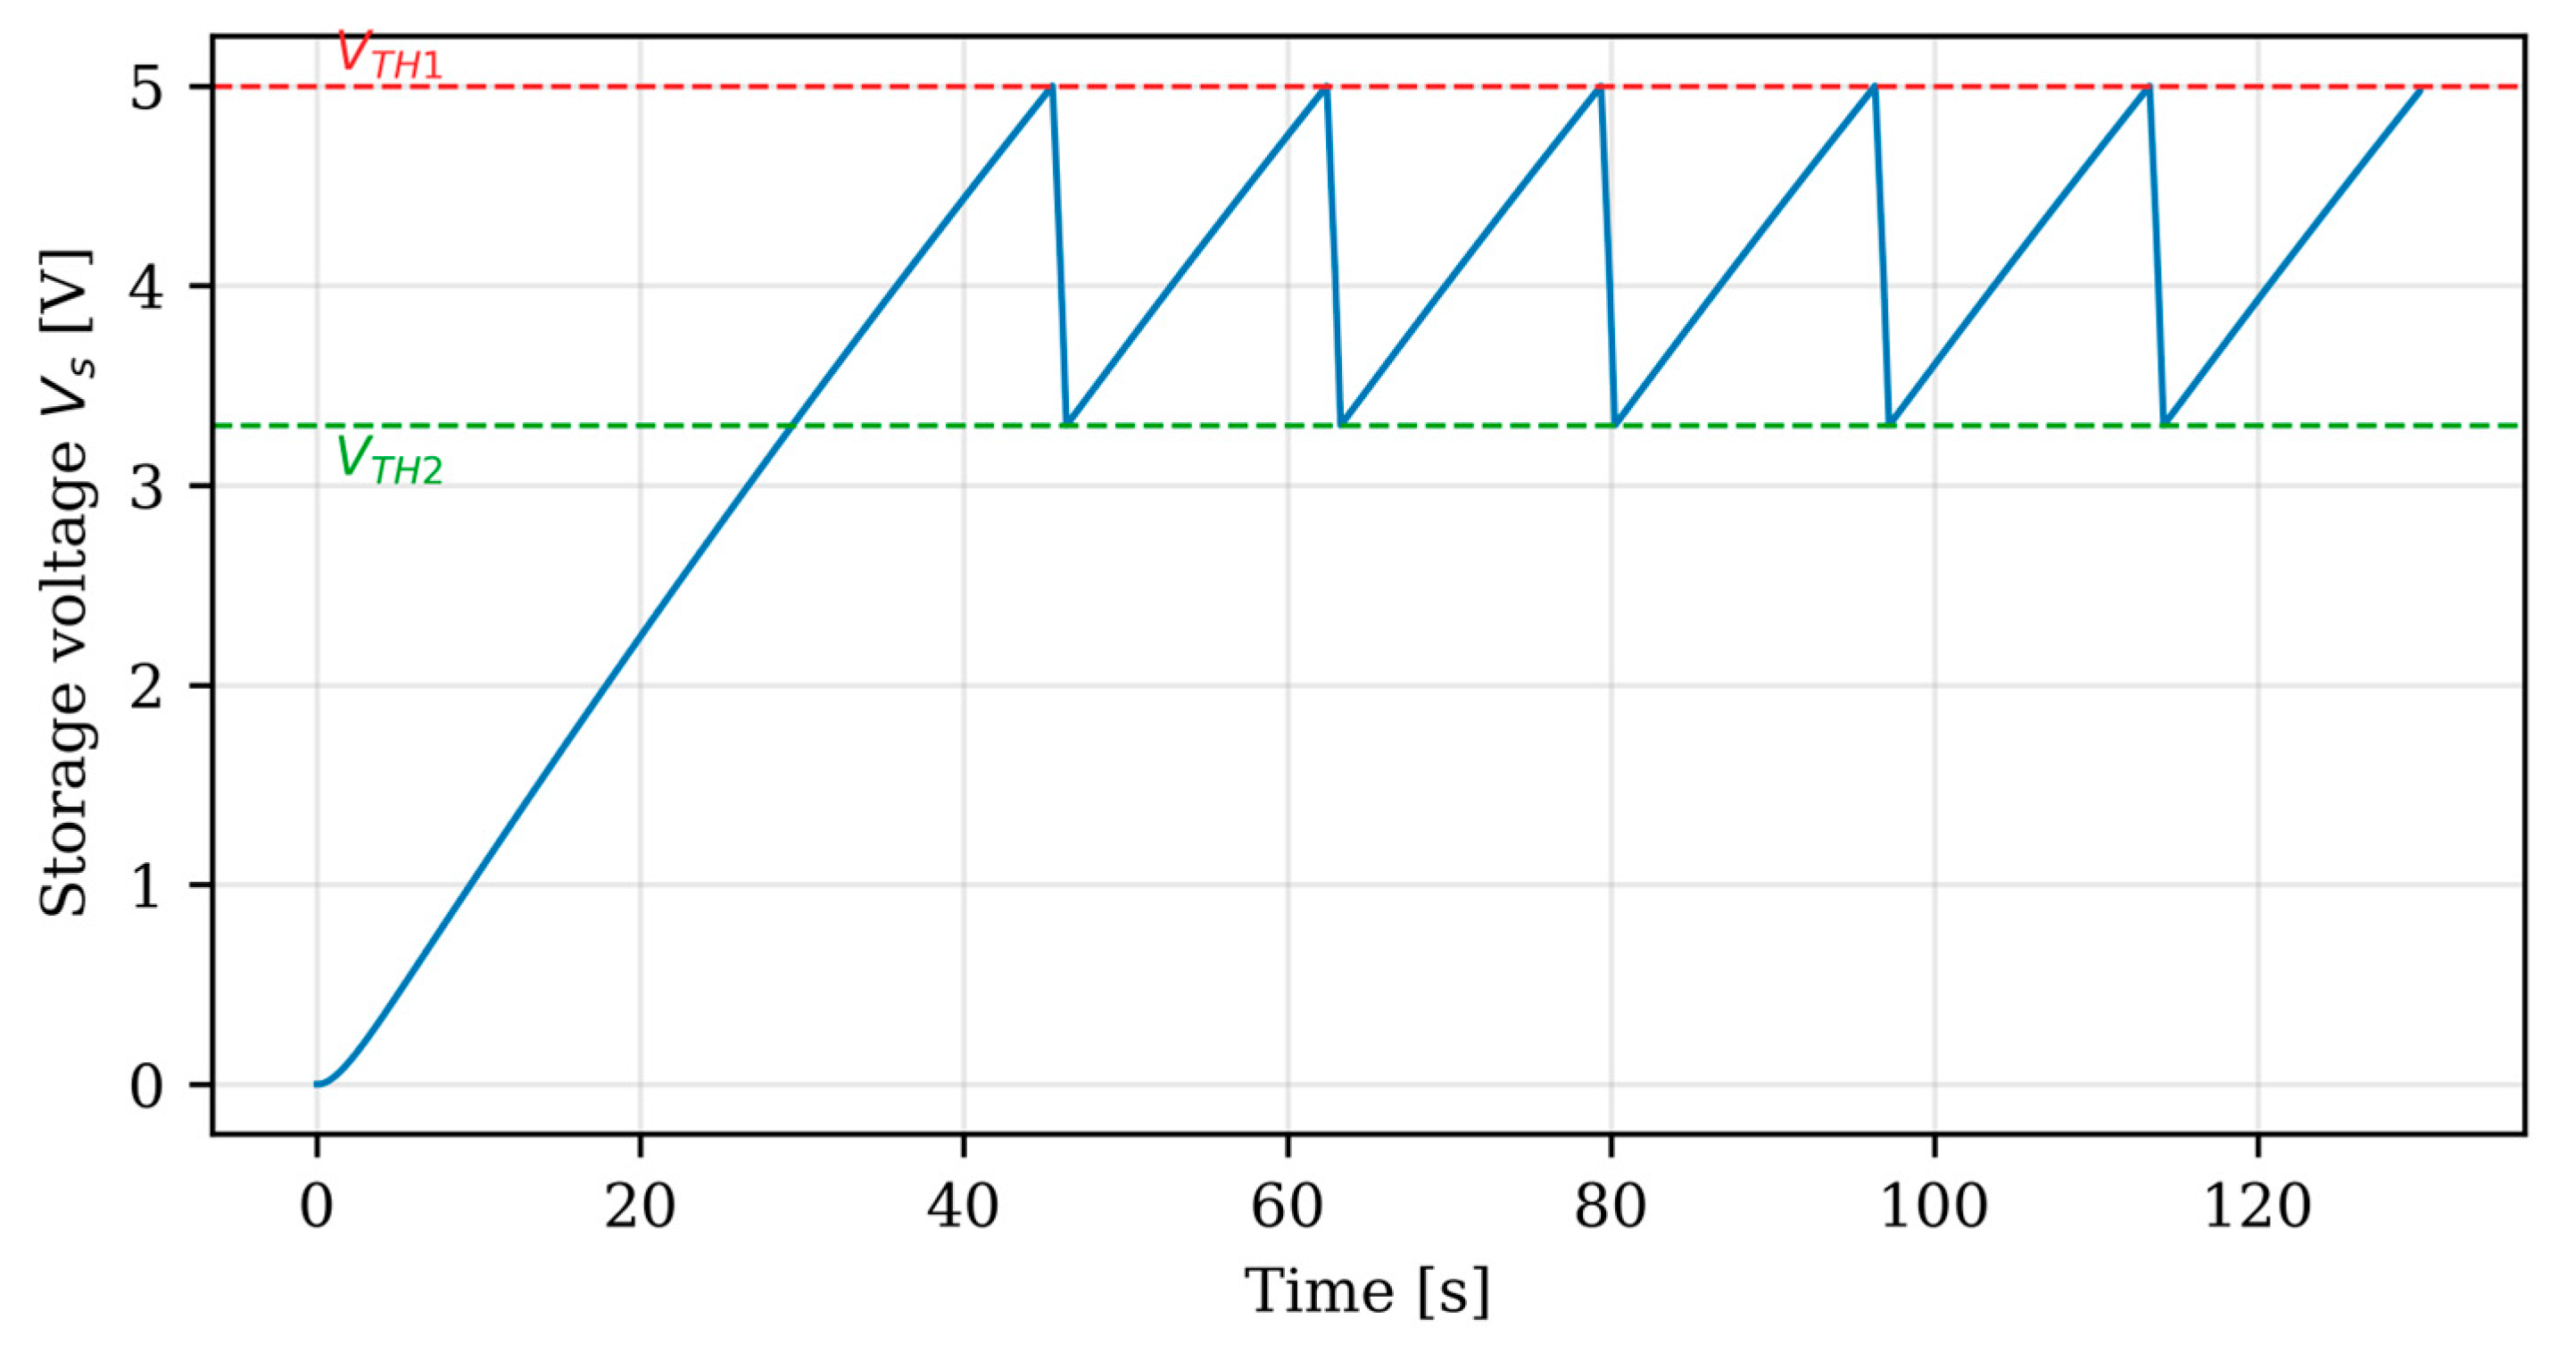
The charging behaviour of the storage subsystem over the complete simulation is reported in
Figure 8. Starting from a fully discharged capacitor, the storage voltage reaches the upper threshold VTH1 = 5.0 V after 45.5 s. The supervisory logic then settles into a periodic limit cycle: the buck converter discharges the capacitor to VTH2 = 3.3 V in 0.86 s while supplying the 3.3 mW reference load, and the capacitor is subsequently recharged in 16.1 s, resulting in a cycle period of approximately 17.0 s and a load duty cycle of about 5%. The discharge duration is consistent with the analytical estimate of Equation (15), the small difference being due to the load-dependent converter efficiency and to the harvesting that continues during the discharge phase. The energy released per cycle equals 3.32 mJ, in exact agreement with the analytical prediction of Equations (11) and (14), providing a first verification of the numerical implementation. The peak tip displacement at the reference excitation is 4.7 mm, i.e., 1.9% of the beam length.
A distinctive feature of the proposed framework is the possibility of verifying numerically the symmetry of the electromechanical coupling established analytically in
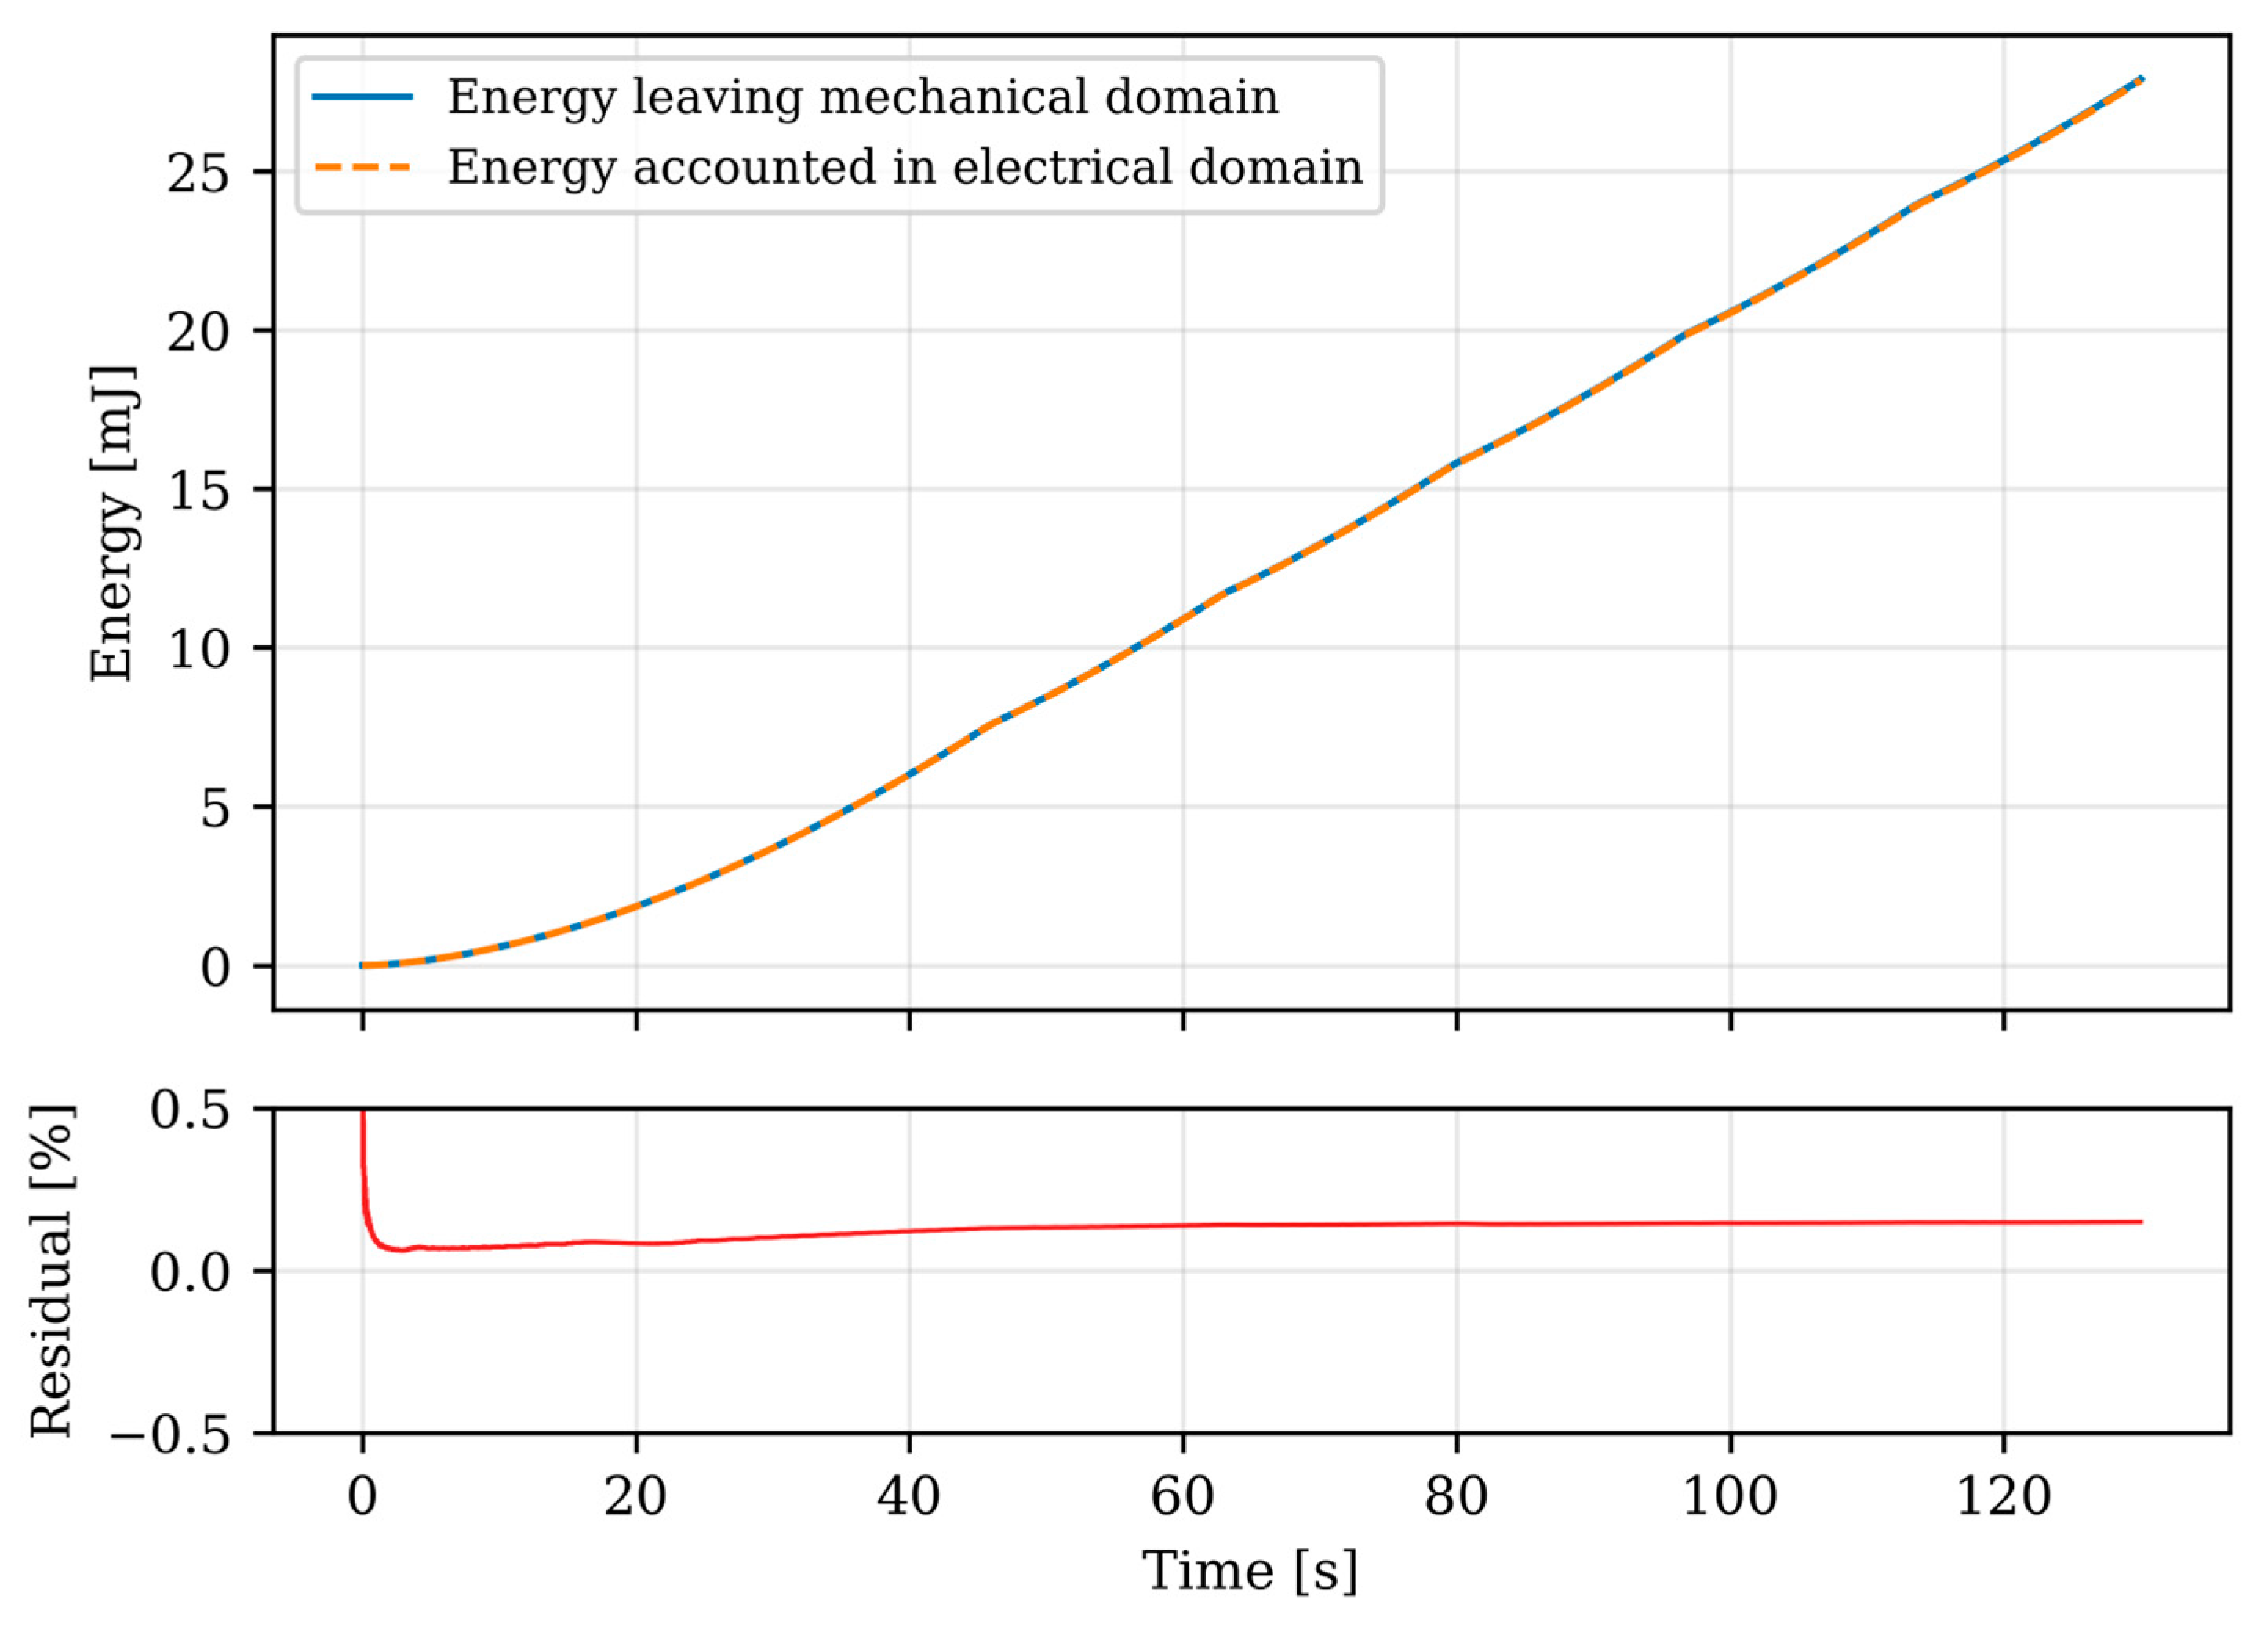
Section 3.2. According to Equation (10), the power leaving the mechanical domain must equal, at every instant, the power entering the electrical domain, since the coupling matrix is exactly symmetric (α = β). To this end, the energy transferred through the coupling was integrated on the mechanical side and compared with independent accounting performed entirely on the electrical side, comprising the energy stored in the clamped capacitance, the dielectric losses, the conduction losses of the rectifier, the energy stored in Cs, the energy drawn by the power management stage, and the sleep consumption of the supervisor. The two cumulative energies are compared in
Figure 9: over 130 s of simulation, 27.9 mJ leave the mechanical domain and 27.9 mJ are accounted for in the electrical domain, with a relative residual of 0.15% attributable to the integration tolerance, which decreases linearly with the time step (
Section 5.3). This result confirms that the numerical implementation preserves the symmetric, lossless nature of the electromechanical transformer: any residual growing beyond the integration tolerance would reveal an inconsistent implementation of the coupling, in agreement with the diagnostic interpretation of asymmetry proposed in
Section 3.2.
The steady-state energy flow can be summarised as follows. The average mechanical power extracted from the vibrating structure amounts to 240 µW; conduction losses in the rectifier absorb 12.6% of the transferred energy, in agreement with the estimate of Equation (13) evaluated at the steady-state peak voltage, while dielectric losses account for 0.4%. The average power made available to the storage subsystem during the recharge phase is 206 µW. Accounting for the load-dependent converter efficiency (81% at the reference operating point), the average power delivered to the electronic load over a complete limit cycle equals 168 µW, corresponding to an overall efficiency of the electrical chain—from the power extracted from the mechanical domain to the power delivered to the load—of about 70%. It is worth stressing that this figure quantifies the efficiency of the conditioning and power management chain, not the fraction of the mechanical energy of the host structure that is converted; the latter depends on the coupling strength and on the operating point of the transducer, as discussed in
Section 5.4. The main quantitative results are collected in
Table 4.
5.3. Model Verification: Analytical Solution and Step-Size Convergence
Since the framework is intended as a virtual prototyping tool, the correctness of its numerical implementation was verified against an independent closed-form solution. For a purely resistive load R connected directly to the transducer, the governing equations of
Section 3 admit an exact harmonic steady-state solution: the tip displacement amplitude, the transducer voltage and the power dissipated in the load follow from the complex frequency response of the coupled system, in which the electrical branch appears as an additional complex stiffness α
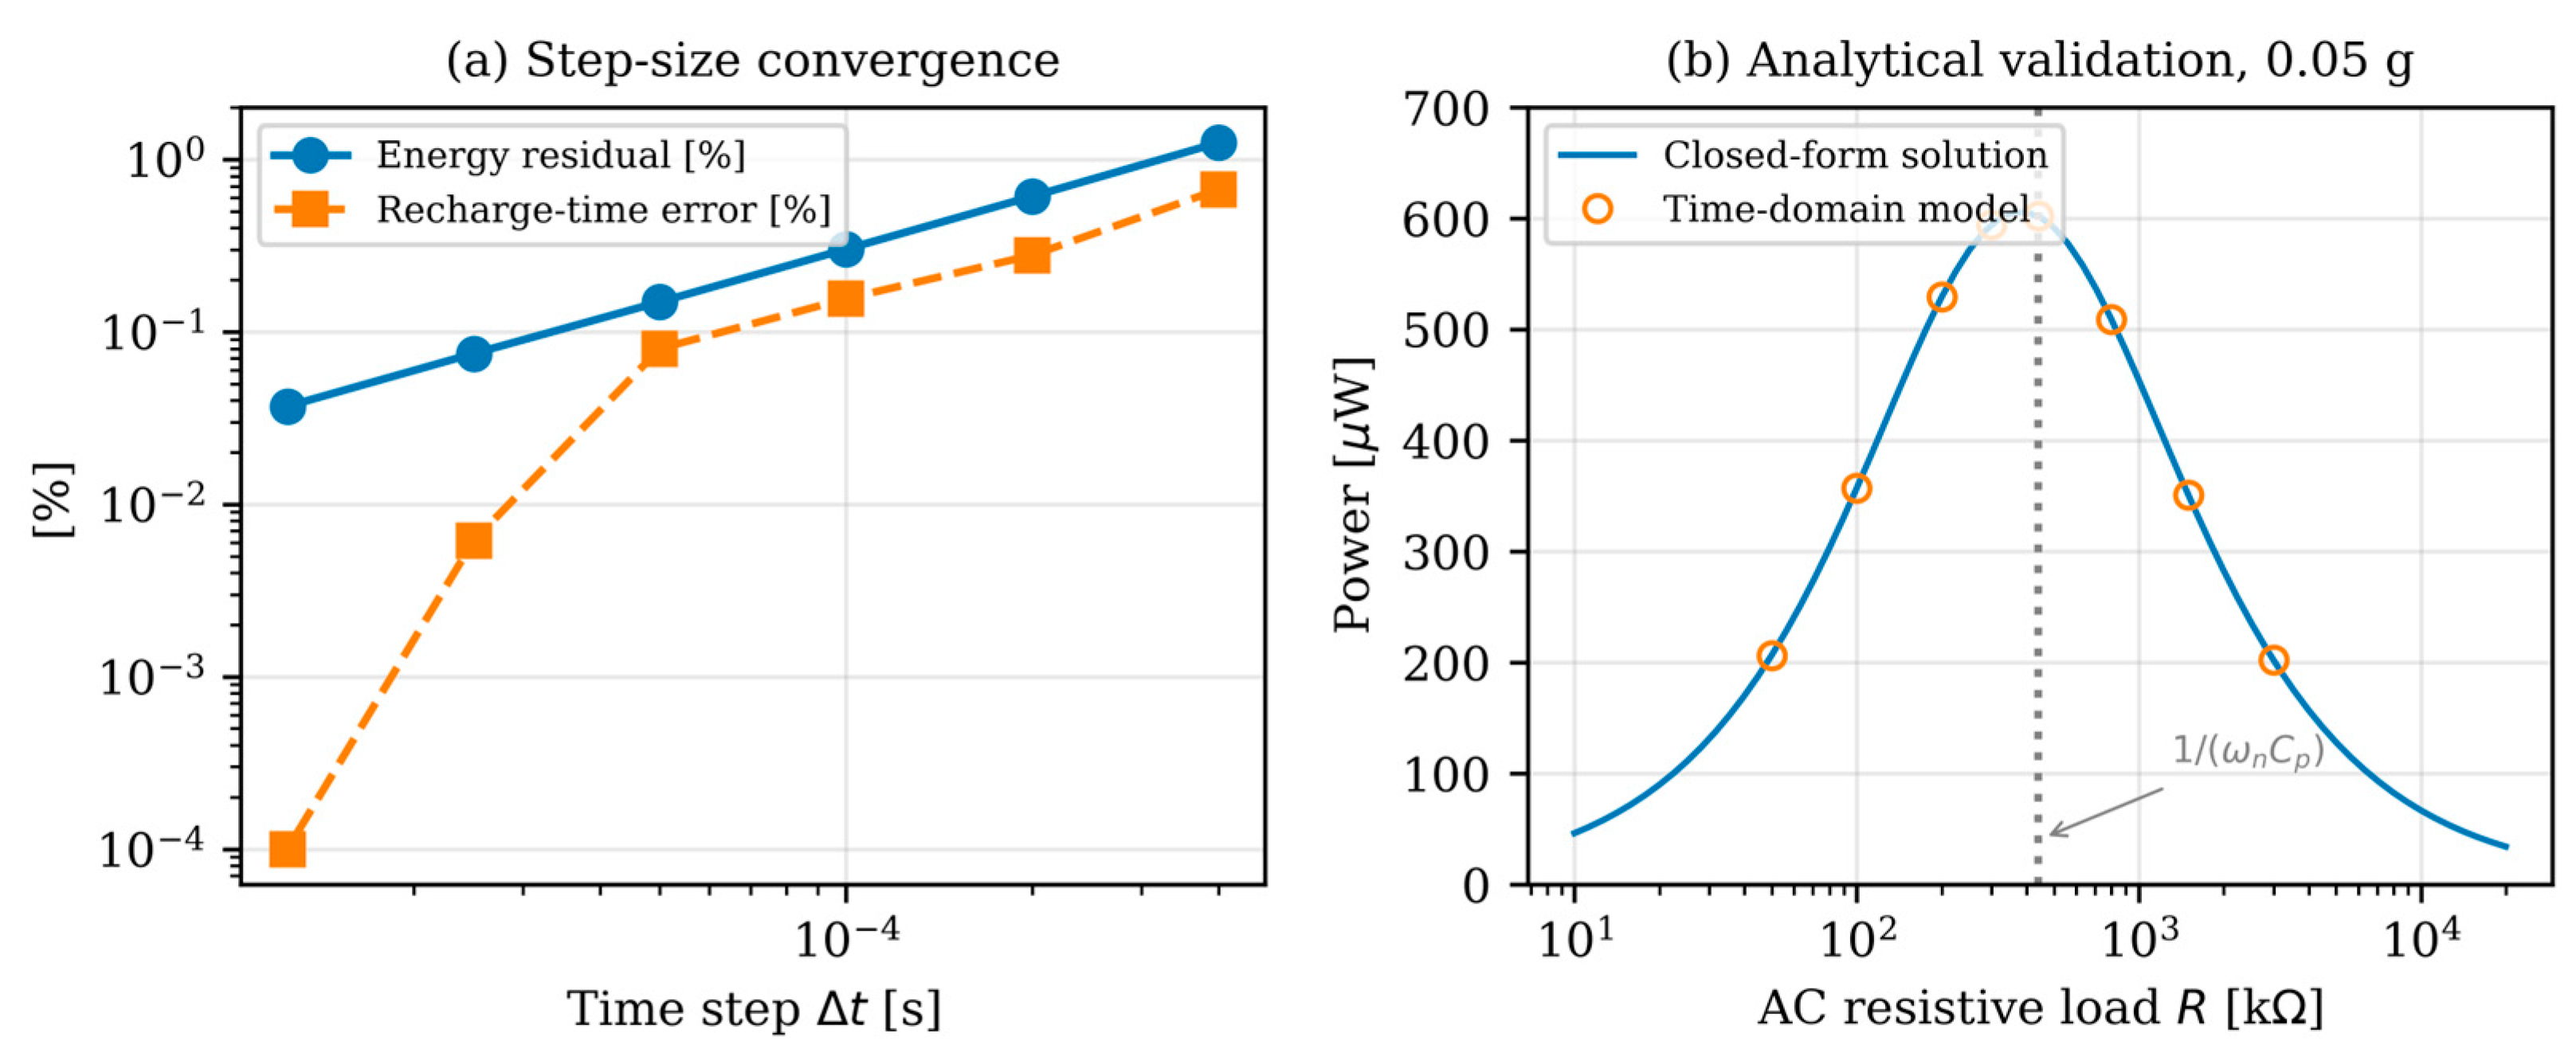
2 jω/(jωCp + 1/R + 1/Rloss). The same configuration was simulated with the time-domain model for load resistances spanning three decades, and the results are compared in
Table 5 and
Figure 10b. The agreement is within 0.07% for the power and within 0.1% for displacement and voltage over the whole range, including the region of maximum power transfer. Together with the exact reproduction of Equation (11) and with the closure of the two-domain energy balance (
Section 5.2), this comparison verifies the implementation of the coupled electromechanical equations independently of the Simscape environment.
The numerical stability of the fixed-step scheme in the presence of the discontinuities introduced by the diode clamps and by the hysteretic comparator was assessed through a step-size sensitivity study, in which the reference simulation was repeated with time steps between 4 × 10
−4 s and 1.25 × 10
−5 s (
Table 6 and
Figure 10a). The recharge time, the cold-start time and the average output power converge monotonically and differ from the finest-step values by less than 0.1% already at 10
−4 s; the energy balance residual decreases linearly with the step size, as expected for a first-order scheme, from 1.25% to 0.04%. The peak transducer voltage is the most sensitive quantity, since it depends on the resolution of the conduction instants of the bridge, and converges from 6.29 V to 5.60 V. The adopted step of 5 × 10
−5 s therefore provides converged results for all the quantities of interest with a residual of 0.15%. No numerical instability was observed at any step size, since the clamp formulation of the rectifier removes the stiff time constant associated with the diode conduction resistance and the hysteretic logic introduces only isolated switching events.
5.4. Impedance Matching Between Transducer and Conditioning Circuit
The high internal impedance of the transducer (Equation (12)) raises the question of the optimal load for maximum power transfer. For a resistive AC load, the closed-form solution of
Section 5.3 (
Figure 10b) gives a maximum of 606 µW at R ≈ 400 kΩ, close to the first order estimate 1/(ωn Cp) = 440 kΩ; the deviation is due to the electrical damping introduced by the coupling, which slightly shifts the optimum. This value represents the upper bound of the electrical power that the reference harvester can deliver at 0.05 g. In the actual architecture, however, the transducer does not see a resistor but a rectifier feeding a quasi-constant storage voltage, and the relevant matching variable becomes the storage voltage Vs itself.
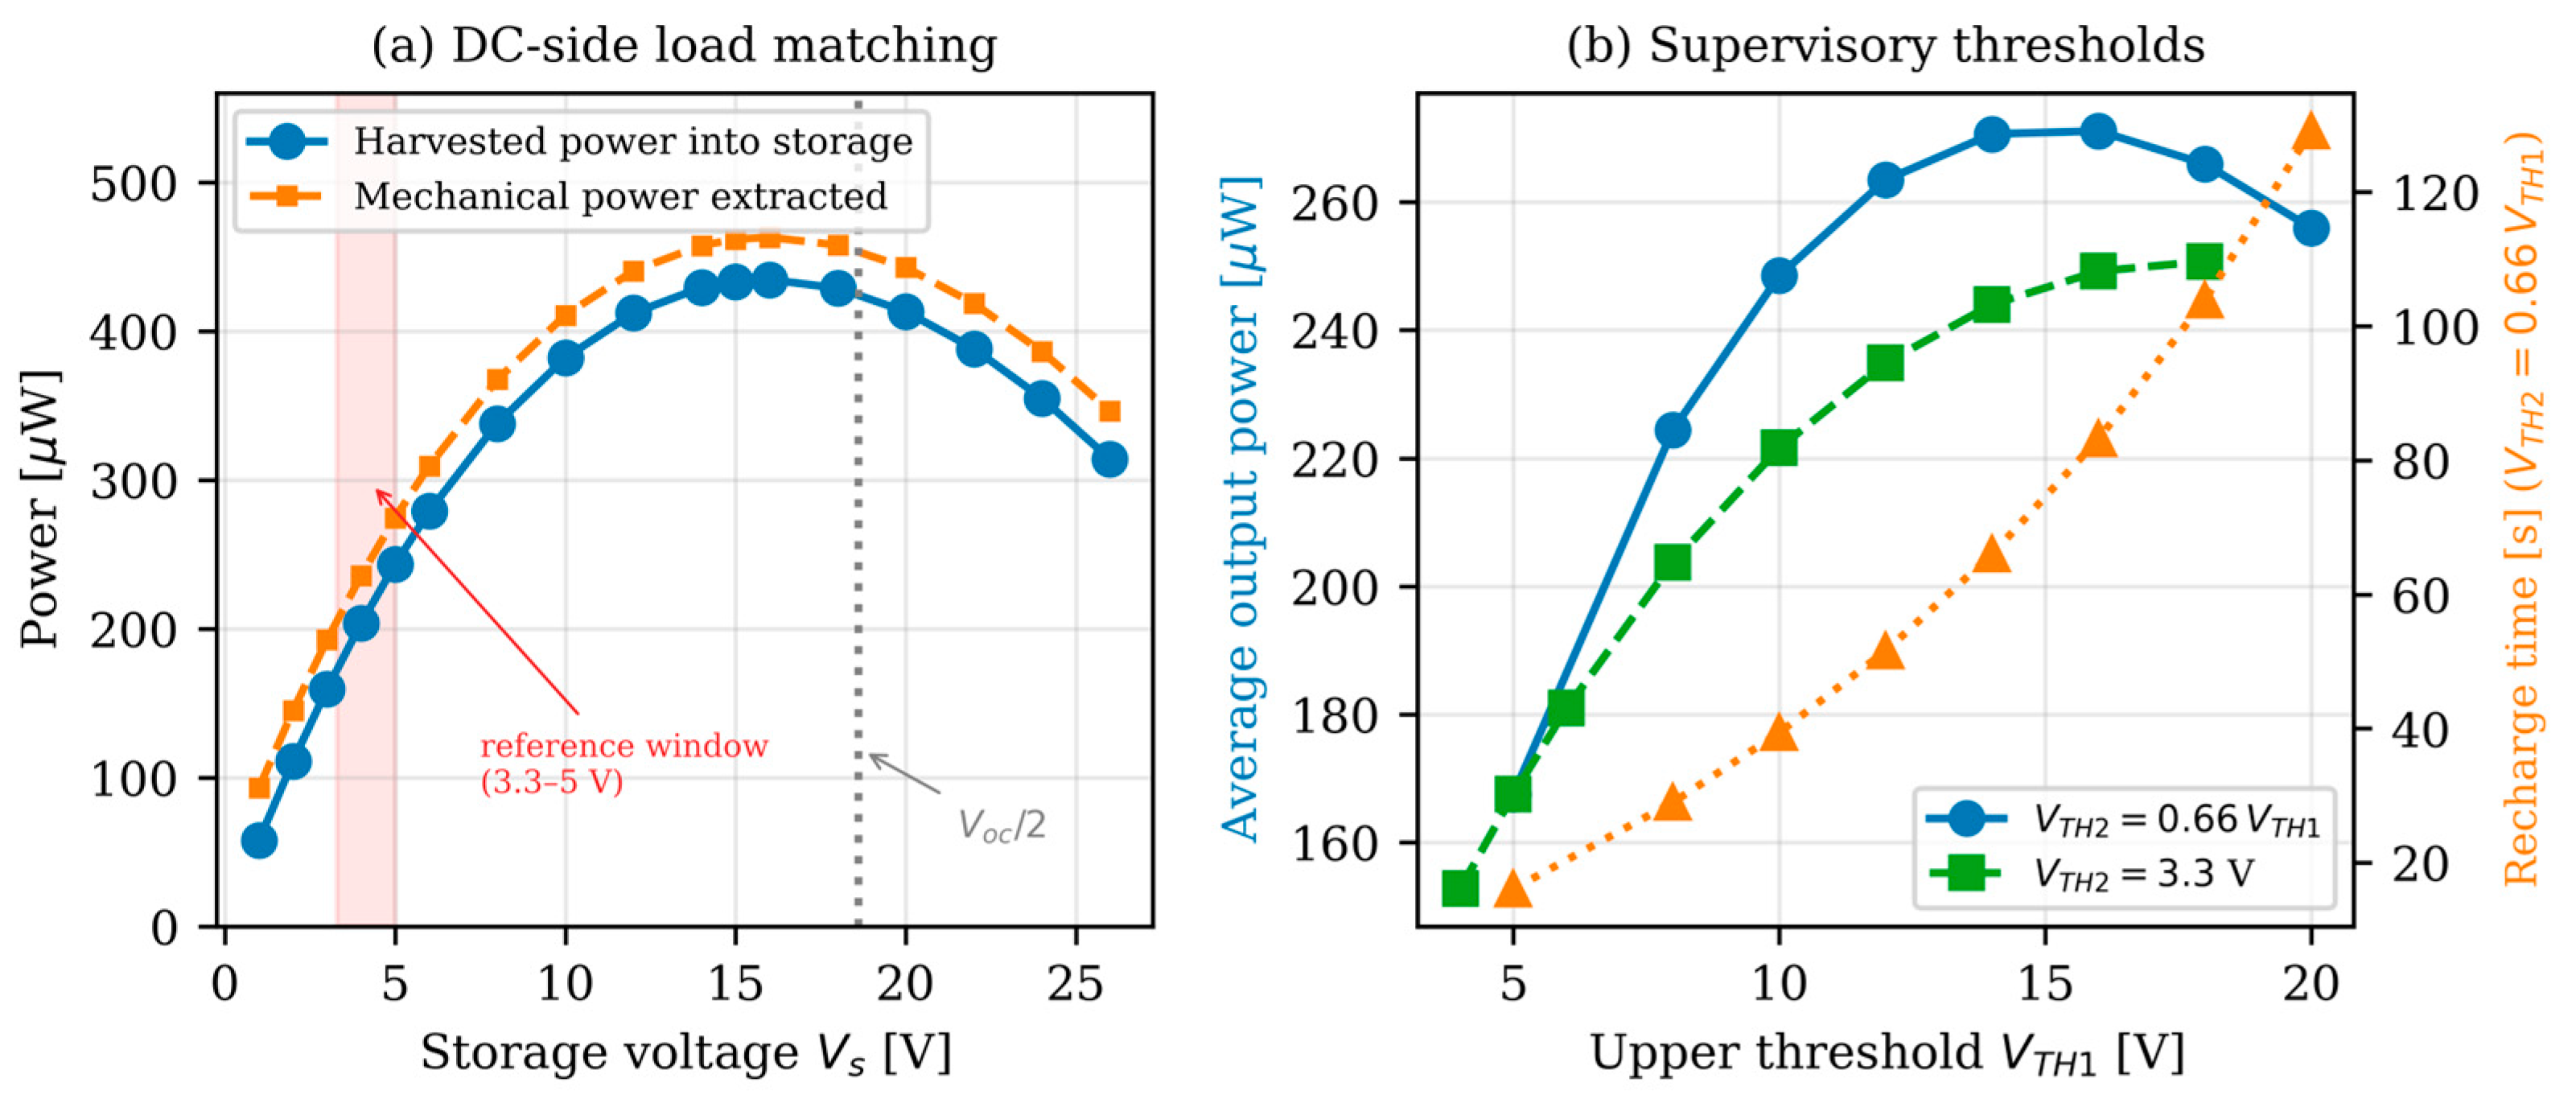
Figure 11a reports the average power delivered to the storage capacitor as a function of Vs, obtained by simulating the circuit with a very large storage capacitance so that Vs remains constant. The harvested power exhibits the well-known behaviour of the standard rectifier interface: it grows with Vs, since the rectified current is almost independent of the storage voltage as long as the latter is small compared with the open-circuit amplitude Voc = 37 V, reaches a maximum of 435 µW at Vs ≈ 15–16 V—slightly below Voc/2 because of the electrical damping—and decreases thereafter as the conduction angle of the bridge shrinks. The maximum harvested power of the rectifier interface is 72% of the resistive optimum, the difference being due to the diode losses and to the non-sinusoidal current drawn by the bridge.
This result has a direct design implication for the supervisory thresholds. The reference window of 3.3–5.0 V, chosen for compatibility with the input range of standard buck converters, keeps the transducer far from its optimal operating point and extracts only 160–245 µW of the 435 µW available; moving the storage window towards 12–18 V would nearly double the harvested power, at the cost of a converter with a wider input range and of a longer recharge time. The same effect explains the sub-quadratic scaling of the output power with the excitation amplitude discussed in
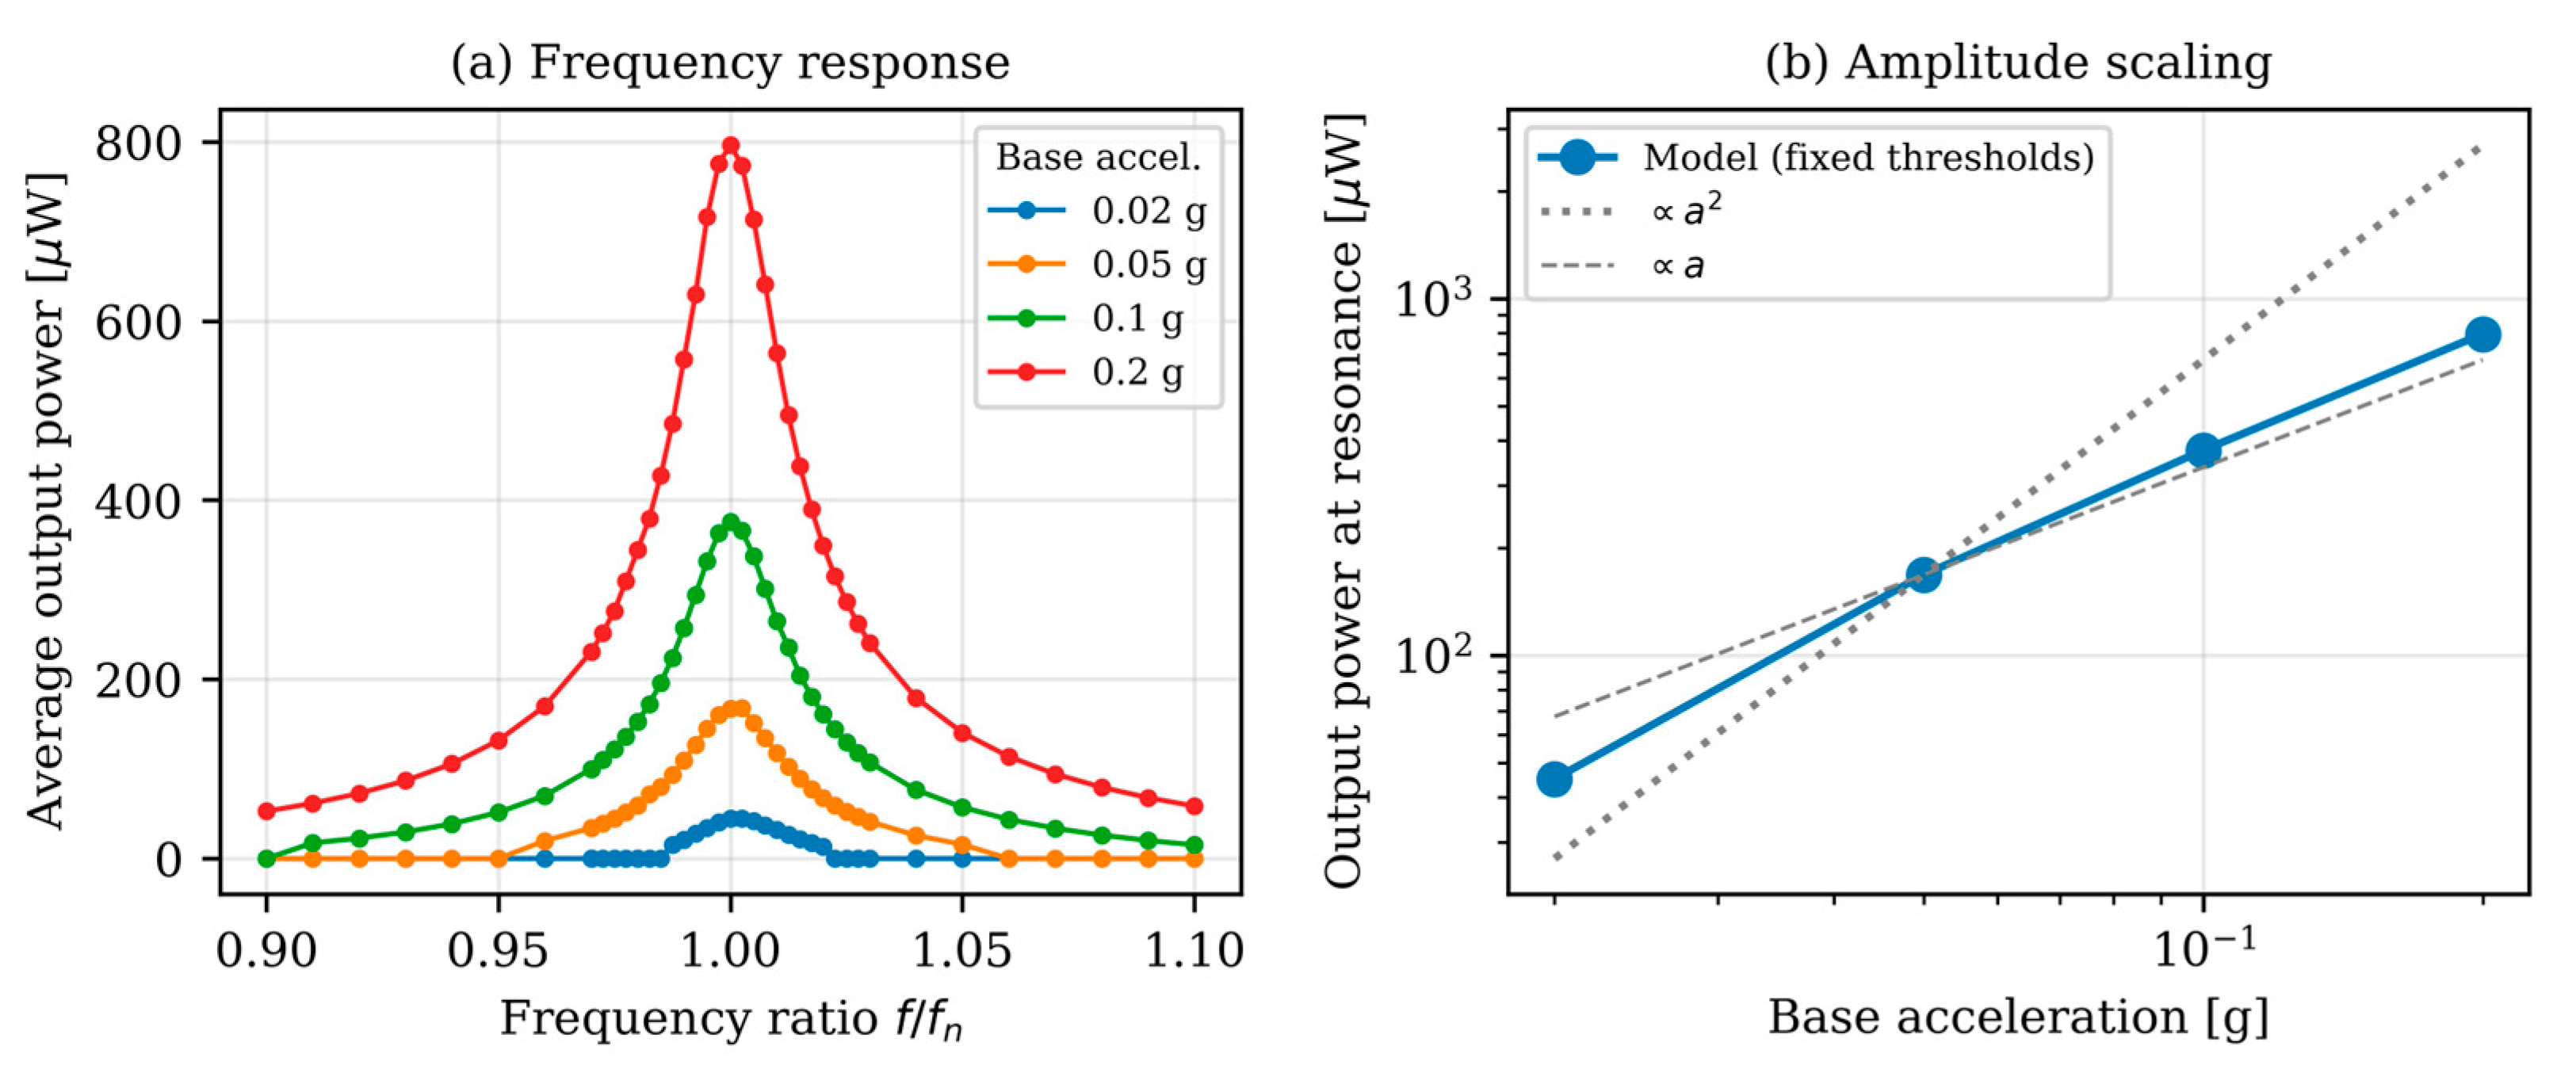
Section 5.5: with fixed thresholds, the storage voltage does not track the increase in the open-circuit voltage, so that the harvested power tends to grow linearly rather than quadratically with the acceleration. Adaptive threshold strategies, tracking Voc/2 as in maximum-power-point techniques, can be straightforwardly implemented in the supervisory block of the framework and represent a natural development of the present work.
5.5. Influence of Excitation, Mechanical Parameters and Load
The dependence of the harvester performance on the excitation was investigated by sweeping the excitation frequency between 0.9 fn and 1.1 fn for base accelerations of 0.02, 0.05, 0.1 and 0.2 g, with the reference circuit and thresholds (
Figure 12). The average output power at resonance equals 45, 168, 376 and 796 µW, respectively. As anticipated in
Section 5.4, the scaling with the acceleration is intermediate between linear and quadratic, tending to be linear at high excitation levels because the storage voltage is fixed by the thresholds. The frequency response is narrow, as expected for a lightly damped linear resonator: the half-power bandwidth is 0.23–0.34 Hz, i.e., 2–3% of fn, and at the lowest excitation level a detuning larger than 1.5% prevents the storage voltage from ever reaching the upper threshold, so that no power is delivered to the load. This behaviour quantifies the well-known limitation of linear resonant harvesters when the host vibration frequency is uncertain or time-varying and motivates the broadband and nonlinear architectures—bistable, vibro-impact or frequency up-converting harvesters—proposed in the literature [
15]; within the present framework, such architectures can be introduced by replacing the linear mechanical subsystem, without modifying the electrical domains.
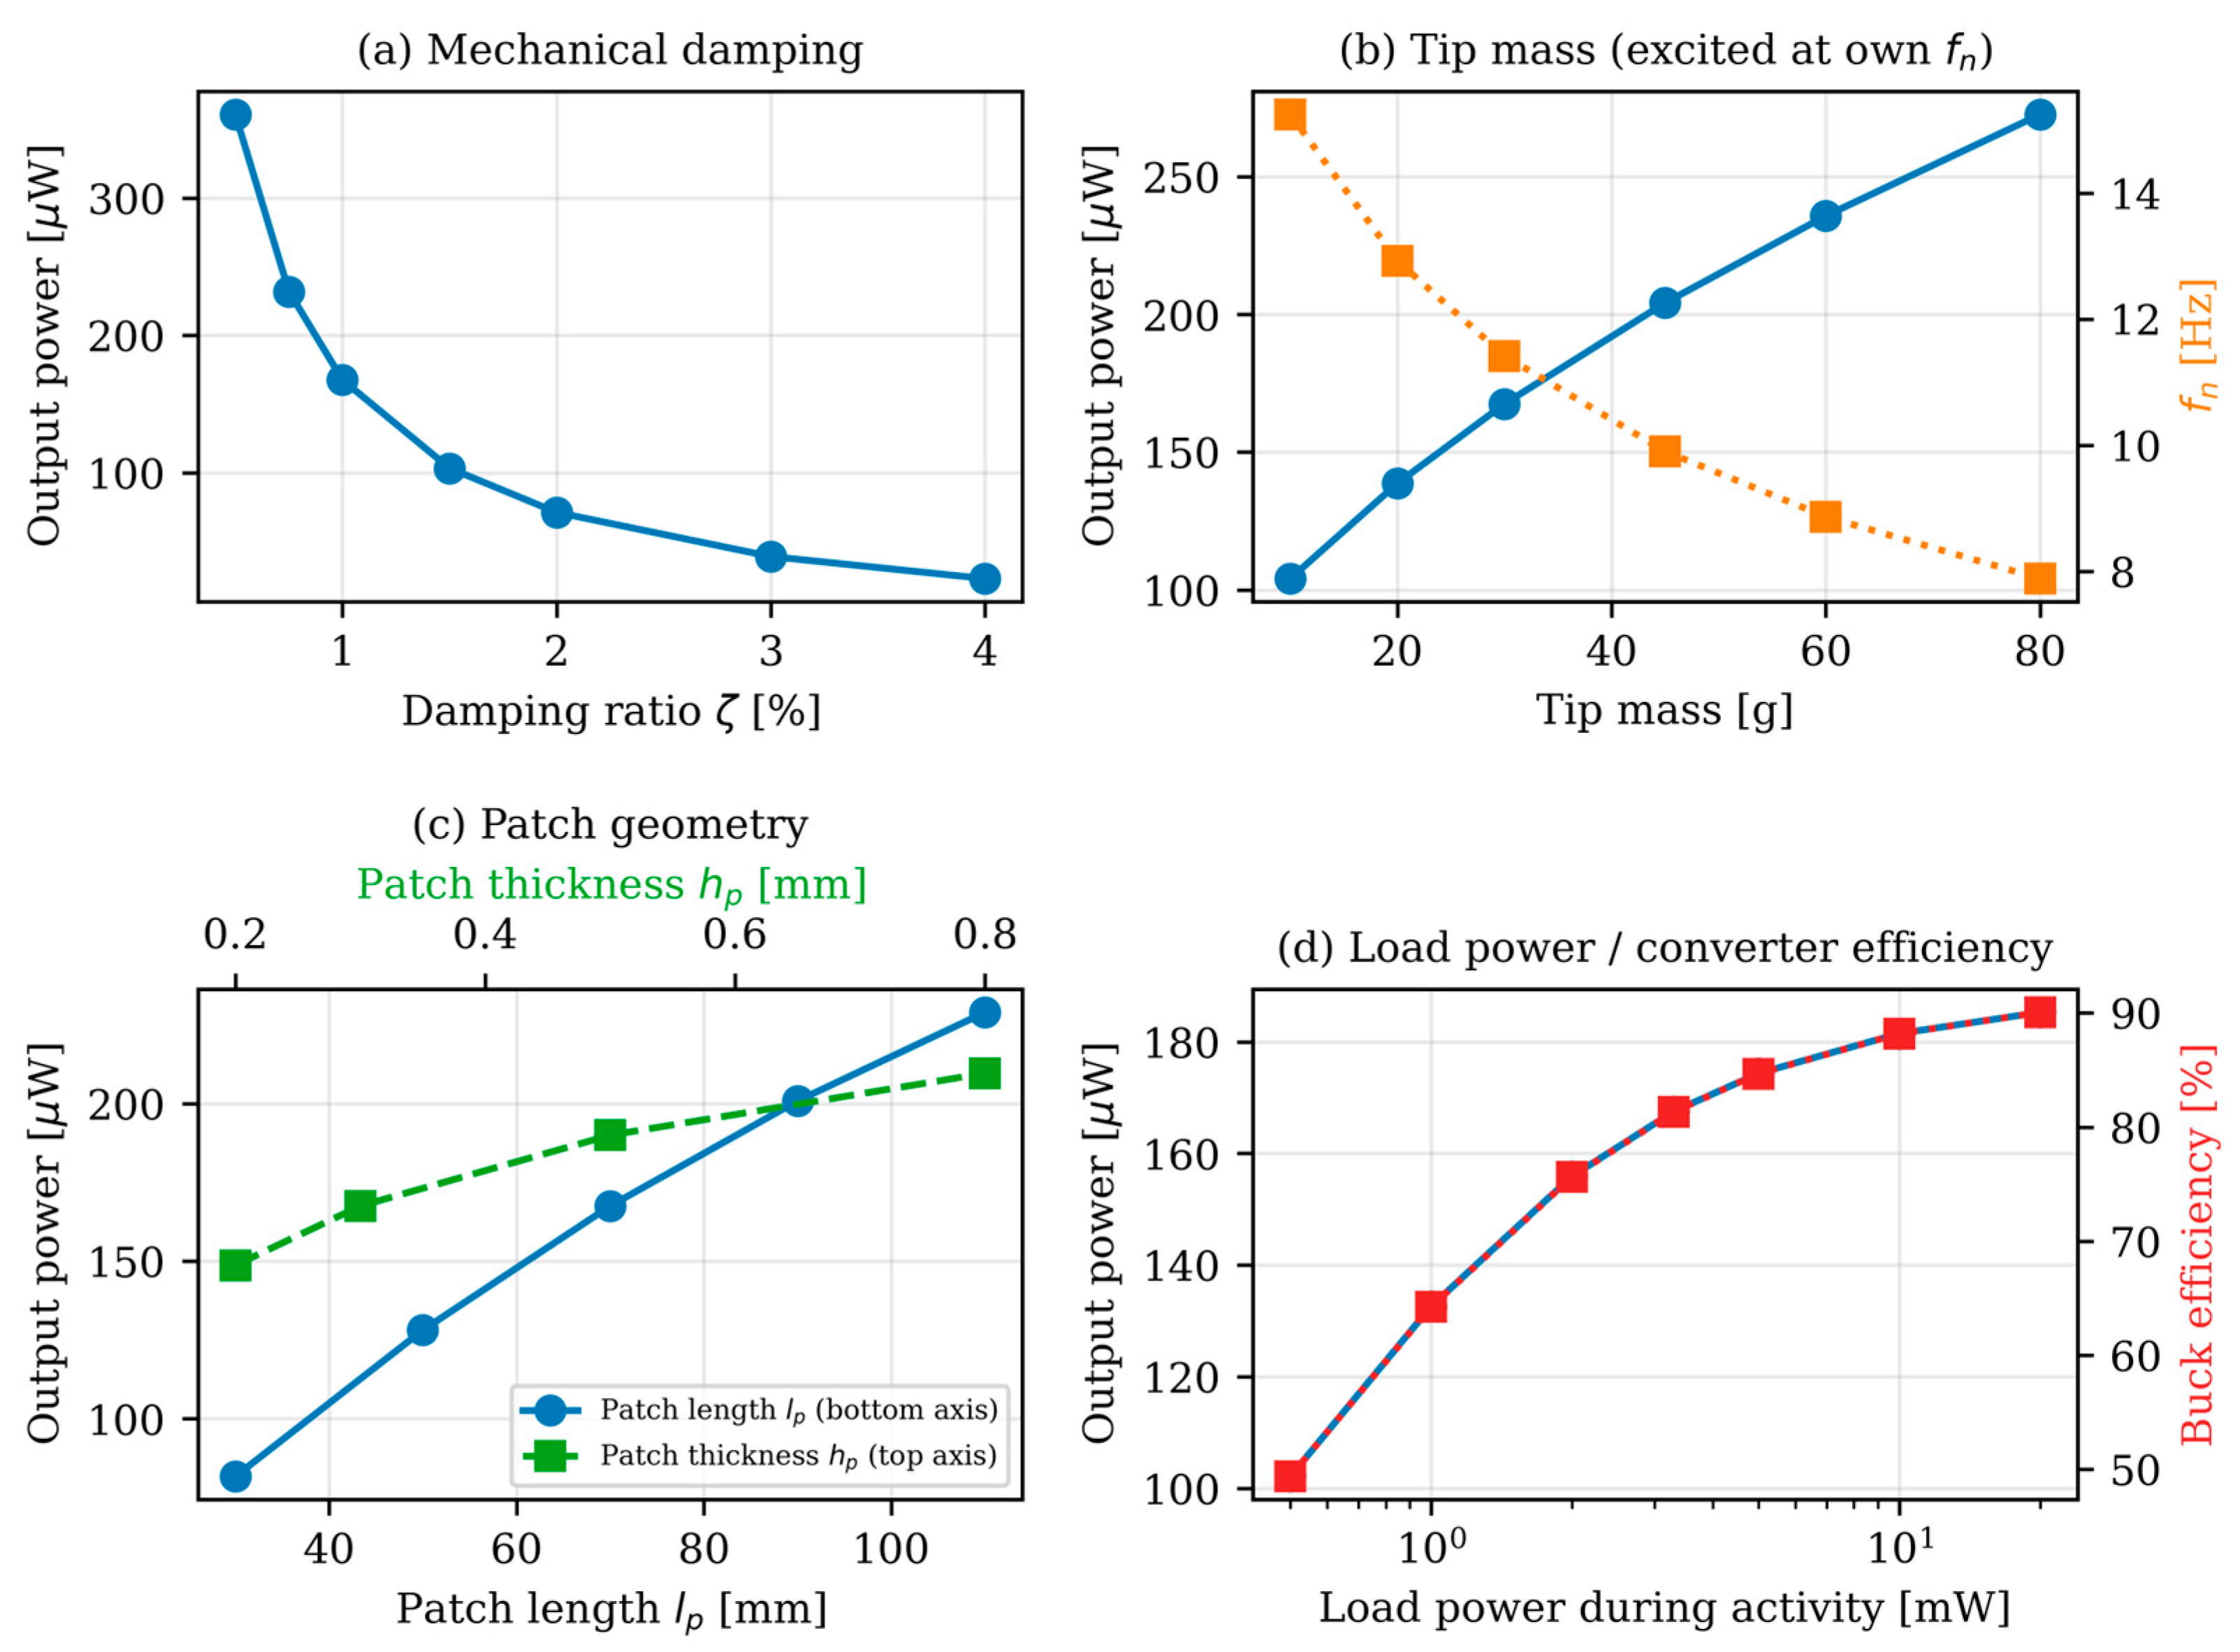
Figure 13 extends the parametric analysis to the mechanical and electrical parameters of the reference case. The mechanical damping ratio is by far the most influential parameter (
Figure 13a): the output power increases from 23 µW at ζ = 4% to 361 µW at ζ = 0.5%, following approximately the 1/ζ dependence of the resonant response; an accurate experimental identification of the damping is therefore the prerequisite for any quantitative prediction. Increasing the tip mass from 10 g to 80 g lowers the natural frequency from 15.2 Hz to 7.9 Hz and raises the output power from 104 µW to 273 µW when the harvester is excited at its own resonance (
Figure 13b), at the price of a larger tip displacement. The patch geometry has a moderate influence (
Figure 13c): the output power grows almost linearly with the patch length, from 82 µW at 30 mm to 229 µW at 110 mm, and more weakly with the patch thickness, from 149 µW at 0.2 mm to 210 µW at 0.8 mm. Finally, the power drawn by the load during the active phase (
Figure 13d) does not affect the harvested power but changes the efficiency of the converter: for the same energy per cycle, a 0.5 mW load is served at 49% efficiency and receives on average 102 µW, whereas a 20 mW load is served at 90% efficiency and receives 185 µW. Concentrating the energy consumption of the node in short, high-power bursts is therefore preferable to a low continuous consumption, a conclusion that would not emerge from a fixed-efficiency converter model. The storage capacitance does not influence the average power and only scales the cycle period, as expected.
5.6. Supervisory Thresholds and Limits of the Linear Model
The influence of the supervisory thresholds, anticipated in
Section 3.4, is summarised in
Figure 11b for two strategies: a fixed lower threshold VTH2 = 3.3 V with increasing VTH1, and a proportional window VTH2 = 0.66 VTH1 that keeps the relative hysteresis constant. In both cases the average output power increases with the upper threshold, as the transducer operating point approaches the DC matching optimum of
Section 5.4: with the proportional window it rises from 168 µW at VTH1 = 5 V to a maximum of 271 µW at VTH1 = 14–16 V and decreases thereafter, while the recharge time grows from 16 s to 83 s. The choice of the hysteresis band therefore embodies a trade-off between the average harvested power and the latency of the monitoring function: applications requiring frequent, short measurement bursts benefit from a low, narrow band, whereas applications with sporadic, energy-intensive transmission events benefit from a high, wide one. The proposed framework allows this trade-off to be explored systematically at the design stage, without requiring hardware prototyping.
The results at the highest excitation levels must be read in the light of the assumptions of the model. At 0.2 g the peak tip displacement reaches 18.7 mm, i.e., 7.5% of the beam length, and the maximum strain in the patch is estimated at about 940 µε, whereas at the reference excitation of 0.05 g these figures are 1.9% and 235 µε, respectively. The reference case is therefore well within the range of validity of the linear Euler–Bernoulli kinematics and of the linear piezoelectric constitutive law, while at 0.2 g geometric stiffening, amplitude-dependent damping and nonlinear electro-elastic coupling can be expected to reduce the response with respect to the linear prediction, which should be regarded as an upper bound; a survey of modelling approaches for geometrically nonlinear vibrations of thin-walled structures is given in [
16]. The adequacy of the single-degree-of-freedom reduction was assessed with a Rayleigh–Ritz model of the cantilever with six assumed modes, accounting for the partial patch and the tip mass: the first natural frequency of the multi-mode model is 11.63 Hz, 1.8% above the lumped value of
Table 2, the second and third bending modes lie at 8.2 fn and 25 fn, and the quasi-static contribution of the second mode to the tip response under harmonic excitation at fn is 0.006% of the resonant contribution of the first mode. Under harmonic excitation close to the fundamental frequency, the higher modes are therefore negligible; under broadband or impulsive excitation, however, the second mode—whose average curvature over the patch is 4.8 times that of the first mode for the same modal amplitude—would contribute appreciably to the generated charge, and a multi-mode mechanical subsystem should be adopted. These aspects are further discussed in
Section 5.9.
5.7. Sensor-Node Consumption Profile and Feasibility of Self-Powered Operation
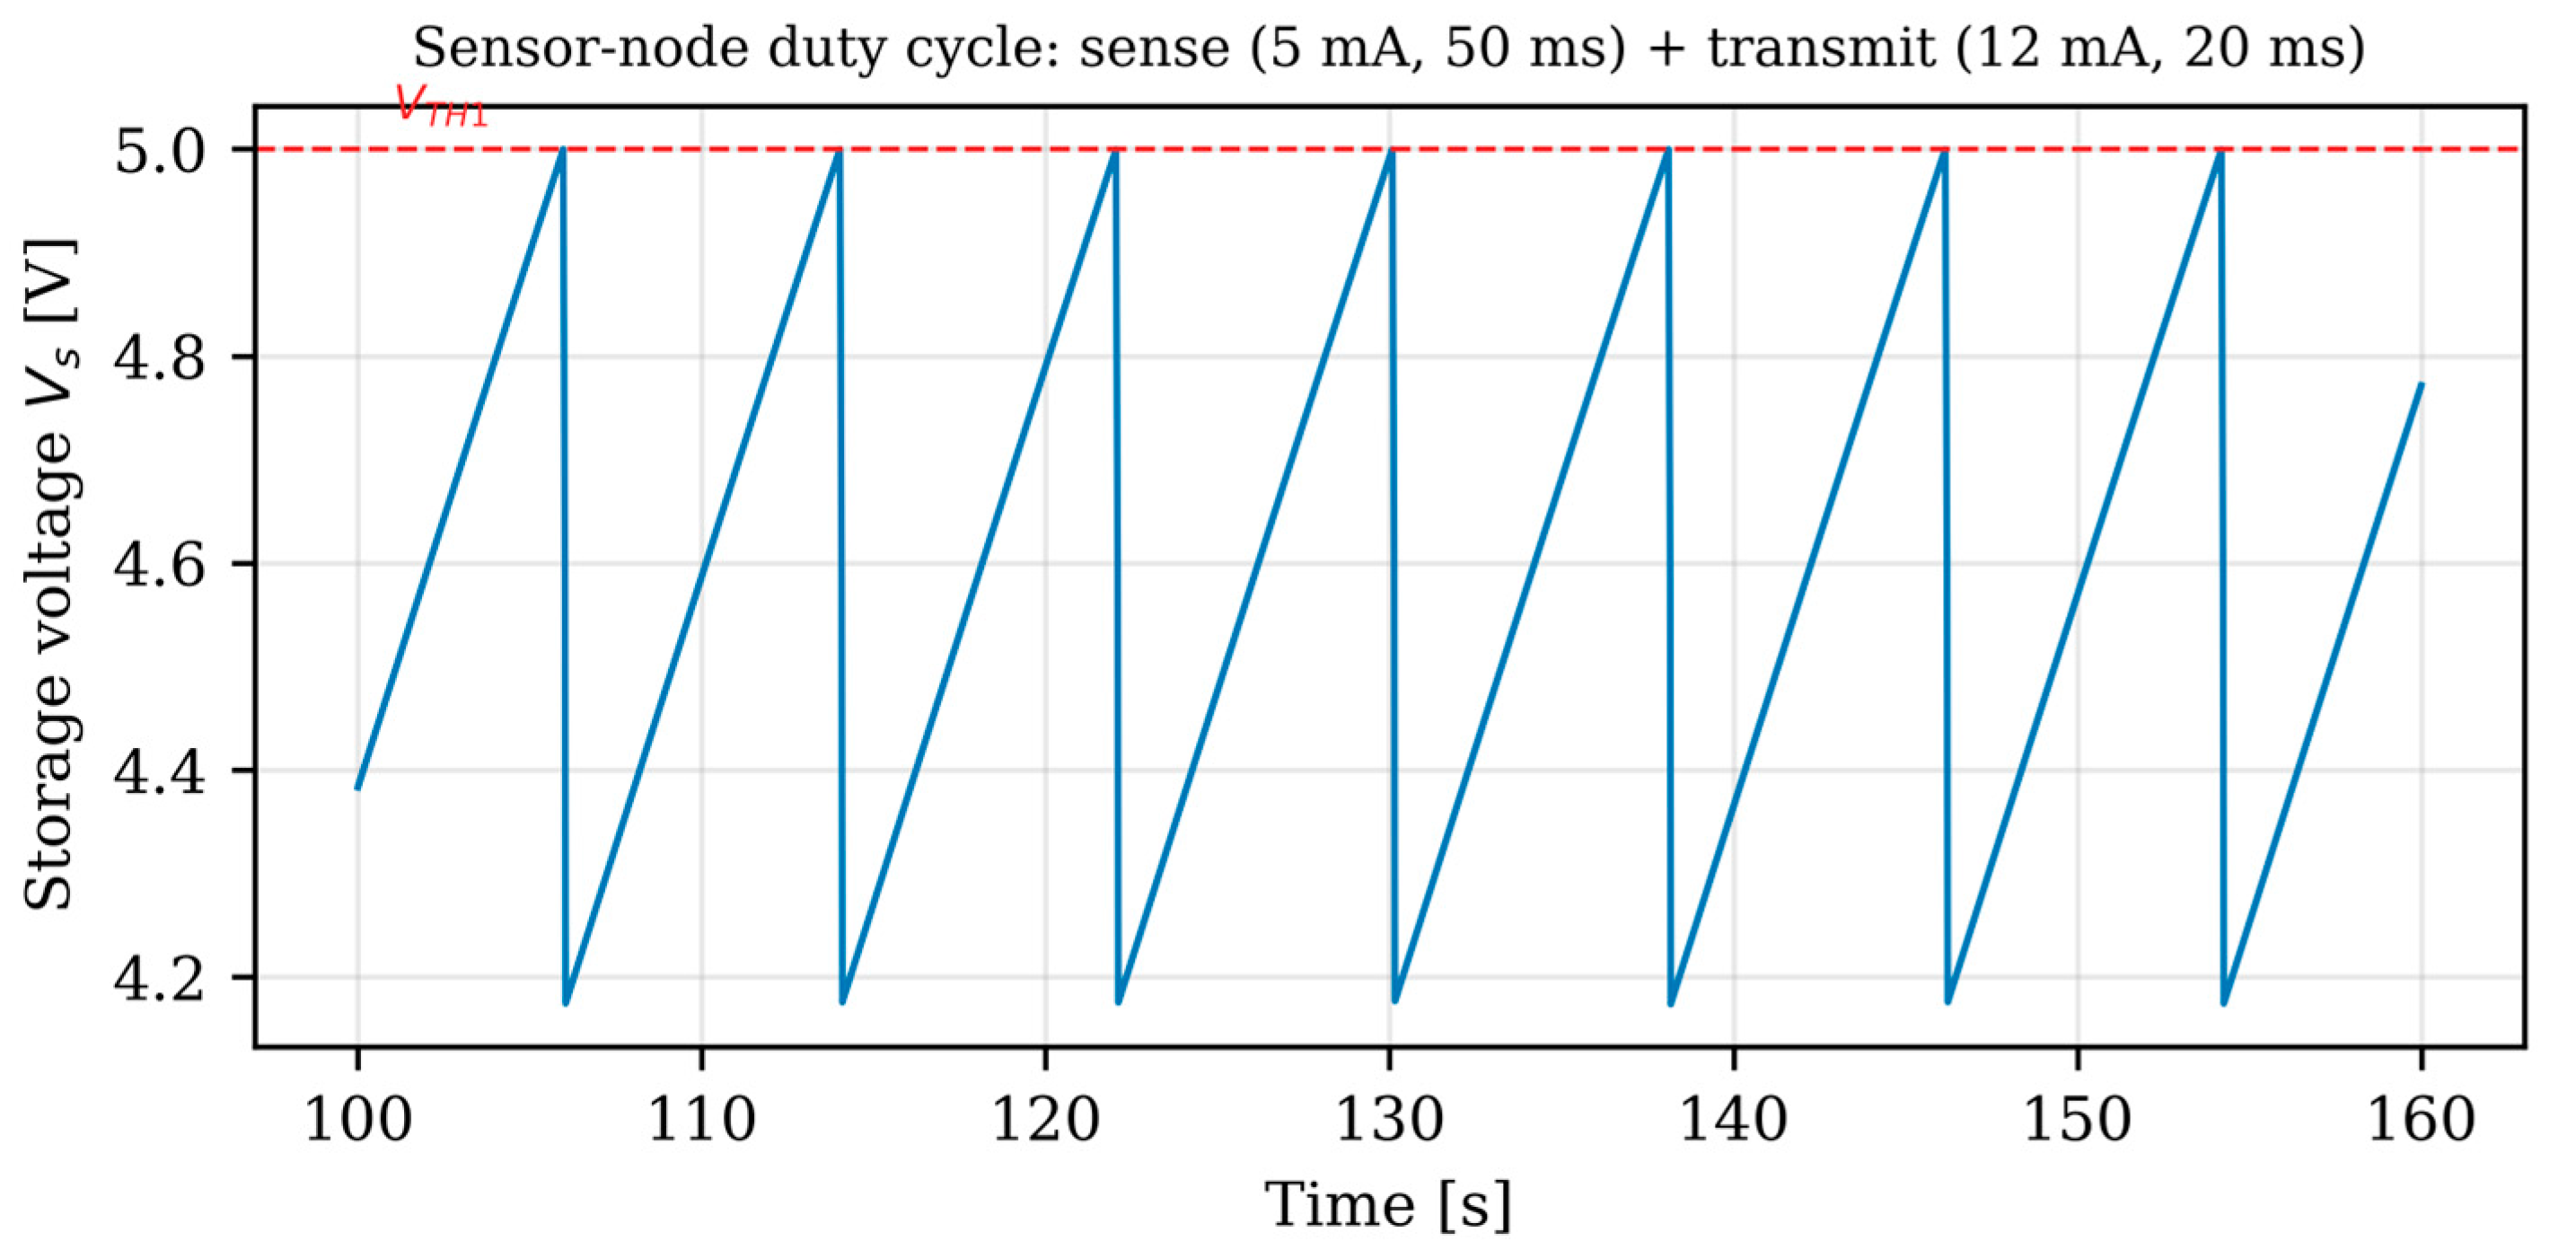
To assess the feasibility of the self-powered monitoring concept beyond the constant-power reference load, the node was described by a realistic duty-cycled consumption profile: a sensing and processing phase drawing 5 mA at 3.3 V for 50 ms, followed by a wireless transmission burst of 12 mA for 20 ms, representative of a low-power microcontroller with a Bluetooth Low Energy or sub-GHz radio; the supervisor enables the converter when the storage voltage reaches VTH1 and disables it at the end of the event. Each measurement-and-transmission event requires 1.62 mJ at the load, i.e., about 1.8 mJ drawn from the storage capacitor at the corresponding converter efficiency of 90%. With the reference harvester at 0.05 g, the storage voltage drops from 5.0 V to about 4.6 V during the event and recovers in 8.0 s (
Figure 14), so that the node can sustain one complete measurement-and-transmission event every 8 s, i.e., 7.5 events per minute, indefinitely. With the optimised threshold window of
Section 5.6 (14 V/9.2 V) the event rate rises to 13.4 per minute. These rates are largely sufficient for structural health monitoring applications, in which measurement intervals from minutes to hours are typical, and indicate that the reference harvester could support either more frequent sampling or more energy-intensive processing at the node.
5.8. Comparison with the Literature
A quantitative comparison with published cantilever harvesters requires a common metric, since the reported power depends on device size, excitation level and frequency. The normalised power density NPD = P/(V a
2), where V is the device volume and a is the base acceleration in g, is widely adopted for this purpose. For the reference harvester, the device envelope, including beam and tip mass, is approximately 11.3 cm
3. The maximum electrical power on the optimal resistive load, which is the quantity usually reported in the literature, is 606 µW at 0.05 g, corresponding to an NPD of about 2.1 × 10
4 µW cm
−3 g
−2; the DC power actually delivered to the load through the complete conditioning chain with the reference thresholds, 168 µW, corresponds to 5.9 × 10
3 µW cm
−3 g
−2. For comparison, the 1 cm
3 bimorph generator of Roundy and Wright delivered 375 µW at 2.5 m s
−2 and 120 Hz [
17], i.e., an NPD of 5.8 × 10
3 µW cm
−3 g
−2; a conventional cantilever bimorph analysed by Sharpes et al. produced 65 µW cm
−3 at 0.1 g and 32 Hz [
18], i.e., 6.5 × 10
3 µW cm
−3 g
−2; and the geometry-optimised bimorph of Cho et al. reached 13.5 mW cm
−3 at 6.9 m s
−2 and 29 Hz [
19], i.e., 2.7 × 10
4 µW cm
−3 g
−2. The reference harvester of this work thus falls within the range of experimentally demonstrated devices, being comparable to conventional cantilever designs when the complete DC chain is considered and approaching optimised designs when the intrinsic capability of the transducer is considered. Two caveats apply: the present values are numerical predictions for a reference case with assumed damping, whereas the literature values are measurements; and the comparison confirms that the largest margin of improvement lies not in the transducer but in the operating point imposed by the conditioning circuit, as quantified in
Section 5.4. The 70% efficiency of the electrical chain reported in
Table 4 is consistent with the 60–85% typically reported for standard rectifier-plus-buck interfaces at milliwatt levels and should not be confused with the mechanical-to-electrical conversion efficiency of the transducer.
5.9. Model Assumptions and Limitations
The results of this section should be interpreted within the assumptions of the model, which are summarised here together with the developments they suggest. First, the piezoceramic is described by constant linear electro-elastic coefficients and by a constant mechanical damping ratio. This description is adequate at the strain levels of the reference case (a few hundred µε), but soft PZT ceramics exhibit amplitude-dependent coupling and dielectric coefficients and stress-dependent damping at higher strain levels, such as those estimated at 0.2 g in
Section 5.6; the modular structure of the framework allows nonlinear constitutive laws to be introduced in the transducer block without affecting the other domains. Second, the structural dynamics are reduced to a single degree of freedom: the Rayleigh–Ritz analysis of
Section 5.6 shows that this reduction is accurate to within 2% in frequency and that higher modes are negligible under harmonic excitation near fn, whereas broadband excitation and large tip deflections would require a multi-mode or geometrically nonlinear mechanical subsystem [
15,
16]. Third, temperature is not modelled. Civil and transportation environments may span temperature variations of several tens of degrees, over which the dielectric, piezoelectric and elastic properties of PZT exhibit a measurable temperature dependence [
20]; consequently, both the electromechanical coupling and the structural natural frequency may vary with the operating temperature. The forward voltage of Schottky diodes decreases with increasing temperature, with temperature coefficients typically of the order of 1–2 mVK
−1 depending on the device and operating current [
21]. Since the framework is built on Simscape physical networks, a thermal domain can be added by coupling temperature-dependent parameters in each block to a common thermal network, which is a planned extension. Fourth, the converter is described by the behavioural efficiency model of Equation (16), which captures the load-dependent efficiency and quiescent losses of real PMICs but not their switching ripple or start-up behaviour. Finally, all results are numerical: the analytical verification of
Section 5.3 establishes the correctness of the implementation, but the experimental validation of the complete chain on a laboratory cantilever with its conditioning circuit—in particular the identification of the damping ratio and of the effective coupling—is the necessary next step and is planned as the continuation of this work.
Overall, the numerical simulations confirm the two central claims of the proposed methodology. First, all physical domains interact within a single numerical environment: modifications introduced in the electrical subsystem, such as the threshold values, the diode characteristics or the converter losses, immediately affect the mechanical response through the symmetric coupling, and vice versa, as the impedance matching analysis clearly shows. Second, the integrated implementation preserves the exact symmetry of the electromechanical transformer established in
Section 3.2, as demonstrated by the closure of the independent two-domain energy balance within the integration tolerance and by the agreement with the closed-form solution. These features make the framework a reliable virtual prototyping tool for the self-powered monitoring applications discussed in the following section.
6. Self-Powered Monitoring Applications
The modelling framework developed throughout the previous sections extends beyond the analysis of the proposed piezoelectric energy harvester, providing a general methodology for the integrated design of future self-powered monitoring systems. The coupled electromechanical model, the electrical conditioning circuit and the multi-domain numerical simulations demonstrated that the proposed approach is capable of simultaneously describing the complete energy conversion process, from mechanical excitation to electrical power delivery. Such an integrated representation constitutes a valuable engineering tool for evaluating the energy balance of autonomous sensing systems before prototype realization and experimental validation.
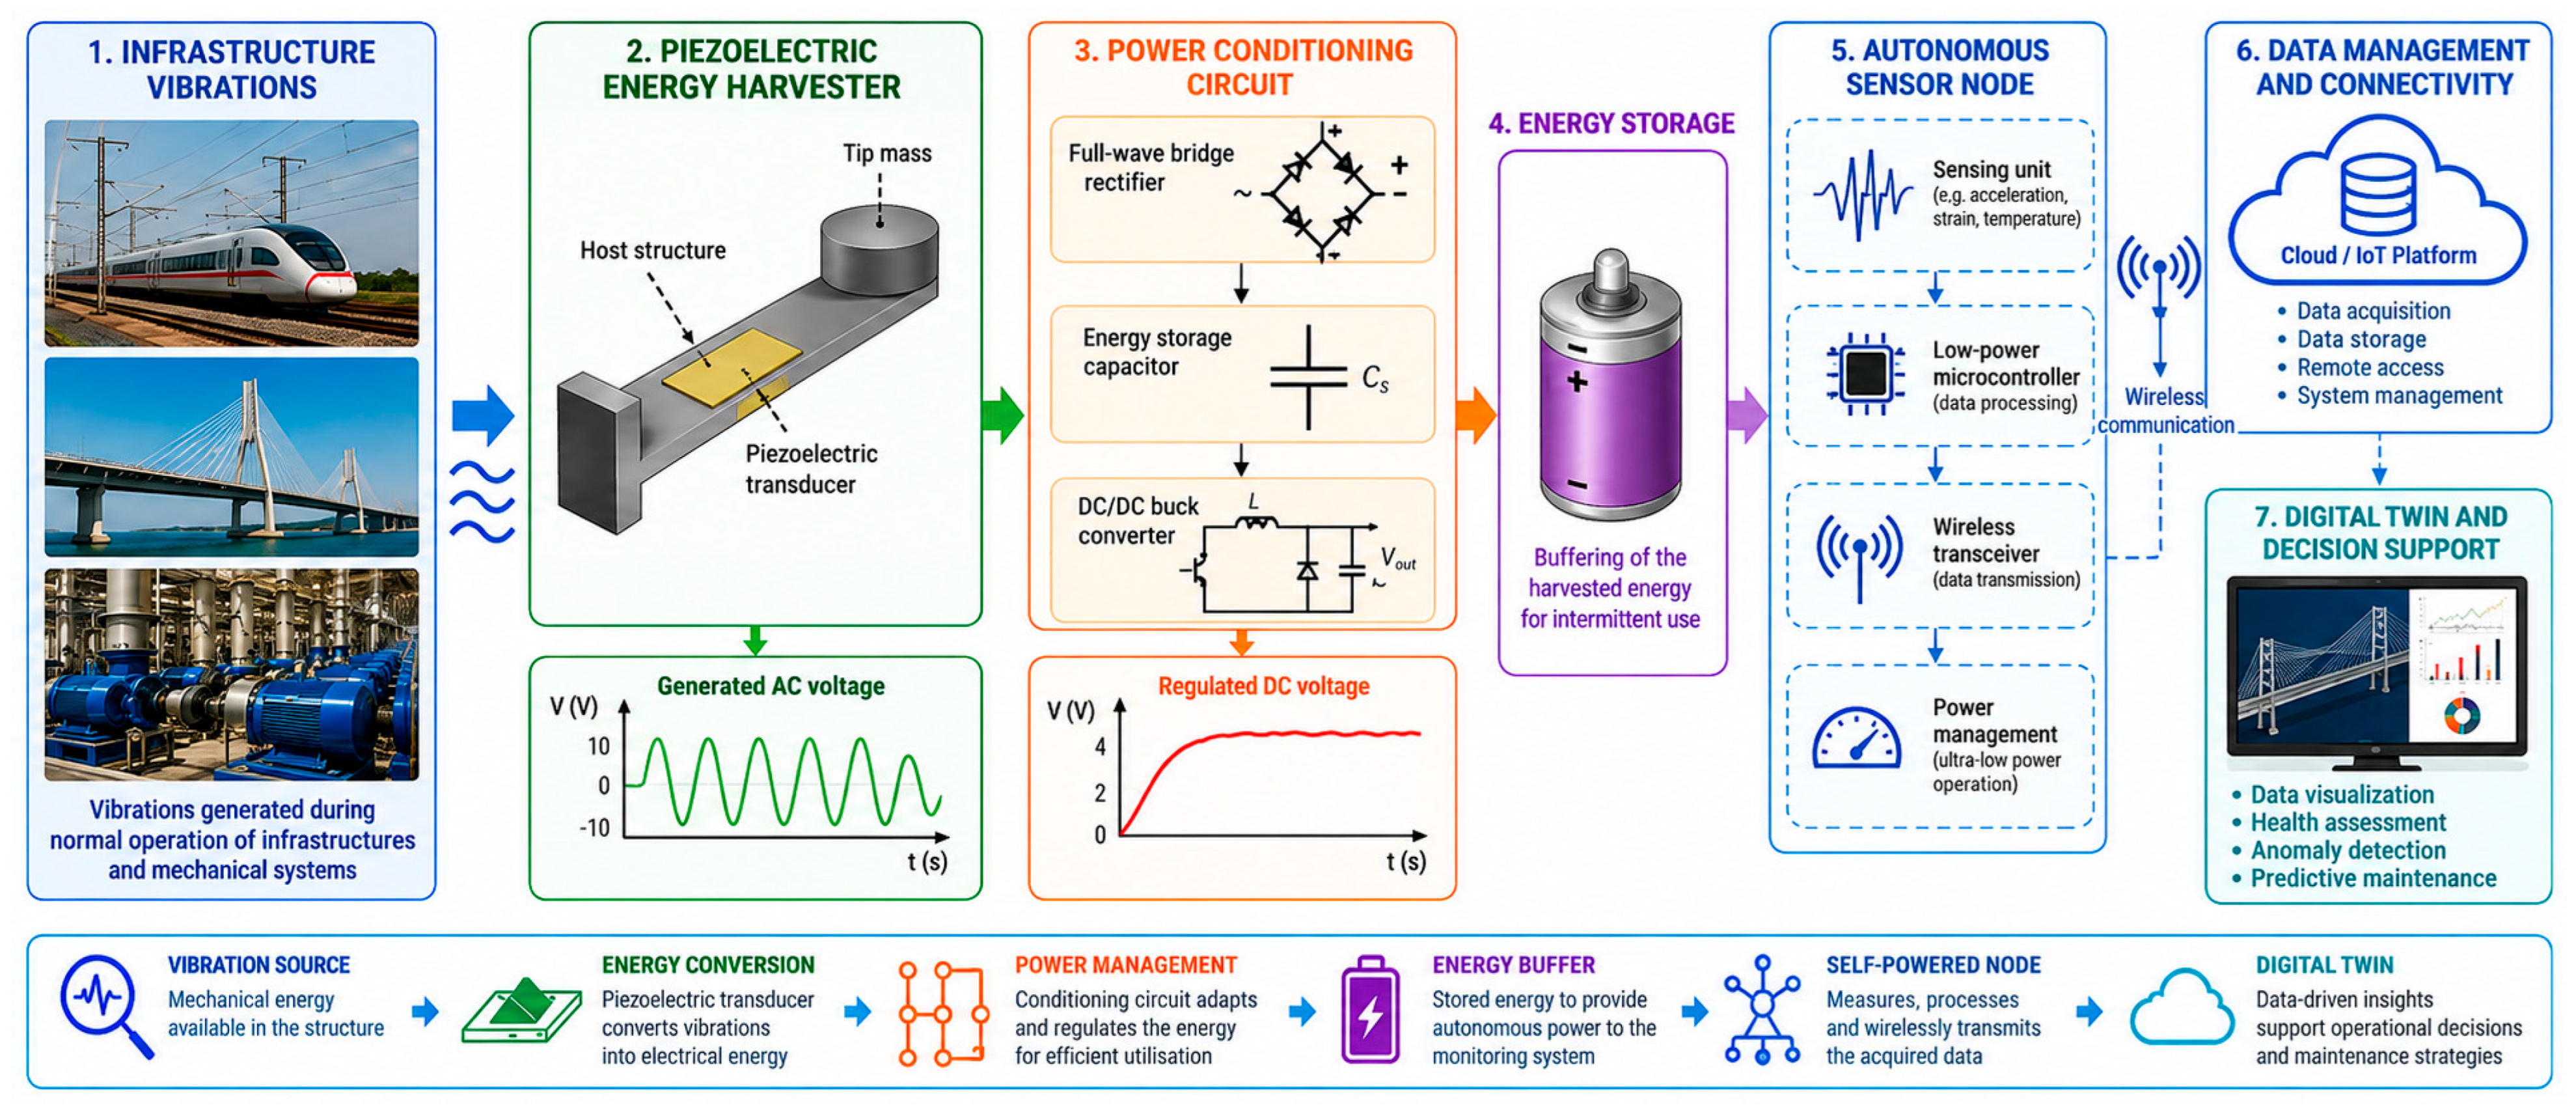
The adoption of distributed monitoring systems has progressively increased across several engineering fields owing to the continuous development of sensing technologies, embedded electronics and wireless communication systems. Modern SHM architectures increasingly rely on large networks of autonomous sensing nodes capable of continuously acquiring information regarding structural integrity, operational conditions and environmental variables (
Figure 15). Compared with conventional inspection-based maintenance strategies, continuous monitoring significantly improves fault detection capabilities while supporting predictive maintenance methodologies and lifecycle management of critical infrastructures [
22,
23,
24,
25].
Despite these technological advances, the long-term energy supply of distributed sensing systems remains one of the principal challenges limiting their large-scale deployment. In infrastructures extending over several kilometres or including hundreds of sensing locations, periodic battery replacement rapidly becomes economically unsustainable and operationally complex. Consequently, considerable research efforts have focused on the development of self-powered sensing platforms capable of harvesting ambient energy directly from the operating environment, thereby reducing maintenance requirements while increasing system autonomy [
26,
27,
28].
Among the available harvesting technologies, piezoelectric transducers are particularly suitable for applications characterised by continuous dynamic excitation. Vibrations naturally generated during the operation of railway vehicles, bridges, viaducts, industrial machinery and transportation infrastructures represent a valuable energy source that can be converted into electrical power without interfering with the primary functionality of the monitored system. The relatively high-power density, compact dimensions and ease of integration of piezoelectric devices make them particularly attractive for low-power sensing applications, where the harvested energy can be accumulated and periodically supplied to sensing, processing and wireless transmission units [
29,
30,
31].
Within this scenario, the multi-domain framework proposed in this work enables the simultaneous optimisation of both the harvesting device and the associated monitoring architecture. Since the mechanical subsystem, the piezoelectric transducers, the conditioning electronics and the storage components are solved within the same simulation environment, designers can directly evaluate the interaction between the available mechanical energy, the harvested electrical power and the power consumption profile of the sensing system. This capability is particularly important during the early design stages, when different transducer configurations, storage capacities, converter topologies and monitoring strategies can be assessed without requiring the realization of multiple physical prototypes.
The proposed methodology also provides a flexible platform that can be readily adapted to different application scenarios. While the present work considers a vibration-based piezoelectric harvester, the same modelling philosophy can be extended to alternative transduction mechanisms, different power management architectures and various sensing technologies. Similarly, the monitoring subsystem may include different sensor typologies according to the specific application, including accelerometers, strain gauges, displacement sensors, temperature sensors or environmental monitoring devices, while preserving the overall multi-domain structure of the model.
Potential application fields include railway infrastructure monitoring, bridge and viaduct surveillance, industrial asset management, and smart transportation systems, where autonomous sensing nodes may continuously supervise both structural behaviour and operational conditions. In railway applications, for example, self-powered monitoring systems could support the continuous assessment of suspension components, wheelsets, bogies, track quality and other safety-critical subsystems, reducing the need for dedicated power wiring while increasing the spatial density of sensing networks. Similar approaches may also be adopted for civil infrastructures, where distributed autonomous sensors could contribute to long-term SHM programmes and support predictive maintenance strategies through continuous data acquisition [
32,
33].
Beyond the specific application considered in this work, the proposed framework naturally supports the development of Digital Twin environments by providing a physically consistent model capable of integrating mechanical behaviour, energy harvesting, electronic power management and sensing functionalities within a single simulation platform. Such integration facilitates virtual prototyping, parameter optimisation and future hardware-in-the-loop implementations, enabling the progressive transition from component-level modelling towards complete cyber–physical monitoring systems. Consequently, the methodology presented in this work should be regarded not only as a modelling approach for piezoelectric energy harvesters but also as a general framework for the design of next-generation self-powered monitoring platforms.
7. Conclusions
This paper presented a comprehensive multi-domain modelling framework for piezoelectric energy harvesting systems intended for self-powered monitoring applications. Unlike conventional modelling approaches, where the mechanical, electrical and electronic subsystems are typically analysed independently, the proposed methodology integrates all the physical domains involved in the energy conversion process within a unified MATLAB Simscape environment. The resulting framework enables the simultaneous representation of the coupled electromechanical behaviour, the electrical conditioning circuit, the energy storage subsystem and the power management electronics, providing a physically consistent description of the complete harvesting process.
A coupled electromechanical model was first developed to describe the interaction between the vibrating cantilever and the piezoelectric transducer through a unified energy-based formulation. The proposed model was subsequently integrated with the electrical conditioning circuit, including the full-wave bridge rectifier, the storage capacitor and the DC/DC power management stage, allowing the complete harvesting architecture to be represented within the same simulation environment. The numerical simulations demonstrated the capability of the proposed framework to analyse the dynamic interaction among the different physical domains while evaluating the influence of the electrical interface on the overall harvesting performance.
Beyond the specific case study considered in this work, the proposed modelling methodology provides a general virtual prototyping framework for the design and optimisation of future self-powered monitoring systems. The integrated representation of mechanical excitation, energy harvesting, electrical conditioning and power management enables the energy requirements of autonomous sensing platforms to be assessed during the early design stages, reducing development time and limiting the need for iterative experimental activities.
The proposed framework is intentionally modular and can therefore be extended to different transducer technologies, alternative power conditioning architectures and various sensing configurations. This flexibility makes the methodology suitable for a broad range of engineering applications, including SHM of civil infrastructures, railway monitoring systems, industrial assets and intelligent transportation systems. Furthermore, the integration of multi-domain modelling with autonomous sensing technologies represents a promising step towards the development of future Digital Twin platforms capable of supporting continuous condition assessment and predictive maintenance strategies.
Future developments will focus on the experimental validation of the complete multi-domain architecture through a dedicated physical testbed integrating the piezoelectric harvester, rectification stage, energy-storage subsystem and power-management electronics. This activity will allow the predictive accuracy of the proposed framework to be quantitatively assessed under realistic excitation and loading conditions. Subsequent developments will focus on the implementation of complete self-powered sensing nodes, the integration of low-power wireless communication modules and the extension of the proposed framework to additional energy harvesting technologies. Particular attention will also be devoted to the development of digital engineering platforms in which multi-domain numerical models interact with real-time monitoring data, supporting the evolution of intelligent autonomous infrastructure management systems.