1. Introduction
Graph theory is recognized as an indispensable mathematical foundation that finds application in many disciplines, from chemistry and network security to computer science and biology. Modeling complex systems using vertices and edges to represent entities and their interactions allows for the rigorous structural analysis of various phenomena. Particularly within the scope of chemical graph theory, graphs are used to symbolize molecular skeletons; in these models, atoms are represented by vertices and chemical bonds by edges [
1,
2,
3].
One of the most critical tools in this field is the topological index, a numerical identifier derived from a molecular graph that remains invariant under graph isomorphism. These indices serve as a bridge between a molecule’s geometric architecture and its physicochemical properties, such as boiling point, enthalpy, and biological activity, with these relationships frequently studied through quantitative structure–property relationship (QSPR) models [
4,
5]. These indices are categorized based on specific graph attributes, leading to the development of various classes such as degree-based, eccentricity-based, and temperature-based indices. Recently, these parameters have enabled the accurate prediction of physicochemical properties for many chemical molecules. In addition, these computational methods have spurred extensive scientific research focusing on both the fundamental theoretical properties of chemical molecules and their practical applications [
6,
7].
Let
be an undirected simple graph such that
and
. The subsequent section delineates the core definitions and terminology essential for a comprehensive analysis of the graph theoretical characteristics discussed in this research. In a graph
G, the open and closed neighborhoods of a vertex
v are signified by
and
, respectively. The vertex degree, denoted by
, is defined as the number of edges incident to
v. In terms of neighborhood sets,
is determined by the size of the open neighborhood, such that
. The maximum and minimum vertex degrees are denoted by
and
, respectively [
8]. For any two vertices
, the distance
signifies the length of the shortest path connecting them. The maximum of these shortest paths across all vertex pairs is defined as the diameter of the graph, denoted by
. Additionally, the eccentricity of a vertex
u, indicated by
, represents the greatest distance from the vertex
u to any other vertex
v within
G [
9].
The foundational topological index in chemical graph theory is the Wiener index, initially proposed by H. Wiener [
10]. From a mathematical perspective, it is characterized as the semi-sum of the distances between every pair of vertices within a graph
G, that is,
Following its inception, a diverse array of topological indices, classified primarily into degree-based and eccentricity-based categories, has been developed to capture various structural attributes of molecular frameworks. Some papers about these topological indices include [
11,
12,
13,
14,
15,
16,
17,
18].
In graph theory, a dominating set
for a graph
is defined as a vertex subset where every vertex in
is adjacent to at least one vertex in
. The smallest possible size of such a set is termed the domination number, denoted by
[
9]. Building on the theoretical framework established by Khan (2023), who correlated seven key domination parameters with the p-electronic energy of benzenoid hydrocarbons [
19], Khan et al. (2025) expanded this research by examining the relationship between these parameters and various physicochemical properties [
20]. By calculating these domination values for 22-lower benzenoid hydrocarbons, their study adhered to the statistical methodology proposed by Khan [
19]. Most recently, in 2026, Sankaran and Chidambaram bridged the gap between chemical graph theory and domination theory by investigating dominating energy. This metric is derived from the sum of the absolute eigenvalues of a graph’s dominating matrix. Their research further explores specialized variants, such as total, connected, and distance-based hop dominating energies. By incorporating Estrada and Resolvent versions of these indices, the authors evaluated their predictive accuracy against the p-electronic energy and 12 physical properties of 35 benzenoid hydrocarbons using multiple regression models, ranging from linear to cubic analyses [
21]. In [
22], the authors determine the values of six critical domination parameters for a specific class of benzenoid hydrocarbon compounds and investigate their correlation with twelve standard physicochemical properties. Through a quantitative structure–property relationship (QSPR) analysis, the research demonstrates that the locating domination number outperforms other parameters, showing a robust and strong correlation with most physicochemical properties [
22].
Common eye conditions such as conjunctivitis, glaucoma, dry eyes, and allergies significantly affect an individual’s visual comfort and overall quality of life. A wide range of medications are used to manage these conditions, including antihistamines, decongestants, anti-inflammatory drugs, and antibiotics. These medications are often formulated as topical drops or ointments to provide localized treatment while minimizing potential side effects in the body [
23]. The following section details the chemical structures and clinical applications of selected compounds, predominantly those targeting eye diseases, alongside various systemic, dermatological, hormonal, and excipient molecules. Detailed information on these medications can be found in article [
23].
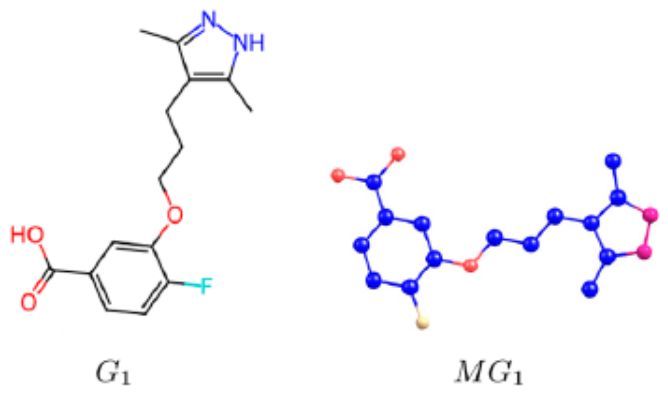
Acoramidis, which combats transthyretin amyloidosis, prevents the formation of harmful fibrils by stabilizing the TTR protein structure. This protein-preserving approach is promising, especially for patients with cardiac involvement, and studies on the drug’s efficacy are ongoing [
23,
24]. The chemical structure and molecular structure of Acoramidis are denoted by
and
, respectively. Furthermore, they are shown in
Figure 1.
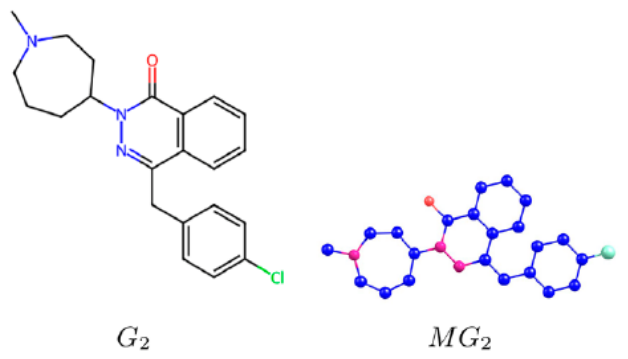
Azelastine is an advanced antihistamine used in sprays and eye drops to treat allergies. It works by blocking H1 receptors and stabilizing mast cells, which reduces the overall release of allergic mediators. Compared to older drugs, it acts faster, lasts longer, and causes significantly less drowsiness. Its dual-action approach makes it a robust treatment for various allergic conditions [
23,
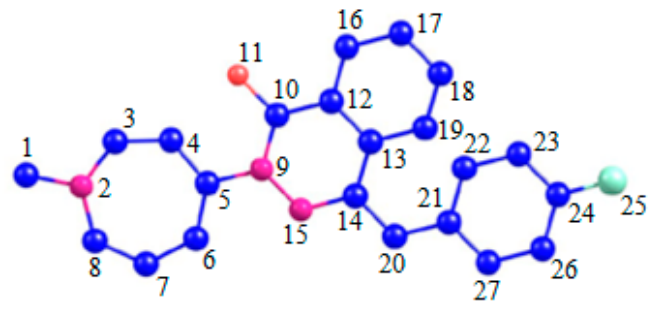
25]. The chemical structure and molecular structure of Azelastine are denoted by
and
, respectively. Furthermore, they are shown in
Figure 2.
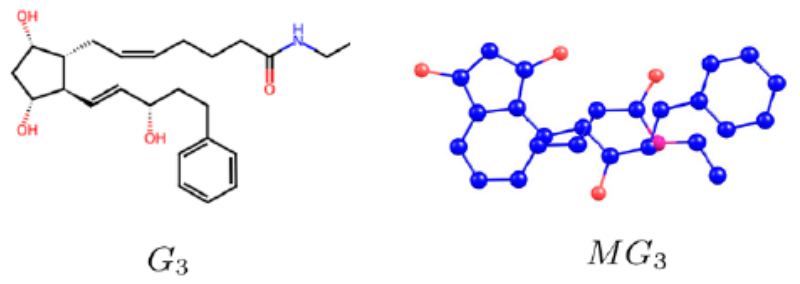
Bimatoprost is a synthetic compound that mimics the body’s natural prostaglandins and is used to lower eye pressure. It balances high pressure by accelerating the outflow of fluid from the eye, thereby assisting glaucoma patients. Furthermore, since its ability to stimulate eyelash growth was discovered, it is also widely preferred for cosmetic purposes [
23,
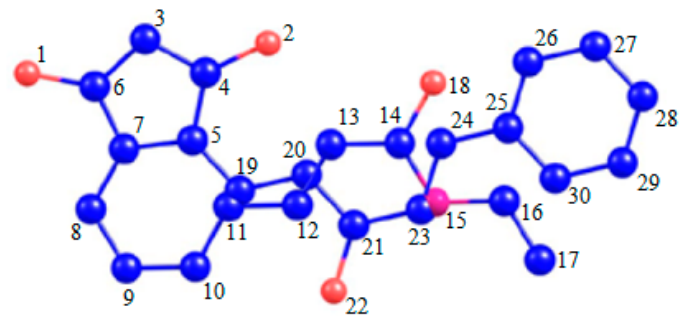
26]. The chemical structure and molecular structure of Bimatoprost are denoted by
and
, respectively. Furthermore, they are shown in
Figure 3.
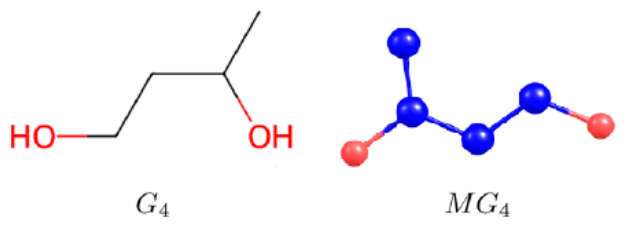
Butylene glycol is a type of organic alcohol used in cosmetic products to hydrate the skin. Thanks to its water-retention ability, it ensures that creams and serums make the skin softer. It helps products be absorbed more quickly by the skin and does not leave a greasy film on the face. It is generally a safe ingredient, although it can sometimes cause mild redness in very sensitive skin [
23,
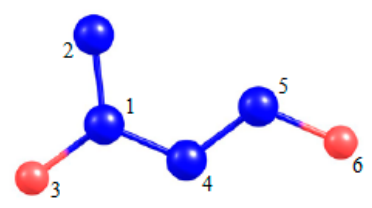
27]. The chemical structure and molecular structure of Butylene glycol are denoted by
and
, respectively. Furthermore, they are shown in
Figure 4.
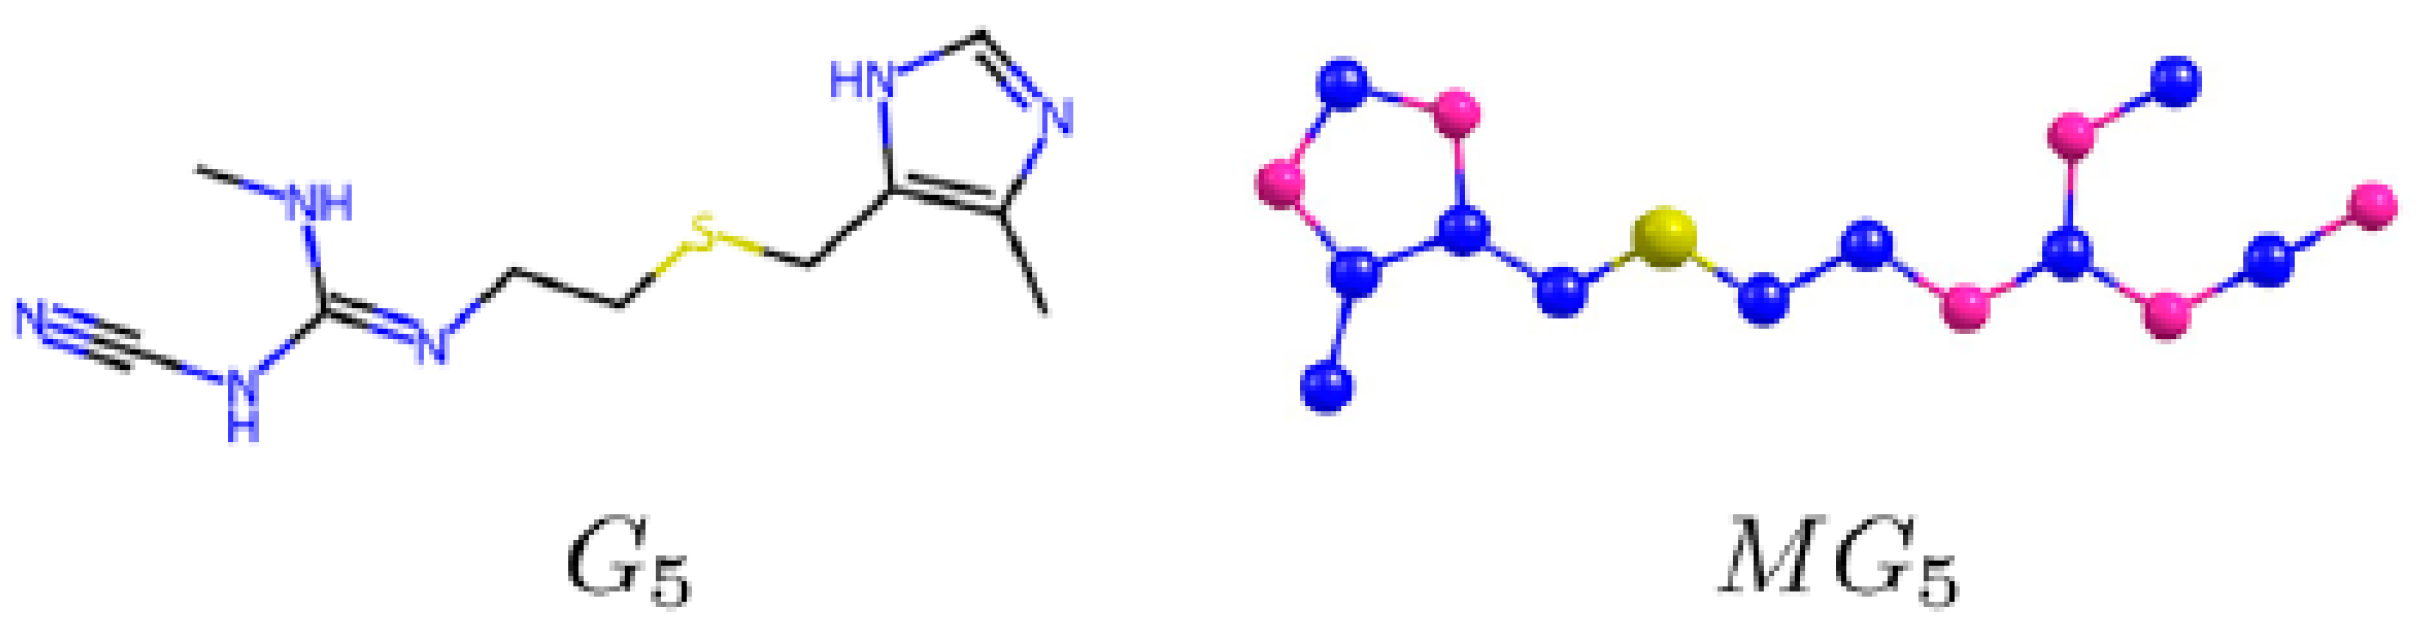
Cimetidine is a medication used to reduce stomach acid and treat conditions such as peptic ulcers and reflux. It stops excessive acid production by blocking specific receptors in the stomach. As one of the first drugs in its field, it created a major shift in the treatment of ulcer disease. Although it requires careful use due to its potential to interact with other medications, it remains an effective option preferred in certain cases despite modern alternatives [
23,
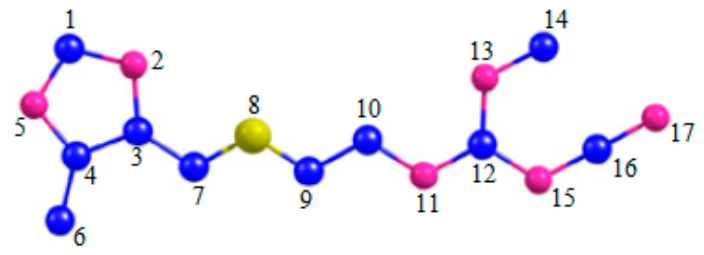
28]. The chemical structure and molecular structure of Cimetidine are denoted by
and
, respectively. Furthermore, they are shown in
Figure 5.
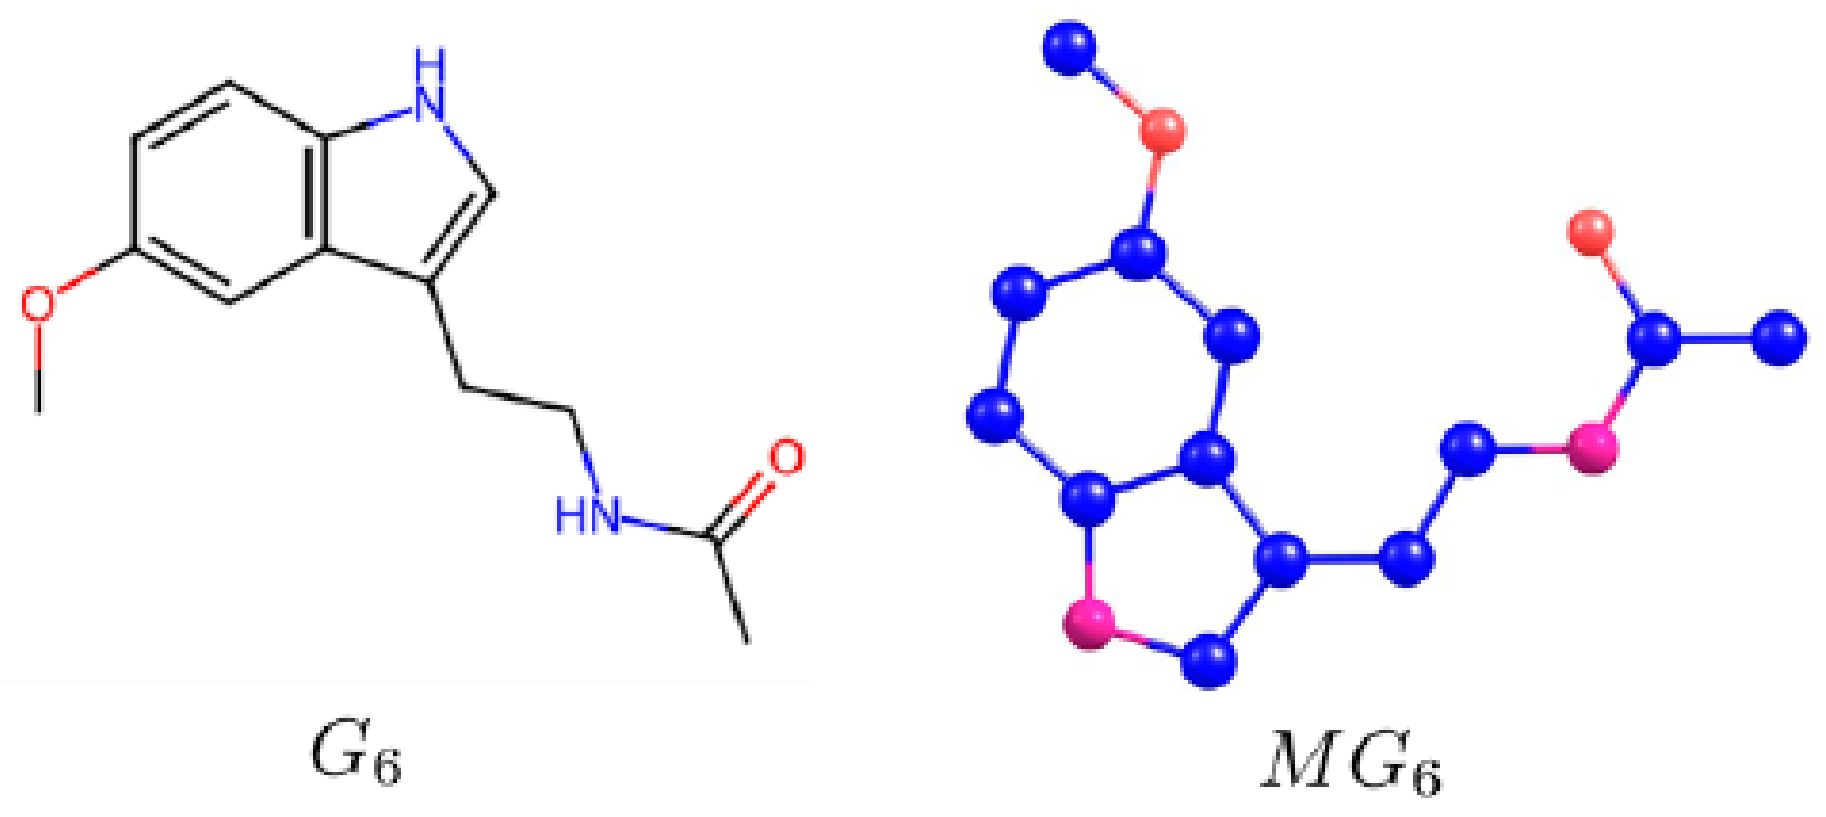
Melatonin is a naturally produced hormone that controls our body’s sleep patterns. By binding to receptors in the brain, it determines when we sleep and wake up, and it is taken as a supplement especially for conditions such as jet lag or insomnia. Thanks to its structure, this hormone reaches the brain quickly and is beneficial not only for sleep but also for supporting the immune system and protecting the body. It is generally a well-tolerated supplement that is used safely [
23,
29]. The chemical structure and molecular structure of Melatonin are denoted by
and
, respectively. Furthermore, they are shown in
Figure 6.
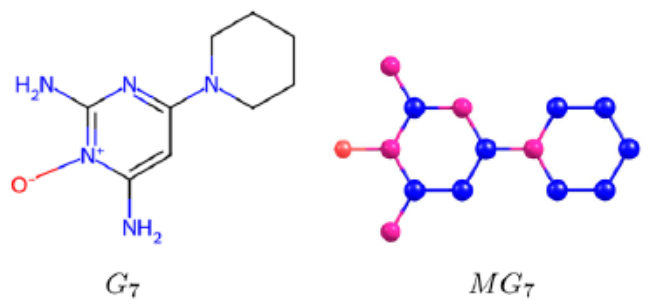
Originally designed as a blood pressure medication, Minoxidil is an effective topical treatment that prevents hair loss by stimulating hair follicles through its vasodilating effect. Applied once daily as a solution or foam, it supports hair growth by increasing microcirculation in the scalp [
23,
30]. The chemical structure and molecular structure of Minoxidil are denoted by
and
, respectively. Furthermore, they are shown in
Figure 7.
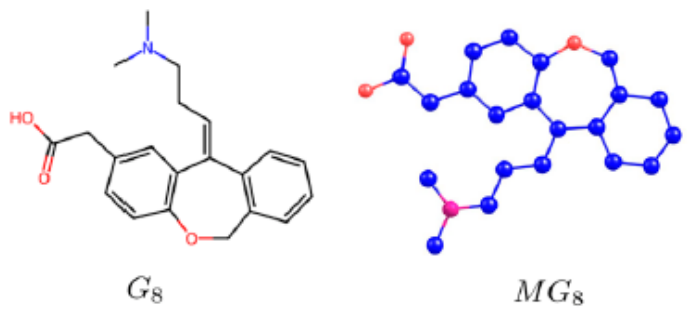
Olopatadine is a dual-action medication used for allergic rhinitis and eye allergies. It both stops the release of allergy-causing substances and rapidly soothes existing itching and redness. Generally used daily as eye drops or nasal sprays, this drug is well-tolerated by the body even with long-term use; it both improves symptoms and prevents new allergic reactions from occurring [
23,
30]. The chemical structure and molecular structure of Olopatadine are denoted by
and
, respectively. Furthermore, they are shown in
Figure 8.
Propylene glycol is a versatile ingredient used in food and beauty products to hold moisture and act as a solvent. Its small molecular size allows it to sink into the skin quickly, helping other ingredients work more effectively. It also makes lotions and creams feel smoother and easier to apply. Although generally considered safe, it can occasionally cause minor irritation for people with highly sensitive skin [
23,
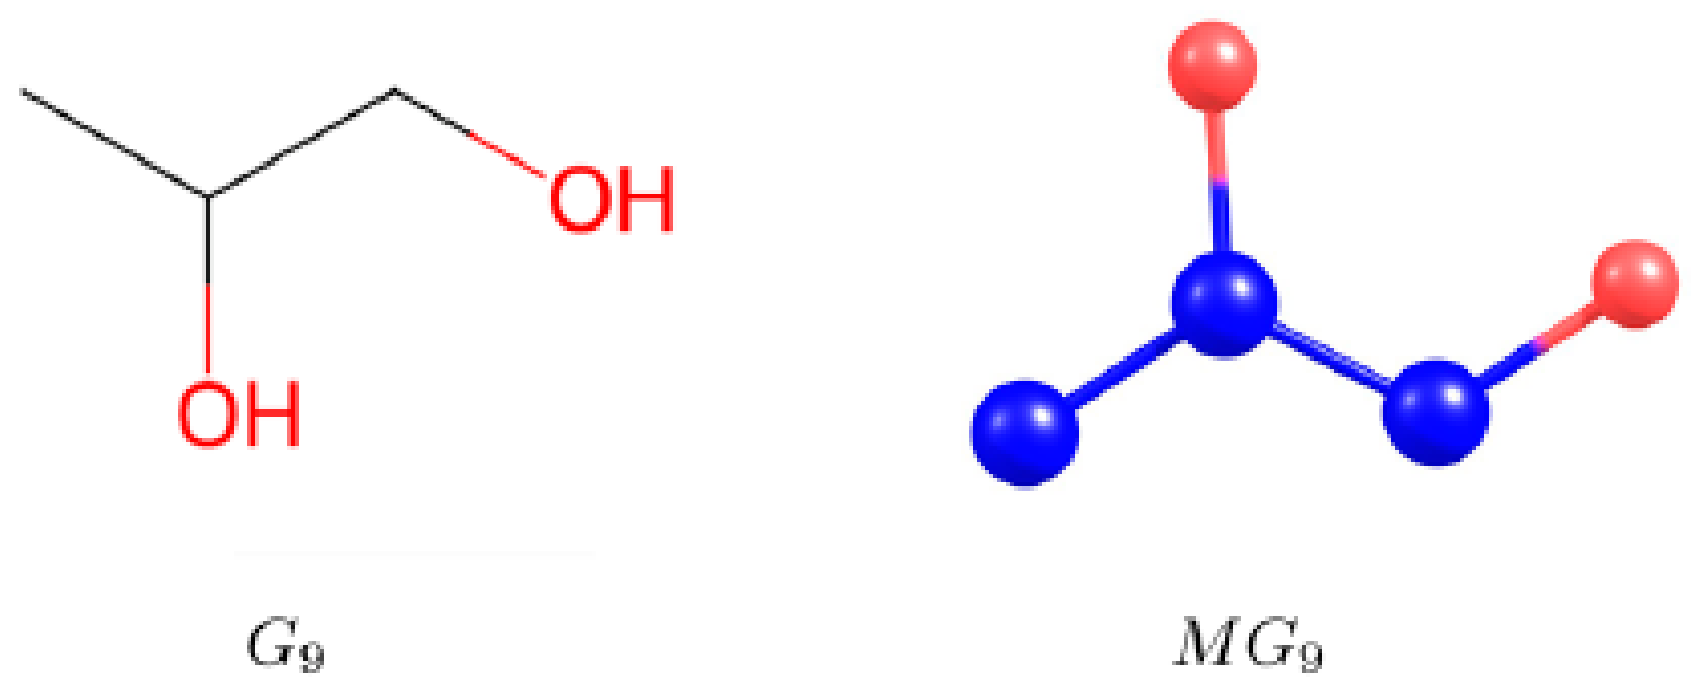
31]. The chemical structure and molecular structure of Propylene glycol are denoted by
and
, respectively. Furthermore, they are shown in
Figure 9.
Trazodone is a medication used to treat depression and anxiety disorders by regulating the serotonin balance in the brain. Because it affects both serotonin and histamine receptors in the body, it has a strong sedative property. For this reason, although its primary purpose is treating depression, it is frequently prescribed by doctors to help patients with insomnia [
23,
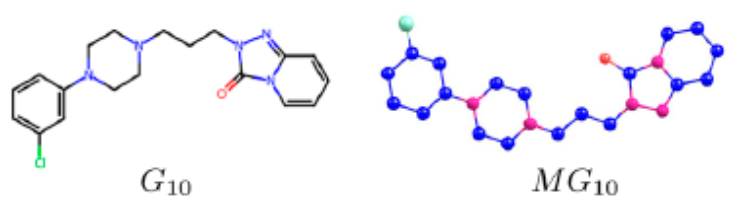
32]. The chemical structure and molecular structure of Trazodone are denoted by
and
, respectively. Furthermore, they are shown in
Figure 10.
In
Table 1, some physicochemical properties of the investigated drug molecules, such as their boiling point (BP), enthalpy of vaporization (EV), flash point (FP), molar refractivity (MR), polarizability (P), and molar volume (MV), are listed. These values can be verified in the ChemSpider database using the corresponding ChemSpider IDs provided in
Table 2. Additionally,
Table 2 presents the official CAS registry numbers, PubChem CIDs, and ChemSpider IDs for all ten compounds. These identifiers ensure the unambiguous characterization of the molecular structures under study and serve as standard reference inputs for computational software.
Inspired by previous studies [
19,
20,
21,
22], this work constructs regression models to predict the physicochemical properties of 10 different drug molecules using the fundamental graph parameters: independence number, covering number and domination number. In
Section 2 of this study, the independence number, covering number, and domination number values of the graphs of the 10 different drug molecules are determined. In
Section 3, regression models are constructed using the results obtained in
Section 2 and the actual results of the physicochemical properties of these molecules. Finally, our results are presented in
Section 4.
2. Computing Independence, Covering and Domination Numbers of Selected 10 Drug Structures
In this section, firstly, we provide the definitions of the independence number , covering number and domination number of any given graph and a theorem about and . Then, we compute the values of these parameters for the molecular graphs of the 10 different drug molecules.
Definition 1 ([
9])
. An independent set of vertices of a graph is a set of vertices of the graph whose elements are pairwise nonadjacent. The independence number of the graph is the maximum cardinality among all independent sets of vertices of the graph . Definition 2 ([
9])
. A covering set is a subset of vertices in a graph such that every edge in the graph is incident to at least one vertex in the set. The covering number is the cardinality of the smallest possible covering sets in that graph . Definition 3 ([
9,
33])
. A dominating set for a graph is defined as a vertex subset where every vertex in is adjacent to at least one vertex in . The smallest possible size of such a set is termed the domination number, and it is denoted by . Theorem 1 ([
9])
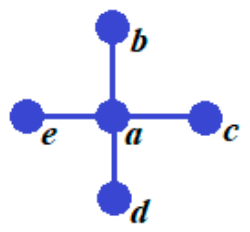
. If is a graph of order n having no isolated vertices, then . Example 1. Compute the independence number, covering number and domination number of the star graph
, which is shown in Figure 11. The independent set with maximum cardinality of is , so we obtain . Furthermore, the covering set with minimum cardinality of is ; thus, we have . It can be easily seen that this satisfies Theorem 1 with these two results. As with the covering set of , the dominating set with minimum cardinality of is ; then, is obtained.
Example 2. Compute the independence number, covering number and domination number of the path graph
, which is shown in Figure 12. The independent set with maximum cardinality of is , so we obtain . Furthermore, the covering set with minimum cardinality of is ; thus, we have . It can be easily seen that this satisfies Theorem 1 with these two results, that is, . Then, the dominating set with minimum cardinality of the path graph is ; thus, is obtained.
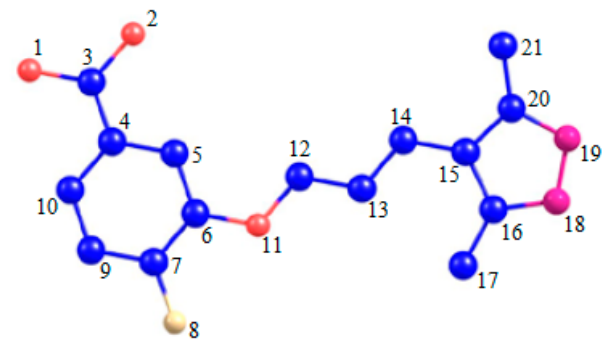
Theorem 2. Let
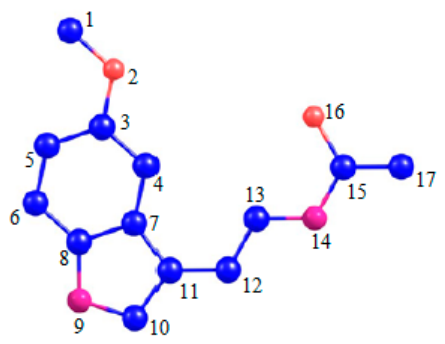
be a molecular graph of Acoramidis of order 21. Then, , and .
Proof. The molecular graph
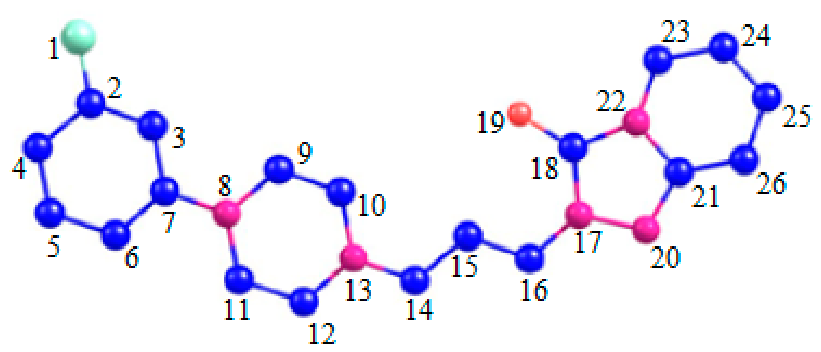
is shown with labeled vertices in
Figure 13.
One of the independent sets with maximum cardinality of is , so we obtain . Furthermore, we have by Theorem 1. One of the dominating sets with minimum cardinality of is ; thus, is obtained. □
Theorem 3. Let
be a molecular graph of Azelastine of order 27. Then, , and .
Proof. The molecular graph
is shown with labeled vertices in
Figure 14.
One of the independent sets with maximum cardinality of is , so we obtain . Furthermore, we have by Theorem 1. One of the dominating sets with minimum cardinality of is ; thus, is obtained. □
Theorem 4. Let
be a molecular graph of Bimatoprost of order 30. Then, , and .
Proof. The molecular graph
is shown with labeled vertices in
Figure 15.
One of the independent sets with maximum cardinality of is , so we obtain . Furthermore, we have by Theorem 1. One of the dominating sets with minimum cardinality of is ; thus, is obtained. □
Theorem 5. Let
be a molecular graph of Butylene glycol of order 6. Then, , and .
Proof. The molecular graph
is shown with labeled vertices in
Figure 16.
The independent set with maximum cardinality of is , so we obtain . Furthermore, we have by Theorem 1. The dominating set with minimum cardinality of is or ; thus, is obtained. □
Theorem 6. Let
be a molecular graph of Cimetidine of order 17. Then, , and .
Proof. The molecular graph
is shown with labeled vertices in
Figure 17.
One of the independent sets with maximum cardinality of is , so we obtain . Furthermore, we have by Theorem 1. One of the dominating sets with minimum cardinality of is ; thus, is obtained. □
Theorem 7. Let
be a molecular graph of Melatonin of order 17. Then, , and .
Proof. The molecular graph
is shown with labeled vertices in
Figure 18.
One of the independent sets with maximum cardinality of is , so we obtain . Furthermore, we have by Theorem 1. One of the dominating sets with minimum cardinality of is ; thus, is obtained. □
Theorem 8. Let
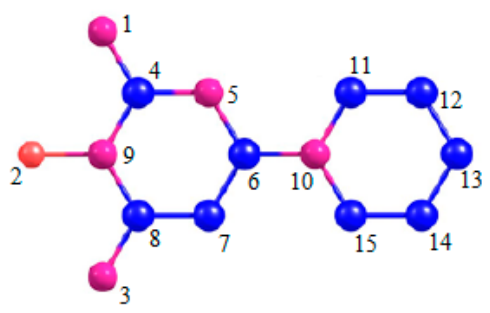
be a molecular graph of Minoxidil of order 15. Then, , and .
Proof. The molecular graph
is shown with labeled vertices in
Figure 19.
One of the independent sets with maximum cardinality of is , so we obtain . Furthermore, we have by Theorem 1. One of the dominating sets with minimum cardinality of is ; thus, is obtained. □
Theorem 9. Let
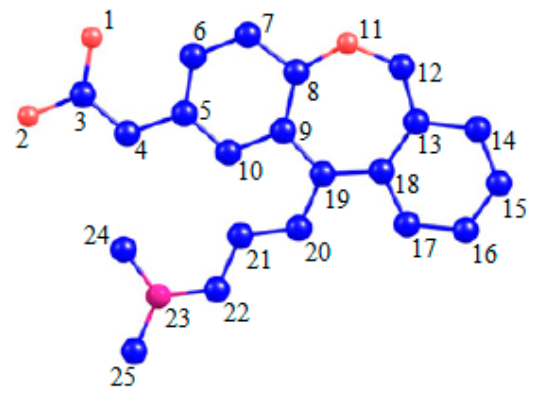
be a molecular graph of Olopatadine of order 25. Then, , and .
Proof. The molecular graph
is shown with labeled vertices in
Figure 20.
One of the independent sets with maximum cardinality of is , so we obtain . Furthermore, we have by Theorem 1. One of the dominating sets with minimum cardinality of is ; thus, is obtained. □
Theorem 10. Let
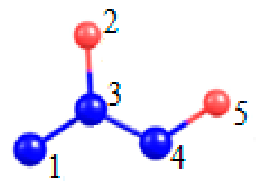
be a molecular graph of Propylene glycol of order 5. Then, , and .
Proof. The molecular graph
is shown with labeled vertices in
Figure 21.
The independent set with maximum cardinality of is or , so we obtain . Furthermore, we have by Theorem 1. The dominating set with minimum cardinality of is or ; thus, is obtained. □
Theorem 11. Let
be a molecular graph of Trazodone of order 26. Then, , and .
Proof. The molecular graph
is shown with labeled vertices in
Figure 22.
One of the independent sets with maximum cardinality of is , so we obtain . Furthermore, we have by Theorem 1. One of the dominating sets with minimum cardinality of is ; thus, is obtained. □
All values between Theorem 2 and Theorem 11 were verified using a computer program. Specifically, the independence numbers of 10 different molecular graphs were determined using the Paull–Unger algorithm. This algorithm identifies all maximal independent sets within a graph
and subsequently computes its independence number [
34,
35]. The vertex covering numbers of these molecular graphs were derived via Theorem 1. Furthermore, the domination numbers were obtained using a brute-force technique, which involves an exhaustive search of all subsets of the vertex set. Since the maximum number of vertices in these 10 molecular graphs is 30, the results were obtained within a short computational timeframe. The independence, covering and domination numbers for the 10 molecular graphs are summarized in
Table 3.
3. QSPR Analysis of Selected Drug Structures Using Graph-Based Regression Models
The primary objective of this section is to enhance the quantitative structure–property relationship (QSPR) between the physicochemical characteristics of some specific drugs (namely, Acoramidis, Azelastine, Bimatoprost, Butylene glycol, Cimetidine, Melatonin, Minoxidil, Olopatadine, Propylene glycol and Trazodone) and the independence, covering, and domination numbers of their respective molecular graphs. Furthermore, this segment evaluates the analytical efficacy and predictive robustness of these graph theoretic parameters in characterizing the molecular behavior of the investigated compounds. Three graph-theoretic parameters derived from the molecular graphs of ten distinct drug molecules are employed to predict six key physicochemical properties, namely, boiling point (BP), enthalpy of vaporization (EV), flash point (FP), molar refractivity (MR), polarizability (P), and molar volume (MV). The physicochemical properties of these drugs are presented in
Table 1. Furthermore, the values of independence, covering and domination numbers of 10 molecular graphs are presented in
Table 3.
Linear, quadratic, and cubic regression models are then developed to relate the physicochemical characteristics of these drugs to the theoretical graph parameters of their molecular graphs. The following equations are utilized in the regression analysis:
Here, the response variable denotes a physicochemical property, the explanatory variable denotes a graph-theoretic parameter, and the remaining constants are regression coefficients. Furthermore, we evaluate six statistical measures, including the correlation coefficient , adjusted (), p-value, Root Mean Square Error (RMSE), Mean Absolute Error (MAE) and Fisher’s statistic , to ensure a comprehensive analysis of the models.
MATLAB R2025b software was used to create linear, quadratic, and cubic regression models between the independence covering and domination, numbers of the molecular graphs of the investigated drugs (given in
Table 3) and their physicochemical properties (listed in
Table 1). The values of correlation coefficients obtained by linear, quadratic and cubic regression models between the graph theoretical parameters and the characteristics of the investigated drugs and bioactive molecules are displayed in
Table 4,
Table 5 and
Table 6, respectively. Furthermore, in these tables, the highest correlation coefficient (R) for each physicochemical property is indicated in bold.
Table 7,
Table 8 and
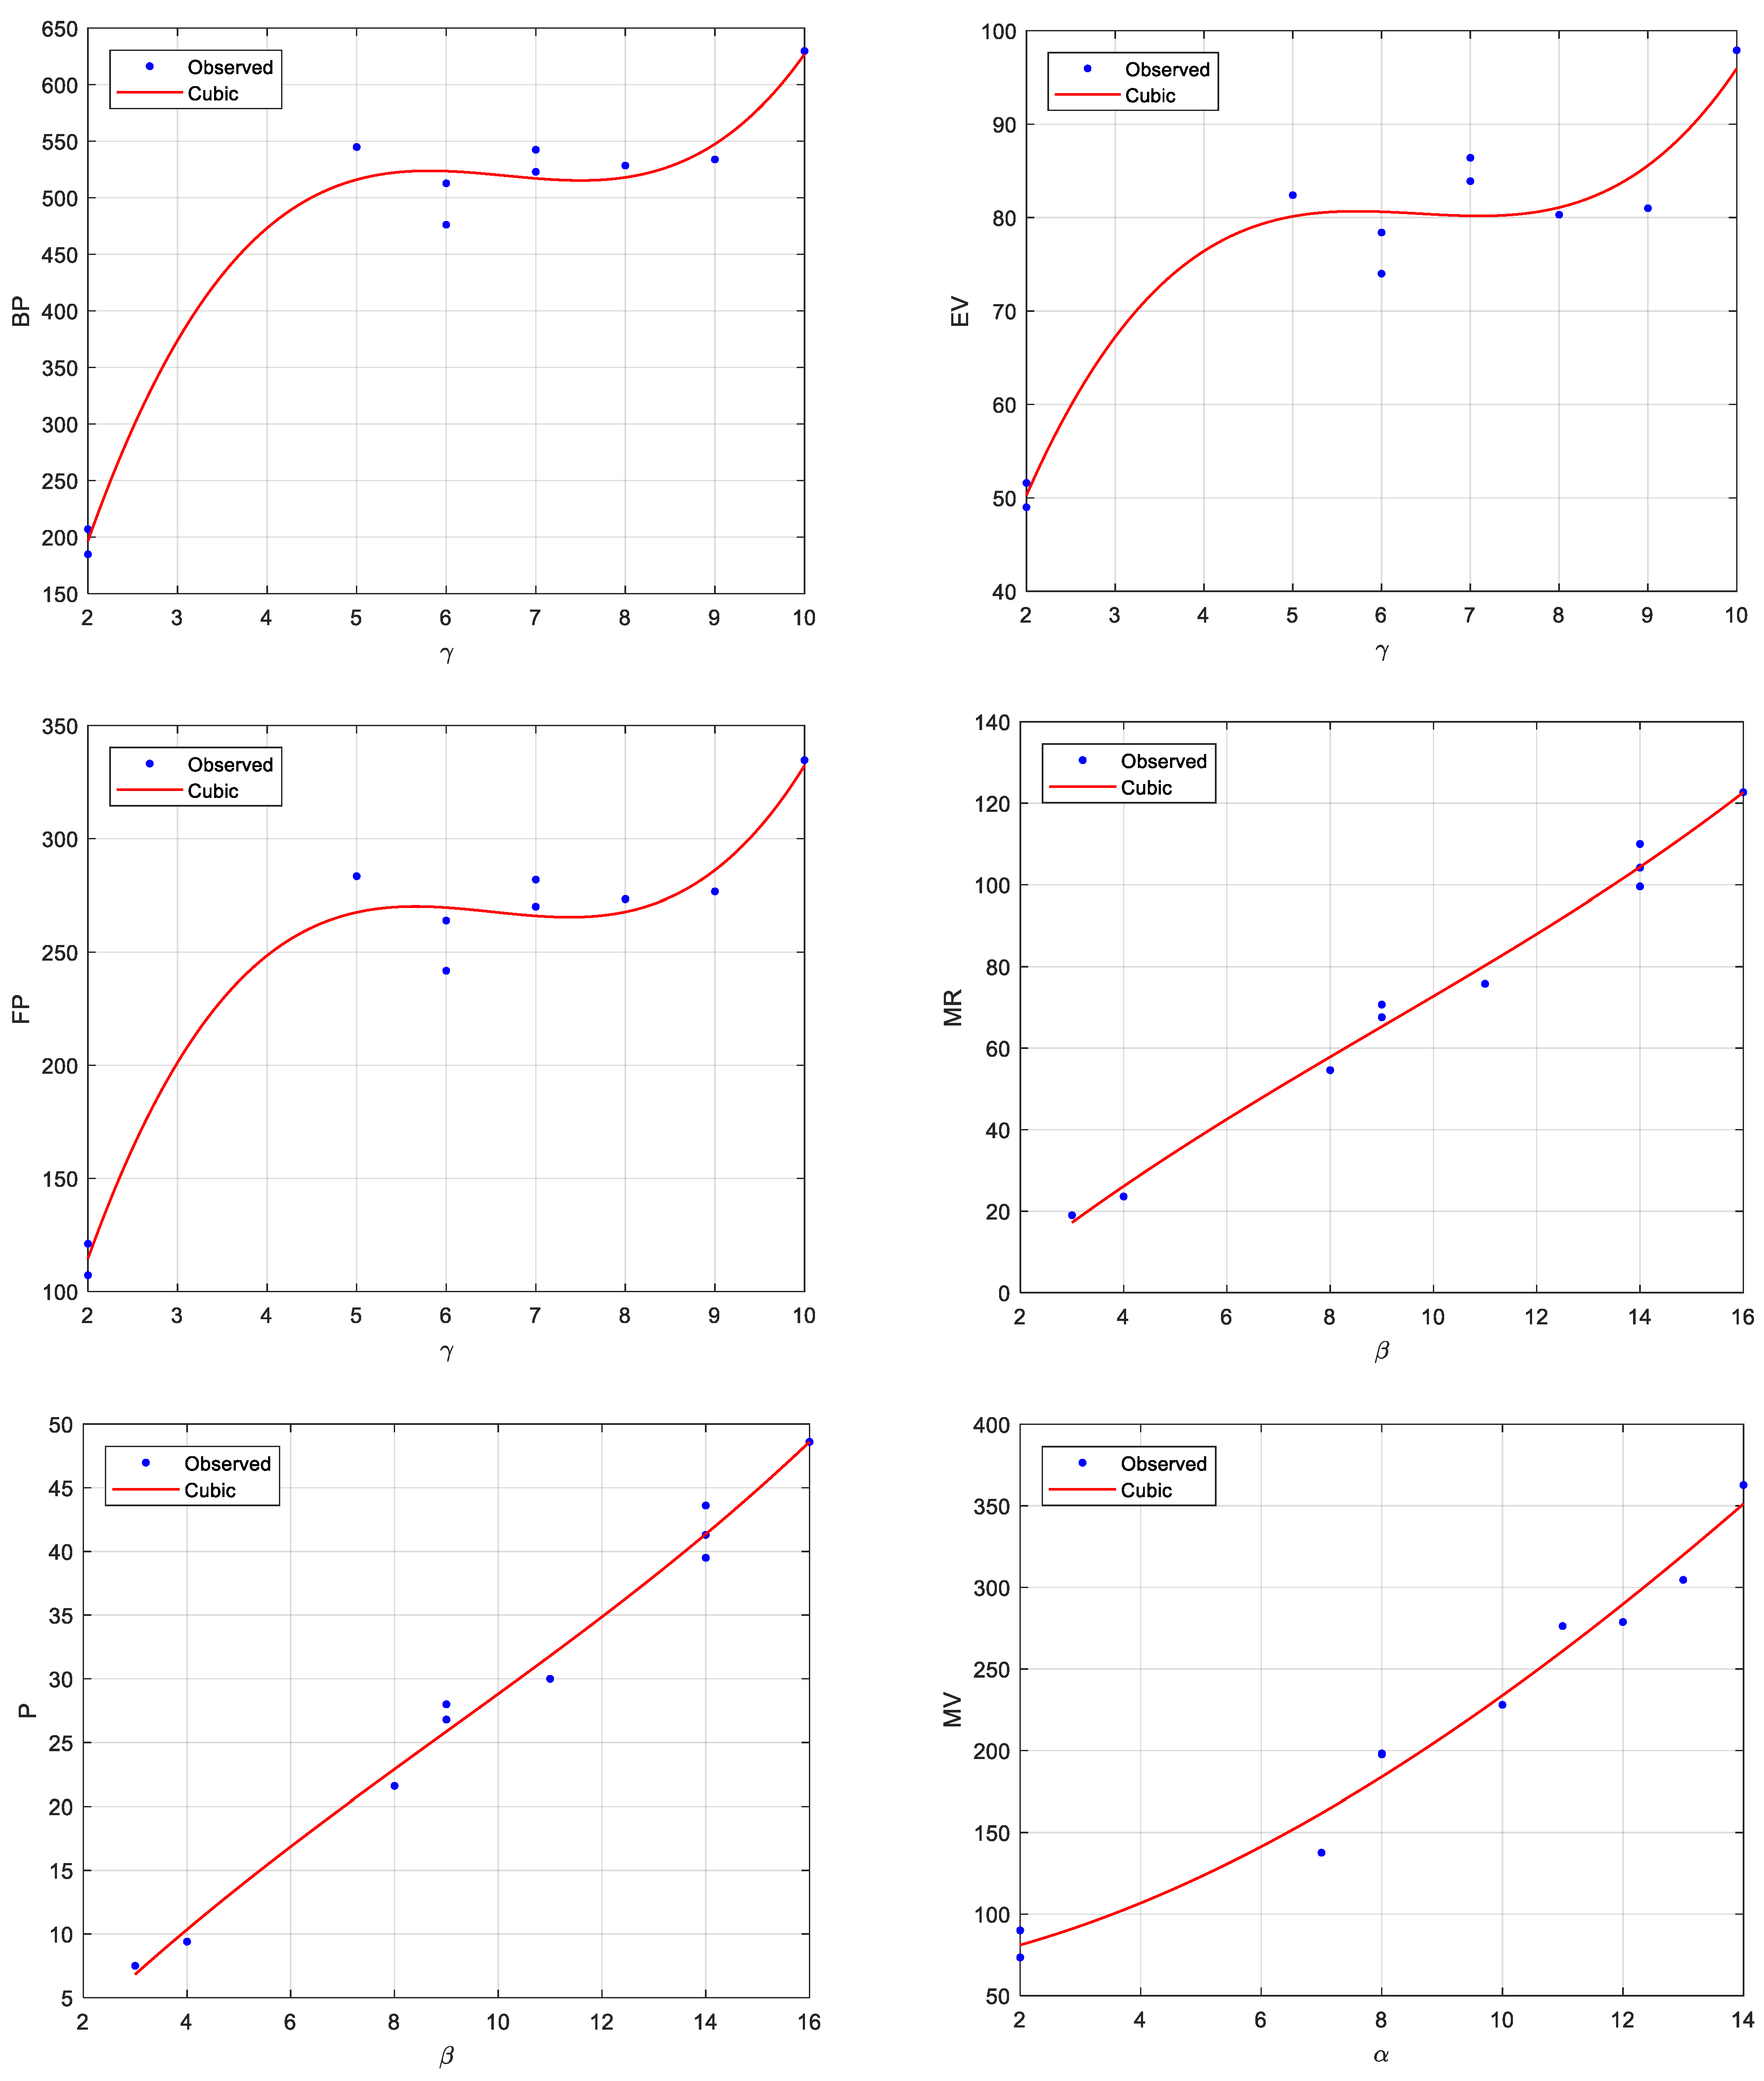
Table 9 present the linear, quadratic and cubic regression models for each physicochemical property with the used graph parameters yielding the highest correlation coefficient (R), along with the
,
, RMSE, MAE, Fisher’s statistic
F and
p-value. Furthermore,
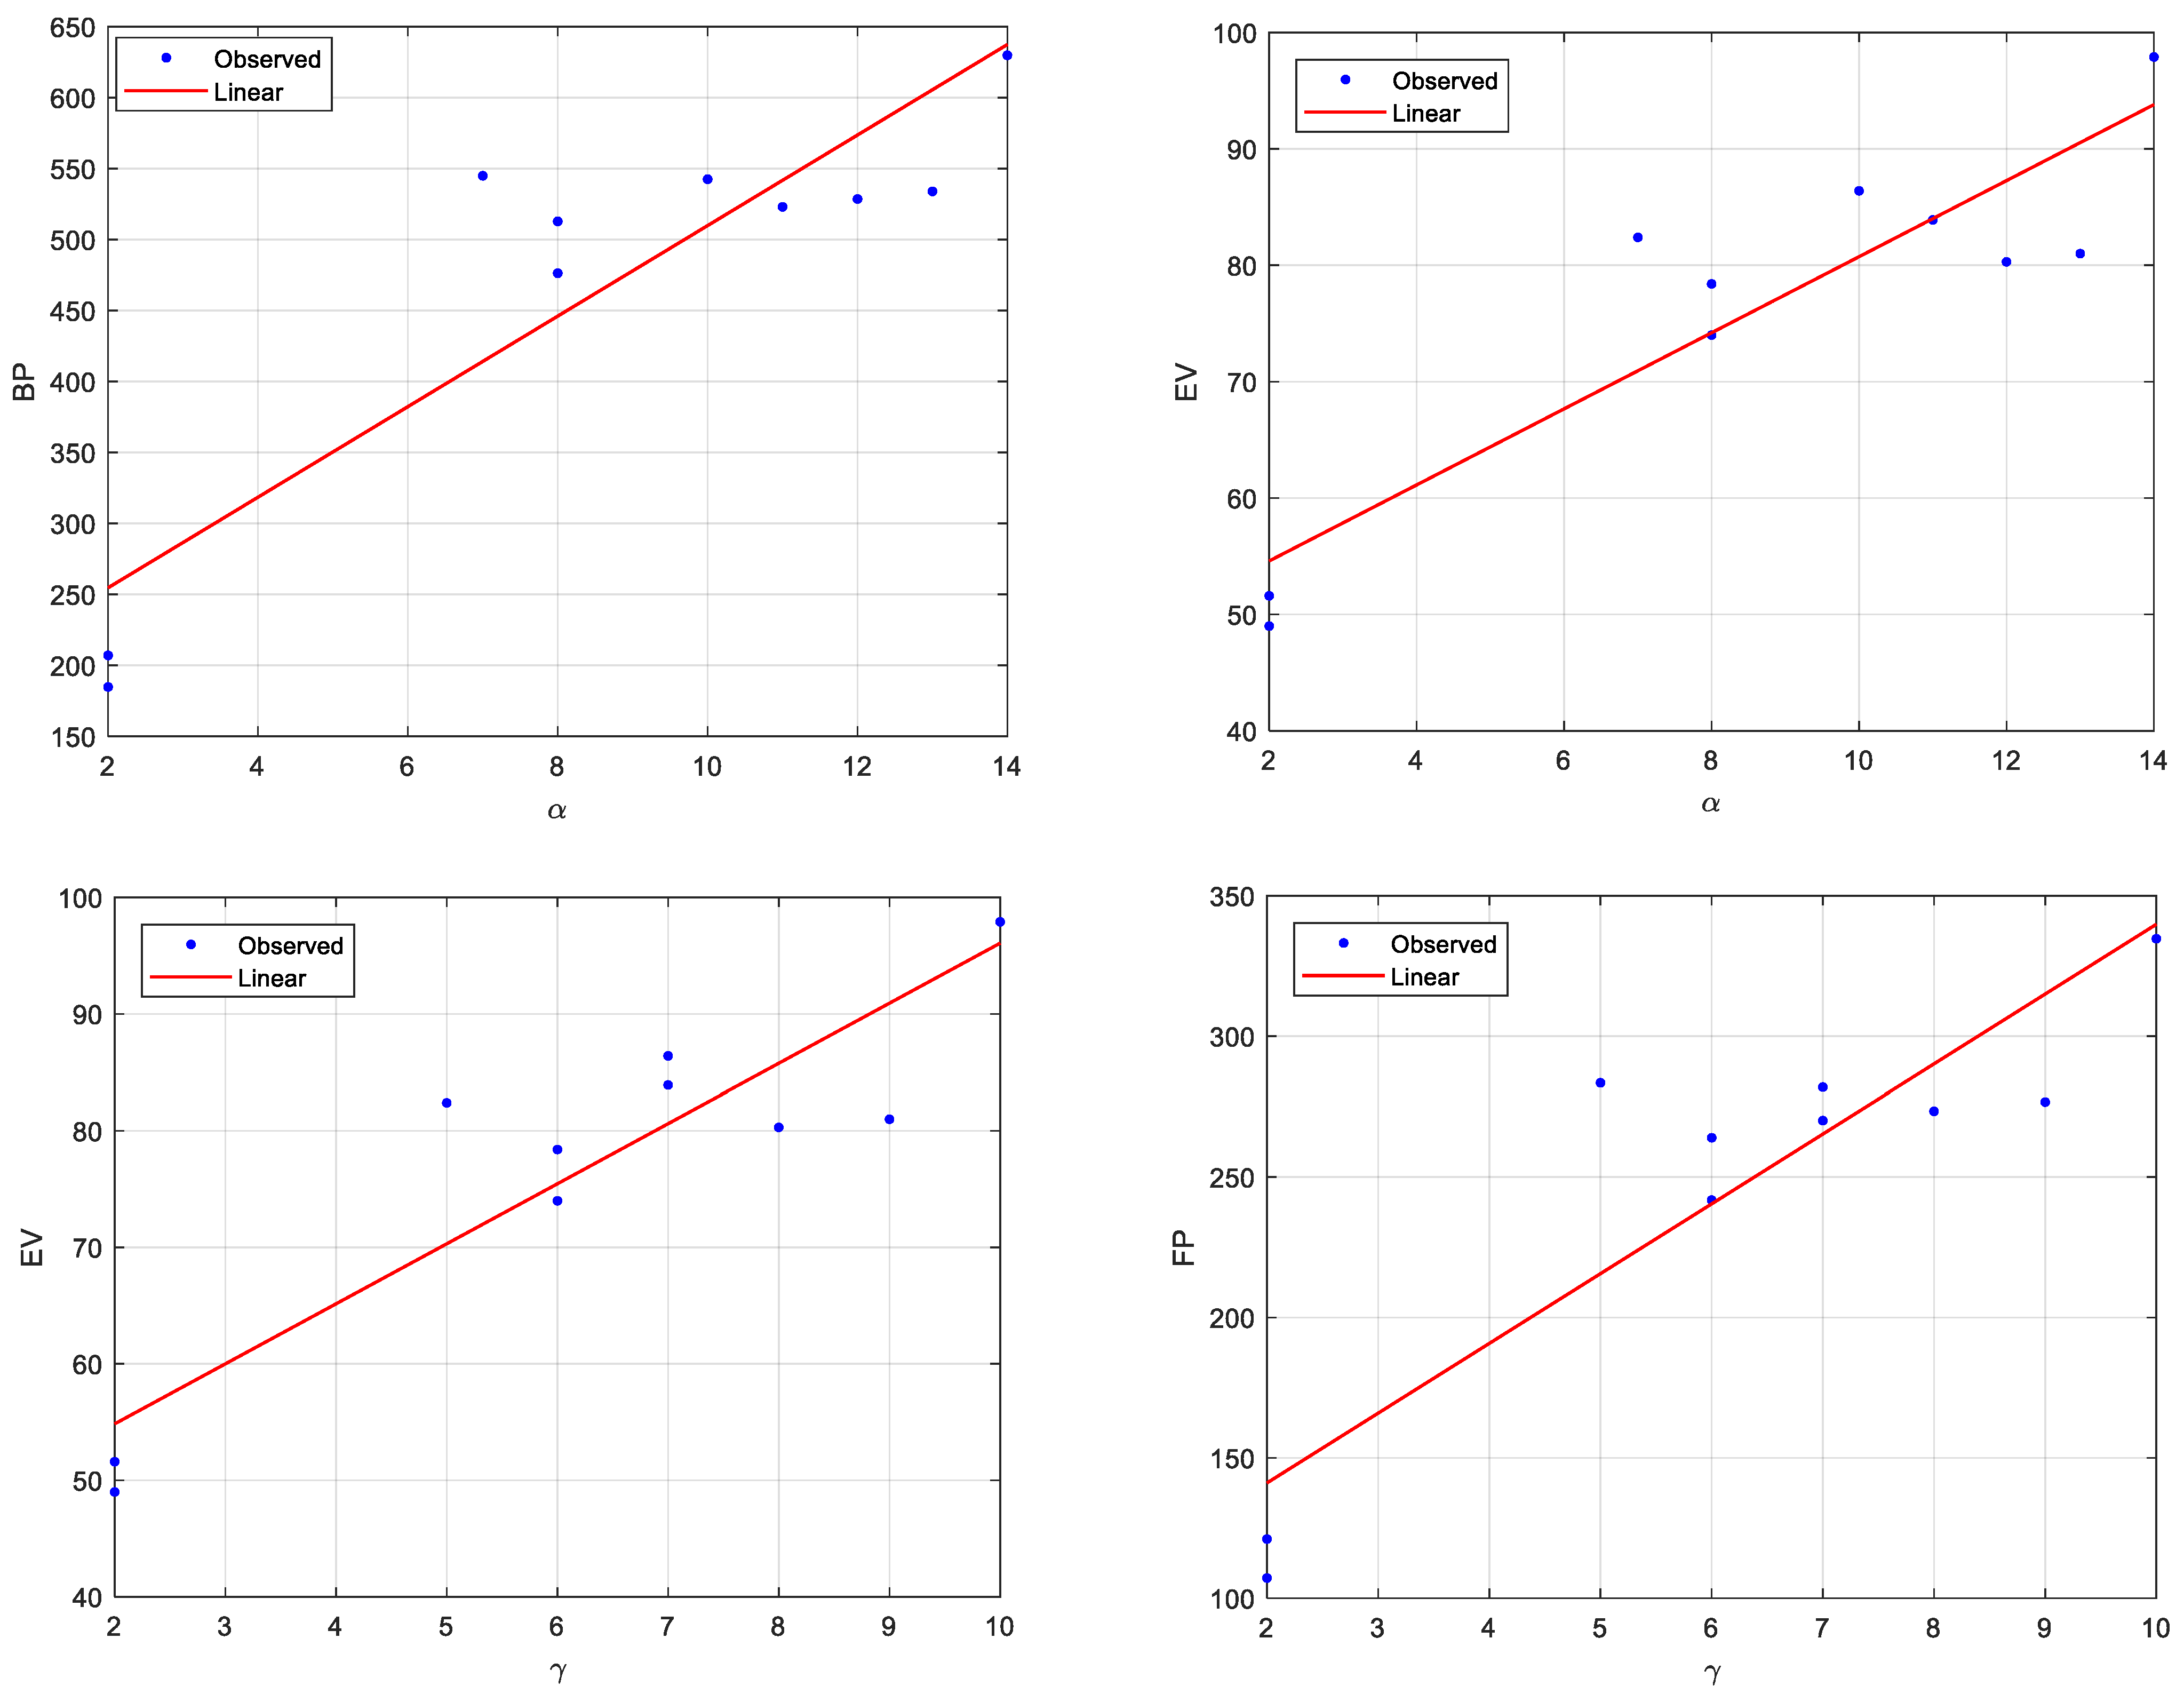
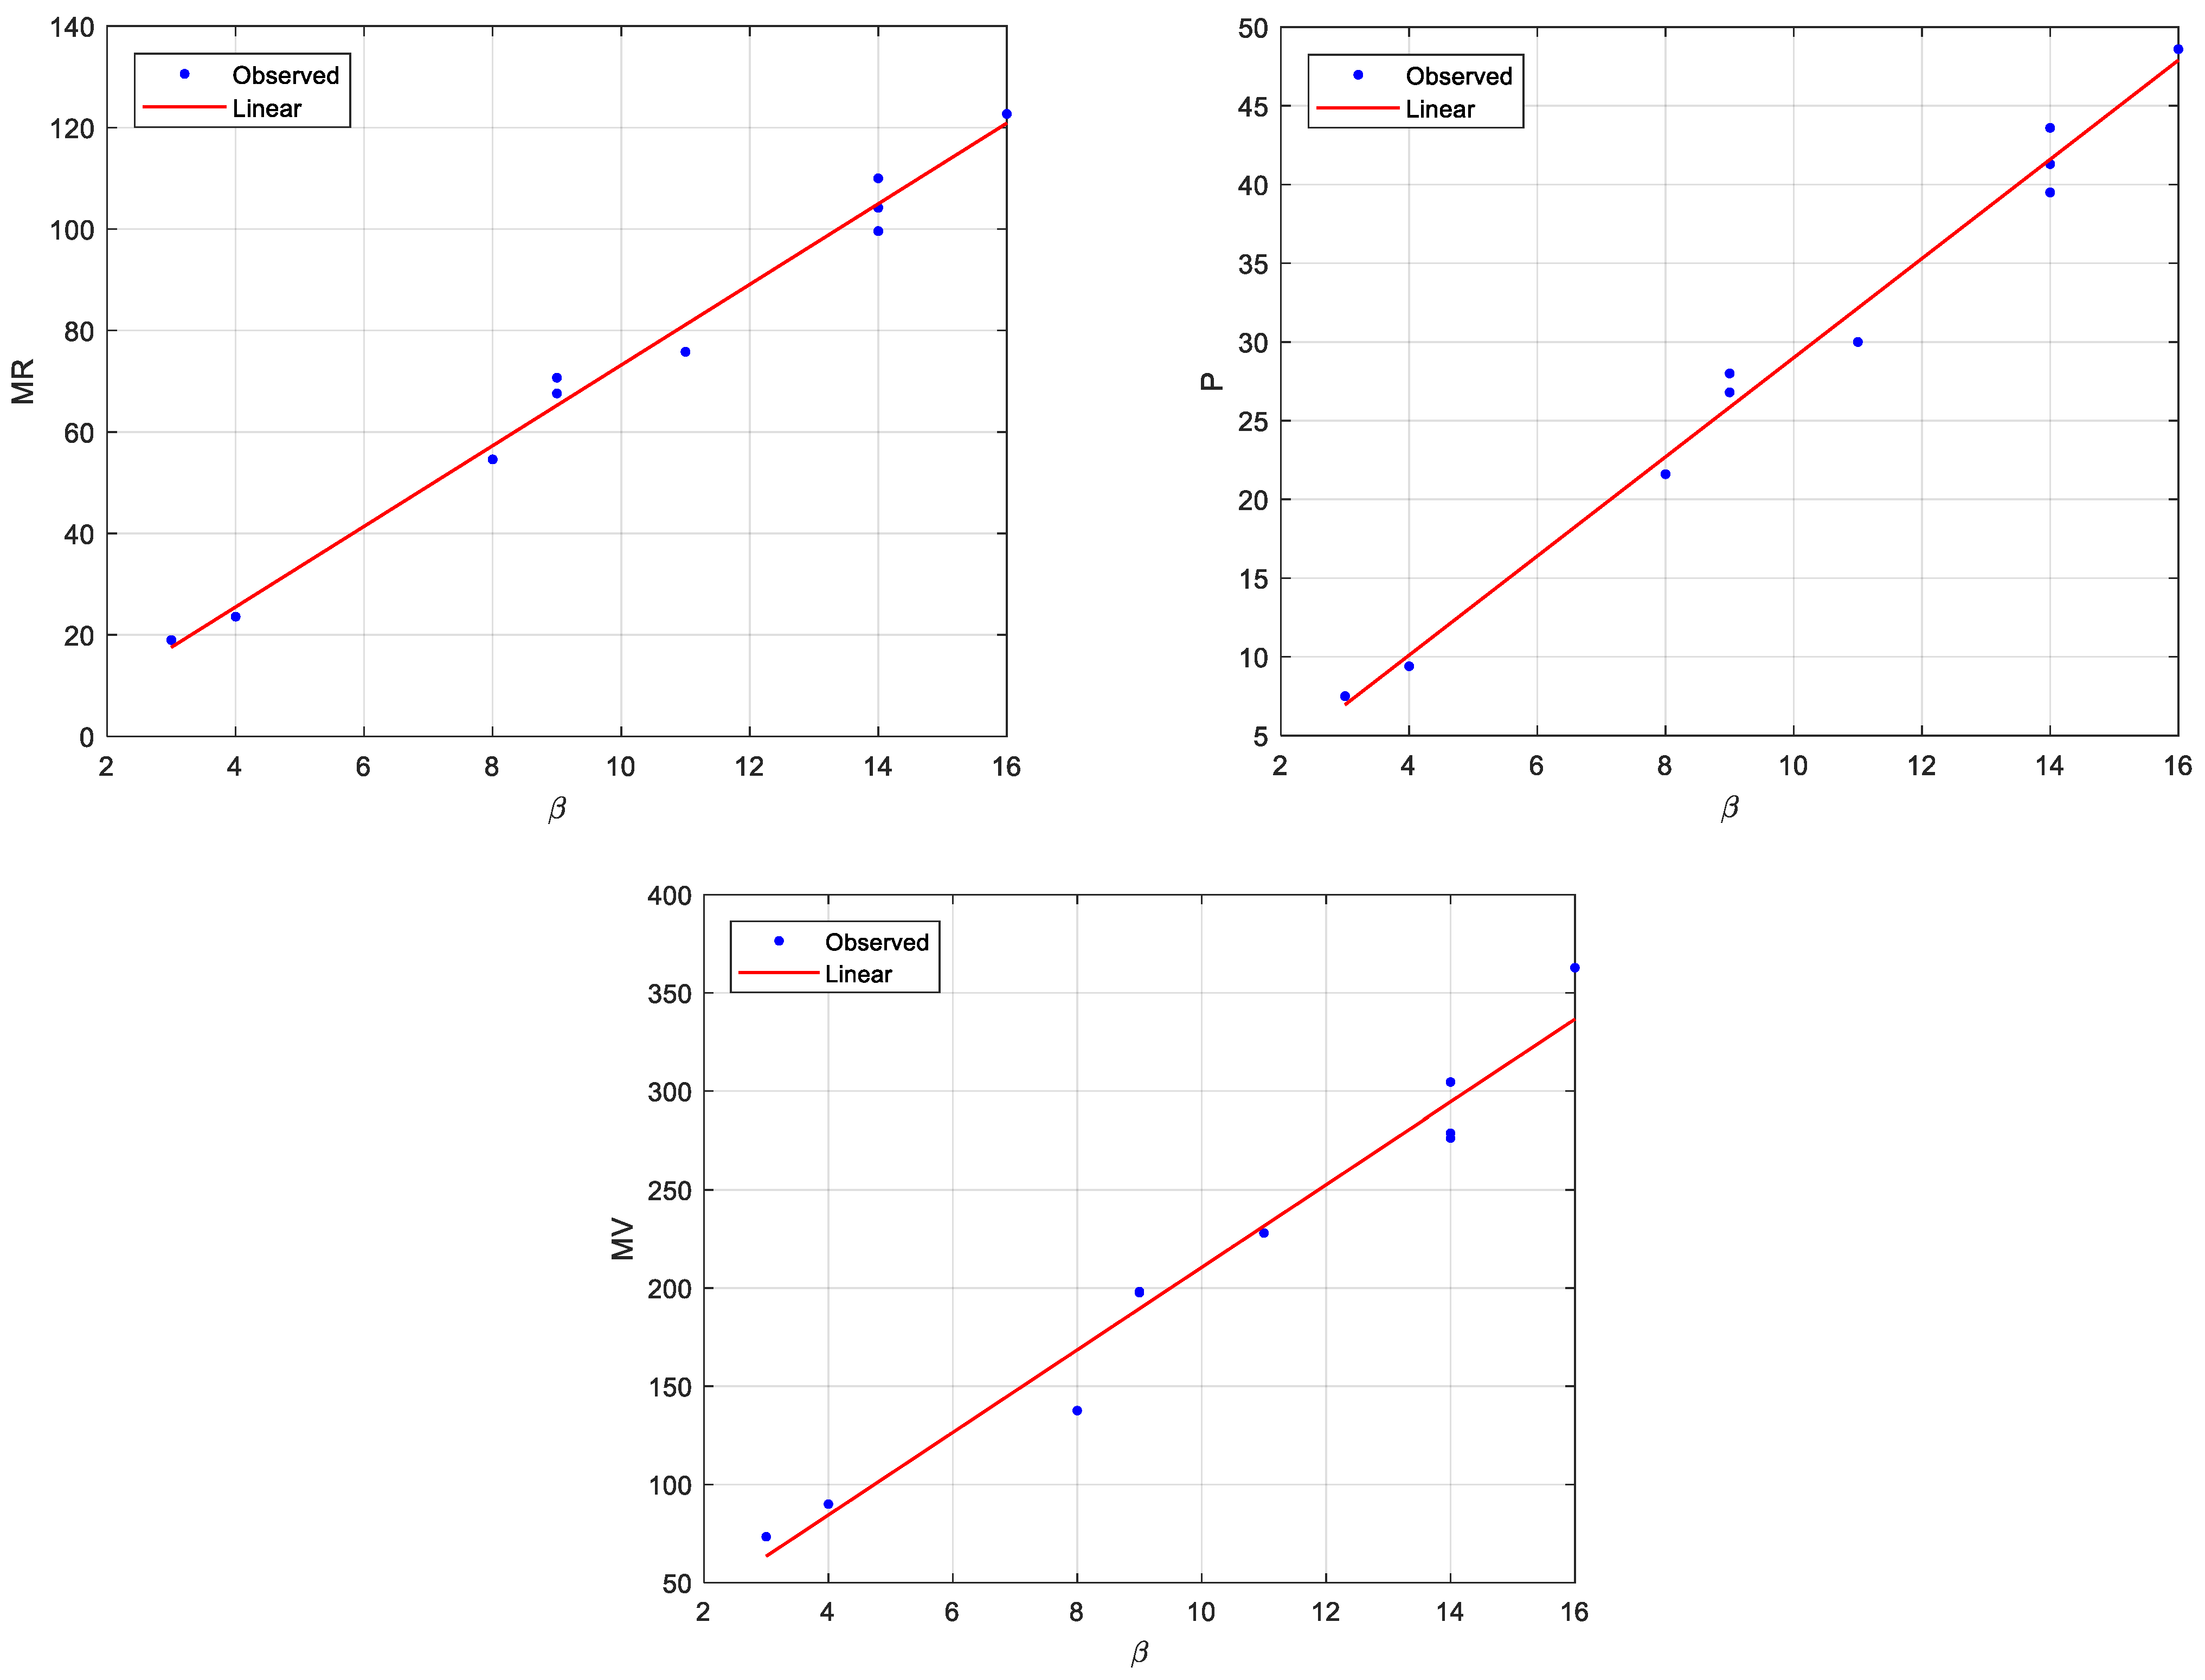
Figure 23,
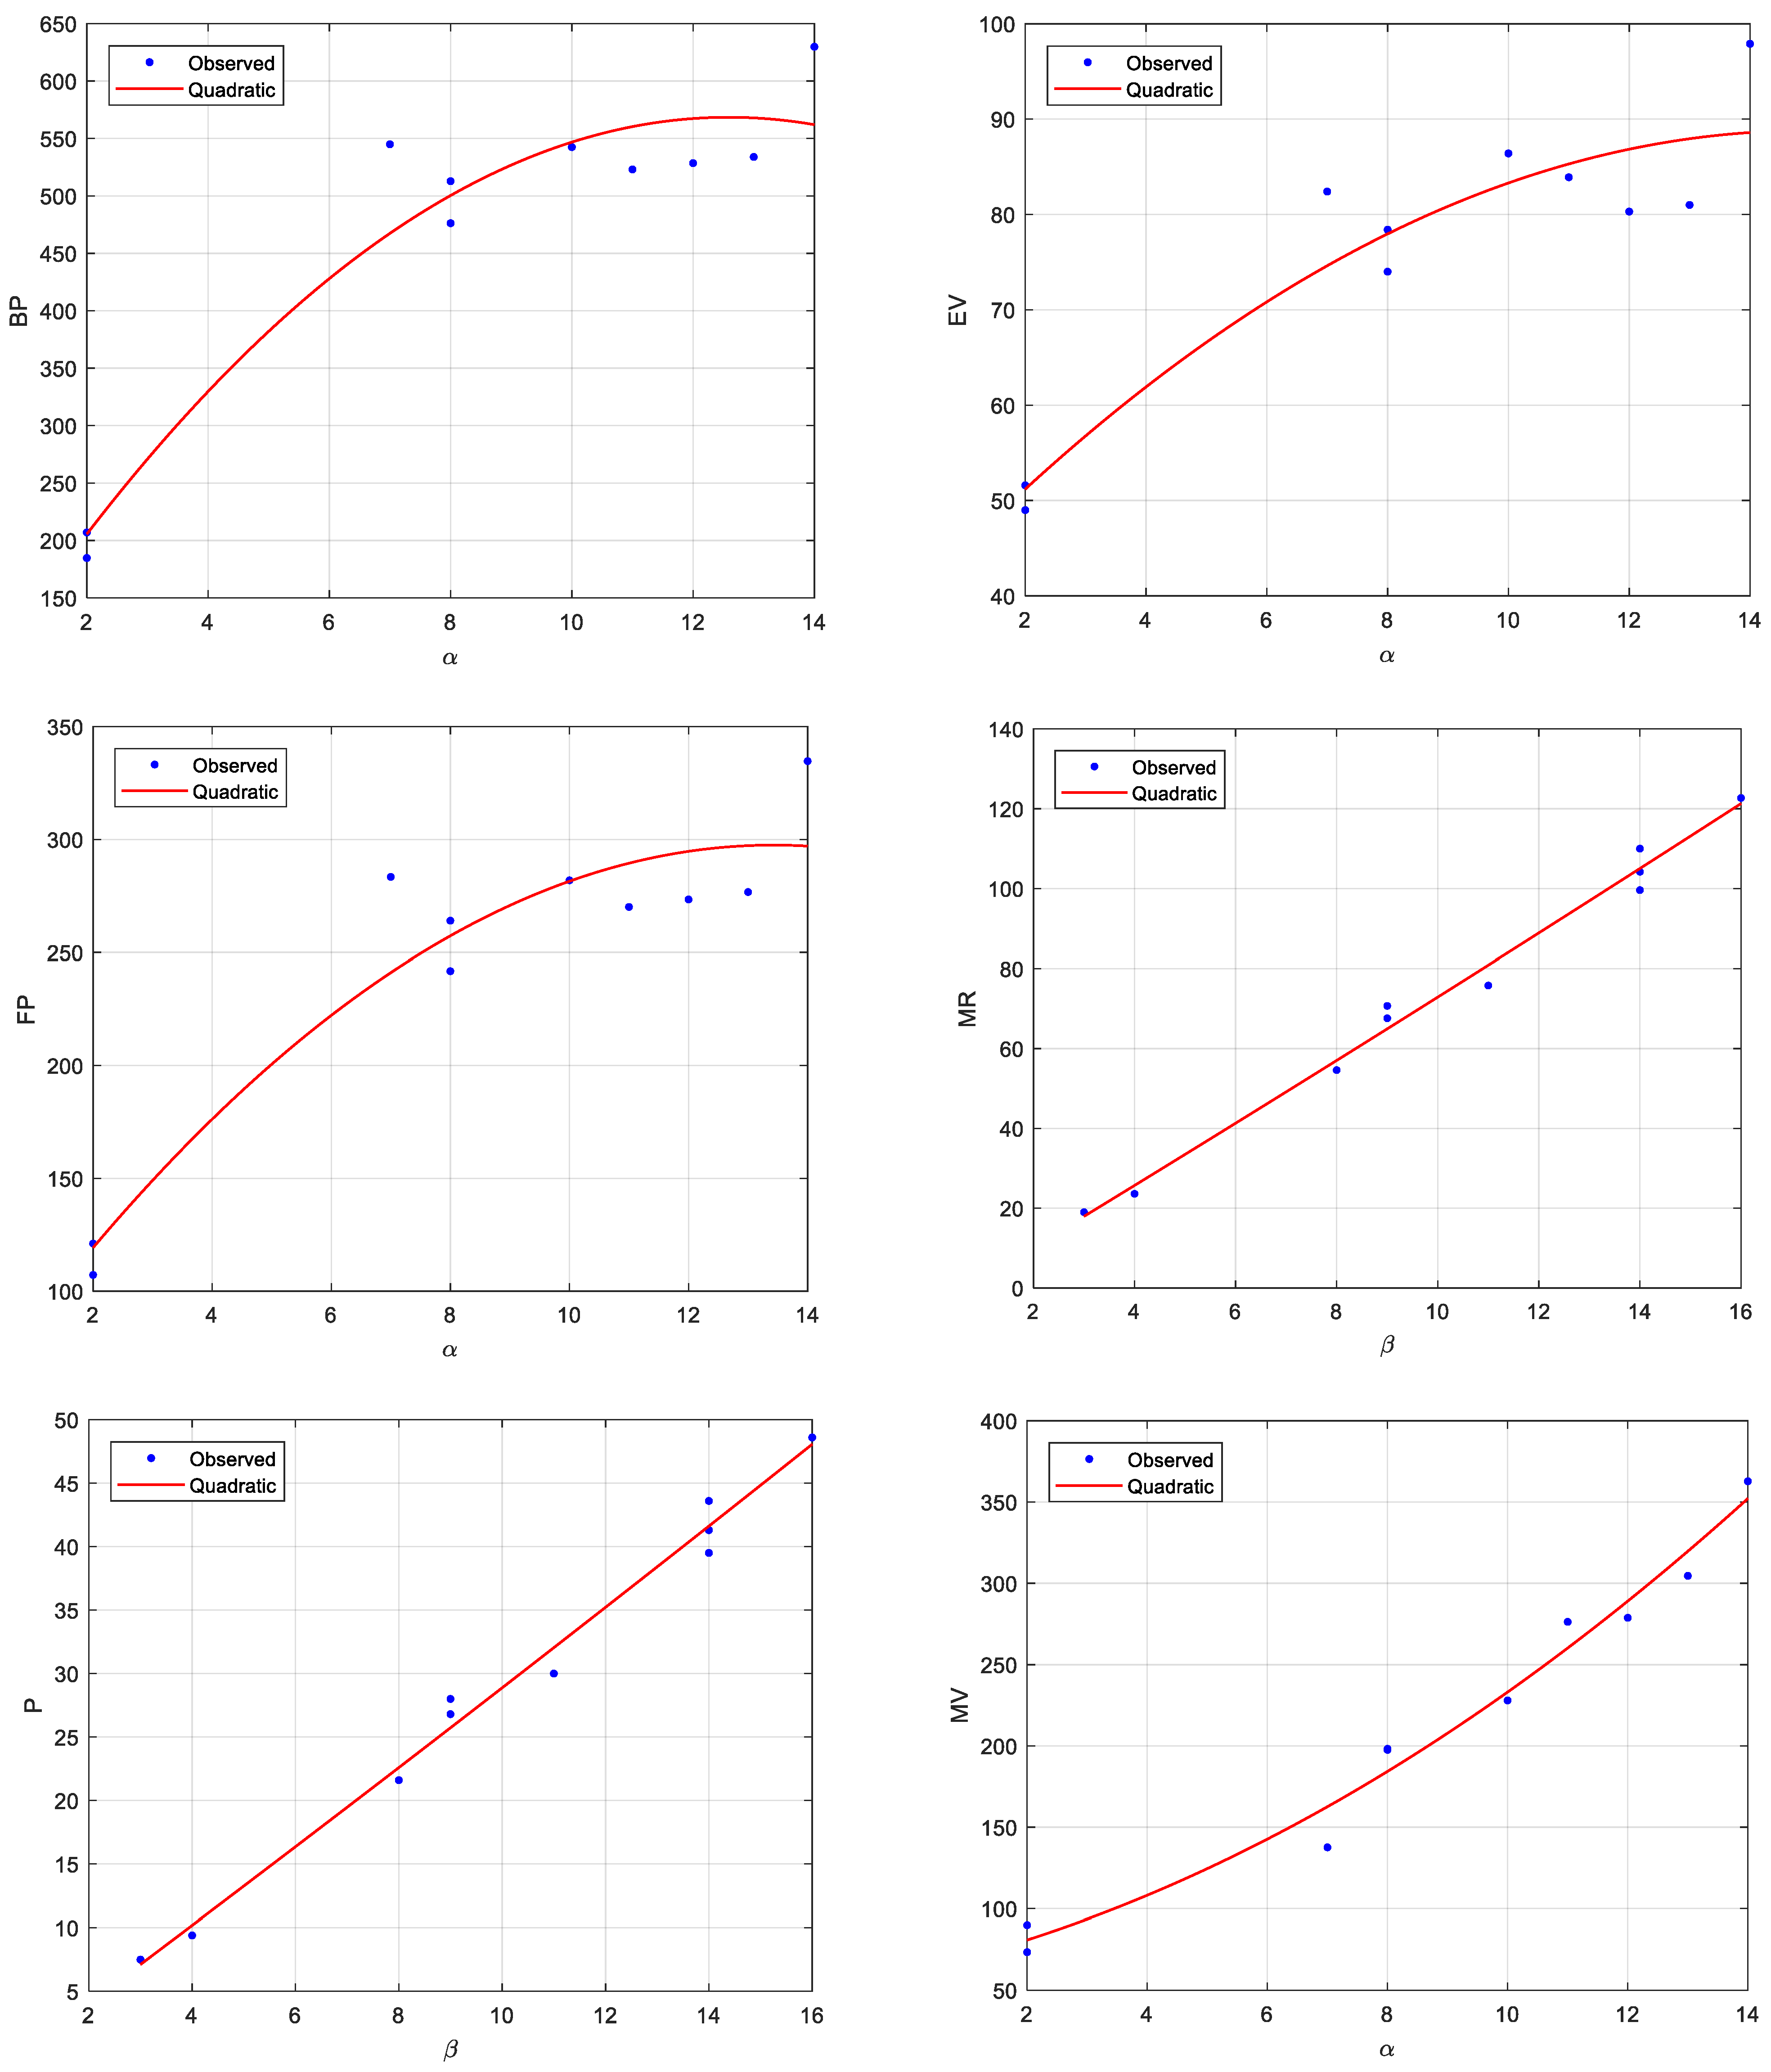
Figure 24 and
Figure 25 show that the illustrations of the most appropriate and well-estimated linear, quadratic and cubic regression models for determining some physicochemical properties of the investigated drugs and bioactive molecules.
The statistical correlations observed across the regression models can be attributed to the fundamental graph theoretic definitions established in
Section 2. According to Theorem 1, the independence number
and vertex covering number
directly scale with the total number of heavy atoms and skeletal branching, which inherently govern molecular size, surface area, and related bulk properties such as boiling point. Concurrently, the domination number
identifies the minimal subset of core vertices required to cover the skeletal network within distance one, effectively reflecting the central connectivity and topological compactness of the molecule. Thus, these set theoretic parameters may serve as simple yet meaningful structural descriptors of both overall molecular dimension and local vertex arrangement.
In order to assess the prediction reliability, stability, and generalizability of the established linear, quadratic, and cubic regression models, the leave one out cross validation (LOOCV) method was employed. In this validation process, a single data point is removed from the dataset to serve as the test sample while the model is calibrated on the remaining observations; this routine is systematically repeated until all samples have been predicted independently. The internal validation capacity was evaluated via the cross validated coefficient of determination (
), the Root Mean Square Error of cross validation (LOOCV RMSE), and the Mean Absolute Error of cross validation (LOOCV MAE). The corresponding validation metrics for the linear, quadratic, and cubic models are presented in
Table 10,
Table 11 and
Table 12, respectively.
Across all 19 established regression models in
Table 10,
Table 11 and
Table 12, the statistical assessment demonstrates remarkable goodness of fit and internal predictive capability, with the leave one out cross validation metrics satisfying the benchmark criteria (
and
) in 18 of the models, supporting their structural robustness and the general absence of overfitting. Only a single model among the quadratic models exhibited a slight discrepancy exceeding the conservative threshold (
,
,
) while still maintaining an acceptable internal predictive power (
). Overall, the coherence between the calibration (
) and validation (
) statistics suggests the reliability, statistical stability, and high predictive capacity of the investigated graph parameters for the targeted physicochemical properties.