Article

Physics-Informed Neural Networks for Non-Recurrent Traffic Congestion Detection: A Case Study on the Seoul Ring Expressway

1
Korea Institute of Civil Engineering and Building Technology, 283, Goyang-daero, Ilsanseo-gu, Goyang-si 10223, Gyeonggi-do, Republic of Korea
2
John A. Reif, Jr. Department of Civil and Environmental Engineering, New Jersey Institute of Technology, Newark, NJ 07102, USA
*
Author to whom correspondence should be addressed.
Symmetry 2026, 18(8), 1394; https://doi.org/10.3390/sym18081394
Submission received: 22 June 2026 / Revised: 30 July 2026 / Accepted: 11 August 2026 / Published: 19 August 2026
(This article belongs to the Special Issue Symmetry/Asymmetry in Intelligent Transportation System)

Abstract

Non-recurrent congestion (NRC), caused by unforeseen events such as crashes, lane closures, and adverse weather, accounts for approximately half of all delays on urban freeways, yet it remains difficult to distinguish from routine congestion at recurrent bottlenecks. This study proposes an NRC detection framework based on a Physics-Informed Neural Network (PINN) that embeds the Lighthill–Whitham–Richards (LWR) conservation law into the learning process to construct a physically consistent baseline of normal traffic states. The traffic flow physics is represented by a two-regime fundamental diagram combining the Greenshields model for free-flow conditions and the Underwood model for congested conditions, and the network is trained by minimizing a composite loss that adaptively balances the data fitting error against the LWR residual. NRC is then detected when the observed density exceeds the PINN-estimated baseline density beyond a tolerance threshold of 150%. The framework was evaluated on a 12 km segment of the Seoul Ring Expressway in Korea using six months of 15 min data collected from seventeen sensor stations. The results show that the proposed model reliably isolates NRC events from recurrent peak-period congestion. From the perspective of symmetry, the framework interprets recurrent traffic as a temporally symmetric background state governed by a conservation law, and non-recurrent congestion as a local breaking of this symmetry, which the physics-constrained residual is designed to expose. The key contribution of this study is a theoretically grounded, label-free anomaly detection approach that couples machine learning with traffic flow theory, offering traffic management centers an automated and interpretable tool for incident detection and response.

1. Introduction

Traffic congestion throughout the United States (US) has reached unprecedented levels, a phenomenon primarily attributable to evolving travel patterns in which traffic delays have permeated midday periods, midweek timeframes, and weekends, extending beyond traditional weekday peak hours [1]. According to INRIX’s 2024 Global Traffic Scorecard, the US national cost of congestion has risen to $74 billion in forfeited time and productivity, with drivers in New York City and Chicago each losing 102 h per year, ranking both cities closely behind Istanbul, and the New York metropolitan area alone incurring an estimated $9.5 billion in economic losses [2]. In this context, the present study concerns non-recurrent congestion (NRC), namely the unpredictable delay caused by random disruptive events such as incidents, adverse weather, and special events, as distinguished from recurrent congestion (RC), which arises predictably from routine peak period demand. The detection framework developed herein is based on a Physics-Informed Neural Network (PINN), a deep learning model whose training is constrained by the governing equations of traffic flow theory; both concepts are elaborated on in the sections that follow.
Effective mitigation of these substantial economic consequences necessitates the precise identification and quantification of delay mechanisms. Transportation analyses differentiate between recurring and non-recurring congestion, noting that roughly half of all congestion is caused by unpredictable, non-recurring disruptions [3,4]. These non-recurring events include traffic incidents, adverse weather conditions, road construction zones, and special events. Crucially, these unexpected factors introduce highly variable and unpredictable travel times, compelling both travelers and freight shippers to allocate excessive buffer time, which ultimately results in lost resources [3].
Skabardonis et al. [5] define non-recurrent congestion as the extra delay on freeway segments caused by unpredictable and random events that disrupt normal traffic flow. This type of delay results from incidents such as accidents, breakdowns, or from special events, lane closures, and bad weather. Essentially, non-recurrent congestion is the additional delay that occurs beyond the regular, predictable delay, which would happen in the absence of the specific disruptive event.
Non-recurrent congestion profoundly impacts transportation systems by adding significant variability to operations and increasing overall delay. Since congestion delay is a random quantity with a large statistical “tail”, reliance on single-day measurements or instrumented probe vehicles to estimate delay is considered highly misleading. Non-recurrent events cause a marked reduction in travel time reliability; analysis of the I-210 corridor showed that the 90th percentile travel time increased by approximately 8 min under incident conditions. Empirical studies further demonstrate that non-recurrent delay accounts for a substantial portion of the total delay, contributing between 13% and 30% of the total congestion delay during peak periods in the corridors examined [5]. In specific case studies, such as the I-880 corridor, each incident during the PM shift was found to contribute an average of 383.8 to 486.1 vehicle-hours of delay [6]. The cumulative effect of these delays is a severe economic burden.
Despite the disclosed substantial impacts of non-recurrent congestion (NRC), its accurate analysis is hindered by significant methodological and data-related challenges. A primary conceptual problem is the difficulty in separating non-recurrent delays from recurrent delays. Furthermore, quantifying the impact of an event is complex because it requires estimating the exact spatial and temporal region of impact, which is often difficult when the time and location data for the incident lack the necessary accuracy. There are also subtle questions of compounding causation that complicate analysis, such as determining how to attribute delay when adverse weather concurrently increases both the number of incidents and the baseline recurrent delay [5]. Additionally, implementing detailed measurement methodologies statewide is constrained by the fact that comprehensive data, including detailed incident records, special event data, and precise lane closure information, are not routinely available [7].
Numerous methodologies have been developed for identifying NRC and traffic anomalies, which can be broadly classified into four categories: statistical analysis, data clustering, machine learning, and traffic flow modeling. As detailed in Section 2, each category faces fundamental challenges, including the difficulty of defining objective thresholds between recurrent and non-recurrent congestion, sensitivity to measurement noise, the scarcity of ground truth NRC labels, and, for purely data-driven models, the risk of producing results detached from established traffic flow theory [8,9,10,11,12,13,14].
The objective of this research is to develop and evaluate an NRC detection method that requires neither labeled incident data nor subjective thresholds calibrated per site, by grounding the detection baseline in traffic flow theory. The underlying premise is that a model constrained by the physics of normal traffic flow cannot reproduce non-recurrent disruptions, so significant deviations between observed and physics-estimated traffic states signal an NRC event. This premise admits a natural interpretation in terms of symmetry: recurrent congestion preserves the day-to-day temporal symmetry of traffic patterns, whereas a non-recurrent event constitutes a local symmetry breaking that the physics-constrained residual is designed to expose.
This research proposes a robust framework for non-recurrent traffic congestion by leveraging Physics-Informed Neural Networks (PINNs) to establish a physically consistent baseline of normal traffic behavior. By treating the traffic stream as a continuous fluid-like system, the PINN acts as an expert estimator that identifies anomalies by measuring the divergence between observed sensor data and the theoretically plausible traffic state. The mathematical foundation of this approach is rooted in the Lighthill–Whitham–Richards (LWR) model, which defines traffic dynamics through the conservation of mass equation. This first-order partial differential equation (PDE) describes the evolution of traffic density, k, over time, t, and space, x.
To ensure the model remains accurate across diverse flow conditions, a two-regime fundamental diagram is utilized to define the flow–density relationship. The detection of non-recurrent congestion is subsequently executed through a rigorous analysis of the model residuals. Because PINN is trained to represent the most plausible and normal traffic state for a given location and time, its output serves as a high-fidelity benchmark for typical flow. When real-time observed traffic states deviate significantly from the PINN’s estimated density, the resulting anomaly score—defined as the absolute difference between observation and estimation—signals a breakdown in the expected physical process. Since recurrent bottlenecks are already accounted for within the physical constraints and historical training of the model, a high residual indicates an external event that cannot be explained by standard traffic physics. Consequently, this methodology allows for the rapid identification of incidents, providing traffic management centers with a more accurate and automated tool for incident response and urban mobility optimization.
The contributions of this study are threefold. First, to the best of the authors’ knowledge, this is the first application of a PINN to non-recurrent congestion detection: whereas prior PINN studies in transportation employ the network as a traffic state estimator to reconstruct unobserved conditions, the present framework repurposes the PINN as a physically constrained baseline of normal traffic behavior, against which anomalies are identified through residual analysis. Second, the framework requires neither labeled incident data nor site-specific congestion thresholds, addressing two limitations that pervade existing NRC detection methods. Third, a differentiable two-regime fundamental diagram combining the Greenshields and Underwood models is embedded in the physics loss, enabling the baseline to remain accurate across both free-flow and congested regimes.
The rest of this paper is organized as follows. Section 2 reviews the literature on NRC detection across four methodological categories and highlights the research gaps this study addresses. Section 3 introduces the proposed PINN framework, including the LWR-based physics formulation, the two-regime fundamental diagram, and the considerations for loss weighting and hyperparameters. Section 4 describes the case study site and data. Section 5 presents the model parameters and NRC detection results, and Section 6 concludes with key findings and directions for future research.

2. Literature Review

This section summarizes the state-of-the-art literature on NRC detection, based on the four methodological categories discussed in the previous section, and addresses the gaps and challenges discovered in each category.

2.1. Clustering-Based Approach

The methodology group focused on data clustering relies on grouping data points or detected congestion incidents based on their proximity and density in space and time.
Anbaroglu et al. [8] proposed an NRC detection framework designed for large-scale urban road networks using link journey time (LJT) data. The core of the methodology involves spatio-temporal clustering of “excessive” LJTs, which are defined as travel times exceeding a threshold calculated by multiplying expected LJTs by a subjective congestion factor. This clustering approach identifies NRC events that span multiple adjacent links and persist across consecutive time intervals, effectively capturing the dynamic expansion and dissipation of congestion. To address the lack of ground-truth data, the authors introduced two novel evaluation criteria: “high-confidence episodes” to ensure detected events are significant enough to warrant operator attention, and a “Localization Index” to assess the spatial connectivity of events. Results from a case study in London demonstrated that the method maintains a robust balance between detection accuracy and the ability to associate congestion with specific incidents.
Similarly, An et al. [15] developed a macroscopic methodology for identifying urban recurrent congestion (RC) evolution patterns by utilizing grid-based divisions and GPS-equipped vehicle mobility data. The approach is structured into three phases: detecting grid-level congestion, differentiating RC from non-recurrent congestion (NRC), and measuring the resulting evolution patterns. A key feature of this research is the application of the Density-Based Spatial Clustering of Applications with Noise (DBSCAN) algorithm, which clusters grids based on a congestion frequency parameter to isolate recurrent patterns from irregular incidents. The evolution of identified RC clusters is subsequently measured using specific indicators, including congestion scale, propagation direction, and the identification of key grids that act as primary sources of propagation. Validated through taxi trajectory data from Harbin, China, the study emphasizes the utility of macroscopic grid analysis over traditional link-level or car-following models in capturing large-scale traffic dynamics.
More recently, Jin et al. [10] proposed the DBSCAN-based dynamic NRC tracking (DyNRTrac) algorithm to enhance the reliability of large-scale highway monitoring. This method leverages historical speed contour diagrams to establish “speed watersheds,” which serve as a reference for real-time comparison against dynamic traffic patterns. The algorithm incorporates Rauch–Tung–Striebel (RTS) smoothing to minimize data noise and utilizes a 3D speed–volume comparison method to detect NRC events, even when they overlap with recurrent peak-period congestion. Furthermore, a bilevel confirmation process involving “tentative” and “confirmed” status levels is used to filter out minor fluctuations and persistency checks. Evaluated with New Jersey Department of Transportation incident logs, the DyNRTrac model demonstrated a superior detection rate and a high capacity for tracking the unique spatial–temporal expansion of non-recurrent events.
As mentioned, the critical issue in the clustering-based method is finding an optimal boundary between NRC and RC. This challenge is exacerbated by the absence of widely consistent ground-truth data detailing the actual spatial and temporal boundaries of NRC events, hindering proper evaluation and refinement of clustering methods [8]. Furthermore, spatio-temporal definitions may fail to cluster events resulting from a single cause if they are separated by propagation delay and lack sufficient temporal overlap [8].

2.2. Statistical Analysis Approach

The category encompassing outlier detection techniques employs rigorous mathematical and probabilistic frameworks to quantify deviations from normal traffic conditions.
Anbaroğlu et al. [9] proposed two NRC detection methods for heterogeneous urban road networks to enhance the approach in [8]. Both methods rely on modeling link journey times (LJTs) with a lognormal distribution, established as the best fit through Kolmogorov–Smirnov testing. The first, percentile-based detection, flags LJTs exceeding a percentile threshold and clusters spatio-temporally overlapping outliers into NRC events, similar to [8]. The second adapts expectation-based space–time scan statistics (STSS), using a likelihood ratio test to identify significant space–time regions where LJTs deviate from their expected lognormal distribution, with significance assessed via Monte Carlo simulation. The methods were validated on London’s 424-link highway network across 20 weekdays and evaluated using high-confidence episode detection and the Localization Index adopted in [8] to measure spatial coherence. Results showed that percentile-based detection better captured high-confidence episodes, while STSS produced more spatially coherent clusters, and both outperformed traditional threshold-based clustering, especially on short or low-quality links.
Luan et al. [11] presented a dual-source framework for detecting and interpreting NRC by combining traffic speed data with social media information from Sina Weibo. The detection phase utilizes the Generalized Extreme Studentized Deviate (GESD) statistical algorithm to identify speed outliers relative to dynamic thresholds learned from historical data. Simultaneously, the authors employed natural language processing and Xgboost classification to extract non-recurring incidents from social media posts, identifying causes such as accidents, concerts, and marathons. By matching detected NRCs with geocoded Weibo posts in space and time, the framework provides bidirectional verification, where traffic data confirms the impact of social events and social media provides descriptive explanations for detected anomalies.
Yang et al. [16] proposed an extension of Bayesian Robust Principal Component Analysis (BRPCA) to detect traffic events by coupling multiple data streams. Their method converts 1-dimensional time-series data into a matrix format and decomposes it into a superposition of a low-rank matrix (i.e., representing normal background) and a sparse matrix (i.e., representing outliers or events). By coupling different physical variables, such as traffic flow and road occupancy, or data from nearby sensors to share a common sparse structure, the model significantly improves its ability to localize events in space and time. An experimental evaluation using loop detector data from Minnesota’s I-494 showed that this nonparametric Bayesian approach outperforms traditional Principal Component Analysis (PCA) by being more robust to noise and adaptive to environmental changes.
Additionally, Kalair and Connaughton [17] developed a novel, data-driven approach for the real-time detection and classification of traffic anomalies by identifying atypical fluctuations in the relationship between traffic density and flow. Moving beyond the single-curve representation of the fundamental diagram, they utilized Kernel Density Estimation (KDE) to construct bivariate probability distributions from high-resolution National Traffic Information Service data. Anomalies are defined as excursions of the flow–density trajectory outside a level curve containing 95% of the total probability mass, with the severity of the anomaly quantified by its distance from this typical region. Validated on London’s M25 motorway, the algorithm proved particularly effective at maintaining low false alarm rates in bi-modal speed cases, where traditional Standard Normal Deviate methods often struggle.

2.3. Deep Learning Approach

A third major grouping focuses on deep learning, where complex layered models are trained on traffic data, often visual or sequential, to predict anomalies or forecast accident risk.
Yuan et al. [14] developed “Hetero-ConvLSTM”, a deep learning framework designed to forecast traffic accident risk while specifically addressing spatial heterogeneity. The approach partitions a large study area into regional windows and employs convolutional long short-term memory networks to capture both temporal trends and local spatial features. To tackle heterogeneity across diverse environments like urban and rural regions, the authors implemented novel spatial graph features generated through the eigen-analysis of road network Laplacian matrices. This information is combined with a spatial model ensemble, which aggregates predictions from multiple regional models to improve overall accuracy. Testing on eight years of Iowa crash data demonstrated that the Hetero-ConvLSTM framework significantly outperforms baseline regression and standard LSTM models by integrating road, weather, and traffic factors.
Svanberg [18] conducted a study implementing a two-step anomaly detection mechanism for non-recurrent traffic congestion using public transport bus data from Stockholm. The methodology utilizes long short-term memory (LSTM) networks to model sequential time-series data, learning the typical travel behavior of buses between road segments. Anomalies are identified by analyzing prediction errors in conjunction with collective detection rules, such as accumulator and circular array rules, which signal an anomaly only when multiple consecutive buses are delayed. This approach incorporates both collective and contextual expressivity, allowing the system to distinguish between individual bus delays and significant congestion events caused by roadwork or accidents. The study concluded that the LSTM-based predictor significantly reduces false positives compared to baseline median filter models.
Sun et al. [19] developed “DxNAT,” a system utilizing deep neural networks to identify and explain non-recurring traffic congestion caused by events. Their approach involves encoding wide-area traffic data, such as speed and jam factors, into two-dimensional “Traffic Condition Images” (TCIs), which preserve the spatial relationships between road segments. These images are classified by a convolutional neural network (CNN) that incorporates time-related features to distinguish between recurring and non-recurring patterns. To overcome the challenge of limited labeled data, the authors introduced a “crossover operator” for data augmentation, generating balanced training sets by mutating and recombining image pixels. Case studies using Nashville data for sports games and accidents achieved high accuracy, demonstrating the model’s ability to identify specific event signatures within complex urban traffic.
While a variety of advanced deep learning techniques are adopted, the primary concern across them appears to stem from their inherent data-intensive nature, which risks yielding models that are detached from validation against core traffic flow theory [14]. A key operational challenge is addressing the extreme scarcity and sparsity of true anomaly events, such as accidents, which lead to highly unbalanced datasets and complicates the reliable training of deep learning models for accurate prediction [14,19]. Moreover, managing spatial heterogeneity remains vital, as a universal model struggles to account for the varying characteristics of accident causality and traffic dynamics across large, diverse regions, like those encompassing both urban and rural environments [14].

2.4. Traffic Flow Modeling Approach

The final distinct group involves macroscopic traffic stream modeling, integrating predictive models derived from traffic flow theory with quality control techniques.
Zeroual et al. [12] proposed an integrated approach for monitoring traffic congestion by combining a piecewise switched linear (PWSL) macroscopic model with an exponentially weighted moving average (EWMA) statistical chart. The PWSL model captures traffic dynamics as a continuous flow, and the residuals—representing the difference between measured and predicted traffic density—are used as congestion indicators. To enhance robustness against measurement noise and modeling errors, the authors applied wavelet-based multiscale filtering to the residuals before they are processed by the EWMA monitoring scheme. Simulation results using freeway data from California confirmed that this model-based approach is highly sensitive to moderate congestion changes and significantly reduces false alarm rates compared to non-filtered methods.
This model-based approach was further adapted by Harrou et al. [13] using the Shewhart statistical chart, and also combined with the Generalized Likelihood Ratio (GLR) hypothesis test, utilizing a Hybrid Observer (HO) based on the PWSL model to provide traffic density estimates against which real-time data are checked for anomalies [20]. Harrou et al. [13] proposed an integrated approach for monitoring traffic congestion by combining a piecewise switched linear (PWSL) macroscopic model with an exponentially weighted moving average (EWMA) statistical chart. The PWSL model captures traffic dynamics as a continuous flow, and the residuals—representing the difference between measured and predicted traffic density—are used as congestion indicators. To enhance robustness against measurement noise and modeling errors, the authors applied wavelet-based multiscale filtering to the residuals before they are processed by the EWMA monitoring scheme. Simulation results using freeway data from California confirmed that this model-based approach is highly sensitive to moderate congestion changes and significantly reduces false alarm rates compared to non-filtered methods.
Zeroual et al. [20] presented a flexible congestion detection approach that utilizes the PWSL macroscopic model in tandem with the Shewhart statistical control chart. The method relies on the PWSL model to describe the evolution of traffic density and employs residuals as inputs to the Shewhart chart, which triggers a congestion signal if values exceed the established three-sigma control limits. Similar to previous iterations, this approach incorporates wavelet-based smoothing to pre-filter residuals, thereby improving detection reliability in the presence of sensor noise. Testing on the SR-60 freeway in California validated the approach’s effectiveness in providing real-time alerts for abrupt and gradual traffic congestion.
Gall and Hall [21] proposed a logic-based approach to distinguish between incident-induced congestion and recurrent congestion at specific freeway locations. This logic utilizes 30 s volume and occupancy summaries from electronic detectors to classify traffic operations into four distinct states, such as uncongested flow or bottleneck flow. The core innovation of this approach is the requirement that, once congestion is detected at a specific station, the cause is identified by evaluating the traffic state at the station immediately downstream. If the downstream station is in an uncongested state, the congestion is likely incident-related; however, if the downstream station shows bottleneck flow characteristics, the congestion is deemed recurrent. A preliminary evaluation on the Queen Elizabeth Way in Ontario indicated that this simple logic effectively complements existing incident-detection algorithms by reducing false alarms at known bottlenecks.
Dowling et al. [22] detailed an analytical methodology for measuring and predicting the total annual traffic delay attributable to both recurrent and non-recurrent congestion. The authors distinguished the two types by their causality, defining NRC as delay resulting from incidents, weather, work zones, or special events, while RC is attributed to normal fluctuations in travel demand. Recurrent congestion is estimated using Highway Capacity Manual speed–flow curves and facility demand data, whereas non-recurrent delay is calculated using a probabilistic approach involving incident probability trees and duration estimates sensitive to response times. The framework provides two distinct tools: the Performance Measurement System (PeMS) method for areas with high sensor density and a “non-PeMS” method for facilities with limited surveillance, allowing for comprehensive statewide congestion monitoring.
Like other methods discussed above, the practical implementation is complicated by measurement noise and inherent modeling errors, necessitating the application of sophisticated pre-filtering techniques, such as wavelet-based multiscale filtering, to the model residuals to maintain low false alarm rates [12,13]. Simpler control chart methodologies, including the Shewhart chart, often prove insensitive to detecting gradual or moderate traffic anomalies, requiring the use of more complex schemes like the exponentially weighted moving average (EWMA) or Cumulative Sum (CUSUM) charts for reliable detection of incipient changes [12,20].
Notably, these traffic flow theory approaches share a common foundation with the present study: they rely on macroscopic traffic flow theory, rooted in the LWR model, to establish an expected traffic state against which observations are compared. The proposed framework builds on this tradition but replaces the piecewise linear approximations and statistical control charts with a neural network estimator constrained directly by the LWR conservation law, as formalized in Section 3. This tradition rests on the macroscopic models of the fundamental diagram family, originating with the kinematic wave theory of Lighthill and Whitham [23] and Richards [24] and the equilibrium speed–density relations of Greenshields [25], Underwood [26], and Daganzo [27], which have served as the physical basis of model-based detection and estimation studies. The proposed framework adopts this same physical basis; the corresponding models are formalized in Section 3, and their parameters are calibrated to the study corridor in Section 5.

2.5. Summary

The detection of non-recurrent congestion involves fundamental challenges that manifest uniquely across different methodological groups, including the difficulty in defining clear thresholds between recurrent congestion (RC) and NRC, and the risk of developing purely data-driven models that overlook established traffic flow dynamics. This research explores a novel approach to overcome the challenges that appeared in the previous efforts by employing a Physics-Informed Neural Network framework.
Table 1 summarizes the reviewed approaches, their representative methods, and their limitations with respect to the requirements of reliable NRC detection. As shown in the table, none of the existing approaches simultaneously avoid labeled incident data and maintain a baseline consistent with traffic flow theory, thereby constituting the research gap addressed by the proposed framework.
In summary, Table 1 reveals a consistent pattern across the reviewed literature. The clustering-based and statistical approaches operate without labeled data but depend on subjectively calibrated thresholds; the deep learning approaches avoid explicit thresholds but require labeled incident data that are scarce and unbalanced; and the traffic flow modeling approaches maintain partial consistency with theory but remain sensitive to measurement noise and modeling error. No existing approach simultaneously avoids labeled incident data and maintains a baseline fully consistent with traffic flow theory. This gap defines the requirements for the framework developed in Section 3.

3. Methodology

The methodology presented in this section is designed to directly address the gaps identified in the literature review. As summarized in Table 1, existing NRC detection approaches suffer from subjective thresholds (i.e., clustering and statistical methods), dependence on scarce labeled incident data (i.e., deep learning methods), or sensitivity to measurement noise and modeling errors (i.e., traffic flow modeling methods). The proposed framework responds to these limitations by extending the traffic flow theory-based detection tradition of Section 2.4 with a Physics-Informed Neural Network: the LWR conservation law replaces piecewise linear approximations, the network is trained on unlabeled sensor data, and detection is performed on physically interpretable residuals rather than statistically calibrated thresholds.

3.1. Physics-Informed Neural Network (PINN)

3.1.1. Overview

Physics-Informed Neural Networks (PINNs) represent a hybrid approach developed as an alternative method for solving non-linear differential equations. The core concept of a PINN is to train a neural network to approximate a solution and/or parameters of a partial differential equation (PDE) while adhering to the governing physical laws of the given system. This method effectively fuses physics knowledge derived from models, such as the Lighthill–Whitham–Richards (LWR) model, with observed data, thereby mitigating the limitations of traditional purely model-driven or purely data-driven methods. The PINN concept was first introduced by Raissi et al. [28], who embedded the residual of governing differential equations into the network training loss, enabling neural networks to learn solutions consistent with physical laws from sparse and noisy data. In transportation, PINNs have been employed primarily for traffic state estimation, where encoding macroscopic models such as the LWR model has been shown to improve estimation accuracy under sparse and noisy sensor data [29,30,31]. To the best of the authors’ knowledge, however, PINNs have not previously been applied to the detection of non-recurrent congestion, which distinguishes the present study from the prior work.
A PINN is designed as an optimization problem where the goal is to minimize a total loss function, typically composed of two main types of errors: data loss and physics loss. The data loss part measures the discrepancy between the measured data (i.e., target values) and the output of the neural network approximation, focusing on the supervised learning task. PINNs are advantageous as they can implement an effective loss function even with a modest amount of data. The physics loss part embeds the differential equations (physical laws) into the network’s loss function as regularization, which constrains the feasible solution space. The algorithm calculates a residual value, f(t, x), that expresses the discrepancy between the neural network approximation, u ^ , and the physical law. This residual is often calculated using automatic differentiation techniques. Since traffic models frequently involve discontinuous solutions (e.g., shock waves), regularization, such as artificial viscosity, is often applied to the governing equation to handle discontinuities for robust PINN performance. The total loss is generally expressed as a weighted sum of these losses and is minimized using optimization techniques such as gradient descent.

3.1.2. Lighthill–Whitham–Richards (LWR) Model

The LWR model [23,24] is the prototype kinematic wave model and the foundational framework for first-order macroscopic traffic flow models, proposed by Lighthill and Whitham and Richards. LWR models treat traffic as a continuum fluid flow rather than individual vehicles and are applicable primarily to large-scale traffic distribution problems on long, crowded roads.
The LWR model is built upon three components: (1) conservation law, (2) fundamental equation of traffic flow, and (3) equilibrium speed–density relationship. The conservation law, also known as the continuity equation, expresses the conservation of the number of vehicles on a section of road, assuming no entry or exit in that section, as shown in Equation (1).
k t + q x = 0
where k is the traffic density (vehicles per unit length), q is the traffic flow rate (vehicles per unit time), t is time, and x is the space variable along the road. From a symmetry standpoint, the conservation law in Equation (1) is itself an expression of invariance: by Noether’s theorem, conservation laws arise from underlying symmetries of a physical system, and the conservation of vehicles embodies the continuity of the traffic stream under translations in time and space. Embedding Equation (1) in the learning process, therefore, endows the proposed model with the symmetry structure of the traffic flow system.
The fundamental equation of traffic flow relates flow, density, and speed (u), which is known as Equation (2).
q = u k
The equilibrium speed–density relationship (a.k.a., fundamental diagram) assumes that the traffic stream is always in equilibrium, meaning the speed (u) is a function only of the density (k) at any point in the stream at any time, such that k and u are according to the equilibrium relation, as expressed in Equation (3).
q ( k ) = q e ( k )
This substitutes the explicit relation q = q(k) into the conservation equation to yield a single partial differential equation (PDE), as depicted in Equation (4). This construction means the LWR model essentially specifies an additional static traffic stream model between density and flow to complete the macroscopic flow model. It is worth noting that the LWR model assumes that traffic remains continuously in equilibrium, meaning that flow (q), density (k), and speed (u) are related by a single function.
k t + ( q ( k ) ) x = 0
The specific nature of the LWR model is defined by the chosen fundamental relation, which often takes the form of a parabolic or triangular curve relating density and flow, such as the Greenshields model [25], Underwood model [26], and Daganzo Model [27]. Among these canonical forms, this study adopts a two-regime combination of the Greenshields and Underwood models, as described in Section 3.2.1, because the parabolic form effectively represents the observed free-flow regime, while the exponential form more accurately captures the gradual speed decay seen in the congested regime of the study corridor. The piecewise linear (i.e., triangular) Daganzo form, although computationally appealing for cell-based simulation, introduces non-differentiable points that hinder gradient-based training and automatic differentiation needed by the PINN framework (cf. Section 3.2.3).

3.2. PINN Model for Non-Recurrent Congestion Detection

3.2.1. Model Structure

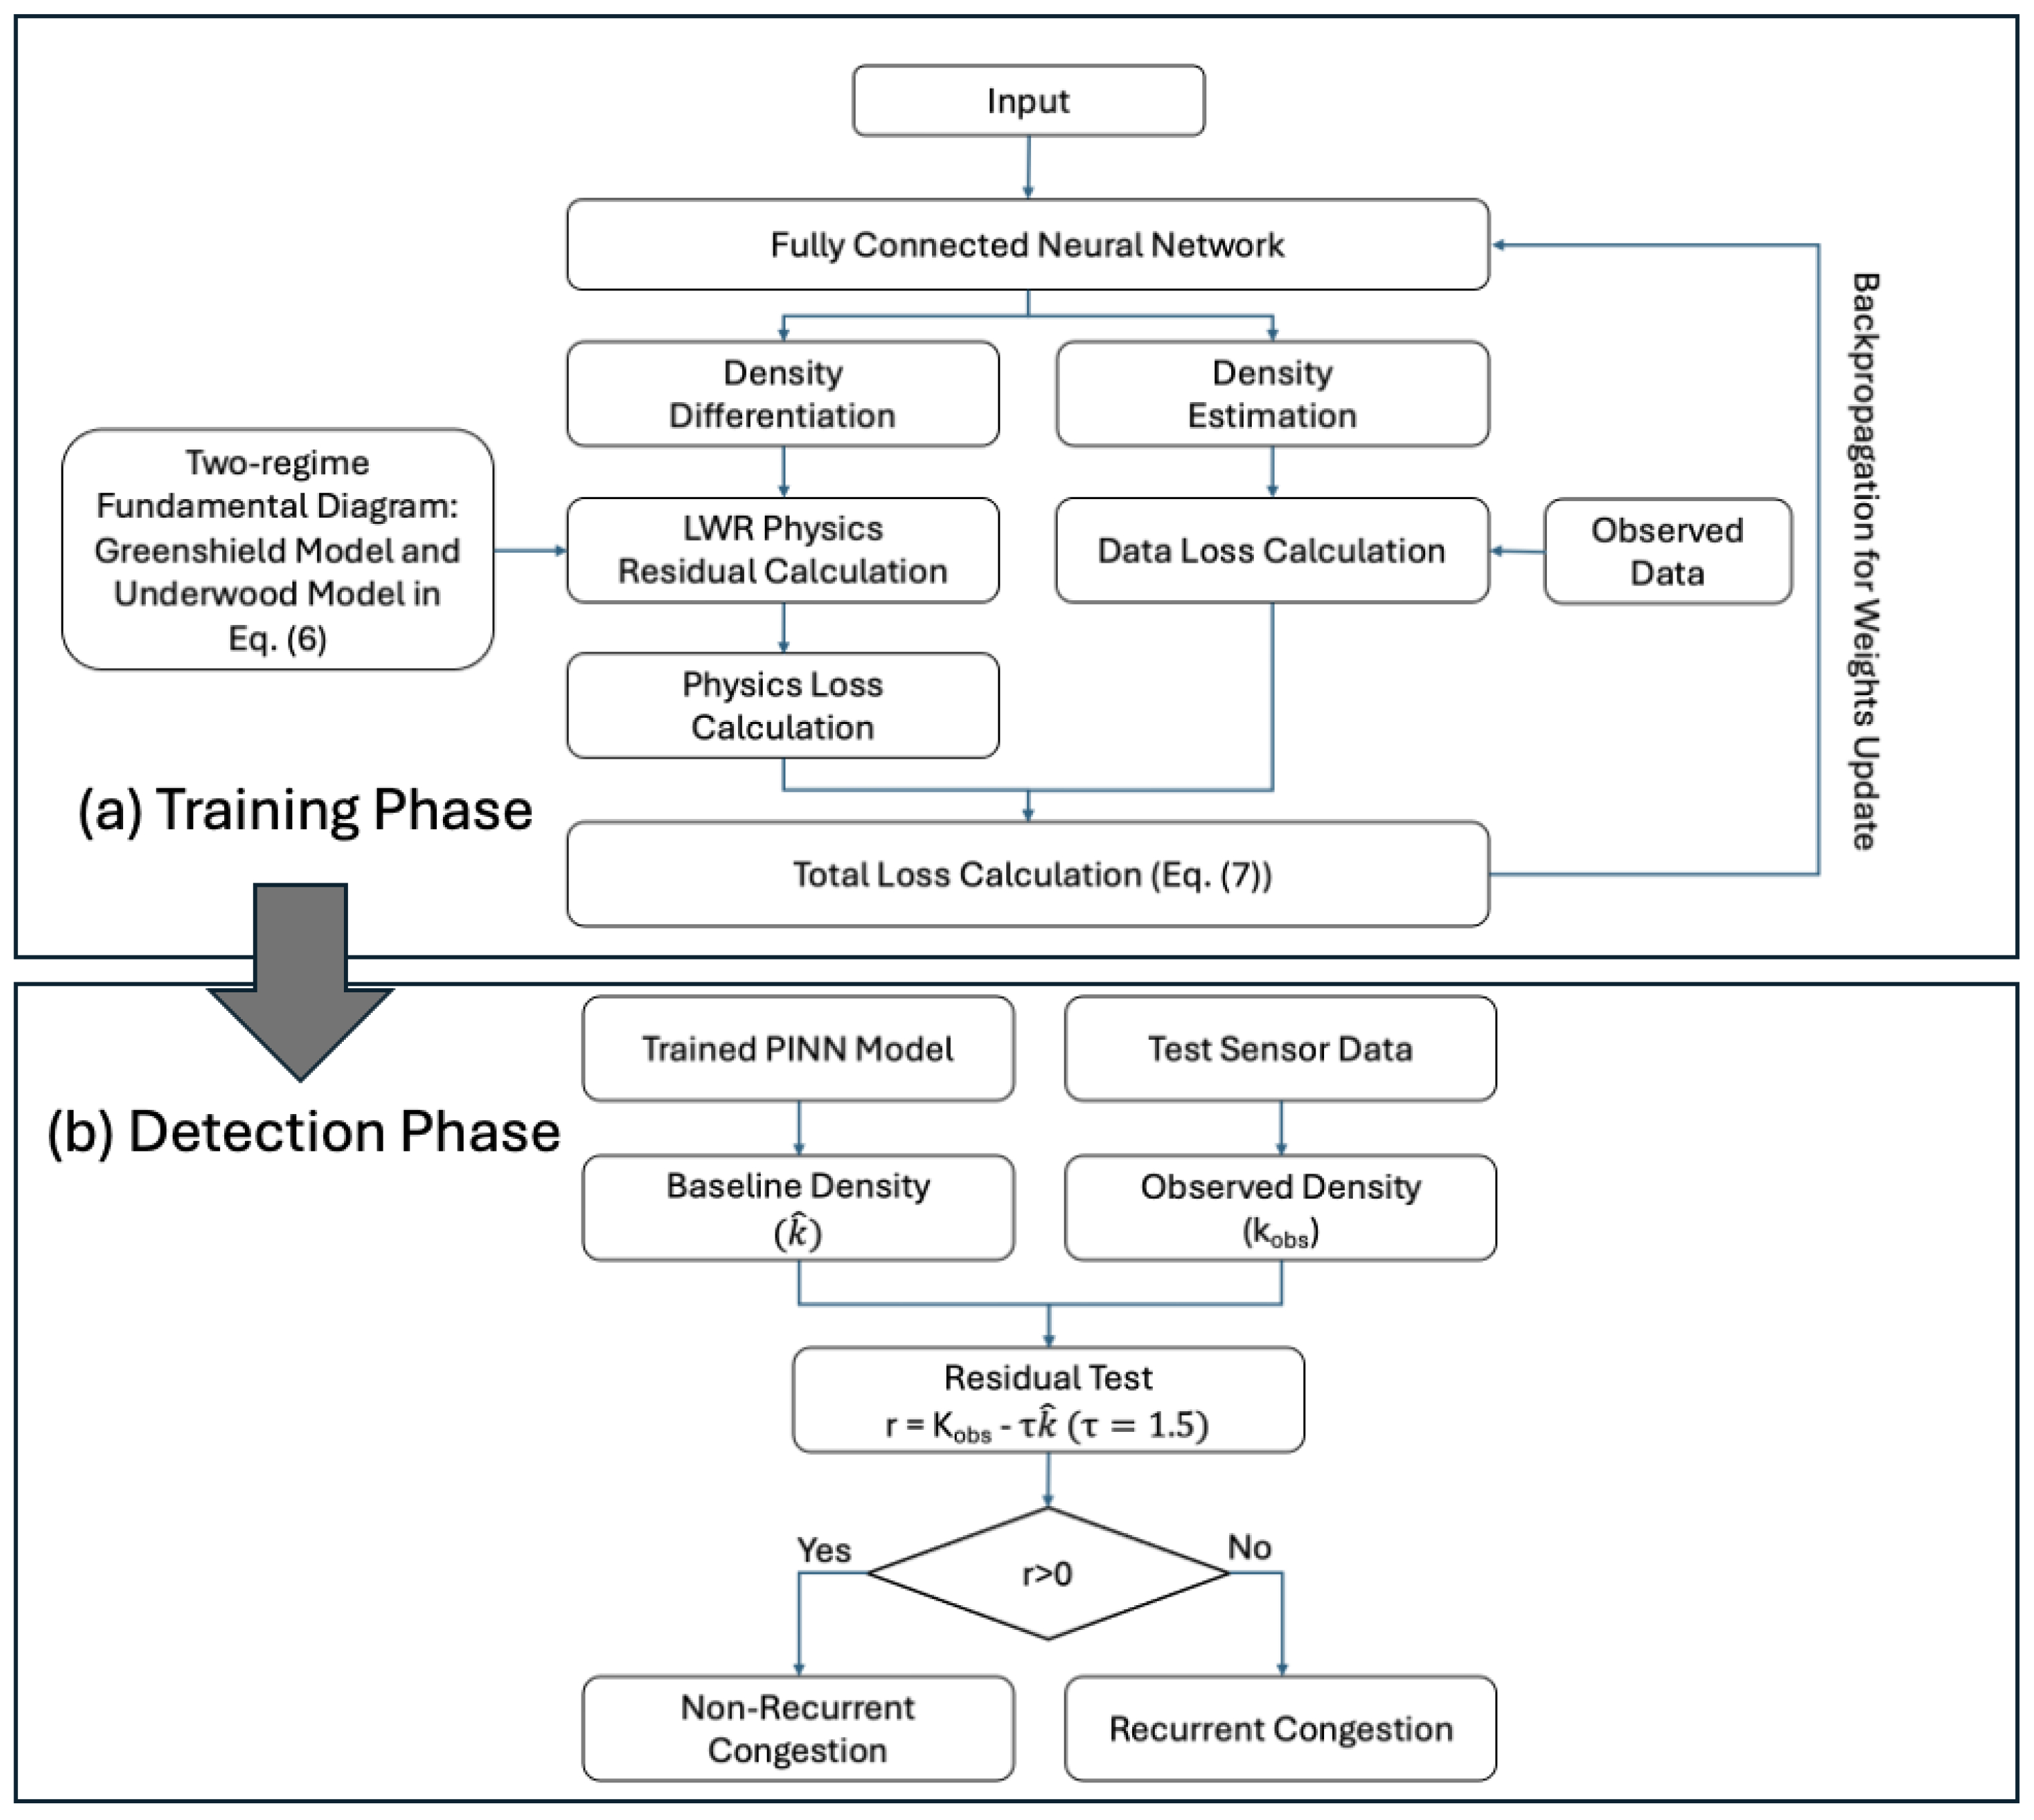
The proposed methodology establishes a diagnostic framework for traffic anomaly detection by synthesizing macroscopic traffic flow theory with the universal approximation capabilities of deep learning. Figure 1 illustrates the overall structure of the proposed PINN model. The framework, developed by the authors, adapts the canonical PINN architecture of Raissi et al. [28] to the NRC detection problem. This involves the standard combination of data loss and physics loss following the general PINN formulation. The embedded physical law is the LWR conservation equation [23,24], featuring a two-regime fundamental diagram [25,26]. The residual-based anomaly scoring stage is a new component introduced in this study. Panel (a) of Figure 1 shows the training phase, and panel (b) shows the online detection phase.
At the center of this approach is PINN, which functions not as a standard predictive model but as a latent state estimator. By mapping spatio-temporal coordinates (x, t) to a density value,   k ^ , the network generates a continuous representation of the traffic field that is strictly governed by the fundamental laws of fluid dynamics. This creates a physical baseline representing the most plausible traffic state under normal operating conditions. The governing physics of the estimator is derived from the LWR conservation law. This partial differential equation ensures that the change in vehicle density over time is balanced by the spatial gradient of the traffic flow, expressed as follows:
k ( x , t ) t + q ( k x , t ) x = 0
To accurately represent the flow q(k) across varying levels of congestion, the proposed methodology incorporates a two-regime fundamental diagram. This hybrid approach utilizes the Greenshields model to characterize the free-flow regime, where velocity decreases linearly as density increases toward a critical threshold, kc. Upon reaching this threshold, the model transitions to the Underwood regime, which employs an exponential decay function to better capture the complex, non-linear behavior of congested traffic. The velocity functions for these two regimes are defined as follows:
u k =   u f 1 k k j ,                             i f   k k c u f e ( k k o ) ,                                           i f   k > k c
The training of the PINN model involves a multi-objective optimization process where the model is constrained by a composite loss function. The empirical component of the loss minimizes the error between the network’s predictions and the sparse observed data from road sensors. Simultaneously, the physics-based component of the loss evaluates the residual of the LWR equation. This is achieved through automatic differentiation, which allows the model to compute exact partial derivatives of the estimated density with respect to time and space. By penalizing any deviation from the conservation law, PINN is forced to fill data gaps with physically consistent interpolations rather than purely statistical ones.
The detection of non-recurrent congestion (NRC) is realized through the quantification of the discrepancy between PINN’s physical estimation and the real-time observations. In this framework, the PINN acts as an ideal observer of the roadway’s “normal” capacity and behavior. When a non-recurrent event occurs, such as a collision or a sudden lane closure, the resulting traffic state violates the steady-state assumptions and physical parameters embedded within the network. By calculating a localized anomaly score based on the magnitude of the residual between the observed density and the PINN’s estimated density, the system can distinguish between recurrent bottlenecks, which the physics can explain, and non-recurrent incidents, which manifest as significant physical outliers. This residual-based approach provides a high-resolution, automated mechanism for isolating transient disturbances within the broader traffic network.

3.2.2. Loss Weighting Strategy

The optimization of the PINN framework requires meticulous calibration of the loss function components to ensure that the physical constraints are not overshadowed by empirical data fitting. The total loss is structured as a weighted summation of the data-driven residual and the physics-informed residual, typically expressed as Equation (7). The selection of these weighting coefficients, λ d a t a and λ p h y s i c s , is a critical methodology consideration, as an imbalance can lead to gradient pathology. This phenomenon occurs when the model prioritizes minimizing the relatively straightforward data loss while neglecting the complex, non-linear partial differential equations of the LWR model, effectively reducing the PINN to a standard, non-physical regressor.
L θ = λ d a t a L d a t a   + λ p h y s i c s L p h y s i c s  
where
  • L ( θ ) : total loss;
  • λ d a t a : weight for data loss;
  • λ p h y s i c s : weight for physics loss;
  • L d a t a : data loss value;
  • L p h y s i c s : physics loss value.
To address this imbalance, the methodology incorporates self-adaptive weighting strategies. Rather than treating the weights as a static hyperparameter, this research utilizes a dynamic weighting scheme that adjusts the coefficients based on the relative magnitude of the gradients from each loss term. This ensures that during the initial stages of training, the model can lean on empirical data to find a localized region of the solution space before the physics loss begins to enforce the strict conservation laws of the Greenshields and Underwood regimes. Such a balanced approach is essential for identifying non-recurrent congestion, as an over-weighted physics term might lead to an overly rigid model that ignores real-world data, while an under-weighted term might allow the model to “memorize” congestion events as normal patterns, thereby failing to flag them as anomalies.

3.2.3. Hyperparameter Configuration

The sensitivity of the model to internal hyperparameters further dictates the accuracy of the baseline state estimation. Specifically, the critical density, kc, serves as a pivotal hyperparameter that defines the transition point between the linear Greenshields model and the exponential Underwood model. Because the physics loss depends on the differentiability of the flow–density relationship, any sharp discontinuity at kc can result in unstable gradient updates. Methodologically, this is often mitigated by employing a sigmoid-based blending function that ensures the two-regime model remains differentiable. Additionally, the learning rate must be tuned with high precision; a learning rate that is too high may cause the model to skip the subtle physical equilibria of the traffic stream, while a learning rate that is too low may result in the model becoming trapped in local minima that do not reflect the true traffic state.
Ultimately, the robustness of the non-recurrent congestion detection depends on the interplay between these hyperparameters and the weighting strategy. If the PINN is correctly calibrated, the physics loss acts as a regularization that prevents the network from accepting unfeasible traffic states as valid, even if those states appear in the training data. This creates a high-fidelity “digital twin” of the roadway’s normal operating capacity. When a transient event like a collision occurs, the discrepancy between the sensor-reported density and the PINN’s physically sound estimate provides a statistically significant signal. By maintaining a sharp focus on the physics-to-data ratio during training, the methodology ensures that the anomaly score remains a reliable metric for isolating incidents from the background noise of daily recurrent traffic.

4. Case Study

This section presents a case study to evaluate the performance of the proposed PINN-based NRC detection method formulated in Section 3.
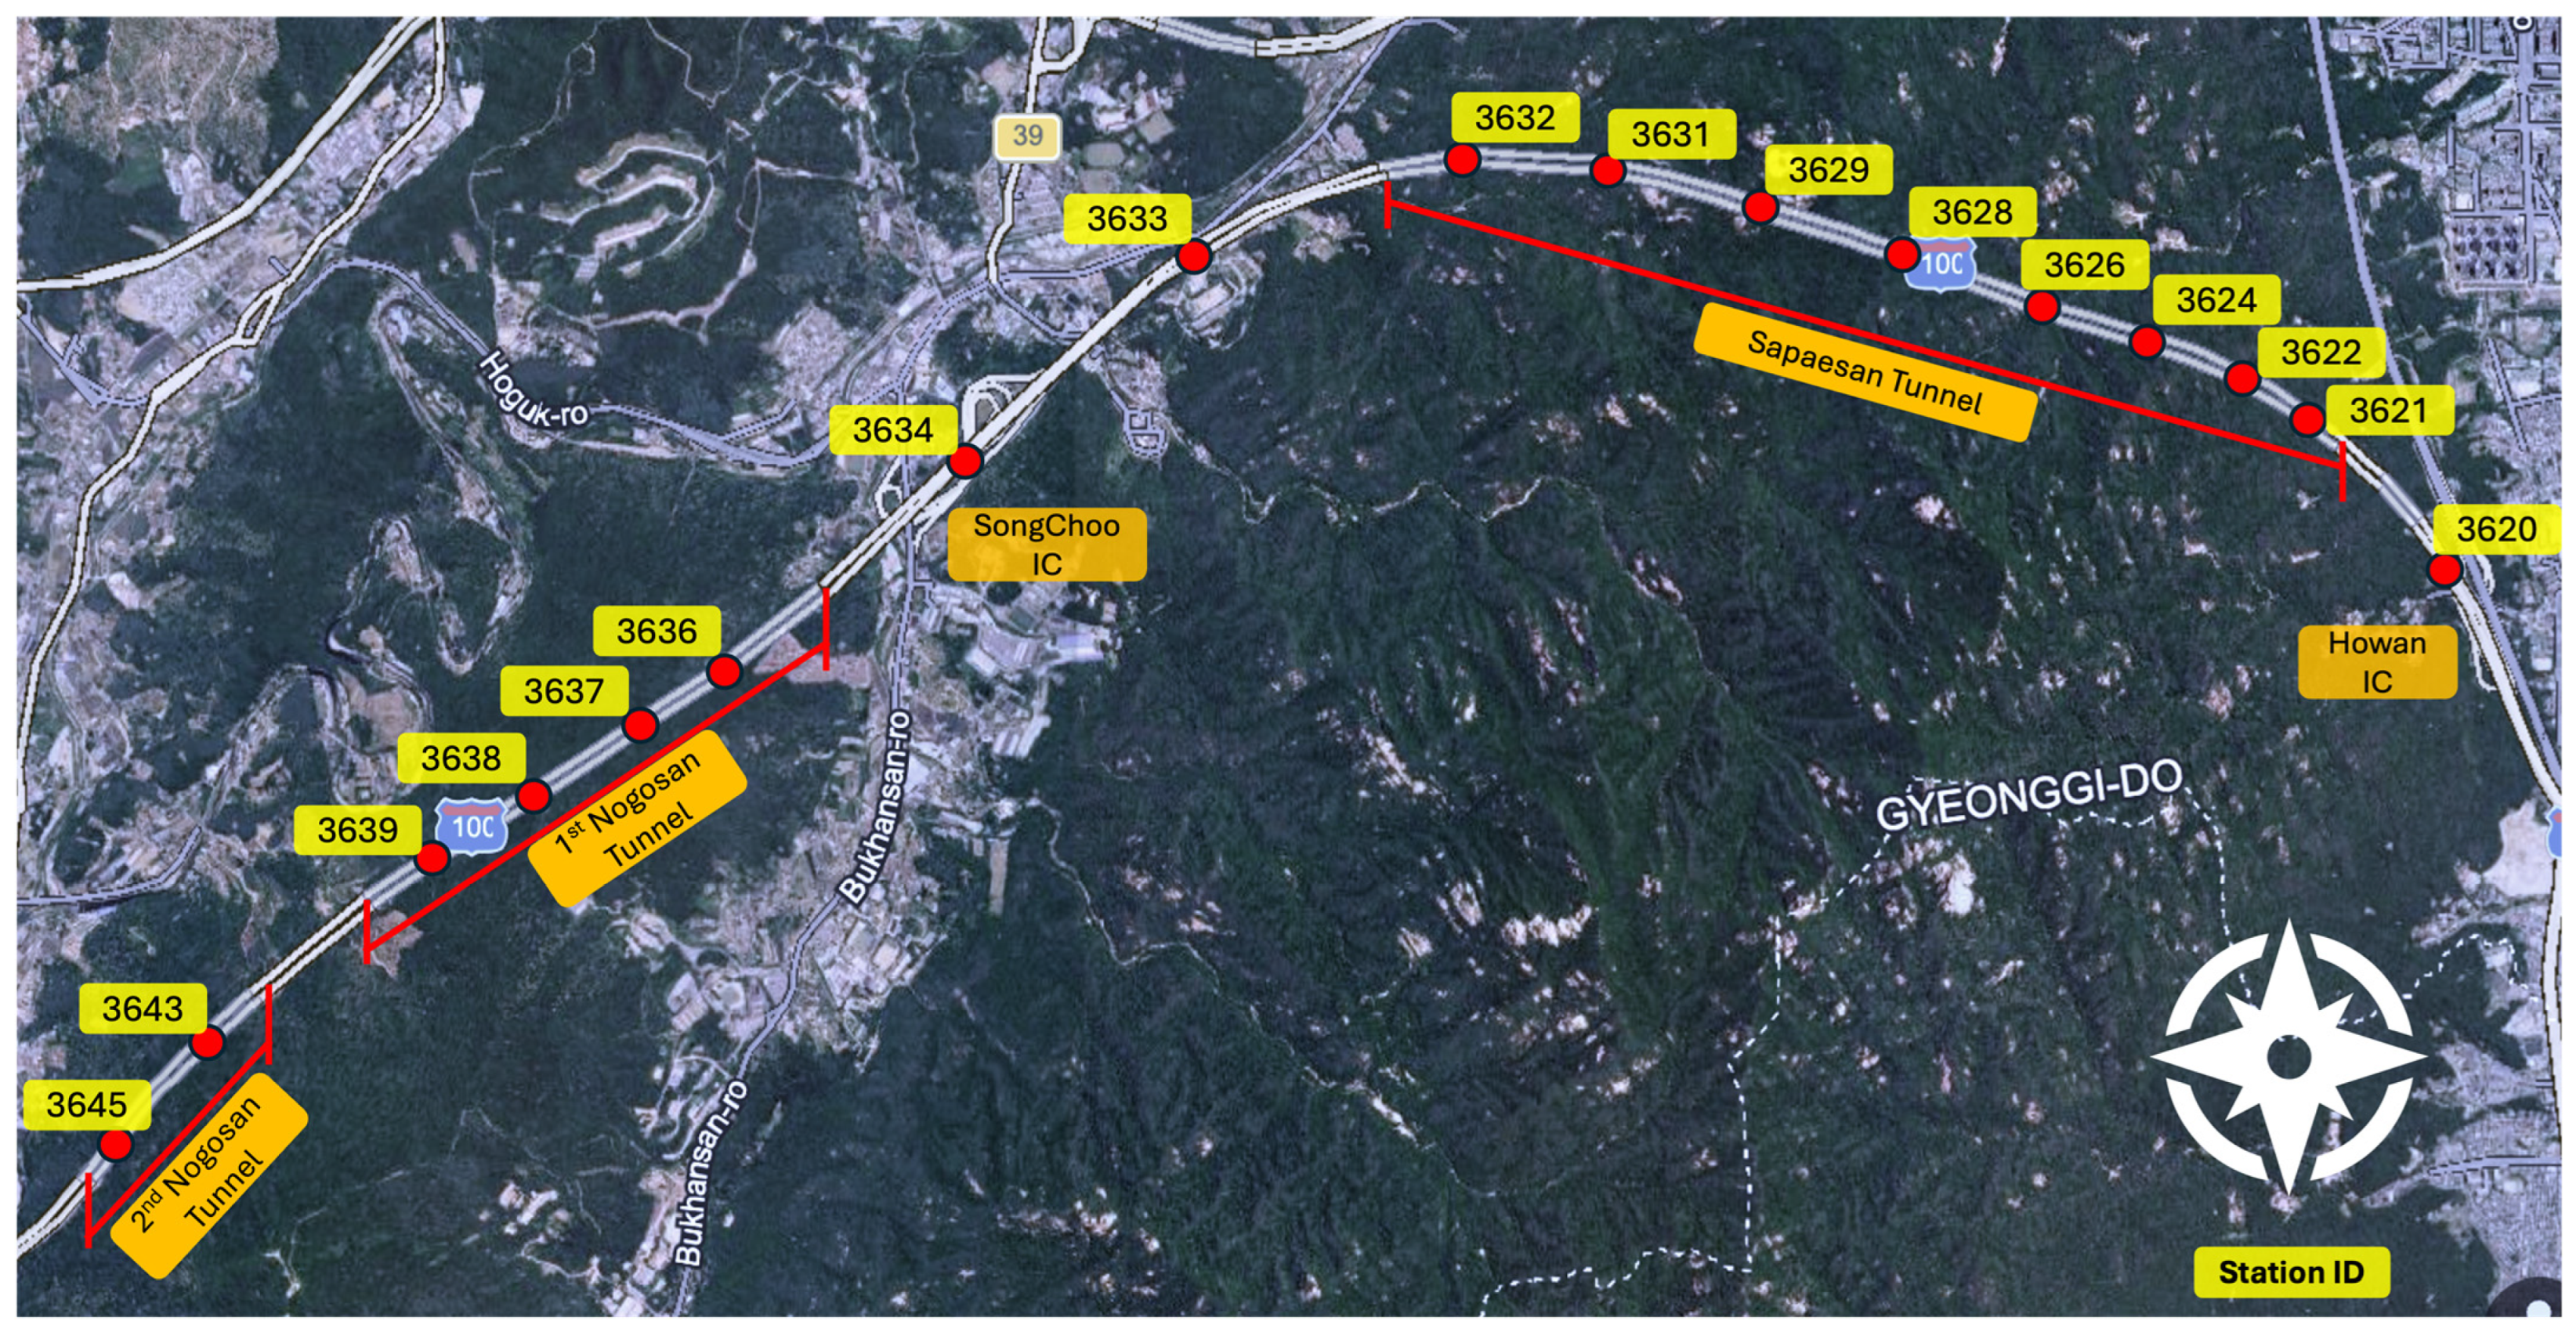
This study selects a 12 km segment on the outer loop (i.e., westbound direction) of the Seoul Ring Expressway in Korea between the Howon IC and the 2nd Nogosan Tunnel, as shown in Figure 2. The chosen segment has 17 permanent data collection stations that capture traffic data, such as count, speed, and occupancy. The selected segment includes three tunnels (i.e., 1st Nogosan Tunnel, 2nd Nogosan Tunnel, and Sapaesan Tunnel), where non-recurrent congestion plays a critical role in congestion and incident management. Furthermore, the interchange (i.e., Songchoo IC) located in the segment often causes unstable traffic flow due to heavy weaving traffic. Along the westbound travel direction, station 3620 is located immediately downstream of the Howon IC, stations 3621, 3622, and 3624 are located within the Sapaesan Tunnel, and station 3633 is located between the Sapaesan Tunnel and the Songchoo IC. The corridor was selected for this proof-of-concept evaluation owing to the availability of high-resolution sensor data covering the entire segment.
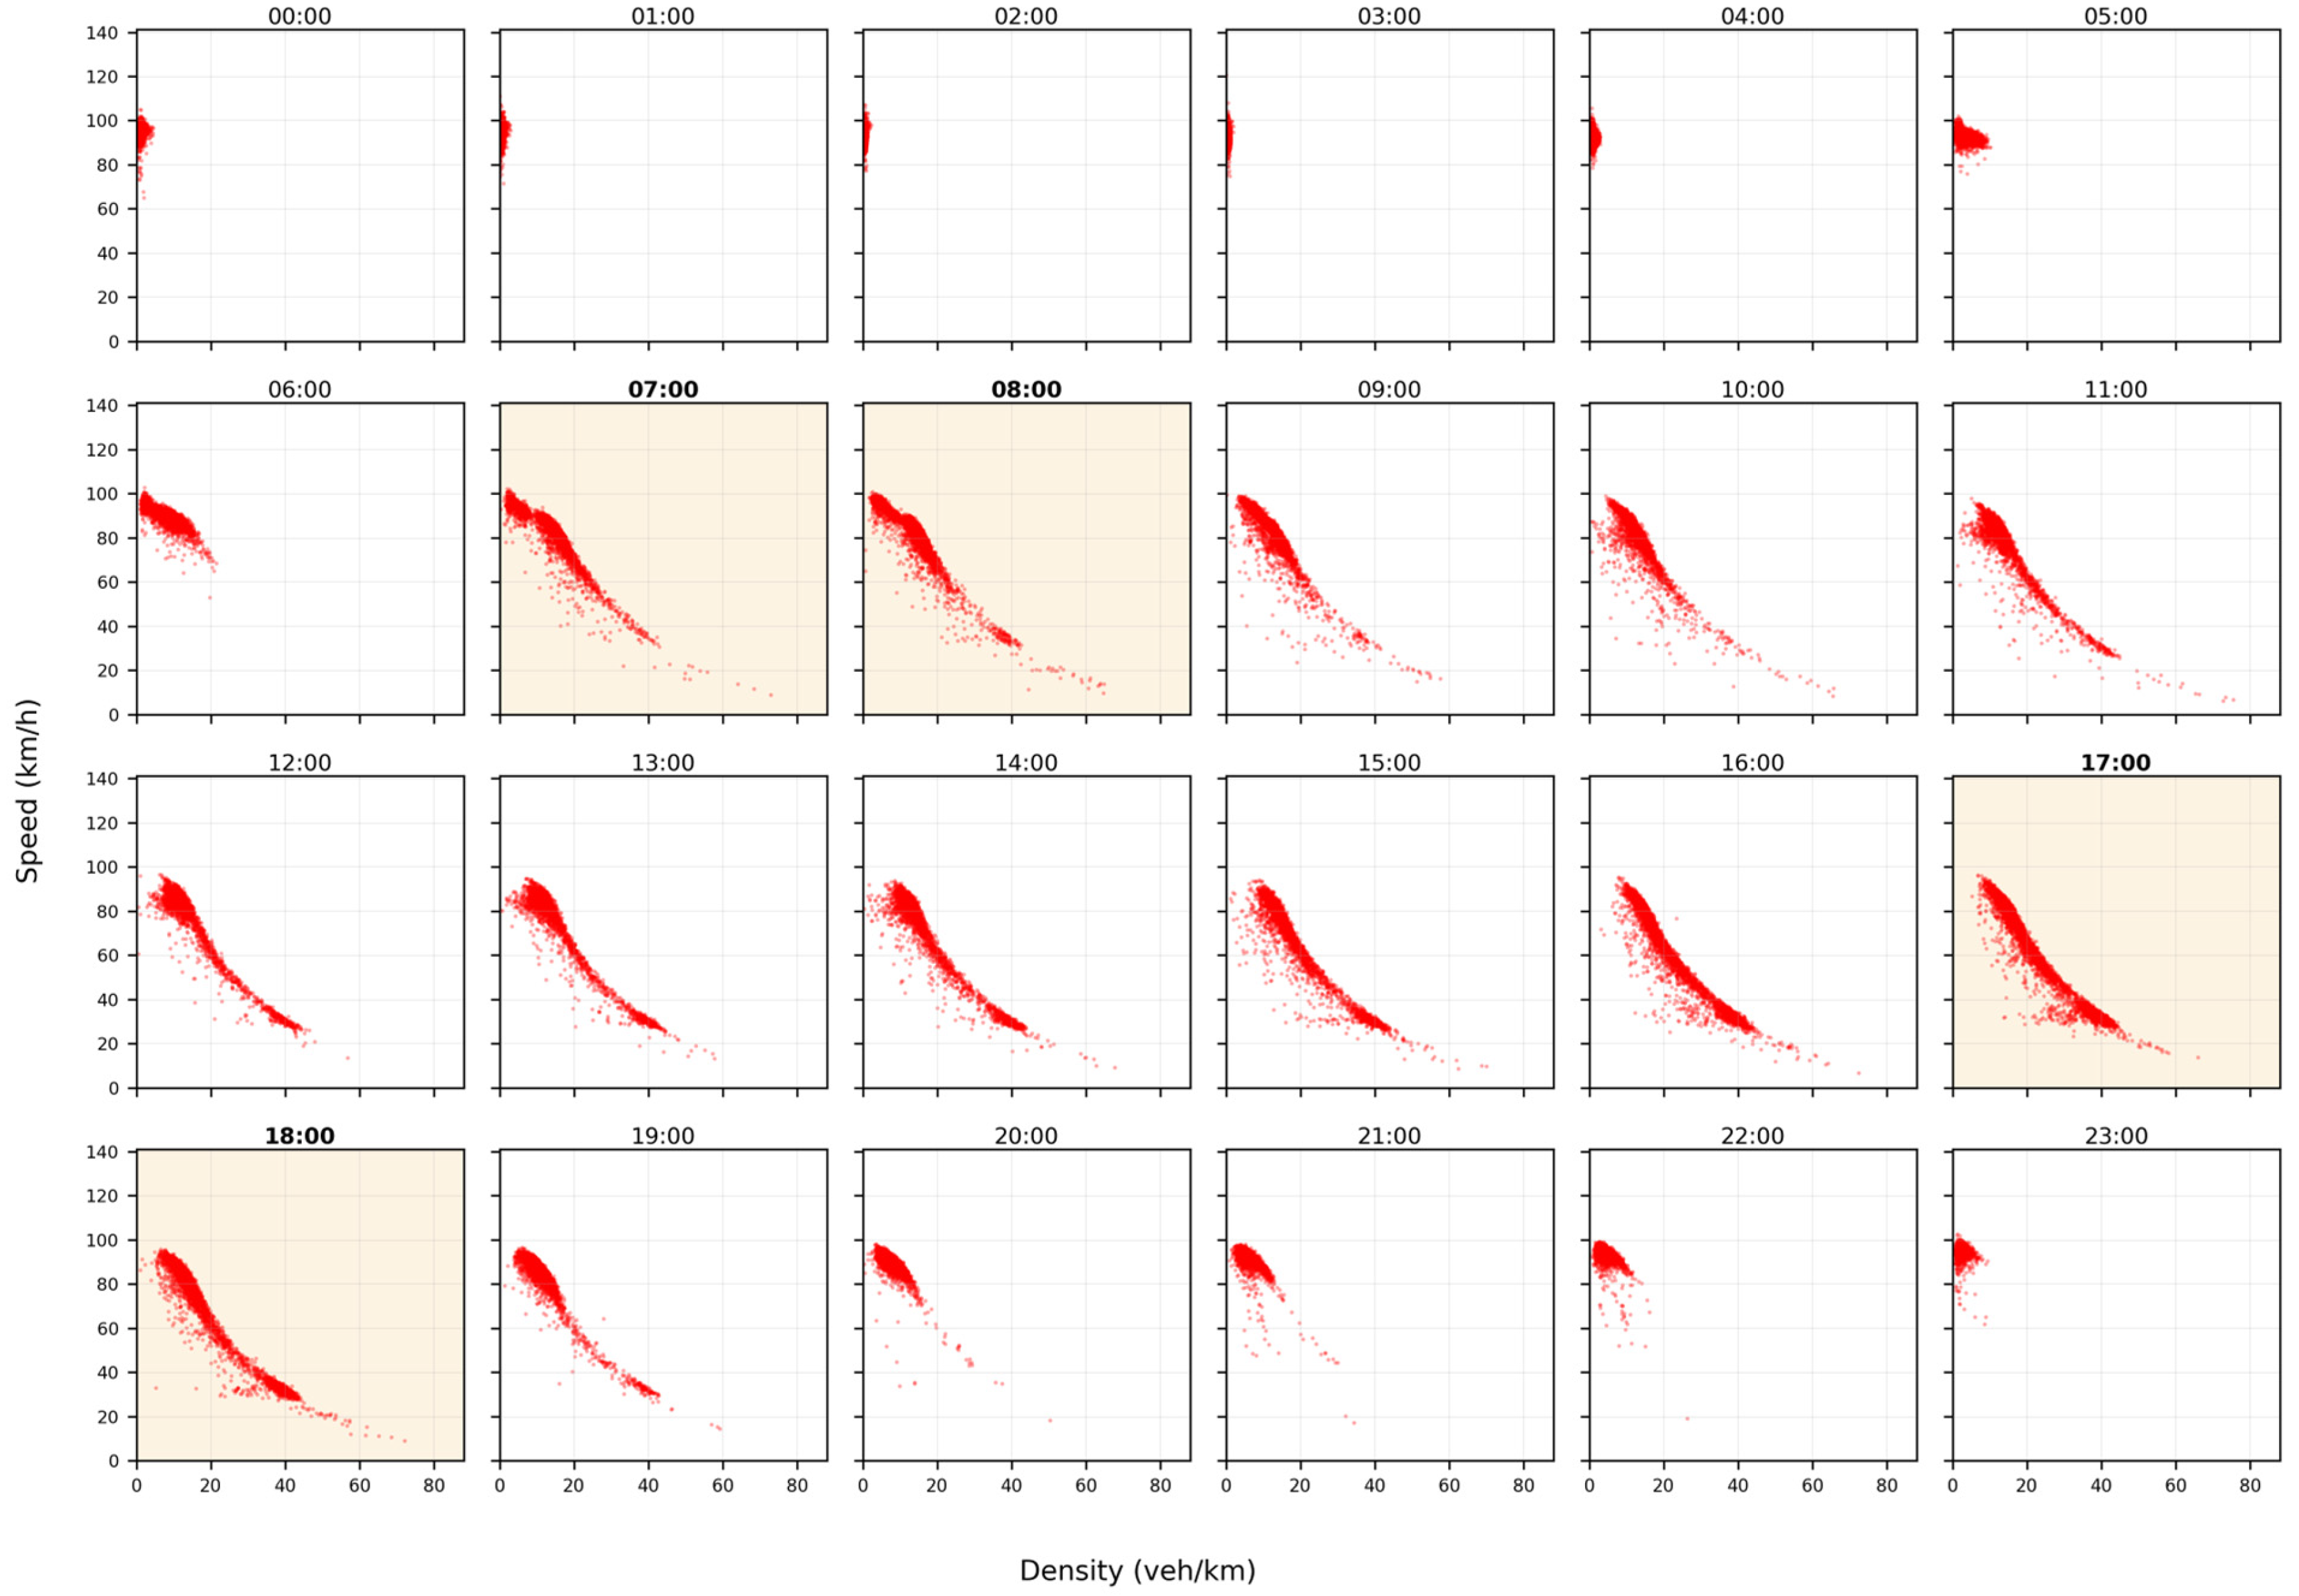
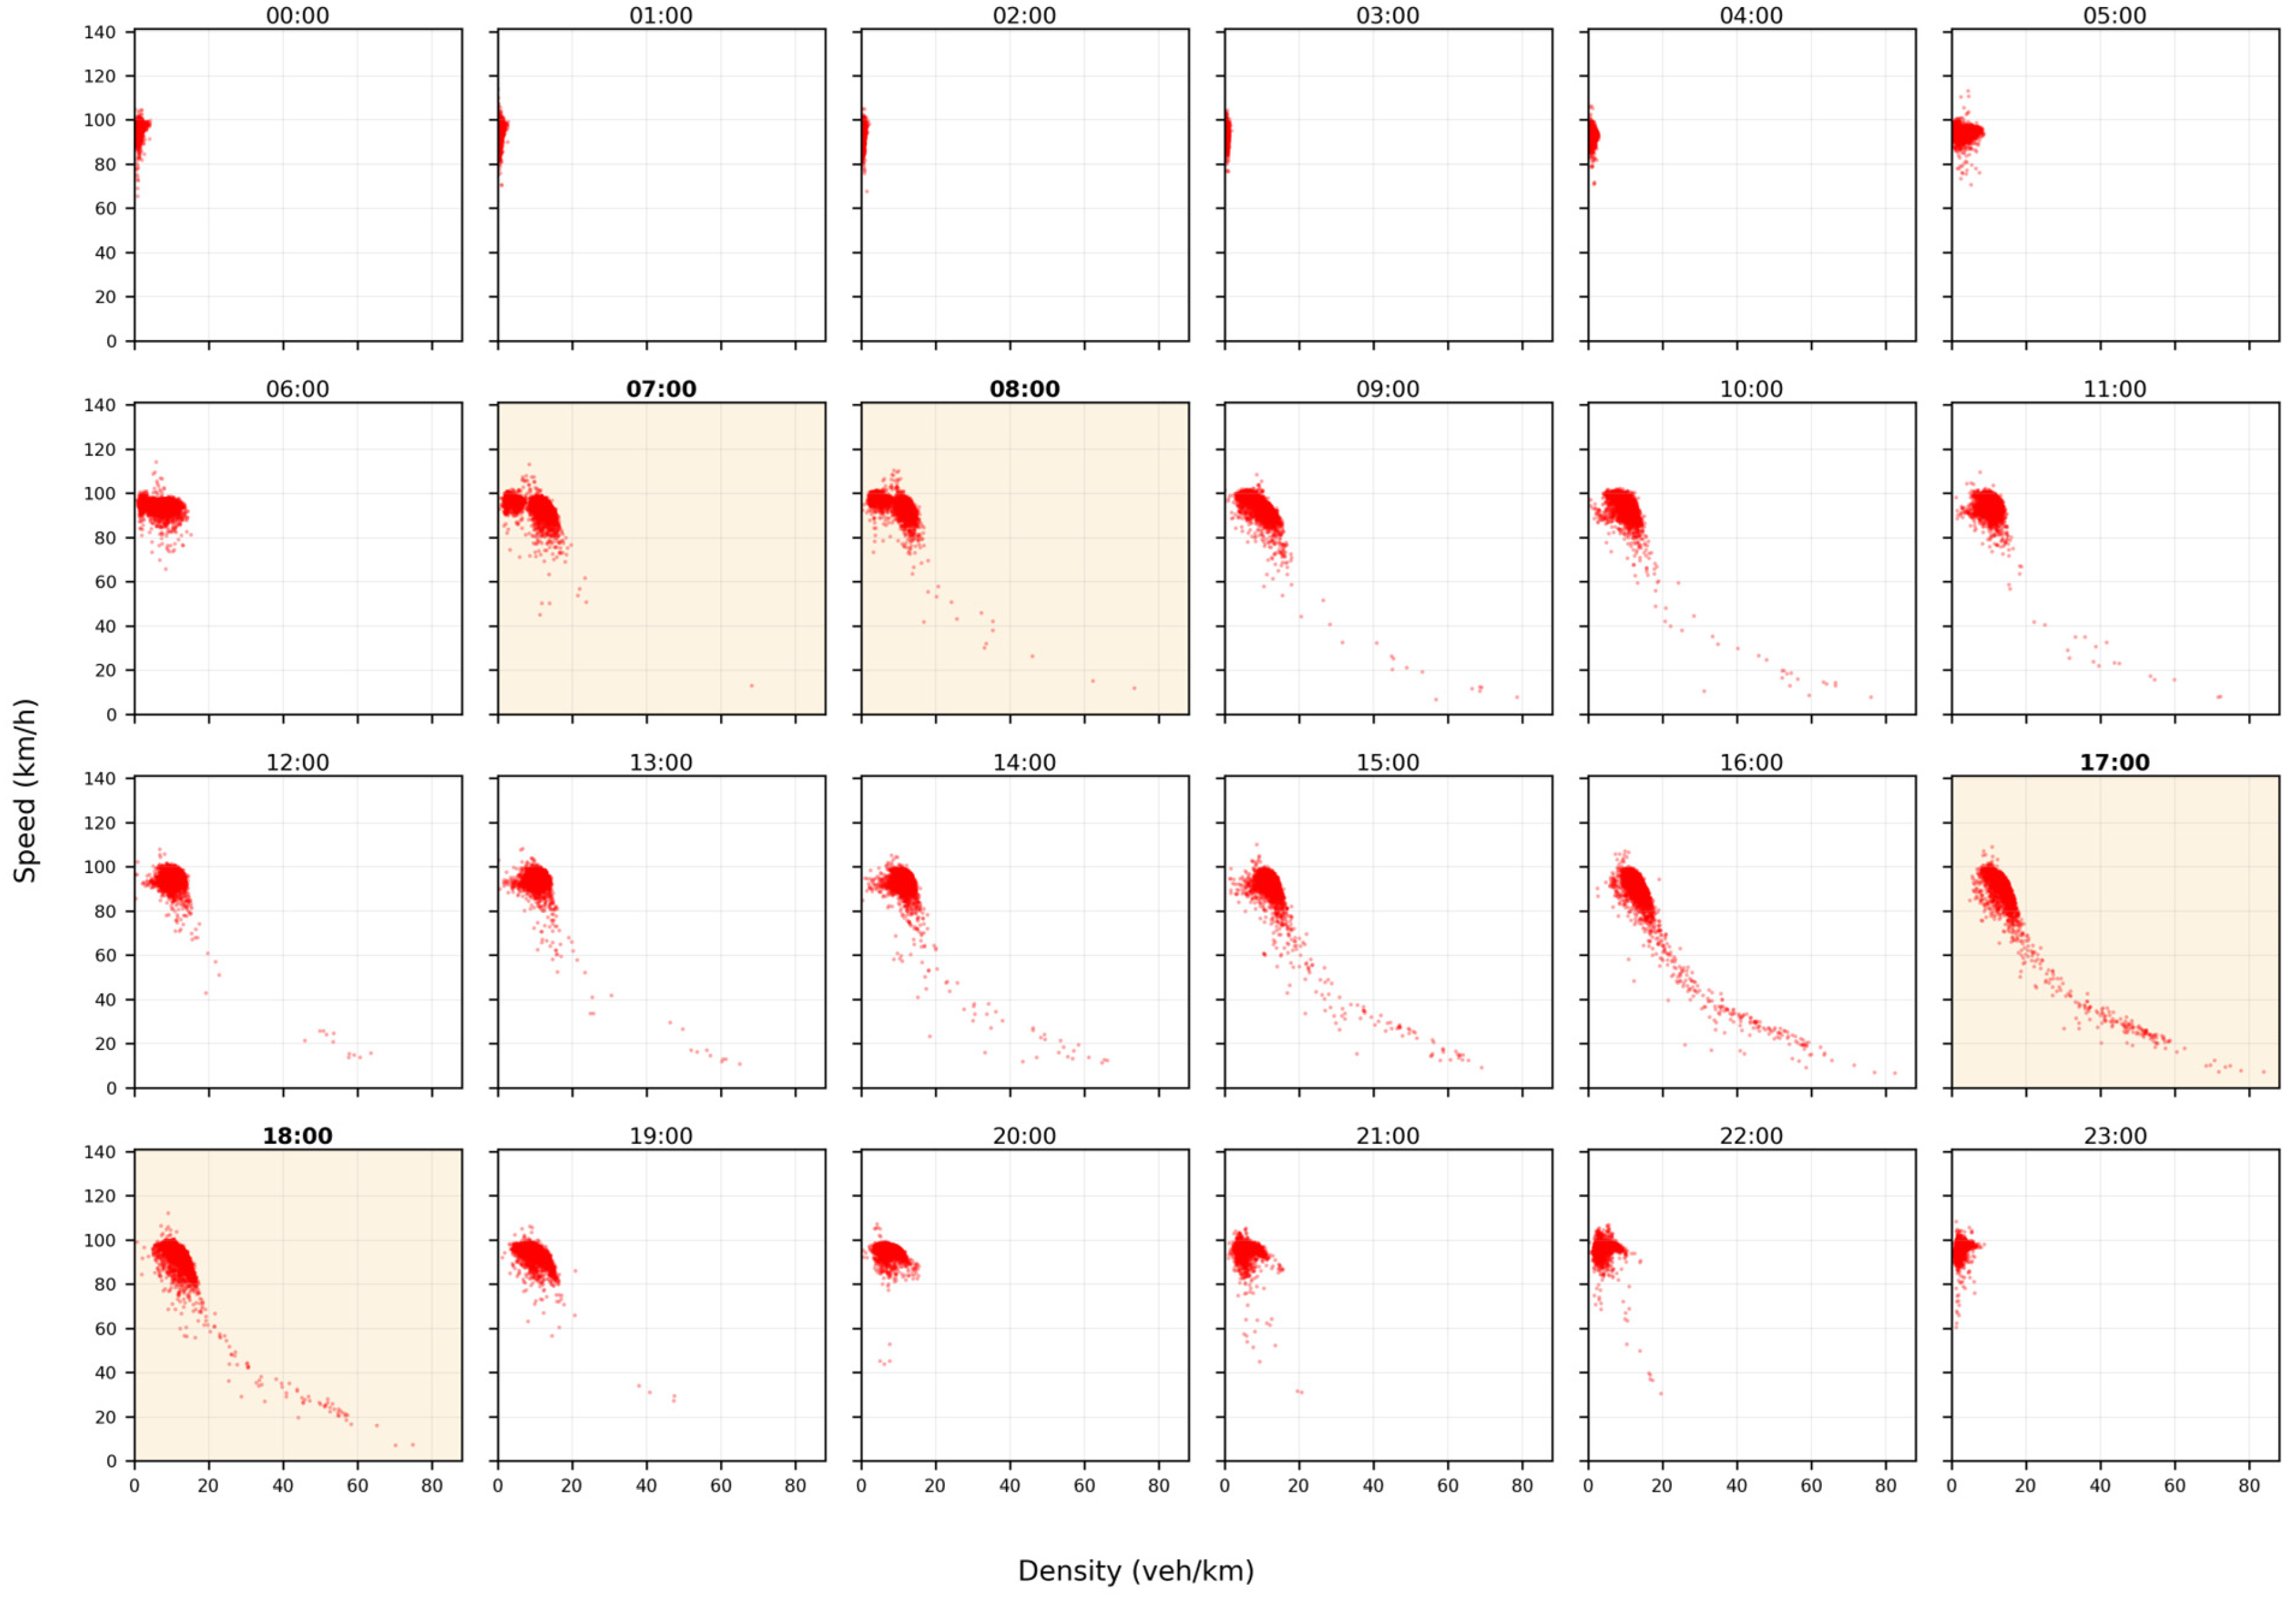
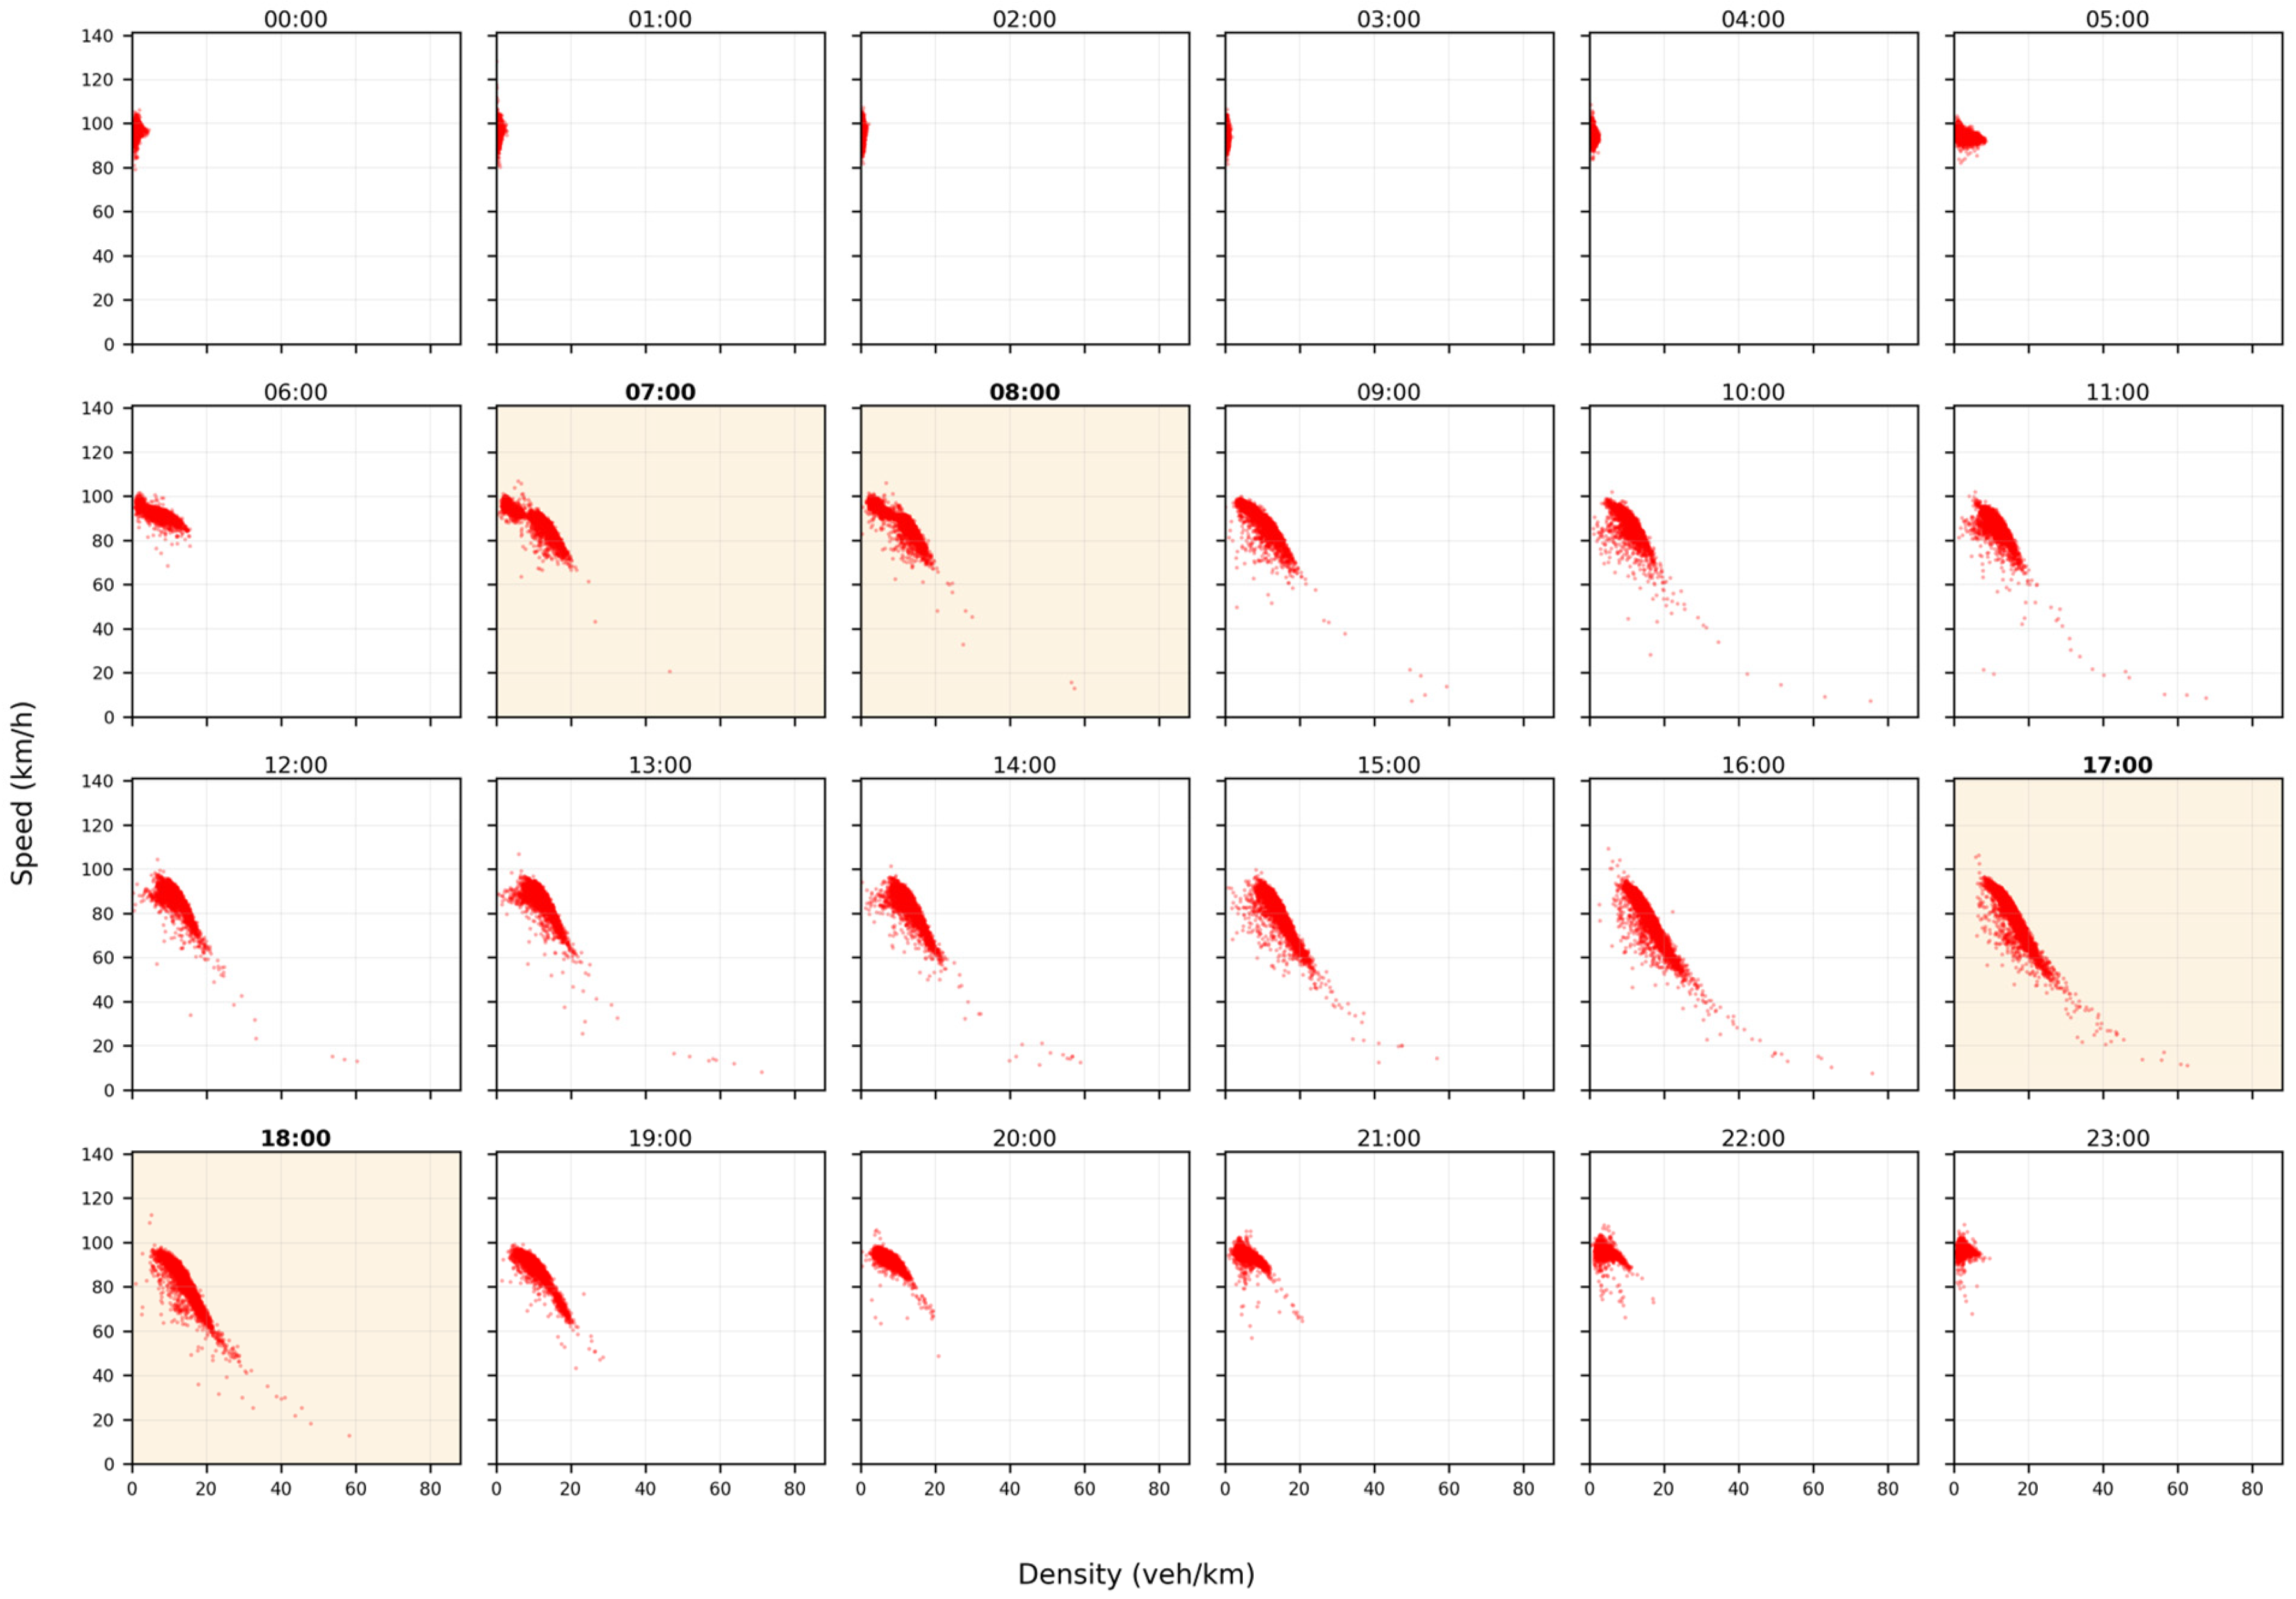
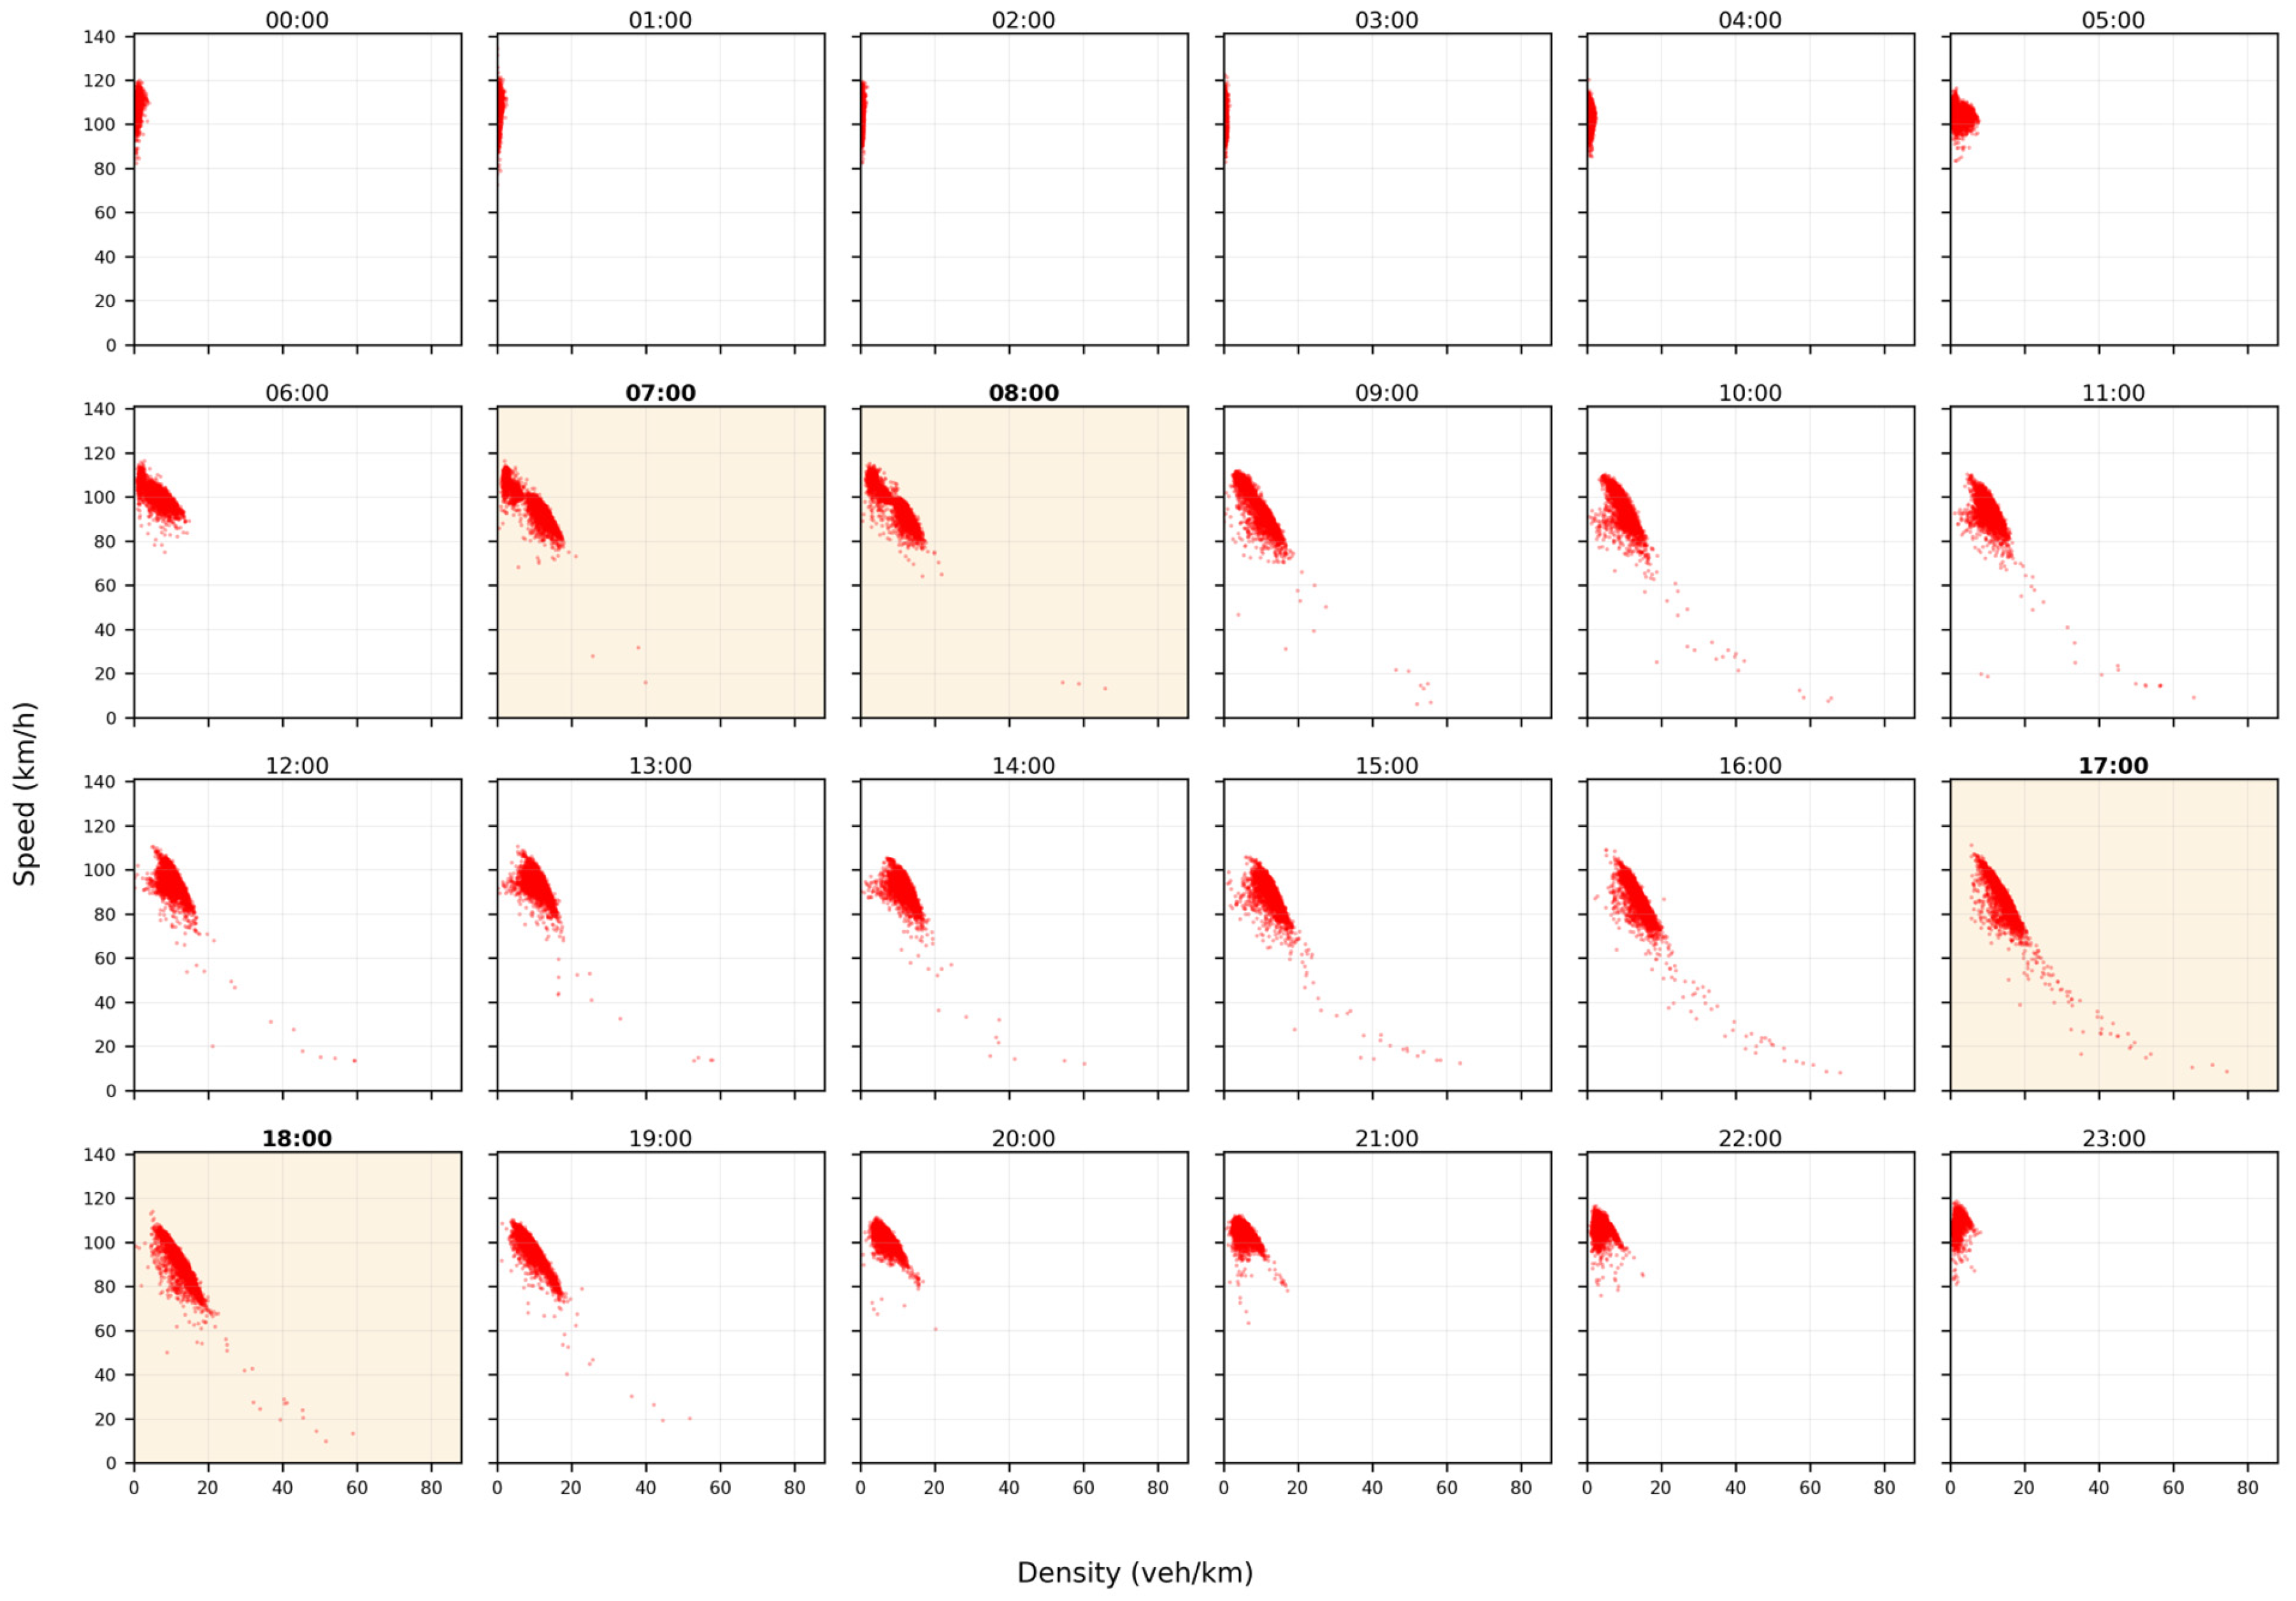
This study employs 15 min interval traffic data collected from each data collection station over a period of 6 months from 1 January 2022 to 30 June 2022. The data is obtained from the data portal of Korea Expressway Corp. The data collection stations capture traffic count (q in veh/hour), speed (u in km/hour), and occupancy (o in %). Thus, density (k in veh/km) is estimated using the fundamental equation. Figure 3, Figure 4, Figure 5 and Figure 6 display hourly speed–density plots, in which each panel aggregates the corresponding 15 min observations, from four selected locations over 24-h: Sapaesan Tunnel (Station ID 3622), Songchoo IC (Station ID 3634), 1st Nogosan Tunnel (Station ID 3638), and 2nd Nogosan Tunnel (Station ID 3645). It is noted that the shaded panels in each figure indicate peak periods (i.e., 7–9 a.m. and 5–7 p.m.). Compared to Nogosan Tunnels (1st and 2nd), as shown in Figure 3 and Figure 4, traffic flow in the Sapaesan Tunnel and Songchoo IC during peak hours (i.e., 7~9 a.m. and 5~7 p.m.) appears slightly unstable. This unstable traffic likely results from upstream shockwaves caused by merging and diverging traffics in and around Songchoo IC.
For model training and evaluation, the dataset was divided temporally. The 15 min interval traffic data collected from 1 January to 30 June 2022 (i.e., 181 days), corresponding to 295,392 observations (=181 days × 96 intervals/day × 17 sensor stations), were used to train the PINN baseline. The data collected on 1 July 2022 (i.e., 1632 observations) were held out entirely from training and used to evaluate the NRC detection performance reported in Section 5. The data were obtained from the open data portal of the Korea Expressway Corporation, which publishes traffic measurements from the permanent detection stations along the corridor, and no additional processing was applied beyond the density estimation described above.

5. Results

Table 2 summarizes the parameters that were used to build the final model. Physics weight is a parameter used to balance the impact of the physics part of PINN to the model training. The physics samples parameter is the number of data points for time, t, and location, x, that are used to randomly choose physics inputs to calculate the physics loss. Depending on how to combine both physics weight and physics samples, the performance of PINN varies. For instance, limited physics samples with very small physics weights would likely cause the PINN model to ignore the physics part, resulting in a final model that would resemble a pure neural network model. On the other hand, excessively large physics samples with relatively high physics weight might cause the model to focus more on the physics part, which could result in the final model lacking a neural network nature.
As aforementioned, this research employs a two-regime traffic state framework for the physics part of PINN: (1) Underwood model for heavy traffic state and (2) Greenshields model for low–moderate traffic state. Through an in-depth data analysis, 17.0 veh/km is identified as the density threshold for distinguishing between heavy and low–moderate traffic state regimes. Furthermore, the jam density and the optimal density are also estimated by using a curve-fitting technique, as shown in Table 1. Likewise, the free-flow speeds for both models are also estimated to be 97.1 km/h and 144.8 km/hour for the Greenshields model and Underwood model, respectively.
The parameters in Table 2 were determined in two groups through a calibration process. The traffic stream parameters, including the jam density, the optimal density, and the free-flow speeds of the two regimes, were calibrated by least squares curve fitting of the two-regime fundamental diagram to the six-month speed–density observations, and the density threshold separating the two regimes (i.e., 17.0 veh/km) was identified from the observed transition in the speed–density relationship. It should be noted that the fitted free-flow speed of the Underwood model (i.e., 144.8 km/h) exceeds that of the Greenshields model (i.e., 97.1 km/h) because, in the Underwood formulation, the free-flow speed is a curve-fitting parameter obtained by extrapolating the congested regime data to zero density rather than an observable travel speed, and values exceeding the physical free-flow speed are typical when the model is fitted to congested regime observations. The network hyperparameters, including the numbers of hidden layers and neurons, the learning rate, the batch size, the number of epochs, the physics weight, and the number of physics collocation samples, were selected through preliminary sensitivity experiments in which candidate configurations were compared based on validation loss and the stability of the physics residual during training, following the considerations described in Section 3.2.2 and Section 3.2.3.
All experiments were conducted on a workstation equipped with an Intel Core Ultra 9 285 CPU (24 cores), 64 GB of memory, and an NVIDIA RTX PRO 6000 GPU, running Ubuntu 24.04 with PyTorch and CUDA 13.0. Training the final model (i.e., 5000 epochs with a batch size of 4096 and 10,000 physics collocation samples) required approximately 5.5 h. Once trained, generating the baseline density for a new observation interval requires only a forward pass, executing in well under one second for all seventeen stations, which is negligible relative to the 15 min data collection cycle. The modest computational footprint indicates that the framework can be operated, and periodically retrained, on standard hardware available to traffic management centers without specialized infrastructure.
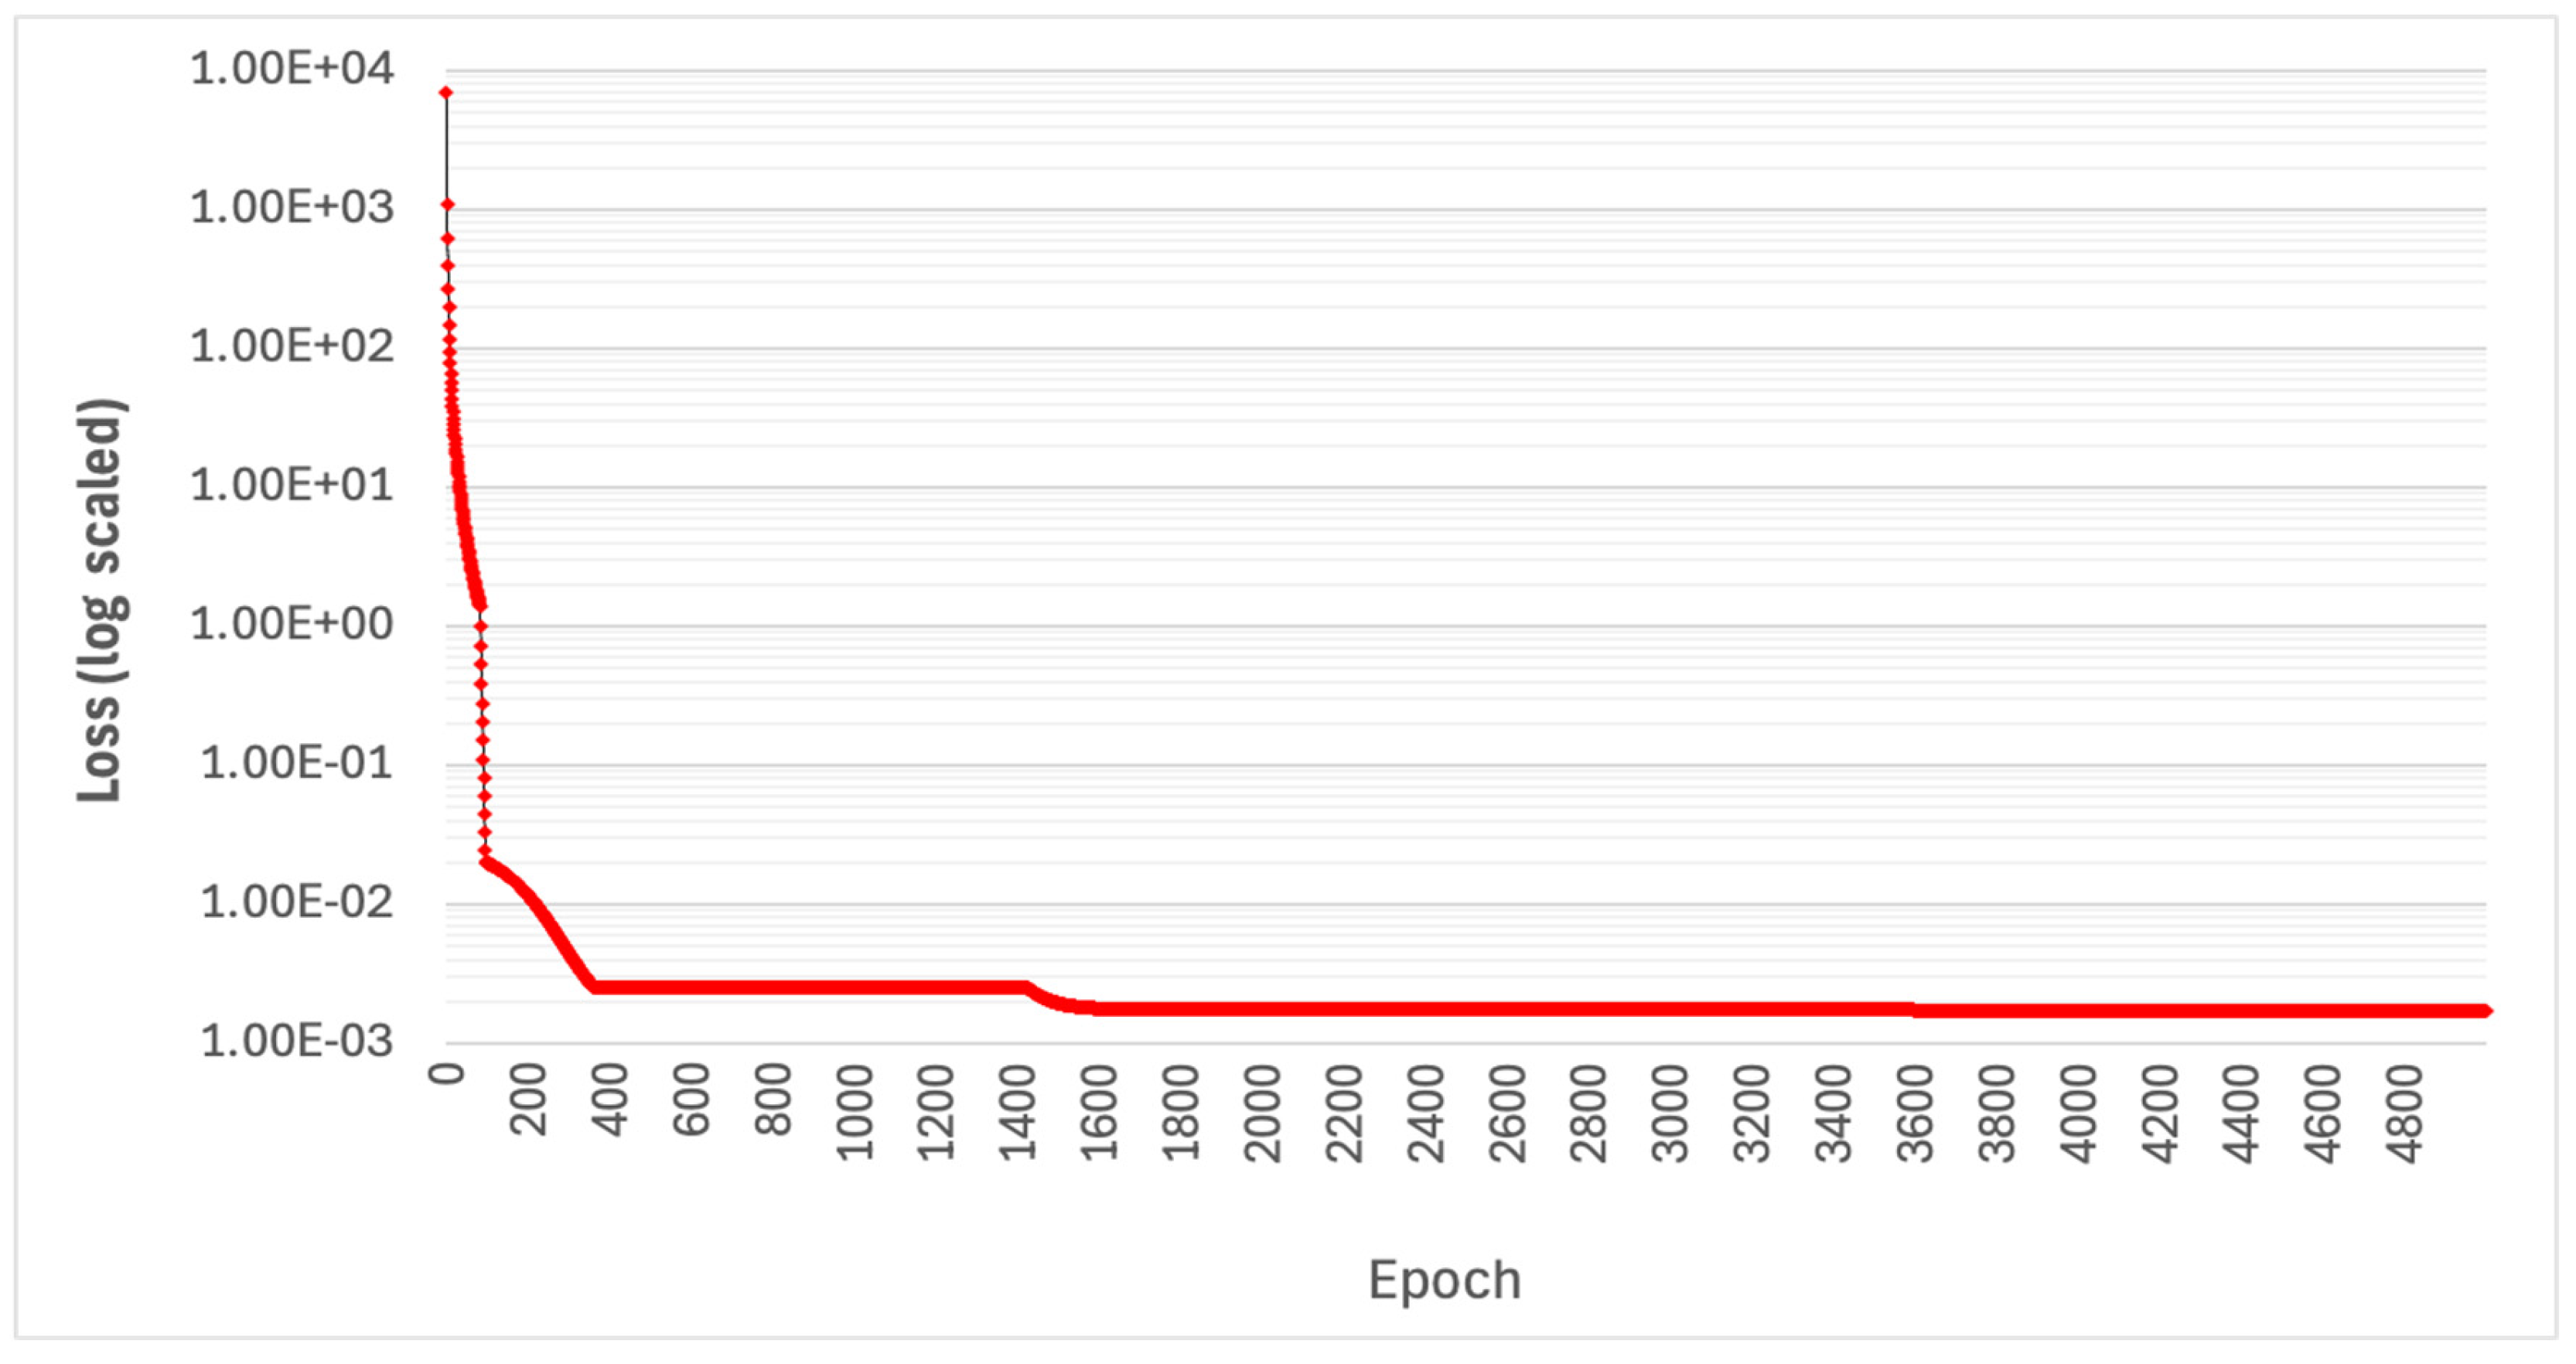
Figure 7 presents the evolution of the total loss over the training epochs. The total loss decreased rapidly during the initial stage of training, and it became stabilized well from the epoch 1623, confirming that the model remained stable throughout training rather than being optimized away.
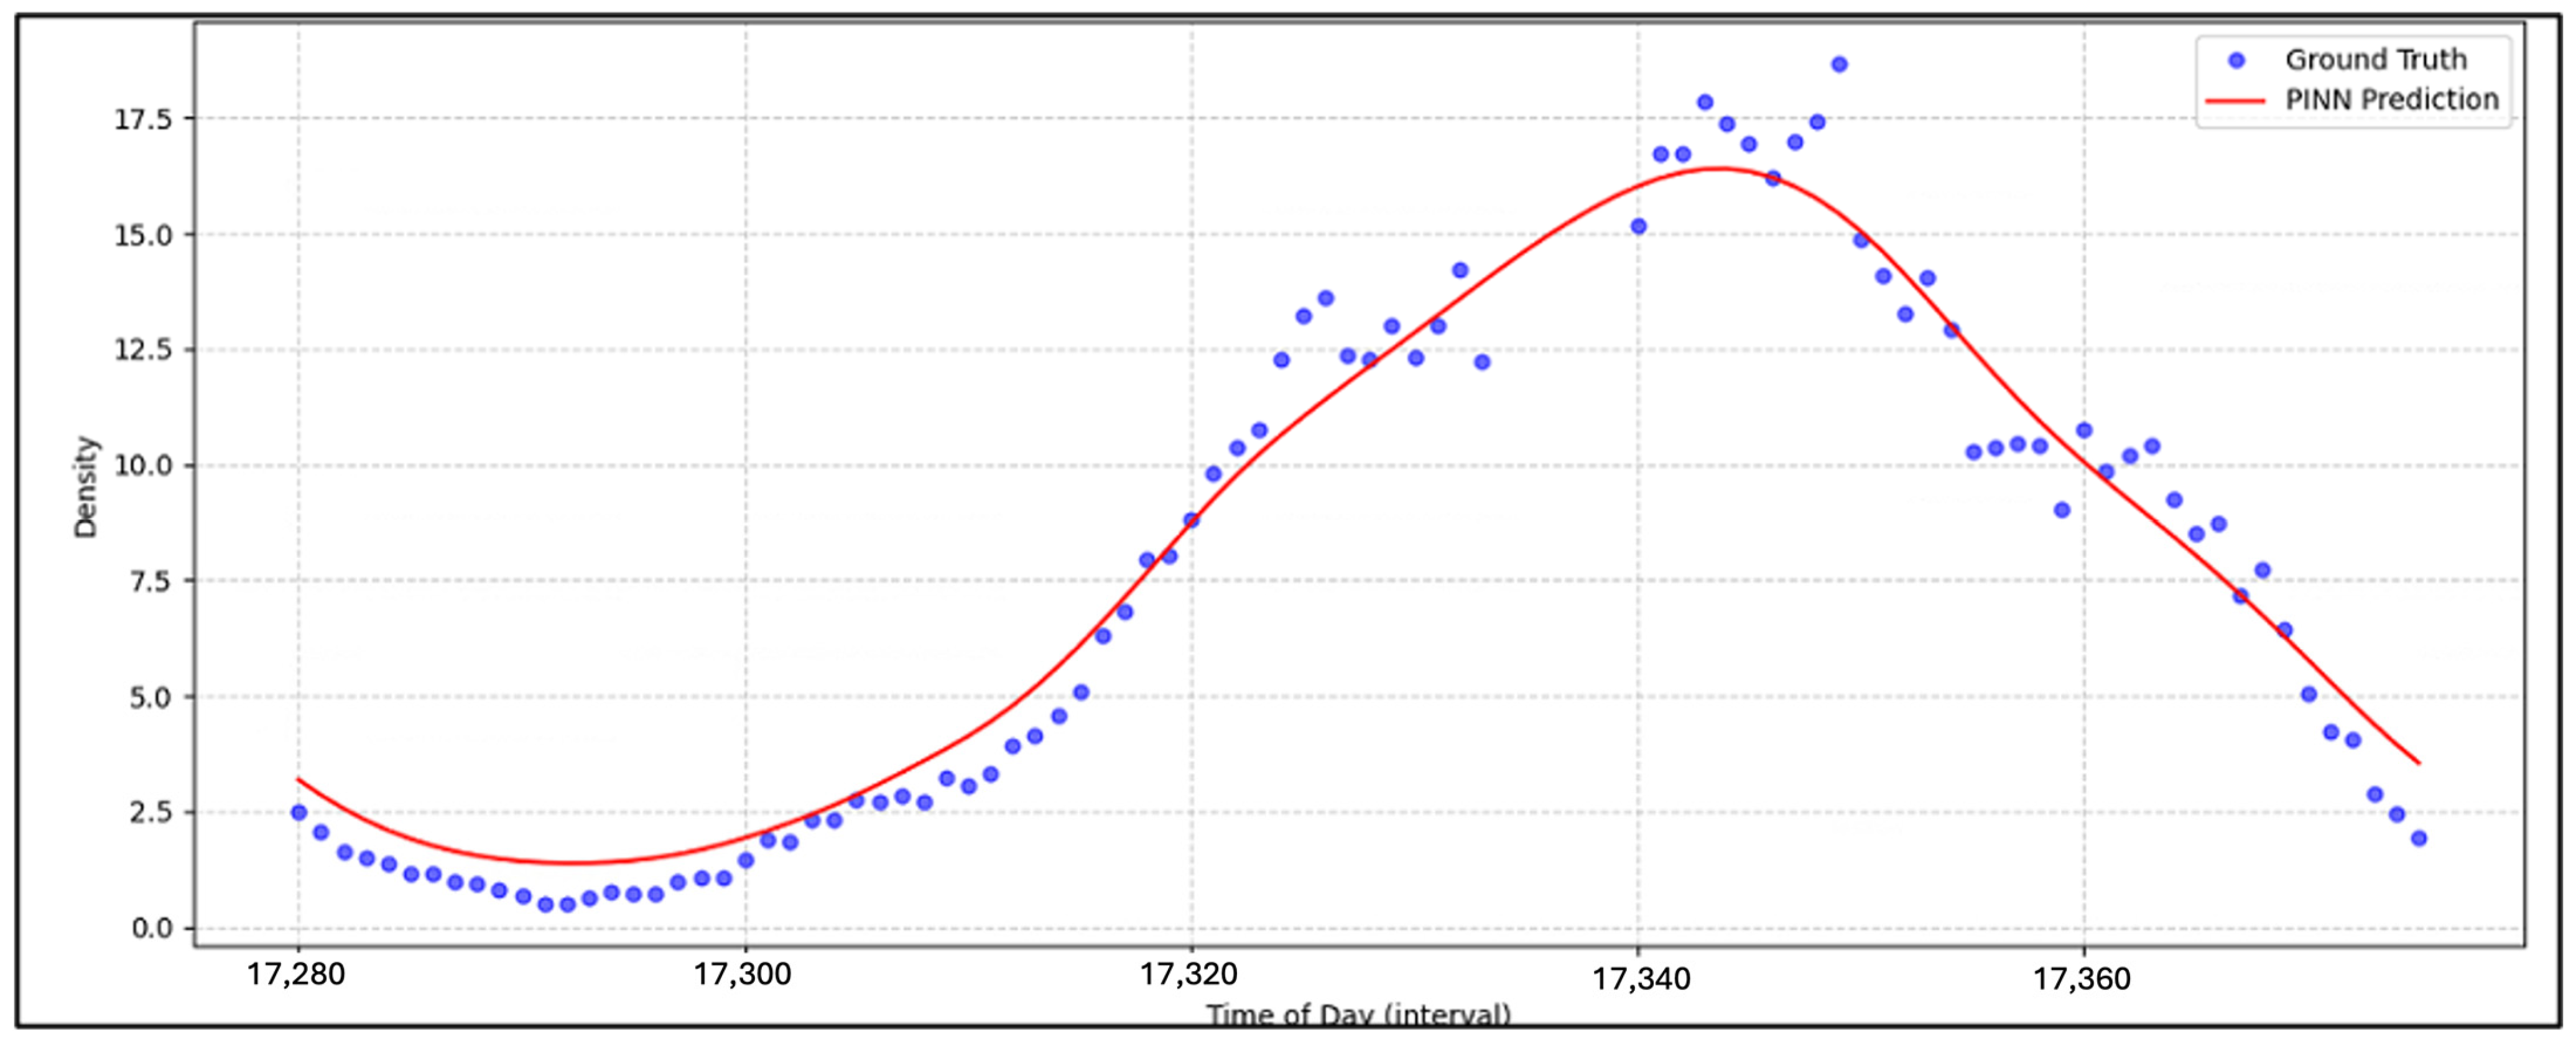
Upon the completion of the model training, the traffic data collected on 1 July 2022 (i.e., the held out evaluation day, see Section 4) are applied to predict traffic states. Figure 8 shows the 24 h density result at the sensor station located between the Sapaesan Tunnel and the Songchoo IC (i.e., Station ID 3633) obtained from the final model. The dots in blue indicate the actual density collected from the sensor and the red curve means the density predicted by the PINN model.
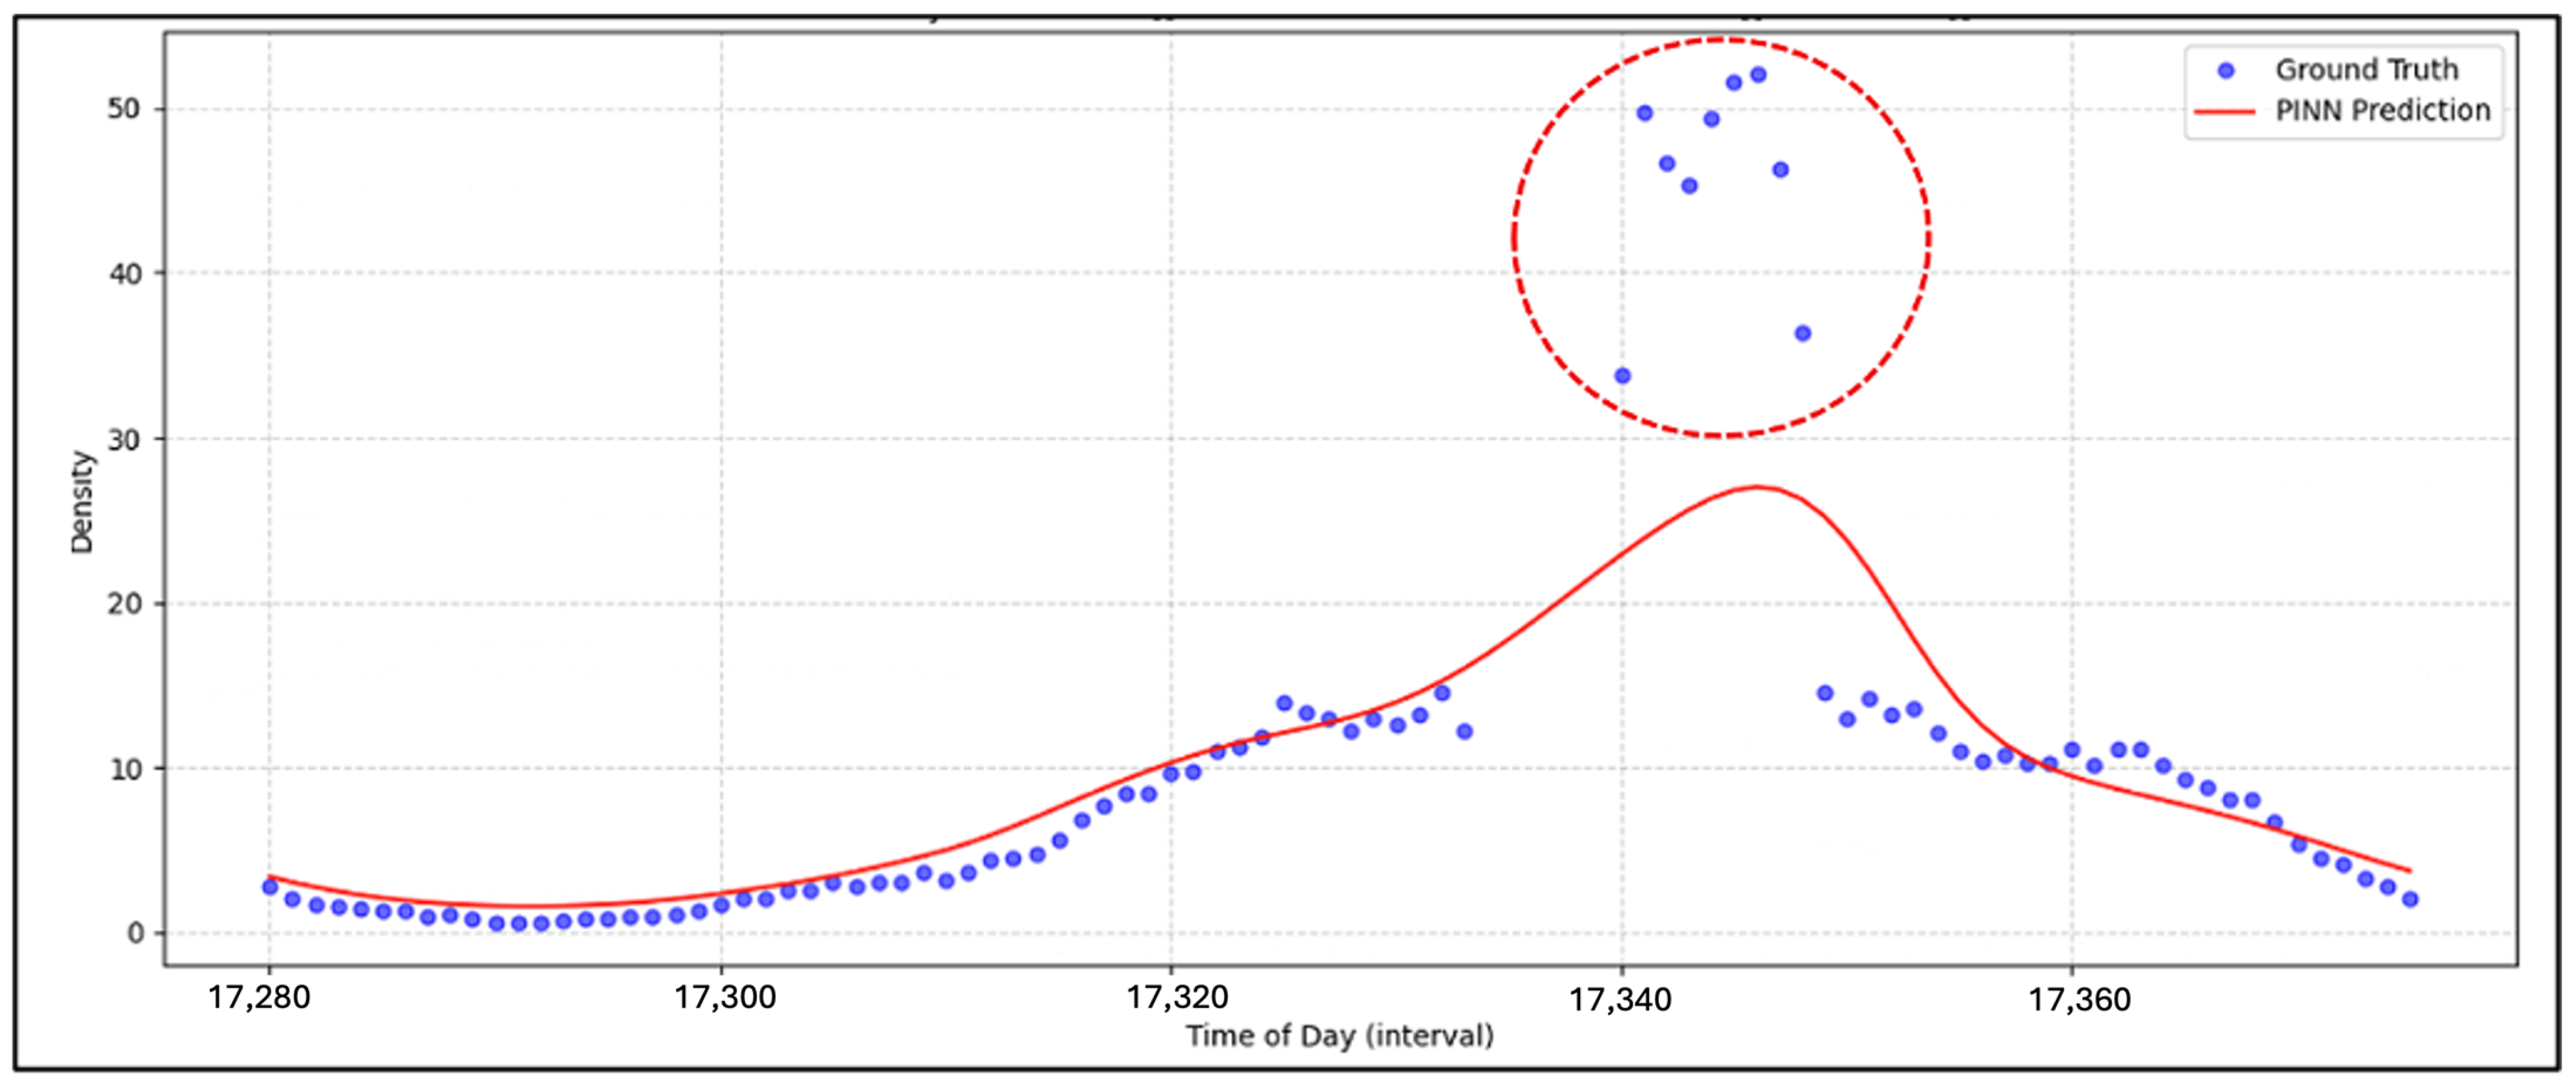
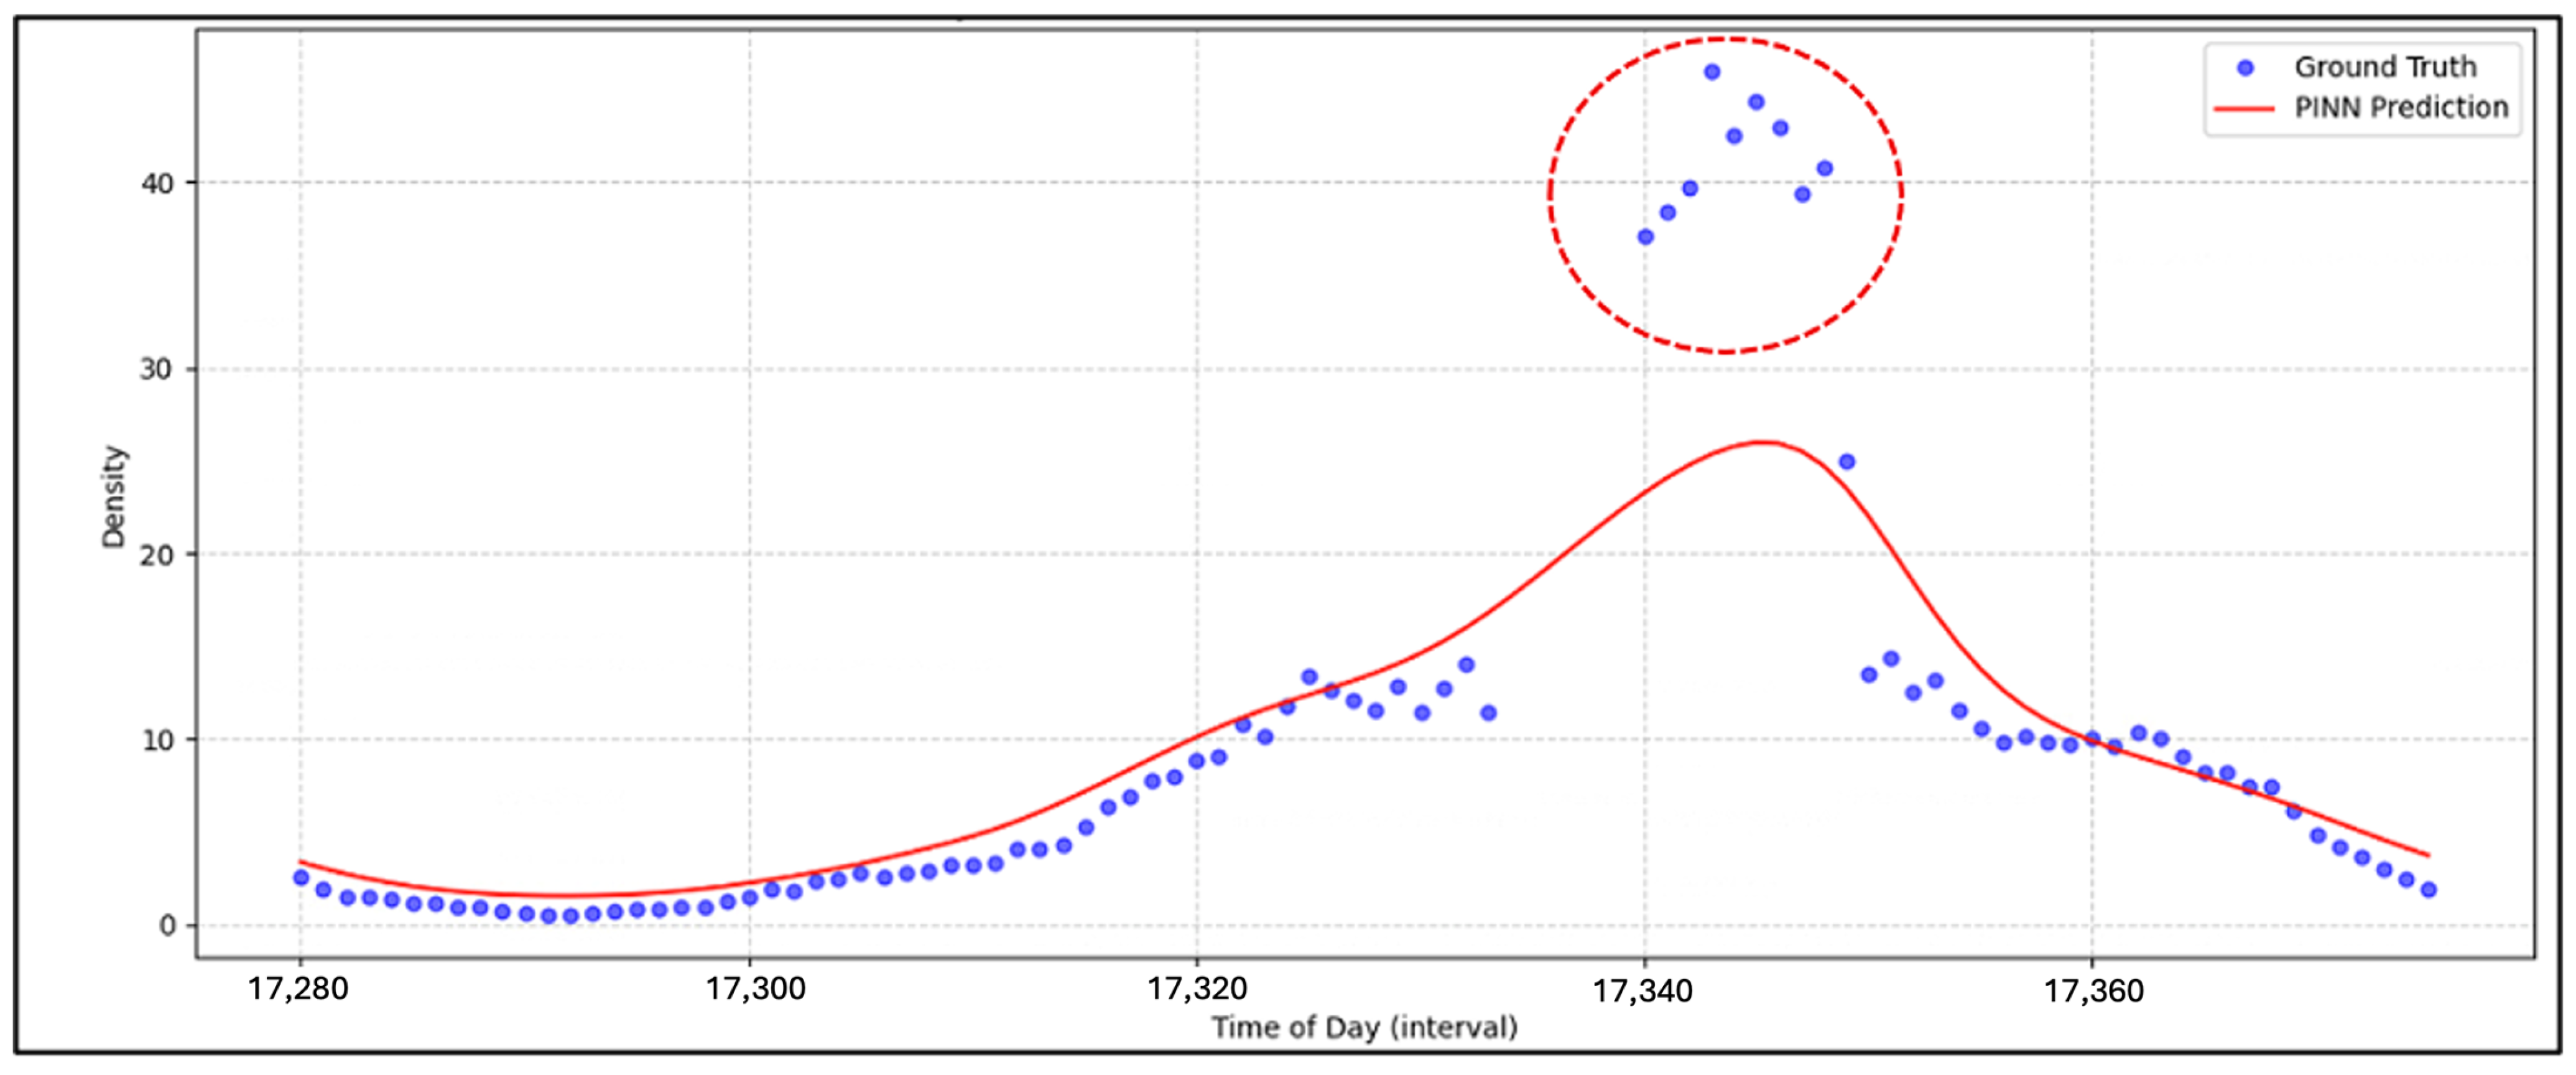
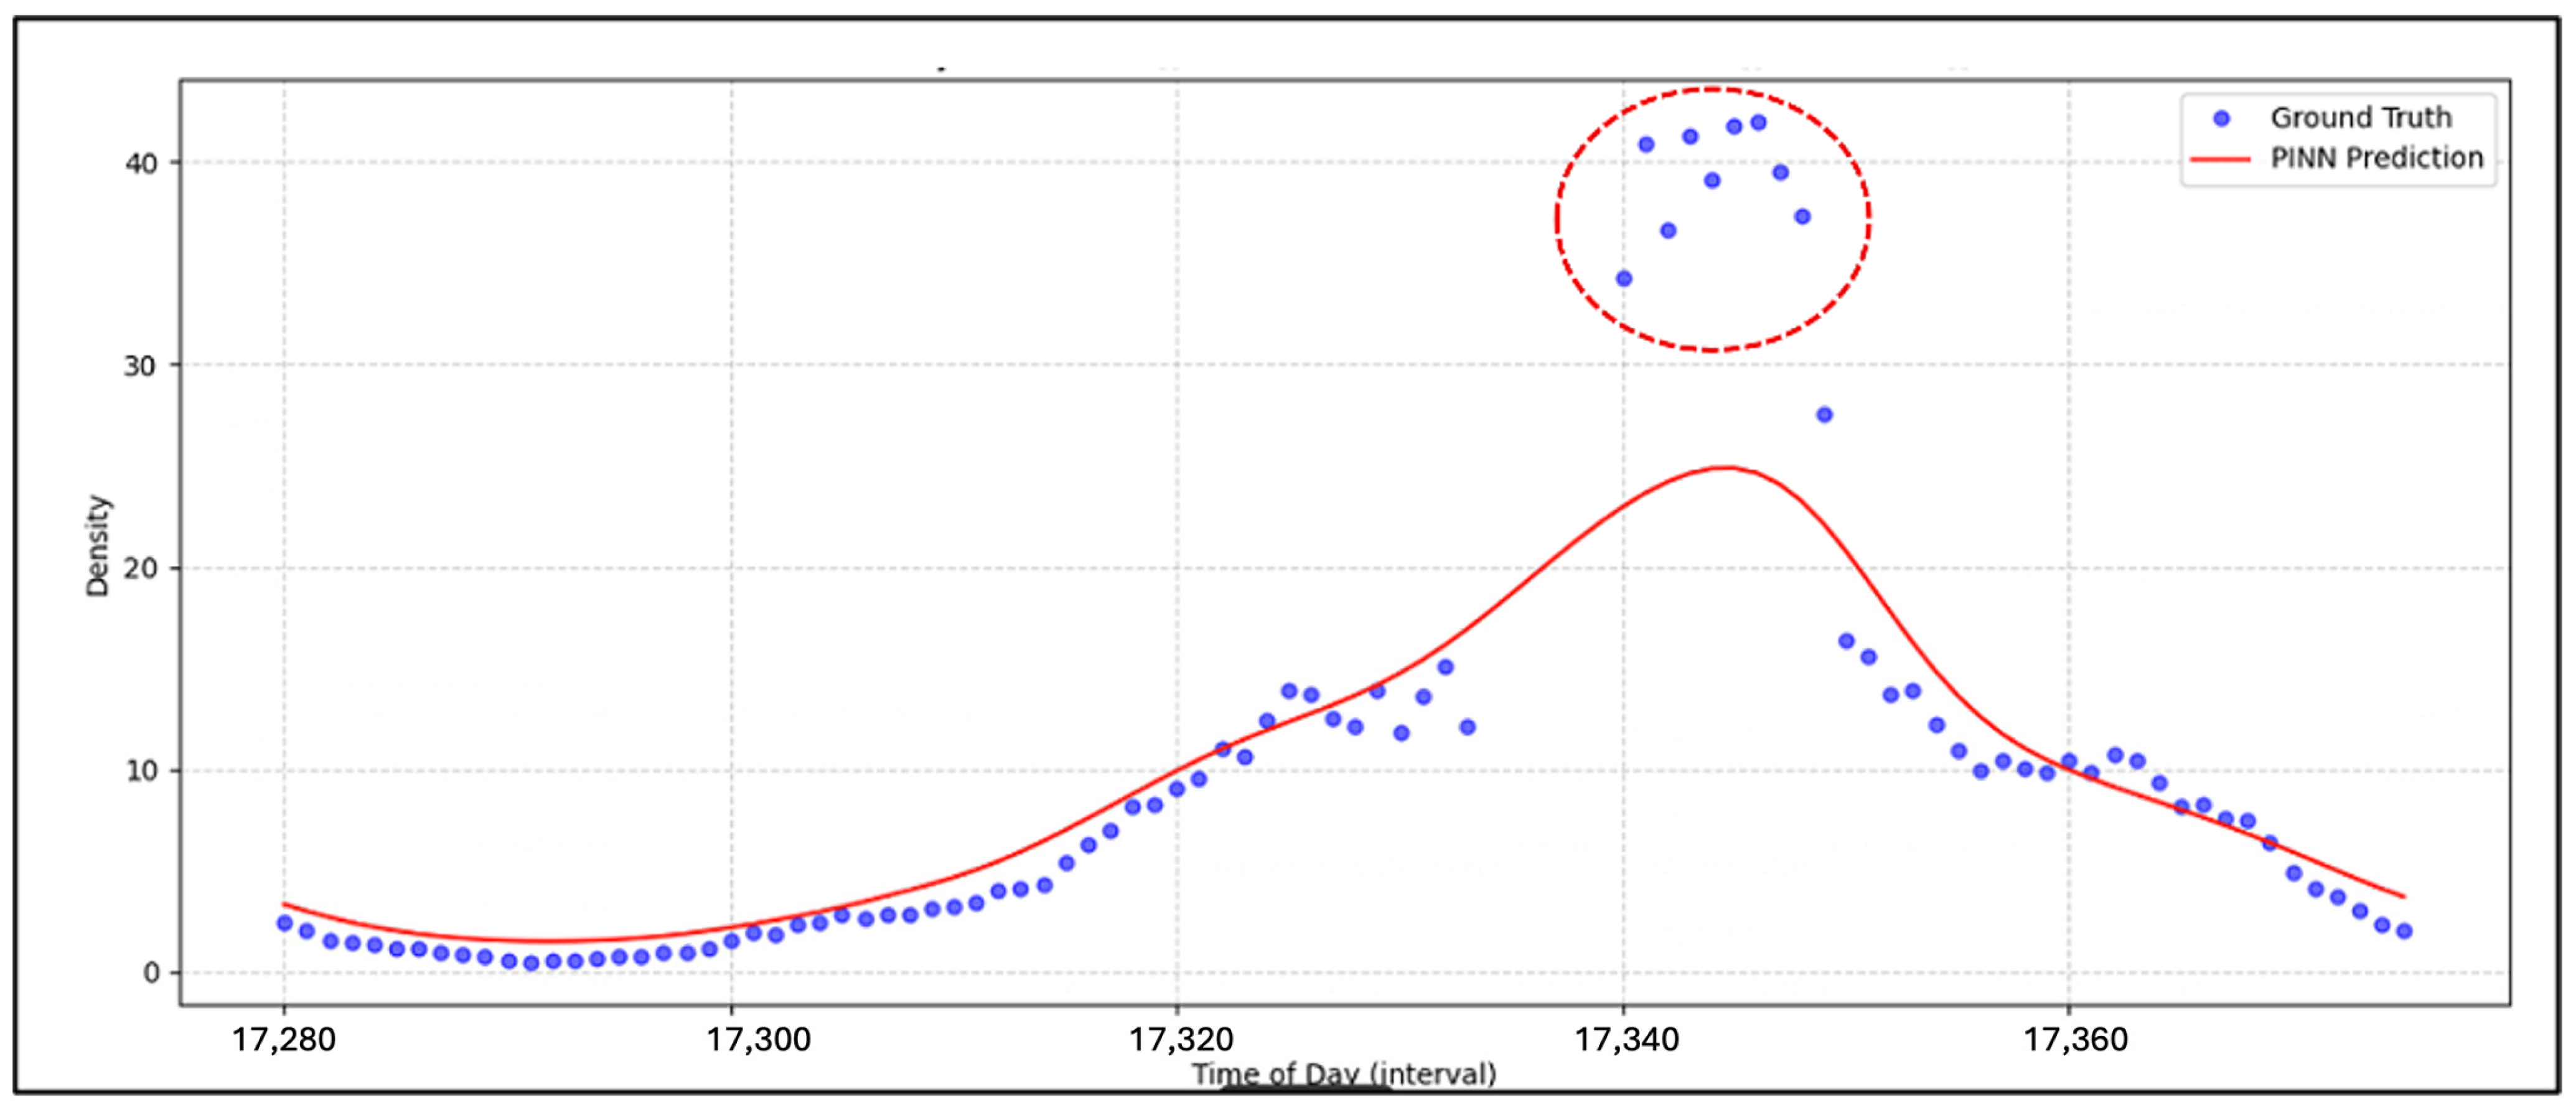
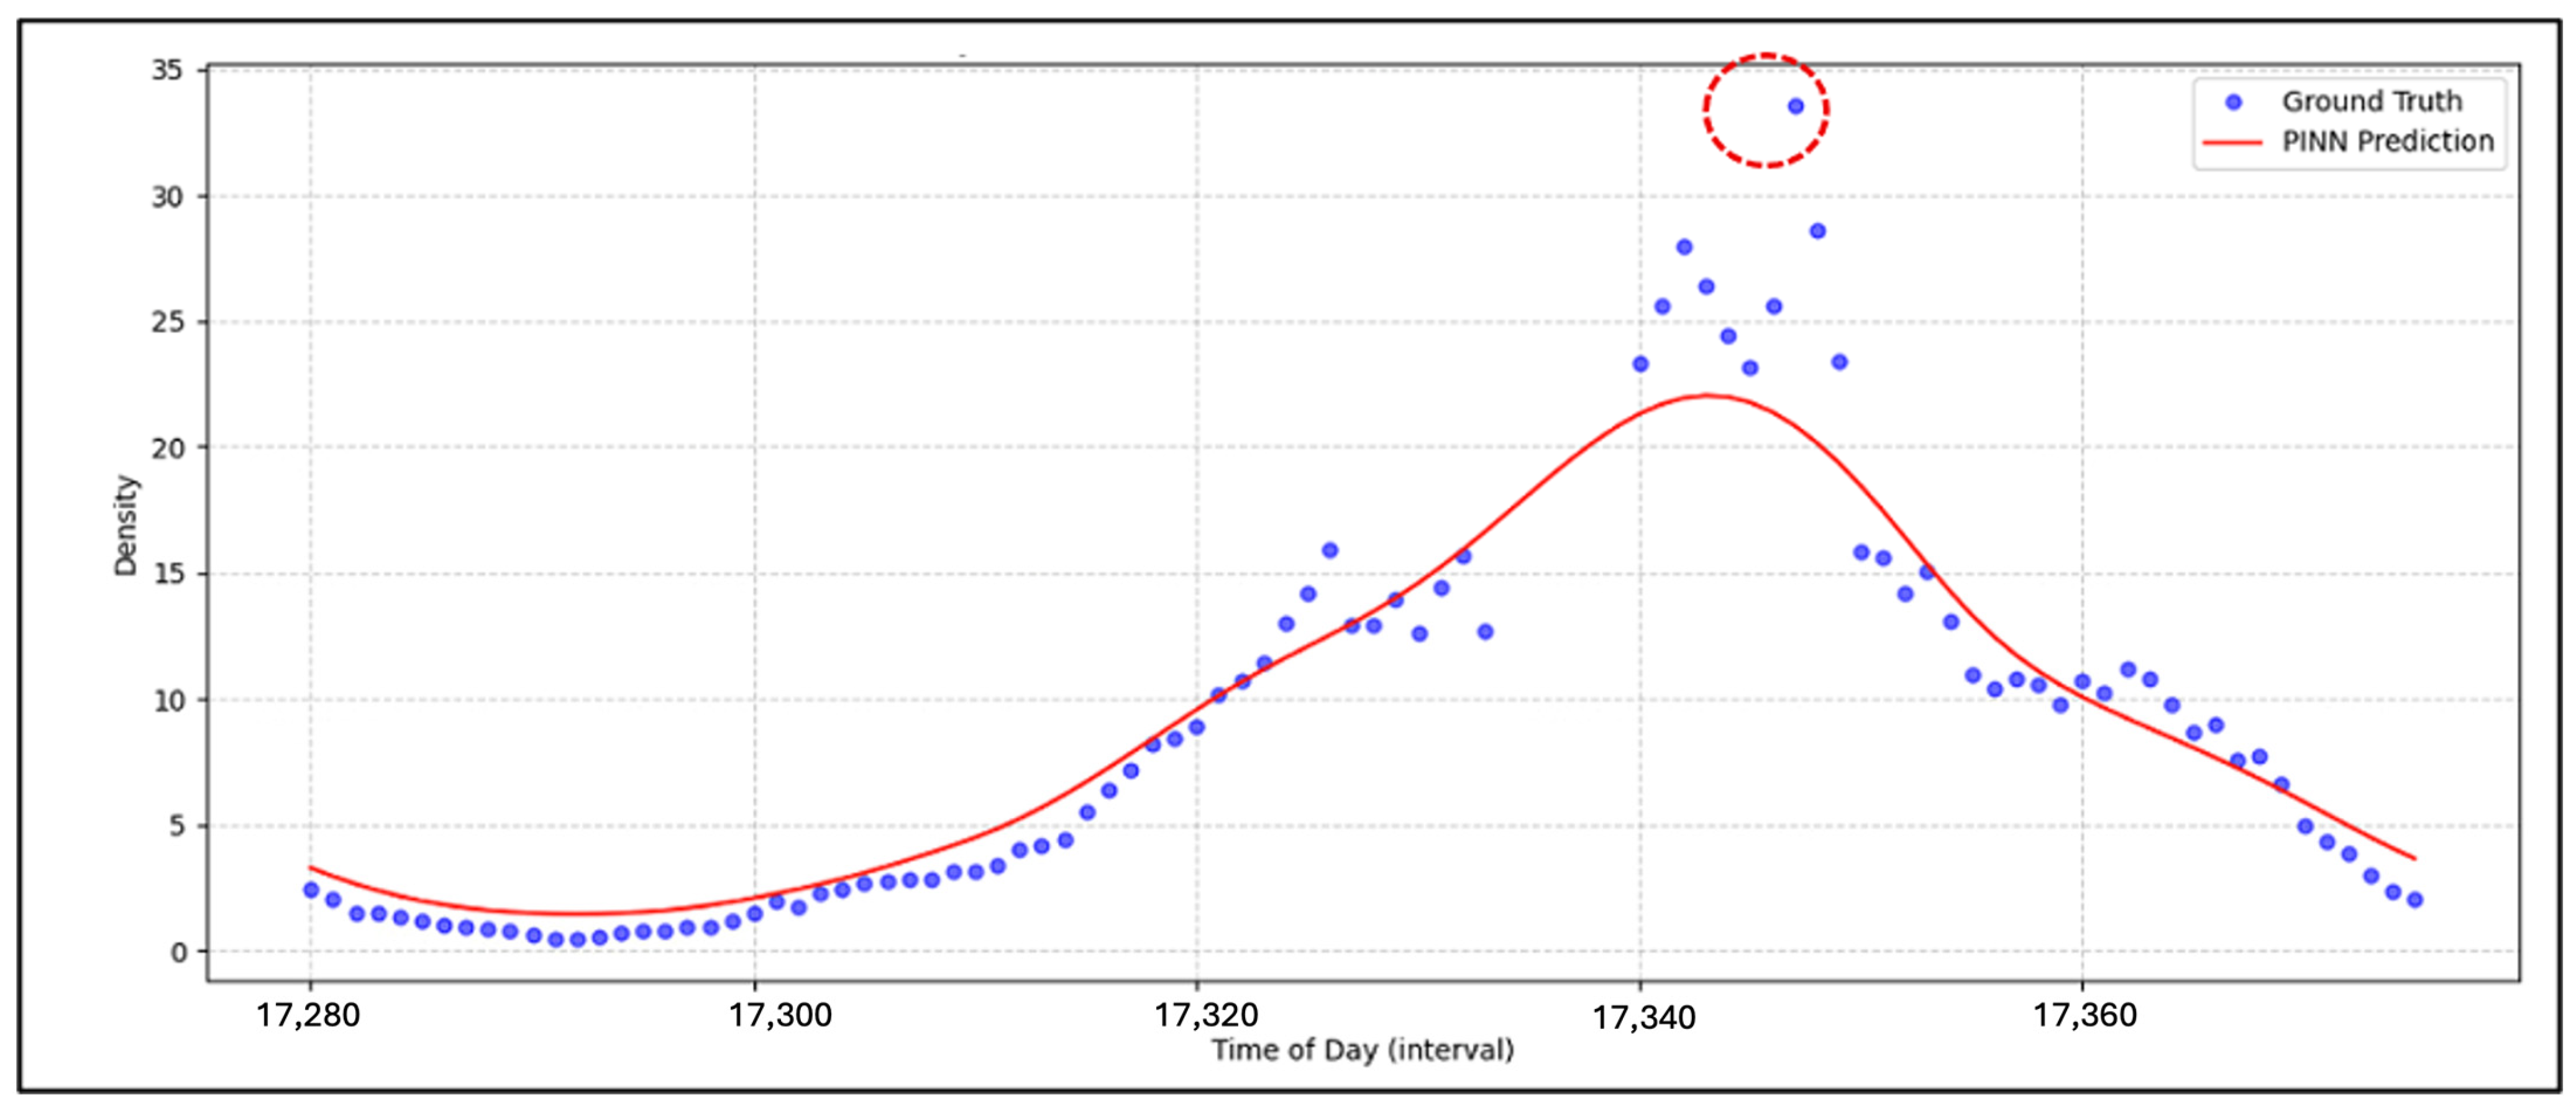
Based on the prediction results, non-recurrent congestion is identified when the traffic condition (i.e., density) recorded by the sensor exceeds the predicted model’s tolerance level (τ). In this research, the tolerance level is set at 1.5 or 150% of the predictions, meaning that if the observed density exceeds the predicted density by 50%, it is considered non-recurrent congestion. The adopted value is grounded in the fitted parameters of the fundamental diagram. Since the estimated normal peak period density ranges from approximately 22 to 27 veh/km and the fitted optimal density is 24.9 veh/km, a state flagged at this tolerance necessarily lies well beyond the capacity density, on the congested branch of the fundamental diagram, which is a physically oversaturated condition that cannot be produced by recurrent equilibrium flow. Lower tolerance values (e.g., 1.2 or 1.3) would flag states within the plausible neighborhood of the capacity point, where measurement noise and routine peak period variability reside. The magnitude is also consistent with the threshold conventions employed in the NRC detection literature [8,9] and with the multiple normal variation logic of the residual-based monitoring schemes reviewed in Section 2.4. It should be noted that the tolerance level is an operator-adjustable parameter reflecting an agency’s preferred balance between detection sensitivity and false alarms, and a formal calibration of the tolerance level against ground-truth incident records is planned as part of the expanded case study described in Section 6. Figure 9, Figure 10, Figure 11 and Figure 12 show the cases of non-recurrent congestion detected, which are marked with dashed circles.
Regarding the sensitivity of the detection outcome to the tolerance level, the detected events in Table 3 exhibit peak observed to predicted density ratios of 2.00 (station 3620), 1.92 (station 3621), 1.68 (station 3622), and 1.50 (station 3624). The three sustained events at stations 3620 through 3622 would therefore remain detected for any tolerance level up to 1.68, well above the adopted value, whereas the brief excursion at station 3624 lies at the margin of the criterion. Increasing the tolerance thus prunes marginal, short-duration excursions first while retaining the pronounced events, which is the intended behavior of the tolerance parameter; a full sensitivity evaluation at lower tolerance levels, quantifying additional detections and false alarms, requires ground truth incident records and is included in the expanded evaluation described in Section 6.
It should be emphasized that the proposed framework, as evaluated here, constitutes a proof of concept demonstrating the feasibility of physics-informed, residual-based anomaly detection, rather than a fully validated operational incident detection system; operational deployment would require the quantitative validation and calibration steps outlined in Section 6.
As demonstrated in Figure 9, Figure 10, Figure 11 and Figure 12, the proposed method successfully isolated non-recurrent incidents from the background noise of daily recurrent traffic. Excessive density increases are observed at stations 3620, 3621, and 3622 between 3:00 p.m. and 4:45 p.m. on 1 July 2022. It is worth noting that station 3620 is located immediately downstream of the Howon IC and stations 3621, 3622, and 3624 are located within the Sapaesan Tunnel (see Section 4); tunnel sections are among the locations where recurrent and non-recurrent congestion co-occur and where fixed-threshold methods struggle. The normal traffic state during this period, estimated by the model trained with the past six months of data, ranges from approximately 22 veh/km to 27 veh/km. Thus, such abnormally high density should be treated as non-recurrent traffic congestion. Table 3 summarizes the detected events, listing each event with its station, location, time window, baseline density, peak observed density, and flag status. A purely data-driven neural network lacking the physics constraint would be expected to fit such density excursions as normal patterns, consistent with the overfitting behavior documented for unconstrained models in the traffic state estimation literature [29,30,31]; a formal ablation comparison is planned as part of the expanded evaluation (see Section 6).
The detection capability demonstrated above can be explained from two complementary perspectives. From the standpoint of traffic flow theory, the two congestion types are physically distinct phenomena. Recurrent congestion arises from demand exceeding capacity at fixed bottlenecks, and the resulting traffic states, however dense, evolve along the equilibrium manifold defined by the fundamental diagram and satisfy the LWR conservation law. Non-recurrent congestion, by contrast, originates from a sudden reduction in capacity (e.g., a blocked lane or a stalled vehicle), which produces density profiles that violate the equilibrium relationship embedded in the model. Because the PINN baseline is constrained to remain on the physically admissible manifold, recurrent congestion is reproduced and thus absorbed, while capacity collapse states are unreproducible by construction and surface as large residuals. The detection signal is therefore not a statistical judgment of rarity but a physical judgment of implausibility. In the language of symmetry, recurrent congestion preserves the temporal symmetry of the daily traffic pattern and remains consistent with the conservation law, whereas a non-recurrent event breaks this symmetry locally; the anomaly score can thus be interpreted as a measure of local symmetry breaking relative to the physically symmetric baseline.
From the machine learning perspective, the physics loss functions as a strong inductive bias. It regularizes the network toward solutions consistent with the conservation law, preventing the overfitting behavior in which an unconstrained model would absorb anomalous observations into its learned representation of normal conditions, which is the failure mode that undermines purely data-driven anomaly detectors trained without labels. The physics constraint also substitutes for labeled data: the model requires only raw sensor measurements, sidestepping the scarcity and imbalance of incident labels that complicate supervised deep learning approaches [14,19].
These properties translate directly into practical implications for traffic management centers. The framework operates on standard 15 min detector data already collected by most agencies; it requires no per site threshold calibration, since the baseline adapts to each location’s recurrent patterns through training; the residual is physically interpretable (i.e., expressed in vehicles per kilometer above the plausible state), which supports operator trust and alarm triage; and the single operator-adjustable parameter maps transparently onto an agency’s preferred balance between sensitivity and false alarms. In an operational deployment, residuals exceeding the tolerance at consecutive intervals or at adjacent stations, as observed at stations 3620 through 3622, would trigger incident verification protocols, enabling faster response than the manual monitoring of speed maps. This method therefore provides traffic management centers with a dependable and automated instrument for incident response, functioning as a digital twin of a roadway’s standard operational capacity to facilitate prompt and proactive incident management strategies.

6. Concluding Remarks

This research addresses the critical challenge of identifying non-recurrent congestion (NRC), which accounts for approximately half of all urban traffic delays and results in billions of dollars in lost productivity. Existing methodologies often struggle to distinguish between predictable recurrent patterns and unpredictable incidents due to measurement noise, inherent modeling errors, and a pervasive lack of ground-truth data. By proposing a Physics-Informed Neural Network (PINN) framework, this study establishes a novel diagnostic tool that fuses the universal approximation capabilities of deep learning with the established physical laws of macroscopic traffic flow theory.
Central to this approach is the integration of the Lighthill–Whitham–Richards (LWR) model as a latent state estimator, which creates a physically consistent baseline of normal traffic behavior by ensuring that estimates are strictly governed by the conservation of mass. To accurately represent the traffic stream across varying conditions, the methodology incorporates a two-regime fundamental diagram that utilizes the Greenshields model for free-flow regimes and transitions to the Underwood model to capture the complex, non-linear behavior of congested states. To prevent the model from purely memorizing anomalies as normal patterns, a self-adaptive weighting strategy was implemented to balance empirical data-driven loss with the physics-based residual. This optimization process forces the model to fill data gaps with physically plausible interpolations rather than relying solely on statistical fitting.
The detection of non-recurrent congestion is ultimately realized by measuring the divergence (i.e., residual) between real-time sensor observations and the PINN’s estimated density. Because recurrent bottlenecks are already accounted for within the model’s physical constraints and historical training, significant physical outliers are flagged as incidents. The main innovative aspect of this work is flipping the usual role of the PINN. Instead of estimating unobserved traffic states, the physics-constrained network acts as a highly accurate reference for normal operation. This way, deviations that cannot be explained physically, rather than statistically identified outliers, become the signal for detection. Viewed through the lens of symmetry, moreover, the framework detects non-recurrent congestion as a local breaking of the temporal symmetry of recurrent traffic patterns, with the conservation law providing the invariant structure against which such breaking becomes measurable.
Empirical validation via a case study on the Seoul Ring Expressway segment in Korea demonstrated the efficacy of this approach; by setting a tolerance level of 150% of the predicted density, the system successfully isolated non-recurrent incidents from the background noise of daily recurrent traffic. This methodology provides traffic management centers with a robust and automated tool for incident response, acting as a digital twin of a roadway’s normal operating capacity to enable immediate and proactive incident management strategies.
While the current case study scale is sufficient for conducting a proof-of-concept test that explores the applicability of the proposed idea, it is essential to evaluate the performance of the proposed PINN-based NRC detection method under more diverse traffic conditions to ensure the model’s robustness. The present results should accordingly be read as establishing feasibility rather than operational readiness. The immediate next steps include acquiring ground truth incident records to enable a formal quantitative evaluation (e.g., precision, recall, F1 score, false alarm rate, and detection delay), calibrating the tolerance level against such records, and conducting comparative benchmarking against representative baselines, including an identically configured neural network without the physics loss, sequence models such as LSTM, autoencoder-based anomaly detectors, and statistical outlier methods. In addition, the expanded case study will include an interchange-focused evaluation by extending the study corridor to cover more interchanges, since interchanges are simultaneously subject to recurrent congestion and highly exposed to non-recurrent events.


Author Contributions

Conceptualization, W.J. and J.L.; methodology, J.L.; software, J.L.; validation, J.L., J.K. and M.T.H.; formal analysis, J.L.; investigation, M.T.H.; resources, W.J.; data curation, J.K.; writing—original draft preparation, J.L.; writing—review and editing, W.J.; visualization, J.L.; supervision, J.K.; project administration, W.J. and J.K. All authors have read and agreed to the published version of the manuscript.

Funding

This research received no external funding.

Data Availability Statement

The original contributions presented in this study are included in the article. Further inquiries can be directed to the corresponding author.

Conflicts of Interest

The authors declare no conflicts of interest.

Abbreviations

The following abbreviations are used in this manuscript:
PINNPhysics-informed neural network
RCRecurrent congestion
NRCNon-recurrent congestion
PDEPartial differential equation
ICInterchange

References

  1. Schrank, D.; Albert, L.; Jha, K.; Eisele, B. 2025 Urban Mobility Report; Texas A&M Transportation Institute: College Station, TX, USA, 2025. [Google Scholar]
  2. INRIX. INRIX 2024 Global Traffic Scorecard: Employees & Consumers Returned to Downtowns, Traffic Delays & Costs Grew; INRIX: Kirkland, WA, USA, 2025. [Google Scholar]
  3. Dowling, R.G.; Parks, K.L.; Nevers, B.; Josselyn, J.; Gayle, S. Incorporating Travel-Time Reliability into the Congestion Management Process: A Primer; Federal Highway Administration: Washington, DC, USA, 2015. [Google Scholar]
  4. Snohomish County Transportation Result Team. Reasonable and Predictable Travel Times 2009-10 Budget—Transportation Result Team Request for Proposal; Snohomish County Transportation Result Team: Everett, WA, USA, 2009. [Google Scholar]
  5. Skabardonis, A.; Varaiya, P.; Petty, K.F. Measuring Recurrent and Nonrecurrent Traffic Congestion. Transp. Res. Rec. J. Transp. Res. Board 2003, 1856, 118–124. [Google Scholar] [CrossRef] [Scilit]
  6. Kwon, J.; Mauch, M.; Varaiya, P. Components of Congestion: Delay from Incidents, Special Events, Lane Closures, Weather, Potential Ramp Metering Gain, and Excess Demand. Transp. Res. Rec. J. Transp. Res. Board 2006, 1959, 84–91. [Google Scholar] [CrossRef]
  7. Varaiya, P. Finding and Analyzing True Effect of Non-Recurrent Congestion on Mobility and Safety; Institute of Transportation Studies: Berkeley, CA, USA, 2007. [Google Scholar]
  8. Anbaroglu, B.; Heydecker, B.; Cheng, T. Spatio-Temporal Clustering for Non-Recurrent Traffic Congestion Detection on Urban Road Networks; Elsevier: Amsterdam, The Netherlands, 2014; Volume 48, pp. 47–65. [Google Scholar]
  9. Anbaroğlu, B.; Cheng, T.; Heydecker, B. Non-Recurrent Traffic Congestion Detection on Heterogeneous Urban Road Networks. Transp. A Transp. Sci. 2015, 11, 754–771. [Google Scholar] [CrossRef] [Scilit]
  10. Jin, J.; Wang, Y.; Chen, A.; Dimitrijevic, B.; Lee, J. Dynamic Nonrecurrent Congestion Event Detection and Tracking Method with DBSCAN on Speed Watersheds. J. Adv. Transp. 2024, 2024, 8404251. [Google Scholar] [CrossRef] [Scilit]
  11. Luan, S.; Ma, X.; Li, M.; Su, Y.; Dong, Z. Detecting and Interpreting Non-recurrent Congestion from Traffic and Social Media Data. IET Intell. Transp. Syst. 2021, 15, 1461–1477. [Google Scholar] [CrossRef] [Scilit]
  12. Zeroual, A.; Harrou, F.; Sun, Y.; Messai, N. Monitoring Road Traffic Congestion Using a Macroscopic Traffic Model and a Statistical Monitoring Scheme; Elsevier: Amsterdam, The Netherlands, 2017; Volume 35, pp. 494–510. [Google Scholar]
  13. Harrou, F.; Zeroual, A.; Sun, Y. Traffic Congestion Detection Based on Hybrid Observer and GLR Test. In Proceedings of the 2018 Annual American Control Conference (ACC); IEEE: New York, NY, USA, 2018; pp. 604–609. [Google Scholar]
  14. Yuan, Z.; Zhou, X.; Yang, T. Hetero-ConvLSTM: A Deep Learning Approach to Traffic Accident Prediction on Heterogeneous Spatio-Temporal Data. In Proceedings of the 24th ACM SIGKDD International Conference on Knowledge Discovery & Data Mining; ACM: London, UK, 2018; pp. 984–992. [Google Scholar]
  15. An, S.; Yang, H.; Wang, J.; Cui, N.; Cui, J. Mining Urban Recurrent Congestion Evolution Patterns from GPS-Equipped Vehicle Mobility Data; Elsevier: Amsterdam, The Netherlands, 2016; Volume 373, pp. 515–526. [Google Scholar]
  16. Yang, S.; Kalpakis, K.; Biem, A. Detecting Road Traffic Events by Coupling Multiple Timeseries with a Nonparametric Bayesian Method; IEEE: New York, NY, USA, 2014; Volume 15, pp. 1936–1946. [Google Scholar]
  17. Kalair, K.; Connaughton, C. Anomaly Detection and Classification in Traffic Flow Data from Fluctuations in the Flow–Density Relationship; Elsevier: Amsterdam, The Netherlands, 2021; Volume 127, p. 103178. [Google Scholar]
  18. Svanberg, J. Anomaly Detection for Non-Recurring Traffic Congestions Using Long Short-Term Memory Networks (LSTMs). Master’s Thesis, KTH Royal Institute of Technology, Stockholm, Sweden, 2018. [Google Scholar]
  19. Sun, F.; Dubey, A.; White, J. DxNAT—Deep Neural Networks for Explaining Non-Recurring Traffic Congestion. In Proceedings of the 2017 IEEE International Conference on Big Data (Big Data); IEEE: New York, NY, USA, 2017; pp. 2141–2150. [Google Scholar]
  20. Zeroual, A.; Harrou, F.; Sun, Y. Flexible and Efficient Model-Based Congestion Detection Approach. In Proceedings of the 2018 6th International Conference on Control Engineering & Information Technology (CEIT); IEEE: New York, NY, USA, 2018; pp. 1–5. [Google Scholar]
  21. Gall, A.I.; Hall, F.L. Distinguishing Between Incident Congestion and Recurrent Congestion: A Proposed Logic. Transp. Res. Rec. 1989, 1232, 1–8. [Google Scholar]
  22. Dowling, R.; Skabardonis, A.; Carroll, M.; Wang, Z. Methodology for Measuring Recurrent and Nonrecurrent Traffic Congestion. Transp. Res. Rec. J. Transp. Res. Board 2004, 1867, 60–68. [Google Scholar] [CrossRef] [Scilit]
  23. Lighthill, M.J.; Whitham, G.B. On Kinematic Waves II. A Theory of Traffic Flow on Long Crowded Roads. Proc. R. Soc. Lond. Ser. A Math. Phys. Sci. 1955, 229, 317–345. [Google Scholar] [CrossRef] [Scilit]
  24. Richards, P.I. Shock Waves on the Highway. Oper. Res. 1956, 4, 42–51. [Google Scholar] [CrossRef] [Scilit]
  25. Greenshields, B.D.; Bibbins, J.R.; Channing, W.S.; Miller, H.H. A Study of Traffic Capacity. In Proceedings of the Highway Research Board Proceedings, Washington, DC, USA, 6–7 December 1934; Volume 14, pp. 448–477. [Google Scholar]
  26. Underwood, R.T. Speed, Volume, and Density Relationships; Yale Bureau of Highway Traffic: New Haven, CT, USA, 1960. [Google Scholar]
  27. Daganzo, C.F. The Cell Transmission Model: A Dynamic Representation of Highway Traffic Consistent with the Hydrodynamic Theory; Elsevier: Amsterdam, The Netherlands, 1994; Volume 28, pp. 269–287. [Google Scholar]
  28. Raissi, M.; Perdikaris, P.; Karniadakis, G.E. Physics-Informed Neural Networks: A Deep Learning Framework for Solving Forward and Inverse Problems Involving Nonlinear Partial Differential Equations. J. Comput. Phys. 2019, 378, 686–707. [Google Scholar] [CrossRef] [Scilit]
  29. Shi, R.; Mo, Z.; Di, X. Physics-Informed Deep Learning for Traffic State Estimation: A Hybrid Paradigm Informed by Second-Order Traffic Models. Proc. AAAI Conf. Artif. Intell. 2021, 35, 540–547. [Google Scholar] [CrossRef] [Scilit]
  30. Huang, A.J.; Agarwal, S. Physics-Informed Deep Learning for Traffic State Estimation: Illustrations with LWR and CTM Models. IEEE Open J. Intell. Transp. Syst. 2022, 3, 503–518. [Google Scholar] [CrossRef] [Scilit]
  31. Di, X.; Shi, R.; Mo, Z.; Fu, Y. Physics-Informed Deep Learning for Traffic State Estimation: A Survey and the Outlook. Algorithms 2023, 16, 305. [Google Scholar] [CrossRef] [Scilit]
Figure 1. Proposed PINN-based NRC detection framework: (a) training phase; (b) detection phase.
Symmetry 18 01394 g001
Figure 2. Case study site.
Symmetry 18 01394 g002
Figure 3. Speed–density plot for Sapaesan Tunnel (Station ID: 3622).
Symmetry 18 01394 g003
Figure 4. Speed–density plot for Songchoo IC (Station ID: 3634).
Symmetry 18 01394 g004
Figure 5. Speed–density plot for 1st Nogosan Tunnel (Station ID: 3638).
Symmetry 18 01394 g005
Figure 6. Speed–density plot for 2nd Nogosan Tunnel (Station ID: 3645).
Symmetry 18 01394 g006
Figure 7. Total loss changes.
Symmetry 18 01394 g007
Figure 8. PINN prediction result at Station ID 3633 (1 July 2022).
Symmetry 18 01394 g008
Figure 9. PINN prediction result at Station ID 3620.
Symmetry 18 01394 g009
Figure 10. PINN prediction result at Station ID 3621.
Symmetry 18 01394 g010
Figure 11. PINN prediction result at Station ID 3622.
Symmetry 18 01394 g011
Figure 12. PINN prediction result at Station ID 3624.
Symmetry 18 01394 g012
Table 1. Summary of reviewed NRC detection approaches and their limitations.
ApproachRepresentative Studies (Year)Typical MethodsLabeled Data RequiredPhysics-Consistent Baseline
Clustering-basedAnbaroglu et al., 2014 [8]; An et al., 2016 [15]; Jin et al., 2024 [10]Spatio-temporal clustering, DBSCANNoNo
Statistical analysisYang et al., 2014 [16]; Anbaroğlu et al., 2015 [9]; Luan et al., 2021 [11]; Kalair and Connaughton, 2021 [17]BRPCA, GESD, KDE outlier detectionNoNo
Deep learningSun et al., 2017 [19]; Svanberg, 2018 [18]; Yuan et al., 2018 [14]ConvLSTM, LSTM, CNNYesNo
Traffic flow modelingGall and Hall, 1989 [21]; Dowling et al., 2004 [22]; Zeroual et al., 2017 [12]; Harrou et al., 2018 [13]; Zeroual et al., 2018 [20]PWSL with control charts, state logicNoPartial
PINN (this study)LWR constrained neural networkNoYes
Table 2. Model parameters.
ParameterValueParameterValue
Hidden Layers4Physics Weight0.00001
Neurons30Physics Samples10,000
Epoch5000Batch Size4096
Learning Rate0.0001Jam Density114.7 veh/km
Density Threshold17.0 veh/kmOptimal Density24.9 veh/km
Free-Flow Speed for Greenshields Model97.1 km/hFree-Flow Speed for Underwood Model144.8 km/h
Table 3. Summary of detected non-recurrent congestion events (1 July 2022 evaluation day).
Station IDLocationTime WindowBaseline Density (veh/km)Peak Observed Density (veh/km)Flagged
3620Downstream of Howon IC3:00–5:00 p.m.2639~52Yes
3621Sapaesan Tunnel3:00–4:30 p.m.2538~48Yes
3622Sapaesan Tunnel3:00–4:30 p.m.2538~42Yes
3624Sapaesan Tunnel4:00–4:30 p.m.2233Yes
Disclaimer/Publisher’s Note: The statements, opinions and data contained in all publications are solely those of the individual author(s) and contributor(s) and not of MDPI and/or the editor(s). MDPI and/or the editor(s) disclaim responsibility for any injury to people or property resulting from any ideas, methods, instructions or products referred to in the content.