Article

Soft Mode Dynamics Associated with QCD Critical Point and Color Superconductivity—Pseudogap, Anomalous Dilepton Production, and Electric Conductivity †

by
Masakiyo Kitazawa
1,2,* and
Teiji Kunihiro
2
1
J-PARC Branch, KEK Theory Center, Institute of Particle and Nuclear Studies, KEK, Tokai, Ibaraki 319-1106, Japan
2
Yukawa Institute for Theoretical Physics, Kyoto University, Kyoto 606-8501, Japan
*
Author to whom correspondence should be addressed.
Report numbers: YITP-26-39; J-PARC-TH-0334.
Symmetry 2026, 18(7), 1185; https://doi.org/10.3390/sym18071185
Submission received: 30 May 2026 / Revised: 2 July 2026 / Accepted: 8 July 2026 / Published: 13 July 2026

Abstract

We give a systematic account of the soft mode dynamics of QCD critical point and the two-flavor color superconductivity based on the two-flavor Nambu–Jona-Lasinio model and investigate their effects on electromagnetic observables in relativistic heavy-ion collisions (HICs). We first demonstrate that the collective excitations coupled to the fluctuations of the respective order parameters are the soft modes associated with the phase transitions, in the sense that they acquire a prominent spectral strength in the low-energy and low-momentum region near the phase transitions, and the peak energy goes down, i.e., becomes softened and eventually vanishes at the critical point. It is shown that the diquark soft mode of the 2SC gives rise to the pseudogap, i.e., a depression in the density of states of the quark spectra around the Fermi surface above but in the vicinity of the critical temperature. Then, exploiting the ideas that were developed in condensed matter physics for describing the ‘para-conductivity’ in the normal phase of metal superconductors, we show that the soft modes cause an anomalous enhancement of electric conductivity and the dilepton production rate and discuss their relevance to HICs.

1. Introduction

One of the central problems in modern physics is to reveal the properties of hot and dense matter realized in the cores of compact stars and in the early universe. Since the extremely hot and dense matter should be described in terms of quarks and gluons governed by quantum chromodynamics (QCD), such an effort can be tantamount to developing condensed matter physics in terms of QCD or QCD-condensed matter physics. Accumulated theoretical works based on the lattice QCD simulations and low-energy effective theories of QCD show that various types of phase transitions may occur in such a matter [1], which includes the appearance of color superconductivity (CSC) [2] and the existence of a critical point called the QCD critical point (QCD-CP) [3,4] at which a first-order phase-transition line in the higher-density and lower-temperature region ends and the phase transition turns second order with non-zero current quark masses. (In fact, the phase structure around the QCD-CP could be more complicated and might have multiple critical points [5] due to the vector interaction [6], the Kobayashi–Maskawa-’t Hooft (KMT) anomaly term, and mismatched Fermi spheres of the respective pairing particles.).
Terrestrial experiments using high-energy heavy-ion collisions (HICs) [7] have been utilized to probe such a hot and dense matter. The beam-energy scan experiments [8,9] have been carried out to explore dense matter at relatively low temperatures, and next-generation experimental programs [10] are being developed or planned in several countries. Since the fluctuation of the order parameter grows in a divergent way as the system approaches the critical point, observables that are coupled to such a fluctuation should be of primary interest for probing the QCD phase transitions in HICs.
In the case of the QCD-CP [11,12], since it comes to exist when an explicit chiral symmetry breaking is present at finite baryon density, its order parameter is a linear combination of the baryon density and the chiral scalar condensate due to the violation of the charge-conjugation symmetry, as is familiar from Walecka’s σ - ω model [13,14]; see Appendix B of the latter paper. People have been interested in extracting fluctuations or second- and higher-order cumulants of fluctuations of baryon number densities through the event-by-event analyses [8,15,16]. In the present article, we shall, however, focus on the dynamical aspects of the fluctuation of the order parameter in the normal phase, say, above the critical temperature, where the dynamical fluctuations of the order parameter have a dominant strength in the space-like region. This is the collective particle-hole excitation corresponding to density fluctuations and has the nature of the soft mode of the QCD-CP in the sense that the peak energy of the collective mode goes down (softens) as the system approaches the QCD-CP in the normal phase and eventually becomes zero there [17,18,19,20,21,22].
As for CSC, which is caused by attractive diquark correlations (Cooper pairs) in the presence of a Fermi sphere, there are various patterns of CSC due to the intrinsic degrees of freedom of quarks [2]. Among such varieties of the pairing patterns, we only take into consideration the two-flavor color superconductivity (2SC) in the present article and consider the precursory diquark fluctuations, assuming the second-order nature of the phase transition. (It should be remarked that gluon fluctuations may alter the order of the phase transition to a (weak) first order from a second one in a relatively low density [23,24,25,26]. It seems, however, that there has been no consensus on the strength of the first-order nature in the low-density region. Thus, we will assume that the phase transition is second order or weakly first order in this article. If the transition becomes weakly first order, the singular behavior due to the complete softening of the diquark soft mode discussed below is replaced by finite peaks. Nevertheless, substantial enhancement is still expected as long as the first-order transition is sufficiently weak.) In fact, it was shown that there exists a specific soft mode in the normal phase of CSC which has a prominent spectral support in the space-like region [27,28,29,30].
We shall closely examine the spectral properties of these soft modes associated with the respective phase transitions in a coherent way on the basis of the massive two-flavor and three-color Nambu–Jona–Lasinio (NJL) model [31,32,33,34,35,36,37], basically following Refs. [27,28,29,30,38].
Then, we first show that the diquark soft mode of the 2SC causes a pseudogap in the quark spectra, i.e., a depression in the density of states of the quark spectra around the Fermi energy above but in the vicinity of the critical temperature.
Although it is left as a future problem to find good observables to confirm the pseudogap experimentally, we shall show that the soft modes for both phase transitions cause an anomalous enhancement of electric conductivity and the dilepton production rate (DPR) to be observed by HICs. For that, we employ an idea established in condensed matter physics to account for an anomalous excess of the electric conductivity, known as ’para-conductivity’ [39,40,41,42], in metal superconductors [42,43]. Needless to say, the DPR should be useful to detect the dynamical properties of the created matter by HICs owing to the relatively weak interactions with the surrounding matter, and the significance of electric conductivity in hot and dense quark matter [44,45,46,47,48,49,50] has been revealed for understanding the space-time evolution of the created matter in HICs [51,52,53].
The present paper is organized as follows. In the next section, we introduce the model Lagrangian and show the phase diagram given by it in the mean-field approximation. In Section 3, a unified account is given of the soft modes as collective excitations based on the linear-response theory, and the important difference in the analytic properties of the spectral functions are elucidated; then, paying attention to the respective analytic properties, we derive approximate low-energy effective propagators valid in the vicinity of the respective critical points. In Section 4, we calculate the density of states of the quark spectra and establish the emergence of the pseudogap phenomenon. In Section 5, we calculate the photon self-energy in the medium by taking account of the soft modes and demonstrate that the soft modes cause an anomalous enhancement of the electric conductivity and the dilepton production rate near but above the respective critical temperatures of the 2SC and QCD-CP. The last section is devoted to a brief summary and concluding remark.

2. Model Lagrangian and Phase Diagram

To explore the effects of critical fluctuations in dense quark matter, we employ a simple two-flavor NJL model with a non-zero current quark mass m, as was performed in Ref. [38],
L = ψ ¯ i ( m ) ψ + G S [ ( ψ ¯ ψ ) 2 + ( ψ ¯ i γ 5 τ ψ ) 2 ] + G D ( ψ ¯ i γ 5 τ 2 λ A ψ C ) ( ψ ¯ C i γ 5 τ 2 λ A ψ ) ,
where ψ ( x ) is the quark field and ψ C ( x ) = i γ 2 γ 0 ψ ¯ T ( x ) denotes its charge conjugation. τ = ( τ 1 , τ 2 , τ 3 ) are the Pauli matrices for the flavor S U ( 2 ) f , and λ A ( A = 2 , 5 , 7 ) are the antisymmetric components of the Gell-Mann matrices for the color S U ( 3 ) c . The scalar coupling constant G S and the three-momentum cutoff Λ are determined so as to reproduce the pion mass m π = 138 MeV and the pion decay constant f π = 93 MeV at the current quark mass m = 5.5 MeV [35]: G S = 5.50 GeV 2 and Λ = 631 MeV . (The three-momentum cutoff is a suitable cut-off scheme to describe a phase transition where the particle masses may change as in the chiral transition because the number of degrees of freedom is not affected by the mass change in this cutoff scheme, in contrast to some seemingly elegant schemes, such as proper-time regularization [35].). We treat G D as a free parameter and vary it in the range obtained by various estimates [37].
To describe the chiral restoration and the onset of the 2SC phase, we adopt the mean-field approximation (MFA) for the scalar and diquark operators,
σ ^ ( x , t ) = ψ ¯ ( x , t ) ψ ( x , t ) and δ ^ A ( x , t ) = ψ ¯ C ( x , t ) i γ 5 τ 2 λ A ψ ( x , t ) .
We refer to their expectation values σ ^ and δ ^ A as the chiral and diquark condensates, respectively. The Lagrangian density in this approximation takes the form
L MFA = ψ ¯ i ( m ) ψ M ψ ¯ ψ 1 2 ( Δ ψ ¯ C i γ 5 τ 2 λ A ψ + h . c . ) M 2 4 G S | Δ | 2 4 G D ,
with M = 2 G S σ ^ and Δ = 2 G D δ ^ A .
From Equation (3), the thermodynamic potential per unit volume at temperature T and quark chemical potential μ is calculated to be [28]
ω MFA = ( M m ) 2 4 G S + | Δ | 2 4 G D 4 d 3 p ( 2 π ) 3 { E p + T log 1 + e ξ + / T 1 + e ξ / T = + ϵ + + sgn ( ξ ) ϵ + 2 T log 1 + e ϵ + / T 1 + e sgn ( ξ ) ϵ / T } ,
E p = p 2 + M 2 , ξ ± = E p ± μ , ϵ ± = ξ ± 2 + | Δ | 2 .
The expectation values M and Δ are given by minimizing ω MFA , and the stationary condition gives the gap equations
ω MFA M = 0 , ω MFA Δ = 0 .
The 2SC phase is characterized by a non-zero diquark condensate Δ . At the 2SC-PT, Δ has a non-zero value in the 2SC phase continuously from zero, provided that the phase transition is of the second order. This implies that ω MFA satisfies
2 ω MFA Δ 2 | Δ = 0 = 0 ,
at the 2SC-PT. Equation (7) tells us that the thermodynamic potential around the minimum point is flat, and hence the diquark susceptibility χ D = ( 2 ω MFA / Δ 2 ) 1 is divergent, and accordingly so do the fluctuations of Δ at the 2SC-PT. Such divergences are a general feature of second-order phase transitions [15]. We will discuss their consequences in subsequent sections. Owing to the non-zero current quark mass, the chiral condensate σ ^ is always non-zero. When ω MFA has two local minima, the values of M and Δ at the global minimum can exhibit a discontinuous change when T and μ are varied, which corresponds to a first-order phase transition.
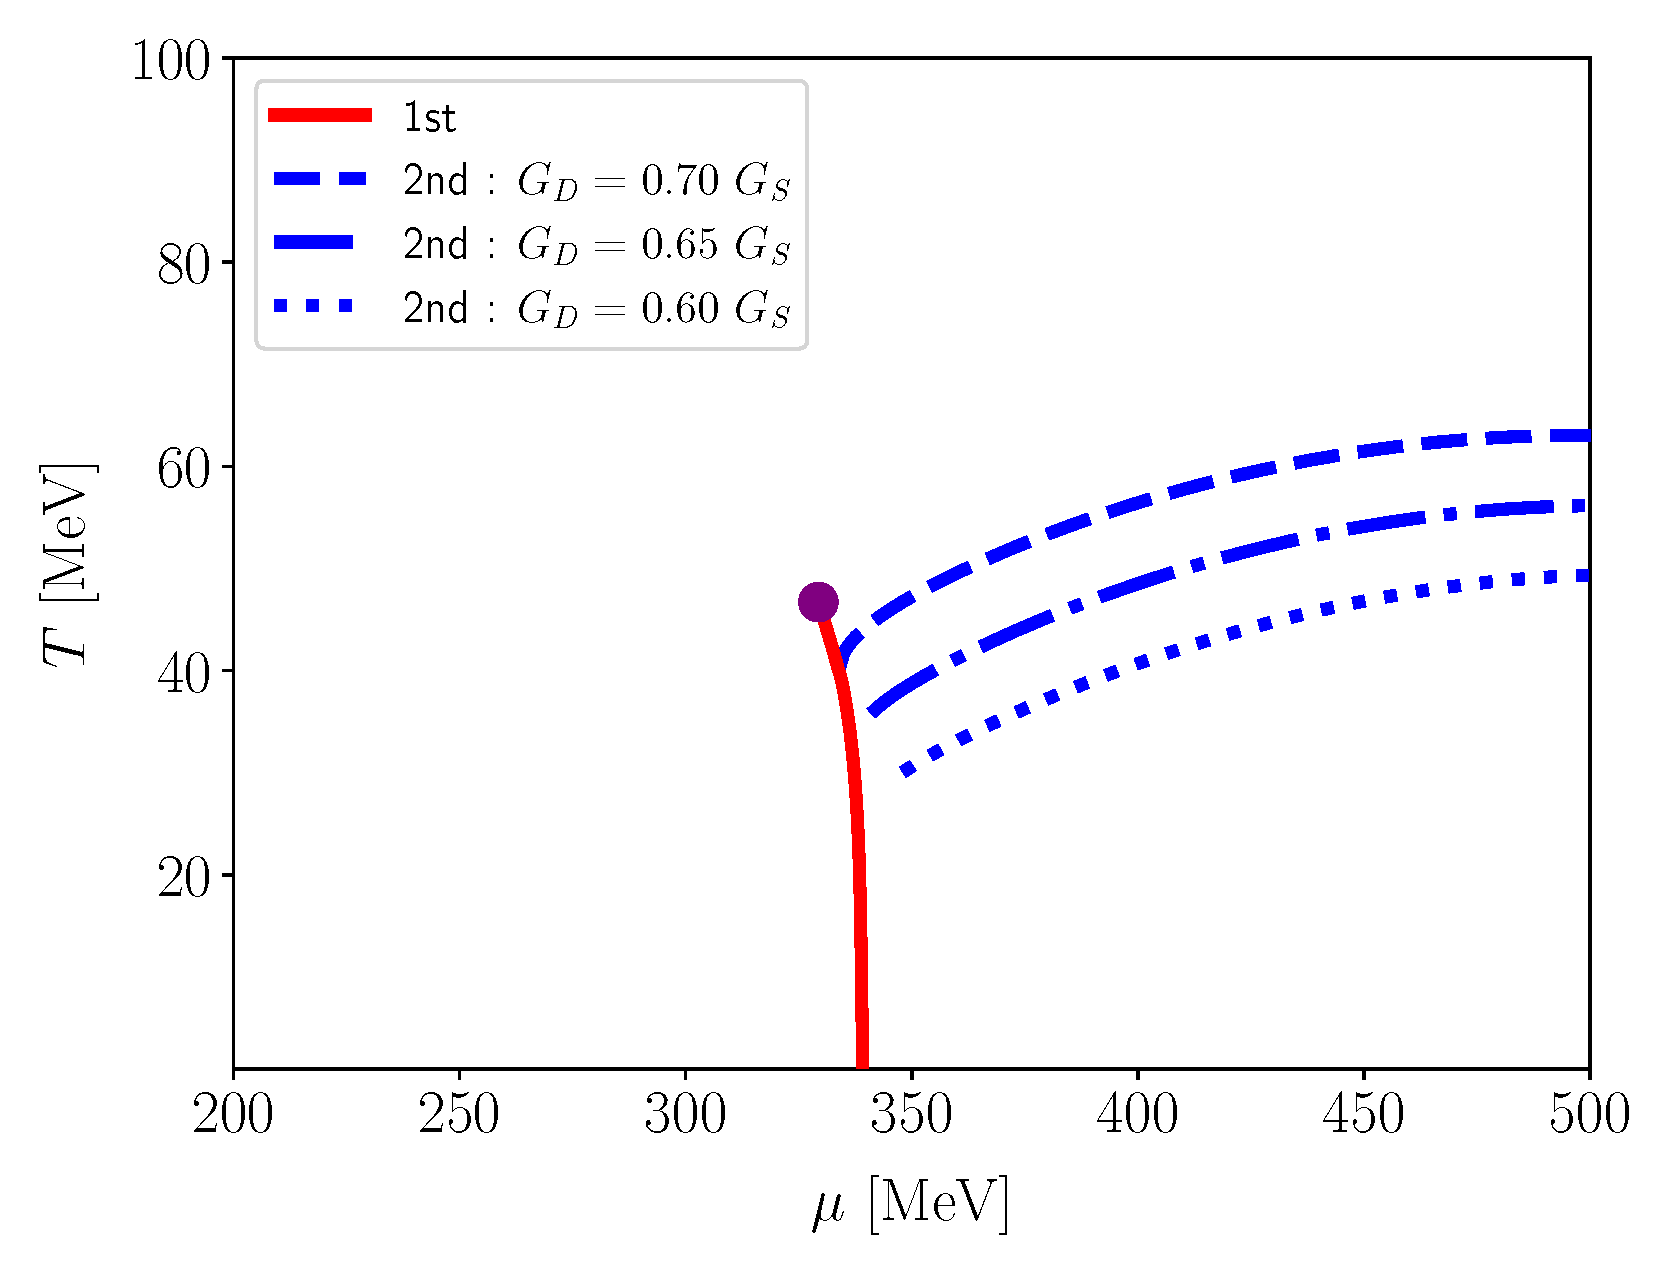
In Figure 1, we show the phase diagram in the T μ plane obtained by the MFA [38]. The solid line shows the first-order transition line. The circle marker at ( T CP , μ CP ) ( 46.712 , 329.34 ) MeV denotes the QCD-CP, which is an endpoint of the first-order transition line where the phase transition is of second order. The dashed, dash-dotted, and dotted lines show the 2SC-PT for G D / G S = 0.70 , 0.65 , and 0.60 , respectively. The critical temperature of the 2SC-PT increases as G D becomes larger. The 2SC-PT is of second order in our model.
As mentioned in the introduction, several studies beyond the MFA suggest that the order of the 2SC-PT is a weak first order owing to fluctuations of gluon fields [23,24,26]. Since any global symmetry distinguishes the 2SC phase from the normal one, the transition to the 2SC phase may have to be crossover [2]. In any event, we are not aware of a definite conclusion on the order of the 2SC-PT, and the following analyses will be performed simply based on the result of the MFA.
At the QCD-CP where two minima of ω MFA existing in the lower-T and higher- μ region merge, ω MFA has a flat direction on the M Δ plane. As Figure 1 shows, in our model, Δ = 0 is satisfied at the QCD-CP for G D / G S < 0.7 and the flat direction is along the M direction. Therefore, at the minimum, ω MFA satisfies
2 ω MFA M 2 = 0 ,
at the QCD-CP. Equation (7) shows that the fluctuation of M is divergent at the QCD-CP.

3. Collective Diquark/Particle-Hole Excitations as the Soft Modes of the Phase Transitions

In this section, we discuss the dynamical properties of fluctuations of Δ and M near the 2SC-PT and QCD-CP, respectively, based on the linear response theory. We show that these fields exhibit collective excitations with prominent peaks of the strength function near these phase transitions, respectively [17,18,27,28,38].

3.1. Linear Response Theory

The linear-response theory [54] is a useful tool to explore dynamical properties of collective excitations. A key idea of this theory is to disturb the system with an infinitesimal external field represented by the Hamiltonian H ext = d 3 x d t e i ω t i k · x f ( x , t ) O ( x , t ) , where O ( x , t ) is a bosonic-field operator and f ( x , t ) is a classical function. As a result of applying the external field, the expectation value of O ( x , t ) can deviate from its thermal expectation value O . For an infinitesimal perturbation, this deviation is proportional to f ( x , t ) and represented by [54]
δ O ( x , t ) O ( x , t ) ext O = d 3 x d t D R ( x x , t t ) f ( x , t ) ,
where O ( x , t ) ext represents the expectation value with the external field and D R ( x , t ) is the retarded Green’s function
D R ( x , t ) = i [ O ( x , t ) , O ( 0 , 0 ) ] θ ( t ) ,
with [ A , B ] = A B B A being the commutator. The Fourier transformation of Equation (9) leads to
δ O ( k , ω ) = D R ( k , ω ) f ( k , ω ) ,
with D R ( k , ω ) = d 3 x d t e i ω t i k · x D R ( x , t ) and so on.
When D R ( k , ω ) has a pole at ω = ω ( k ) for real ω , Equation (11) tells us that δ O ( k , ω ( k ) ) becomes non-zero with an infinitesimal external perturbation. Such a mode forms a collective excitation that carries the quantum number of the operator O ( x , t ) . When D R ( k , ω ) admits a complex pole ω = ω ( k ) C with a small imaginary part, it is also said that there exists a well-developed collective mode or quasi-particle.
To explore the fluctuations of Δ and M, we only have to substitute the operators δ ^ A ( x , t ) and σ ^ ( x , t ) into O ^ ( x , t ) , respectively. We denote these retarded functions with O ( x , t ) = δ ^ A ( x , t ) and σ ^ ( x , t ) as D D R ( k , ω ) and D S R ( k , ω ) , respectively.

3.2. Random-Phase Approximation and Thouless Criterion

The retarded Green’s functions D D R ( k , ω ) and D S R ( k , ω ) that are consistent with the MFA are given by the random-phase approximation (RPA) or ring approximation,
D γ R ( k , ω ) = Q γ R ( k , ω ) 1 + G γ Q γ R ( k , ω ) = Q γ R ( k , ω ) Q γ R ( k , ω ) G γ Q γ R ( k , ω ) + ,
with γ = D , S and the unperturbed correlation functions Q γ R ( k , ω ) . As shown in Figure 2, Q γ R ( k , ω ) are represented by the one-loop graphs, where the directions of quark propagators are different for γ = D , S . To calculate Q γ R ( k , ω ) , it is convenient to first introduce the corresponding functions in the Matsubara (imaginary-time) formalism
Q D ( k ) = d 3 x d t e i ν n τ i k · x T τ δ ^ A ( x , τ ) δ ^ A ( 0 , 0 ) free = 2 N f ( N c 1 ) p Tr D [ G 0 ( p ) G 0 ( k p ) ] ,
Q S ( k ) = d 3 x d t e i ν n τ i k · x T τ σ ^ ( x , τ ) σ ^ ( 0 , 0 ) free = 2 N f N c p Tr D [ G 0 ( p ) G 0 ( k + p ) ] ,
where k = ( k , i ν n ) is the collective index with ν n = 2 n π / T the Matsubara frequency for bosons, · free denotes the expectation value in the non-interacting system, and G 0 ( p ) = G 0 ( p , i ω m ) = 1 / [ ( i ω m + μ ) γ 0 p · γ M ] is the free-quark propagator with ω m = ( 2 m + 1 ) π / T being the Matsubara frequency for fermions. The retarded function Q γ R ( k , ω ) is then obtained by the analytic continuation i ν n ω + i η
Q γ ( k ) = Q γ ( k , i ν n ) i ν n ω + i η Q γ R ( k , ω ) .
For later convenience, we also introduce the retarded T-matrices
Ξ γ R ( k , ω ) = 1 G γ 1 + Q γ R ( k , ω ) = G γ G γ D γ R ( k , ω ) G γ ,
which also means
D γ R ( k , ω ) = G γ 1 Q γ R ( k , ω ) Ξ γ R ( k , ω ) .
An important property of the T-matrices (16) is that their low-energy low-momentum limits are related to the second derivatives of ω MFA as [38]
lim | k | 0 Ξ D R 1 ( k , 0 ) = 2 2 ω MFA Δ 2 , lim | k | 0 Ξ S R 1 ( k , 0 ) = 2 2 ω MFA M 2 .
Since the thermodynamic potential satisfies 2 ω MFA / Δ 2 = 0 ( 2 ω MFA / M 2 = 0 ) at the 2SC-PT (QCD-CP) as discussed in Section 2, from Equation (18) it is immediately concluded that
Ξ γ R 1 ( 0 , 0 ) = 0 and D γ R 1 ( 0 , 0 ) = 0 ,
are satisfied at the respective critical points. These properties are called the Thouless criterion [55]. Although the derivation of the Thouless criterion presented here relies on the MFA and the RPA, it has a general validity beyond the MFA, reflecting the fact that lim | k | 0 Ξ γ R 1 ( k , 0 ) corresponds to the susceptibility of the order-parameter field that diverges at the second-order phase transition [42].
An important consequence of the Thouless criterion is that D D R ( k , ω ) and D S R ( k , ω ) have a massless pole ω ( 0 ) = 0 at the 2SC-PT and QCD-CP, respectively. Since the location of the pole ω ( k ) changes continuously as a function of T and μ , the pole stays near the origin ω = 0 even away from the transition point. Such a mode is called the soft mode of the respective phase transitions.
Figure 2. Diagrammatic representation of Equation (12). The lines denote the quark propagator.
Symmetry 18 01185 g002

3.3. Analytic Structure of Q γ R

The imaginary parts of Q γ R ( k , ω ) are calculated to be [38]
Im Q D R ( k , ω ) = N f ( N c 1 ) T 4 π ( ω + 2 μ ) 2 k 2 | k | × { θ Λ ¯ | ω + 2 μ | θ | ω + 2 μ | k 2 + 4 M 2 F D ω , k ¯ ( | k | , ω + 2 μ ) + θ k ¯ ( | k | , Λ ¯ ) | ω + 2 μ | F D ω , k ¯ ( | k | , ω + 2 μ ) F D ω , Λ ¯ } ,
F D ( ω , x ) = 2 s = ± s log cosh ( [ ω + s x ] / 4 T ) ,
and
Im Q S R ( k , ω ) = N f N c T 4 π ω 2 k 2 4 M 2 | k | × { θ Λ ¯ | ω | θ | ω | k 2 + 4 M 2 F S ω , k ¯ ( | k | , ω ) + θ k ¯ ( | k | , Λ ¯ ) | ω | F S ω , k ¯ ( | k | , ω ) F S ω , Λ ¯ } ,
F S ( ω , x ) = s , t = ± s log cosh ( [ ω + s x 2 t μ ] / 4 T ) ,
with k ¯ ( | k | , ω ) = | k | 1 4 M 2 / ( ω 2 k 2 ) and Λ ¯ = 2 Λ 2 + M 2 .
From Equations (20) and (22), one finds that the first (second) term in the curly bracket in Equation (20) takes a non-zero value at
| ω + 2 μ | > k 2 + 4 M 2 , ( | ω + 2 μ | < k ¯ ( | k | , Λ ¯ ) ) ,
while that in Equation (22) is non-zero at
| ω | > k 2 + 4 M 2 , ( | ω | < k ¯ ( | k | , Λ ¯ ) ) .
One can also verify from Equations (20) and (22) that Q D R ( k , ω ) and Q S R ( k , ω ) are not analytic at the boundary of the supports (24) and (25). Therefore, Q S R ( k , ω ) is not analytic at the origin, whereas Q D R ( k , ω ) is analytic there. As we will see later, this leads to a qualitative difference in the nature of the soft modes of the 2SC-PT and QCD-CP.

3.4. Linearized Time-Dependent Ginzburg–Landau (TDGL) Approximation

In this subsection, we derive effective equations for the soft modes near the 2SC-PT and QCD-CP known as the linearized time-dependent Ginzburg–Landau (TDGL) equations [38]. These equations are obtained by expanding Ξ γ R ( k , ω ) with respect to k and ω . Through the derivation of these equations, the qualitative difference in the analytic properties of the soft modes of the 2SC-PT and QCD-CP will be clarified. The resultant TDGL equations will be found helpful to investigate the effects of the soft modes on various observables in a simple way to be conducted in the subsequent sections.

3.4.1. Soft Mode of 2SC-PT

Let us start with the soft mode of the 2SC-PT, which is a collective mode encoded in Ξ D R ( k , ω ) . As discussed in Section 3.2, this T-matrix satisfies Ξ D R 1 ( 0 , 0 ) = 0 at T = T c and is analytic at ω = | k | = 0 . Therefore, at small ω and | k | , this function is well approximated by the Taylor expansion
Ξ D R 1 ( k , ω ) A D ( k ) + C D ω ,
near the 2SC-PT with
A D ( k ) = G D 1 + Q D R ( k , 0 ) , C D = Q D R ( 0 , ω ) ω | ω = 0 ,
which are found to be real and complex numbers, respectively. Since the Thouless criterion (18) tells us that A D ( 0 ) = 0 at T = T c , Equation (26) is further expanded as
Ξ D R 1 ( k , ω ) a ˜ D ϵ + b D k 2 + c D ω ,
with the reduced temperature
ϵ = T T c T c .
The approximate Formula (28) corresponds to the linearized time-dependent Ginzburg–Landau (TDGL) Equation [42]. In fact, the linear-response theory, Equation (11), shows that the equation of motion of the field Δ with an infinitesimal external field is given by Ξ D R 1 ( k , ω ) Δ ( k , ω ) = 0 , whose Fourier transformation gives the linearized TDGL equation ( i C D / ω b D 2 + a ˜ D ϵ ) Δ = 0 . In the following, we refer to Equations (28) and (26) as the TDGL and the low-energy (LE) approximations, respectively. It is numerically verified that these approximations well reproduce the Ξ D R 1 ( k , ω ) obtained in the RPA near the 2SC-PT [38].
From Equation (28), the dispersion relation of the soft mode is readily obtained as
ω = ( a ˜ D ϵ + b D k 2 ) / c D .
When | Re c D | | Im c D | , Equation (28) can be rewritten as
Ξ D R ( k , ω ) = 1 a D + b D k 2 + c D ω = i | Im c D | 1 ω + i τ GL 1 1 + ξ D 2 q 2 ,
where
τ GL = | c D | / a D , and ξ D = b D / a D
are the relaxation time and the coherence length of the soft mode, respectively. Equation (31) shows that the soft mode is a damping mode.
Using the approximations M T + | μ | Λ and T / μ 1 , the coefficients in Equation (28) are calculated to be
a ˜ D = 2 N f ( N c 1 ) π 2 μ 2 , b D = 7 N f ( N c 1 ) ζ ( 3 ) 48 π 4 μ 2 T 2 , c D = i N f ( N c 1 ) 4 π μ 2 T ,
up to logarithmic terms [38]. On account of Equation (33), the expressions of the relaxation time and the coherence length in Equation (31) are simplified to
τ GL = π 8 T 1 ϵ , ξ D = 7 ξ ( 3 ) 96 T 2 1 ϵ 1 / 2 ,
respectively. One sees that both quantities do not depend on μ and are divergent for ϵ 0 .

3.4.2. Soft Mode of QCD-CP

The soft mode of the QCD-CP can be treated in much the same way as the 2SC-PT. Ξ S R ( k , ω ) is approximated for small ω and | k | as
Ξ S R 1 ( k , ω ) A S ( k ) + C S ( k ) ω ,
with
A S ( k ) = G S 1 + Q S R ( k , 0 ) and C S ( k ) = Q S R ( k , ω ) ω | ω = 0 ,
which are found to be real and pure imaginary, respectively. An important difference of Equation (36) from Equation (26) is that Ξ S R 1 ( k , ω ) is not analytic at ω = | k | = 0 ; reflecting it, C S ( k ) diverges as 1 / | k | for k 0 . As discussed in Section 3.3, Ξ S R ( k , ω ) has discontinuities at | ω | = k ¯ ( | k | , Λ ¯ ) | k | . Therefore, the LE approximation (35) is valid only in the region | ω | < k ¯ ( | k | , Λ ¯ ) and not applicable to the time-like region. This analytic property shows that the soft mode of the QCD-CP is in the space-like region and hence not conventional mesonic excitations in the time-like region.
Equation (35) is further expanded as
Ξ S R 1 ( k , ω ) a S ( T , μ ) + b S | k | 2 + c S ω | k | ,
with a S ( T , μ ) = G S 1 + lim | k | 0 Q S R ( k , 0 ) . We refer to Equation (37) as the TDGL approximation for Ξ S R ( k , ω ) in analogy with Equation (28). The parameter a S ( T , μ ) in Equation (37) vanishes at the QCD-CP as in the case of 2SC-PT. Its behavior around there is, however, more intricate [38]: When T and μ approach the QCD-CP linearly but with a different fixed ratio T T CP : μ μ CP , it varies as
a S ϵ CP parallel to the first order line , ϵ CP 2 / 3 otherwise ,
in the MFA with
ϵ CP = T T CP T CP 2 + μ μ CP μ CP 2 .
In contrast to the case for the 2SC-PT, Equations (35) or (37) is applicable only to the space-like region. The non-analyticity reflects the coupling between the order parameter and conserved hydrodynamic modes, which is a generic feature of the dynamical critical behavior of the QCD critical point. When we use it, we thus assume Ξ S R ( k , ω ) = 0 in the time-like region.
The last term in Equation (37) is finite in the space-like region. It is also worth mentioning that the soft mode of the QCD-CP existing in the space-like region should not be confused with the mesonic excitation in the time-like region, which is usually called the σ meson. Therefore, one should be cautious when the symbol σ is used to represent the soft mode of the QCD-CP in the literature.

4. Emergence of Pseudogap in Quark Excitation Spectra

In the previous sections, we have seen that the fluctuations of Δ and M are enhanced near the 2SC-PT and QCD-CP, respectively, and well-developed collective modes, the soft modes, are formed, which become massless at the critical points. The emergence of the soft modes can, in turn, modify properties of various physical observables near the transition points. In this and the next sections, we investigate some such observables in the dense quark matter near the 2SC-PT and QCD-CP.
In this section, we focus on the modification of the excitation properties of quarks due to the soft modes. In the strongly correlated superconductors, such as the high-temperature superconductors and cold atoms near the unitarity limit, it is known that there appear unconventional properties in the fermionic excitations near but above the critical temperature T c . They lead to the suppression of the density of states (DOS) near the Fermi surface even above the critical temperature, which is called the pseudogap phenomenon. In this section, we explore the possibility of the appearance of the pseudogap in the quark spectral function near the 2SC-PT and QCD-CP [56,57,58].
The excitation properties of quarks are represented by the one-particle quark spectral function,
A ( k , ω ) = 1 π · Im G R ( k , ω ) = 1 π G R ( k , ω ) γ 0 G R ( k , ω ) γ 0 2 i ,
with the retarded quark Green’s function G R ( k , ω ) . From rotational and parity invariance, the Dirac indices of A ( k , ω ) can be decomposed into
A ( k , ω ) = ρ 0 ( k , ω ) γ 0 ρ v ( k , ω ) k ^ · γ + ρ s ( k , ω ) ,
with k ^ = k / | k | . Here, ρ 0 ( k , ω ) represents the strength of excitations carrying the quark number, and the DOS of the quarks is defined through this channel as
N ( ω ) = 4 d 3 k ( 2 π ) 3 Tr c , f ρ 0 ( k , ω ) ,
with Tr c , f denoting the trace over color and flavor indices.
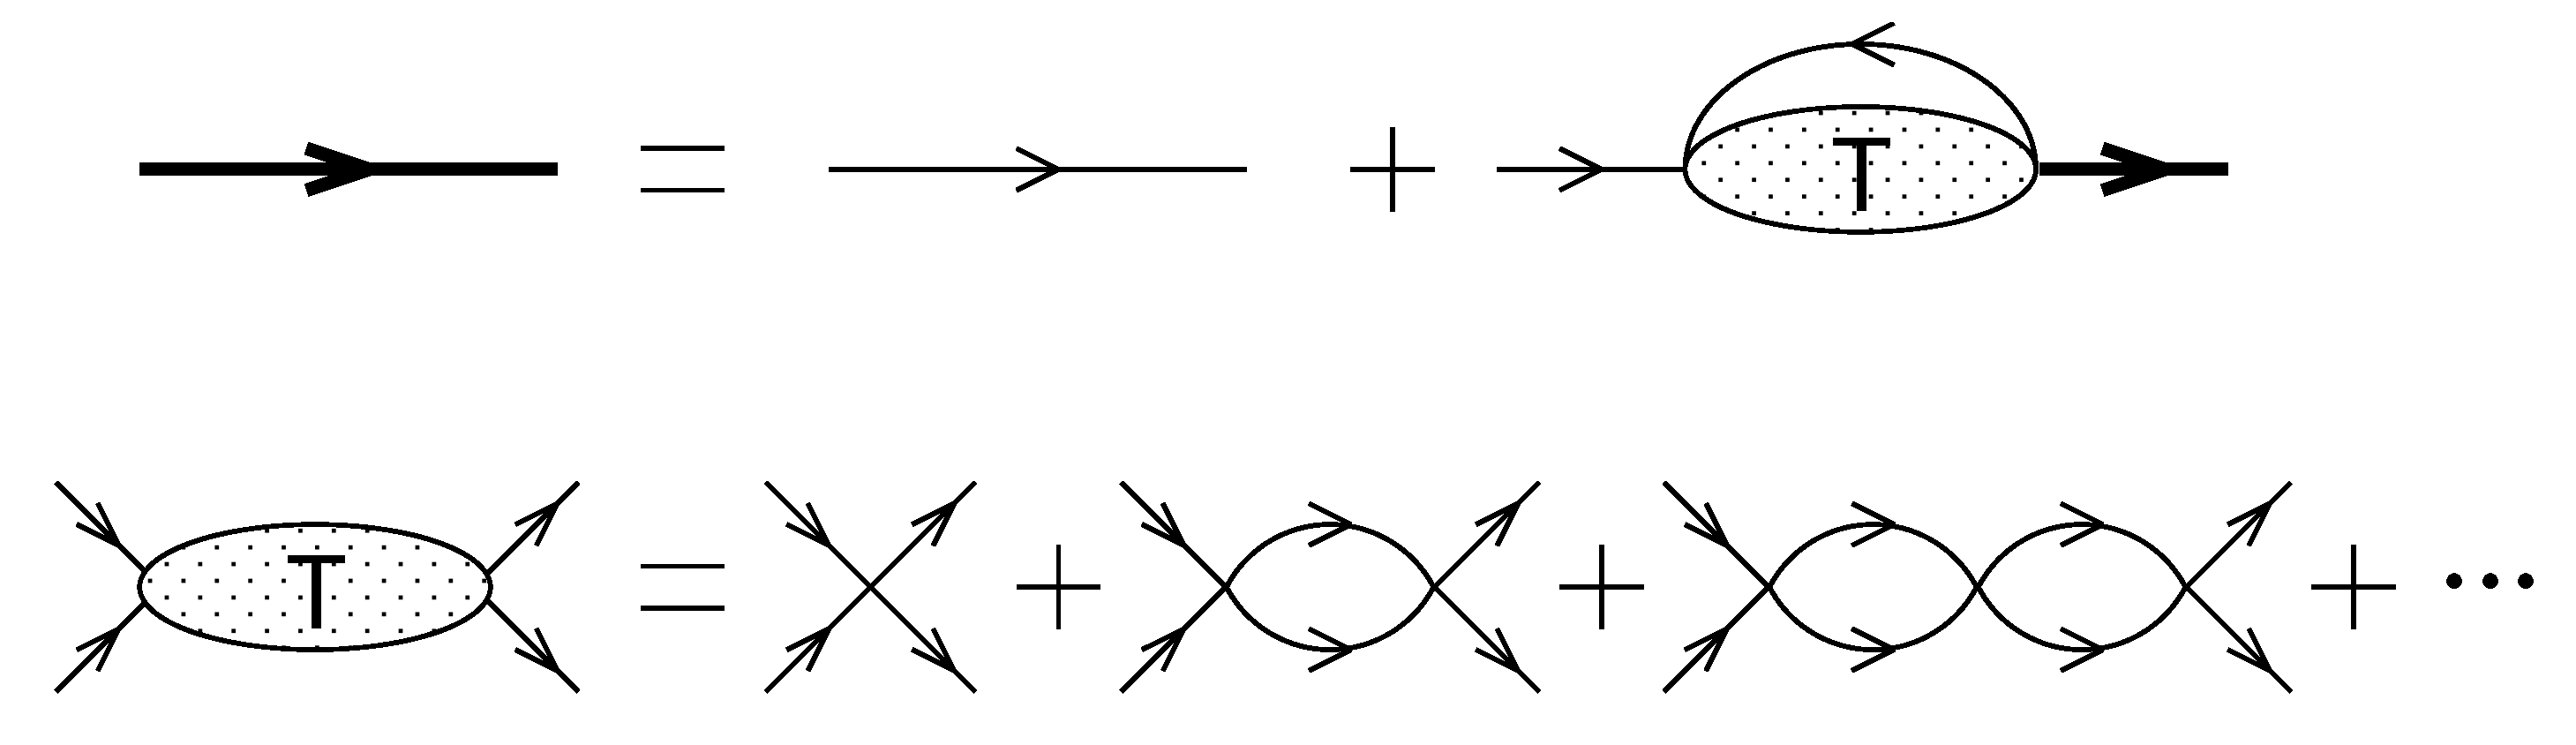
To calculate the quark Green’s function by incorporating the effects of the soft modes of the 2SC-PT, we employ the non-self-consistent T-matrix approximation [28,56], where the quark propagator is diagrammatically represented in Figure 3. The thin and bold lines in the figure represent the free and full propagators. In the Matsubara formalism, the quark self-energy in this approximation is given by
Σ ˜ ( p , ω n ) = 4 A = 2 , 5 , 7 ( λ A ) 2 T m d 3 k ( 2 π ) 3 Ξ ˜ D ( p + k , ω n + ω m ) G 0 ( k , ω m ) ,
where Ξ ˜ D ( p , ν n ) is the T-matrix in the imaginary-time formalism. In Equation (43), effects of the diquark soft modes are contained in the propagation of quarks through the T-matrix.
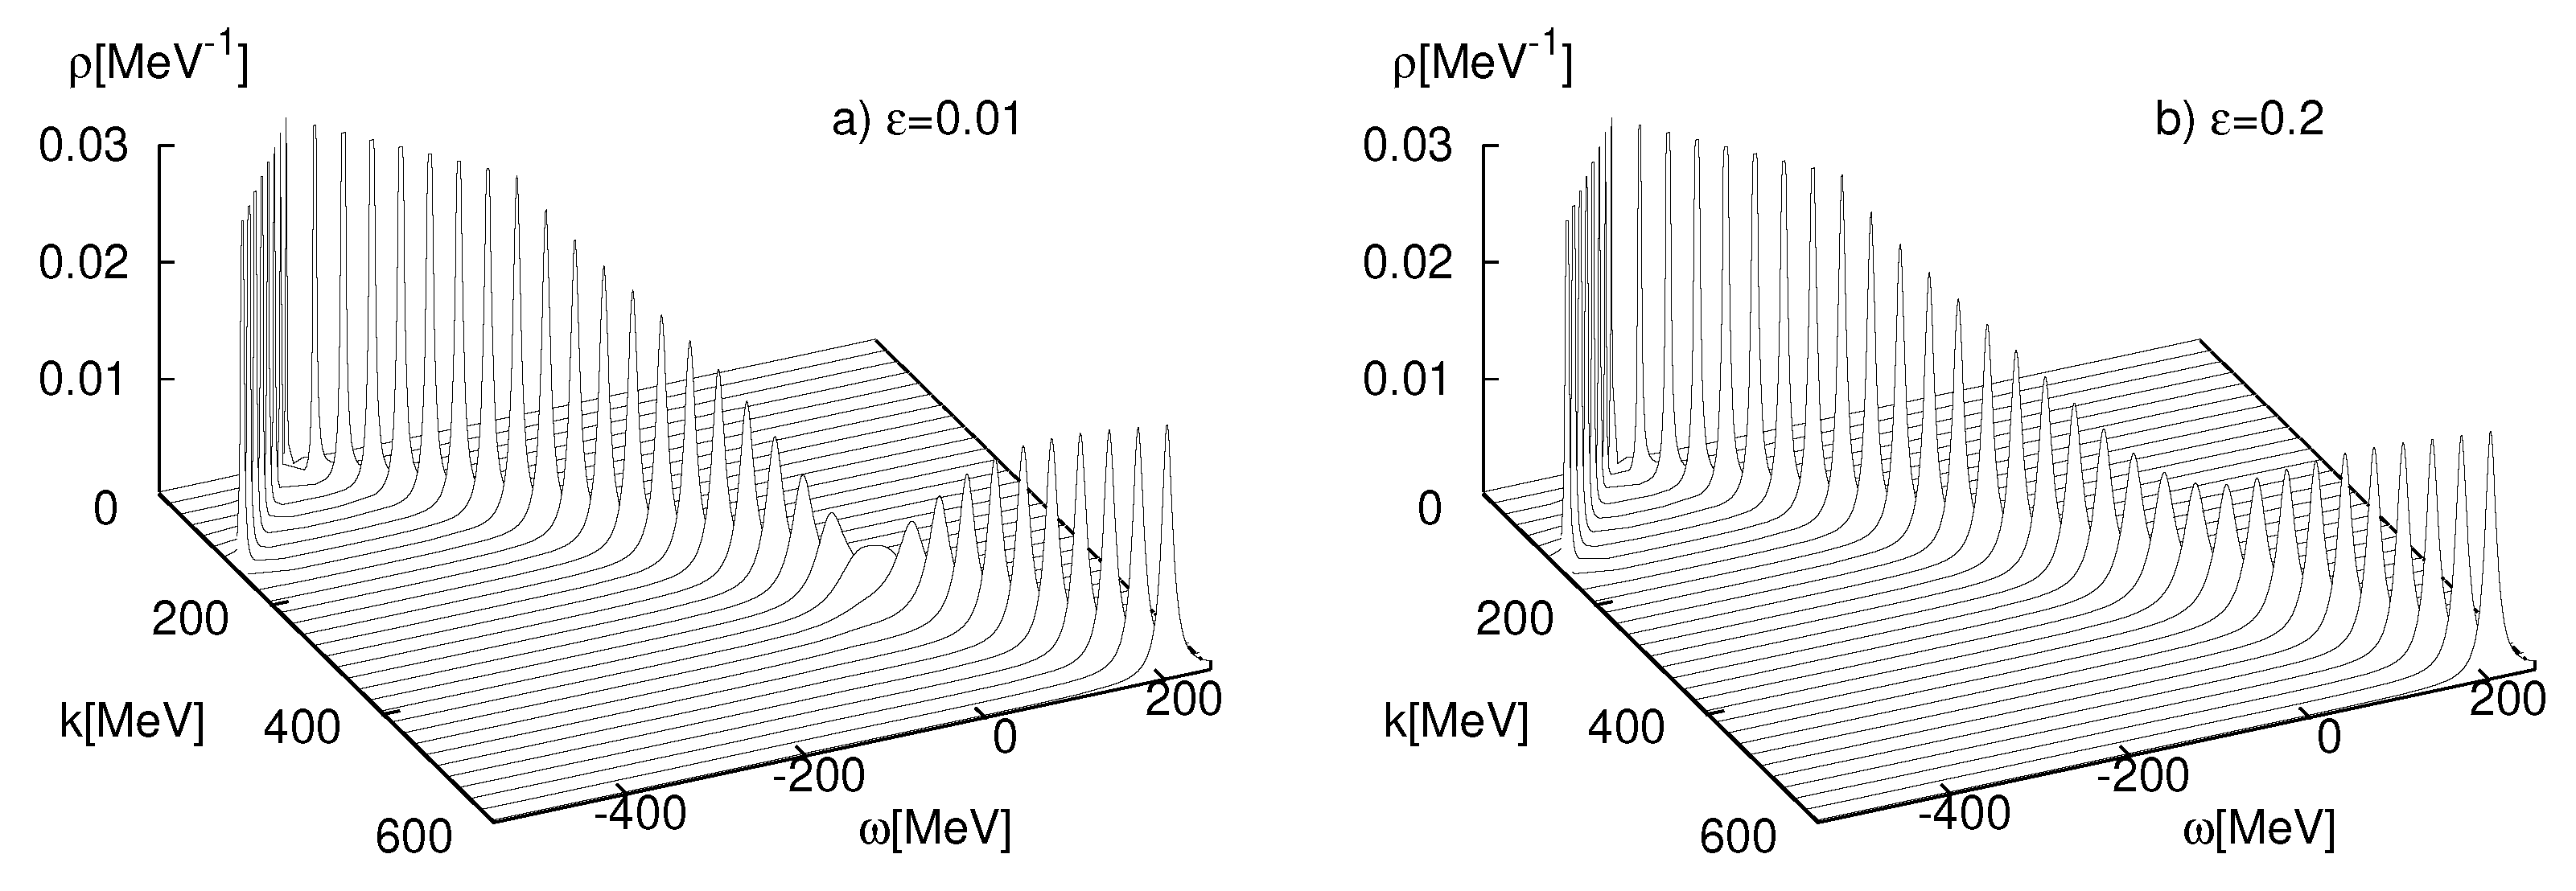
In Figure 4, we show the spectral function ρ 0 ( k , ω ) obtained in this approximation near the 2SC-PT at μ = 400 MeV and ε = 0.01 (left) and 0.2 (right) with ε = ( T T c ) / T c . One sees clear peak structures around ω = ± k μ in both figures, which correspond to the quasi-quark and anti-quark excitations, respectively. The quasi-quark peak has a clear depression around the Fermi energy ω = 0 , which means that the decay rate of quark excitations is enhanced there. The depression becomes more remarkable as ϵ decreases. This behavior is in contrast to that of the conventional Fermi liquid, in which the lifetime of the quasiparticles becomes longer as ω approaches the Fermi energy.
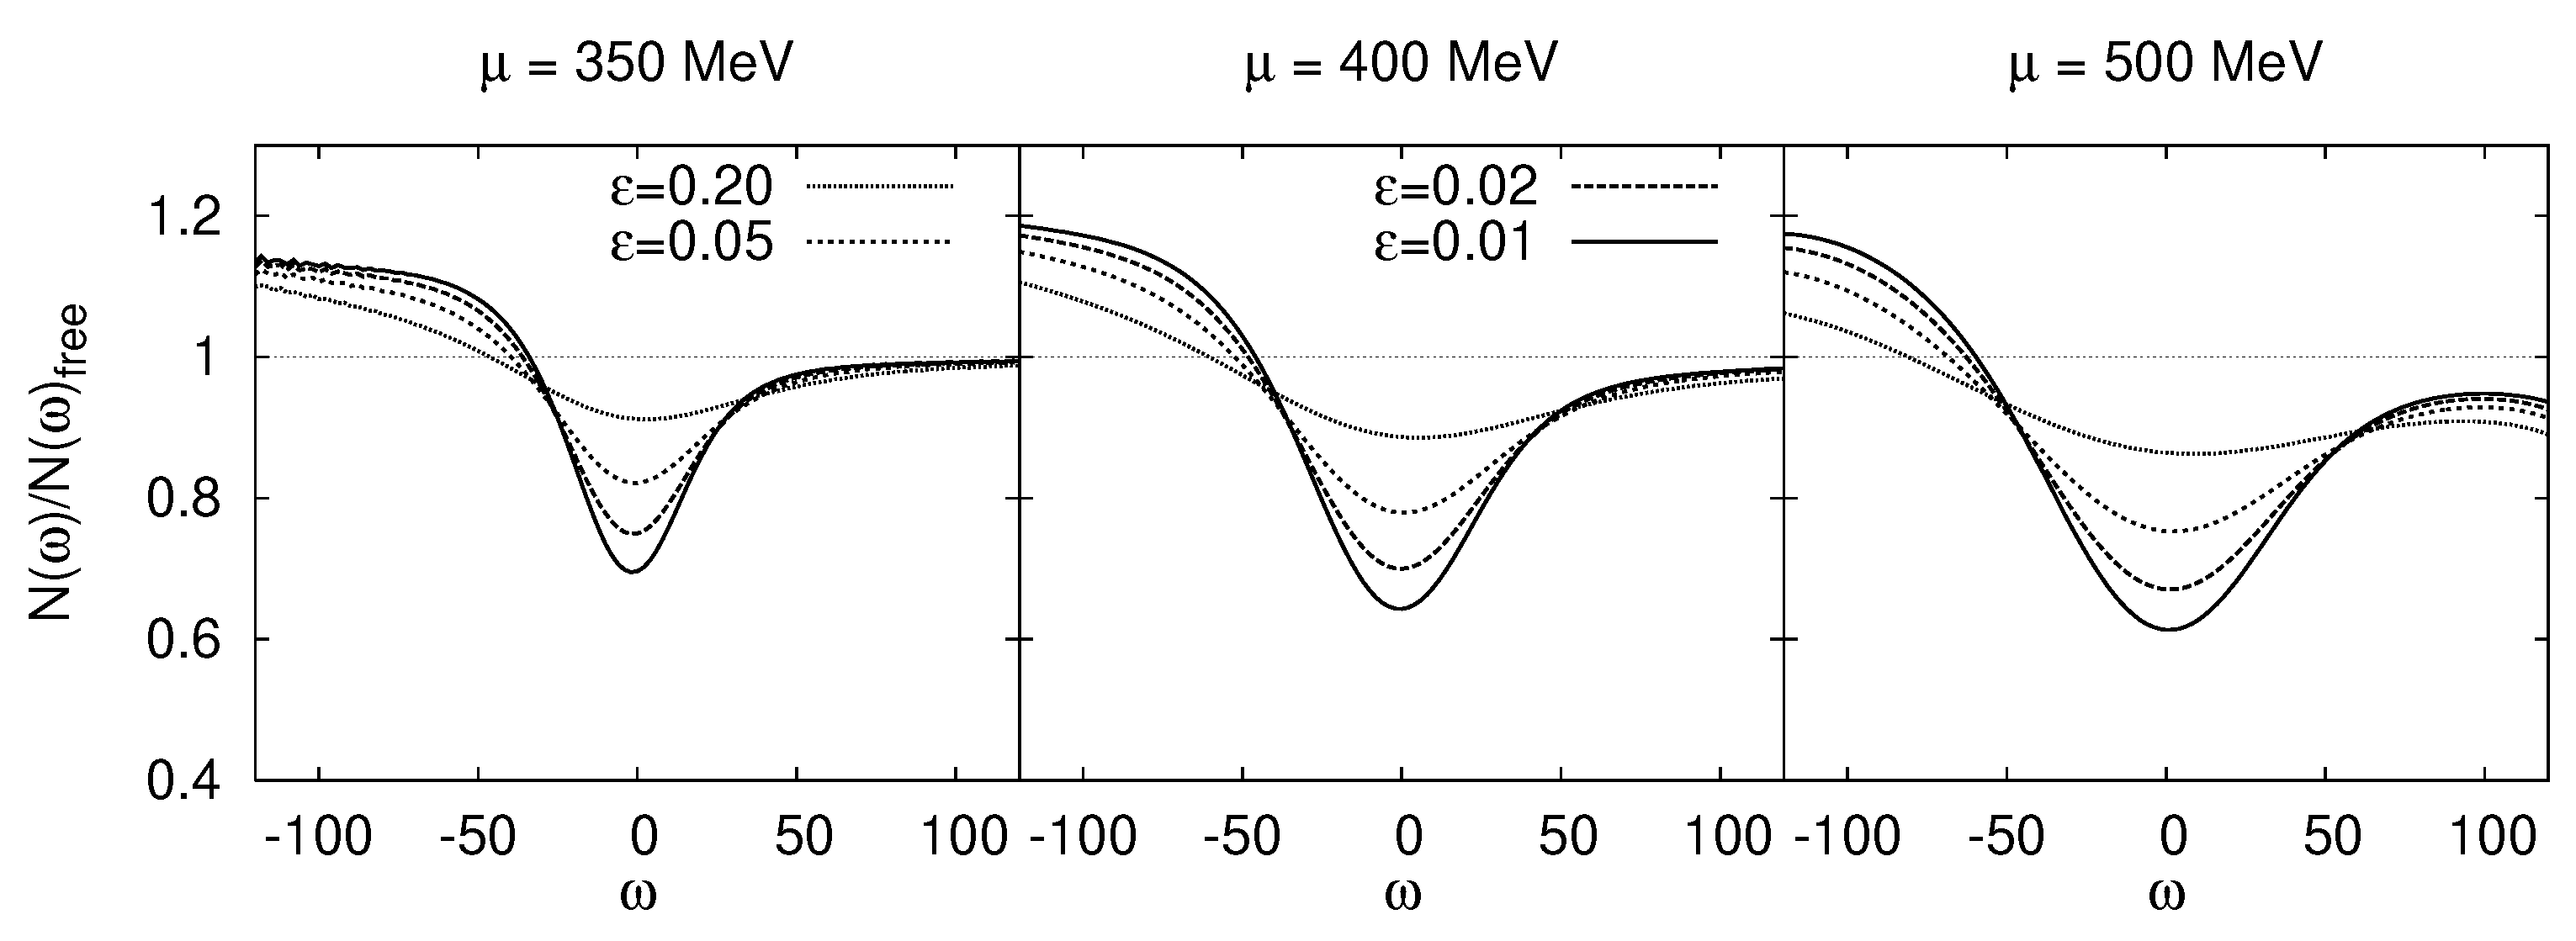
Substituting this spectral function into Equation (42), one obtains the quark DOS N ( ω ) . In Figure 5, we show the DOS normalized by that of the free quarks, N free ( ω ) = 2 N f N c ( ω μ ) 2 / π 2 , for μ = 350 , 400 , a n d   500 MeV and several values of ϵ [56]. There appears clear depression in the DOS around the Fermi energy for ϵ = 0.01 for all μ , and the depression survives up to ϵ 0.05 . This result shows the pseudogap phenomenon of the color superconductivity. The appearance of the pseudogap in the quark DOS is naturally understood through the non-Fermi liquid behaviors in ρ 0 ( k , ω ) shown for the first time in Refs. [28,56].
Similar pseudogap phenomena owing to the soft modes of the QCD-CP have been explored in Ref. [58]. In this case, however, it was found that the quark spectrum has an intricate rich structure. In a thermal relativistic system, it is known that a simple boson-exchange interaction leads to the mass gap in fermionic excitations, called the thermal mass. When the boson that couples to the fermions is massless, the fermionic excitation has two branches, one of which is called the plasmino. It is also known that when the boson mass is non-zero and at the same order as T, the fermionic spectrum exhibits a three-peak structure [59,60]; in addition to the normal and plasmino modes, there emerges an almost massless mode. In Ref. [61], the emergence of such a three-peak structure is confirmed near the chiral phase transition in the chiral limit at μ = 0 . The analysis is then extended to the QCD-CP in Refs. [57,58].
Whereas the present calculation employs the non-self-consistent T-matrix approximation, self-consistency is expected to modify quantitative features, such as the width and depth of the pseudogap through feedback effects on the quark propagator, as is known in cold atoms [62,63,64]. This also seems to be the case for a three-dimensional Fermi gas analyzed by the functional renormalization group (FRG) approach in the real-time formalism [64], which suggests that the inclusion of vertex corrections might change the situation. An application of the FRG with vertex corrections in the real-time formalism [19,20,64,65] to the problem of color superconductivity is highly desirable but left for future work.

5. Electric Conductivity and Dilepton Production Rates

In this section, we explore the effects of the soft modes on the electric conductivity and dilepton production rates (DPRs) near the 2SC-PT and QCD-CP. These quantities are derived from the retarded photon self-energy
Π R μ ν ( k , ω ) = d 4 x e i ω t i k · x [ j μ ( x , t ) , j ν ( 0 , 0 ) ] θ ( t ) ,
with the electric current operator j μ ( x , t ) . The electric conductivity σ is given by the low-energy limit of Equation (44) as
σ = 1 3 lim ω 0 1 ω i = 1 3 Im Π R i i ( 0 , ω ) ,
and the DPR is related to Π R μ ν ( k , ω ) as
d 4 Γ d 4 k = α 12 π 4 1 k 2 1 e ω / T 1 g μ ν Im Π R μ ν ( k ) ,
where α = e 2 / 4 π is the fine structure constant.
Thus, our first task is to construct the photon self-energy Π R μ ν ( k , ω ) by incorporating the effects of the soft modes to satisfy the Ward–Takahashi (WT) identity. In this construction, we take it for granted that Π R μ ν ( k , ω ) consists of three parts
Π R μ ν ( k , ω ) = Π free R μ ν ( k , ω ) + Π D R μ ν ( k , ω ) + Π S R μ ν ( k , ω ) ,
where Π D R μ ν ( k , ω ) and Π S R μ ν ( k , ω ) are the contributions from the soft modes of the 2SC-PT and QCD-CP, respectively, and Π free R μ ν ( k , ω ) is the self-energy of the free-quark system, which is derived from the Matsubara Green’s function given by
Π ˜ free μ ν ( k ) = N c C em p Tr D [ γ μ G 0 ( p + k ) γ ν G 0 ( p ) ] ,
with C em e u 2 + e d 2 , where e u = 2 | e | / 3 ( e d = | e | / 3 ) is the electric charge of the up (down) quark with e being the electron charge.

5.1. Photon Self-Energy

5.1.1. Contribution of the Soft Modes of 2SC-PT

A gauge-invariant construction of Π D R μ ν ( k , ω ) with the effects of the soft modes of the 2SC-PT being incorporated can be performed through the calculation of the lowest contribution of the soft modes to the thermodynamic potential
Ω D = 3 p ln [ G D Ξ ˜ D 1 ( p ) ] ,
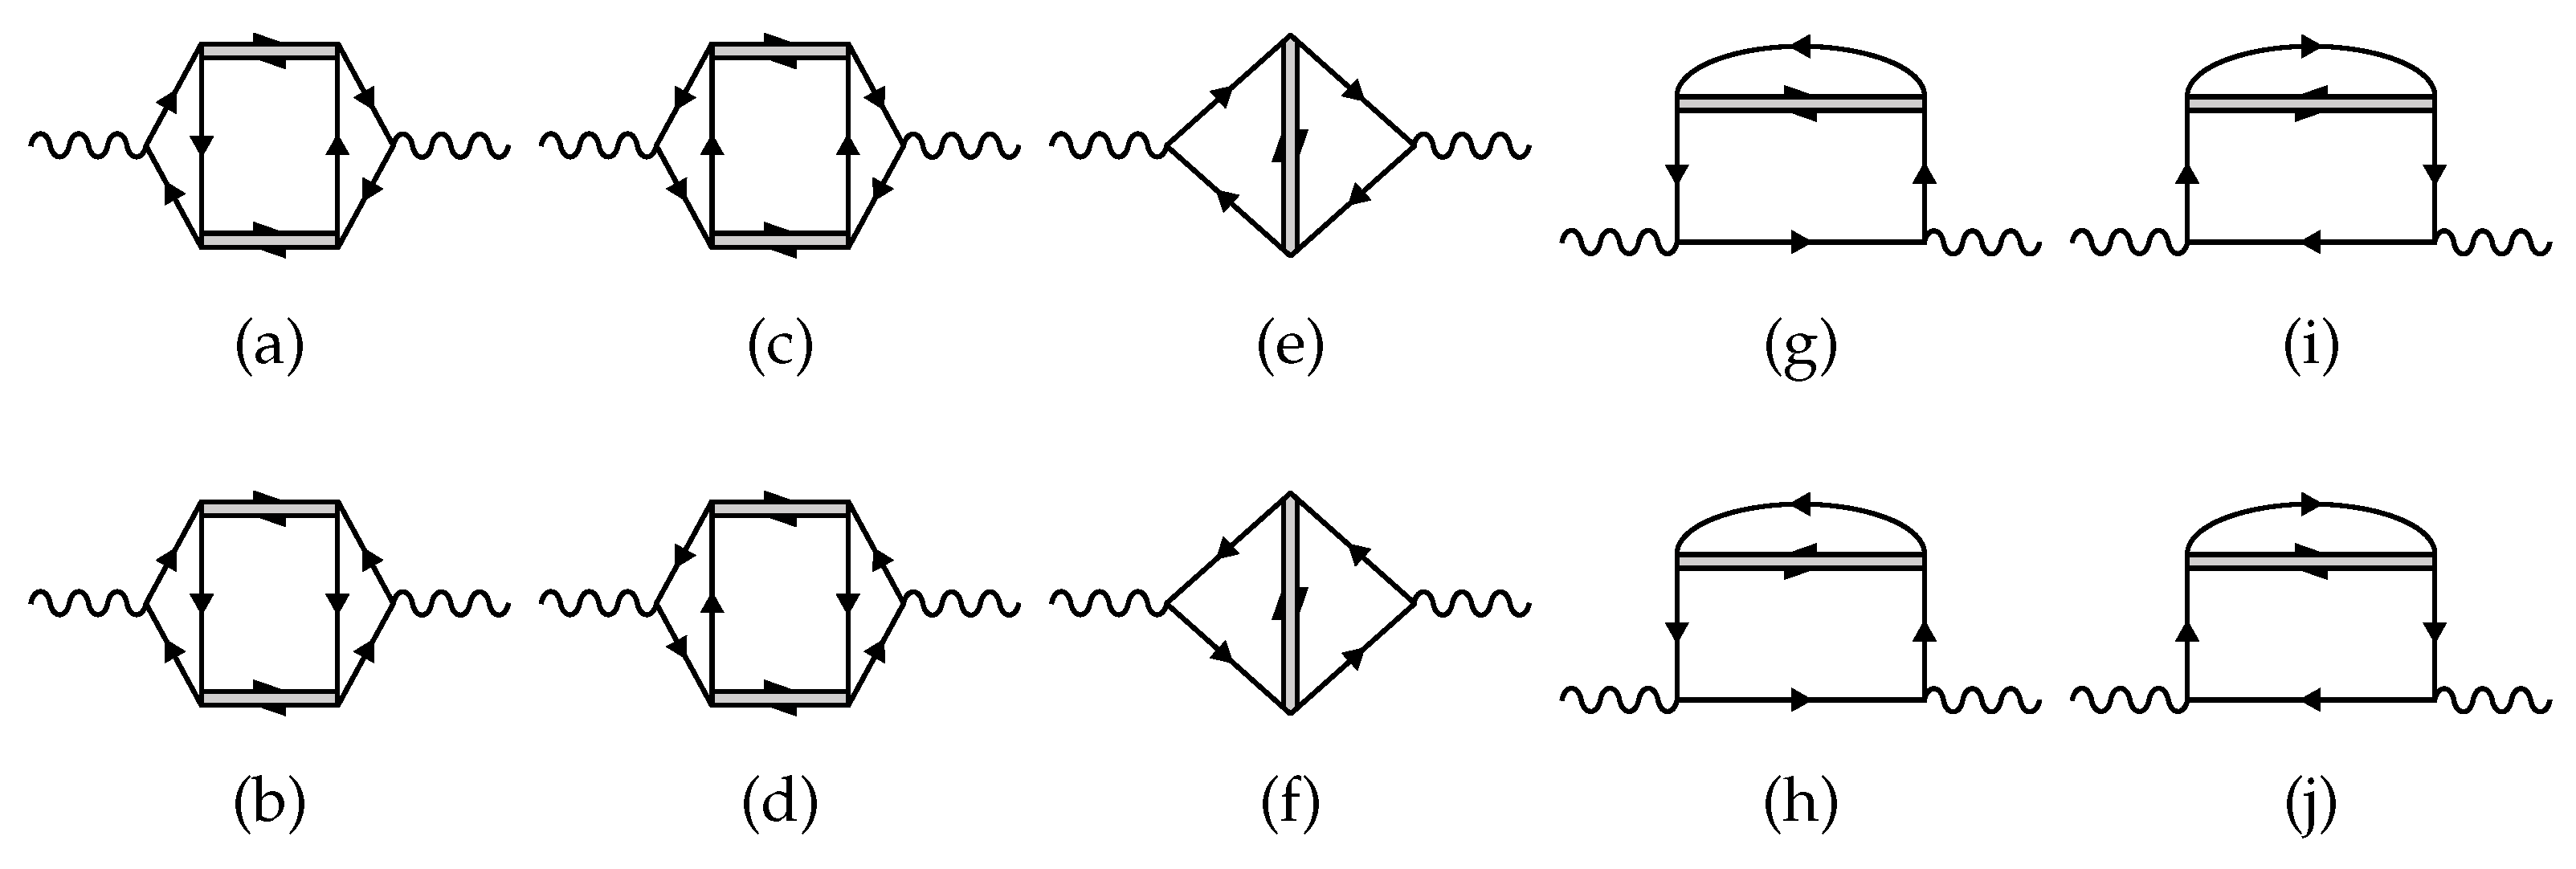
which is the one-loop diagram of Ξ ˜ D ( p ) given in Figure 6, where Ξ ˜ D ( p ) is the imaginary-time T-matrix corresponding to Equation (16) and the coefficient 3 is the number of the anti-symmetric channels of the diquark modes. Then, the photon self-energy satisfying the WT identity is simply given by attaching electromagnetic vertices at any two points on the quark lines in Ω D . This procedure leads to the four types of diagrams shown in Figure 7; we call the respective terms (a) Aslamazov–Larkin (AL) [39], (b) Maki–Thompson (MT) [40,41], and (c, d) density of states (DOS) following the theory of metallic superconductivity [42]. Thus, the photon self-energy in the imaginary-time formalism, Π ˜ D μ ν ( k ) , takes the form
Π ˜ D μ ν ( k ) = Π ˜ AL , D μ ν ( k ) + Π ˜ MT , D μ ν ( k ) + Π ˜ DOS , D μ ν ( k ) ,
where Π ˜ AL , D μ ν ( k ) , Π ˜ MT , D μ ν ( k ) , and Π ˜ DOS , D μ ν ( k ) are the AL, MT, and DOS terms, respectively.
The AL, MT, and DOS terms are further decomposed into the vertex functions and the T-matrices. In the numerical analyses, the LE or TDGL approximation will be employed for the T-matrix Ξ ˜ D ( q ) in these terms, and the vertex functions are determined so as to satisfy the Ward identities for the vetices [29] with these approximated T-matrices.
When the LE approximation is adopted, one can show that the MT and DOS terms in Im Π R i j ( k , ω ) exactly cancel out with each other as [66]
Im Π MT , D R i j ( k , ω ) + Π DOS , D R i j ( k , ω ) = 0 .
Since the electric conductivity and the DPR solely depend on Im Π R i j ( k , ω ) as in Equations (45), (46), and (51), it tells us that only the AL term remains to contribute to these quantities.

5.1.2. Contribution of the Soft Modes of QCD-CP

Next, we calculate the modification of the photon self-energy Π S R μ ν ( k , ω ) due to the soft modes of the QCD-CP [30].
Again, we begin with the lowest-order contribution of the soft mode of the QCD-CP to the thermodynamic potential Ω S = p ln [ G S Ξ ˜ S 1 ( p ) ] , shown in Figure 8. Then, much the same way as the previous analysis, by attaching electromagnetic vertices at any two different points of quark lines in Ω S , we arrive at ten types of diagrams shown in Figure 9, where the number of diagrams is larger than that in Figure 7 because the directions of quark lines in the vertices should be distinguished in this case. We refer to the diagrams (a)–(d) as the AL, (e), (f) as the MT, and (g)–(j) as the DOS terms, respectively, with a clear reason. The respective contributions to the photon self-energy in the imaginary-time formalism are written as
Π ˜ S μ ν ( k ) = Π ˜ AL , S μ ν ( k ) + Π ˜ MT , S μ ν ( k ) + Π ˜ DOS , S μ ν ( k ) .
As in the previous subsection, we use the LE or TDGL approximation for Ξ ˜ S ( q ) and determine the vertex functions so that they satisfy the Ward identities between the vertex functions and Ξ ˜ S ( q ) . One can then show that the spatial components of MT and DOS terms in Im Π S R μ ν ( k , ω ) cancel out with each other. Thus, Im Π S R i j ( k , ω ) is again given solely by the AL term.

5.2. Electric Conductivity

Now, we apply the photon self-energy obtained above to the analysis of the electric conductivity σ . Since the photon self-energy consists of three contributions as given in Equation (47), the spectral function at zero momentum ρ ( ω ) = i Im Π R i i ( 0 , ω ) is also decomposed as
ρ ( ω ) = ρ free ( ω ) + ρ D ( ω ) + ρ S ( ω ) ,
with ρ free ( ω ) = i Im Π free R i i ( 0 , ω ) , and ρ γ ( ω ) = i Im Π γ R i i ( 0 , ω ) ( γ = D , S ). Among them, ρ free ( ω ) does not contribute to σ since ρ free ( ω ) = 0 for | ω | < 2 M . Near the 2SC-PT, ρ D ( ω ) dominates over ρ S ( ω ) , and the behavior of σ is described solely by ρ D ( ω ) , and vice versa.
Before discussing the numerical results, it is instructive to explore the behaviors of σ near the 2SC-PT and QCD-CP analytically.
In the case of the 2SC-PT, as T approaches T c , the dominant contribution to the AL term comes from ( | q | , ω ) = ( 0 , 0 ) of Ξ D R ( k , ω ) . This justifies the use of the TDGL approximations (28), and one obtains
σ = 3 e Δ 2 T 16 π 1 a D 1 / 2 b D 1 / 2 | c D | 2 Im c D T ϵ 1 / 2 .
This result shows that σ diverges at T = T c with the critical exponent 1 / 2 , which corresponds to the mean-field value. Equation (54) also tells us that the magnitude of σ does not have any explicit dependence on μ nor G D , implying that σ is insensitive to μ around the 2SC-PT.
Next, we consider the case of the QCD-CP. In this case, the use of the TDGL approximation (37) leads to
ρ S ( ω ) ω | ω = 0 = ( e u 2 + e d 2 ) T 2 π 3 Im c S a S tan 1 Im c S a S .
Using Equation (38), we then obtain asymptotic behaviors
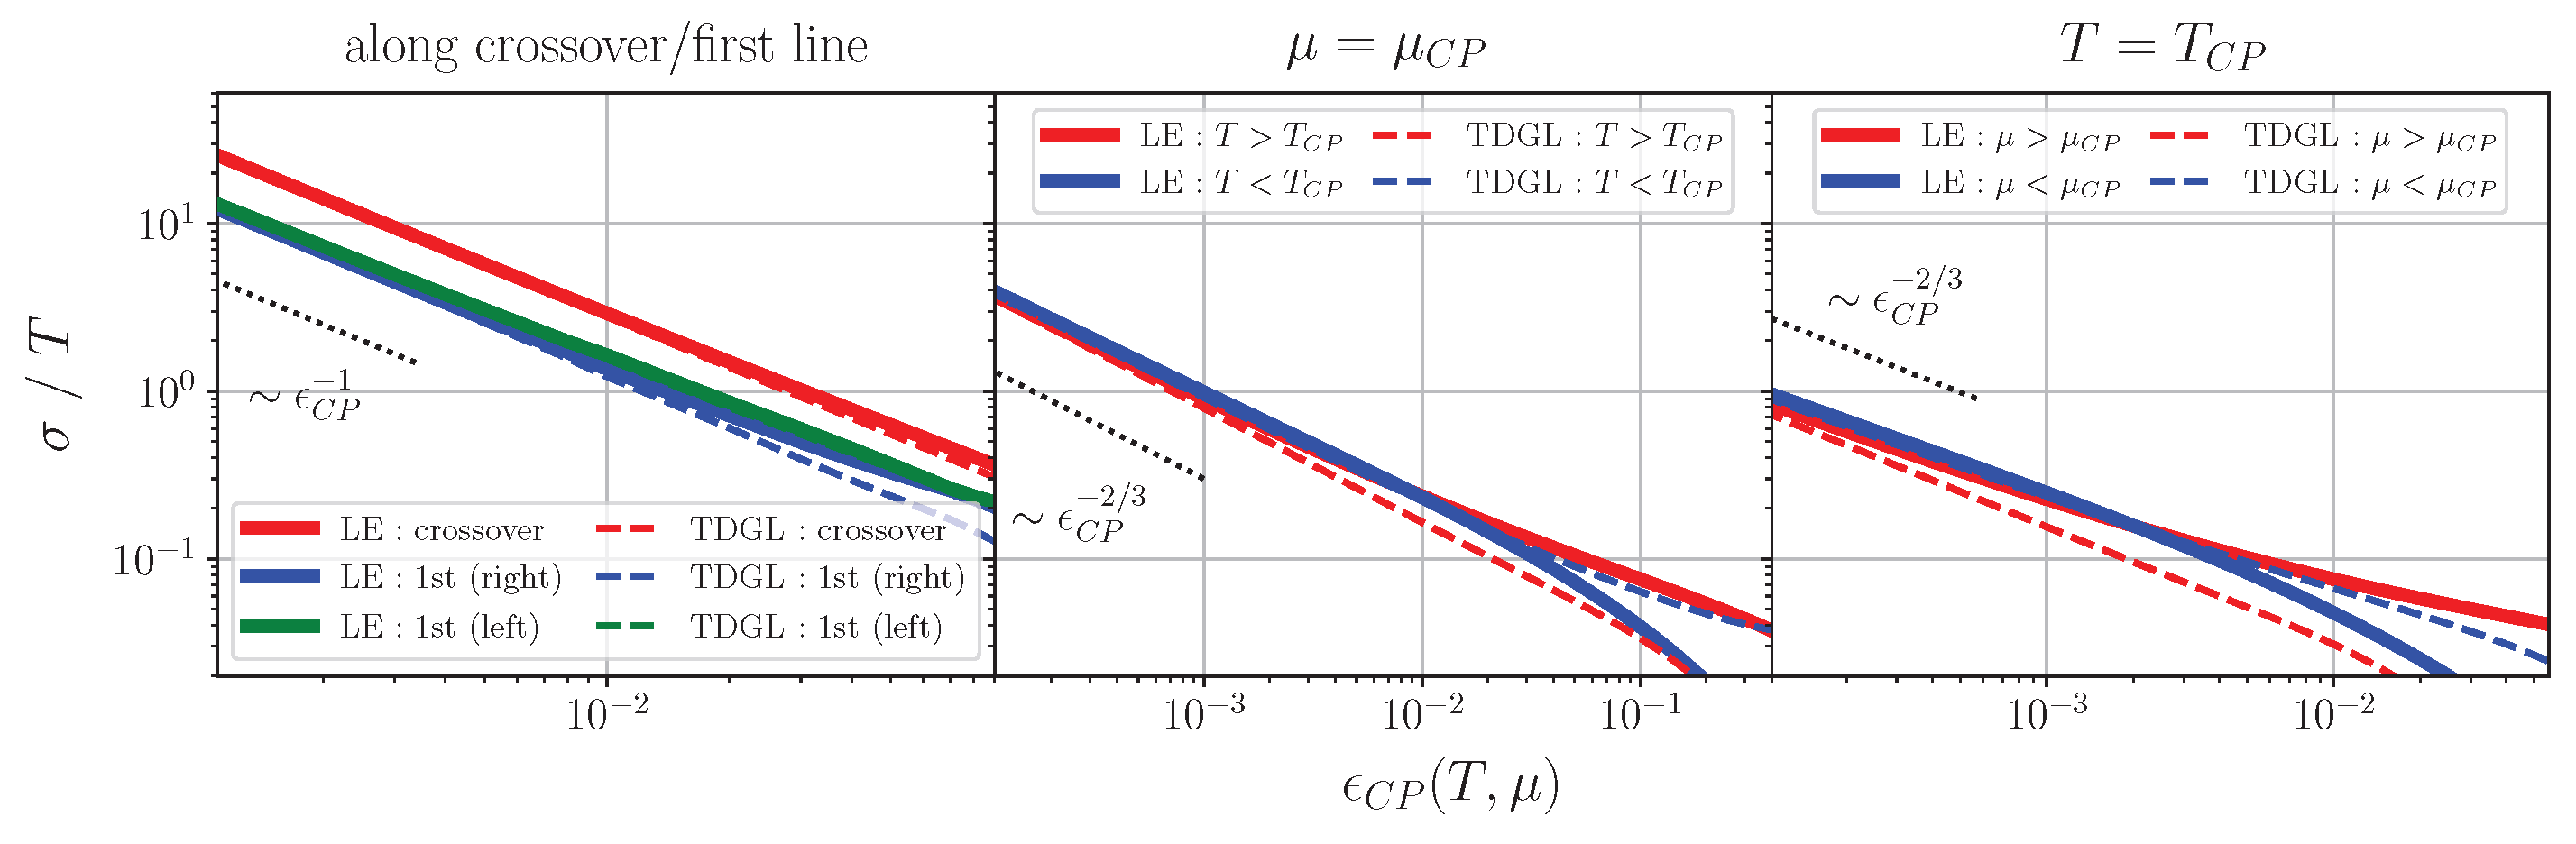
σ 1 a S ϵ CP 1 along the first order PT or crossover transition lines , ϵ CP 2 / 3 otherwise .
Note that this singular behavior originates from that in 1 / a S defined in Equation (37) based on a low-energy expansion fully valid when ( ω , k ) is kept within the space-like region. Indeed, the spectral function relevant to the soft mode in this case has support only in the space-like region. The critical exponent obtained here is based on this fine infrared structure rather than an ordinary Taylor expansion around ( ω , k ) = ( 0 , 0 ) where the spectral function for the soft mode of the QCD-CP is singular.
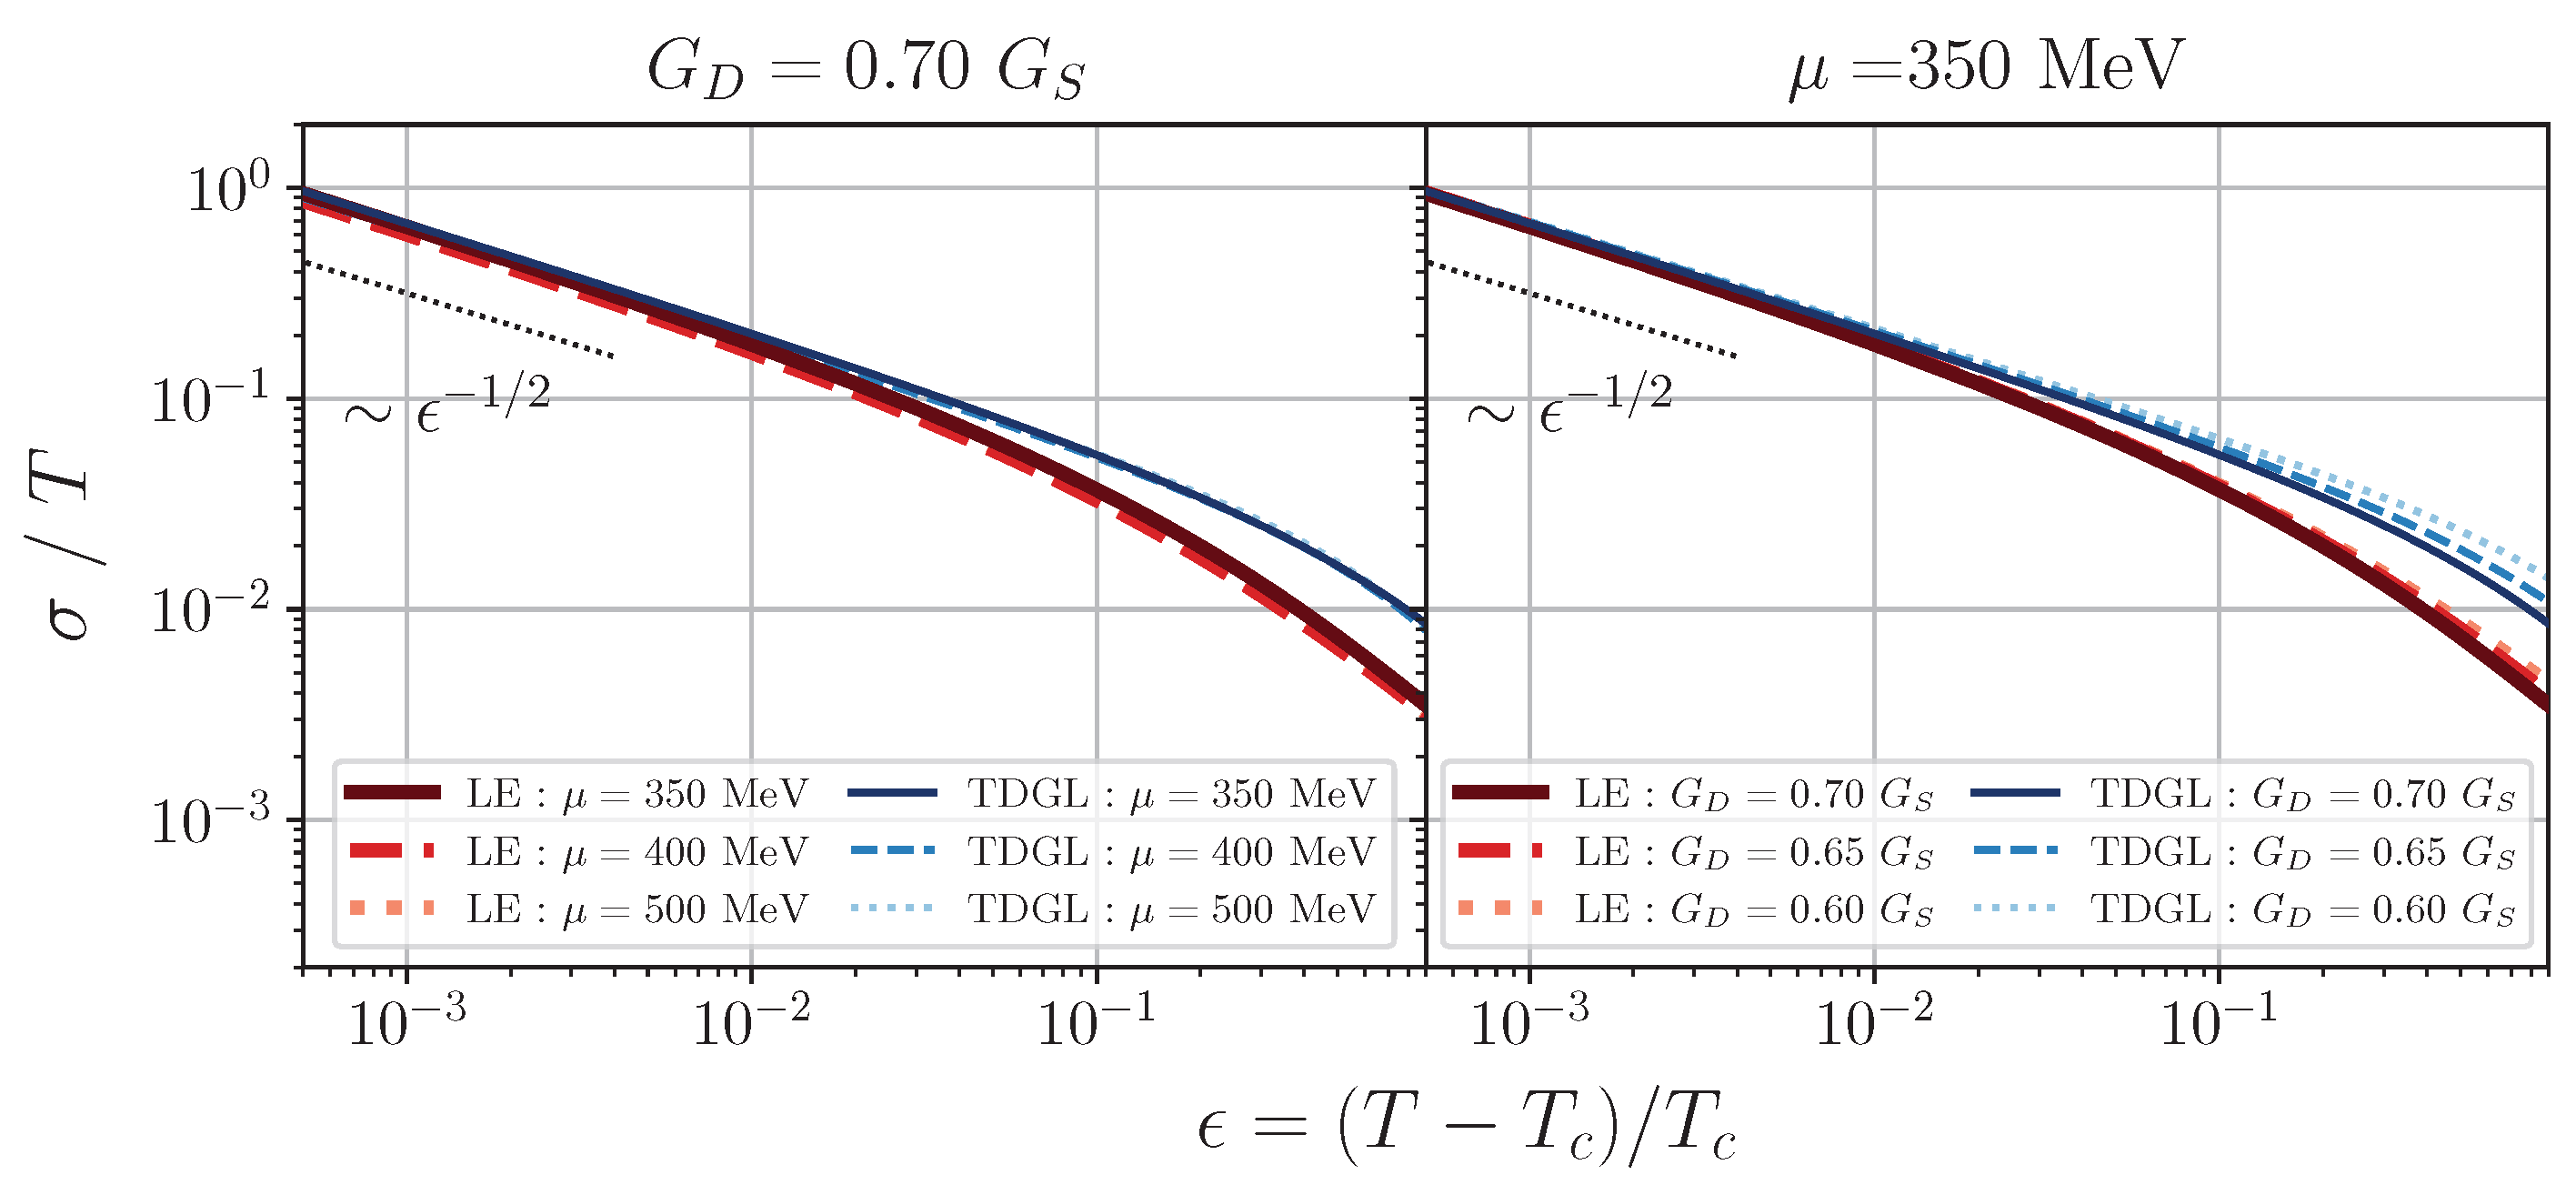
Next, let us examine the behavior of σ near the 2SC-PT and QCD-CP numerically. Figure 10 shows σ / T as a function of ϵ = ( T T c ) / T c . The left panel shows the results for μ = 350 , 400 , 500 MeV with fixed G D / G S = 0.7 , while the value of G D is varied at μ = 350 MeV in the right panel. The thick red and thin blue lines show the results in the LE and TDGL approximations, respectively: The figure shows that σ / T increases toward T c according to the critical scaling predicted in Equation (54), indicated by the dotted lines. As the critical point is approached, the LE and TDGL results converge, while their deviation becomes increasingly significant away from T c , i.e., for larger ϵ . Moreover, the numerical results verify that σ / T depends only weakly on μ and G D , in agreement with the analytical prediction of Equation (54).
Figure 11 presents the numerical results for the QCD-CP as functions of ϵ CP [38]. In the left panel, both T and μ are varied along the phase transition line. On the first-order side, the results are shown for the two coexisting phases on the transition line. For the crossover region ( T > T CP ), the transition line is identified by the location where the chiral susceptibility, χ M = 2 Ω / M 2 , reaches its maximum at each temperature. The middle panel shows the results obtained by varying T at fixed μ = μ CP , whereas the right panel corresponds to varying μ with T = T CP held constant. The LE and TDGL results are represented by the thick and thin curves, respectively, while the thin dotted lines denote the critical exponents predicted in Equation (56). As in the previous case, the numerical results closely follow the analytical predictions in the vicinity of the QCD critical point.
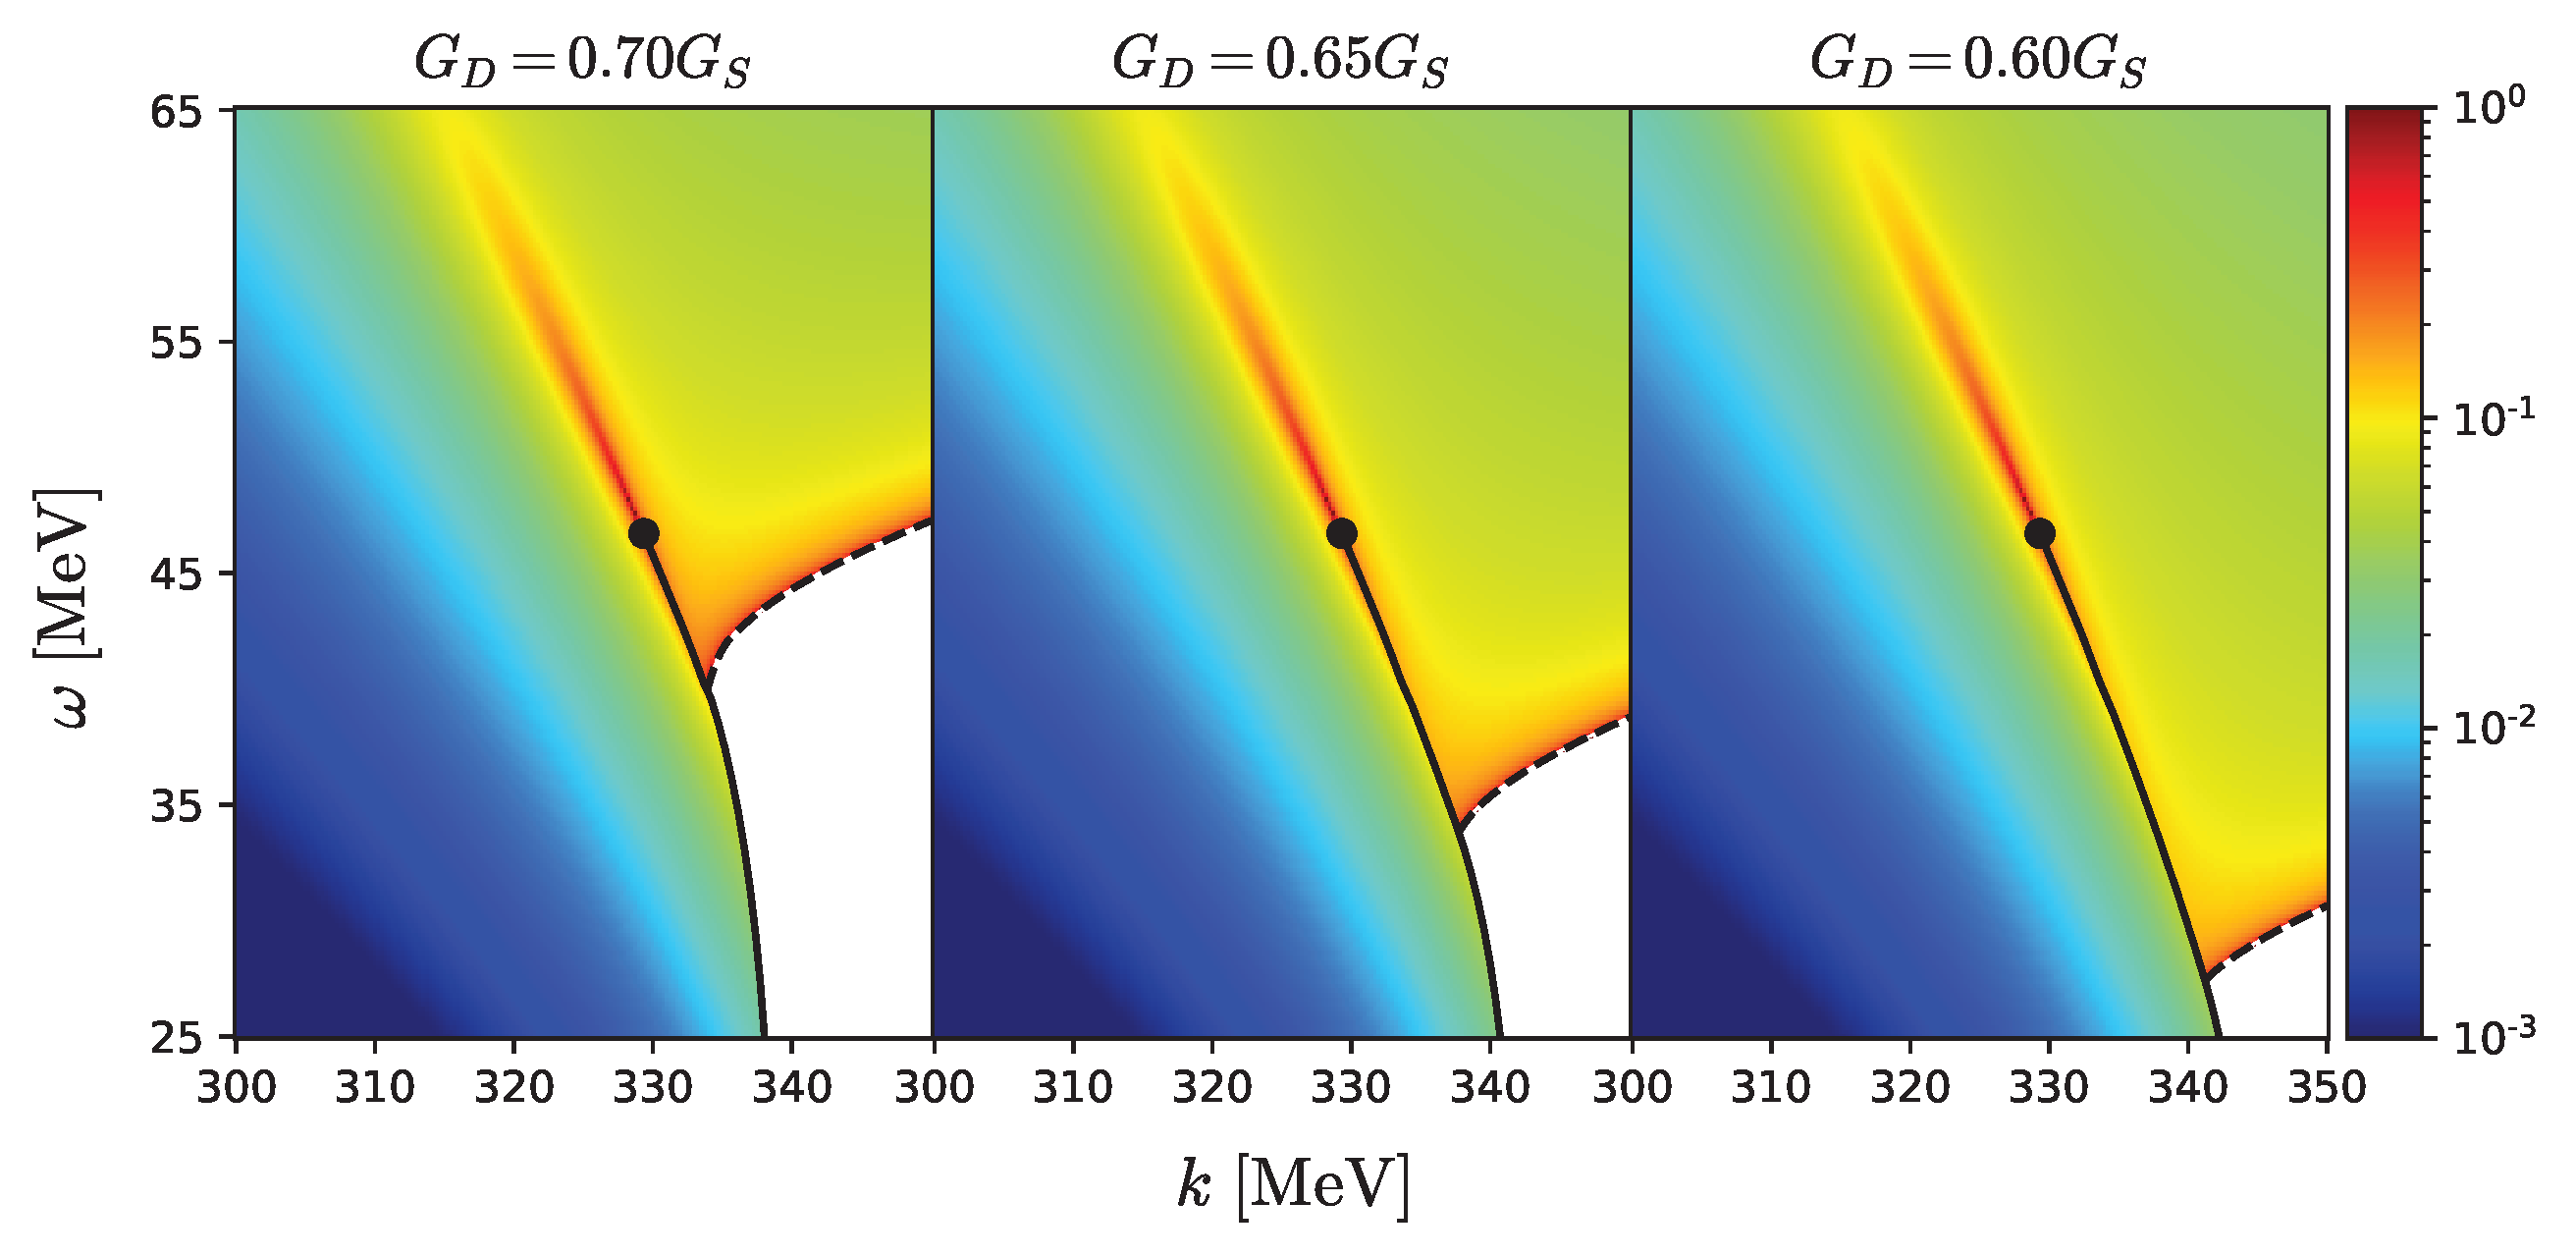
Figure 12 summarizes the global behavior of σ / T in the T μ plane when the effects of the QCD-CP and the 2SC-PT are taken into account simultaneously [38]. The color maps display the LE results for three values of the diquark coupling, G D / G S = 0.70 , 0.65 , and 0.60 . The solid and dashed curves represent the first-order transition line and the second-order 2SC-PT, respectively. Since the present formalism is not applicable inside the 2SC phase with Δ 0 , this region is left blank.
The figure clearly shows that σ / T is enhanced in the vicinity of both the QCD-CP and the 2SC-PT. Around the QCD-CP, the enhancement extends along the critical line running parallel to the first-order transition line. Of particular interest is the emergence of two distinct enhancement regions of σ , which may have important implications for beam-energy scan experiments in HICs. In particular, they could give rise to two separate non-monotonic structures in experimental observables as functions of the collision energy. We return to this point in the next subsection.
A remark is in order here. A similar analysis is found to reveal a diverging behavior of the relaxation time and correlation length around the respective critical points [38]: For instance, Equation (34) tells us that both the relaxation time and the correlation length increase in a diverging way with respective exponents when the system approaches the critical point in the case of CSC. Moreover, Equation (32) shows that the divergent behaviors come from the singular behavior of a D . Thus, a more intricate but similarly singular behavior of a S given in Equation (38) will lead to similar singular behaviors of the relaxation time and correlation length also in the case of QCD-CP.

5.3. Dilepton Production Rates

Finally, we focus on the DPR, which is an experimentally observable quantity in the HIC. As the DPR is extracted from the photon self-energy as in Equation (46), we calculate it using Π R i j ( k , ω ) obtained in Section 5.1.
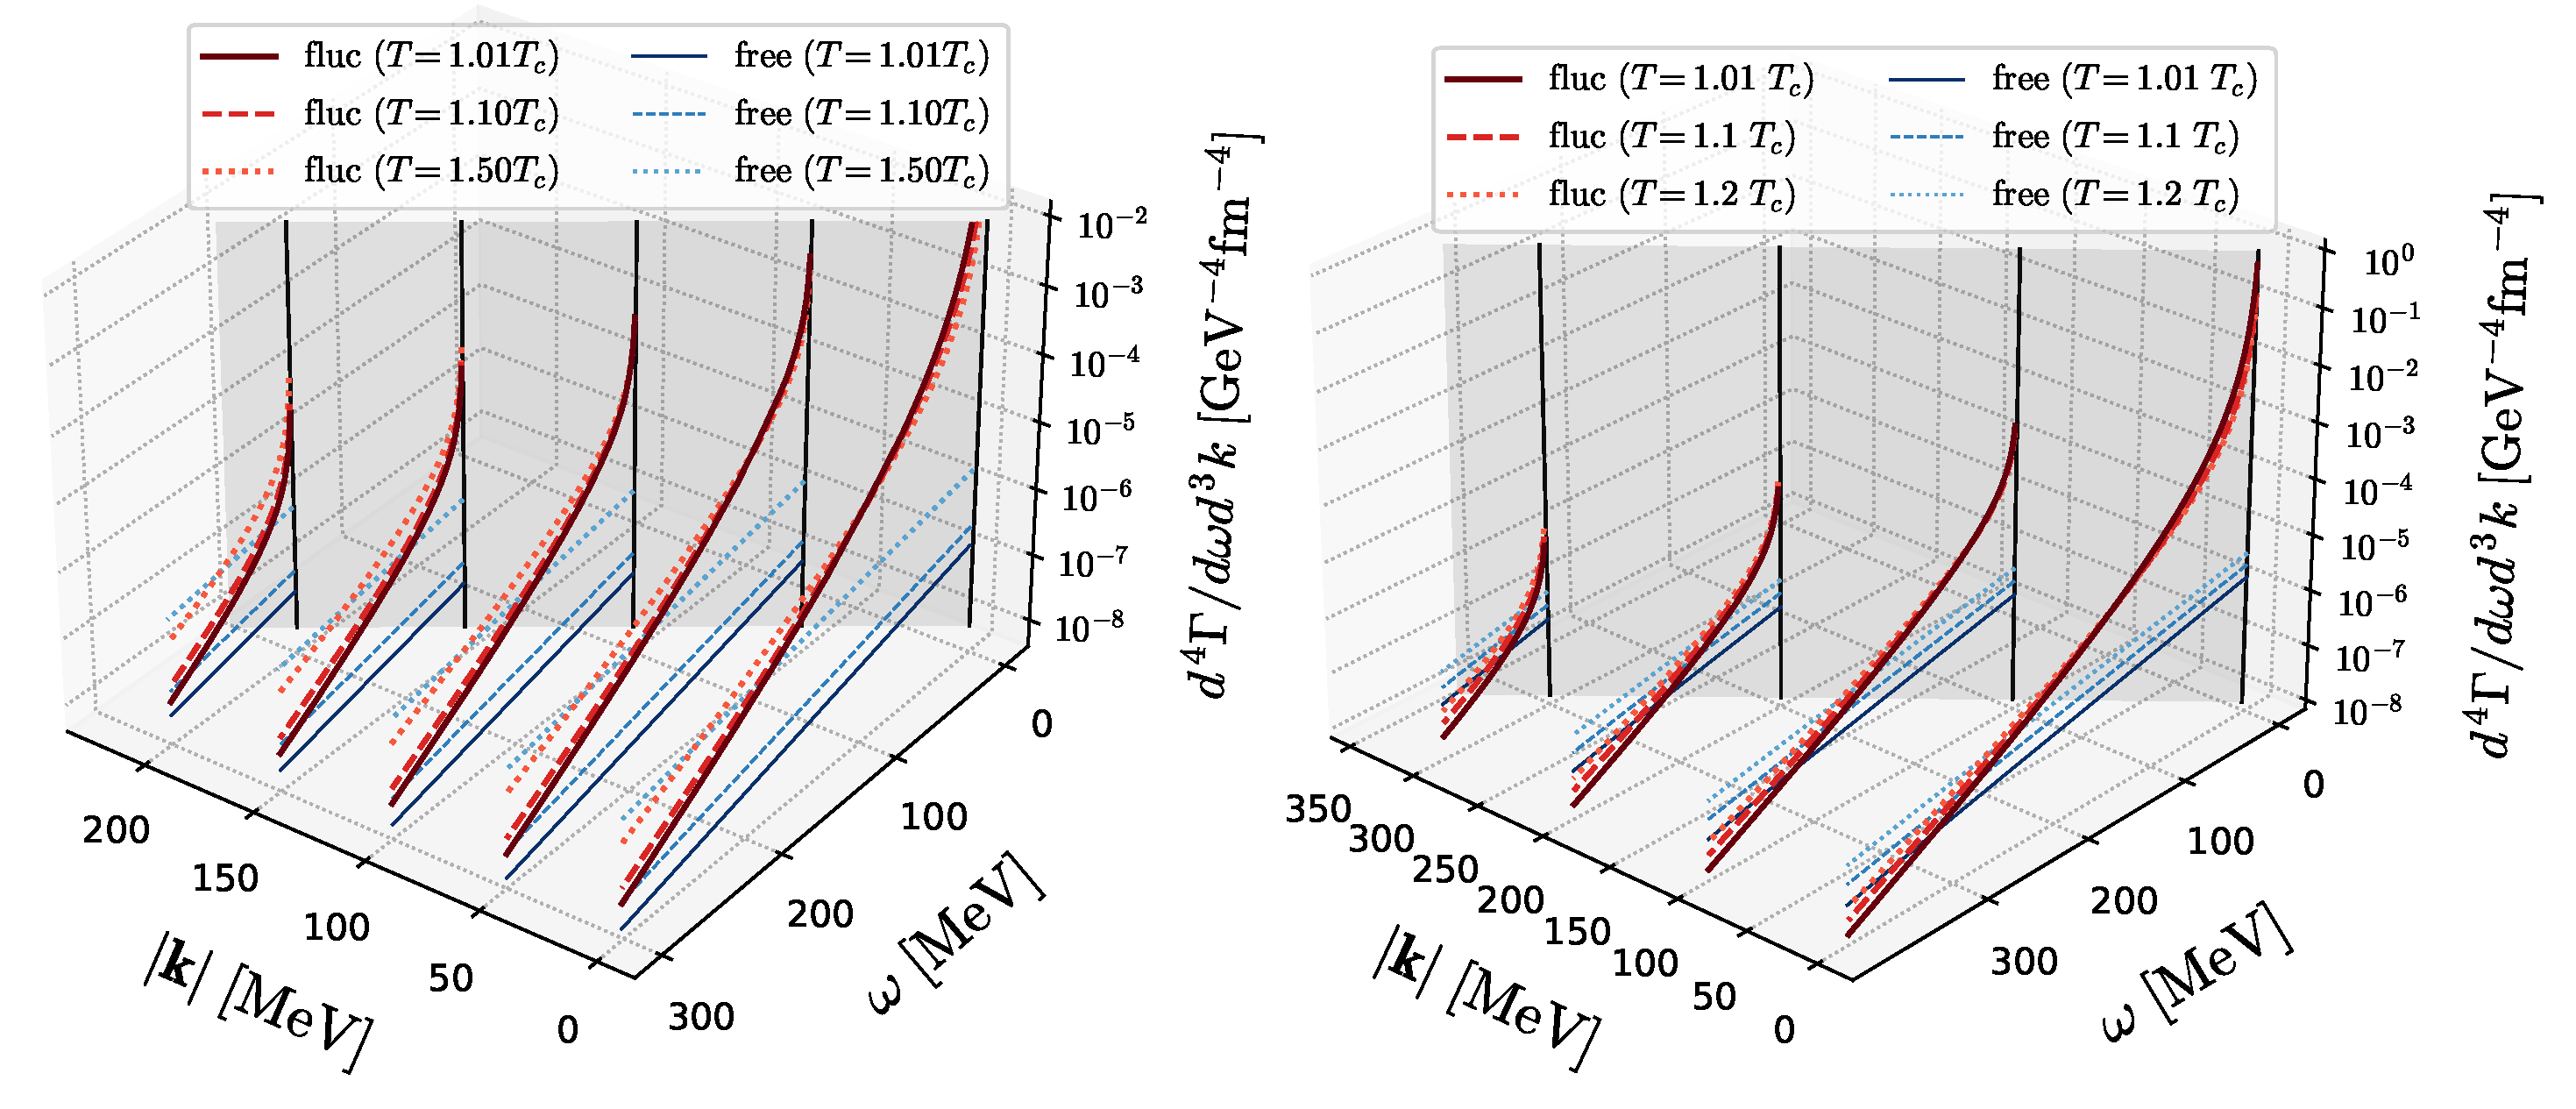
The left panel of Figure 13 presents the DPR per unit energy ω and momentum k in the vicinity of the 2SC-PT for T / T c = 1.01 , 1.1 , and 1.5 , with μ = 350 MeV and G D = 0.7 G S [29]. The thick curves show the contribution from the soft modes, whereas the thin curves correspond to the free quark gas. The figure demonstrates that, for T 1.5 T c , the soft-mode contribution is strongly enhanced in the low- ω and low- k region compared with the free quark gas. This enhancement becomes increasingly pronounced as the system approaches T c , reflecting the critical behavior of the soft modes. We note that a similar enhancement of the photon production rate near the QCD-CP has been discussed in Ref. [67].
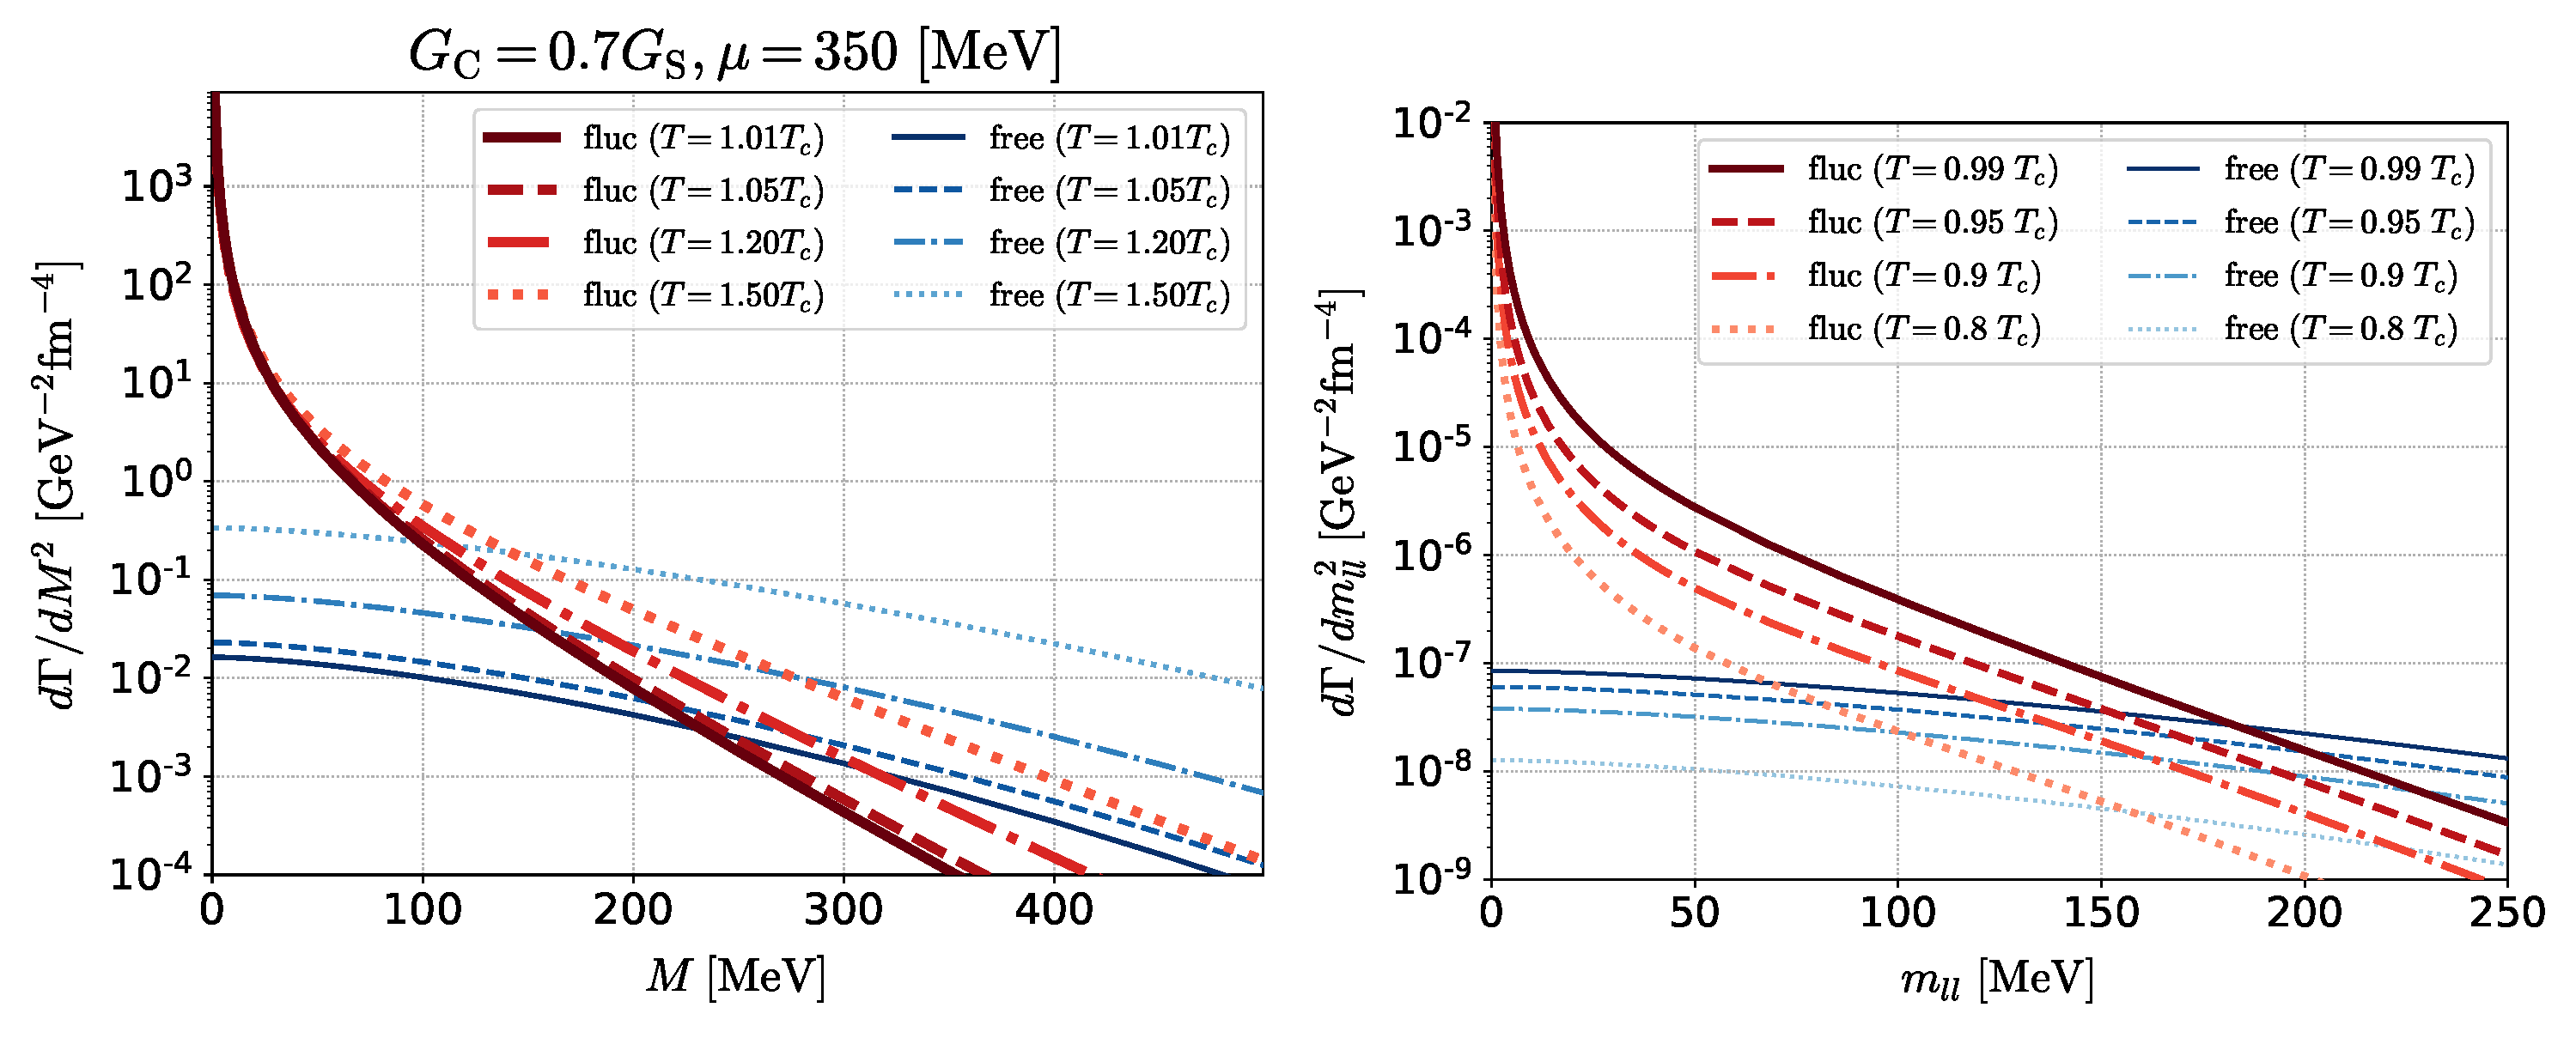
In HICs, the DPR is observed as a function of the invariant mass M = ω 2 k 2 to remove the effects of the motion of the medium. Shown in Figure 14 are the invariant-mass spectra of DPR near the 2SC-PT (left) and QCD-CP (right) [30]. One finds that the anomalous enhancement of the DPR is observed at the low-mass region M 200 MeV.
The low energy-momentum limit of the DPR is related to the electric conductivity as is verified in Equations (45) and (46). Therefore, the dilepton production in the HIC is enhanced when the medium created by the collisions passes through the red-color region in the figure. The existence of the two hot spots, corresponding to the 2SC-CP and QCD-CP, in Figure 12 may suggest that the beam-energy scan can measure distinct peaks of the DPR [66].

6. Brief Summary and Concluding Remarks

In this article, we have made a unified account of the soft modes of the QCD critical point (QCD-CP) and the critical point of the 2SC phase transition (2SC-CP) and their relevance to relativistic heavy-ion collisions (HICs), based on the two-flavor Nambu–Jona–Lasinio (NJL) model.
We started by discussing not only static but also dynamical fluctuations of physical quantities coupled to the order parameters of these second-order phase transitions in the normal phase in a comprehensive way and then showed the very existence of the soft modes for both the transitions within the mean-field-level calculations. Then, it was demonstrated that the soft modes affect various observables and cause interesting phenomena near the QCD-CP and 2SC-CP. Firstly, it was shown that the diquark soft mode of the 2SC gives rise to a ’pseudogap’ in the quark density of states around the Fermi surface in the normal phase just above the critical temperature of the 2SC. Although the appearance of the pseudogap is of great interest in relation to the similar phenomena seen in condensed matter physics, it is left as a future problem to identify good observables to confirm it experimentally. As experimentally feasible observables, we took up the electromagnetic observables, such as electric conductivity and the dilepton production rate in heavy-ion collisions, and showed that these quantities are largely affected by the soft modes so that they both increase in a divergent way when the system approaches the respective critical temperature from the normal phase. We also remarked that the relaxation time and correlation length will show similar anomalous behaviors around the respective critical points. For the analyses of these quantities, we have extended the ideas that are successful to account for the ‘para-conductivity’ in the normal phase of metallic superconductors.
Finally, we add some words on the model dependence of the results in this article. The present analysis has been carried out within the NJL model with a specific cutoff scheme and the mean-field/RPA framework. Non-universal quantities such as the location of the critical point and the magnitude of various enhancements may depend on model parameters and regularization schemes. However, the infrared critical behavior discussed here is governed by the soft modes and is therefore expected to be qualitatively robust. The present analysis aims to clarify such soft-mode dynamics and their consequences once a critical point exists. If the critical point were located at higher temperatures as other recent analyses [12] suggest, the same mechanism would remain operative, although quantitative predictions such as the extent of the critical region would naturally be modified. Anyway, a quantitative comparison with approaches beyond the present approximation, such as functional renormalization group analyses of dynamical critical behavior [19,20,21,22], would be an important future direction.

Author Contributions

Both authors contributed equally to shaping the project and research plan. M.K. made the major contribution to the actual computations, made the figures, and wrote the first draft of the main text except for Abstract, Introduction, and the last section, which were written by T.K. The authors equally contributed to finalizing the whole text of the paper. All authors have read and agreed to the published version of the manuscript.

Funding

This work was partially supported in part by JSPS KAKENHI (Nos. JP22K03619, JP24K07049), ISHIZUE 2025 of Kyoto University, and the Center for Gravitational Physics and Quantum Information (CGPQI) at Yukawa Institute for Theoretical Physics.

Data Availability Statement

No new data were created or analyzed in this study. Data sharing is not applicable to this article.

Acknowledgments

A major part of this study is based on the collaboration with Toru Nishimura, who the authors acknowledge.

Conflicts of Interest

The authors declare no conflicts of interest.

References

  1. Fukushima, K.; Hatsuda, T. The phase diagram of dense QCD. Rept. Prog. Phys. 2011, 74, 014001. [Google Scholar] [CrossRef] [Scilit]
  2. Alford, M.G.; Schmitt, A.; Rajagopal, K.; Schäfer, T. Color superconductivity in dense quark matter. Rev. Mod. Phys. 2008, 80, 1455–1515. [Google Scholar] [CrossRef] [Scilit]
  3. Asakawa, M.; Yazaki, K. Chiral Restoration at Finite Density and Temperature. Nucl. Phys. A 1989, 504, 668–684. [Google Scholar] [CrossRef] [Scilit]
  4. Barducci, A.; Casalbuoni, R.; De Curtis, S.; Gatto, R.; Pettini, G. Chiral Symmetry Breaking in QCD at Finite Temperature and Density. Phys. Lett. B 1989, 231, 463–470. [Google Scholar] [CrossRef] [Scilit]
  5. Kitazawa, M.; Koide, T.; Kunihiro, T.; Nemoto, Y. Chiral and color superconducting phase transitions with vector interaction in a simple model. Prog. Theor. Phys. 2002, 108, 929–951, Erratum in Prog. Theor. Phys. 2003, 110, 185–186. [Google Scholar] [CrossRef] [Scilit]
  6. Kunihiro, T. Quark number susceptibility and fluctuations in the vector channel at high temperatures. Phys. Lett. B 1991, 271, 395–402. [Google Scholar] [CrossRef] [Scilit]
  7. Yagi, K.; Hatsuda, T.; Miake, Y. Quark-Gluon Plasma: From Big Bang to Little Bang; Cambridge University Press & Assessment: Cambridge, UK, 2005; Volume 23. [Google Scholar]
  8. Bzdak, A.; Esumi, S.; Koch, V.; Liao, J.; Stephanov, M.; Xu, N. Mapping the Phases of Quantum Chromodynamics with Beam Energy Scan. Phys. Rept. 2020, 853, 1–87. [Google Scholar] [CrossRef] [Scilit]
  9. Abdallah, M.; Adam, J.; Adamczyk, L.; Adams, J.R.; Adkins, J.K.; Agakishiev, G.; Aggarwal, I.; Aggarwal, M.M.; Ahammed, Z.; Alekseev, I.; et al. Cumulants and correlation functions of net-proton, proton, and antiproton multiplicity distributions in Au+Au collisions at energies available at the BNL Relativistic Heavy Ion Collider. Phys. Rev. C 2021, 104, 024902. [Google Scholar] [CrossRef] [Scilit]
  10. Galatyuk, T. Future facilities for high μB physics. Nucl. Phys. A 2019, 982, 163–169. [Google Scholar] [CrossRef] [Scilit]
  11. Stephanov, M.A.; Rajagopal, K.; Shuryak, E.V. Signatures of the tricritical point in QCD. Phys. Rev. Lett. 1998, 81, 4816–4819. [Google Scholar] [CrossRef] [Scilit]
  12. Fu, W.j.; Pawlowski, J.M.; Rennecke, F. QCD phase structure at finite temperature and density. Phys. Rev. D 2020, 101, 054032. [Google Scholar] [CrossRef] [Scilit]
  13. Walecka, J.D. A Theory of highly condensed matter. Ann. Phys. 1974, 83, 491–529. [Google Scholar] [CrossRef] [Scilit]
  14. Matsui, T. Fermi Liquid Properties of Nuclear Matter in a Relativistic Mean—Field Theory. Nucl. Phys. A 1981, 370, 365–388. [Google Scholar] [CrossRef] [Scilit]
  15. Asakawa, M.; Kitazawa, M. Fluctuations of conserved charges in relativistic heavy ion collisions: An introduction. Prog. Part. Nucl. Phys. 2016, 90, 299–342. [Google Scholar] [CrossRef] [Scilit]
  16. Bluhm, M.; Kalweit, A.; Nahrgang, M.; Arslandok, M.; Braun-Munzinger, P.; Floerchinger, S.; Fraga, E.S.; Gazdzicki, M.; Hartnack, C.; Herold, C.; et al. Dynamics of critical fluctuations: Theory—phenomenology—heavy-ion collisions. Nucl. Phys. A 2020, 1003, 122016. [Google Scholar] [CrossRef] [Scilit]
  17. Fujii, H. Scalar density fluctuation at critical end point in NJL model. Phys. Rev. D 2003, 67, 094018. [Google Scholar] [CrossRef] [Scilit]
  18. Fujii, H.; Ohtani, M. Sigma and hydrodynamic modes along the critical line. Phys. Rev. D 2004, 70, 014016. [Google Scholar] [CrossRef] [Scilit]
  19. Yokota, T.; Kunihiro, T.; Morita, K. Functional renormalization group analysis of the soft mode at the QCD critical point. Prog. Theor. Exp. Phys. 2016, 2016, 073D01. [Google Scholar] [CrossRef] [Scilit]
  20. Yokota, T.; Kunihiro, T.; Morita, K. Tachyonic instability of the scalar mode prior to the QCD critical point based on the functional renormalization-group method in the two-flavor case. Phys. Rev. D 2017, 96, 074028. [Google Scholar] [CrossRef] [Scilit]
  21. Fu, W.j.; Luo, X.; Pawlowski, J.M.; Rennecke, F.; Yin, S. Ripples of the QCD critical point. Phys. Rev. D 2025, 111, L031502. [Google Scholar] [CrossRef] [Scilit]
  22. Fu, W.j.; Pawlowski, J.M.; Pisarski, R.D.; Rennecke, F.; Wen, R.; Yin, S. QCD moat regime and its real-time properties. Phys. Rev. D 2025, 111, 094026. [Google Scholar] [CrossRef] [Scilit]
  23. Matsuura, T.; Iida, K.; Hatsuda, T.; Baym, G. Thermal fluctuations of gauge fields and first order phase transitions in color superconductivity. Phys. Rev. D 2004, 69, 074012. [Google Scholar] [CrossRef] [Scilit]
  24. Giannakis, I.; Hou, D.f.; Ren, H.c.; Rischke, D.H. Gauge field fluctuations and first-order phase transition in color superconductivity. Phys. Rev. Lett. 2004, 93, 232301. [Google Scholar] [CrossRef] [Scilit] [PubMed]
  25. Noronha, J.L.; Ren, H.c.; Giannakis, I.; Hou, D.; Rischke, D.H. Absence of the London limit for the first-order phase transition to a color superconductor. Phys. Rev. D 2006, 73, 094009. [Google Scholar] [CrossRef] [Scilit]
  26. Fejős, G.; Yamamoto, N. Functional renormalization group approach to color superconducting phase transition. J. High Energy Phys. 2019, 12, 069. [Google Scholar] [CrossRef] [Scilit]
  27. Kitazawa, M.; Koide, T.; Kunihiro, T.; Nemoto, Y. Precursor of color superconductivity in hot quark matter. Phys. Rev. D 2002, 65, 091504. [Google Scholar] [CrossRef] [Scilit]
  28. Kitazawa, M.; Koide, T.; Kunihiro, T.; Nemoto, Y. Pre-critical phenomena of two-flavor color superconductivity in heated quark matter: Diquark-pair fluctuations and non-Fermi liquid behavior. Prog. Theor. Phys. 2005, 114, 117–155. [Google Scholar] [CrossRef] [Scilit]
  29. Nishimura, T.; Kitazawa, M.; Kunihiro, T. Anomalous enhancement of dilepton production as a precursor of color superconductivity. Prog. Theor. Exp. Phys. 2022, 2022, 093D02. [Google Scholar] [CrossRef] [Scilit]
  30. Nishimura, T.; Kitazawa, M.; Kunihiro, T. Enhancement of dilepton production rate and electric conductivity around the QCD critical point. Prog. Theor. Exp. Phys. 2023, 2023, 053D01. [Google Scholar] [CrossRef] [Scilit]
  31. Nambu, Y.; Jona-Lasinio, G. Dynamical Model of Elementary Particles Based on an Analogy with Superconductivity. 1. Phys. Rev. 1961, 122, 345–358. [Google Scholar] [CrossRef] [Scilit]
  32. Nambu, Y.; Jona-Lasinio, G. Dynamical model of elementary particles based on an analogy with superconductivity. II. Phys. Rev. 1961, 124, 246–254. [Google Scholar] [CrossRef] [Scilit]
  33. Vogl, U.; Weise, W. The Nambu and Jona Lasinio model: Its implications for hadrons and nuclei. Prog. Part. Nucl. Phys. 1991, 27, 195–272. [Google Scholar] [CrossRef] [Scilit]
  34. Klevansky, S.P. The Nambu-Jona-Lasinio model of quantum chromodynamics. Rev. Mod. Phys. 1992, 64, 649–708. [Google Scholar] [CrossRef] [Scilit]
  35. Hatsuda, T.; Kunihiro, T. QCD phenomenology based on a chiral effective Lagrangian. Phys. Rept. 1994, 247, 221–367. [Google Scholar] [CrossRef] [Scilit]
  36. Ebert, D.; Reinhardt, H.; Volkov, M.K. Effective hadron theory of QCD. Prog. Part. Nucl. Phys. 1994, 33, 1–120. [Google Scholar] [CrossRef] [Scilit]
  37. Buballa, M. NJL model analysis of quark matter at large density. Phys. Rept. 2005, 407, 205–376. [Google Scholar] [CrossRef] [Scilit]
  38. Nishimura, T.; Kitazawa, M.; Kunihiro, T. Electromagnetic response of dense quark matter around color-superconducting phase transition and QCD critical point. Ann. Phys. 2024, 469, 169768. [Google Scholar] [CrossRef] [Scilit]
  39. Aslamazov, L.; Larkin, A. Soviet Solid State 10, 875 (1968). Phys. Lett. A 1968, 26, 238. [Google Scholar]
  40. Maki, K. Critical fluctuation of the order parameter in a superconductor. I. Prog. Theor. Phys. 1968, 40, 193–200. [Google Scholar] [CrossRef] [Scilit]
  41. Thompson, R.S. Microwave, flux flow, and fluctuation resistance of dirty type-II superconductors. Phys. Rev. B 1970, 1, 327. [Google Scholar] [CrossRef] [Scilit]
  42. Larkin, A.; Varlamov, A. Fluctuation Phenomena in Superconductors; Springer: Berlin/Heidelberg, Germany, 2008; pp. 369–458. [Google Scholar]
  43. Tinkham, M. Introduction to Superconductivity; Courier Corporation: Chelmsford, MA, USA, 2004. [Google Scholar]
  44. Arnold, P.B.; Moore, G.D.; Yaffe, L.G. Transport coefficients in high temperature gauge theories. 1. Leading log results. J. High Energy Phys. 2000, 11, 001. [Google Scholar] [CrossRef] [Scilit]
  45. Arnold, P.B.; Moore, G.D.; Yaffe, L.G. Transport coefficients in high temperature gauge theories. 2. Beyond leading log. J. High Energy Phys. 2003, 05, 051. [Google Scholar] [CrossRef] [Scilit]
  46. Teaney, D. Finite temperature spectral densities of momentum and R-charge correlators in N=4 Yang Mills theory. Phys. Rev. D 2006, 74, 045025. [Google Scholar] [CrossRef] [Scilit]
  47. Cassing, W.; Linnyk, O.; Steinert, T.; Ozvenchuk, V. Electrical Conductivity of Hot QCD Matter. Phys. Rev. Lett. 2013, 110, 182301. [Google Scholar] [CrossRef] [Scilit] [PubMed]
  48. Greif, M.; Bouras, I.; Greiner, C.; Xu, Z. Electric conductivity of the quark-gluon plasma investigated using a perturbative QCD based parton cascade. Phys. Rev. D 2014, 90, 094014. [Google Scholar] [CrossRef] [Scilit]
  49. Aarts, G.; Nikolaev, A. Electrical conductivity of the quark-gluon plasma: Perspective from lattice QCD. Eur. Phys. J. A 2021, 57, 118. [Google Scholar] [CrossRef] [Scilit]
  50. Kaczmarek, O.; Shu, H.T. Spectral and Transport Properties from Lattice QCD. Lect. Notes Phys. 2022, 999, 307–345. [Google Scholar] [CrossRef] [Scilit]
  51. Hirono, Y.; Hongo, M.; Hirano, T. Estimation of electric conductivity of the quark gluon plasma via asymmetric heavy-ion collisions. Phys. Rev. C 2014, 90, 021903. [Google Scholar] [CrossRef] [Scilit]
  52. Nakamura, K.; Miyoshi, T.; Nonaka, C.; Takahashi, H.R. Relativistic resistive magneto-hydrodynamics code for high-energy heavy-ion collisions. Eur. Phys. J. C 2023, 83, 229. [Google Scholar] [CrossRef] [Scilit]
  53. Mayer, M.; Rezzolla, L.; Elfner, H.; Inghirami, G.; Rischke, D.H. BHAC-QGP: Three-dimensional MHD simulations of relativistic heavy-ion collisions, II. Application to Au-Au collisions. arXiv 2024, arXiv:2403.08669. [Google Scholar]
  54. Fetter, A.L.; Walecka, J.D. Quantum Theory of Many-Particle Systems; Courier Corporation: Chelmsford, MA, USA, 2012. [Google Scholar]
  55. Thouless, D.J. Perturbation theory in statistical mechanics and the theory of superconductivity. Ann. Phys. 1960, 10, 553–588. [Google Scholar] [CrossRef] [Scilit]
  56. Kitazawa, M.; Koide, T.; Kunihiro, T.; Nemoto, Y. Pseudogap of color superconductivity in heated quark matter. Phys. Rev. D 2004, 70, 056003. [Google Scholar] [CrossRef] [Scilit]
  57. Kitazawa, M.; Kunihiro, T.; Nemoto, Y. Possible generation of anomalously soft quark excitations at nonzero temperature: Nonhyperbolic dispersion of the parapion and van Hove singularity. Phys. Rev. D 2014, 89, 056002. [Google Scholar] [CrossRef] [Scilit]
  58. Kitazawa, M.; Kunihiro, T.; Nemoto, Y. Emergence of soft quark excitations by the coupling with a soft mode of the QCD critical point. Phys. Rev. D 2014, 90, 116008. [Google Scholar] [CrossRef] [Scilit]
  59. Kitazawa, M.; Kunihiro, T.; Nemoto, Y. Novel Collective Excitations and Quasi-particle Picture of Quarks Coupled with a Massive Boson at Finite Temperature. Prog. Theor. Phys. 2007, 117, 103–138. [Google Scholar] [CrossRef] [Scilit]
  60. Kitazawa, M.; Kunihiro, T.; Mitsutani, K.; Nemoto, Y. Spectral properties of massless and massive quarks coupled with massive boson at finite temperature. Phys. Rev. D 2008, 77, 045034. [Google Scholar] [CrossRef] [Scilit]
  61. Kitazawa, M.; Kunihiro, T.; Nemoto, Y. Quark spectrum above but near critical temperature of chiral transition. Phys. Lett. B 2006, 633, 269–274. [Google Scholar] [CrossRef] [Scilit]
  62. Ohashi, Y.; Tajima, H.; van Wyk, P. BCS–BEC crossover in cold atomic and in nuclear systems. Prog. Part. Nucl. Phys. 2020, 111, 103739. [Google Scholar] [CrossRef] [Scilit]
  63. Johansen, C.H.; Frank, B.; Lang, J. Spectral functions of the strongly interacting three-dimensional Fermi gas. Phys. Rev. A 2024, 109, 023324. [Google Scholar] [CrossRef] [Scilit]
  64. Dizer, E.; Horak, J.; Pawlowski, J.M. Spectral properties and observables in ultracold Fermi gases. Phys. Rev. A 2024, 109, 063311. [Google Scholar] [CrossRef] [Scilit]
  65. Kamikado, K.; Strodthoff, N.; von Smekal, L.; Wambach, J. Real-time correlation functions in the O(N) model from the functional renormalization group. Eur. Phys. J. C 2014, 74, 2806. [Google Scholar] [CrossRef] [Scilit]
  66. Nishimura, T.; Nara, Y.; Steinheimer, J. Enhanced Dilepton production near the color superconducting phase and the QCD critical point. arXiv 2023, arXiv:2311.14135. [Google Scholar]
  67. Akamatsu, Y.; Asakawa, M.; Hongo, M.; Stephanov, M.; Yee, H.U. Enhancement of the photon emission rate near the QCD critical point. Phys. Rev. D 2026, 113, 034009. [Google Scholar] [CrossRef] [Scilit]
Figure 1. Phase diagram calculated by the mean-field approximation in the two-flavor NJL model (1) [38]. The solid line shows the first-order phase transition calculated with G D = 0.70 G S . The dashed, dash-dotted, and dotted lines are the second-order 2SC-PT for G D / G S = 0.70 , 0.65 , and 0.60 , respectively. The QCD-CP is indicated by the circle marker located at ( T CP , μ CP ) ( 46.712 , 329.34 ) MeV.
Symmetry 18 01185 g001
Figure 3. Feynman diagrams representing the quark Green function in the non-self-consistent T-matrix approximation. The thin lines represent the free propagator G 0 , while the bold ones represent the full propagator G .
Symmetry 18 01185 g003
Figure 4. Spectral function ρ 0 ( k , ω ) at μ = 400 MeV and ε = 0.01 and 0.2 . The peaks at ω = k μ and ω = k μ correspond to the quark and anti-quark quasiparticles, respectively. Notice that there is a depression around ω = 0 , which is responsible for the pseudogap formation.
Symmetry 18 01185 g004
Figure 5. Density of state at μ = 400 MeV and various ε ( T T c ) / T c [56]. The dotted line shows that of the free quarks. A clear pseudogap structure is seen, which survives up to ε 0.05 .
Symmetry 18 01185 g005
Figure 6. Contribution of the diquark soft mode to the thermodynamic potential.
Symmetry 18 01185 g006
Figure 7. Diagrammatic representations of the Aslamazov–Larkin (a), Maki–Thompson (b), and density of states (c,d) terms with the 2SC soft modes with the wavy lines being the photon ones.
Symmetry 18 01185 g007
Figure 8. Contribution of the soft mode of the QCD-CP to the thermodynamic potential.
Symmetry 18 01185 g008
Figure 9. Diagrammatic representations of the Aslamazov–Larkin (ad), Maki–Thompson (e,f), and density of states (gj) terms with the soft modes of the QCD-CP. The single, double, and wavy lines are quarks, soft modes, and photon, respectively.
Symmetry 18 01185 g009
Figure 10. Electric conductivity σ in the vicinity of the 2SC-PT for various values of μ and G D [38]. Thick red and thin blue curves represent the LE and TDGL results, respectively. The left panels compare the results for μ = 350 , 400, and 500 MeV with G D / G S = 0.7 , whereas the right panels show the dependence on G D / G S = 0.70 , 0.65 , and 0.60 at fixed μ = 350 MeV. The dotted curves indicate the critical scaling σ ϵ 1 / 2 .
Symmetry 18 01185 g010
Figure 11. Electric conductivity σ around the QCD-CP [38]. The left panels correspond to variations of T and μ along the transition line, while the middle and right panels show the results at fixed μ = μ CP and T = T CP , respectively. Dotted curves denote the critical exponents given in Equation (56).
Symmetry 18 01185 g011
Figure 12. Contour maps of σ / T on the T μ plane around the CP with G D / G S = 0.70 , 0.65 and 0.60 [38]. The solid and dashed lines are the first-order and second-order phase transitions, respectively.
Symmetry 18 01185 g012
Figure 13. Dilepton production rates per unit energy ω and momentum k above the 2SC critical temperature at μ = 350 MeV (left) [29] and in the vicinity of the QCD critical point at μ = μ CP (right) [30], obtained for G D = 0.7 G S . Thick and thin curves show the contributions from the soft modes and the massless free quark gas, respectively.
Symmetry 18 01185 g013
Figure 14. Dilepton production rates per unit energy ω and momentum k above the 2SC critical temperature at μ = 350 MeV (left) [29] and near the QCD-CP at μ = μ CP (right) [30], both for G D = 0.7 G S . Thick and thin curves represent the contributions from the soft modes and the massless free quark gas, respectively.
Symmetry 18 01185 g014
Disclaimer/Publisher’s Note: The statements, opinions and data contained in all publications are solely those of the individual author(s) and contributor(s) and not of MDPI and/or the editor(s). MDPI and/or the editor(s) disclaim responsibility for any injury to people or property resulting from any ideas, methods, instructions or products referred to in the content.