Article

Prostate Cancer Detection Using Reflectional Asymmetry Analysis in MRI Images

1
Department of Radiology, University Medical Centre Maribor, 2000 Maribor, Slovenia
2
Faculty of Electrical Engineering and Computer Science, University of Maribor, 2000 Maribor, Slovenia
3
Department of Radiology, University College London Hospitals NHS Foundation Trust, London NW1 2PG, UK
*
Author to whom correspondence should be addressed.
Symmetry 2026, 18(7), 1094; https://doi.org/10.3390/sym18071094
Submission received: 4 April 2026 / Revised: 20 June 2026 / Accepted: 23 June 2026 / Published: 27 June 2026
(This article belongs to the Section Life Sciences)

Abstract

Multiparametric magnetic resonance imaging (mpMRI) is the standard imaging modality for the detection and evaluation of prostate cancer (PCa); however, diagnostic challenges remain due to overlapping imaging features of malignant and benign tissue. The healthy prostate is approximately reflectionally symmetric, whereas malignant transformation introduces structural asymmetry. A novel algorithm that exploits this asymmetry to detect PCa on T2-weighted (T2W), diffusion weighted (DWI), and apparent diffusion coefficient (ADC) images is presented. This study represents a proof-of-concept evaluation of a symmetry-based, training-free approach. Asymmetry features are extracted across all three sequences using band-pass filtering, adaptive thresholding, and intensity-based criteria, and fused into a unified detection map. The method was evaluated in 66 men with histopathological confirmation (33 biopsy-confirmed PCa cases and 33 biopsy-negative controls). The algorithm correctly detected cancer in 29 of 33 cases (sensitivity 87.9%) and correctly classified 15 of 33 non-cancer cases, yielding a specificity of 45.5% and an overall accuracy of 66.7%. Detection performance was higher for lesions ≥ 10 mm (sensitivity 91.7%) than for lesions < 10 mm (sensitivity 77.8%). The PcaAsym framework demonstrated complete intra-reader reproducibility and substantial inter-reader agreement. These results demonstrate the feasibility of symmetry-based analysis as an interpretable and deterministic approach for PCa detection. Validation in larger, consecutive cohorts is warranted to assess performance in routine clinical settings.

1. Introduction

Prostate cancer (PCa) is the second most common cancer among men worldwide and the fifth leading cause of cancer-related mortality [1]. This substantial burden highlights the need for accurate early detection, effective screening strategies, and reliable diagnostic tools [2]. Current approaches for early PCa detection include digital rectal examination (DRE), prostate-specific antigen (PSA) testing, and imaging assessment. Among available imaging modalities, multiparametric magnetic resonance imaging (mpMRI) has emerged as the recommended first-line investigation for men with suspected PCa. Interpretation is standardized using the Prostate Imaging–Reporting and Data System (PI-RADS) version 2.1 [3]. MpMRI enables detailed visualization of prostate anatomy and soft-tissue characteristics, facilitating differentiation between the peripheral, transitional, and central zones of the gland. This improves the detection of clinically significant tumors and supports assessment of tumor extent, including extraprostatic extension [4]. Consequently, mpMRI has become an essential component of contemporary PCa diagnostics and risk stratification, with increasing evidence supporting its role in MRI-informed screening pathways.
Despite these advantages, broader implementation of mpMRI for PCa detection, particularly in screening settings, remains challenging. In addition to limited scanner availability, accurate interpretation of prostate MRI requires substantial radiological expertise, representing a major barrier to wider implementation in national screening programs. Image interpretation is time-consuming, requires specialized training, and may be affected by variability in scanner hardware and acquisition protocols across institutions. Human factors, including radiologist experience, fatigue, and intra- and inter-reader variability, further influence diagnostic performance [5]. Together, these factors increase diagnostic complexity, cost, and variability in clinical decision-making [6,7]. Furthermore, despite its high negative predictive value (NPV), the positive predictive value (PPV) of mpMRI remains modest, typically ranging from 25% to 40%, resulting in a substantial number of unnecessary prostate biopsies. Clinically significant prostate cancer is confirmed in only approximately half of biopsied lesions, placing additional burden on healthcare systems [8].
To support radiologists and improve the efficiency and consistency of prostate MRI interpretation, a range of computer-aided detection (CAD) [9] and artificial intelligence (AI) [10] approaches has been proposed. While CAD systems demonstrated early promise, systematic reviews have highlighted substantial heterogeneity in their reported performance [11]. In particular, machine learning (ML) [12,13] and deep learning (DL) [14,15] methods have shown considerable promise for automated prostate MRI analysis, including lesion detection, segmentation, and risk stratification [16,17]. However, many of these approaches rely on large, annotated datasets for training and may exhibit reduced generalizability, as performance can vary substantially across different scanners, vendors, imaging protocols, and patient populations. For instance, a recent landmark multi-center AI validation study reported site-specific specificity ranging from 0.23 to 0.83 across six sites, illustrating the substantial cross-institutional performance variability inherent to data-driven approaches [18].
An alternative and potentially complementary strategy is to exploit intrinsic anatomical priors that can be directly assessed from medical images. Symmetry has been extensively studied across art [19], architecture [20], medicine [21,22], mathematics [23], and other scientific and engineering fields [24,25,26]. One such characteristic is the approximate bilateral symmetry of the prostate gland with respect to the midsagittal plane. In the absence of focal pathology, the left and right halves of the gland typically exhibit similar structural and signal-intensity patterns across MRI sequences. The presence of PCa may disrupt this symmetry through localized structural changes and sequence-specific signal alterations. Compared with purely data-driven approaches, symmetry-based analysis provides a biologically grounded and potentially interpretable framework for detecting abnormal tissue patterns.
Relatively few studies have explored asymmetry analysis for prostate tissue anomaly detection, particularly in MRI. Early investigations of prostate symmetry were conducted using non-MRI modalities and reported mixed or inconclusive findings. For example, Hansen et al. [27] and Yilmaz et al. [28] investigated PCa detection in patients with symmetric and asymmetric findings on DRE and reported similar detection rates in both groups, suggesting that asymmetry detected by DRE alone is not a reliable indicator of malignancy. Kiyoshima et al. [29] evaluated asymmetrical contours in prostate cancer specimens obtained after radical prostatectomy and concluded that asymmetry was not a reliable prognostic parameter for determining tumor location within the gland.
In MRI-based studies, Yang et al. [30] investigated intensity differences between normal and cancerous tissue on T2-weighted (T2W) images by comparing the left and right halves of the peripheral zone. Their approach demonstrated the ability to detect prostate cancer and other abnormalities in otherwise symmetric prostates. However, this method was limited to the peripheral zone and relied exclusively on T2W imaging, without incorporating functional MRI sequences that may provide complementary diagnostic information. Furthermore, the control group was defined by repeated negative biopsies over clinical follow-up rather than a single biopsy-confirmed reference standard. Benign prostatic conditions known to disrupt symmetry, including prostatitis and hemorrhage, were not included in the study cohort, potentially inflating the reported specificity.
Therefore, the present study proposes a semi-automated framework for PCa detection based on reflectional asymmetry analysis in prostate mpMRI. The method integrates asymmetry information derived from anatomical T2-weighted (T2W) images with complementary features from functional imaging, including diffusion-weighted imaging (DWI) and apparent diffusion coefficient (ADC) maps, to generate a combined asymmetry map for identifying suspicious prostate tissue. By combining symmetry-based analysis with sequence-specific signal characteristics, the proposed framework aims to provide an interpretable and reproducible approach for semi-automated prostate MRI assessment.

2. Methodology

A new programming framework (PcaAsym) developed by the authors of the paper for prostate cancer (PCa) detection based on the asymmetric paradigm is introduced in this Section. Three standard MRI images, namely, a T2 weighted image ( I T 2 W ), a diffusion weighted image ( I D W I ), and an apparent diffusion coefficient map ( I A D C ), are obtained during the multiparametric MRI (mpMRI) investigation. We have used 1.5 MRI system (Magnetom Sola; Siemens AG, Erlangen, Germany. The proposed approach utilizes all three of them. PcaAsym consists of two main parts: a preparation phase and an analysis phase.

2.1. Preparation Phase

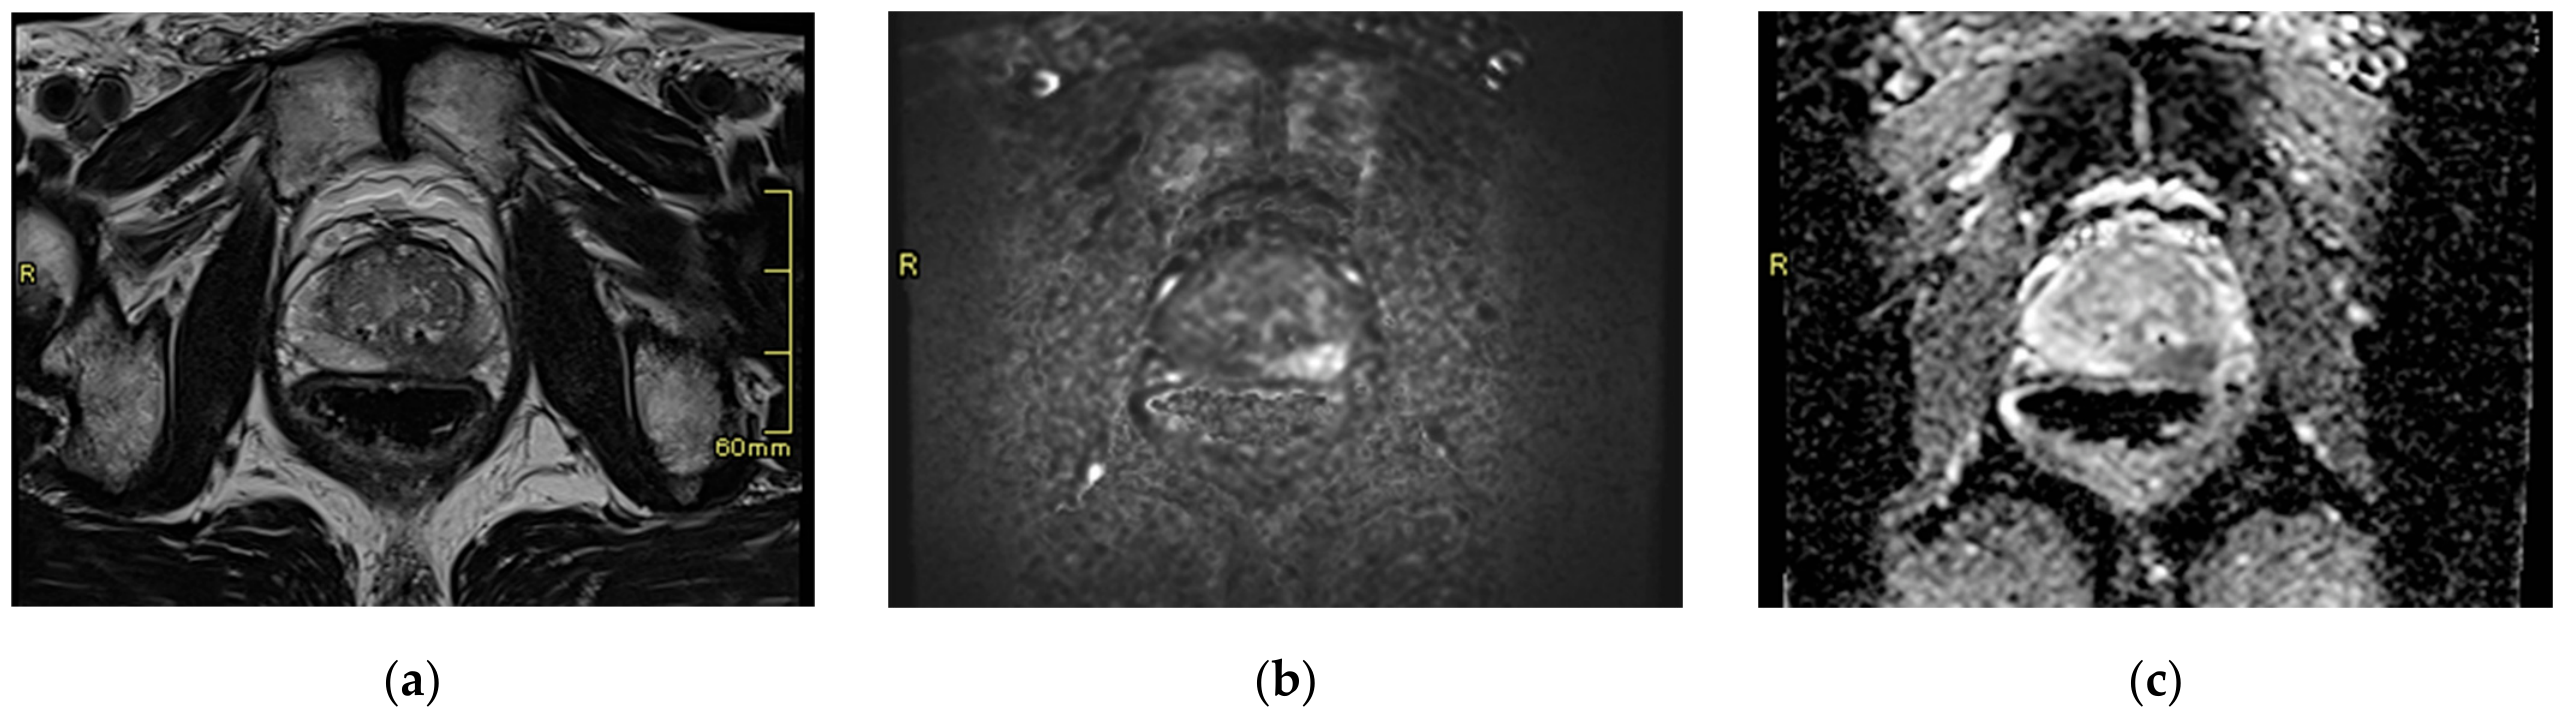
The MRI machine provides images in different resolutions, namely, I T 2 W has a resolution of 320 × 320 pixels, while I D W I and I A D C have 256 × 256 pixels. All the images are grayscale with an 8-bit depth. The I D W I and I A D C images are upsampled to match the resolution of I T 2 W . Various raster image scaling approaches exist, including nearest neighbour, bicubic, and spline interpolation, which may differently affect image characteristics. However, in this study Lanczos resampling was applied [31], which is a commonly used interpolation method for image resampling. Subsequently, all the images are aligned and placed within a common reference coordinate system. This process was performed automatically using data from the MRI system settings and the manufacturer’s specifications. No additional image registration was performed, as the images are inherently co-registered by the MRI acquisition system. Typical MRI images from all three modalities after resolution adjustment and alignment are shown in Figure 1.
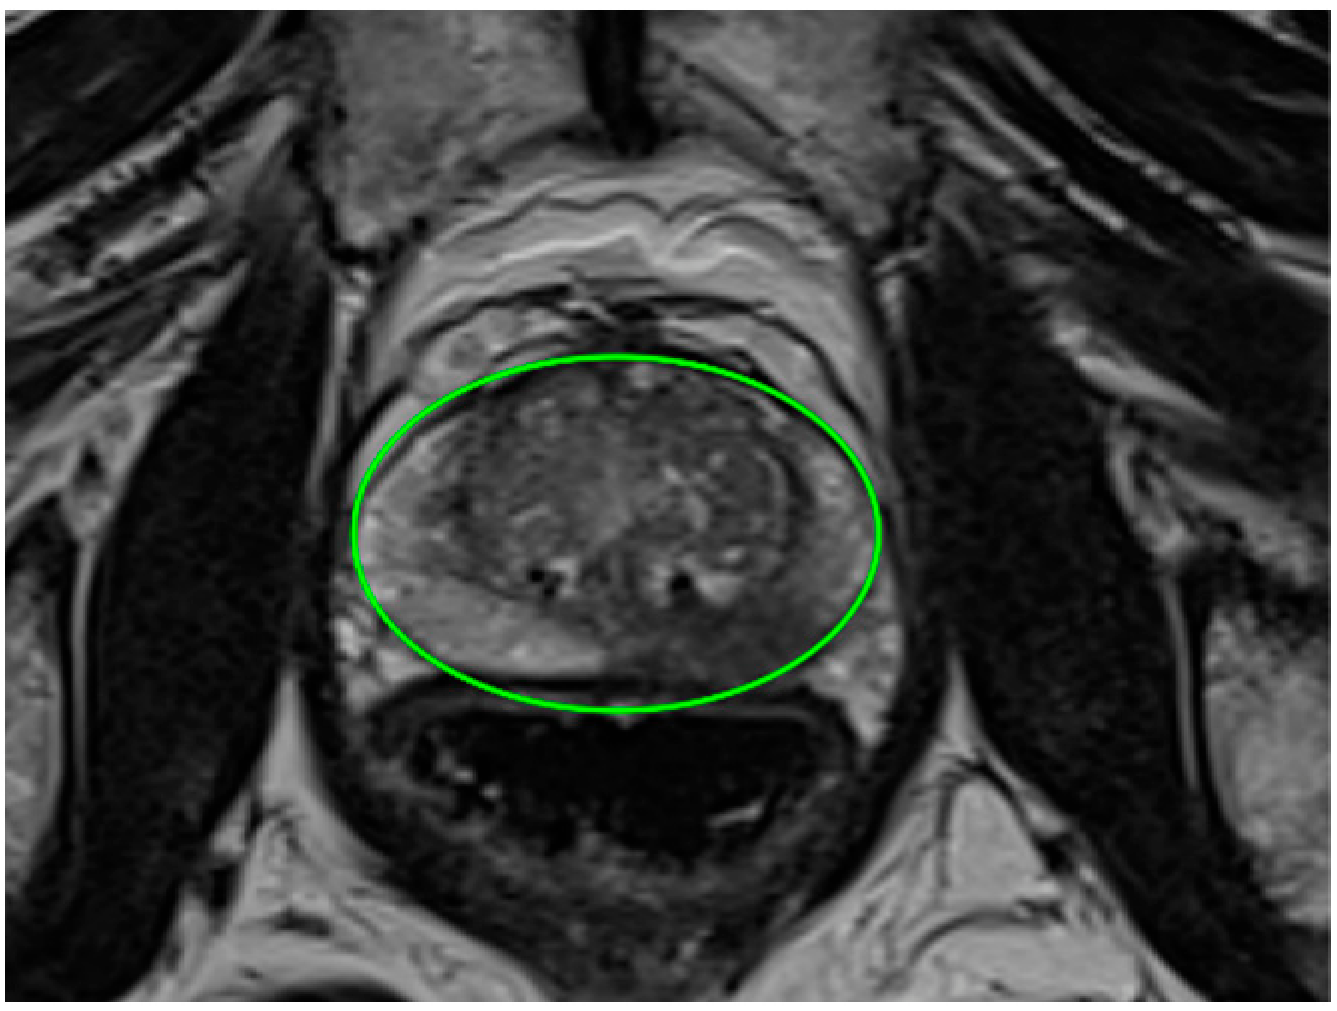
The I T 2 W image is used to locate the prostate, which a trained radiologist delineates interactively using an ellipse (see Figure 2).
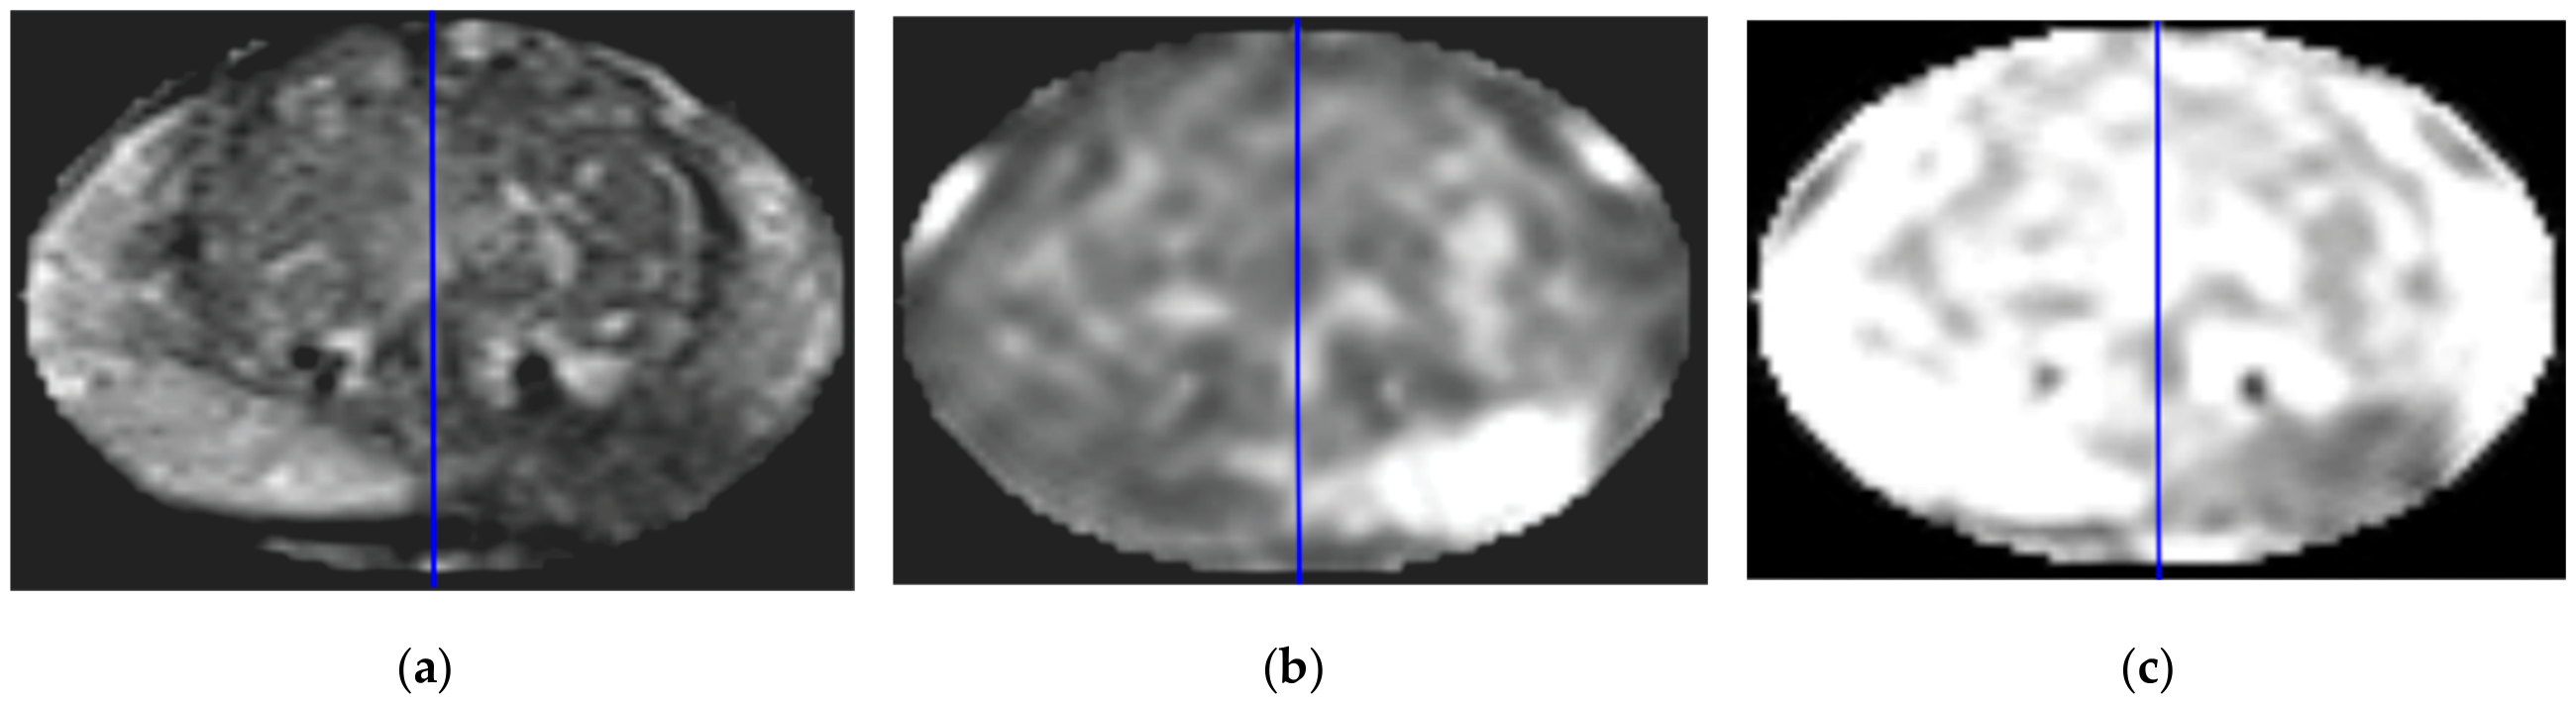
All the pixels outside the ellipse are then set to zero, and the I T 2 W , I D W I , and I A D C images are cropped accordingly. All the cropped images have the same resolution of N × M pixels, where N , M 320 . From this point onward, the cropped images are denoted by the same symbols as the original images, i.e., I T 2 W , I D W I , and I A D C , respectively. The vertical axis of the ellipse is considered the axis of reflectional symmetry of the prostate, as illustrated in Figure 3. The images are now prepared for diagnosis within the PcaAsym framework, following the PI-RADS v2.1 scoring system [3].

2.2. Analysis Phase

The analysis phase of PcaAsym consists of the following steps:
  • Band-pass filtering;
  • Detecting the reflectional asymmetries in each of the filtered images;
  • Constructing a fused map of the asymmetries;
  • Generating binary masks indicating the locations of potential anomalies;
  • Determining the suspicious areas map for prostate cancer;
  • Constructing the final decision map to support the diagnosis.

2.3. Band-Pass Filtering

Multiple tests demonstrated that applying band-pass filtering benefits the subsequent steps in PcaAsym. The filtering was performed by applying a 2D Fast Fourier Transform [32], followed by setting the high-pass filter cut-off frequency to 0.23/mm and the low-pass filter cut-off frequency to 0.01/mm. The cut-off frequencies were determined empirically by testing various combinations on cases with PI-RADS scores 2–5. This iterative process aimed to optimally enhance asymmetry patterns associated with prostate cancer while suppressing noise and irrelevant low-frequency structures. Such empirical tuning is a common practice in CAD and radiomics systems for prostate MRI-based diagnosis [30,33,34].
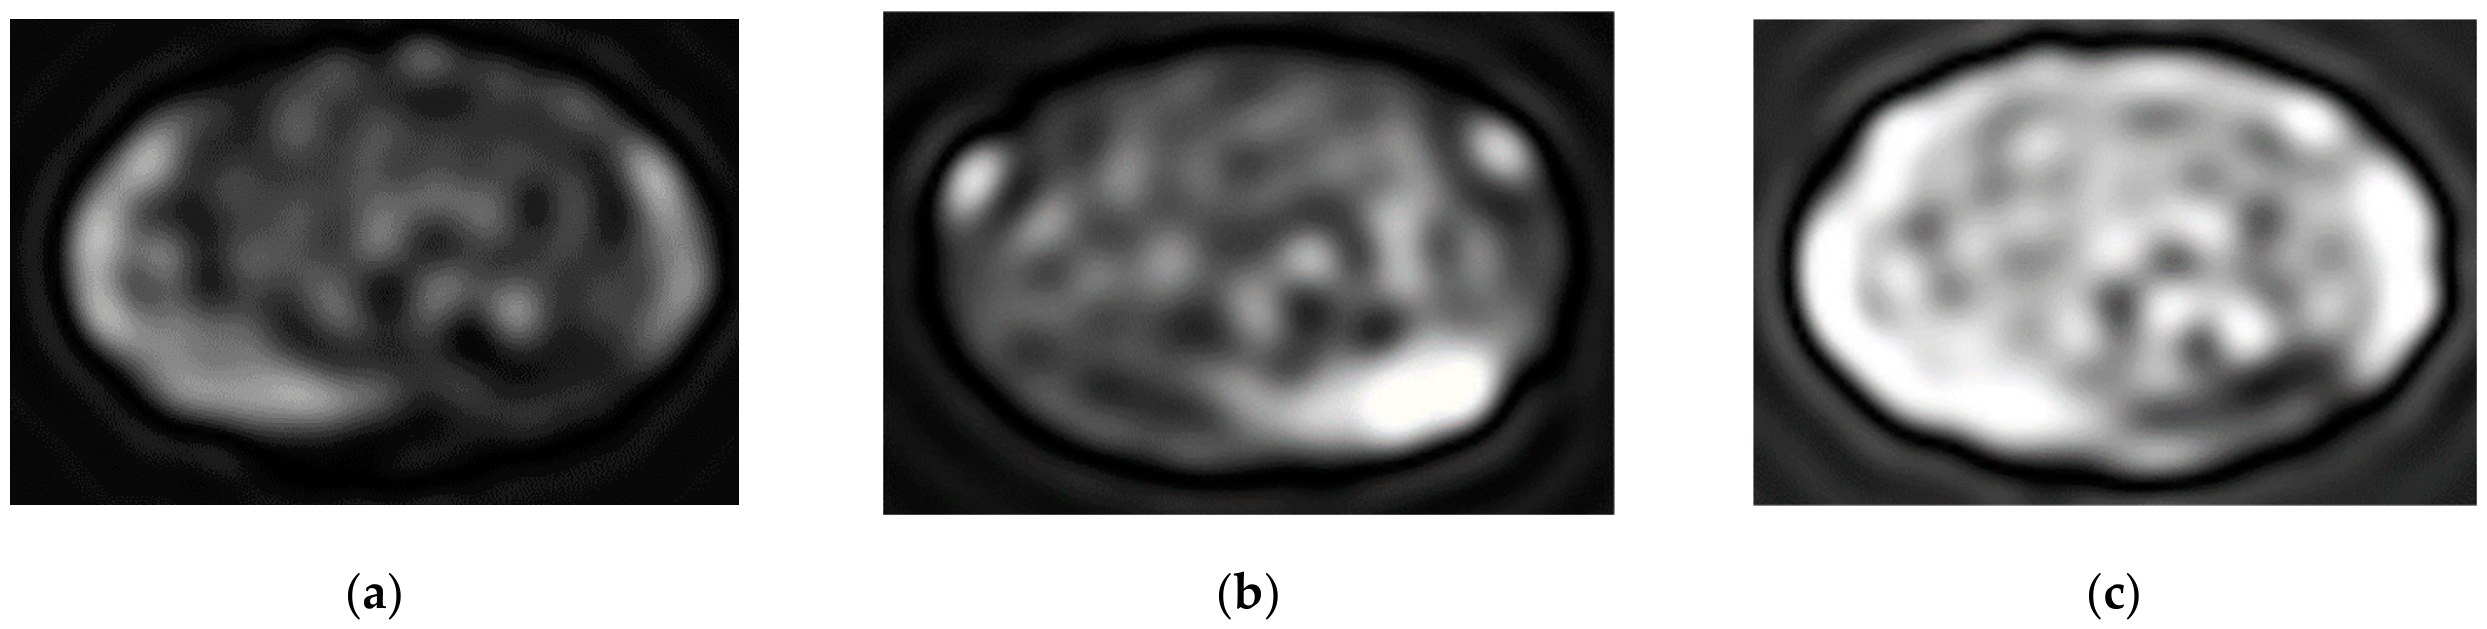
An inverse 2D Fast Fourier Transform was then applied to the filtered data to obtain the filtered images, examples of which are shown in Figure 4.

2.4. Determination of Reflection Asymmetries

All three filtered mpMRI images are then subjected to asymmetry estimation [35]. Let I = { I T 2 W , I D W I , I A D C } represent one of the mpMRI filtered images. The intensity of the pixel at the position ( x , y ) is then denoted by I ( x , y ) . The axis of the symmetry divides the image I in two halves: I L and I R , corresponding to the left and right sides, respectively. The absolute difference D ( x , y ) between the symmetrical pixel pairs is then computed as:
D ( x , y ) = | I L ( x , y ) I R ( x , y ) | ,   ( x , y ) Ω ,
where Ω denotes the prostate region with the ellipse. The symmetry coefficient S C is then defined as the sum of these differences.
S C = ( x , y ) Ω D ( x , y )
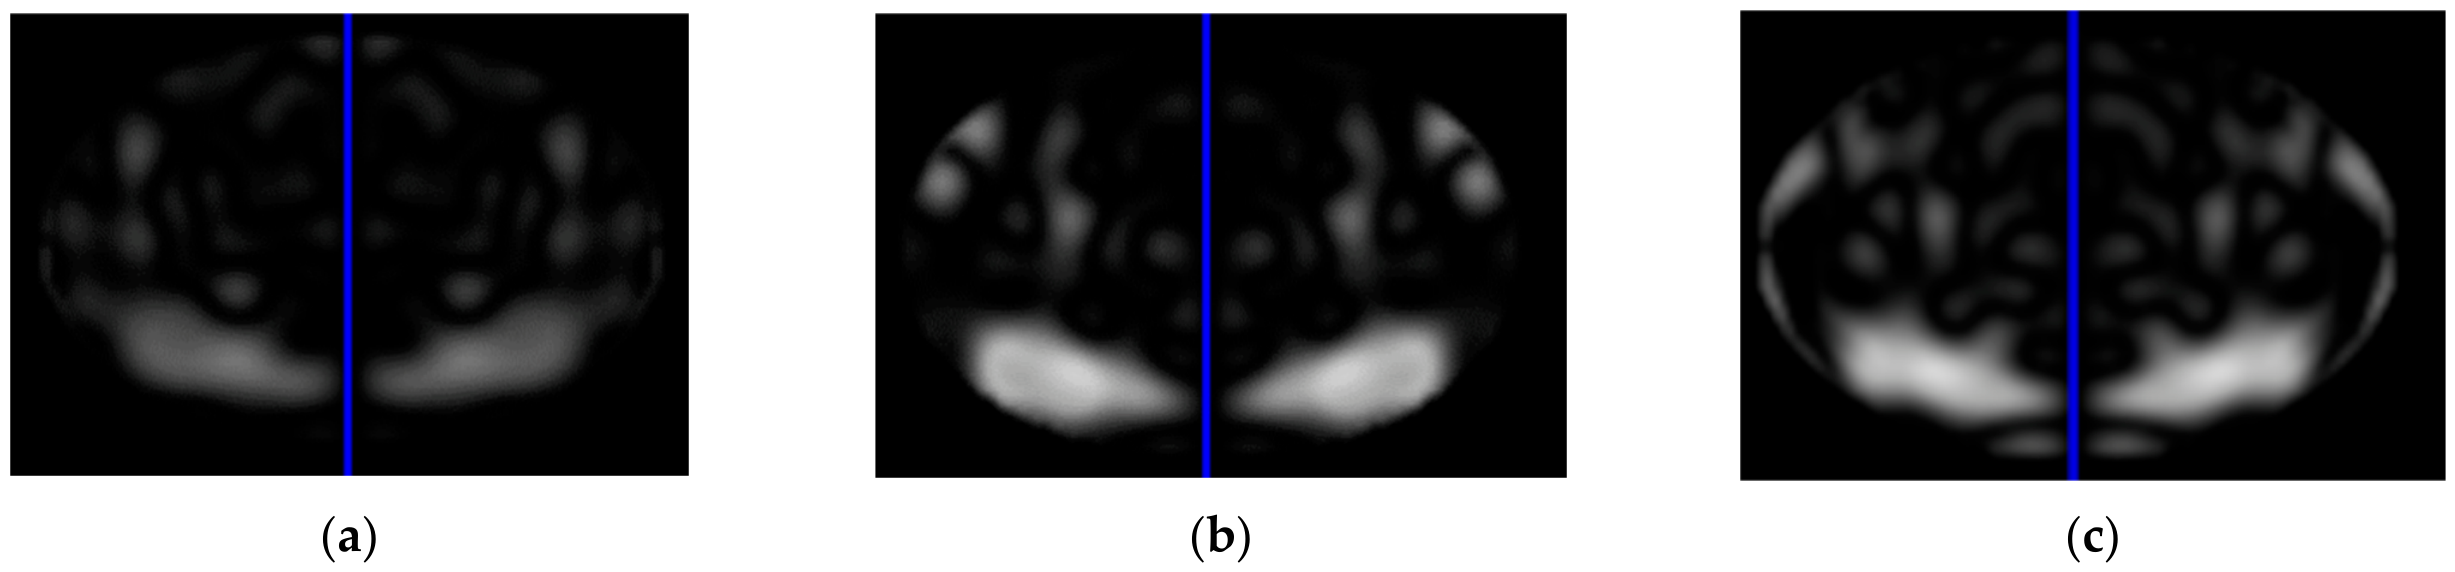
In the case of perfect symmetry, S C = 0 . The symmetry coefficient SC is therefore used as a global quantitative summary of the pixel-wise asymmetry distribution and complements the asymmetry maps by providing a compact representation of the overall asymmetry within the region of interest. In practice, perfect symmetry is extremely rare due to image noise and natural variations in tissue, even in completely healthy prostates. However, asymmetry is expected to increase significantly in the presence of cancerous anomalies. To highlight these differences, asymmetry maps, A D W I , and A A D C are generated for all three MRI modalities, as shown in Figure 5. The resolution of the asymmetry maps is N × M and the relevant pixels are still within the region Ω . Since all input images share the same intensity range [0, 255], the resulting asymmetry maps are computed on a common scale, and no additional normalization is required prior to fusion.

2.5. Constructing a Fused Map of Asymmetries

The asymmetry maps A T 2 W , A D W I , and A A D C are fused in this step, to enhance the individual asymmetry signals captured by the different MRI modalities. The Fused Map of Asymmetry (FMA) is obtained by multiplying the corresponding pixel values across the individual asymmetry maps, as defined in Equation (3).
F M A ( x , y ) = A T 2 w ( x , y ) × A D W I ( x , y ) × A A D C ( x , y ) ,   where   ( x , y ) Ω
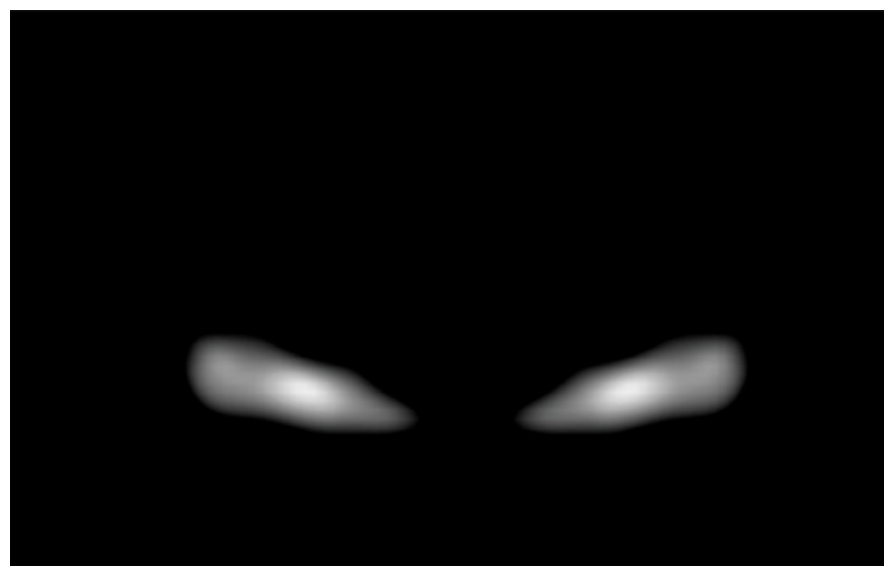
The FMA is used as an intermediate saliency map to enhance asymmetry patterns and does not directly represent final lesion localization. Since all asymmetry maps are derived from the same pixel-wise absolute difference formulation, they are expressed on a comparable and non-negative scale, which mitigates inter-modality intensity imbalance and reduces the risk of dominance by a single modality. The multiplicative formulation therefore acts as a coherence-enhancing operator, emphasizing regions where asymmetry is consistently present across modalities while attenuating isolated responses. Figure 6 presents an illustrative example, in which potential pathological regions within the prostate can be identified clearly.
However, the suspicious area(s) identified in the FMA are, of course, distributed symmetrically with respect to the axis of symmetry. The next step is needed to determine the position of the anomalous region(s) unambiguously.

2.6. Generating Binary Masks Indicating the Locations of Potential Anomalies

In this step, two binary masks, B D W I and B A D C , are constructed, to identify areas with an increased probability of tissue with anomalies, based on common radiological criteria for the interpretation of I D W I and I A D C images. In I D W I , the anomalous tissue is characterized by high pixel values, whereas in I A D C , low pixel values may correspond to cancerous areas.
As the actual absolute pixel values differ slightly from one investigation to another, due to moderately varying MRI machine settings, appropriate threshold values, t D W I for I D W I and t A D C for I A D C , are determined first as follows:
t D W I = C D W I | Ω | ( x , y ) Ω I D W I ( x , y ) ,   t A D C = C A D C | Ω | ( x , y ) Ω I A D C ( x , y ) ,
where | Ω | denotes the number of pixels within Ω , while C D W I and C A D C are user-adjustable parameters, intended to amplify the potential anomalous values. C D W I [ 1.5 ,   2.0 ] is intended to increase the high values in I D W I , while C A D C [ 0.5 ,   0.8 ] is used to reduce the low values in I A D C further. The thresholds in Equations (5) and (6) are defined relative to the mean intensity within Ω , which reduces variability due to differences in MRI machine settings.
The binary masks are determined as follows:
B D W I ( x , y ) = { 1 ,   I D W I ( x , y ) t D W I 0 ,   I D W I ( x , y ) < t D W I
and
B A D C ( x , y ) = { 1 ,   I A D C ( x , y ) t A D C 0 ,   I A D C ( x , y ) > t A D C
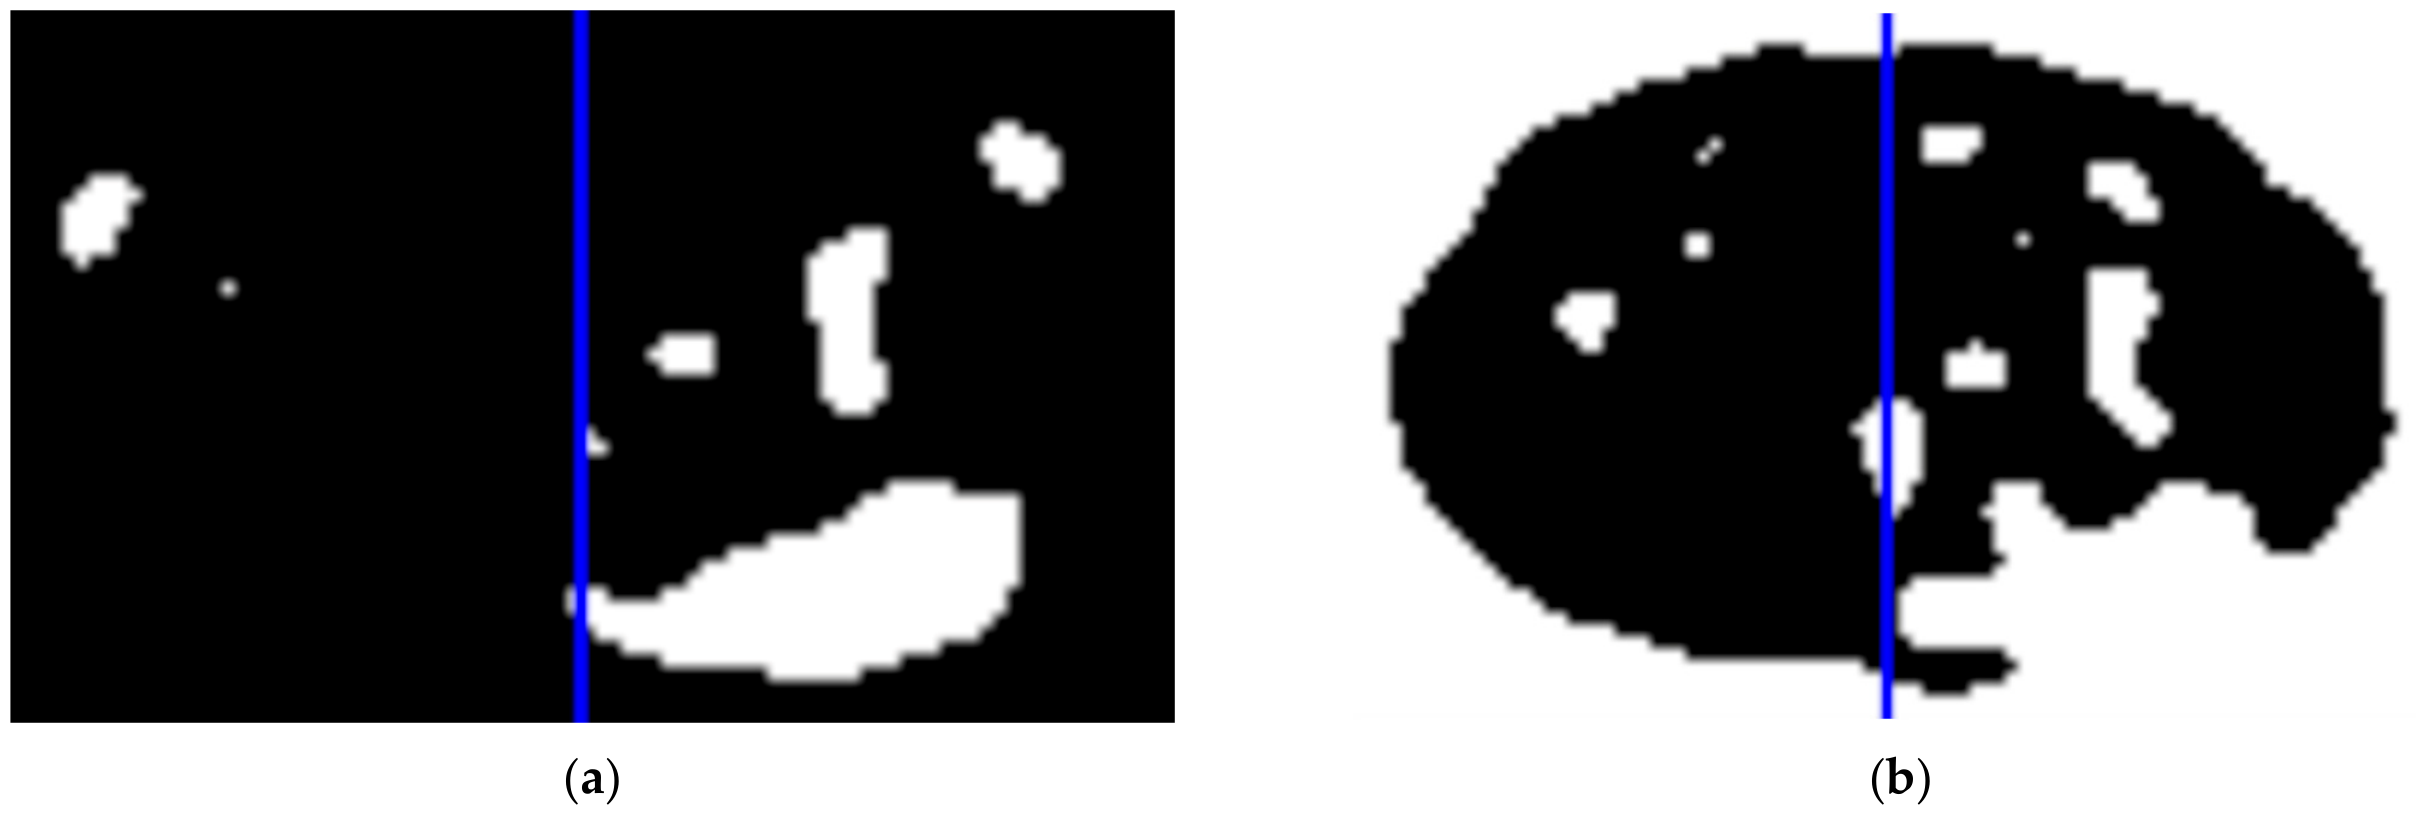
where 0 x < M and 0 y < N . The binary masks B D W I and B A D C for our example are shown in Figure 7.

2.7. Determining the Suspicious Areas Map for Prostate Cancer

The Fused Map of Asymmetry ( F M A ) and both binary masks B D W I and B A D C are applied to calculate, according to Equation (7), the final PCa Suspicious Areas Map ( S A M ):
S A M ( x , y ) = 2 × F A M ( x , y ) × B D W I ( x , y ) × B A D C ( x , y ) ,   0 x < N ,   0 y < M
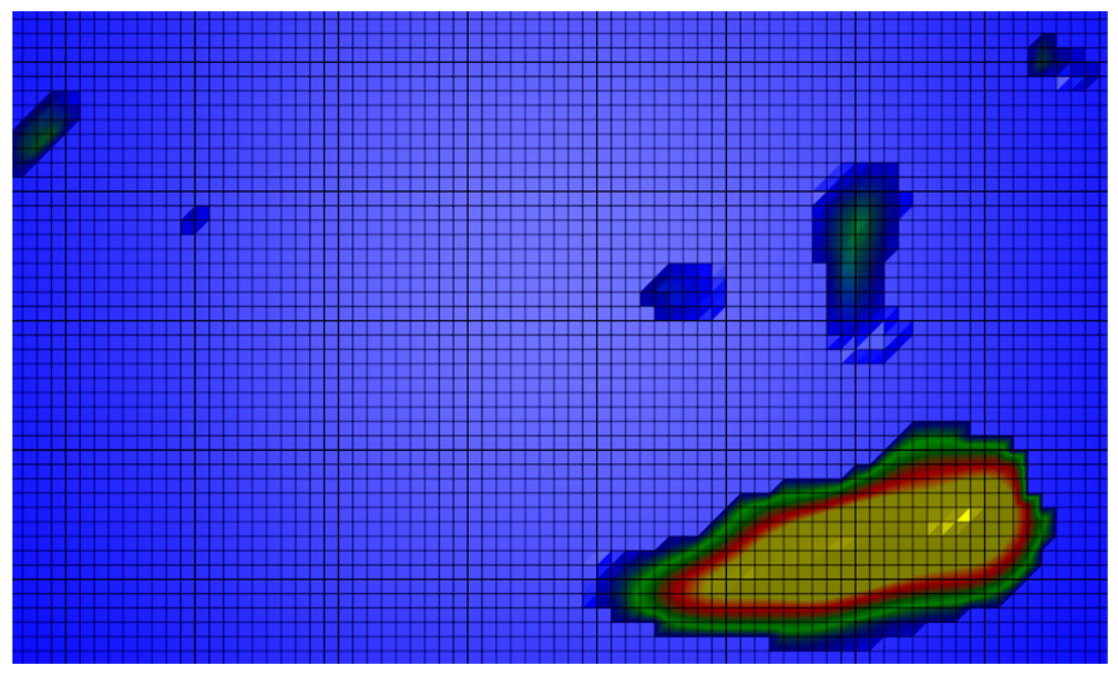
The SAM values are linearly rescaled to the range [0, 511) for visualization purposes as shown in Figure 8 for given example. This range is used as an index for color encoding, where values are mapped to a RGB colormap as defined in Table 1. The color encoding is based on commonly used perceptual conventions to represent increasing levels of abnormality in the analyzed tissues.

2.8. Constructing the Final Decision Map to Support Diagnosis

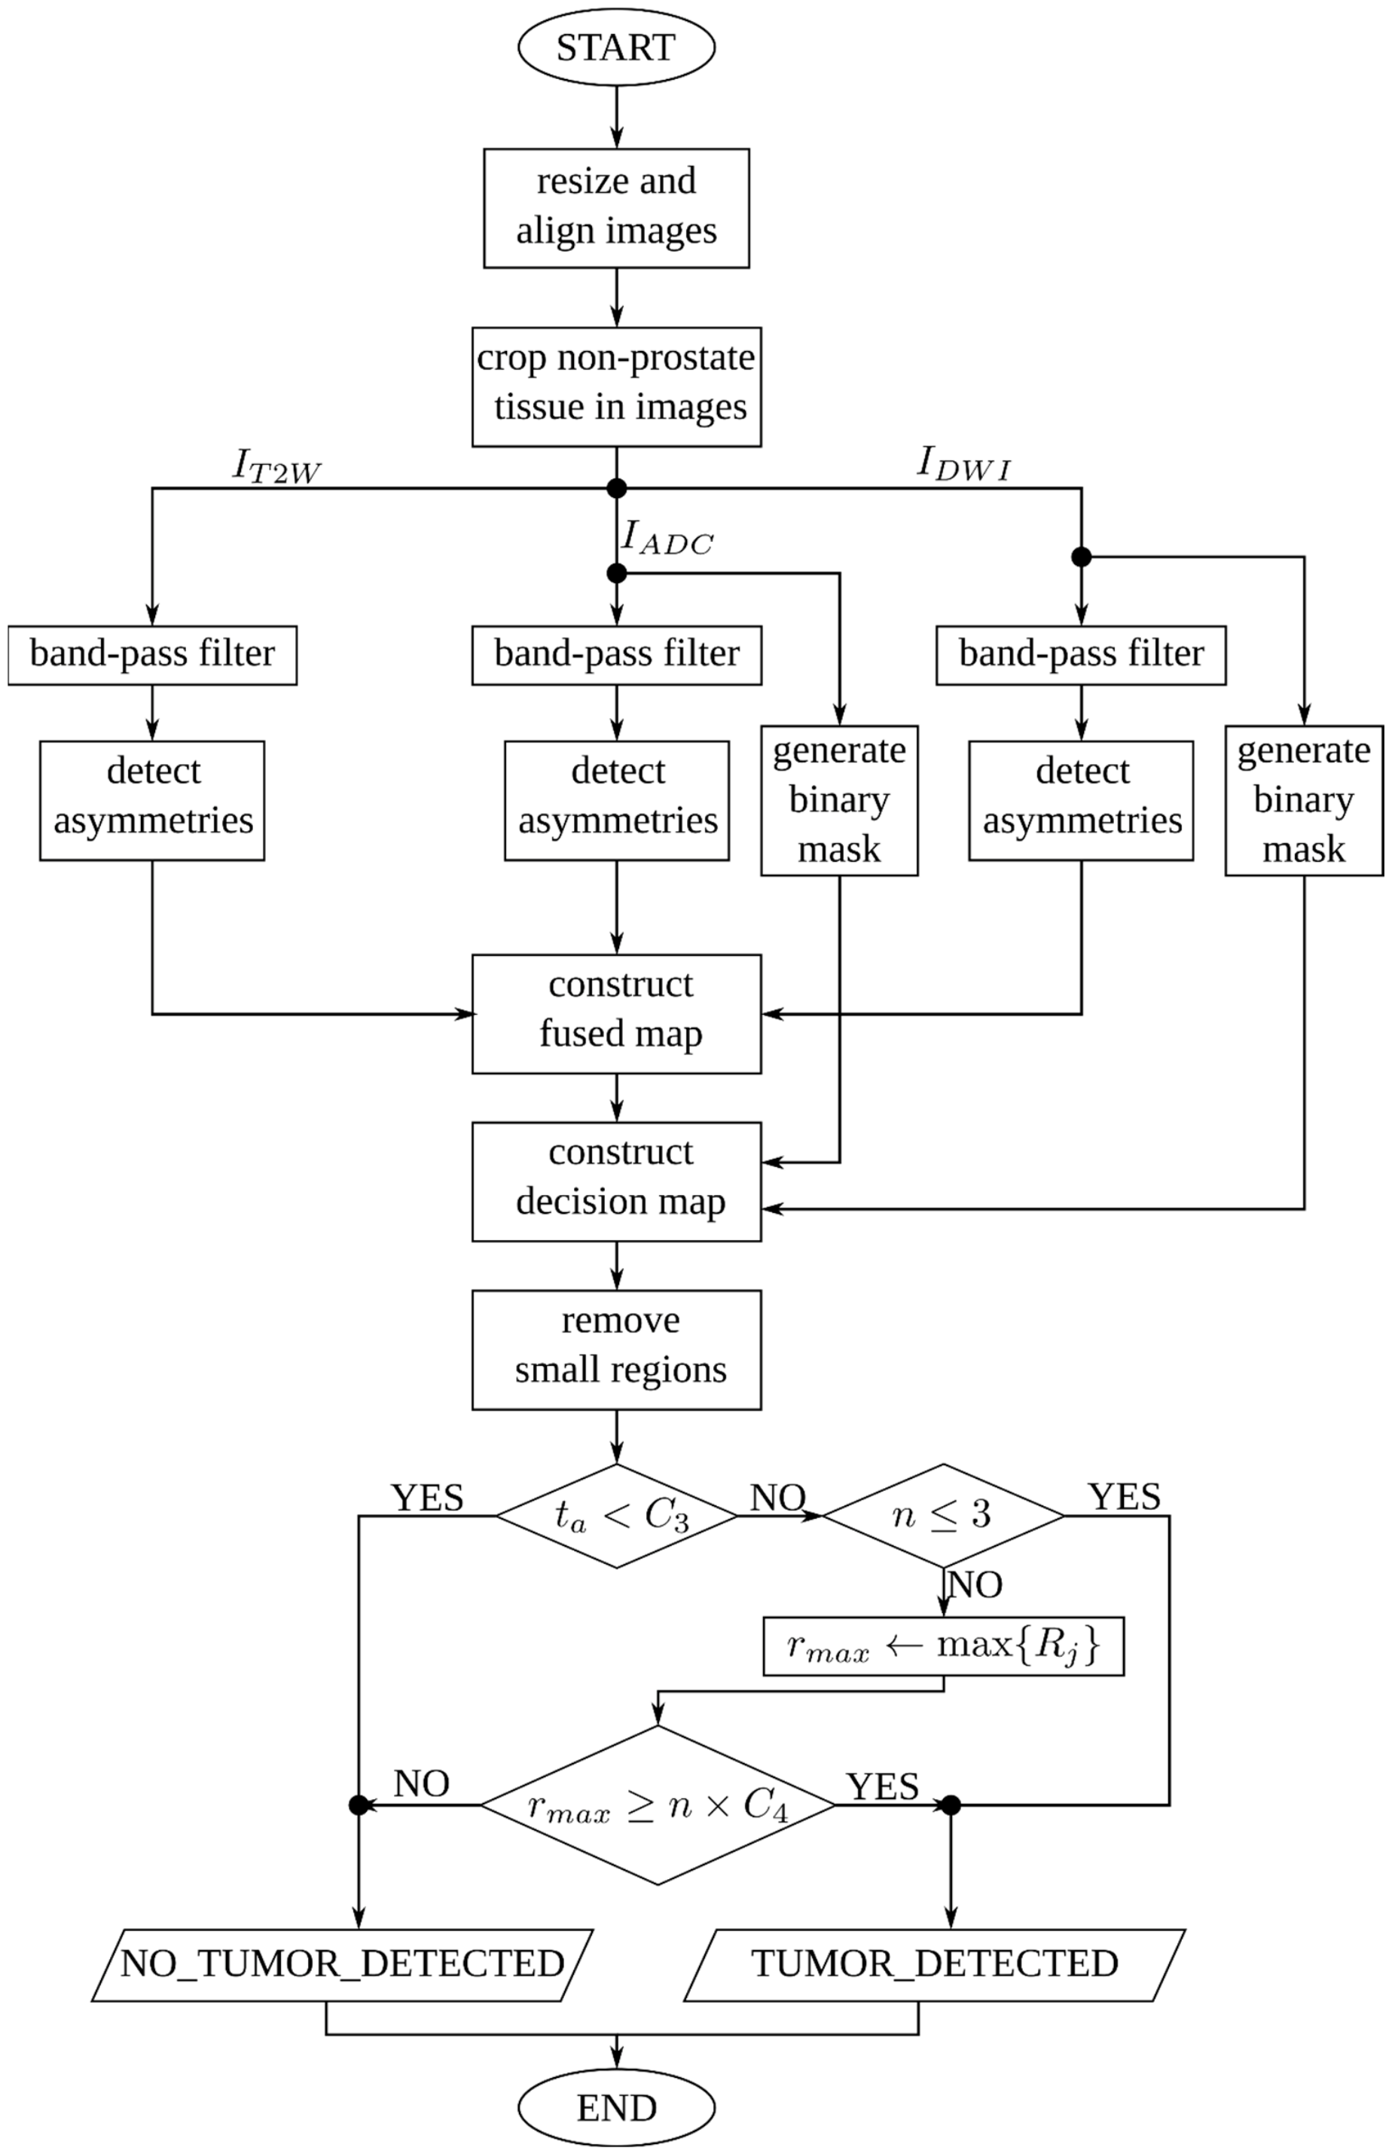
In this stage the S A M is analyzed further to support the final decision as follows. Suspicious regions are identified as groups of pixels where S A M ( x , y ) C 1 (guidance on setting the constants in this part of the PcaAsym will be discussed later). The pixels are grouped into regions using the flood-fill algorithm [36], taking the pixels’ 8-neighborhood into account, which follows standard practice in region-based image analysis. While alternative 4-neighborhood connectivity may slightly affect boundary assignment, the resulting regions remain generally stable. There may be m such regions R i , where 0 i < m . Their respective areas A i ,   0 i < m , are then calculated by Equation (8).
A i = ( x , y ) R i 1
The following steps are then applied:
  • If A i ( R i ) < C 2 , the region is ignored. There are n m remaining regions.
  • The sum of all the remaining regions is then calculated as:
    t a = j = 0 n A j
  • If t a < C 3 , the PcaAsym system assumes that there is no tumor present and terminates; otherwise, it proceeds to step 4.
  • When n 3 , PcaAsym assumes that a tumor has been detected. However, the prostate tissues may be considerably heterogeneous, and, in many cases, n is significantly larger. In such cases, the algorithm continues to step 5.
  • When n > 3 , the largest region r m a x = m a x { R j } ,   0 j < n , is determined. If r m a x C 4 × n , pathology is detected.
The pseudocode in Algorithm 1 and the flowchart in Figure 9 clarify the decision process.
Algorithm 1. Pseudocode of the PcaAsym decision-making process based on the S A M analysis of suspicious tissue
Function Decision( S A M , C 1 , C 2 , C 3 , C 4 )
begin
    ( R , m ) ConstructRegions(SAM, C 1 );
     A   CalculateRegionAreas( m , R );
    ( R , n ) RemoveSmallRegion( C 2 , m , R );
     t a   CalculateSumOfAreas( A , n );

    if ( t a < C 3 )
       return NO_TUMOR_DETECTED;
    if ( n 3 )
       return TUMOR_DETECTED;
    else begin
      r m a x   FindLargestRegions( R , n );
     if ( r m a x   n × C 4 )
       return TUMOR_DETECTED;
     else
       return NO_TUMOR_DETECTED;
    end
end

2.9. Determination of Time Complexity

At first, I D W I and I A D C images are upscaled from 256 × 256 to 320 × 320 pixels using Lanczos interpolation, which has linear time complexity T L a n = O ( K ) , where K denotes the number of output pixels. After cropping, all modalities have resolution L = N × M , where N , M 320 and L K . Cropping is performed in linear time T C r o p = O ( K ) . A 2D Fast Fourier Transform (FFT) is applied to the cropped images with the time complexity T F F T = O ( L   l o g   L ) . Symmetry coefficient and asymmetry maps are computed in linear time T A s y m = O ( L ) , too. A Fused Map of Asymmetries is calculated by element-wise multiplication of the corresponding values from all three asymmetry maps, also linear time T F A M = O ( L ) . Binary masks B D W I and B A D C are computed by applying an element-wise thresholding operation to I D W I and I A D C , respectively, in linear time T B M = O ( L ) , where threshold is also calculated in linear time T T h r = O ( L ) .
The final PCa Suspicious Areas Map (SAM) is computed by element-wise multiplication of the Fused Map of Asymmetries and both binary masks B D W I and B A D C , with linear time complexity T S A M = O ( L ) . Group of pixels constructed using a flood-fill algorithm and the computation of their areas are also performed in linear time T A r e a = O ( L ) , since each pixel is visited at most once. The removal of small areas and final decision are performed in constant time T D e c = O ( 1 ) . In summary:
T P c a A s y m = T L a n + T C r o p + T F F T + T A s y m + T F A M + T T h r + T B M + T S A M + T A r e a + T D e c i s i o n = O ( K ) + O ( K ) + O ( L   l o g   L ) + O ( L ) + O ( L ) + O ( L ) + O ( L ) + O ( L ) + O ( L ) + O ( 1 ) = O ( L log L )
Since L K , the overall time complexity can also be expressed as
T P c a A s y m = O ( L log L ) O ( K log K )
The measured CPU time for processing MRI images across all three modalities is approximately 30 ms, excluding operator-dependent steps such as manual prostate selection and image loading. The measurements were performed on an average PC equipped with an AMD Ryzen 9 5900X processor and 64 GB of RAM, running Ubuntu Linux 26.04.

2.10. Guidance on Setting the Constants

Constant C 1 was assigned a value 50, based on the threshold defined in Table 1. Constant C 2 was determined from the published literature; several studies have shown that tumors below a certain volume may be regarded as clinically insignificant [37]. Although the reported thresholds vary, a total volume below 0.5 cm3 is commonly considered insignificant. Since PcaAsym utilizes 2D images taken from a single prostate cross-section, we estimated the corresponding area as 0.5 3 0.63 cm2, which yields C 2 = 116 pixels. However, tumors can have complex shapes, and because the proposed method may truncate malignant tissue at the edges of suspicious areas, C 2 was set conservatively within the range [ 10 ,   20 ] , with a typical value of C 2 = 15 . The same value was, consequently, set for C 3 as well. Constant C 4 was determined empirically by observing a substantial set of heterogeneous prostates. The suitable range for C 4 appears to be between 10 and 20 pixels as well.
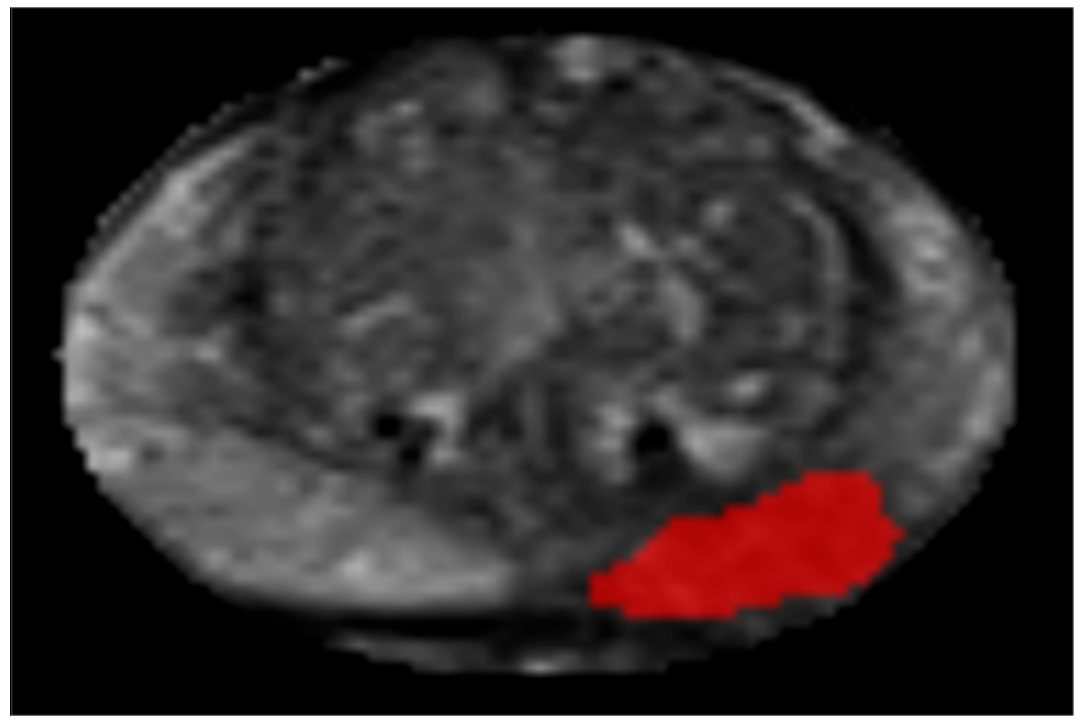
Using these settings, PcaAsym successfully classified S A M from Figure 8 as highly suspicious for prostate cancer, and indicates the positions of the anomalous tissue, as shown in Figure 10.

3. Model Validation

To validate the developed method, a single-center retrospective proof-of-concept cross-sectional case-control study was conducted with institutional review board approval (0120-282/2024-2711-7) and the waiver of informed consent.

3.1. Methods

3.1.1. Inclusion and Exclusion Criteria

The eligible patients were biopsy—naive men who underwent a prostate multiparametric MRI (mpMRI) between September 2023 and May 2025, and, subsequently, underwent MRI–ultrasound targeted fusion biopsy.
The exclusion criteria were prior prostate biopsy or prostate-directed treatment and non-diagnostic mpMRI examinations due to artefacts.

3.1.2. Patient Data Collection

Sixty-six patients met the inclusion criteria. Their ages, prostate-specific antigen (PSA), PSA density (PSAd) and biopsy results were retrieved from the hospital information system. The imaging characteristics (lesion size, lesion location) were obtained from the radiology reports.

3.1.3. MRI Acquisition

All the mpMRI examinations were performed on two 1.5 T Siemens scanners using a pelvic phased-array coil. The protocol was compliant with a standardized PI-RADS v2.1 protocol [3], including multiplanar T2-weighted turbo spin echo (T2W TSE), diffusion-weighted imaging (DWI) with b-values of 50, 800, and 1700 s/mm2, apparent diffusion coefficient (ADC) maps derived from DWI, and dynamic contrast-enhanced (DCE) sequences. DCE imaging was performed after intravenous administration of gadobutrol (Bayer, Germany). Detailed sequence parameters are provided in Table 2.

3.1.4. Reference Standard

To ensure a uniform and robust reference standard, all 66 patients underwent a combined MRI–ultrasound fusion biopsy. The patients were classified as PCa-positive when the biopsy demonstrated prostate cancer as defined by International Society of Urological Pathology (ISUP) classification [3], and PCa-negative, when the biopsy findings were negative.

3.1.5. Statistical Analysis

Descriptive statistics were calculated for the baseline characteristics. Sensitivity, specificity, positive predictive value (PPV), negative predictive value (NPV), accuracy, and corresponding 95% confidence intervals were calculated using biopsy as the reference standard. Algorithm reproducibility for the binary output (positive/negative classification) was assessed in 15 randomly selected cases by repeating the full analysis three times with independent ellipse placement by the same abdominal radiologist (9 years of experience reporting prostate MRI). To assess inter-reader variability of prostate localization, a second abdominal radiologist (5 years of experience reporting prostate MRI) independently positioned the prostate ellipse in the same 15 cases. Agreement in the final binary classification was assessed using percentage agreement and Cohen’s κ statistic. An exploratory zone-specific analysis was performed to evaluate diagnostic performance in the peripheral and transition zones. Subgroup analysis compared the detection rates for lesions < 10 mm and ≥10 mm. The analyses were performed using MedCalc 19.3.1. [38].

3.2. Results

3.2.1. Study Population

The cohort comprised 66 men with a mean age at 69.4 years, mean PSA at 9.8 ng/mL and mean prostate size at 48.8 mL. There were 33 men with prostate cancer and 33 with a negative biopsy. The baseline characteristics are presented in Table 3.

3.2.2. Algorithm Performance

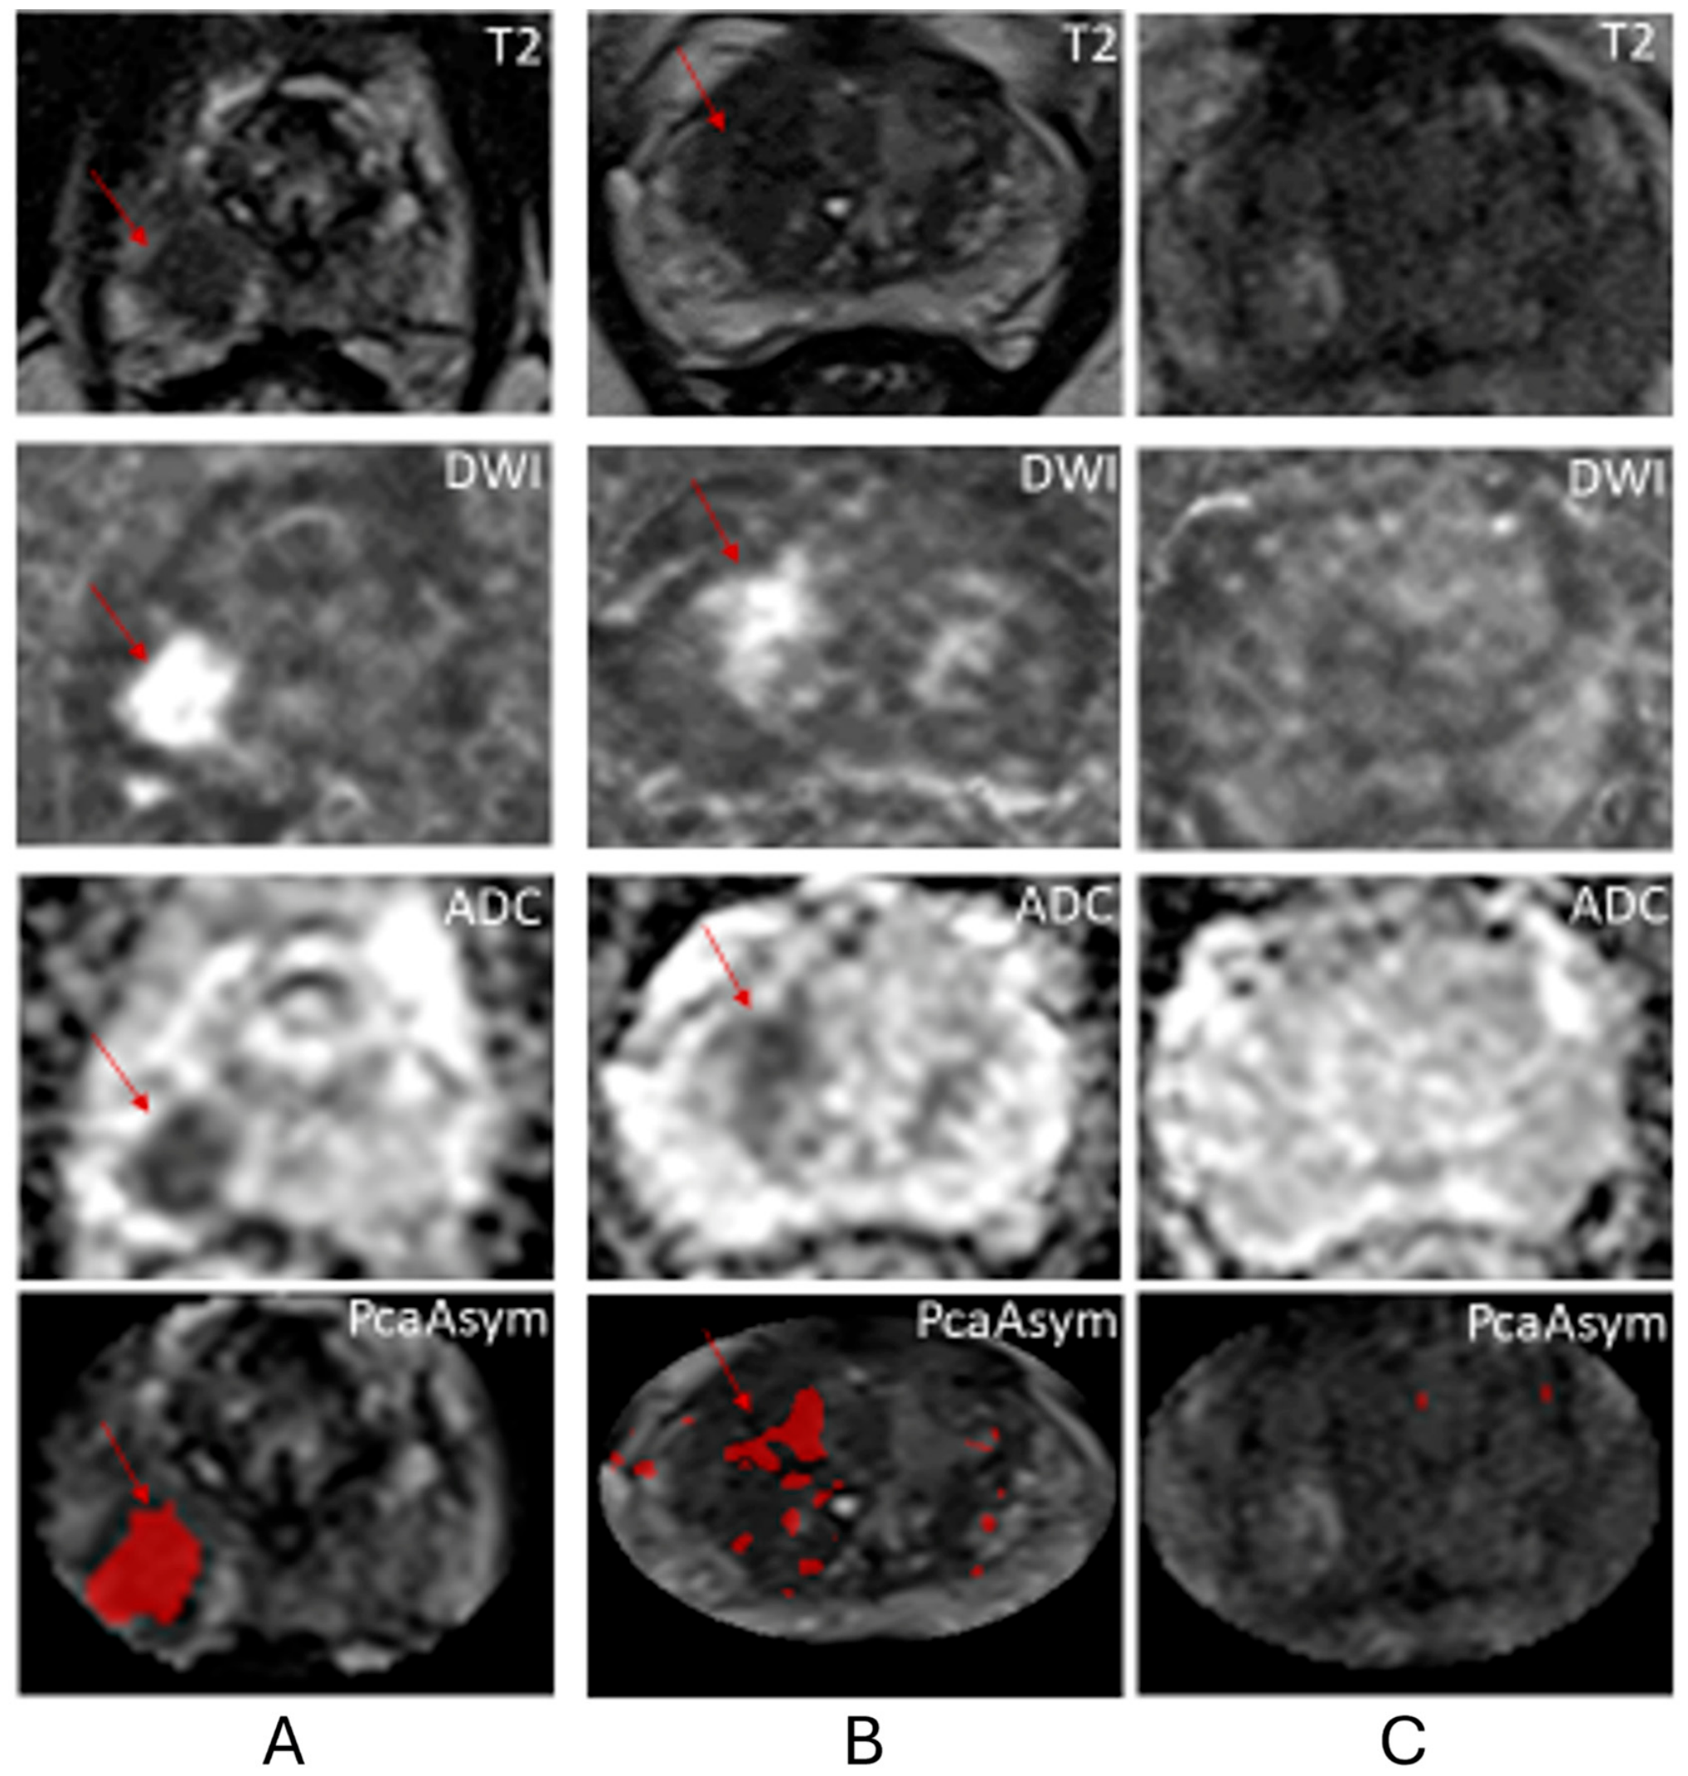
PcaAsym detected 29 of 33 cancers, yielding a sensitivity of 87.9% (95% CI, 72.7–95.2%). It classified 15 of 33 non-cancer cases correctly, resulting in a specificity of 45.5% (95% CI, 29.8–62.0%). PPV and NPV were 61.7% and 78.9%, respectively, with an overall accuracy of 66.7% (see Table 4). Two missed cancers were located in the peripheral zone and were smaller than 10 mm (7 mm). One cancer was situated in the transition zone, where a benign stromal or glandular heterogeneity was present. Another cancer had a cribriform pattern, which is difficult to detect because it differentiates poorly from healthy tissue. False-positive outputs (n = 18) arose predominantly in the transition zone (n = 11) and corresponded to benign stromal or glandular heterogeneity (see Figure 11).

3.2.3. Lesion-Size Subgroup Analysis

The mean lesion size on MRI was 14.9 mm, with larger lesions observed in biopsy-positive compared with biopsy-negative cases (17.1 mm vs. 12.7 mm, respectively). Using a 10 mm threshold, there were 47 MRI lesions (20 positive on biopsy) measuring ≥10 mm and 19 lesions (13 positive on biopsy) measuring <10 mm. The detection performance was higher for lesions ≥ 10 mm (22 of 24 detected; 91.7%) than for lesions < 10 mm (7 of 9 detected; 77.8%). The overall accuracy for ≥10 mm versus <10 mm was 68.1% versus 63.2%, respectively (see Table 4).
Zone-specific subanalysis revealed substantial performance differences between the peripheral and transition zones. In the peripheral zone, the algorithm achieved a sensitivity of 93.3% (95% CI 78.7–98.2%) and a specificity of 60.0% (95% CI 35.7–80.2%). In contrast, performance in the transition zone was markedly lower, with a sensitivity of 33.3% (95% CI 6.1–79.2%) and a specificity of 33.3% (95% CI 16.3–56.3%) (see Table 5).

3.2.4. Reproducibility and Inter-Reader Agreement

The reproducibility of the PcaAsym algorithm was assessed by repeating the full analysis three times on 15 randomly selected cases, with independent repositioning of the prostate ellipse for each repetition. All repeated analyses produced identical binary outputs. In addition, a second radiologist independently positioned the prostate ellipse in the same 15 cases, resulting in concordant binary outputs in 14 of 15 cases (93.3%; Cohen’s κ = 0.76).

4. Discussion

This study demonstrates the feasibility of reflectional asymmetry analysis for PCa detection on MRI, achieving high sensitivity and reproducible binary outputs. However, previous work relying solely on T2W image asymmetry proved insufficient for reliable and consistent PCa detection [30]. To overcome this limitation, we systematically combined complementary anatomical and functional imaging techniques to strengthen the original T2W asymmetry approach and improve reliability, especially in challenging or borderline cases according to the PI-RADS v2.1 classification [3]. The proposed method extends asymmetry analysis to T2 weighted, DWI, and ADC images, and fuses the three results into a single composite prostate asymmetry map. Detection is further refined by applying established DWI/ADC radiological criteria to reduce false positives. In addition, all images were pre-processed using noise-reduction filtering, and adaptive thresholding criteria were applied to obtain the final binary decision regarding the presence of suspicious lesions.
PcaAsym achieved a sensitivity of 0.88 and specificity of 0.46. While direct comparison with published MRI performance is limited by differences in study design and patient populations, the observed performance is broadly consistent with contemporary MRI literature (meta-analyses typically report Sn 0.88–0.96 and Sp 0.43–0.66) [39].
In our study, missed cancers were predominantly small lesions (<10 mm) in the peripheral zone, lesions obscured by benign tissue heterogeneity in the transition zone, or those with cribriform growth patterns that closely resemble normal tissue. The method performs better on larger and more conspicuous lesions than on smaller ones. This is expected, given the relatively low resolution of the input images (320 × 320 pixels for T2 and 256 × 256 for DWI and ADC map). With a resolution of 256 × 256 pixels, only about 20% of the image area corresponds to the prostate, with approximately 50 × 50 pixels representing the entire gland. Under these conditions, reliable detection of small focal abnormalities is inherently challenging. This limitation is reflected in the reduced sensitivity for lesions < 10 mm. However, smaller lesions are more likely to represent clinically insignificant or indolent disease, whereas detection of larger lesions—where the proposed method demonstrates higher performance—is of greater clinical relevance [40,41].
Specificity represents the primary performance limitation of the current framework and warrants critical discussion. In this study, biopsy was used as a robust reference standard; however, due to current clinical practice, where PI-RADS 1–2 findings typically do not proceed to biopsy, all included cases were sufficiently suspicious on MRI to warrant biopsy. Consequently, the framework was evaluated in a clinically challenging, biopsy-enriched population rather than an unselected diagnostic or screening cohort. False-positive findings occurred predominantly in the transition zone, where benign stromal and glandular heterogeneity can generate asymmetric signal patterns that resemble clinically significant prostate cancer [42,43]. This observation is consistent with the recognized difficulty of distinguishing benign and malignant processes on prostate MRI resulting in only modest positive predictive value 40]. Overall, reducing false-positive findings, particularly in the transition zone, is identified as the principal target for future development, potentially through integration of additional radiological and clinical parameters such as PSA density.
The proposed method shows potential for use as a semi-automated prostate MRI decision-support tool by highlighting suspicious regions for radiologist review. Such an approach may help reduce missed lesions and perceptual errors, while also decreasing the workload associated with manual image interpretation. Following manual prostate localization, all subsequent processing steps are automated and deterministic. Intra-reader repeatability was excellent and inter-reader agreement was substantial, suggesting that minor variations in ellipse placement had limited impact on the final classification. Formal evaluation across different MRI vendors, field strengths, and imaging protocols was not performed; however, the study cohort included examinations acquired on two separate 1.5 T MRI systems, providing a limited degree of technical heterogeneity. Further evaluation across larger cohorts, multiple readers, and diverse imaging platforms remains warranted.
The band-pass filter cut-off frequencies were selected empirically rather than through formal optimization (e.g., grid search with cross-validation). While this approach yielded promising results in the current proof-of-concept cohort, it represents a limitation. Similar empirical parameter selection is frequently reported in early-stage prostate MRI CAD and radiomics literature before more comprehensive tuning in subsequent validation studies [44]. Although the current study focuses exclusively on imaging-derived features, future developments could incorporate clinical parameters such as PSAd and total PSA to further improve risk stratification and support biopsy decision-making. Unlike data-driven AI approaches, the proposed method is fully rule-based, with transparent decision logic expressed through explicit pseudocode, satisfying the explainability and interpretability requirements increasingly expected of clinical decision-support systems. It relies on classical signal processing techniques and can be implemented on standard hardware without the need for specialized computational resources. In contrast, many DL models typically require substantial computational power, including high-performance graphics processing unit (GPU) or tensor processing unit (TPU), and are associated with higher deployment and maintenance costs [15]. This makes PcaAsym more accessible for use in resource-limited settings, such as smaller hospitals or regions with limited AI infrastructure and/or may also have educational utility. Furthermore, as no training data is required, the method is inherently less dependent on dataset-specific characteristics than data-driven approaches: however, robustness across scanners and protocols remains to be established. Future work should include a formal validation study in a larger consecutive cohort, to enable meaningful clinical comparison with radiologists. A prospective multi-center, multi-vendor study would additionally allow systematic evaluation of robustness across different scanners and acquisition protocols. Automated prostate localization may further reduce operator dependence and should be evaluated in future work. In addition, systematic comparison with contemporary deep learning-based prostate lesion detection methods would help contextualize PcaAsym within the current state of the art.

5. Conclusions

This study demonstrates the feasibility of semi-automated PCa detection on MRI using asymmetry analysis. Although reflectional asymmetry alone proves insufficient for reliable prostate cancer detection, its synergistic integration with complementary radiological criteria derived from T2W, DWI, and ADC images facilitates the identification of clinically relevant lesions. The proposed PcaAsym framework provides a deterministic, interpretable, and computationally efficient approach that achieves high sensitivity and robust reproducibility. Future work should focus on improving specificity, validating the method in larger multi-center cohorts with representative disease prevalence, and assessing its integration into clinical workflows. In addition, the impact of different MRI systems, particularly higher-resolution imaging, should be investigated. An ablation study is planned to quantify the contribution of individual components of the PcaAsym programming framework. Integration with machine learning methods may further enhance diagnostic performance while preserving interpretability and reproducibility.
The PcaAsym framework is publicly available to facilitate further research. It can be downloaded from https://gemma.feri.um.si/ProstateSym.zip (accessed on 4 April 2026).

Author Contributions

Conceptualization, S.V.Đ., B.Ž. and I.C.; methodology, S.V.Đ., B.Ž. and I.C.; software, S.V.Đ., A.N. and B.Ž.; validation, S.V.Đ., A.N. and B.Ž.; formal analysis, S.V.Đ. and I.C.; investigation, S.V.Đ., B.Ž. and I.C.; resources, S.V.Đ., B.Ž., A.N. and I.C.; data curation, S.V.Đ.; writing—original draft preparation, S.V.Đ., B.Ž. and I.C.; writing—review and editing, S.V.Đ., B.Ž. and I.C.; visualization, S.V.Đ. and A.N.; supervision, B.Ž. and I.C.; funding acquisition, B.Ž. All authors have read and agreed to the published version of the manuscript.

Funding

This research was funded by the Slovene Research and Innovation Agency under Research 210 Project N2-0181 and Research Programme P2-0041.

Institutional Review Board Statement

Patients provided written informed consent for the MR examination. However, due to the retrospective nature of the study, written informed consent for study participation was not obtained. MR images were anonymized, and the study design was approved by the Ethics Committee of Slovenia.

Data Availability Statement

The data that support the findings of this study are available on request from the corresponding author.

Acknowledgments

All authors express their gratitude to Jan Zmazek for the statistical analysis of the data.

Conflicts of Interest

The authors declare no conflicts of interest. No AI-generated tools were used to produce the scientific content of this manuscript, including the study design, data collection, analysis, interpretation of results, or conclusions. AI-assisted language editing tools were used solely for grammar checking and improvement of English readability. The authors take full responsibility for the integrity and accuracy of all scientific content presented in this work.

References

  1. Schafer, E.; Laversanne, M.; Sung, H.; Soerjomataram, I.; Briganti, A.; Dahut, W.; Bray, F.; Jemal, A. Recent Patterns and Trends in Global Prostate Cancer Incidence and Mortality: An Update. Eur. Urol. 2025, 87, 302–313. [Google Scholar] [CrossRef] [PubMed]
  2. Stabile, A.; Giganti, F.; Rosenkrantz, A.; Taneja, S.; Villeirs, G.; Gill, I.; Allen, C.; Emberton, M.; Moore, C.; Kasivisvanathan, V. Multiparametric MRI for Prostate Cancer Diagnosis: Current Status and Future Directions. Nat. Rev. Urol. 2020, 17, 41–61. [Google Scholar] [CrossRef] [PubMed]
  3. Padhani, A.; Weinreb, J.; Rosenkrantz, A.; Villeirs, G.; Turkbey, B.; Barentsz, J. Prostate Imaging-Reporting and Data System Steering Committee: PI-RADS v2 Status Update and Future Directions. Eur. Urol. 2019, 75, 385–396. [Google Scholar] [CrossRef] [PubMed]
  4. Patel, P.; Wang, S.; Siddiqui, M. The Use of Multiparametric Magnetic Resonance Imaging (mpMRI) in the Detection, Evaluation, and Surveillance of Clinically Significant Prostate Cancer (csPCa). Curr. Urol. Rep. 2019, 20, 60. [Google Scholar] [CrossRef] [PubMed]
  5. Gatti, M.; Faletti, R.; Calleris, G.; Giglio, J.; Berzovini, C.; Gentile, F.; Marra, G.; Misischi, F.; Molinaro, L.; Bergamasco, L.; et al. Prostate Cancer Detection with Biparametric Magnetic Resonance Imaging (bpMRI) by Readers with Different Experience: Performance and Comparison with Multiparametric (mpMRI). Abdom. Radiol. 2019, 44, 1883–1893. [Google Scholar] [CrossRef] [PubMed]
  6. Gulati, R.; Jiao, B.; Al-Faouri, R.; Sharma, V.; Kaul, S.; Fleishman, A.; Wymer, K.; Boorjian, S.; Olumi, A.; Etzioni, R.; et al. Lifetime Health and Economic Outcomes of Biparametric Magnetic Resonance Imaging as First-Line Screening for Prostate Cancer: A Decision Model Analysis. Ann. Intern. Med. 2024, 177, 871–881. [Google Scholar] [CrossRef] [PubMed]
  7. Merriel, S.; Buttle, P.; Price, S.; Burns-Cox, N.; Walter, F.; Hamilton, W.; Spencer, A. Early Economic Evaluation of Magnetic Resonance Imaging for Prostate Cancer Detection in Primary Care. BJUI Compass 2024, 5, 855–864. [Google Scholar] [CrossRef] [PubMed]
  8. Oerther, B.; Engel, H.; Bamberg, F.; Sigle, A.; Gratzke, C.; Benndorf, M. Cancer Detection Rates of the PI-RADSv2.1 Assessment Categories: Systematic Review and Meta-Analysis on Lesion Level and Patient Level. Prostate Cancer Prostatic Dis. 2022, 25, 256–263. [Google Scholar] [CrossRef] [PubMed]
  9. Fei, B. Computer-Aided Diagnosis of Prostate Cancer with MRI. Curr. Opin. Biomed. Eng. 2017, 3, 20–27. [Google Scholar] [CrossRef] [PubMed]
  10. Alis, D.; Onay, A.; Colak, E.; Bakır, B. A Narrative Review of Artificial Intelligence in MRI-Guided Prostate Cancer Diagnosis: Addressing Key Challenges. Diagnostics 2025, 15, 1342. [Google Scholar] [CrossRef] [PubMed]
  11. Xing, X.; Zhao, X.; Wei, H.; Li, Y. Diagnostic accuracy of different computer-aided diagnostic systems for prostate cancer based on magnetic resonance imaging: A systematic review with diagnostic meta-analysis. Medicine 2021, 100, e23817. [Google Scholar] [CrossRef] [PubMed]
  12. Cuocolo, R.; Cipullo, M.; Stanzione, A.; Romeo, V.; Green, R.; Cantoni, V.; Ponsiglione, A.; Ugga, L.; Imbriaco, M. Machine Learning for the Identification of Clinically Significant Prostate Cancer on MRI: A Meta-Analysis. Eur. Radiol. 2020, 30, 6877–6887. [Google Scholar] [CrossRef] [PubMed]
  13. Alkadi, R.; Taher, F.; El-baz, A.; Werghi, N. A Deep Learning-Based Approach for the Detection and Localization of Prostate Cancer in T2 Magnetic Resonance Images. J. Digit. Imaging 2019, 32, 793–807. [Google Scholar] [CrossRef] [PubMed]
  14. LeCun, Y.; Bengio, Y.; Hinton, G. Deep learning. Nature 2015, 521, 436–444. [Google Scholar] [CrossRef] [PubMed]
  15. Wildeboer, R.; van Sloun, R.; Wijkstra, H.; Mischi, M. Artificial Intelligence in Multiparametric Prostate Cancer Imaging with Focus on Deep-Learning Methods. Comput. Methods Programs Biomed. 2020, 189, 105316. [Google Scholar] [CrossRef] [PubMed]
  16. Saha, A.; Bosma, J.S.; Twilt, J.J.; van Ginneken, B.; Bjartell, A.; Padhani, A.R.; Bonekamp, D.; Villeirs, G.; Salomon, G.; Giannarini, G.; et al. Artificial intelligence and radiologists in prostate cancer detection on MRI (PI-CAI): An international, paired, non-inferiority, confirmatory study. Lancet Oncol. 2024, 25, 879–887. [Google Scholar] [CrossRef] [PubMed] [PubMed Central]
  17. Twilt, J.J.; Saha, A.; Bosma, J.S.; Giannarini, G.; Padhani, A.R.; Yakar, D.; Elschot, M.; Veltman, J.; Fütterer, J.; Huisman, H.; et al. Evaluating an AI-driven Triaging Workflow for MRI-based Clinically Significant Prostate Cancer Diagnosis: A Simulation Study. Radiol. Imaging Cancer 2026, 8, e250461. [Google Scholar] [CrossRef] [PubMed]
  18. Giganti, F.; Moreira da Silva, N.; Yeung, M.; Davies, L.; Frary, A.; Ferrer Rodriguez, M.; Sushentsev, N.; Ashley, N.; Andreou, A.; Bradley, A.; et al. AI-powered prostate cancer detection: A multi-centre, multi-scanner validation study. Eur. Radiol. 2025, 35, 4915–4924. [Google Scholar] [CrossRef] [PubMed]
  19. McManus, I.C. Symmetry and Asymmetry in Aesthetics and the Arts. Eur. Rev. 2005, 13, 157–180. [Google Scholar] [CrossRef]
  20. Mehaffy, M. The Impacts of Symmetry in Architecture and Urbanism: Toward a New Research Agenda. Buildings 2020, 10, 249. [Google Scholar] [CrossRef]
  21. Talavera-Martínez, L.; Bibiloni, P.; Giacaman, A.; Taberner, R.; Hernando, L.; González-Hidalgo, M. A Novel Approach for Skin Lesion Symmetry Classification with a Deep Learning Model. Comput. Biol. Med. 2022, 145, 105450. [Google Scholar] [CrossRef] [PubMed]
  22. Schmid-Saugeon, P. Symmetry Axis Computation for Almost-Symmetrical and Asymmetrical Objects: Application to Pigmented Skin Lesions. Med. Image Anal. 2000, 4, 269–282. [Google Scholar] [CrossRef] [PubMed]
  23. Tapp, K. Symmetry: A Mathematical Exploration; Springer: New York, NY, USA, 2012. [Google Scholar] [CrossRef]
  24. Dorado, R. Medial Axis of a Planar Region by Offset Self-Intersections. Comput. Aided Des. 2009, 41, 1050–1059. [Google Scholar] [CrossRef]
  25. Mitra, N.; Pauly, M.; Wand, M.; Ceylan, D. Symmetry in 3D Geometry: Extraction and Applications. Comput. Graph. Forum 2013, 32, 1–23. [Google Scholar] [CrossRef]
  26. Shi, G.; Liu, S.; Chen, P. A Fast NURBS Interpolation Method for 3D Ship Hull Surface. J. Appl. Sci. 2013, 13, 2139–2145. [Google Scholar] [CrossRef]
  27. Hansen, J.; Dalkin, B.; Harris, C.; Johnson, C.; Ahmann, F. Prostatic Asymmetry as a Risk Factor for Prostatic Carcinoma: Serial Prostate-Specific Antigen Monitoring and Cancer Detection. Br. J. Urol. 1997, 79, 924–926. [Google Scholar] [CrossRef] [PubMed]
  28. Yilmaz, Ö.; Kurul, Ö.; Ates, F.; Soydan, H.; Aktas, Z. Does an Asymmetric Lobe in Digital Rectal Examination Include Any Risk for Prostate Cancer? Results of 1495 biopsies. Int. Braz. J. Urol. 2016, 42, 704–709. [Google Scholar] [CrossRef] [PubMed]
  29. Kiyoshima, K.; Oda, Y.; Tamiya, S.; Hori, Y.; Yamada, T.; Naito, S.; Tsuneyoshi, M. Histopathological Approach to Prostatic Contour Alterations with the Concept of Left-Right Asymmetry. Pathol. Int. 2006, 56, 390–396. [Google Scholar] [CrossRef] [PubMed]
  30. Yang, L.; Xie, Y.; Li, B.; Xie, M.; Wang, X.; Zhang, J. Symmetry Based Prostate Cancer Detection. Br. J. Radiol. 2015, 88, 20150132. [Google Scholar] [CrossRef] [PubMed]
  31. Duchon, C. Lanczos Filtering in One and Two Dimensions. J. Appl. Meteorol. 1979, 18, 1016–1022. [Google Scholar] [CrossRef] [PubMed]
  32. Rao, K.R.; Kim, D.N.; Hwang, J.-J. Fast Fourier Transform-Algorithms and Applications; Springer: Dordrecht, The Netherlands, 2010. [Google Scholar] [CrossRef]
  33. Ferro, M.; de Cobelli, O.; Musi, G.; del Giudice, F.; Carrieri, G.; Busetto, G.M.; Falagario, U.G.; Sciarra, A.; Maggi, M.; Crocetto, F.; et al. Radiomics in Prostate Cancer: An Up-to-Date Review. Cancers 2022, 14, 1724. [Google Scholar] [CrossRef] [PubMed]
  34. Chaddad, A.; Tan, G.; Liang, X.; Hassan, L.; Rathore, S.; Desrosiers, C.; Katib, Y.; Niazi, T. Advancements in MRI-Based Radiomics and Artificial Intelligence for Prostate Cancer: A Comprehensive Review and Future Prospects. Cancers 2023, 15, 3839. [Google Scholar] [CrossRef] [PubMed]
  35. Žalik, B.; Strnad, D.; Kohek, Š.; Kolingerová, I.; Nerat, A.; Lukač, N.; Podgorelec, D. A Hierarchical Universal Algorithm for Geometric Objects’ Reflection Symmetry Detection. Symmetry 2022, 14, 1060. [Google Scholar] [CrossRef]
  36. Foley, J.D.; van Dam, A.; Feiner, S.K.; Hughes, J.F. Computer Graphics: Principles and Practice, 3rd ed.; Addison-Wesley: Boston, MA, USA, 2013. [Google Scholar]
  37. Stamey, T.A.; Freiha, F.S.; McNeal, J.E.; Redwine, E.A.; Whittemore, A.S.; Schmid, H.-P. Localized Prostate Cancer. Relationship of Tumor Volume to Clinical Significance for Treatment of Prostate Cancer. Cancer 1993, 71, 933–938. [Google Scholar] [CrossRef]
  38. MedCalc Statistical Software, version 19.3.1.; RRID: SCR_015044; MedCalc Software Ltd.: Ostend, Belgium, 2020; Available online: https://www.medcalc.org (accessed on 4 April 2026).
  39. Nedelcu, A.; Oerther, B.; Benkendorff, A.; Dieckbreder, S.; Schwarzer, G.; Agrotis, G.; Schoots, I.G.; El Matine, R.; Eisenblaetter, M.; Sigle, A.; et al. PI-RADS Version 2.1 for Prostate MRI Interpretation: Associations of Study Quality and Cancer Detection Metrics—A Systematic Review and Meta-Analysis. AJR Am. J. Roentgenol. 2026, 226, e2533583. [Google Scholar] [CrossRef] [PubMed]
  40. Wolters, T.; Roobol, M.J.; van Leeuwen, P.J.; van den Bergh, R.C.; Hoedemaeker, R.F.; van Leenders, G.J.; Schröder, F.H.; van der Kwast, T.H. A Critical Analysis of the Tumor Volume Threshold for Clinically Insignificant Prostate Cancer Using a Data Set of a Randomized Screening Trial. J. Urol. 2011, 185, 121–125. [Google Scholar] [CrossRef] [PubMed]
  41. Klein, E. What is ‘Insignificant’ Prostate Carcinoma? Cancer 2004, 101, 1923–1925. [Google Scholar] [CrossRef] [PubMed]
  42. Borofsky, S.; George, A.; Gaur, S.; Bernardo, M.; Greer, M.; Mertan, F.; Taffel, M.; Moreno, V.; Merino, M.; Wood, B.; et al. What Are We Missing? False-Negative Cancers at Multiparametric MR Imaging of the Prostate. Radiology 2018, 286, 186–195. [Google Scholar] [CrossRef] [PubMed]
  43. Bratan, F.; Niaf, E.; Melodelima, C.; Chesnais, A.; Souchon, R.; Mège-Lechevallier, F.; Colombel, M.; Rouvière, O. Influence of Imaging and Histological Factors on Prostate Cancer Detection and Localisation on Multiparametric MRI: A Prospective Study. Eur. Radiol. 2013, 23, 2019–2029. [Google Scholar] [CrossRef] [PubMed]
  44. Schwier, M.; van Griethuysen, J.; Vangel, M.G.; Pieper, S.; Peled, S.; Tempany, C.; Aerts, H.J.W.L.; Kikinis, R.; Fennessy, F.M.; Fedorov, A. Repeatability of Multiparametric Prostate MRI Radiomics Features. Sci. Rep. 2019, 9, 9441. [Google Scholar] [CrossRef] [PubMed]
Figure 1. Typical mpMRI images: (a) I T 2 W , with scale in mm denoted in yellow (b) I D W I , (c) I A D C ; where R (in yellow) denotes the side of the patient.
Symmetry 18 01094 g001
Figure 2. Interactive identification of the prostate in the I T 2 W image by a green ellipse.
Symmetry 18 01094 g002
Figure 3. The cropped (a) I T 2 W , (b) I D W I , and (c) I A D C images with the axis of symmetry plotted in blue, following interactive prostate identification.
Symmetry 18 01094 g003
Figure 4. Band-pass filtered images: (a) I T 2 W , (b) I D W I , and (c) I A D C .
Symmetry 18 01094 g004
Figure 5. Asymmetry maps: (a) A T 2 W , (b) A D W I , and (c) A A D C where blue line represents the symmetry axis of the prostate.
Symmetry 18 01094 g005
Figure 6. Fused map of asymmetries.
Symmetry 18 01094 g006
Figure 7. Binary masks: (a) B D W I and (b) B A D C .
Symmetry 18 01094 g007
Figure 8. S A M of prostate tissue with color encoding where blue corresponds to non-suspicious, green to modestly suspicious, red to suspicious and yellow to highly suspicious regions.
Symmetry 18 01094 g008
Figure 9. Flowchart of PcaAsym.
Symmetry 18 01094 g009
Figure 10. The red pixels indicate an area highly suspicious for prostate cancer.
Symmetry 18 01094 g010
Figure 11. Examples of PcaAsym performance on prostate MRI: (A) True-positive detection (subject #11), (B) False-positive detection (subject #50), (C) False-negative detection (subject #12).
Symmetry 18 01094 g011
Table 1. Color encoding of the Suspicious Areas Map.
ColorSAM(x, y)Meaning
Blue0Non-suspicious
Green50Modestly suspicious
Red170Suspicious
Yellow255 and moreHighly suspicious
Table 2. MRI imaging protocol.
T2W TSEDWIDCE
Imaging planesAxial, coronal, sagittalAxial, matching T2WAxial, matching T2W
Echo time [ms]106701.6
Field of view [cm2]20 × 2020 × 2019.2 × 20
Slice thickness/gap [mm]3/03/03/0
Acquisition matrix0/320/230/00/128/128/00/192/134/0
Number of averages2101
High b value/1700 s/mm2/
ADC/Mono-exponential fitting of b values  <  1000 s/mm2/
Table 3. Baseline patient demographics.
PatientsCohort (n = 66)PCa Positive (n = 33)PCa Negative (n = 33)
Age [years]69.469.569.3
PSA [ng/mL]9.812.96.8
Prostate volume [mL]48.83958.6
PSA-d [ng/mL2]0.20.30.1
Lesion size [mm]14.817.012.6
Table 4. Diagnostic performance of PcaAsym.
Cohort (n = 66)≥10mm (n = 47)<10 mm (n = 19)
Sensitivity (95% CI)0.88 (0.73–0.95)0.92 (0.74–0.98)0.78 (0.45–0.94)
Specificity0.46 (0.30–0.62)0.44 (0.26–0.63)0.50 (0.24–0.76)
PPV0.62 (0.47–0.74)0.63 (0.46–0.77)0.58 (0.32–0.81)
NPV0.79 (0.57–0.91)0.83 (0.55–0.95)0.71 (0.36–0.92)
Accuracy0.67 (0.55–0.77)0.68 (0.54–0.80)0.63 (0.41–0.81)
The values in parentheses indicate 95% confidence intervals (CI).
Table 5. Zone-specific analysis.
Estimate (%)95% CI Lower95% CI Upper
PZ Sensitivity0.9330.7870.982
PZ Specificity0.6000.3570.802
PZ PPV0.8240.6650.917
PZ NPV0.8180.5230.949
TZ Sensitivity0.3330.0610.792
TZ Specificity0.3330.1630.563
TZ PPV0.0770.0140.333
TZ NPV0.7500.4090.929
Disclaimer/Publisher’s Note: The statements, opinions and data contained in all publications are solely those of the individual author(s) and contributor(s) and not of MDPI and/or the editor(s). MDPI and/or the editor(s) disclaim responsibility for any injury to people or property resulting from any ideas, methods, instructions or products referred to in the content.