Article

Symmetry-Aware Fatigue Driving Detection Based on Improved YOLOv8-LSTM with Enhanced Spatiotemporal Feature Fusion
International School, Beijing University of Posts and Telecommunications, Beijing 100876, China
Symmetry 2026, 18(6), 909; https://doi.org/10.3390/sym18060909
Submission received: 27 February 2026 / Revised: 12 May 2026 / Accepted: 19 May 2026 / Published: 26 May 2026

Abstract

Fatigue driving causes 20–30% of global traffic accidents. To address limitations in feature fusion and real-time performance, this study proposes an improved You Only Look Once version 8 (YOLOv8)-Long Short-Term Memory (LSTM) model with symmetry-aware spatiotemporal feature learning. In the spatial phase, Group Shuffle Convolution (GSConv) and Slim Neck structures are introduced to enhance facial feature detection while reducing parameters by 32.3%. In the temporal phase, an improved Inverted Transformer(iTransformer) with differential attention is integrated with an LSTM-Feed-Forward Network (FFN) architecture, achieving a 90.1% prediction accuracy and an 84.6% noise suppression rate. A standardized dataset of 13,200 images was constructed using a four-level classification system. By implementing TensorRT acceleration and multi-process parallel frameworks, the system optimizes single-frame latency to 38 ms—a 9.5× efficiency gain—while maintaining an overall detection accuracy of 92.4%. These results demonstrate that the proposed framework effectively balances model lightweighting with high precision, providing a robust and efficient solution for real-time driver monitoring in complex driving scenarios.

1. Introduction

Fatigue driving poses a significant and persistent threat to road traffic safety, leading to impaired attention, delayed reactions, and a substantial proportion of global traffic accidents annually [1]. Therefore, the development of accurate and reliable fatigue detection systems is of paramount importance for accident prevention.
Current objective fatigue detection methods primarily rely on three categories of data: vehicle behavior parameters (e.g., steering wheel angle), physiological signals (e.g., Electroencephalogram (EEG), Electrooculogram (EOG)), and visual facial features [2,3,4,5,6,7,8,9,10]. Among these, vision-based methods offer a non-intrusive and cost-effective advantage, making them highly suitable for in-vehicle applications. Models based on architectures like YOLO have demonstrated promising performance in detecting facial cues such as eye closure [11,12]. A growing consensus suggests that integrating multi-source visual data with advanced algorithmic optimization holds the key to developing more robust systems [13].
However, despite these advances, state-of-the-art vision-based fatigue detection systems still face four major challenges that hinder their practical deployment. First, feature extraction and fusion mechanisms are often insufficient for effectively integrating complex multi-source visual cues. Second, the high computational cost of deep models limits inference speed, failing to meet the strict real-time requirements of in-vehicle systems. Third, most temporal modeling approaches struggle to capture the long-term dependencies inherent in the gradual process of fatigue accumulation. Fourth, practical application is hampered by the lack of a simple and efficient fatigue assessment scale suitable for rapid decision-making.
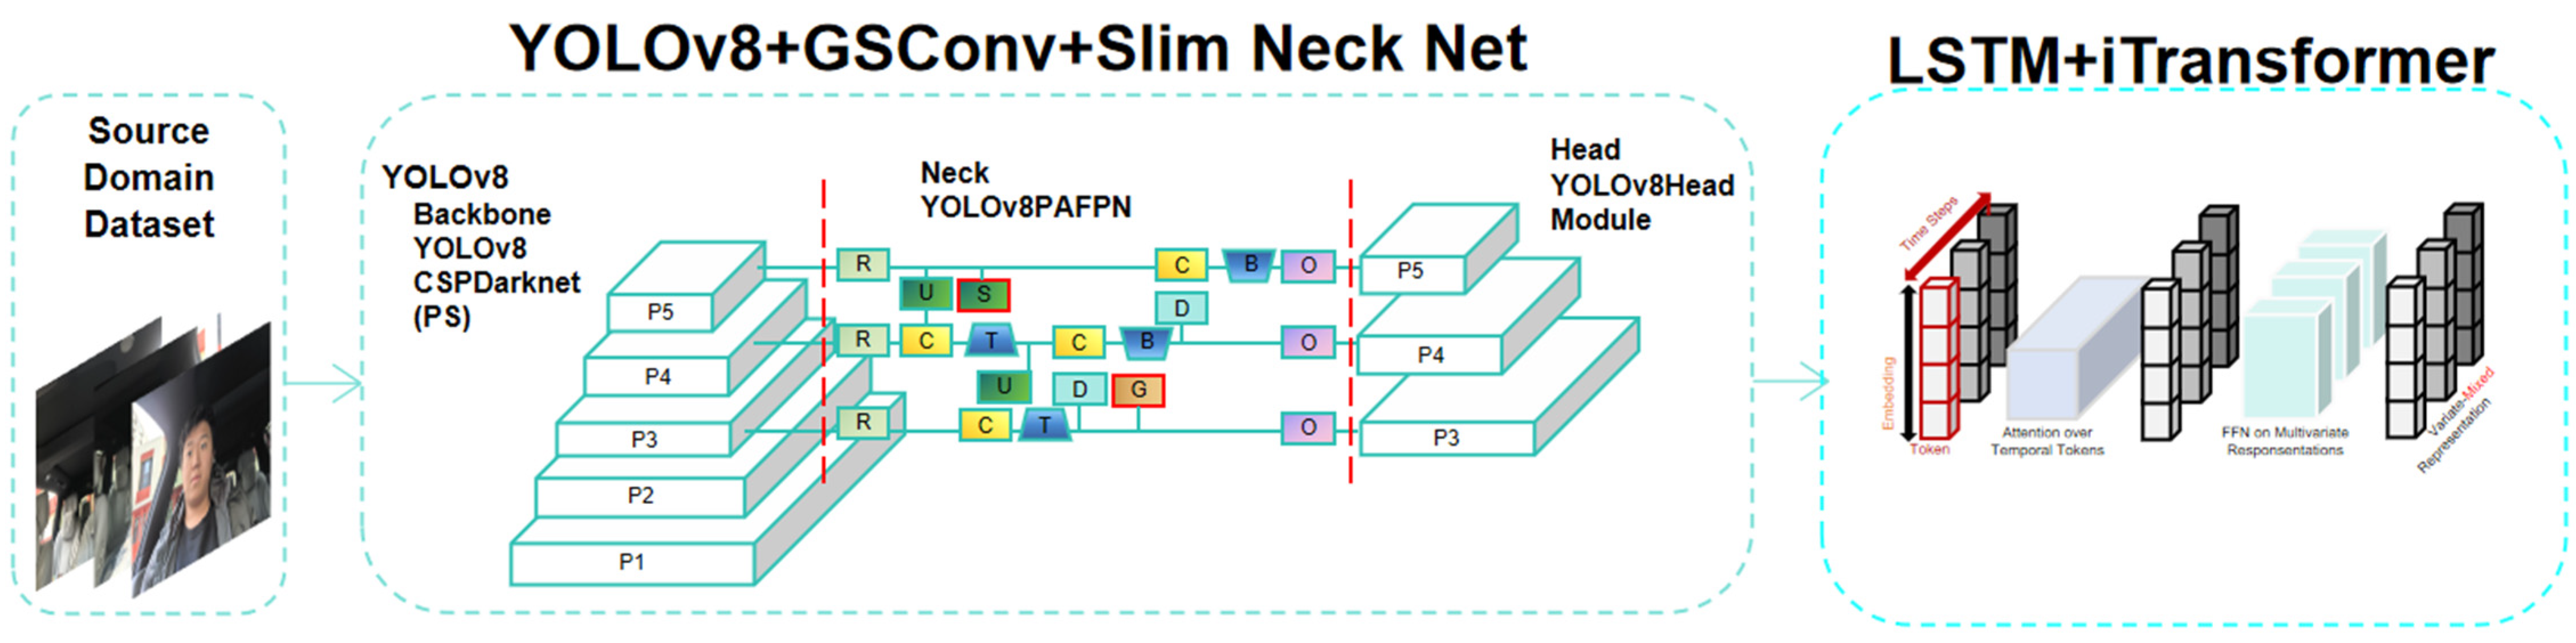
To address these challenges, this paper proposes a novel, symmetry-aware fatigue detection framework. As shown in Figure 1, the core original contributions of this work, which distinctly address the identified gaps in the literature, are not the individual components themselves (YOLOv8, LSTM, iTransformer), but rather their architectural innovation and synergistic integration. Specifically, this study presents: (1) The lightweight redesign of the spatial feature extractor via the integration of GSConv and a Slim Neck structure into YOLOv8; (2) The enhanced hybrid temporal modeling achieved by incorporating a differential attention mechanism into the iTransformer and an LSTM-FFN module; and (3) The implementation of a multi-process parallel inference pipeline for real-time system-level optimization. This integrated approach effectively bridges the gap between accurate spatiotemporal modeling and efficient embedded deployment.
The remainder of this paper is structured as follows. Section 2 details the proposed methodology. Section 3 presents the experimental setup and results. Section 4 discusses the findings, limitations, and future work.

2. Guidelines for Manuscript Preparation

This study proposes a spatiotemporal fatigue detection framework fusing YOLOv8 and LSTM. The visual backbone utilizes GSConv and Slim Neck for multi-scale detection at 15+ fps on Raspberry Pi, while the temporal module employs differential multi-head attention and LSTM-FFN to model dynamic behaviors. Through multi-process parallel fusion and weighted voting, the system yields four-level fatigue classification, achieving 92.4% accuracy on public datasets.

2.1. Core Concept: Symmetry-Aware Modeling

Symmetry-Aware in this study encompasses two interconnected dimensions comprising spatial symmetry and temporal symmetry. Spatial Symmetry refers to the geometric balance of facial features such as the symmetry between left and right eyes and the mouth within the spatial domain. Fatigue states often disrupt this balance, manifesting as asymmetric eye closure where one eye is more closed than the other, yawning, or abnormal head tilting. The improved YOLOv8 model enhanced with GSConv and Slim Neck is specifically designed to be highly sensitive to these subtle asymmetric changes in facial geometry.
Temporal Symmetry refers to the predictable and often cyclical evolution of fatigue states over time, where the transition from alertness to fatigue and potential recovery follows specific patterns. The proposed LSTM-iTransformer hybrid architecture is tailored to capture these long-term temporal dependencies and dynamic patterns. This approach effectively models the symmetry or regularity in the temporal progression of fatigue, overcoming the limitations of static frame analysis.
The proposed symmetry-aware modeling in this paper does not rely on explicit loss function constraints. Spatial symmetry is implicitly realized through the architectural design of GSConv and Slim Neck: both modules employ weight sharing and symmetric receptive fields when processing bilaterally corresponding facial regions (e.g., left/right eyes and mouth corners), enabling the model to naturally preserve high sensitivity to spatial mirror patterns at the feature extraction stage. Temporal symmetry is implicitly captured by the LSTM-iTransformer hybrid architecture, which learns the cyclical evolution of fatigue states—from alertness to fatigue and subsequent recovery—through gated memory units and inverted attention mechanisms. This essentially models the approximate temporal symmetry (i.e., repeatable state transition patterns) inherent in fatigue cycles. Consequently, symmetry awareness is integrated into the algorithm at the architectural level rather than through additional mathematical constraints, improving the utilization of fatigue-related symmetric/cyclical features.

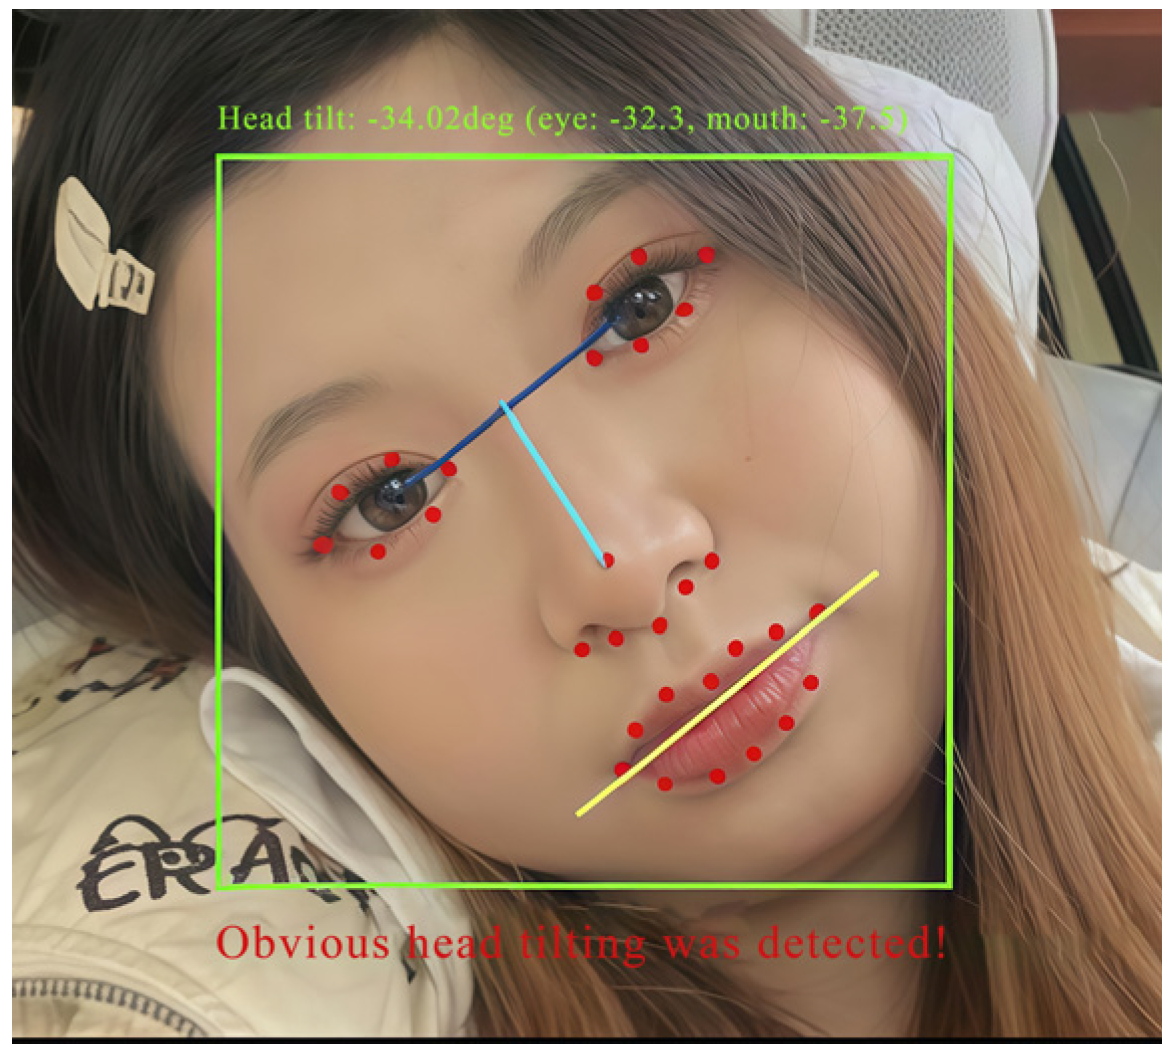
2.2. Introduction and Optimization Design of YOLOv8

2.2.1. Optimized YOLOv8 Architecture for Lightweight Feature Extraction

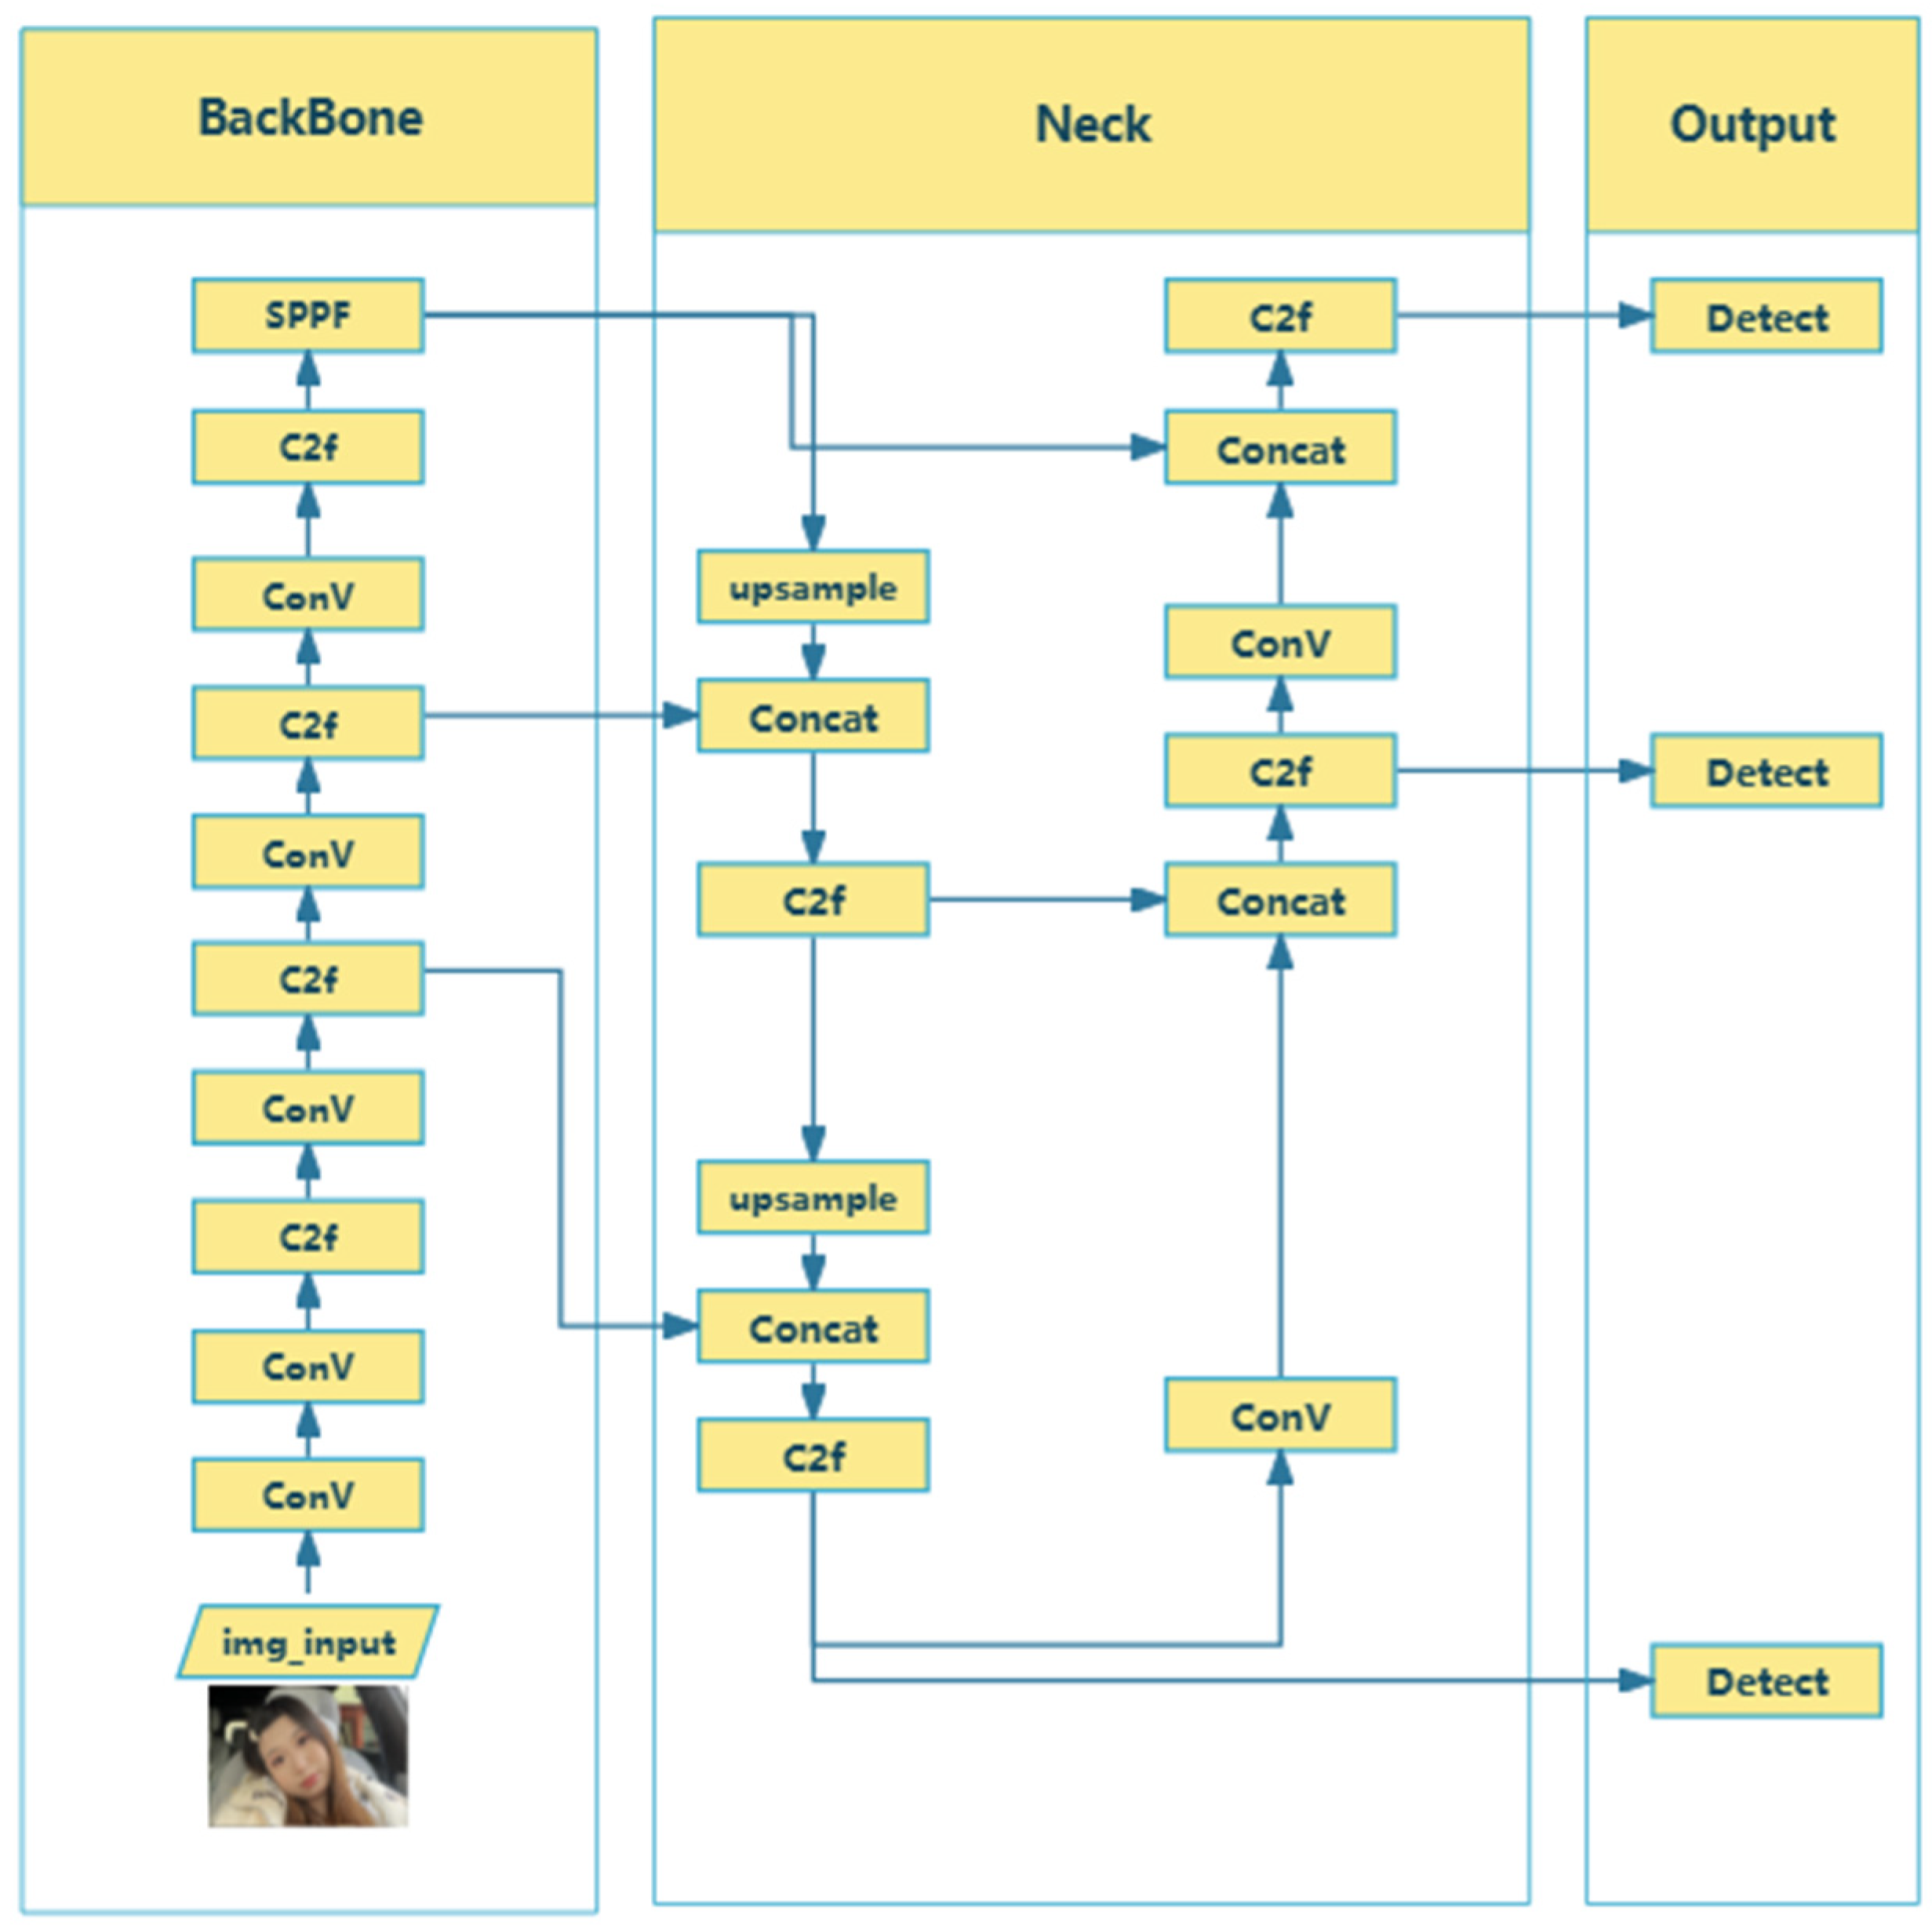
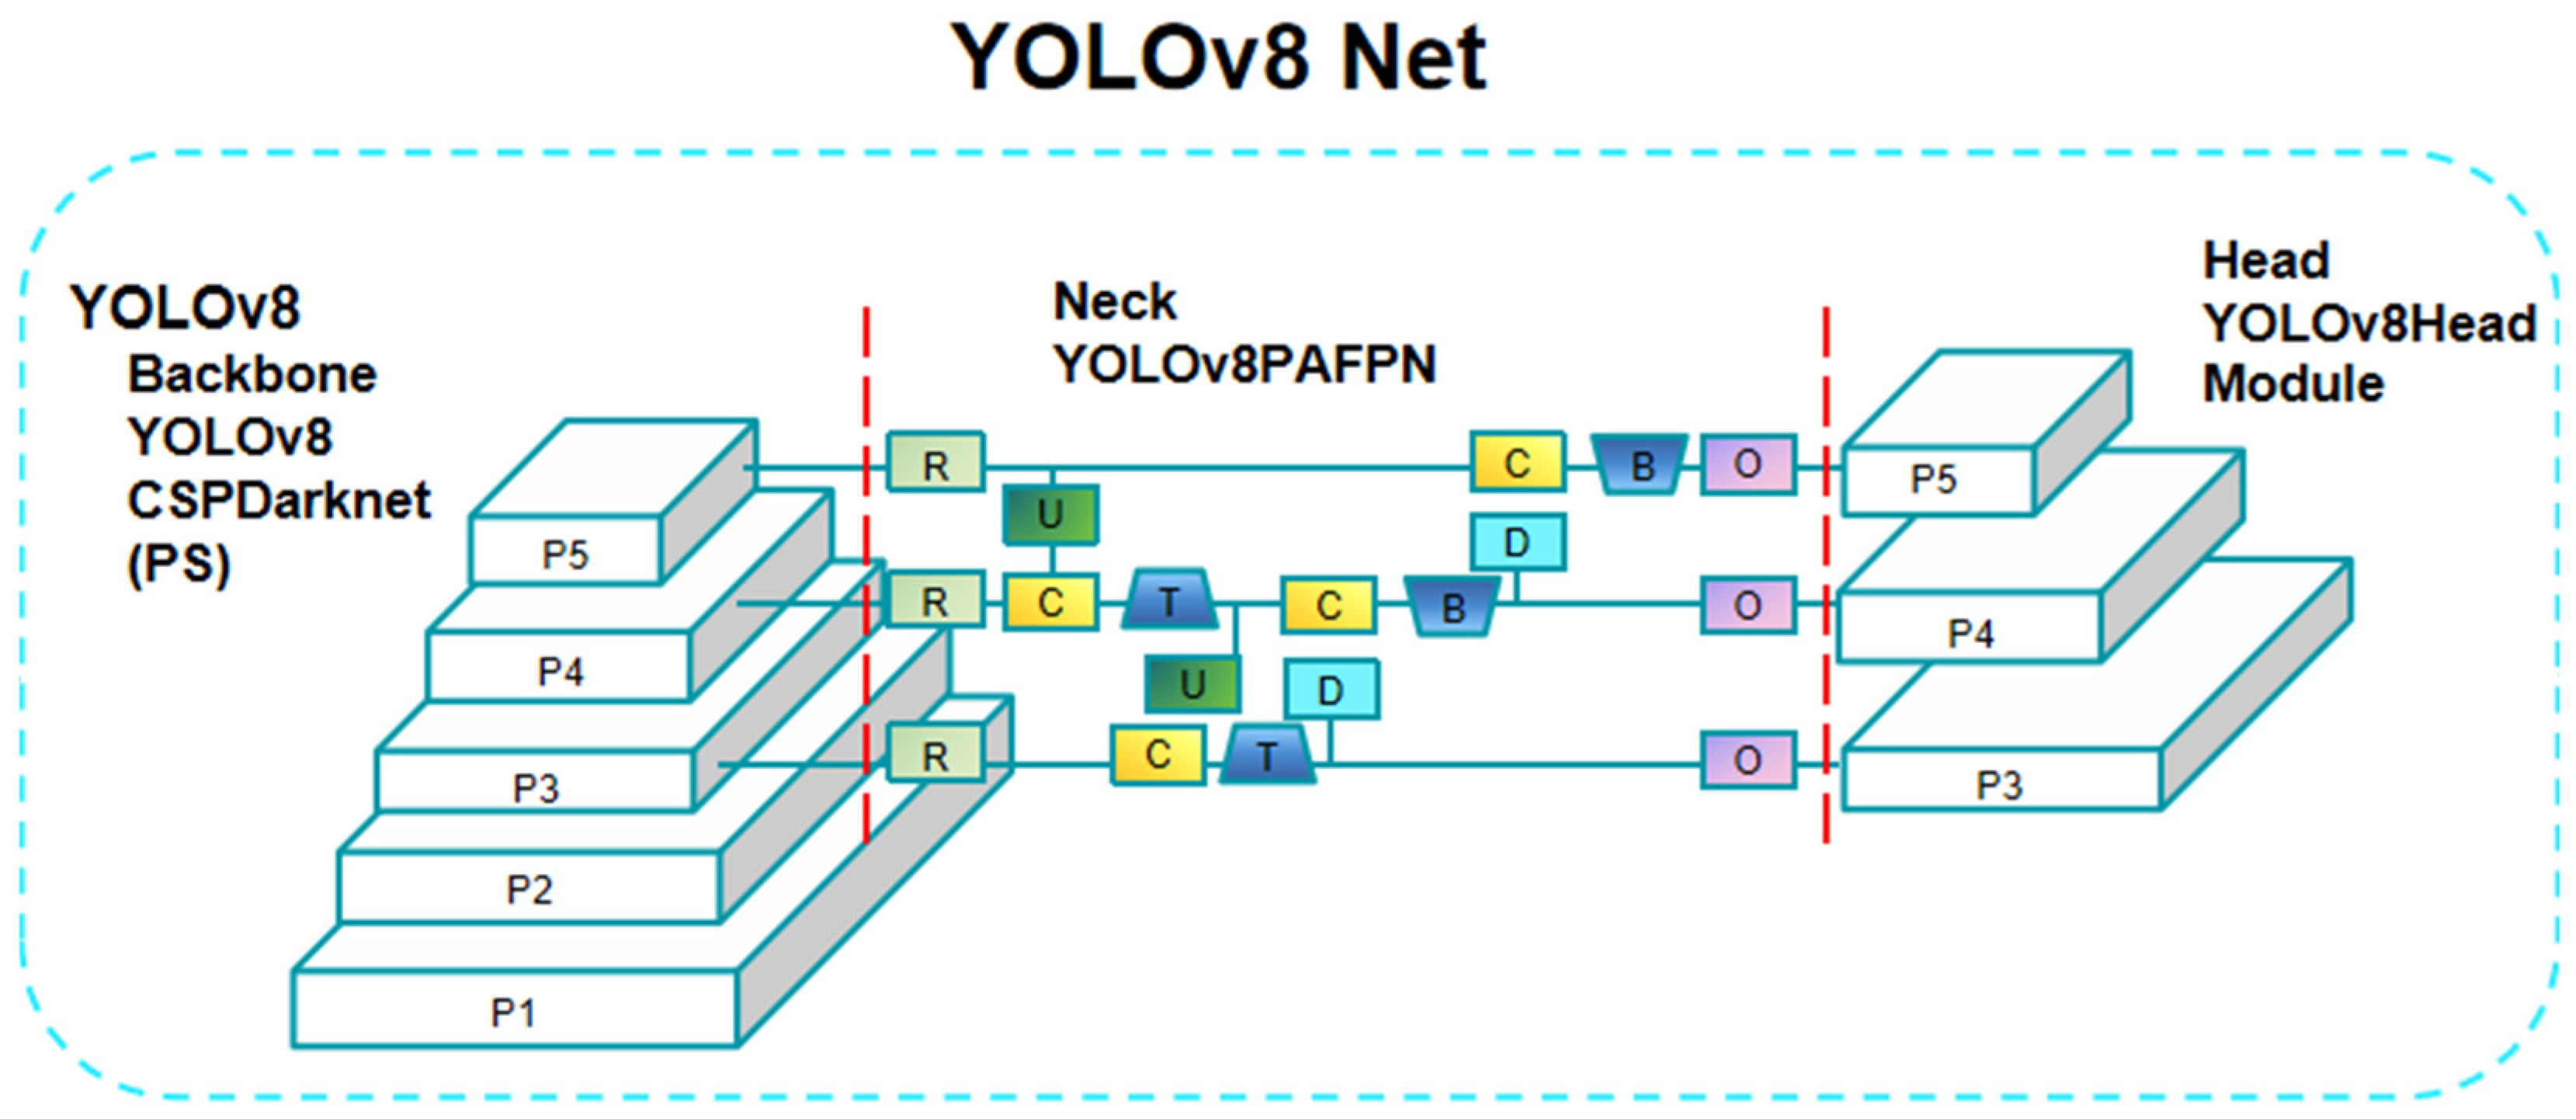
As shown in Figure 2, we employ YOLOv8 as the foundational object detection framework due to its established balance between speed and accuracy, which is a prerequisite for real-time fatigue detection [14,15]. However, as shown in Figure 3, its vanilla architecture poses deployment challenges on resource-constrained in-vehicle platforms due to high computational complexity and parameter counts, which hinder real-time performance. To enable lightweight detection of facial cues, we integrate two key components: the GSConv module and a Slim Neck feature pyramid. These enhancements optimize the model for identifying subtle eye closure and yawning. Standard YOLOv8 utilizes a Backbone, Neck, and Head for detection. Detailed formulations of modules like C2f are documented in foundational literature [16,17,18,19].
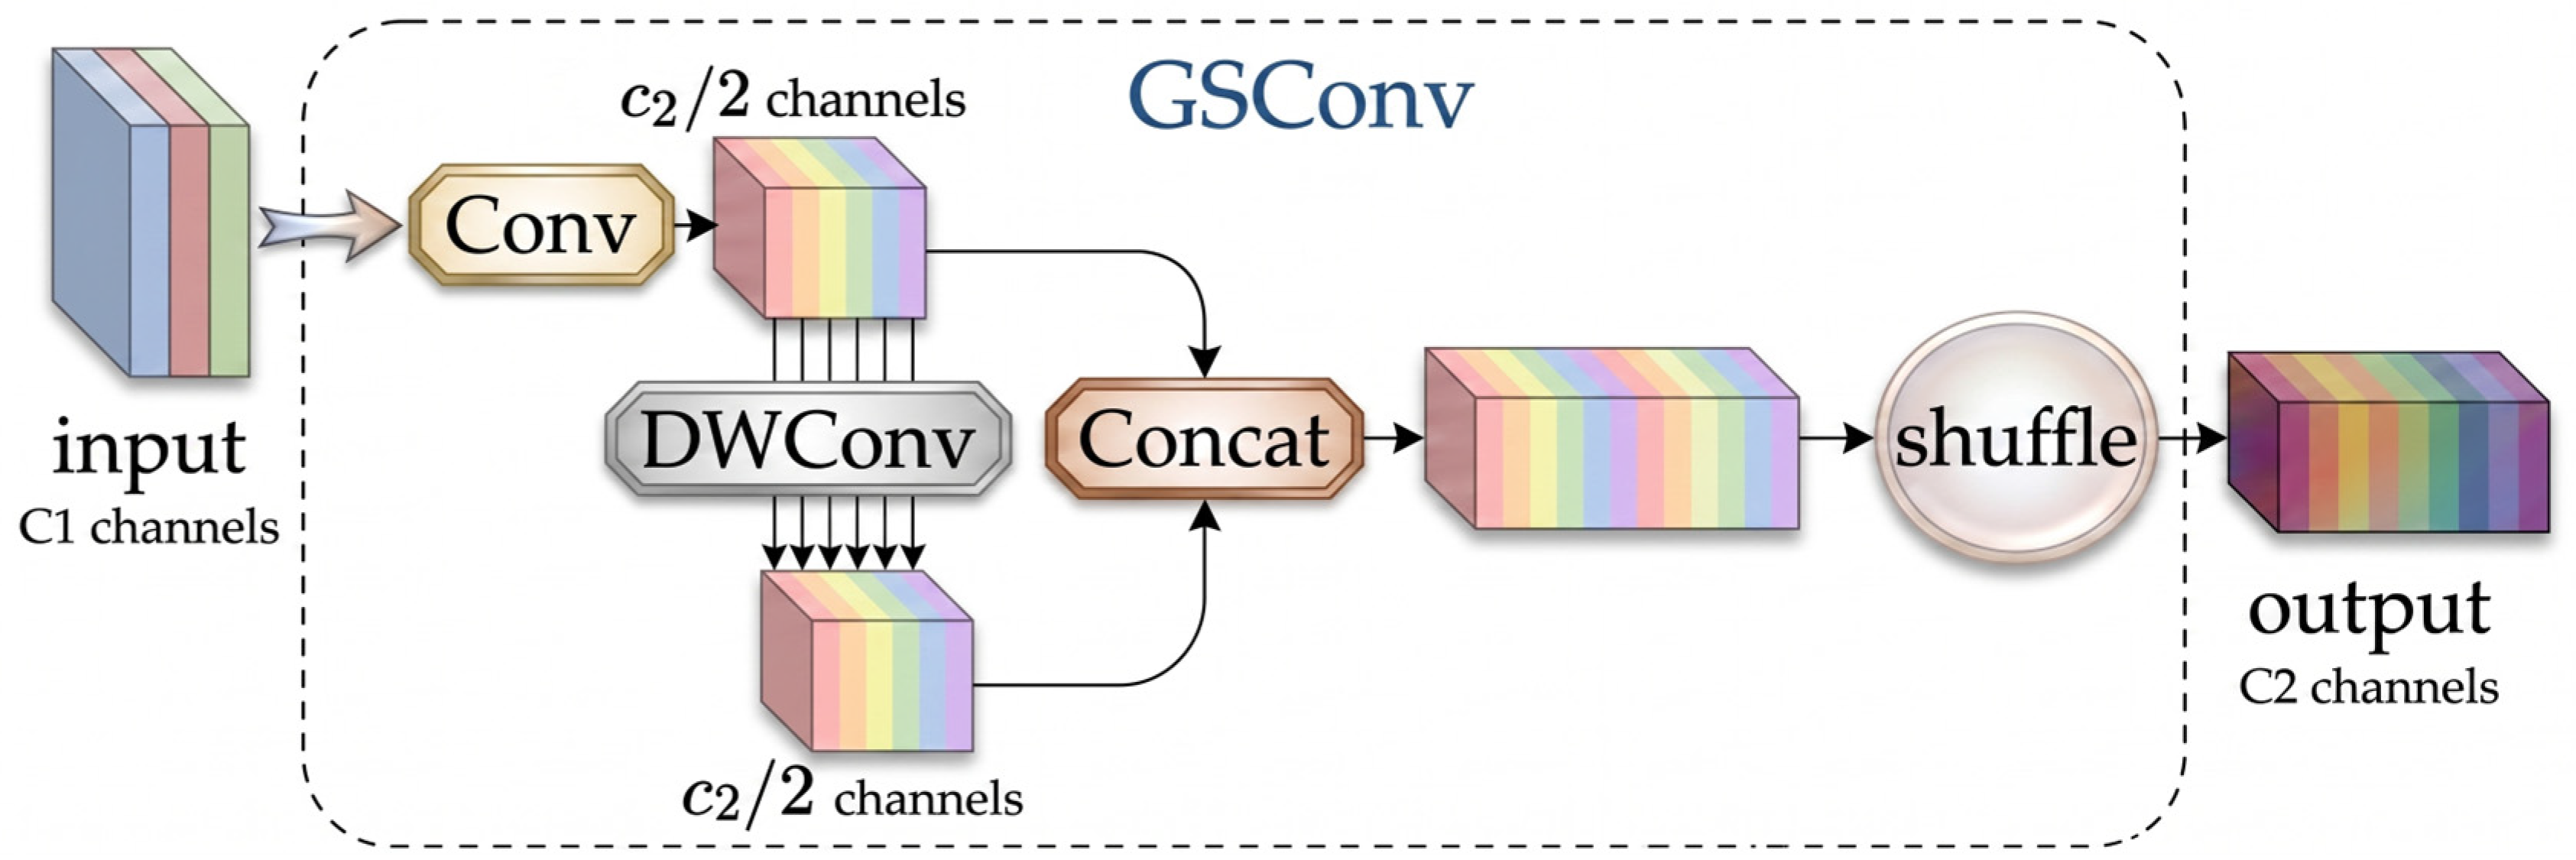
To reduce computational demands, we integrate GSConv into the backbone and neck, using grouped convolutions and channel shuffling to slash load [20]. Simultaneously, a Slim Neck streamlines the feature pyramid to minimize parameter redundancy and accelerate inference [21]. The integration of GSConv and Slim Neck creates an optimized YOLOv8 variant that balances accuracy with efficiency [22,23]. This lightweight architecture is highly suited for resource-constrained edge devices, providing a robust foundation for in-vehicle fatigue detection.

2.2.2. YOLOv8 Object Detection Model Optimization

To enhance YOLOv8 in fatigue driving detection, this study integrates GSConv and Slim Neck modules into the backbone network. These architectural modifications reduce computational complexity while strengthening feature extraction for multi-scale facial feature analysis.
Integration of GSConv Module
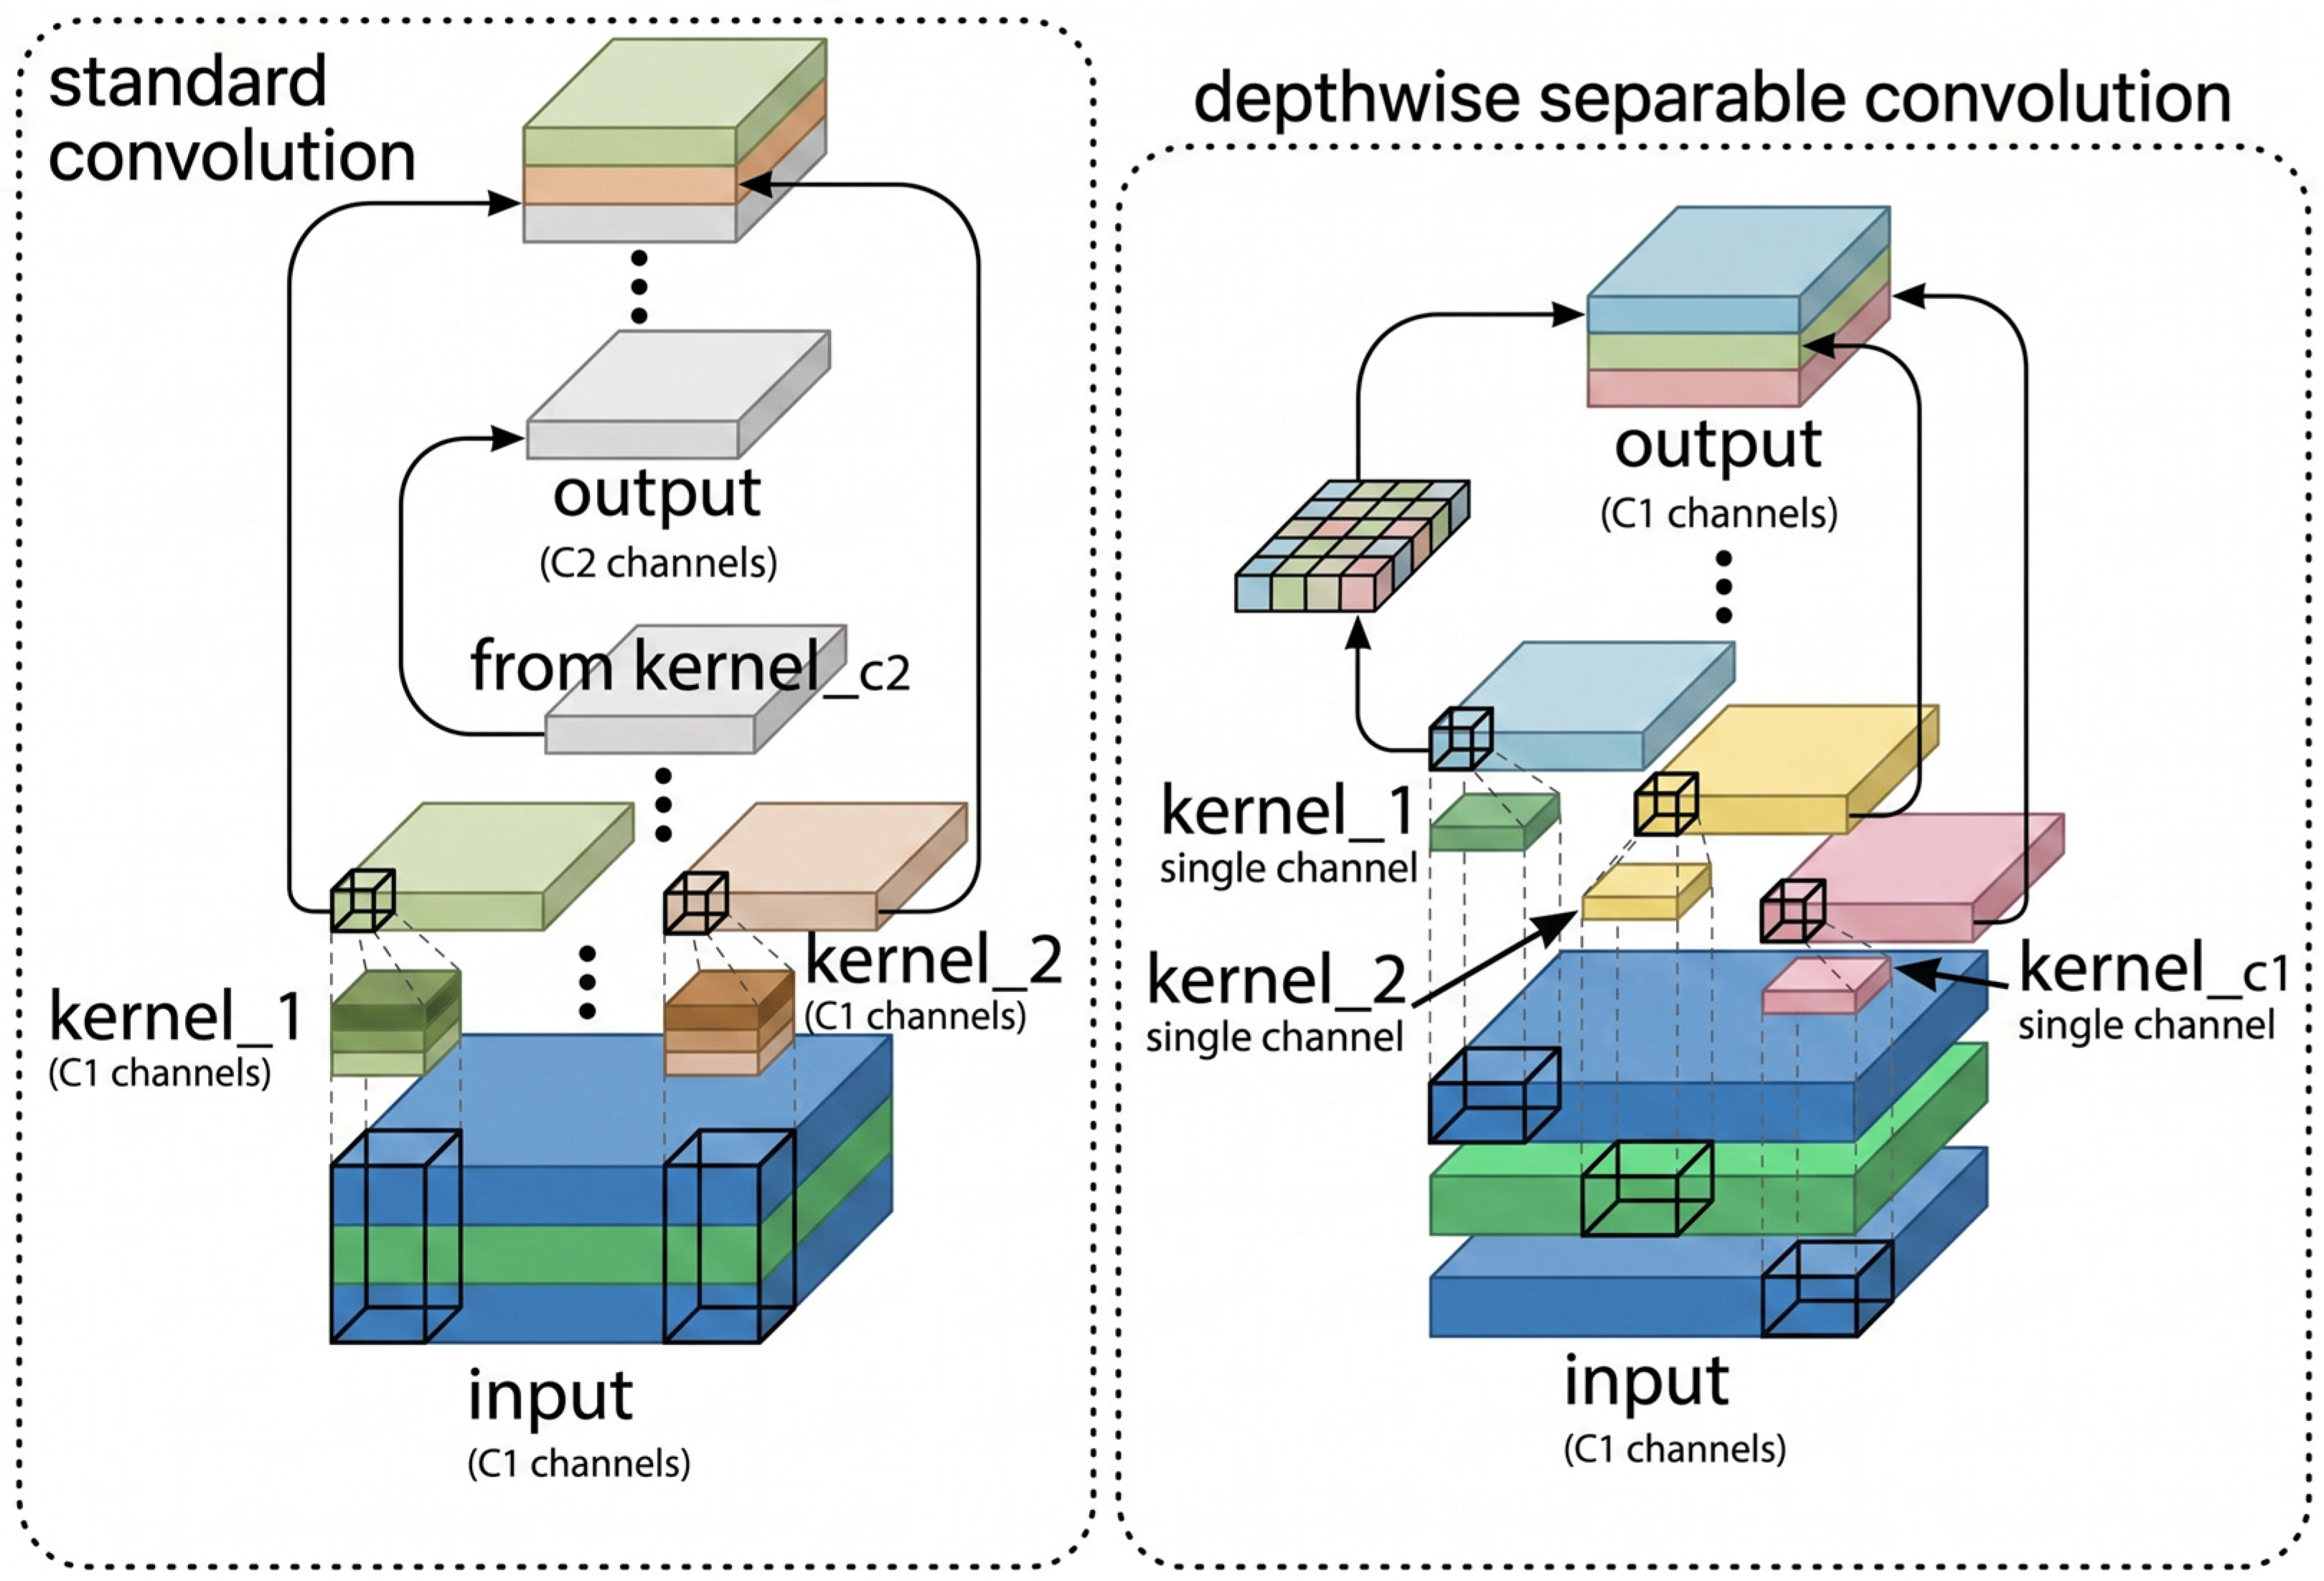
To minimize computational costs, we integrate GSConv into the early backbone [24,25,26]. As shown in Figure 4, GSConv utilizes grouped convolutions followed by a channel shuffle (Mix) to decouple spatial and channel-wise processing. This design drastically reduces parameters and Floating Point Operations (FLOPs) compared to standard convolutions while preserving the feature representation necessary for detecting subtle cues like eye and mouth aspect ratios.
Adoption of Slim Neck Architecture
To further enhance feature fusion efficiency within the feature pyramid network (FPN) and reduce parameter redundancy, we adopt the Slim Neck architecture [27]. Specifically, we replace standard modules in the FPN with VoVNet-GSConv Cross Stage Partial (VoVGSCSP) modules, which combine the cross-stage partial connections from VoVNet [28] and the hierarchical structure of CSPNet [29]. This design, as depicted in Figure 5, promotes more efficient gradient flow and feature reuse across different network stages. The simplified feature propagation can be represented as:
P i = VoVGSCSP ( C i , P i + 1 )
where P i and C i denote feature maps and convolutional operations at different scales. The integration of Slim Neck streamlines the neck structure, leading to faster inference and lower memory footprint without compromising the multi-scale feature fusion capability crucial for detecting fatigue-related features at various resolutions. In summary, integrating GSConv and Slim Neck optimizes spatial feature extraction for resource-constrained in-vehicle platforms. Experimental results (Section 3.4) confirm that this architecture significantly reduces parameters and computational costs while maintaining or improving detection accuracy for fatigue indicators. This balance ensures a practical and efficient visual front-end for real-time detection.

2.3. Improvement of LSTM and Timing Modeling

2.3.1. From RNNs to Enhanced Temporal Modeling

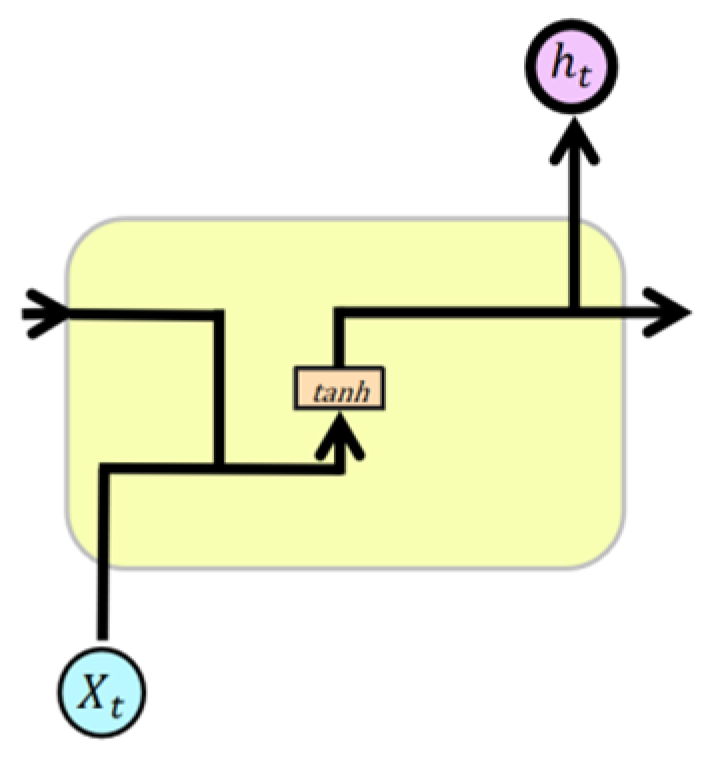
Recurrent Neural Networks (RNNs) are a foundational class of models designed for sequential data processing, utilizing recurrent connections to propagate a hidden state across time steps [30,31]. As shown in Figure 6, this architecture theoretically enables the modeling of temporal dependencies, a crucial requirement for analyzing the progressive nature of driver fatigue.
However, standard RNNs suffer from the well-documented vanishing/exploding gradient problems during backpropagation through time (BPTT) [32]. These issues severely limit long-range dependency learning, causing focus on short-term patterns. In fatigue detection, where state evolution over extended periods is key, this represents a fundamental limitation.
To mitigate these issues, LSTM networks [33] utilize gating mechanisms to regulate information flow, enabling superior modeling of long-term fatigue dynamics [34,35]. However, modeling high-dimensional patterns in multi-source data remains challenging. We propose a hybrid architecture integrating LSTM with an improved iTransformer to capture both local temporal dynamics and global cross-variable dependencies.

2.3.2. Long Short-Term Memory Networks

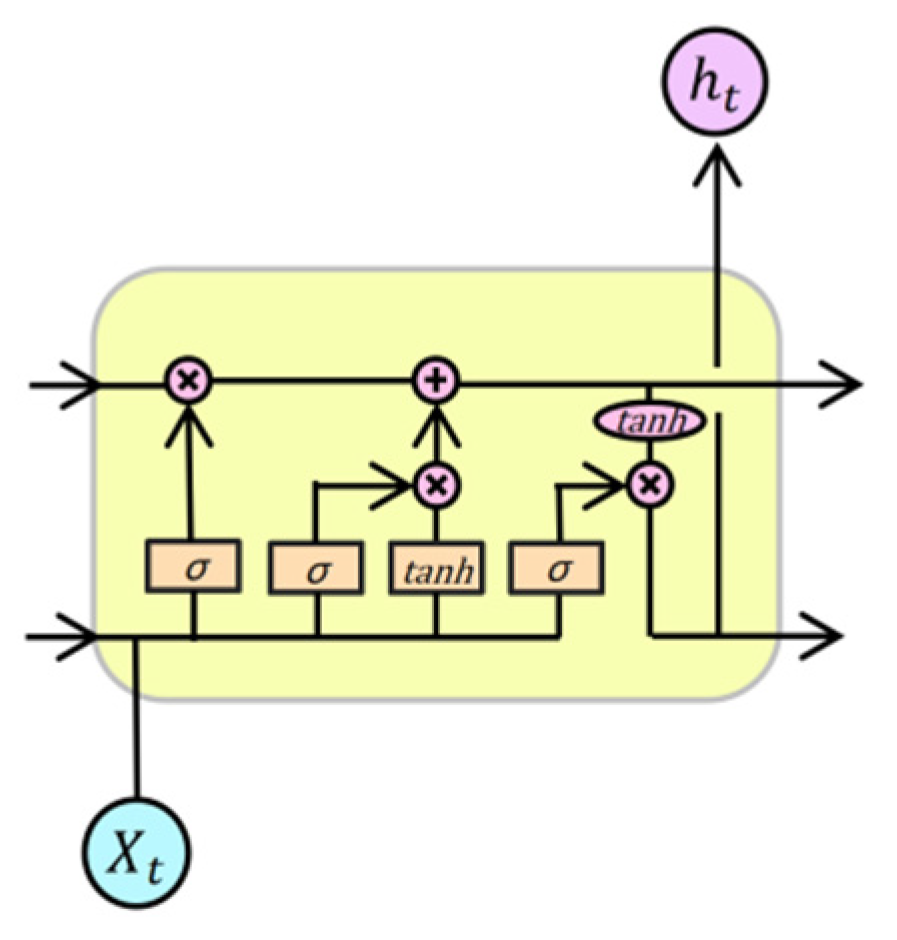
To address the gradient instability limitations of basic RNNs, LSTM (Long Short-Term Memory) networks were introduced. LSTM utilizes a cell state regulated by forget, input, and output gates. These gates employ sigmoid functions to manage information flow across time steps. This architecture allows gradients to flow with minimal attenuation, mitigating vanishing or exploding gradient issues and enabling the modeling of long-range temporal dependencies.
Capturing extended contextual information is crucial for analyzing the progressive and cyclical nature of driver fatigue. Therefore, LSTM serves as the foundational temporal modeling component in our framework. Its standard formulation and gradient propagation properties are established in references. The detailed schematic of the LSTM unit structure is provided in Figure 7.

2.3.3. Enhanced LSTM-iTransformer Hybrid Framework

LSTM effectively models long-term dependencies but struggles with global inter-variable correlations in high-dimensional data, whereas iTransformer excels at cross-variable modeling but lacks local temporal sensitivity [36,37]. To leverage their complementary strengths, we propose an LSTM-iTransformer hybrid featuring: (1) Differential Multi-head Attention for noise robustness and (2) an LSTM-FFN module for collaborative modeling of global interactions and local temporal patterns.
The proposed Differential Multi-head Attention mechanism addresses the sensitivity of standard attention to irrelevant noise. As conceptually depicted in related architectures [38], it computes a refined attention map A d i f f by taking the difference between a primary attention distribution A m and a scaled auxiliary distribution A n that captures noise patterns:
A d i f f = A m λ A n ,
where λ is an adaptive suppression coefficient. By performing a difference operation on two independent Softmax distributions (Equation (3)), this design filters high-frequency noise to generate sparser, more interpretable attention maps. Experiments confirm a 13.3% improvement in noise suppression compared to conventional multi-head attention.
Attention ( Q , K , V ) = Softmax Q K d k V ,
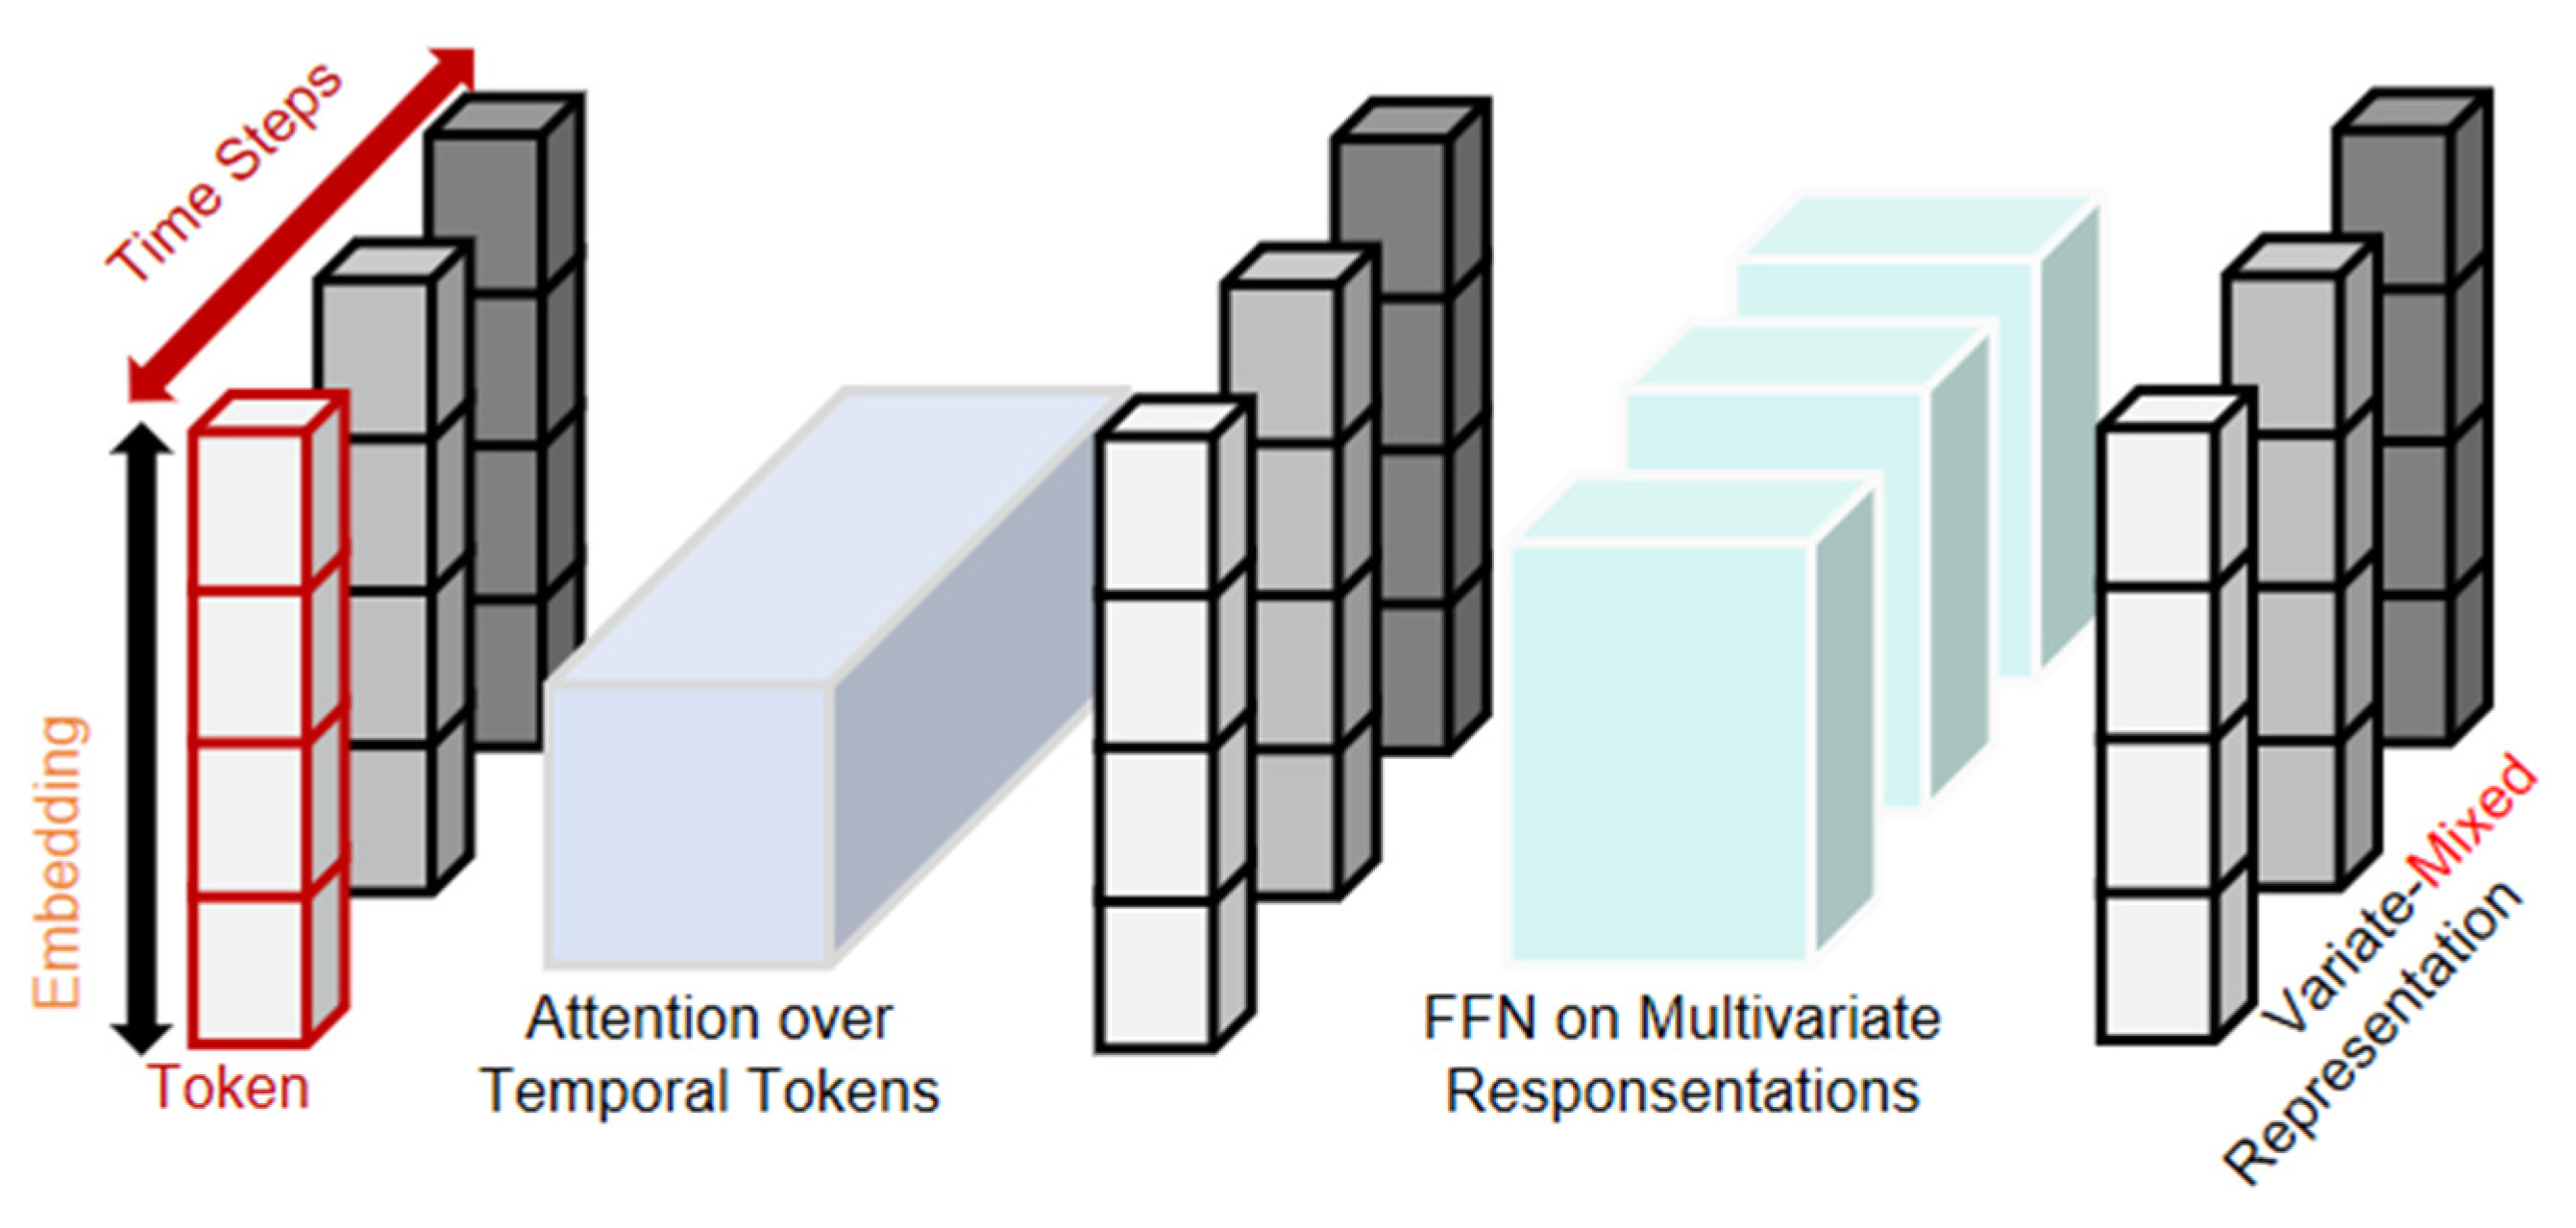
To enhance the modeling of local temporal dynamics, as shown in Figure 8, we embed an LSTM network within the standard Feed-Forward Network (FFN) block of the iTransformer, creating an LSTM-FFN hybrid module.
Features are processed in parallel, with an LSTM capturing local sequential patterns and a Multi-Layer Perceptron (MLP) modeling global nonlinear interactions. Their outputs are dynamically fused via a gating mechanism with a learnable weight g (Equation (4)), balancing local temporal features and global representations. The architecture is illustrated in Figure 8.
g = σ W g [ h n seq ; h n lstm ] ,

2.4. Parallel Computing Optimization

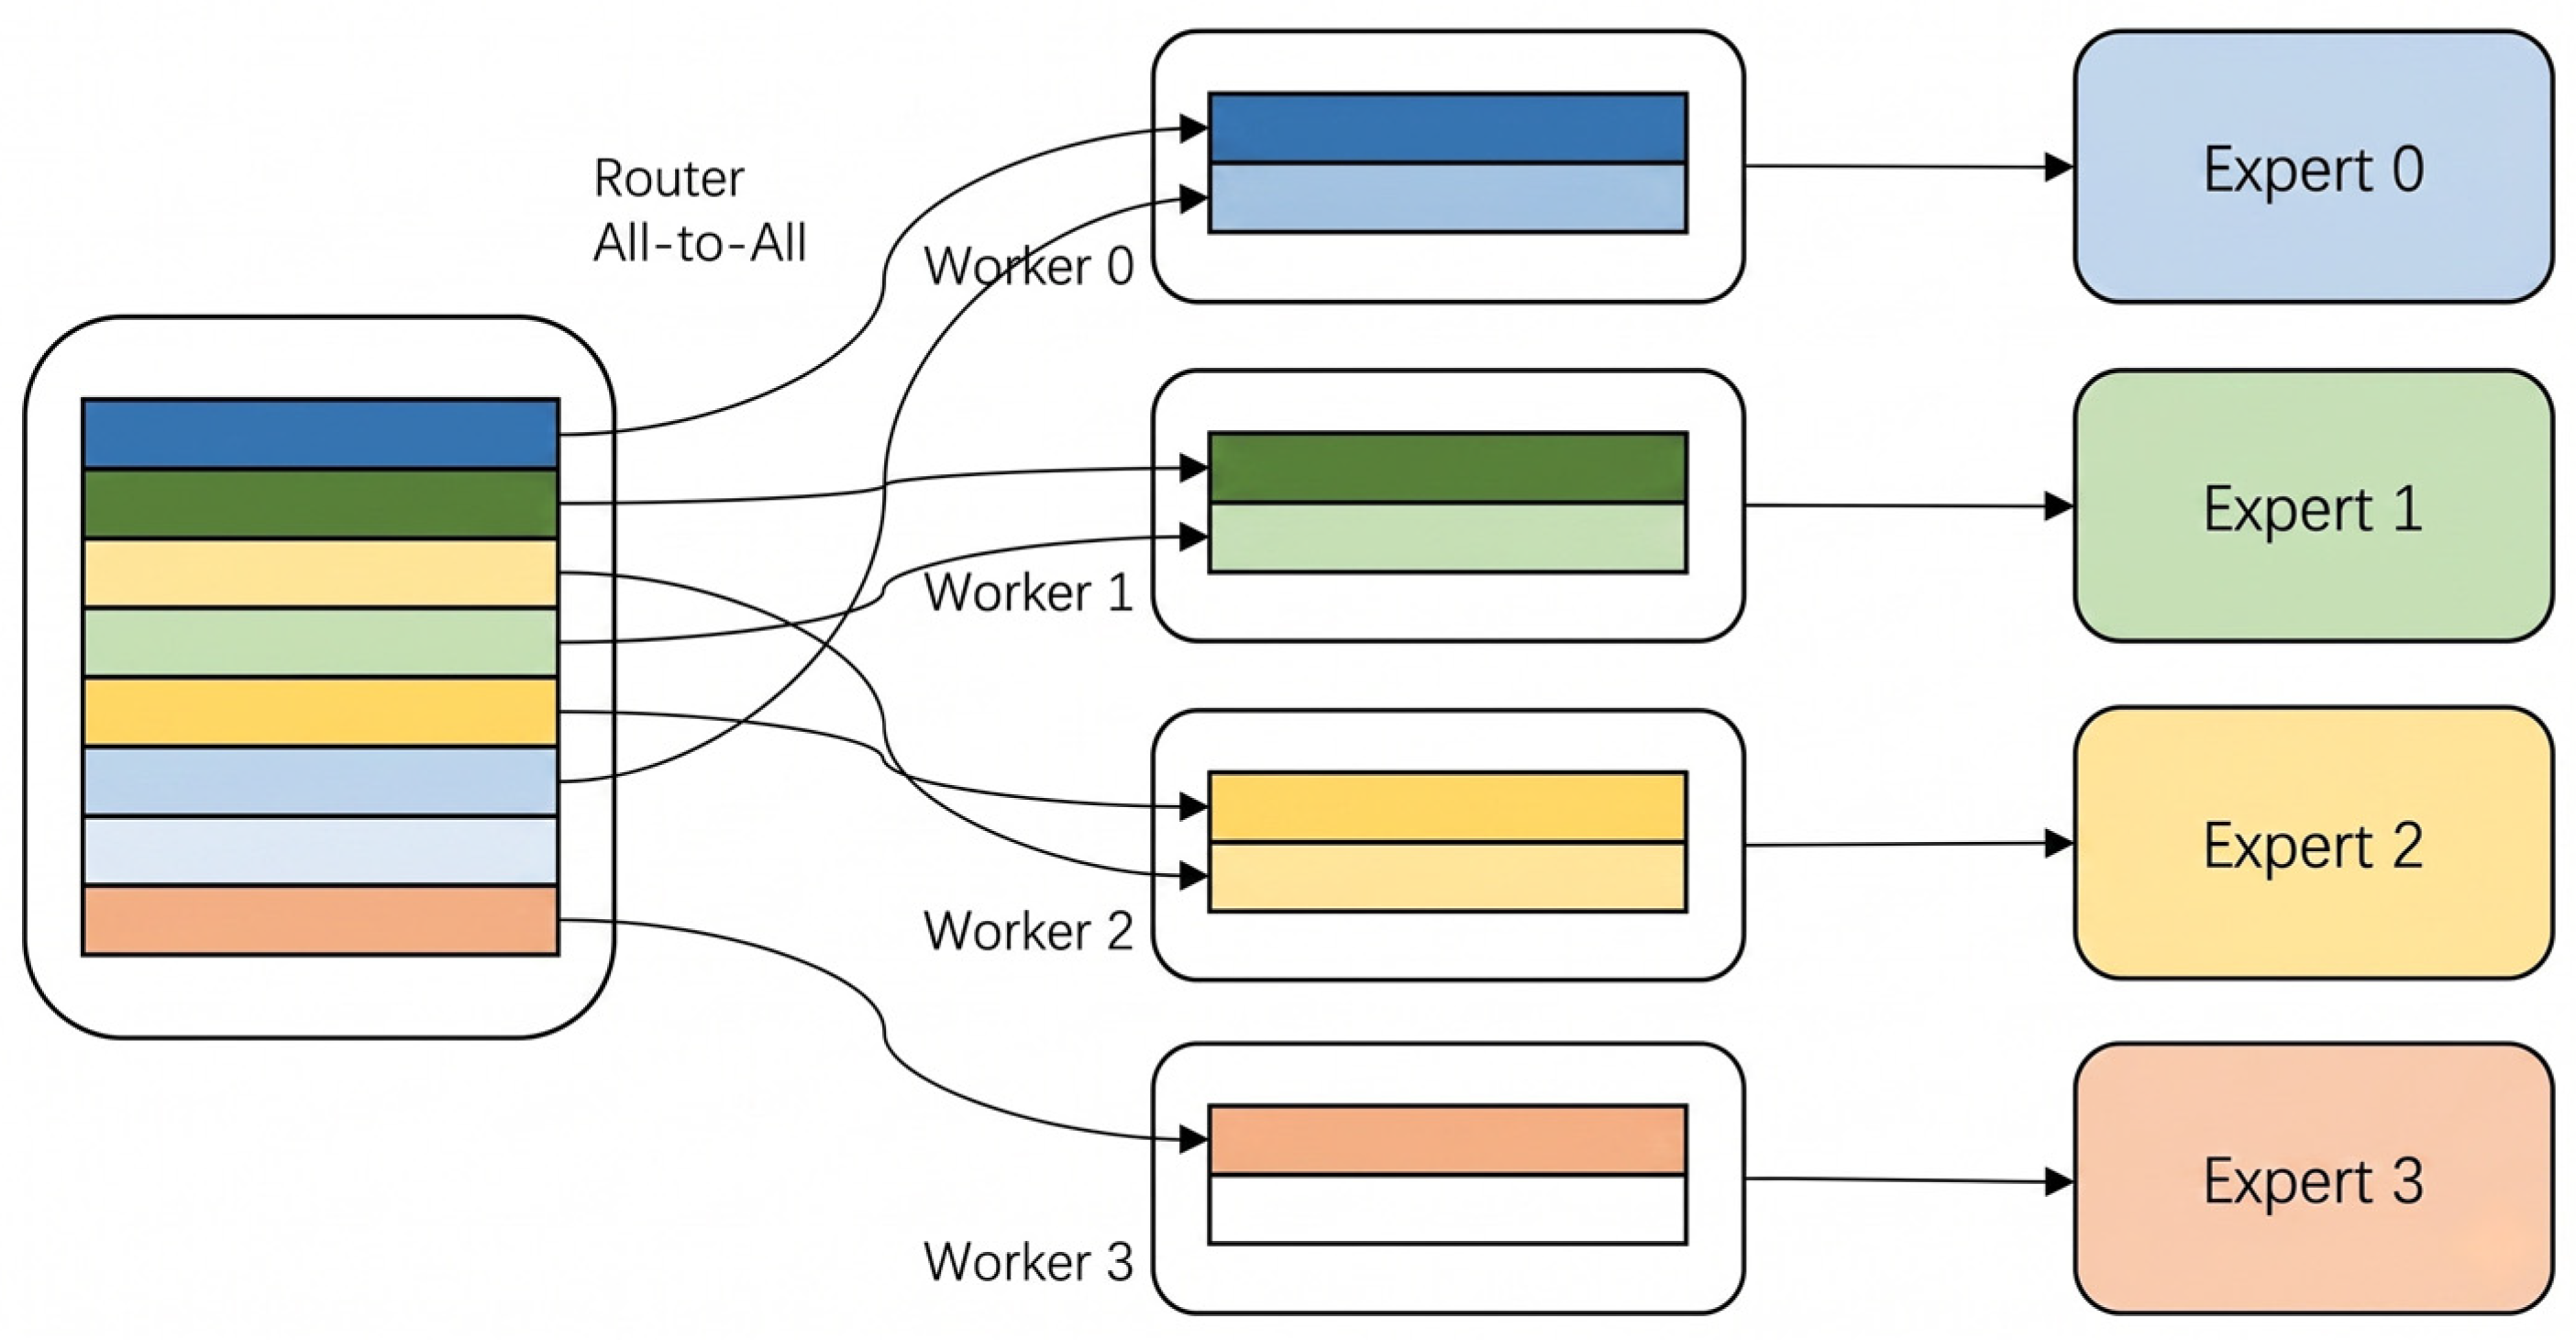
This study implements a ProcessPoolExecutor-based multi-process parallel inference framework to achieve real-time detection capabilities [40]. The system deploys enhanced YOLOv8 and LSTM as independent processes using shared memory mechanisms for synchronization, significantly improving performance. As shown in Figure 9, an intelligent Router dynamically distributes video streams to worker processes via predefined load-balancing strategies.

2.4.1. System Operation Mechanism and Task Division

As shown in Figure 9, the workflow captures facial features via video stream, using parallel workers (0–3) for specialized tasks: eye/mouth analysis, head pose detection, and LSTM temporal modeling. This multi-core approach overcomes single-process bottlenecks. Results are fused and validated by Expert modules, while shared memory pools eliminate communication delays and minimize system latency.

2.4.2. Dynamic Weighted Fusion Mechanism

A dynamic weighted fusion mechanism adaptively balances YOLOv8 spatial weights and LSTM temporal weights based on model confidence. The three-stage process involves: (1) multi-dimensional assessment of accuracy and stability; (2) dynamic weight calculation via softmax normalization; and (3) sliding window smoothing to ensure detection stability and minimize fluctuations.
The mathematical expression for dynamic weighted fusion is:
S c o r e f a t i g u e = α ( t ) × S c o r e Y O L O + β ( t ) × S c o r e L S T M + γ ( t ) × S c o r e f e a t u r e s ,
where the dynamic weight coefficients employ softmax normalization mechanisms for real-time adjustment based on feature confidence:
α ( t ) = exp ( c o n f i d e n c e Y O L O ) i exp ( c o n f i d e n c e i ) ,
β ( t ) = exp ( c o n f i d e n c e L S T M ) i exp ( c o n f i d e n c e i ) ,
γ ( t ) = exp ( c o n f i d e n c e f e a t u r e s ) i exp ( c o n f i d e n c e i ) ,

2.4.3. Hierarchical Recognition and Optimization Strategies

This system utilizes progressive feature fusion and a differentiated loss weighting mechanism to capture physiological changes across fatigue levels while enforcing temporal consistency constraints to stabilize classification. The hierarchical optimization integrates intelligent image cropping for facial localization, a multi-process parallel architecture for task decomposition, and a PT-Open Neural Network Exchange (ONNX)-Engine pipeline enhanced by TensorRT acceleration. Furthermore, dynamic scheduling and memory management ensure optimal hardware utilization by balancing Graphics Processing Unit (GPU), Central Processing Unit (CPU), and memory resources according to real-time load states.

2.4.4. Training Convergence and Complexity Analysis

The system exhibits high training stability, with total loss converging from 1.98 to 0.29. To synchronize module optimization and prevent gradient conflicts, a hierarchical loss function with independent branches was implemented. Additionally, an adaptive learning rate mechanism dynamically adjusts strategies based on individual loss convergence rates [42], ensuring rapid convergence while mitigating overfitting.
The convergence characteristics of each loss function follow exponential decay laws:
L b b o x ( t ) = L b b o x ( 0 ) × e α t + ε b b o x ,
L c l s ( t ) = L c l s ( 0 ) × e β t + ε c l s ,
L s e q ( t ) = L s e q ( 0 ) × e γ t + ε s e q ,
L t o t a l ( t ) = ω 1 L b b o x ( t ) + ω 2 L c l s ( t ) + ω 3 L s e q ( t ) ,
where α , β , and γ are the respective convergence rate coefficients of each loss function, ε is the residual term, and ω 1 , ω 2 , ω 3 corresponds to the weight coefficient.
The time complexity relationship of multi-process parallel processing demonstrates the advantages of parallel computing:
T s i n g l e = n × ( t p r e + t i n f + t p s t ) ,
T p a r a l l e l = n p × ( t p r e + t i n f + t p o s t ) + t s y n c ,
where n represents the number of images; p denotes the number of processes; t p r e , t inf , and t p o s t represent preprocessing, inference, and post-processing times respectively; and t s y n c indicates process synchronization time.

2.4.5. Performance Validation and Experimental Results

This study achieves a 9.5-fold reduction in total processing time for 220 high-resolution images, decreasing from 55.67 s to 5.86 s. This improvement stems from a synergistic multi-level optimization strategy applied across the entire processing pipeline to maximize efficiency.
In pre-processing, an intelligent cropping algorithm reduces input size to 384 × 512, slashing computational load by 40%. Model inference is accelerated via a PT-ONNX-TensorRT pipeline, reducing single-frame latency from 9.5 ms to 1.3 ms. Additionally, a multi-process framework utilizing 11 parallel processes increases GPU utilization from 15% to 85% while ensuring system stability. Integrated optimizations significantly enhance hardware efficiency, raising CPU utilization to 70% and ensuring efficient resource allocation. Regarding accuracy, the system achieves 92.4% classification accuracy, 88.3% mean Average Precision (mAP)@0.5, and a 90.5% F1-score on fusion datasets. These results validate the synergistic optimization of YOLOv8 spatial extraction, LSTM temporal modeling, and dynamic weighted fusion.
These innovations demonstrate that multi-source feature fusion enhances adaptability in complex driving scenarios through visual and temporal complementarity. The dynamic weight adjustment improves robustness under challenging conditions, while the parallel architecture satisfies real-time requirements without sacrificing precision. Achieving millisecond-level speeds with consistent performance validates the practical engineering value of this framework for real-world driving assistance.

3. Experiments and Performance Analysis

This chapter presents a fatigue driving detection framework centered on an optimized YOLOv8-LSTM fusion model. A custom 1800-image dataset was constructed using a four-level classification standard based on Eye Aspect Ratio (EAR), Mouth Aspect Ratio (MAR), and head pose metrics. Implemented on a Raspberry Pi 4B, the system integrates dlib-based landmark detection with multi-stage preprocessing. Experimental results confirm that the fusion model achieves 92.4% accuracy and an 89.7% F1-score, while reducing parameters by 37.2% and boosting inference speed by 86%. Through ProcessPoolExecutor parallelization and TensorRT acceleration, the system maintains 18.6 fps on the embedded platform. The proposed method demonstrates significant advantages in spatiotemporal fusion and long-term temporal modeling, providing an efficient, lightweight solution for real-world fatigue detection.

3.1. Dataset

This study establishes a multi-source integrated dataset for fatigue detection, comprising 13,200 high-quality images. By merging a custom collection with two representative public datasets under unified annotation and feature quantification standards, it provides a comprehensive foundation for deep learning training.

3.1.1. Custom Dataset Construction

To enhance YOLOv8’s performance in fatigue recognition, this study constructed a specialized dataset of 1800 facial images from three participants. Data was collected in a simulated environment with cameras positioned 40–50 cm from the driver to ensure unobstructed head coverage. All procedures followed ethical guidelines with participant consent.
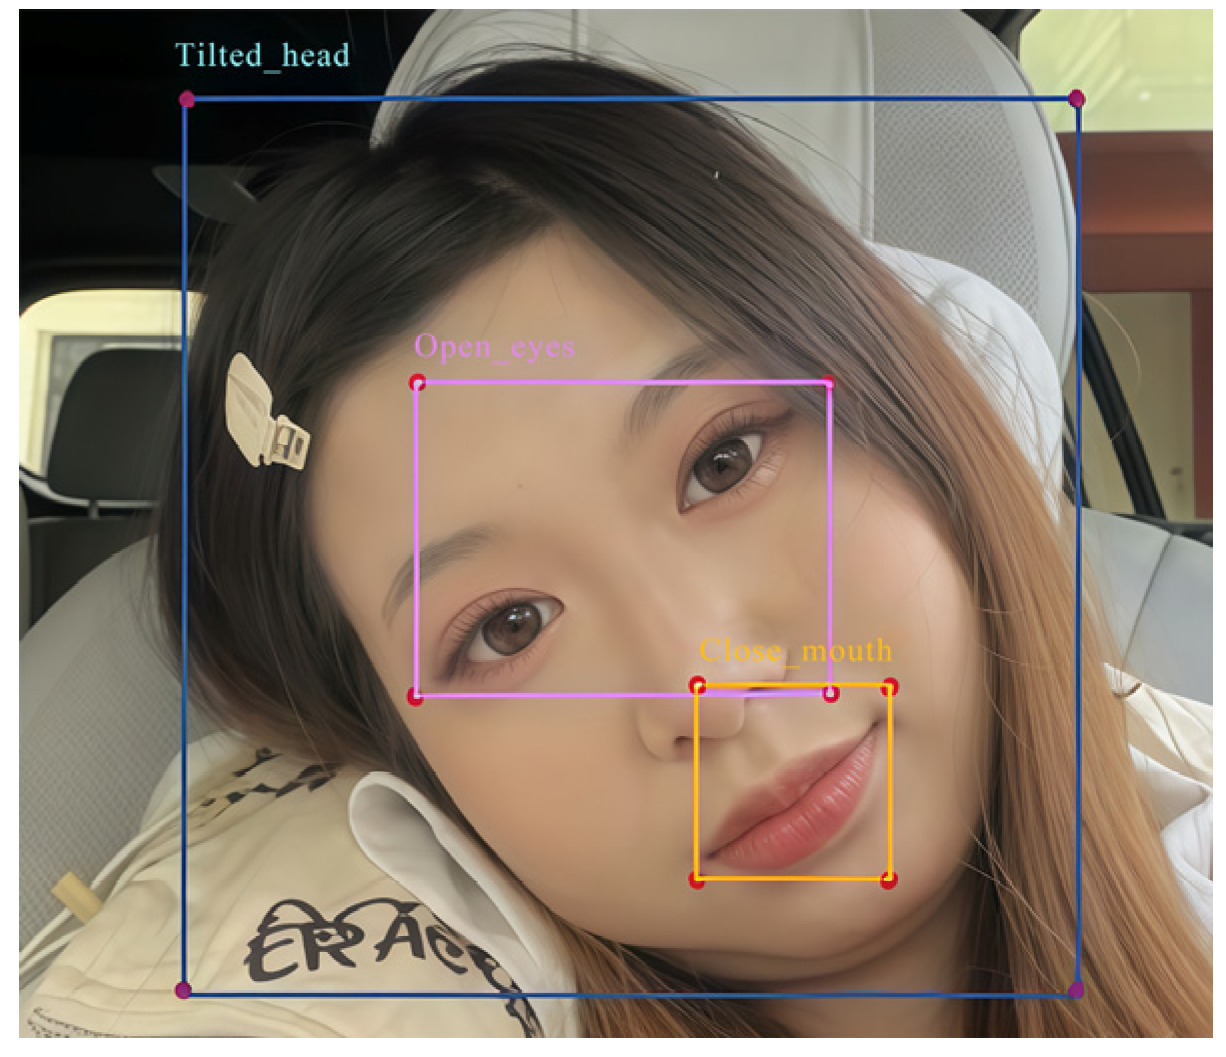
A four-level classification system—alert, relatively alert, fatigued, and relatively fatigued—was developed by adapting the Karolinska Sleepiness Scale (KSS) scale through a deductive scoring method. Starting from a baseline of 4 points, 1 point is deducted if the EAR falls below 0.15, the MAR reaches or exceeds 0.9, or the head tilt surpasses 20 degrees. The example is shown in Figure 10. This approach maintains clinical relevance while increasing objectivity. Finally, the dataset was partitioned into training, validation, and test sets using a 7:2:1 ratio to ensure robust model evaluation and generalization.

3.1.2. Public Dataset Selection

To evaluate generalization and robustness, this study integrates the custom dataset with two public datasets: NITYMED and the Fatigue Driving Dataset. While the custom data provides standardized assessment via a refined four-level classification, the public datasets offer multidimensional characterization and scenario diversity. This section systematically compares these datasets across key dimensions, including data characteristics, classification standards, and application scenarios. This comparison reveals the advantages of each source, providing a theoretical foundation for multi-source data fusion and cross-scenario model optimization.
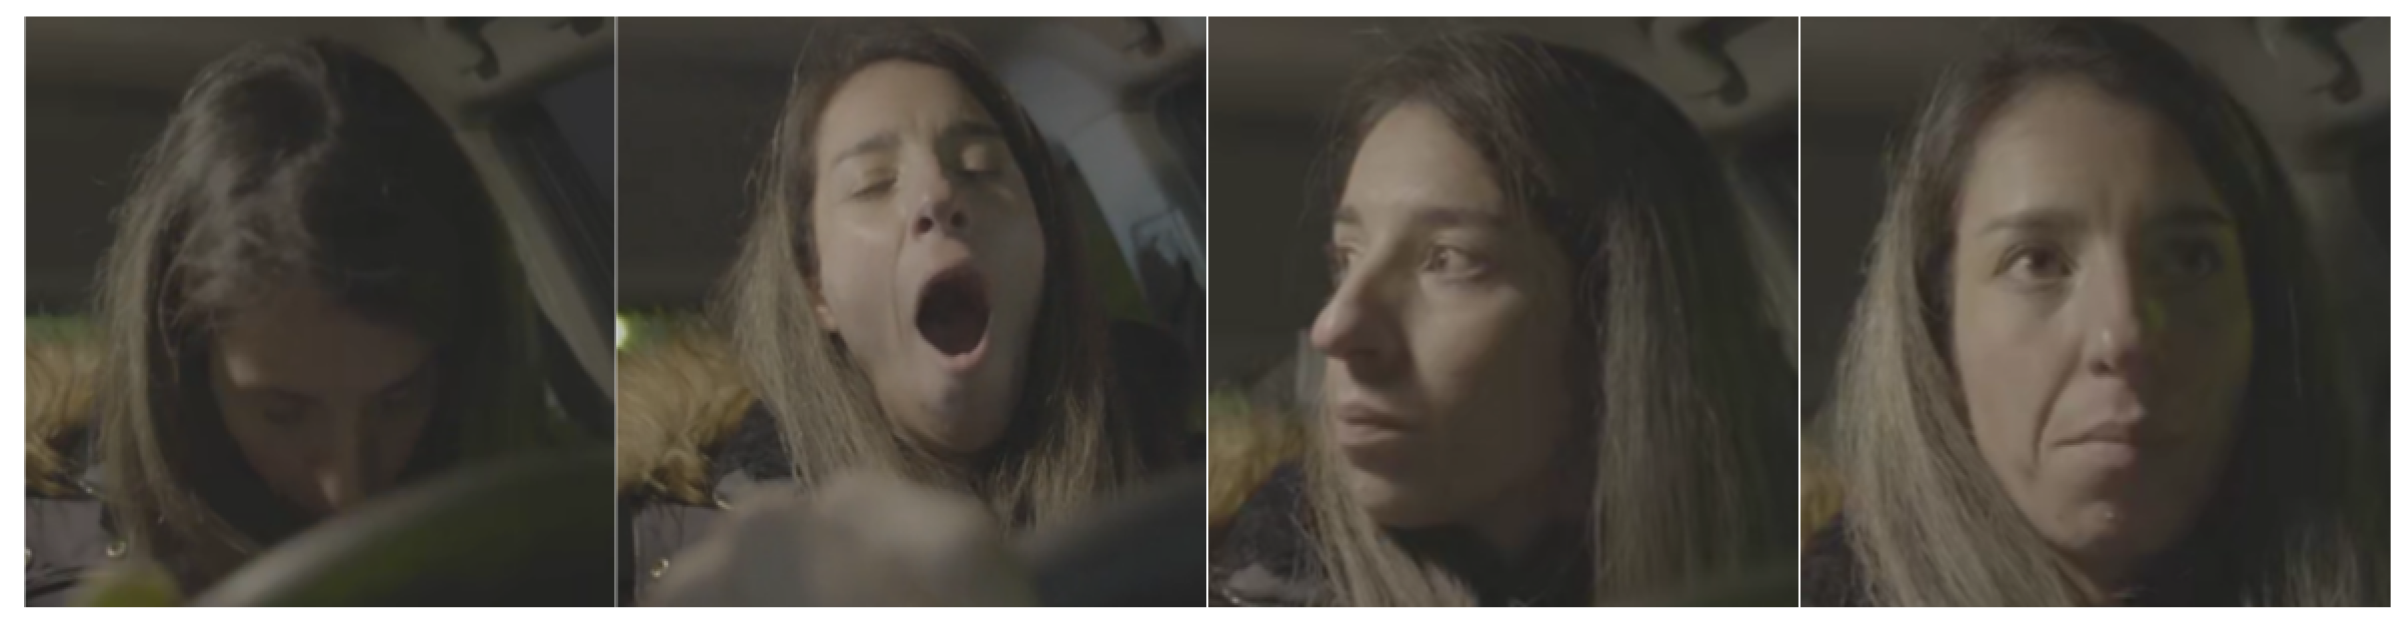
NITYMED [43,44]: As shown in Figure 11, this dataset contains 130 real-world nighttime driving videos from 21 drivers. It is categorized into two classes: Yawning (107 clips) and Microsleep (21 longer videos capturing fatigue episodes like gaze deviation). The data provides valuable scenarios of actual driver fatigue under natural lighting conditions.
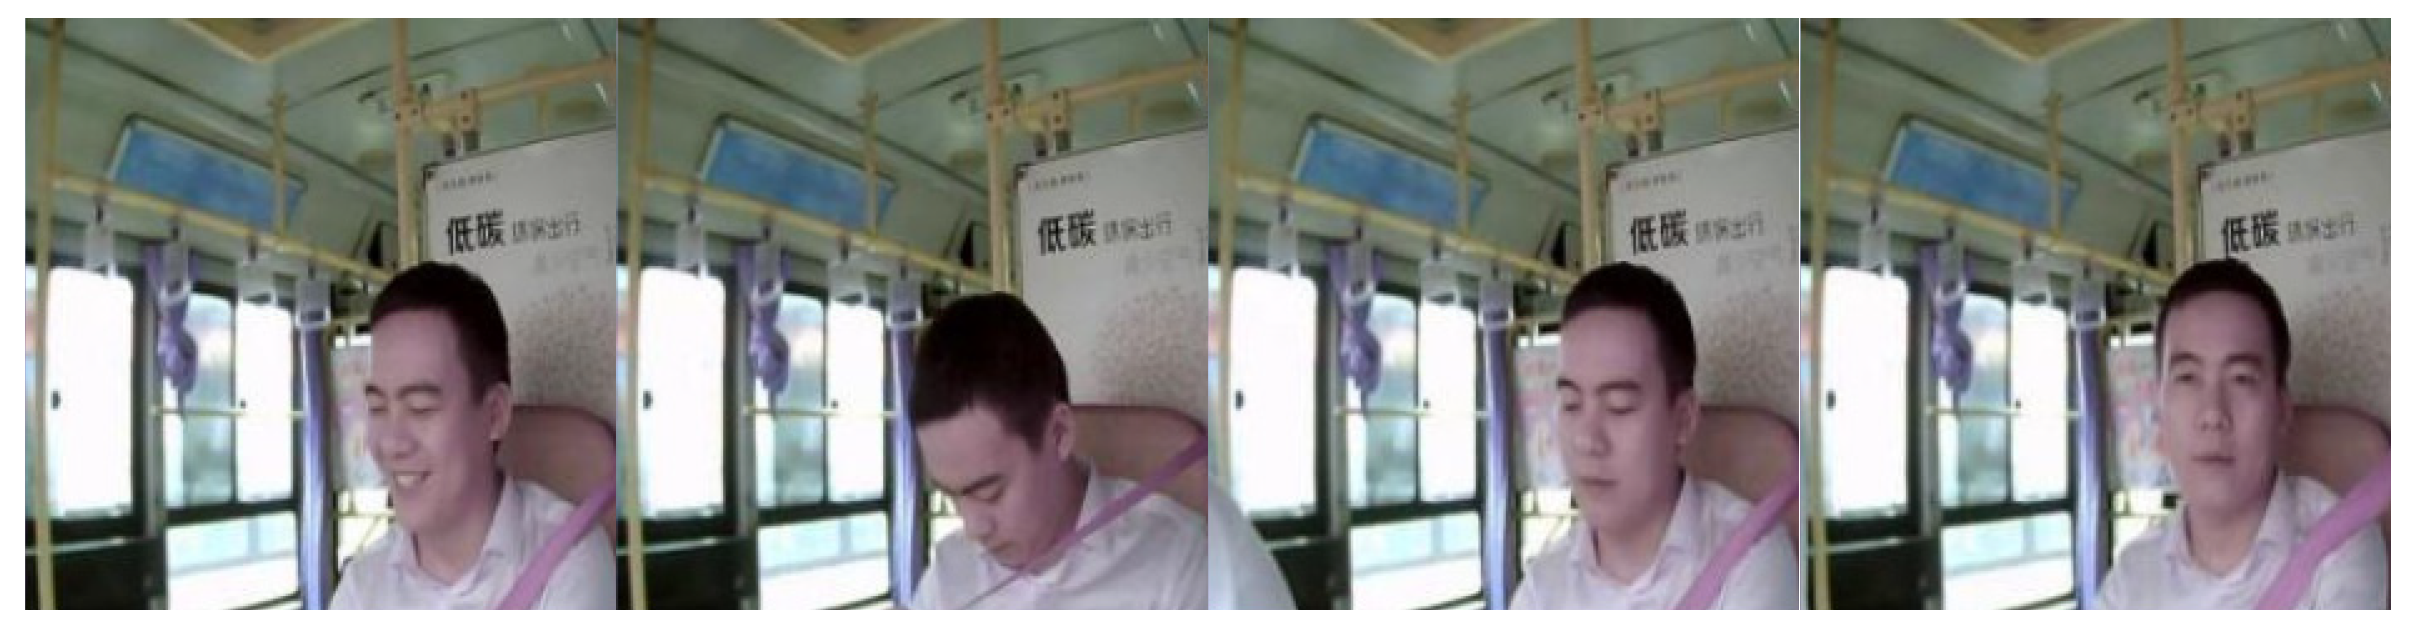
Fatigue Driving Dataset [45]: As shown in Figure 12, this dataset consists of 2914 in-vehicle facial images (640 × 480 pixels). It is annotated with four categories—closed/open eye and closed/open mouth—for fatigue state analysis. The dataset is pre-split into training, validation, and test sets with a 7:2:1 ratio.

3.1.3. Multi-Source Dataset Fusion Strategy

To enhance generalization, this study integrates the custom dataset with the Fatigue Driving Dataset and NITYMED, creating a large-scale training set of 13,200 high-quality images. The custom dataset contributes a refined four-level classification, while the public sources provide controlled indoor quality and authentic nighttime environments, respectively. By applying unified annotation standards and feature alignment techniques, the fusion process resolved inconsistencies and leveraged the complementary strengths of each source. Furthermore, data augmentation—including geometric transformations, HSV perturbations, and noise addition—was implemented to strengthen the model’s robustness against illumination changes, viewpoint shifts, and image degradation. This multi-source strategy ensures the model maintains high adaptability across diverse and complex driving contexts while providing a standardized foundation for robust training and validation.

3.1.4. Dataset Statistical Analysis and Distribution Characteristics

The fused dataset comprises 13,200 samples with a standardized four-level classification and balanced distribution. As shown in Table 1, the four states include: Alert (3300 samples), defined by normal features; Relatively Alert (3250 samples), showing isolated indicators like frequent blinking; Fatigued (3350 samples), marked by two concurrent features; and Relatively Fatigued (3300 samples), a high-risk state with all three indicators present.
Spatially, the dataset covers diverse demographics and facial characteristics; temporally, it captures the full progression of fatigue. The assessment follows a deduction-based framework: starting from a baseline of 4 points, 1 point is deducted for each indicator (eye closure, mouth opening, or head tilting). This rigorous construction ensures balanced feature learning and provides abundant samples for training, significantly improving model adaptability to diverse driving scenarios and individual differences.
In summary, to train and evaluate the proposed model, a multi-source fused dataset was constructed by integrating the custom-collected dataset (1800 images) with the NITYMED and Fatigue Driving Dataset. The final fused dataset comprises a total of 13,200 high-quality annotated images. To ensure rigorous evaluation, the entire dataset was systematically partitioned into training, validation, and test sets using a ratio of 7:2:1. This results in 9240 images for training, 2640 for validation, and 1320 for testing, providing a solid foundation for model development and unbiased performance assessment.

3.2. Data Processing

This framework utilizes Dlib to extract 68 facial keypoints for the quantitative assessment of fatigue via EAR, MAR, and head pose. We define eye closure at an EAR threshold of 0.15—validated alongside PERCLOS (Percentage of Eyelid Closure over the Pupil) metrics—and yawning at an MAR of 0.9 or higher. Head tilt is determined by a 20-degree threshold, calculated from a weighted combination of eye (60%), mouth (30%), and nose (10%) feature points. The preprocessing pipeline integrates image resizing, histogram equalization, and Gaussian filtering (5 × 5 kernel), followed by median-based outlier filtering to enhance robustness. Finally, LabelImg was employed to produce standardized annotations across six categories, namely open/closed eyes, open/closed mouth, and tilted/straight head, establishing a high-quality data foundation for model training.

3.2.1. Eye Posture Assessment

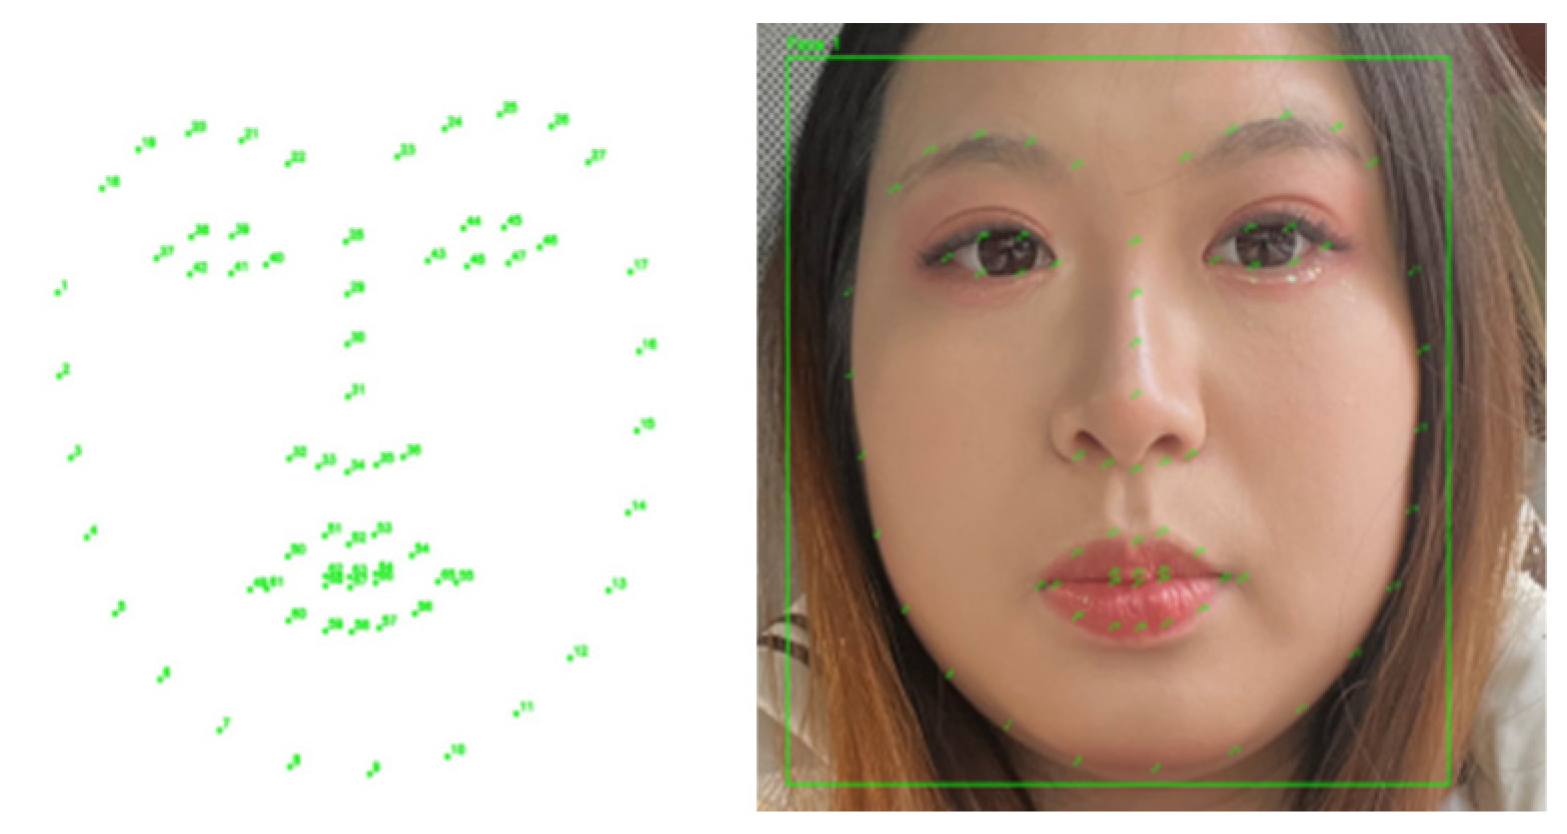
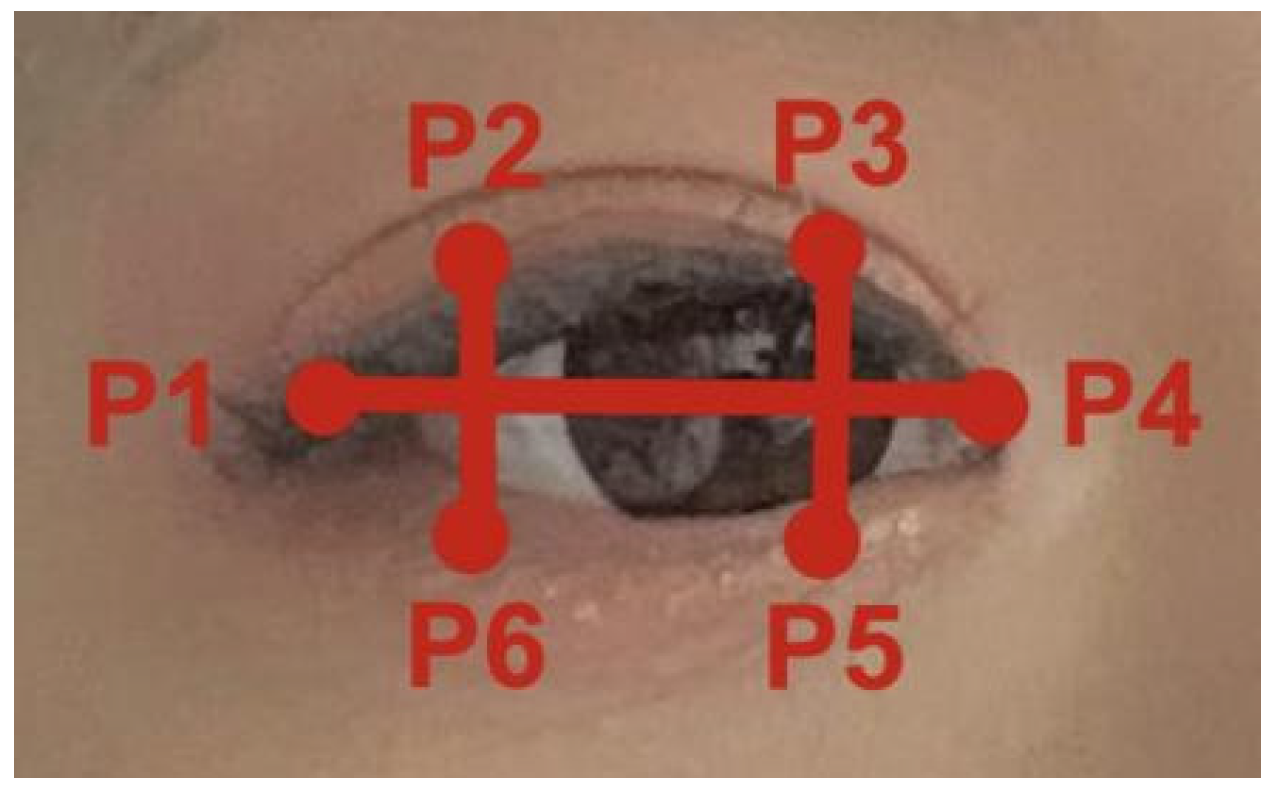
To automate blinking detection, physiological behaviors are quantified via the EAR, which reflects the ratio of vertical eye height to horizontal width. Under alert conditions, the EAR remains high and stable, whereas it approaches zero during eye closure. Notably, the EAR is invariant to uniform image scaling and in-plane facial rotation, demonstrating low sensitivity to individual differences and moderate head pose variations. Given that both eyes typically blink synchronously, the final EAR value is the average of both eye measurements. As shown in Figure 13, utilizing the Python Dlib library, 68 facial keypoints are localized to extract precise eyelid coordinates, facilitating the vertical and horizontal distance calculations applied in Equation (15).
E A R = p 2 p 6 + p 3 p 5 2 p 1 p 4 ,
Due to individual differences, human eyes vary in size and shape. For blink detection, as shown in Figure 14, it is necessary to first compute the average EAR over a baseline period and then calculate the ratio between the current frame’s EAR and this reference value. When this ratio falls below a predetermined threshold, eye closure is detected. The selection of an appropriate threshold is a critical factor influencing the accuracy of eye state classification. An EAR value below 0.15 is adopted as the criterion for identifying closed eyes in drivers.
To validate EAR effectiveness, continuous monitoring experiments were conducted on multiple subjects. Figure 15 illustrates real-time EAR variations, where values remain stable above 0.15 during normal driving but drop significantly below this threshold during fatigue. This numerical separation provides empirical support for EAR as a robust fatigue indicator. Despite slight baseline variations across individuals, consistent downward trends confirm the feasibility of a unified detection threshold. Specifically, Figure 15A captures the temporal transition from alertness to fatigue, while Figure 15B reveals synchronized changes across detection channels through multi-channel analysis. Finally, Figure 15C correlates EAR features with other physiological parameters, highlighting the integration of multi-source signals. These results collectively demonstrate that the 0.15 threshold reliably distinguishes eye states across diverse physiological profiles, ensuring the system’s robustness in practical driving scenarios.
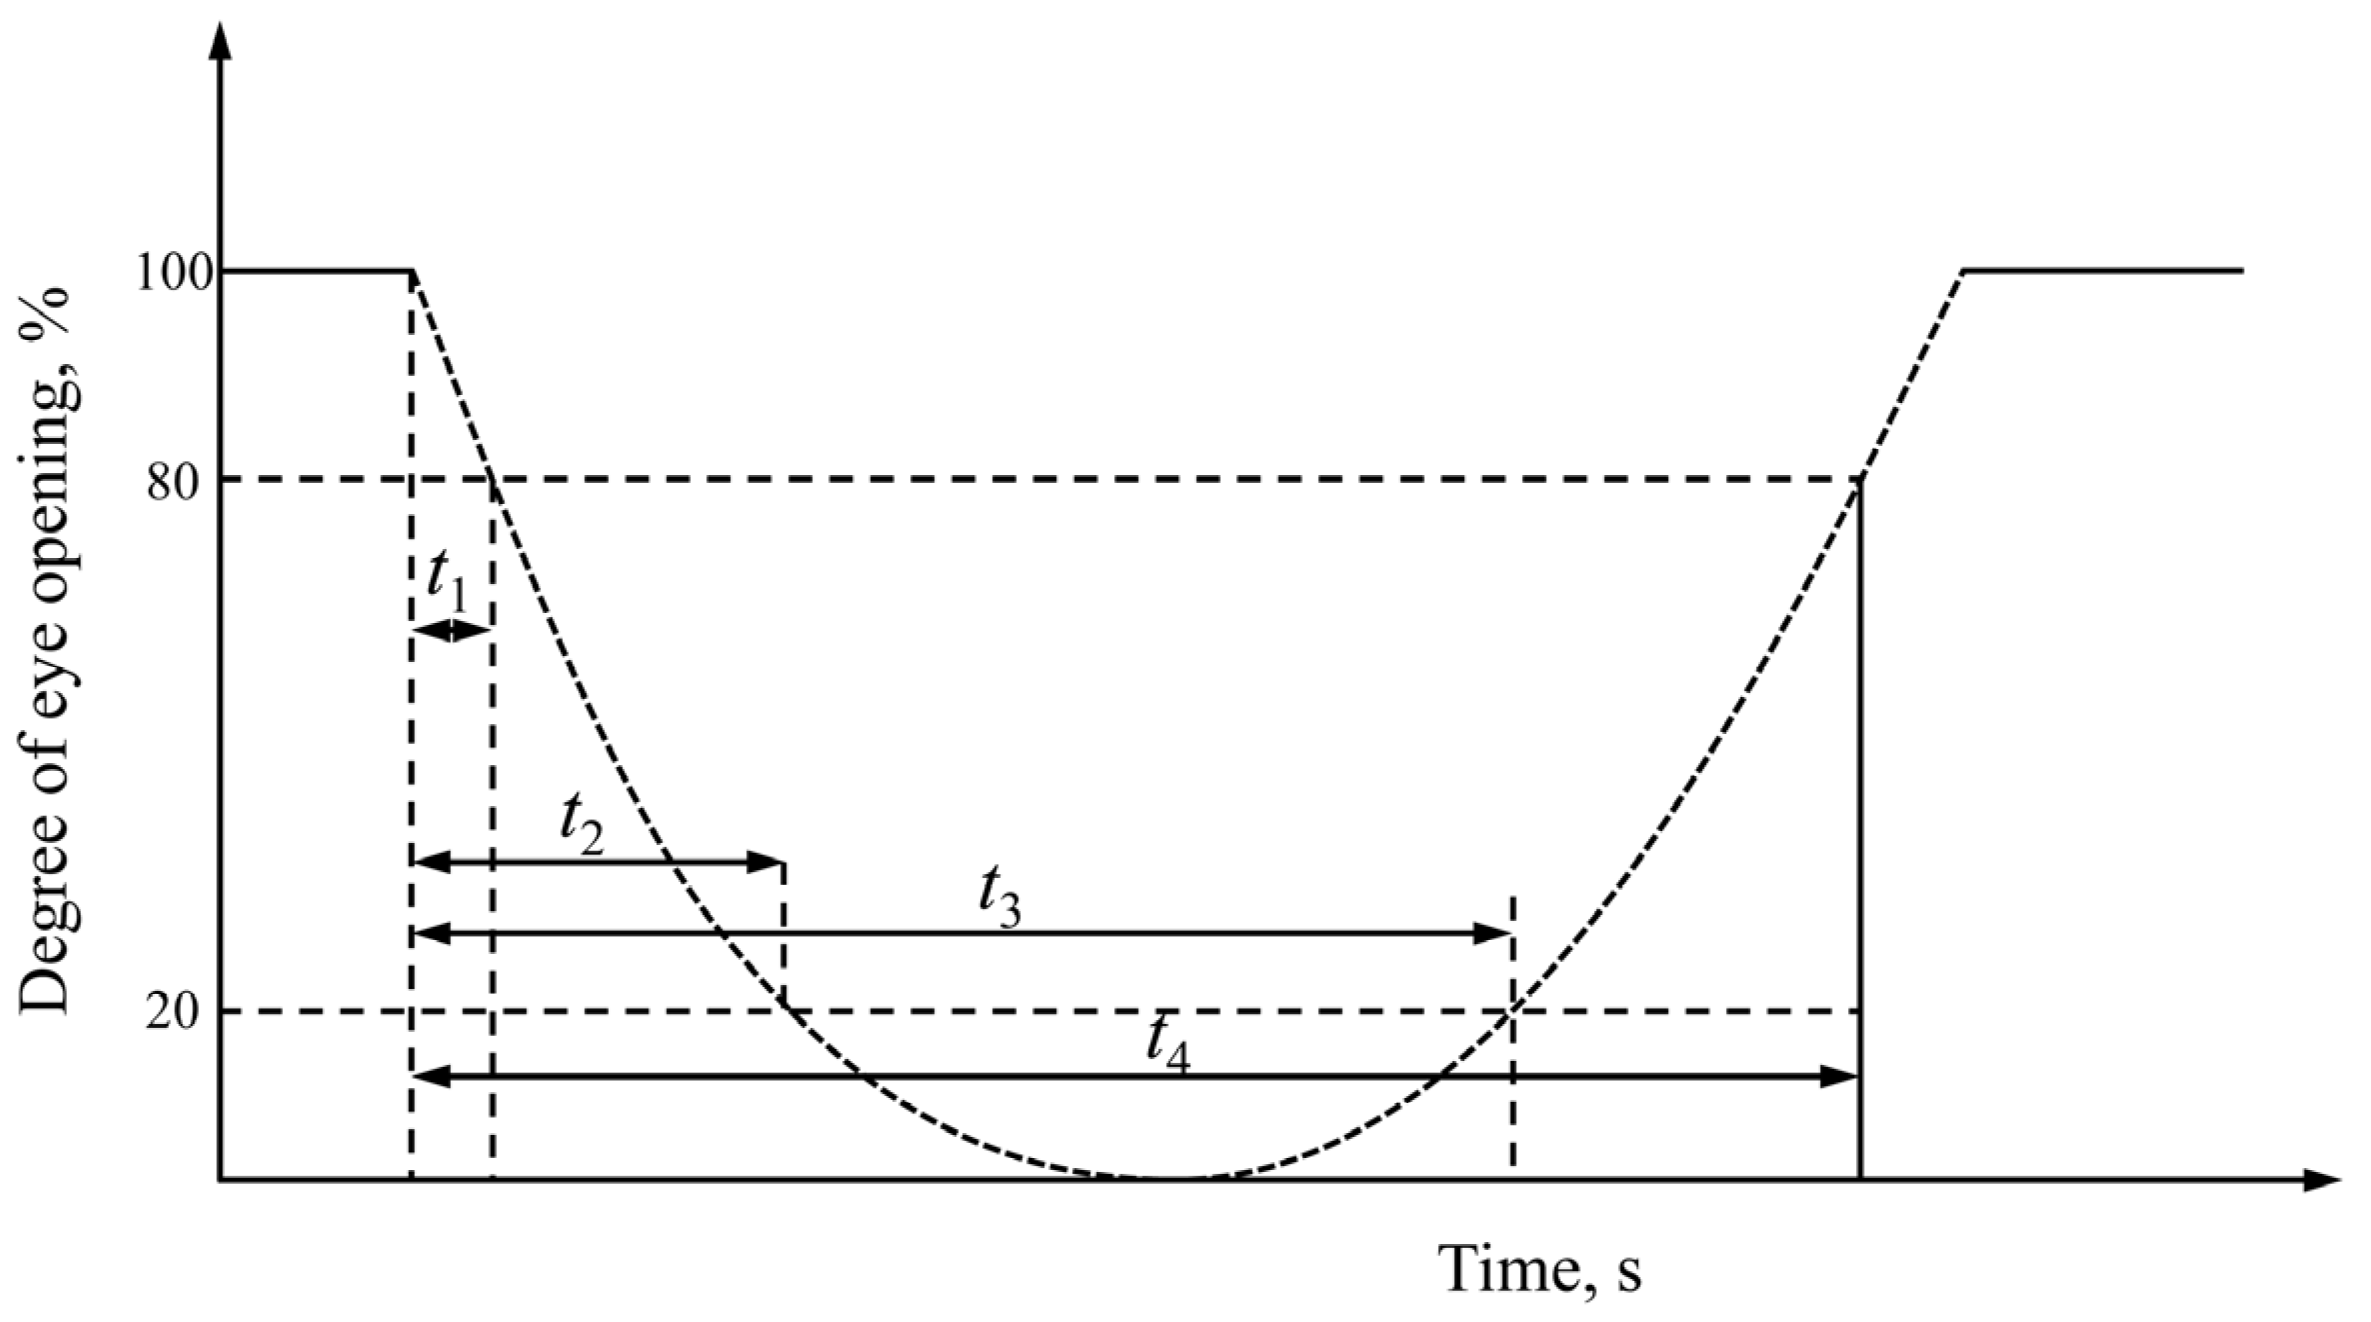
To further validate eye-based fatigue indicators, this study employs PERCLOS (Percentage of Eyelid Closure over the Pupil). PERCLOS quantifies fatigue by measuring the proportion of time a driver’s eyes are at least 80% closed (the P80 threshold) within a fixed interval. This criterion enables binary classification of eye states and is a well-established indicator for assessing drowsiness. In this study, the P80 standard is adopted as a key benchmark, leveraging its strong correlation with physiological fatigue to evaluate driver alertness and physical state.
Let O represent the total number of pixels in the image, and C represent the number of black pixels in the image:
T h r e s h o l d = ( O C ) × 0.2 + C ,
As shown in Figure 16, an eye is classified as CLOSED when the number of black pixels falls below the predefined threshold, indicating that at least 80% of the pupil area is covered—corresponding to the P80 criterion. Conversely, if the pixel count exceeds this threshold, meaning the eye remains open by more than 20%, it is classified as OPEN.

3.2.2. Mouth Posture Assessment

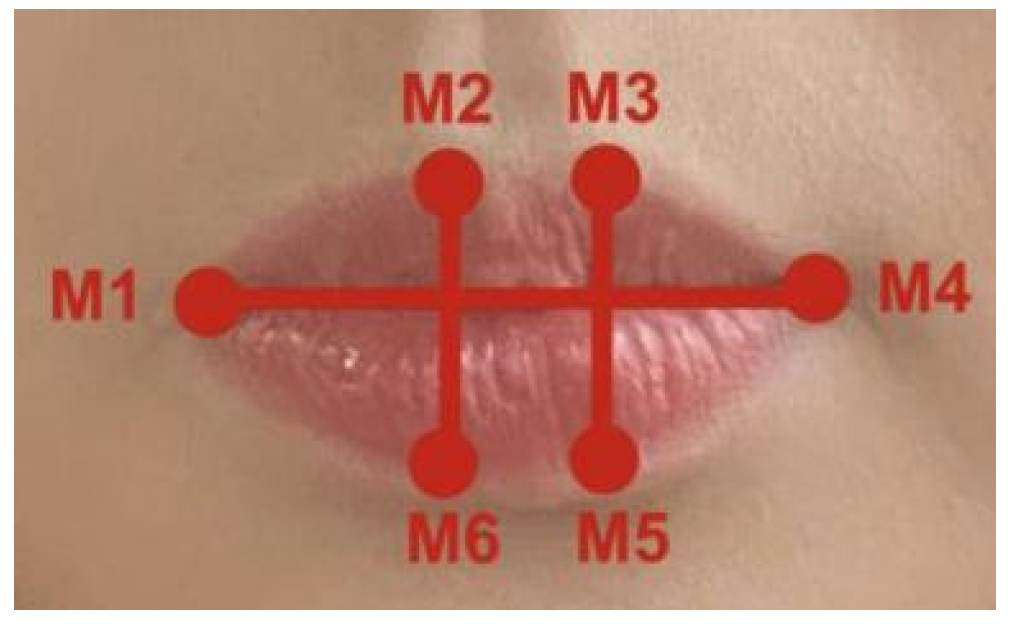
Mouth state assessment utilizes MAR methodology analogous to eye evaluation. Based on facial landmarks in Figure 17, the MAR typically remains below 0.9 under normal conditions. During yawning, however, significant vertical expansion occurs, with the mouth opening reaching or exceeding the horizontal span defined by landmarks M1 and M4. Based on Equation (17), a MAR value greater than or equal to 0.9 is classified as a yawning event.
M A R = M 2 M 6 + M 3 M 5 2 M 1 M 4 ,
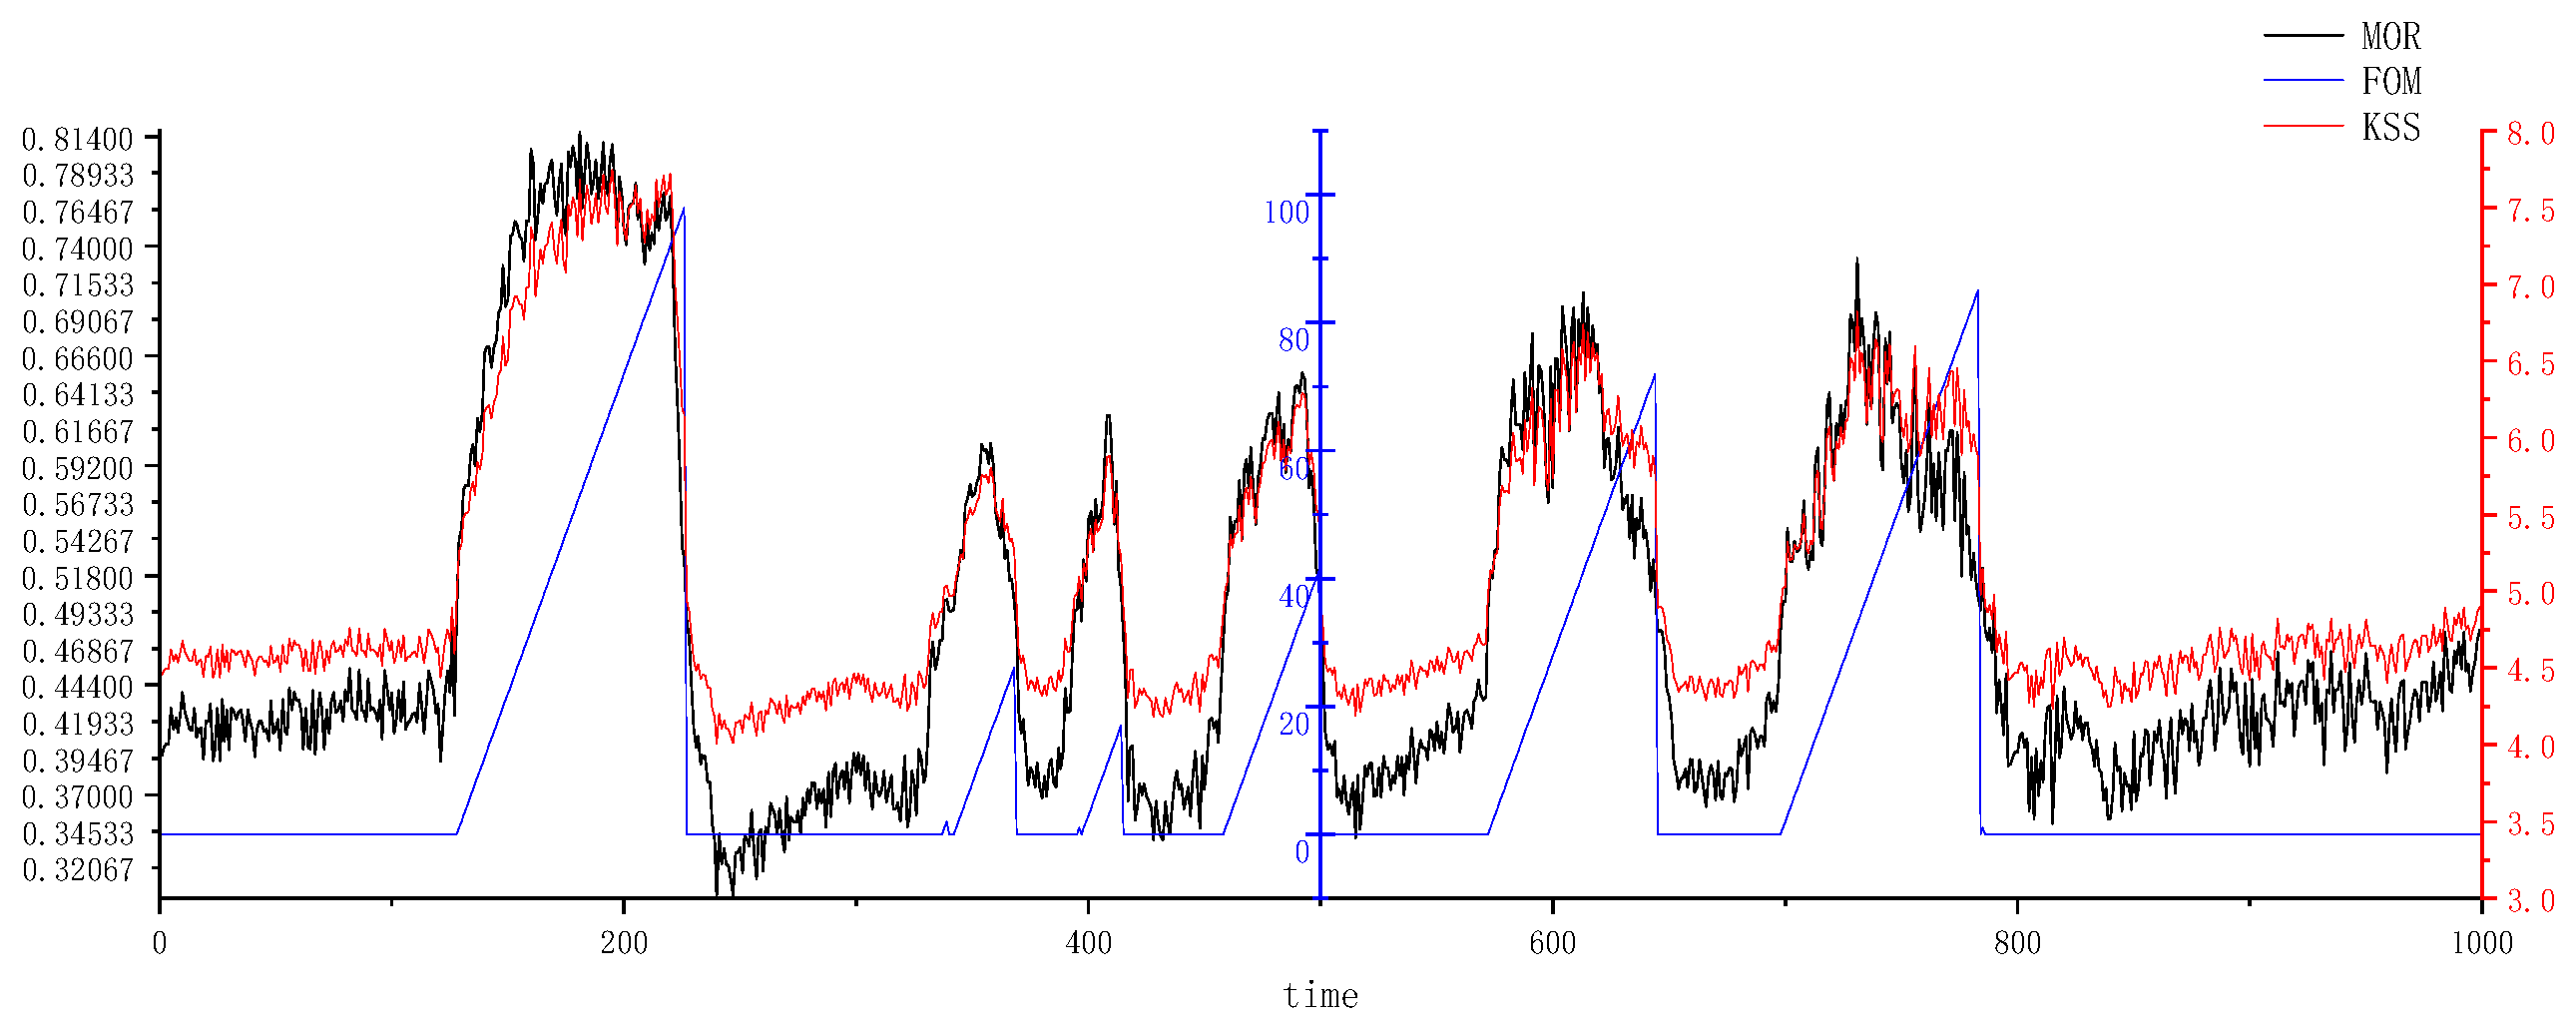
Figure 18 presents the real-time analysis results from our multi-feature fatigue detection system, illustrating the dynamic variations in three key indicators: the Mouth Opening Ratio (MOR), the Fusion Output Metric (FOM), and the KSS score. Synchronized trends in MOR, FOM, and KSS scores validate the four-level classification framework and multi-feature fusion strategy. Using the 0.9 MAR threshold, the system clearly delineates transitions between fatigue levels. Experimental results confirm a 92.4% classification accuracy, a 6.5-percentage-point improvement over the baseline YOLOv8. These coordinated patterns and numerical gains demonstrate the effectiveness of integrating mouth opening indicators with temporal scoring to enhance fatigue state recognition in practical driving scenarios.

3.2.3. Head Tilt Angle Calculation

Head tilt estimation relies on a weighted average of angles derived from the interocular line, mouth line, and nasal bridge, assigned weights of 60%, 30%, and 10% respectively. As shown in Figure 19, following safe driving standards, a 20-degree threshold is established to identify significant tilting behavior. To ensure precision, input images undergo a preprocessing pipeline featuring automatic resizing, histogram equalization, and 5 × 5 Gaussian filtering. This is complemented by an anomaly detection strategy that calculates the median angle from three facial regions. Any measurement deviating from this median by more than 20 degrees is excluded as an outlier. Subsequently, a final weighted average is computed based on the remaining reliable data. This integrated approach—combining multi-stage image enhancement with median-based filtering—effectively mitigates localization errors and ensures stable head tilt detection in complex driving environments.
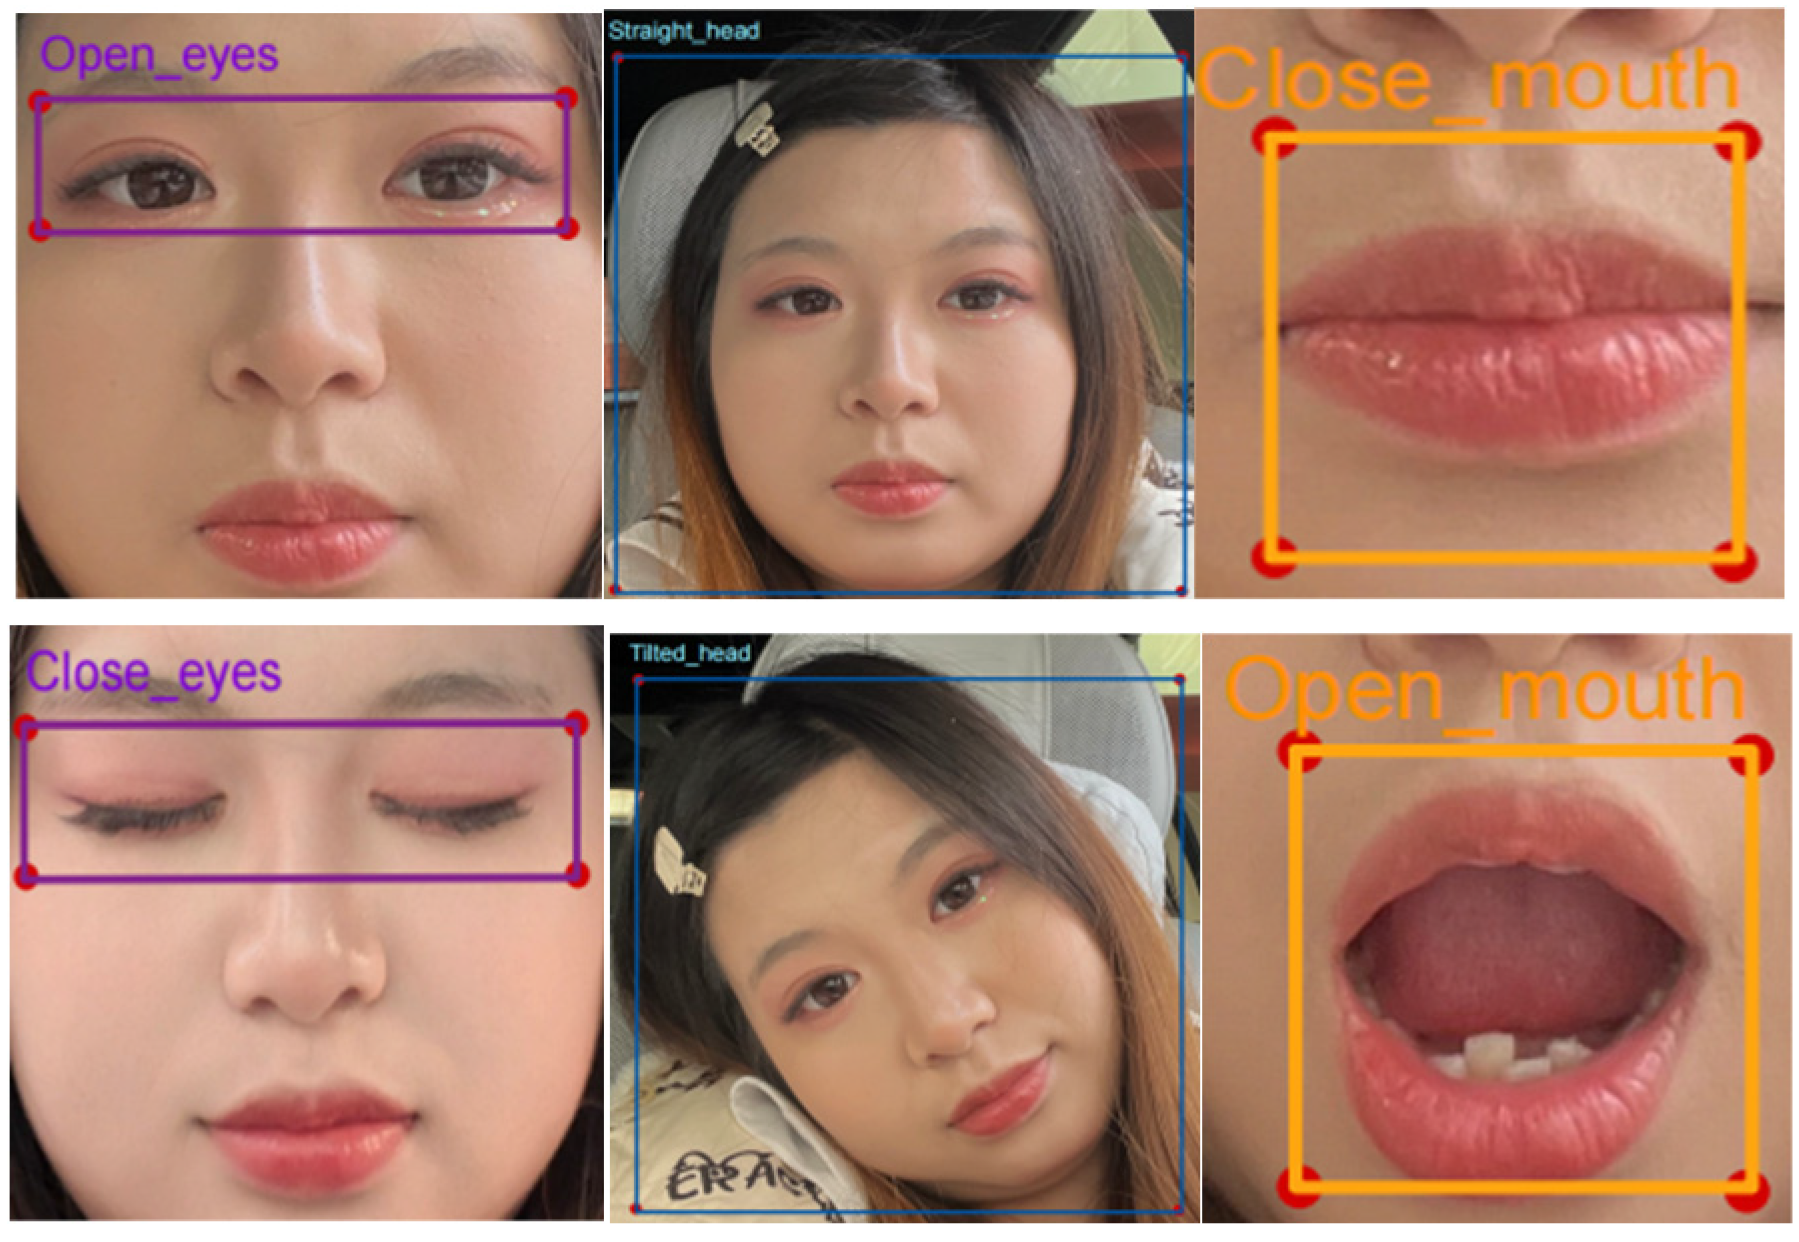
Following Dlib-based extraction, samples are annotated via LabelImg using unified thresholds. As shown in Figure 20, eyes are categorized as open when the EAR maintains or exceeds 0.15, and closed when it falls below this value. Similarly, a MAR exceeding 0.9 identifies an open mouth, whereas values at or below 0.9 denote a closed mouth. Regarding head pose, tilt angles reaching 20 degrees or more are annotated as tilted, while smaller angles are labeled as straight. This process ensures consistent data labeling.

3.3. Experimental Environment and Related Configurations

3.3.1. Hardware Environment

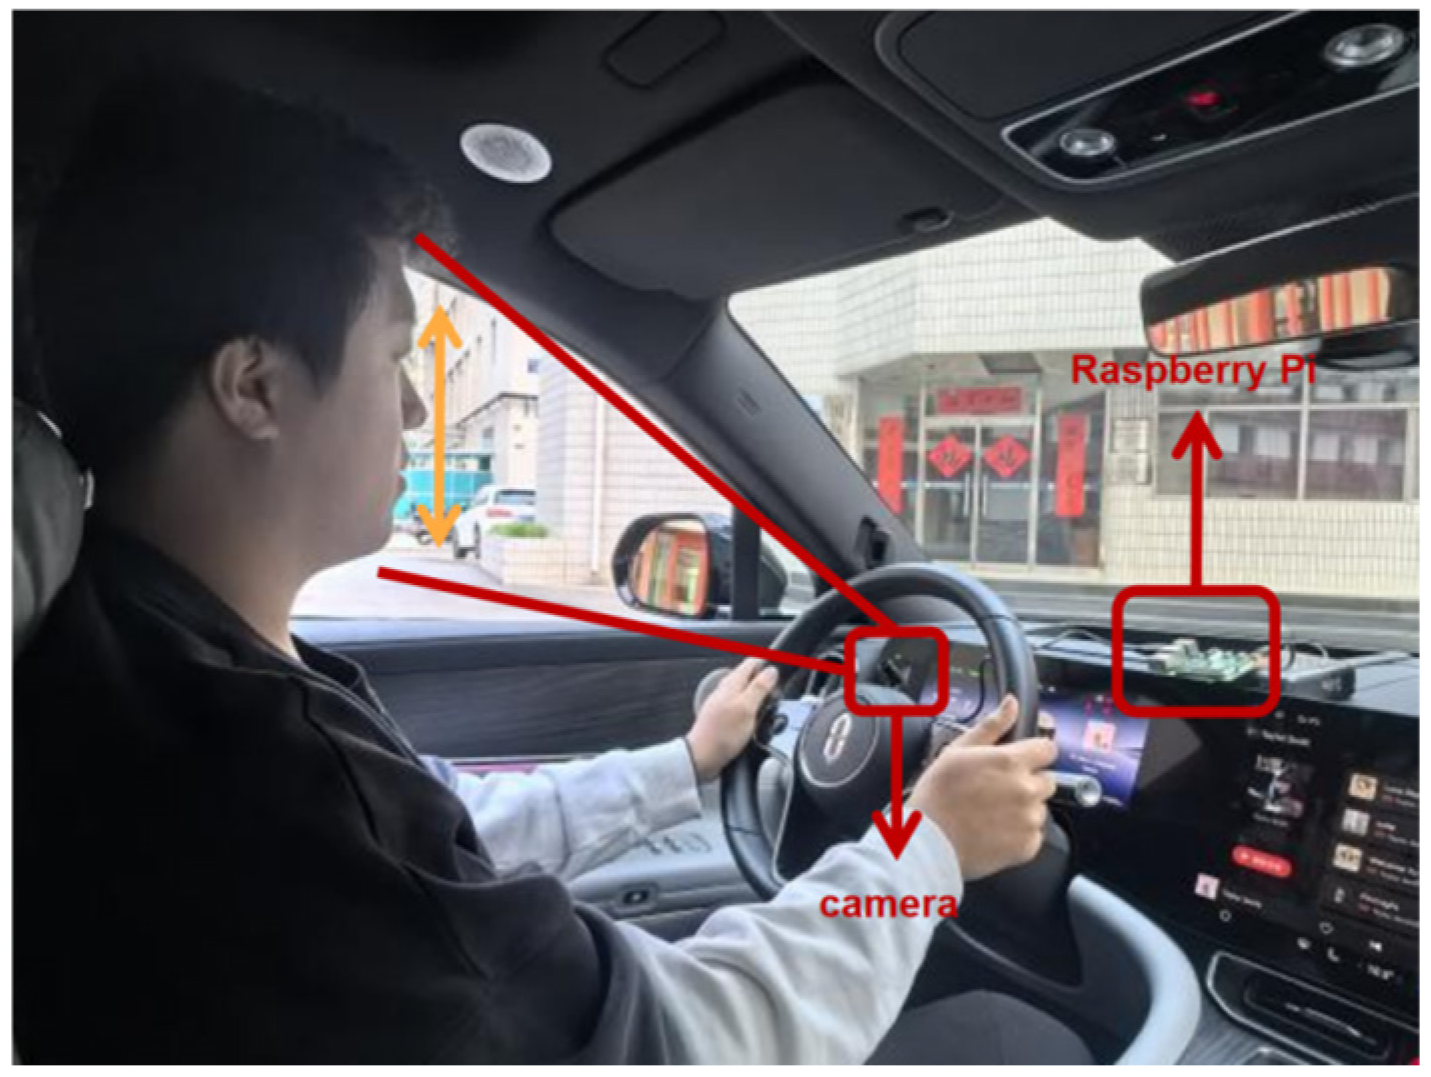
As shown in Figure 21, the fatigue detection system is implemented on a Raspberry Pi 4B featuring a 1.5 GHz quad-core BCM2711 processor and 2 GB RAM. Image acquisition is performed via a LISM USB camera module with an OV7670 sensor, capturing 640 × 480 video at 30 fps. System operations are supported by a 32 GB Class 10 microSD card and a 5 V/3 A power adapter. This configuration ensures a compact and efficient embedded environment for real-time video processing and data caching.

3.3.2. Software Environment

As shown in Table 2, the system operates on Raspberry Pi OS 64-bit with Python 3.9.2 and ARM-optimized PyTorch 1.11.0. Computer vision tasks utilize OpenCV 4.5.4 with GTK + 3.0 and V4L2 support, managed via the libcamera driver. For lightweight deployment, the architecture integrates TensorFlow Lite 2.8.0 and Flask 2.1.2 for RESTful API interfaces. All software packages are cross-compiled for ARMv8 compatibility and verified via official apt-get and pip3 repositories, ensuring a stable and high-performance environment for real-time model inference.

3.3.3. Hyperparameter Settings

The hyperparameters for model training and inference were configured as follows. For the spatial feature extraction module, which is built upon the improved YOLOv8, the Stochastic Gradient Descent (SGD) optimizer was adopted with an initial learning rate of 0.01, a momentum of 0.937, and a batch size of 16. The training process was conducted over 300 epochs. In the temporal modeling module, the input sequence length of the LSTM network was fixed at 30 frames. The LSTM architecture comprises two hidden layers, each with 256 units. The enhanced iTransformer module employs 8 attention heads, and a Dropout rate of 0.1 is applied within the feed-forward networks for regularization. All the aforementioned hyperparameters were determined through preliminary tuning on the validation set to ensure an optimal balance between model performance and training efficiency.

3.4. Performance Test Results

System performance is evaluated using accuracy, precision, recall, F1-score, and mAP@0.5. Accuracy reflects the proportion of correctly classified states among total assessments. Precision and recall measure the model’s capability to minimize false alarms and capture all fatigue instances, respectively. The F1-score serves as a balanced harmonic mean of these two metrics. Specifically, mAP@0.5 assesses the mean average precision across all categories at an Intersection over Union (IoU) threshold of 0.5, providing a comprehensive quantitative benchmark for the detection model.
The confusion matrix visualizes predictive accuracy across the four fatigue levels: Alert, Relatively Alert, Fatigued, and Relatively Fatigued. By comparing predicted labels with ground truth, it identifies correct classifications and error patterns. In this context, TP (True Positive) represents correctly identified fatigue, while TN (True Negative) refers to alert states accurately recognized as non-fatigued. Conversely, FP (False Positive) occurs when alert states are misclassified as fatigued, and FN (False Negative) denotes undetected fatigue—the highest safety risk. To supplement these numerical statistics, this study integrates a multidimensional framework including Precision, Recall, F1-score, mAP@0.5, and Precision–Recall curve analysis. This approach ensures a comprehensive evaluation of the model’s ability to distinguish between adjacent fatigue levels in safety-critical driving applications.

3.4.1. Performance Analysis of the Improved YOLOv8 + GSConv + Slim Neck Model

This study optimizes YOLOv8 by integrating GSConv and Slim Neck, significantly reducing computational complexity without sacrificing accuracy—making it ideal for deployment on vehicle-mounted edge devices.
As shown in Table 3, the improved YOLOv8 achieves 88.2% comprehensive accuracy, a 2.6% increase over the original model. By leveraging GSConv and Slim Neck, the model reduces parameters by 32.3% while attaining 86.4%, 84.0%, and 78.9% accuracy for eye closure, yawning, and head tilting, respectively. Specifically, the VoVGSCSP module’s optimized feature fusion enhances multi-scale representation, boosting detection of subtle features, such as minor eye changes, from 82.2% to 88.7%.
Precision–confidence analysis confirms stable performance across thresholds. At a 0.68 confidence threshold, the model achieves 88.2% accuracy. The GSConv and Slim Neck synergy effectively stabilizes predictions, ensuring robust detection across varying conditions. Recall performance evaluation indicates that the improved model demonstrates strong performance in comprehensively recognizing fatigue states. The improved YOLOv8 achieves an 84.7% comprehensive recall rate, surpassing the original model by 2.4%. Specifically, recall rates reach 92.4% for alert, 82.5% for relatively alert, 65.5% for fatigue, and 70.8% for relatively fatigue states. This high performance results from GSConv’s fine-grained feature extraction and Slim Neck’s multi-level feature fusion, which collectively enhance indicator capture and minimize missed detections.
As the harmonic mean of precision and recall, the improved model achieves a comprehensive F1-score of 86.4%, with optimal performance attained at a confidence threshold of 0.68. This result demonstrates that the synergistic optimization of the GSConv grouped separable convolution and the Slim Neck feature pyramid structure achieves a well-balanced trade-off between precision and recall, providing reliable technical support for fatigue driving detection.
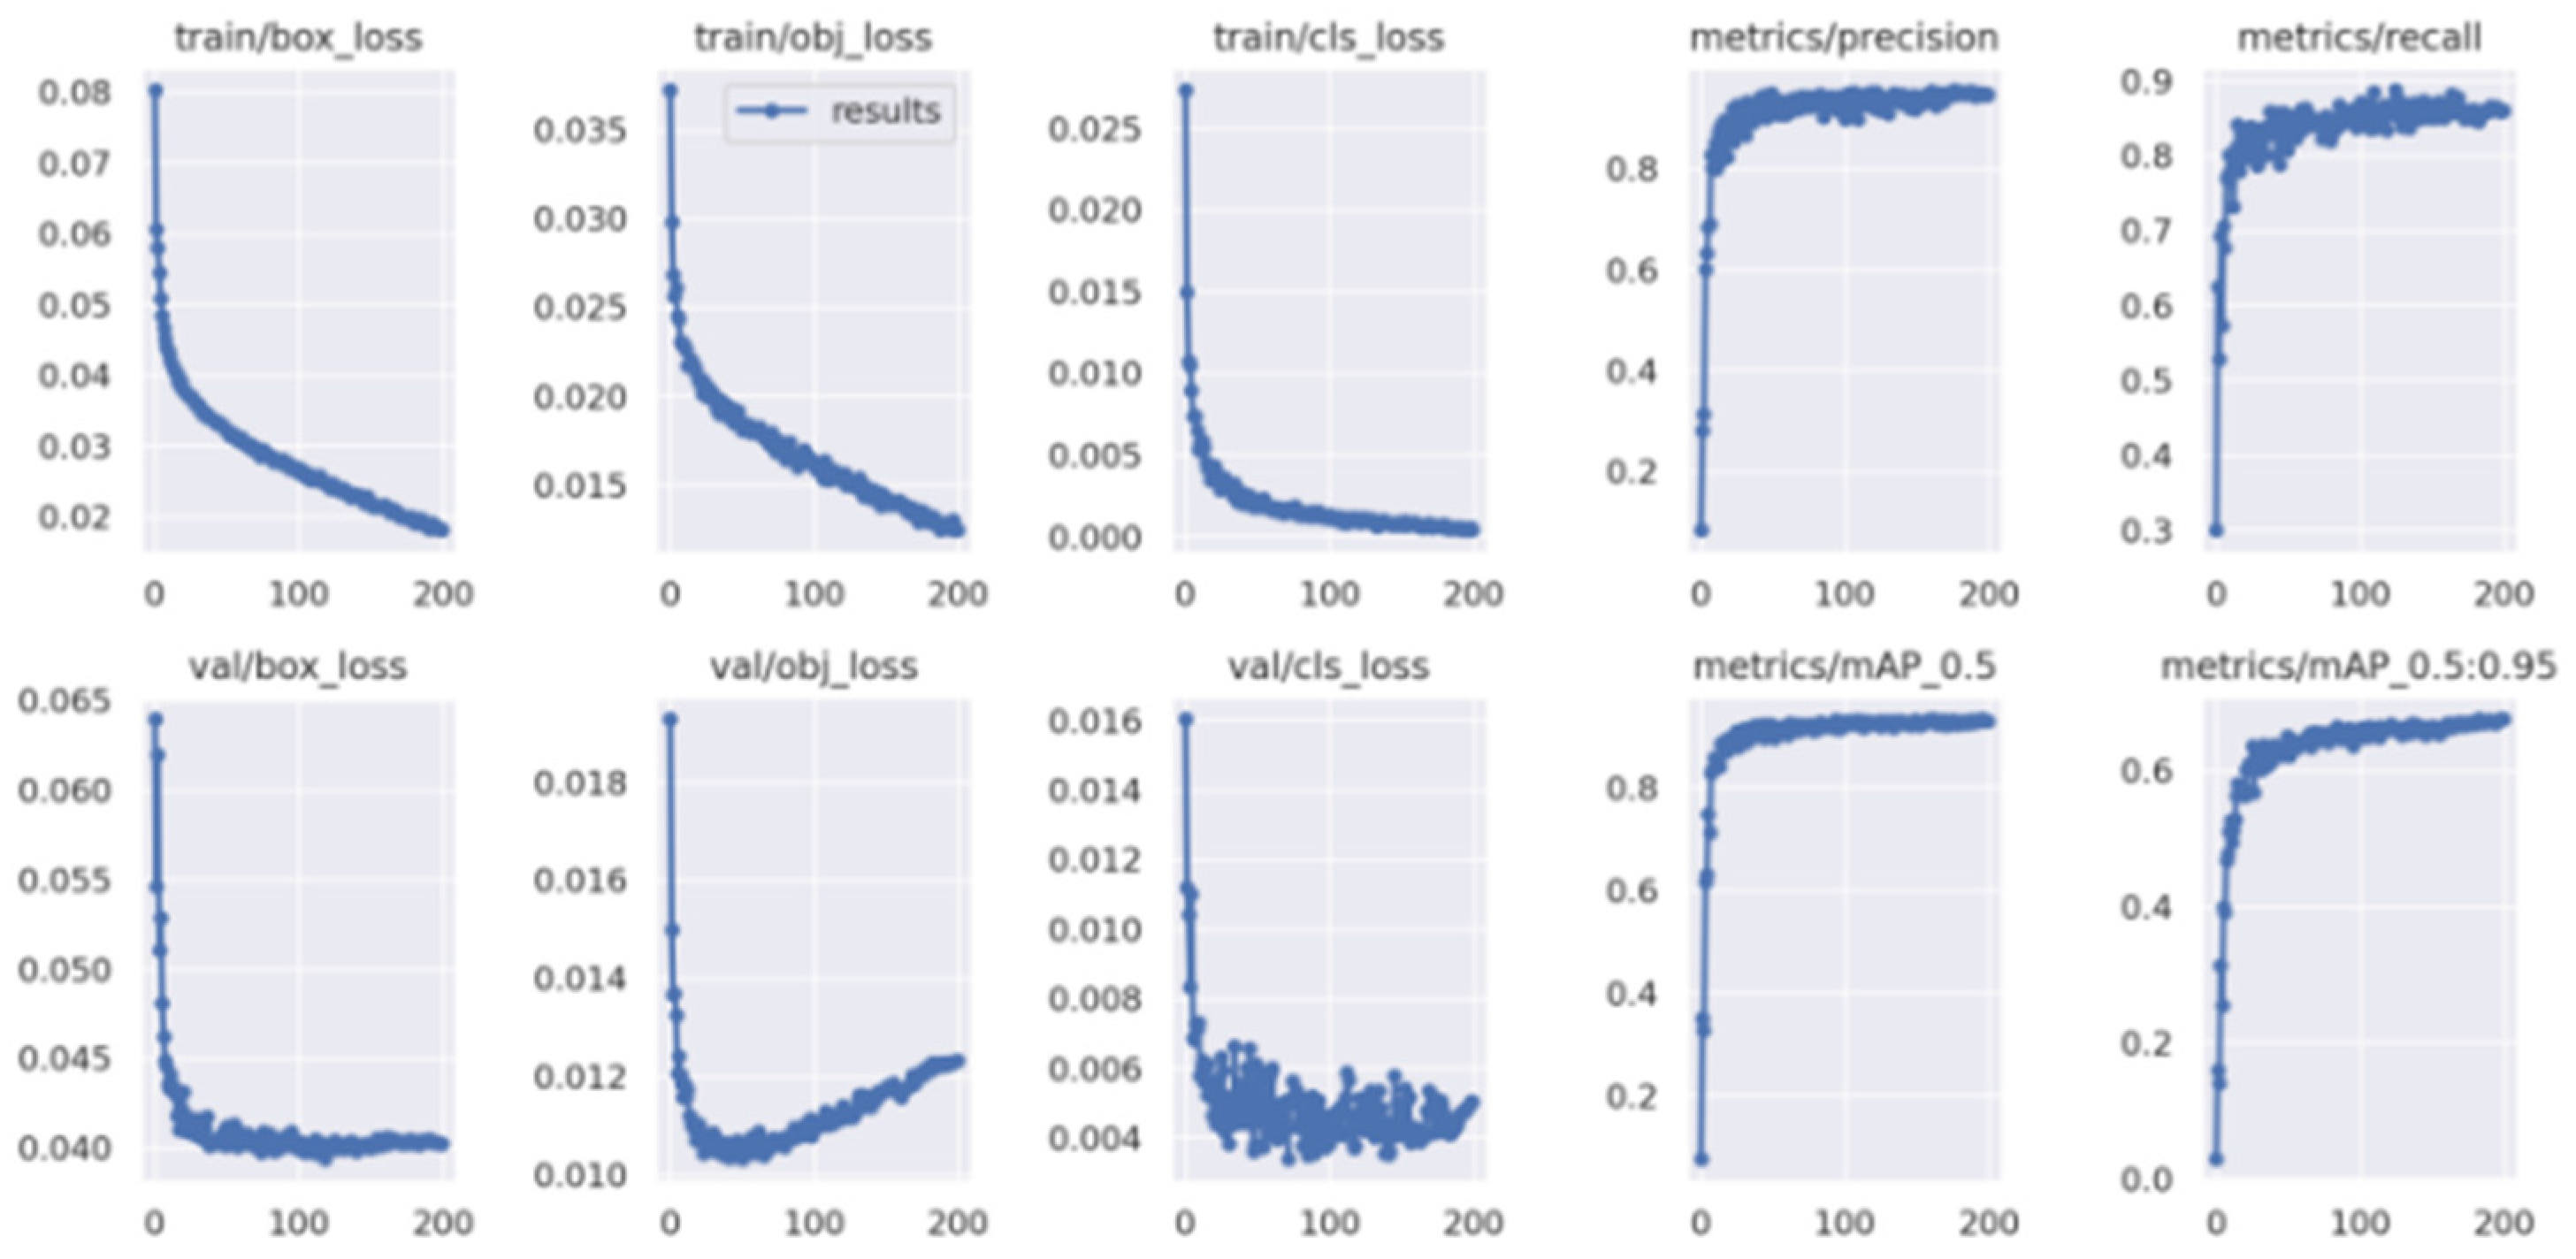
Figure 22 tracks the training and validation dynamics of the improved YOLOv8. Rapidly converging loss curves across box, object, and classification tasks reflect stable learning and precise feature extraction. Significant gains in precision, recall, and mAP metrics validate the effectiveness of GSConv and Slim Neck in ensuring robust generalization and high detection accuracy.
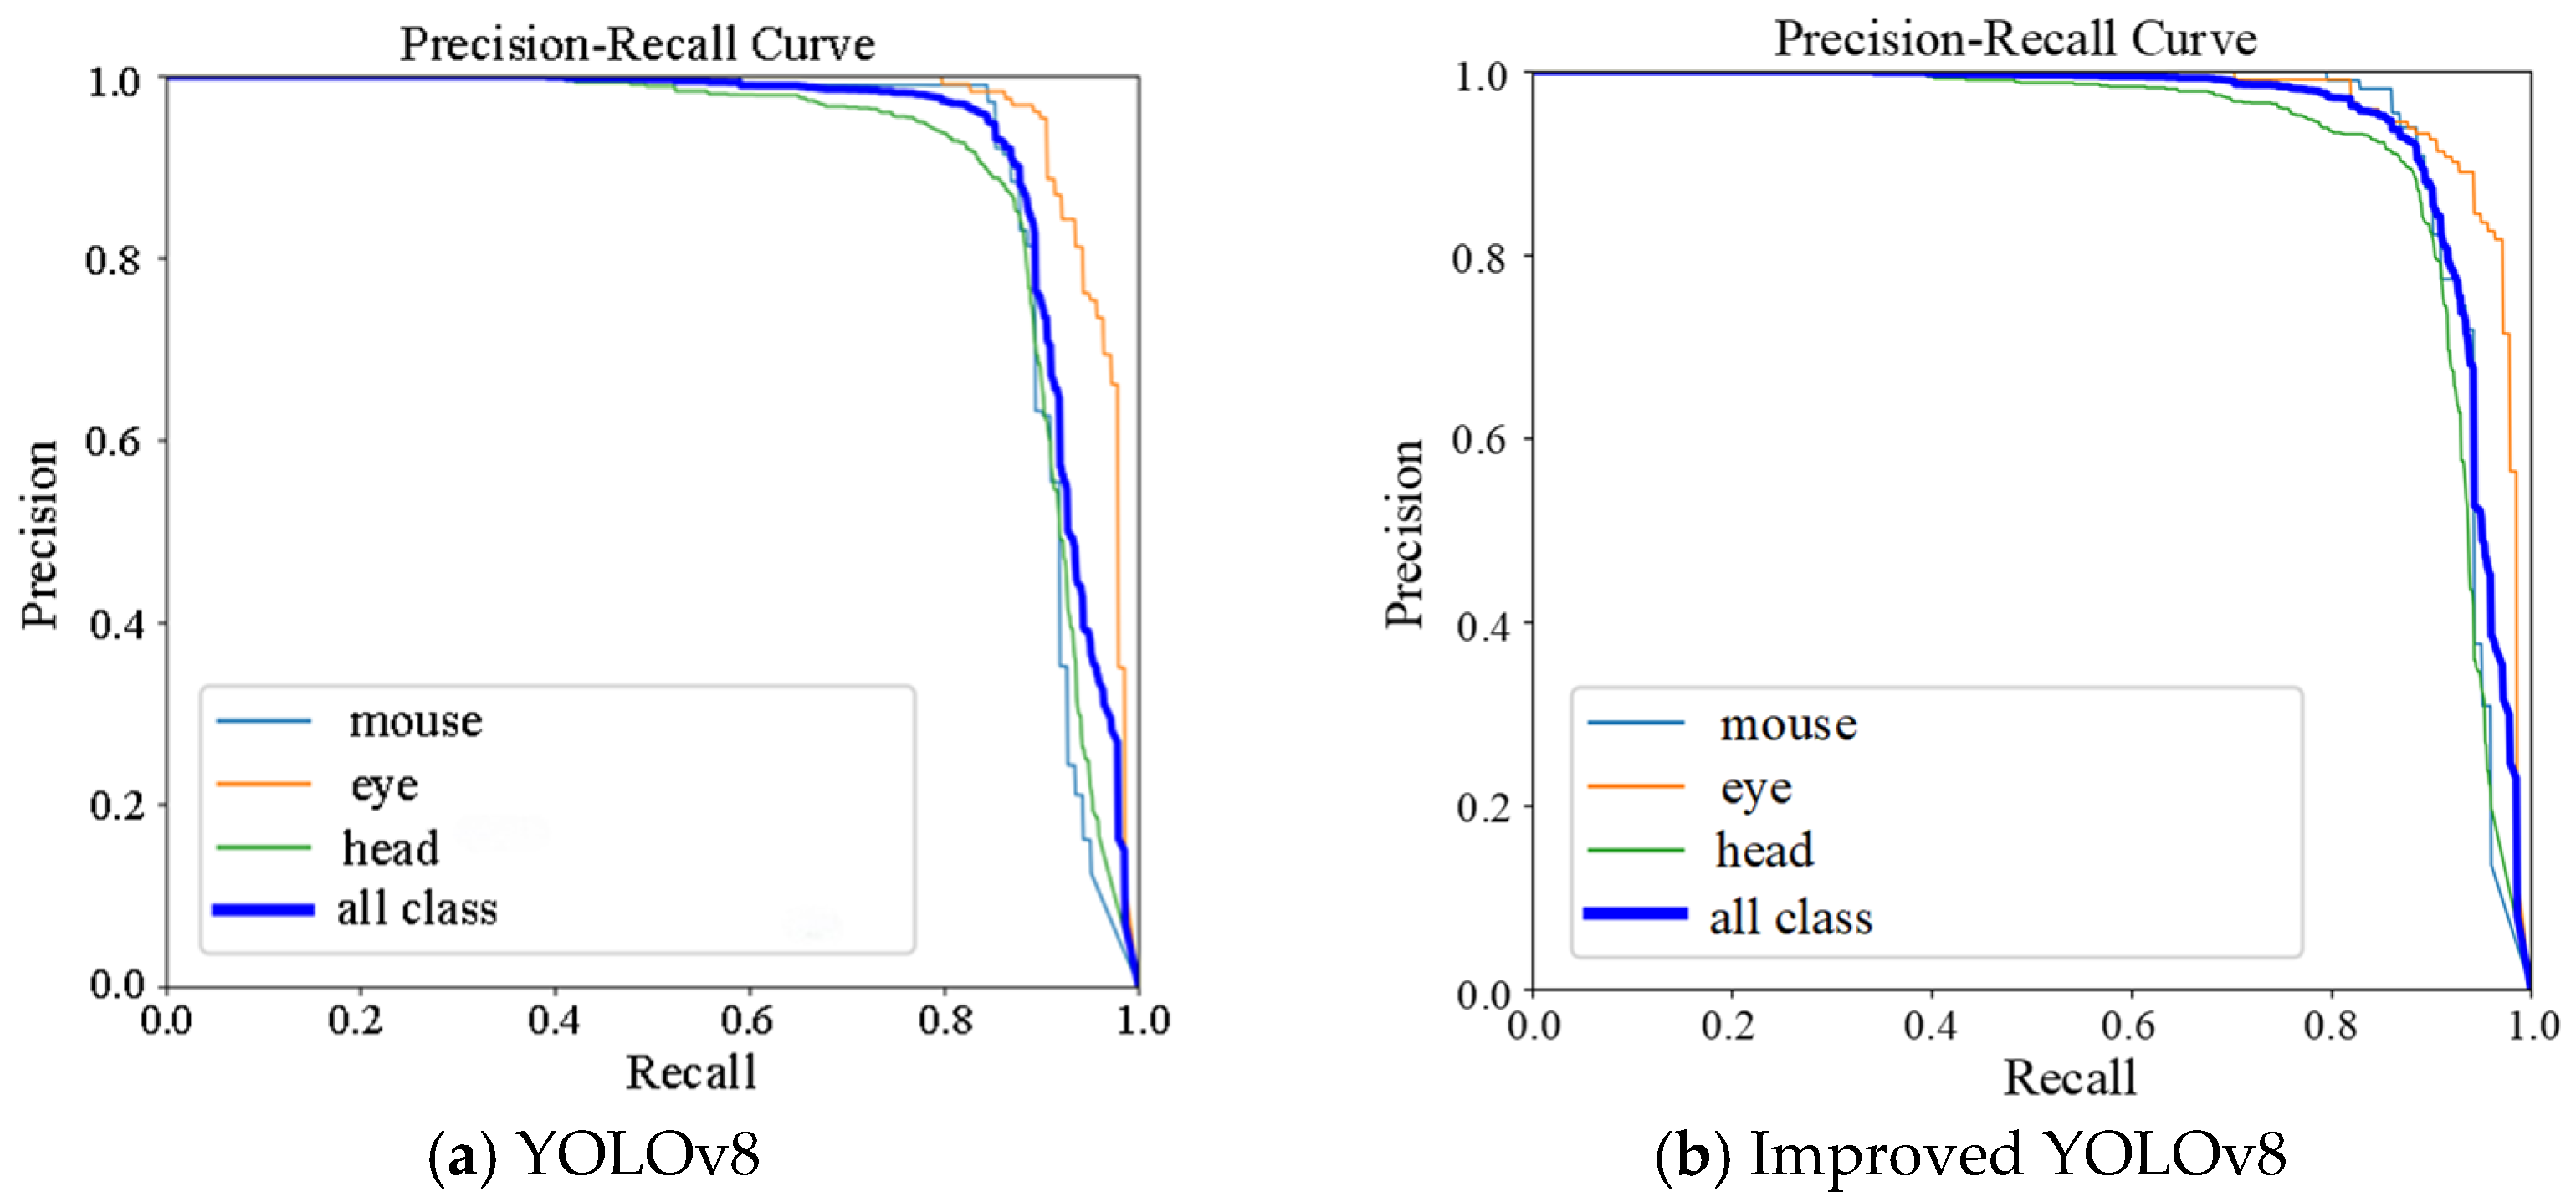
Figure 23 compares PR curves between the original and improved YOLOv8 models. These curves illustrate the precision–recall trade-off across varying confidence thresholds, providing a comprehensive evaluation of the model’s detection capability and performance gains under different operating conditions.
PR analysis of the original YOLOv8 establishes a baseline as shown in Figure 23a. Mouth detection exhibits a steep precision decline in high-recall regions, while eye detection remains stable until recall exceeds 0.8. Conversely, head pose detection shows the greatest variability, particularly within the medium recall range. Ultimately, the model achieves a multi-class mAP of approximately 0.82, serving as a quantitative benchmark for evaluating subsequent improvements.
The improved YOLOv8 demonstrates significant performance gains as illustrated in Figure 23b. The mouth detection curve shows enhanced stability in high-recall regions due to GSConv’s precise capture of subtle features. Similarly, eye detection maintains precision above 0.8 even as recall exceeds 0.9, highlighting the Slim Neck architecture’s efficacy in small target detection. Head pose detection also exhibits markedly reduced fluctuations, reflecting greater adaptability to complex variations like head tilting.
Crucially, the overall multi-class mAP exceeds 0.88, a 6-percentage-point increase over the original model. This improvement is reflected in the favorable curve shape, which maintains high precision at elevated recall levels—a critical requirement for safety-critical fatigue detection.
Comparative analysis confirms that the improved model achieves gains across all categories. The overall rightward and upward shift in the PR curves validates that integrating GSConv with the Slim Neck architecture effectively reduces missed detections and false alarms. This synergistic optimization provides the necessary technical reliability and safety assurance for practical driving applications.

3.4.2. Evaluation of LSTM + Improved iTransformer for Time Series Modeling Performance

Temporal modeling constitutes a core technology for the monitoring of driver fatigue states. The LSTM + improved iTransformer hybrid model significantly enhances the capability to capture the dynamic evolution of fatigue by integrating a differential multi-head attention mechanism with a hybrid LSTM-FFN architecture.
As shown in Table 4, accuracy analysis confirms the superior performance of the LSTM + improved iTransformer model in processing sequential data. Through differential attention mechanisms, the enhanced iTransformer increases the noise suppression rate by 13.3 percentage points—from 71.3% to 84.6%. This advancement elevates the overall fatigue state prediction accuracy from 85.1% to 90.1%, representing a 5-percentage-point gain. The model achieves high recognition accuracy across specific categories, reaching 92.6% for eye sequences, 84.7% for mouth sequences, 83.3% for head pose anomalies, and 85.7% for progressive fatigue sequences. Furthermore, the LSTM-FFN module enhances the capture of gradual fatigue by enabling synergistic modeling of local temporal dynamics and global variable interactions, ensuring robust state recognition.
Recall analysis demonstrates that the LSTM + improved iTransformer model enhances fatigue detection sensitivity. Selective historical retention via LSTM gating and cross-variable attention in iTransformer elevate the comprehensive recall rate from 81.4% to 89.3%, a 7.9 percentage-point gain. Simultaneously, sequence processing capacity increases by 30%, rising from 1000 to 1300 frames. This integration ensures robust capture of subtle fatigue transitions while maintaining high computational efficiency.
The LSTM + improved iTransformer model increases the F1-score from 83.4% to 90.5%, a 7.1 percentage point gain. By performing difference operations between Softmax distributions, the differential attention mechanism and LSTM-FFN module accurately identify current states and predict fatigue trajectories. This architecture provides effective technical support for proactive warning systems by modeling historical trends and state transitions without compromising computational efficiency.
Assessment of the F1-score reveals that the LSTM + improved iTransformer architecture achieves superior temporal modeling balance, rising from 83.4% to 90.5%. This 7.1-percentage-point growth stems from the integration of differential multi-head attention and the LSTM-FFN hybrid module. By executing difference operations between independent Softmax distributions, the system accurately identifies current states while forecasting fatigue trajectories via historical trends. Consequently, these synchronized mechanisms provide a robust technical foundation for proactive warning systems.

3.4.3. Parallel Optimization System Overall Performance Analysis

The fatigue detection system employs a ProcessPoolExecutor-based multi-process parallel framework to concurrently optimize accuracy and inference speed. This performance gain stems from the synergistic fusion of YOLOv8 for spatial extraction and LSTM for temporal modeling. To integrate these dual-path outputs, a dynamic weighted voting mechanism adaptively adjusts the weight coefficient α based on feature confidence scores. Consequently, the architecture effectively synchronizes spatiotemporal information to ensure reliable decision-making in complex driving scenarios.
Confusion matrix analysis validates the robust performance of the parallel system across four fatigue levels, achieving 92.4% overall accuracy. This represents a 7.3 percentage-point improvement over single-model baselines. Specifically, accuracy reaches 93.7% for Alert, 88.7% for Relatively Alert, 83.1% for Fatigue, and 78.5% for Relatively Fatigue states. Most importantly, critical safety risks remain minimal as misclassifying fatigued states as normal occurs in only 1.2% of cases, ensuring high operational reliability.
The mAP@0.5 evaluation confirms the advantages of the proposed strategy, yielding a score of 88.3%. This result reflects a 6.8 percentage point increase compared to baseline models. Category-wise analysis shows AP values of 86.4% for eyes, 84.0% for mouth, and 78.9% for head pose, while the integrated fatigue classification reaches 90.5%. These metrics underscore the efficacy of spatiotemporal feature fusion and collaborative temporal modeling in outperforming existing detection methods.
Inference testing reveals substantial throughput gains enabled by the parallel framework and TensorRT acceleration. When processing 220 high-resolution images, the multi-process PyTorch (PT) model reduces execution time from 55.67 to 13.04 s. Integrating TensorRT and intelligent cropping further compresses this duration to 5.86 s, achieving a 9.5-fold efficiency improvement. Furthermore, hardware utilization significantly increases, with GPU memory and compute core usage reaching 85% and 90% respectively, thereby maximizing embedded resource efficiency.
Training analysis demonstrates robust convergence across all loss functions. The spatial module reduces bounding box loss to 0.32 and classification loss to 0.24, while the temporal module brings sequence prediction loss down to 0.38. Overall system loss exhibits a consistent decline from 1.98 to 0.29. This stable downward trend indicates effective overfitting mitigation and ensures strong generalization. Collectively, these results establish a reliable technical foundation for real-world intelligent driving safety applications.
Tests on 1800 custom images and public datasets confirm the system successfully integrates spatial and temporal strengths. With critical errors restricted to only 1.2%, the parallel optimization architecture fully validates its reliability and practicality for high-safety fatigue monitoring tasks.
Table 5 presents performance benchmarks for the integrated YOLOv8 + GSconv + iTransformer + LSTM model against existing frameworks. Comparative analysis reveals that this hybrid approach consistently outperforms individual components and prior integrated models. Compared to the FD-YOLOv8 baseline utilizing YOLOv8 + GSconv, the proposed model demonstrates substantial gains, with mAP@0.5 rising from 64.1% to 88.3%, Precision increasing from 69.0% to 92.4%, and Recall jumping from 59.8% to 89.3% [46]. Furthermore, this study achieves a higher mAP than dedicated flame detection architectures, ensuring superior bounding box accuracy during attribute verification [47]. When measured against the specially designed YOLOv8s + LSTM, the current model yields a 56.9 percentage point higher mAP along with significant improvements in Precision and Recall [48]. These results confirm that the synergistic integration of spatiotemporal modeling and optimized convolution layers effectively maximizes detection robustness.

4. Conclusions

4.1. Research Summary

We established a standardized 13,200-image dataset across four fatigue levels using EAR, MAR, and head pose thresholds. For real-time detection, we developed a lightweight YOLOv8 model using GSConv and Slim Neck, reducing parameters by 32.3% and increasing speed by 15%. This was integrated with a hybrid LSTM-iTransformer architecture featuring differential attention, which improved noise suppression to 84.6% and temporal prediction accuracy to 90.1%. The final system employs a TensorRT-accelerated multi-process framework with dynamic weighted fusion, achieving 92.4% accuracy and a 9.5-fold reduction in processing time for high-resolution images. With single-frame latency optimized to 38 ms, the framework ensures robust, millisecond-level performance for vehicle-mounted fatigue monitoring.
This study achieved three major technical breakthroughs: First, GSConv group separable convolution and Slim Neck lightweight structure were introduced into the YOLOv8 object detection framework for the first time. Through feature pyramid network optimization and the channel shuffle mechanism, 92.4% detection accuracy was maintained while reducing parameter count by 32.3%. Second, an improved iTransformer temporal modeling method based on differential attention mechanism was innovatively proposed. Through cross-variable feature interaction and LSTM-FFN hybrid modules, the global contextual modeling capability for multi-source time series was effectively enhanced. Third, a comprehensive technical system was established, spanning from multi-source data acquisition and multi-level feature fusion model design to parallel computing acceleration and deployment.
Despite the promising results achieved on the multi-source fused dataset (totaling 13,200 images), this study acknowledges limitations pertaining to data diversity and generalization validation. The primary constraint lies in the composition of the custom-collected dataset, which, although providing high-quality annotations, comprises data from only three participants. This limited demographic scope may not fully capture the extensive physiological and behavioral variations present in the broader driving population, potentially affecting the model’s robustness and generalizability across unseen individuals and real-world scenarios. Furthermore, while the proposed dynamic weighted fusion mechanism demonstrates adaptive capabilities, the study’s evaluation of personalized adaptation remains preliminary. The reliance on fixed thresholds (e.g., EAR < 0.15), though effective within the collected data, may not be optimal for all individuals, highlighting the need for personalized calibration strategies to enhance accuracy and user-specific performance. The angle threshold-based method used for head pose detection lacks full adaptability to individual physiological differences and dynamic driving environments. Additionally, the resource scheduling efficiency of the multi-process parallel optimization scheme on low-computing-power embedded devices such as the Raspberry Pi requires further empirical validation. Future work will focus on large-scale cross-ethnic data collection, adaptive threshold algorithm design, and edge computing framework optimization to continuously improve system practicality and universality.
It is important to note that the current work focuses on fusing features from a single modality (visual video). While we integrate data from multiple sources (custom dataset, NITYMED, Fatigue Driving Dataset) to enhance diversity and robustness, the core features—eye closure, yawning, and head pose—are all extracted from the visual stream. A key direction for future research, as outlined in the next section, is to extend this framework to true multimodal fusion by incorporating physiological signals such as EEG or EKG, which could provide complementary information and further improve detection reliability in challenging conditions.

4.2. Future Improvement Directions

To address the limitations identified in this study, particularly concerning data diversity and personalized adaptation, and to propel the technology toward robust commercial deployment, future work will prioritize the following interconnected directions.
First, to rigorously evaluate the model’s cross-scenario generalization capability, we will embark on large-scale data collection campaigns involving dozens to hundreds of participants from diverse demographic backgrounds (e.g., varying age, gender, ethnicity). This expanded dataset, significantly exceeding the current scale in terms of participant diversity, is crucial for building a more universally applicable system. Furthermore, through multi-institutional collaboration, we aim to construct large-scale, cross-scenario datasets encompassing diverse demographics and driving conditions. This effort will facilitate rigorous validation of algorithmic generalization and support the establishment of industry-wide standards.
Second, building upon this enriched dataset, we will investigate adaptive threshold algorithms and continuous learning techniques to tackle the personalization challenge. The goal is to shift from static thresholds to dynamic, user-specific models that can calibrate based on individual baseline behaviors recorded during an initial setup phase, thereby significantly improving the precision of fatigue assessment for each driver. This aligns with the broader strategy of devising dynamic threshold adjustment algorithms based on driver-specific historical data to establish personalized fatigue assessment models, which overcomes the limitations of static thresholds and improves both detection accuracy and user experience.
Beyond these immediate priorities, future research will pursue additional strategic directions to advance technological innovation and expand applicability. This includes the integration of visual cues with physiological signals such as EEG and heart rate, employing cross-modal attention mechanisms to extract complementary information and enhance robustness in challenging conditions. To satisfy edge computing constraints, neural network pruning and quantization techniques will be implemented to develop embedded inference engines using frameworks such as TensorFlow Lite or ONNX Runtime, enabling efficient, low-power, real-time operation.
Regarding long-term research prospects, further efforts will focus on the collaborative optimization of spatiotemporal feature fusion and edge computing. Privacy-preserving fatigue detection schemes will be developed within federated learning frameworks, enabling distributed model training and updating while ensuring data security, thereby enhancing the reliability and universality of intelligent transportation systems.

Funding

This research received no external funding.

Institutional Review Board Statement

Informed consent was obtained from all subjects involved in the study.

Data Availability Statement

The original contributions presented in this study are included in the article. Further inquiries can be directed to the corresponding author.

Conflicts of Interest

The author declares no conflicts of interest.

References

  1. World Health Organization. Global Status Report on Road Safety 2023. 2023. Available online: https://iris.who.int/handle/10665/375016 (accessed on 18 October 2025).
  2. Li, R.; Chen, Y.V.; Zhang, L. A method for fatigue detection based on driver’s steering wheel grip. Int. J. Ind. Ergon. 2021, 82, 103083. [Google Scholar] [CrossRef]
  3. Zhang, H.; Dong, Y.; Liu, H.; Liu, B.; Deng, Y. A novel multi-scale mechanical model for fatigue expansion of corroded high-strength steel wires. Constr. Build. Mater. 2026, 514, 145567. [Google Scholar] [CrossRef]
  4. Zhang, H.; Zhao, L.; Chen, F.; Luo, Y.; Xiao, X.; Liu, Y.; Deng, Y. A machine learning and multi-source authentic data-driven framework for accurate fatigue life prediction of welds in existing steel bridge decks. Thin-Walled Struct. 2026, 222, 114559. [Google Scholar] [CrossRef]
  5. McDonald, A.D.; Lee, J.D.; Schwarz, C.; Brown, T.L. A contextual and temporal algorithm for driver drowsiness detection. Accid. Anal. Prev. 2018, 113, 25–37. [Google Scholar] [CrossRef] [PubMed]
  6. Li, Z.; Chen, L.; Nie, L.; Yang, S.X. A novel learning model of driver fatigue features representation for steering wheel angle. IEEE Trans. Veh. Technol. 2022, 71, 269–281. [Google Scholar] [CrossRef]
  7. Chen, J.; Cui, Y.; Wei, C.; Polat, K.; Alenezi, F. Advances in EEG-based emotion recognition: Challenges, methodologies, and future directions. Appl. Soft Comput. 2025, 180, 113478. [Google Scholar] [CrossRef]
  8. Ding, X.; Chen, G.; Wang, J.; Xu, Y.; Zhao, J.; Xu, W. Driving fatigue detection with three prefrontal EEG channels and deep learning model. In Proceedings of the 15th International Conference on Advanced Computational Intelligence, Seoul, Republic of Korea, 6–9 May 2023; IEEE: New York, NY, USA, 2023; pp. 1–5. [Google Scholar] [CrossRef]
  9. Wang, H.; Wu, C.; Li, T.; He, Y.; Chen, P.; Bezerianos, A. Driving fatigue classification based on fusion entropy analysis combining EOG and EEG. IEEE Access 2019, 7, 61975–61986. [Google Scholar] [CrossRef]
  10. Chen, J.; Fan, F.; Wei, C.; Polat, K.; Alenezi, F. Decoding driving states based on normalized mutual information features and hyperparameter self-optimized Gaussian kernel-based radial basis function extreme learning machine. Chaos Solitons Fractals 2025, 199, 116751. [Google Scholar] [CrossRef]
  11. Murali, E.; Vignesh, C.G.; Varma, G.P. Driver drowsiness detection using YOLO. In Proceedings of the 10th International Conference on Advanced Computing and Communication Systems, Coimbatore, India, 14–15 March 2024; IEEE: New York, NY, USA, 2024; pp. 1608–1612. [Google Scholar] [CrossRef]
  12. Li, R.; Xu, C.; Qin, X.; An, X.; Zhao, J.; Chuai, W.; Liu, B. YOLO-SGC: A dangerous driving behavior detection method with multiscale spatial-channel feature aggregation. IEEE Sens. J. 2024, 24, 36044–36056. [Google Scholar] [CrossRef]
  13. Rampavan, M.; Ijjina, E.P. An improved genetic algorithm based deep learning model with you only look once framework for driver distraction detection. Eng. Appl. Artif. Intell. 2025, 160, 111932. [Google Scholar] [CrossRef]
  14. Yaseen, M. What is YOLOv8: An in-depth exploration of the internal features of the next-generation object detector. arXiv 2024. [Google Scholar] [CrossRef]
  15. Hussain, M. YOLOv1 to v8: Unveiling each variant–A comprehensive review of YOLO. IEEE Access 2024, 12, 42816–42833. [Google Scholar] [CrossRef]
  16. Redmon, J.; Divvala, S.; Girshick, R.; Farhadi, A. You only look once: Unified, real-time object detection. In Proceedings of the IEEE Conference on Computer Vision and Pattern Recognition, Las Vegas, NV, USA, 27–30 June 2016; IEEE: New York, NY, USA, 2016; pp. 779–788. [Google Scholar] [CrossRef]
  17. Swathi, Y.; Challa, M. YOLOv8: Advancements and innovations in object detection. In Smart Trends in Computing and Communications: SmartCom 2024. Lecture Notes in Networks and Systems; Senjyu, T., So-In, C., Joshi, A., Eds.; Springer: Singapore, 2024; Volume 946. [Google Scholar] [CrossRef]
  18. Glenn, J.; Ayush, C.; Alex, S.; Jing, Q. YOLOv5 Release Notes: SPPF Implementation; Ultralytics Documentation: Madrid, Spain, 2023; Available online: https://docs.ultralytics.com/yolov5/ (accessed on 18 October 2025).
  19. Neubeck, A.; Van Gool, L. Efficient non-maximum suppression. In Proceedings of the 18th International Conference on Pattern Recognition, Hong Kong, China, 20–24 August 2006; IEEE: New York, NY, USA, 2006; pp. 850–855. [Google Scholar] [CrossRef]
  20. Li, H.; Li, J.; Wei, H.; Liu, Z.; Zhan, Z.; Re, Q. Slim-neck by GSConv: A lightweight-design for real-time detector architectures. J. Real-Time Image Process. 2024, 21, 62. [Google Scholar] [CrossRef]
  21. Huang, D.; Tu, Y.; Zhang, Z.; Ye, Z. A lightweight vehicle detection method fusing GSConv and coordinate attention mechanism. Sensors 2024, 24, 2394. [Google Scholar] [CrossRef]
  22. Jun, E.S.; Sim, H.J.; Moon, S.J. Advancing YOLOv8-based wafer notch-angle detection using oriented bounding boxes, hyperparameter tuning, architecture refinement, and transfer learning. Appl. Sci. 2025, 15, 11507. [Google Scholar] [CrossRef]
  23. Yuan, Z.; Ning, H.; Tang, X.; Yang, Z. GDCP-YOLO: Enhancing steel surface defect detection using lightweight machine learning approach. Electronics 2024, 13, 1388. [Google Scholar] [CrossRef]
  24. Howard, A.G.; Zhu, M.; Chen, B.; Kalenichenko, D.; Wang, W.; Weyand, T.; Andreetto, M.; Adam, H. MobileNets: Efficient convolutional neural networks for mobile vision applications. arXiv 2017, arXiv:1704.04861. [Google Scholar] [CrossRef]
  25. Zhang, X.; Zhou, X.; Lin, M.; Sun, J. ShuffleNet: An extremely efficient convolutional neural network for mobile devices. In Proceedings of the IEEE Conference on Computer Vision and Pattern Recognition, Salt Lake City, UT, USA, 18–23 June 2018; IEEE: New York, NY, USA, 2018; pp. 6848–6856. [Google Scholar] [CrossRef]
  26. Xue, R.; Wang, L. Research on Lightweight Citrus Leaf Pest and Disease Detection Based on PEW-YOLO. Processes 2025, 13, 1365. [Google Scholar] [CrossRef]
  27. Yang, F.; Pan, L.; Cui, H.; Zhang, L. An improved lightweight tiny-person detection network based on YOLOv8: IYFVMNet. Front. Phys. 2025, 13, 1553224. [Google Scholar] [CrossRef]
  28. Lee, Y.; Hwang, J.W.; Lee, S.; Bae, Y.; Park, J. An energy and GPU-computation efficient backbone network for real-time object detection. In Proceedings of the IEEE/CVF Conference on Computer Vision and Pattern Recognition Workshops (CVPRW), Long Beach, CA, USA, 16–17 June 2019; IEEE: New York, NY, USA, 2019; pp. 752–760. [Google Scholar]
  29. Wang, C.Y.; Liao, H.Y.M.; Wu, Y.H.; Chen, P.Y.; Hsieh, J.W.; Yeh, I.H. CSPNet: A new backbone that can enhance learning capability of CNN. In Proceedings of the IEEE/CVF Conference on Computer Vision and Pattern Recognition Workshops, Seattle, WA, USA, 14–19 June 2020; IEEE: New York, NY, USA, 2020; pp. 1571–1580. [Google Scholar] [CrossRef]
  30. Rumelhart, D.; Hinton, G.; Williams, R. Learning representations by back-propagating errors. Nature 1986, 323, 533–536. [Google Scholar] [CrossRef]
  31. Lipton, Z.C.; Berkowitz, J.; Elkan, C. A critical review of recurrent neural networks for sequence learning. arXiv 2015, arXiv:1506.00019. [Google Scholar] [CrossRef]
  32. Werbos, P.J. Backpropagation through time: What it does and how to do it. Proc. IEEE 2002, 78, 1550–1560. [Google Scholar] [CrossRef]
  33. Hochreiter, S.; Schmidhuber, J. Long short-term memory. Neural Comput. 1997, 9, 1735–1780. [Google Scholar] [CrossRef]
  34. Van Houdt, G.; Mosquera, C.; Nápoles, G. A review on the long short-term memory model. Artif. Intell. Rev. 2020, 53, 5929–5955. [Google Scholar] [CrossRef]
  35. Lafraxo, S.; El Ansari, M.; Koutti, L. Computer-aided system for bleeding detection in WCE images based on CNN-GRU network. Multimed. Tools Appl. 2023, 83, 21081–21106. [Google Scholar] [CrossRef]
  36. Shrestha, A.; Serra, E.; Spezzano, F. Multi-modal social and psycho-linguistic embedding via recurrent neural networks to identify depressed users in online forums. Netw. Model. Anal. Health Inf. Bioinform. 2020, 9, 22. [Google Scholar] [CrossRef]
  37. Liu, Y.; Hu, T.; Zhang, H.; Wu, H.; Wang, S.; Ma, L.; Long, M. iTransformer: Inverted transformers are effective for time series forecasting. arXiv 2023, arXiv:2310.06625. [Google Scholar]
  38. Vaswani, A.; Shazeer, N.; Parmar, N.; Uszkoreit, J.; Jones, L.; Gomez, A.N.; Kaiser, Ł.; Polosukhin, I. Attention is all you need. In Proceedings of the Advances in Neural Information Processing Systems, Long Beach, CA, USA, 4–9 December 2017; pp. 5998–6008. [Google Scholar]
  39. Lu, G.; Ou, Y.; Li, W.; Zeng, X.; Zhang, Z.; Huang, D.; Kotenko, I. An inverted transformer framework for aviation trajectory prediction with multi-flight mode fusion. Aerospace 2025, 12, 319. [Google Scholar] [CrossRef]
  40. Liu, Z.; Xu, X.; Qiao, P.; Li, D. Acceleration for deep reinforcement learning using parallel and distributed computing: A survey. ACM Comput. Surv. 2025, 57, 91. [Google Scholar] [CrossRef]
  41. Beijing Academy of Artificial Intelligence. Parallelism; Beijing Academy of Artificial Intelligence: Beijing, China, 2022; Available online: https://hub.baai.ac.cn/view/16225 (accessed on 4 February 2026).
  42. You, K.; Long, M.; Wang, J.; Jordan, M.I. How does learning rate decay help modern neural networks? arXiv 2019, arXiv:1908.01878. [Google Scholar] [CrossRef]
  43. Petrellis, N.; Christakos, P.; Zogas, S.; Mousouliotis, P.; Keramidas, G.; Voros, N.; Antonopoulos, C. Challenges towards hardware acceleration of the deformable shape tracking application. In Proceedings of the 29th International Conference on Very Large Scale Integration, Singapore, 4–7 October 2021; IEEE: New York, NY, USA, 2021; pp. 1–4. [Google Scholar] [CrossRef]
  44. Petrellis, N. NITYMED (Night-Time Yawning–Microsleep–Eyeblink–Driver Distraction) [Data Set]; ESDA Lab, University of Patras: Patras, Greece, 2022; Available online: https://datasets.esdalab.ece.uop.gr (accessed on 18 October 2025).
  45. Shumingjingyi. Fatigue Driving Dataset [Data Set]; Baidu AI Studio: Beijing, China, 2021; Available online: https://aistudio.baidu.com/datasetdetail/85880 (accessed on 18 October 2025).
  46. Li, L.; Liu, Z.; Ruan, Y.; Chen, B. FD-YOLOv8: An improved fire detection model based on YOLOv8n. In Proceedings of the 8th International Conference on Advanced Algorithms and Control Engineering, Shanghai, China, 21–23 March 2025; IEEE: New York, NY, USA, 2025; pp. 1302–1306. [Google Scholar] [CrossRef]
  47. Sun, W.; Gao, H.; Li, C. High-performance real-time fire detection and forecasting framework for industrial cables. Fire Saf. J. 2024, 148, 104228. [Google Scholar] [CrossRef]
  48. Lu, F.; Zeng, C.; Shi, H.; Xu, Y.; Fu, S. Real-time detection sensor for unmanned aerial vehicle using an improved YOLOv8s algorithm. Sensors 2025, 25, 6246. [Google Scholar] [CrossRef] [PubMed]
Figure 1. Architecture diagram of the spatiotemporal feature fusion model of improved YOLOv8 and LSTM.
Symmetry 18 00909 g001
Figure 2. Yolov8 Flowchart (Modified based on [14,15]).
Symmetry 18 00909 g002
Figure 3. Yolov8 architecture diagram(Modified based on [14]).
Symmetry 18 00909 g003
Figure 4. GSConv architecture diagram (Modified based on [20]).
Symmetry 18 00909 g004
Figure 5. Slim neck architecture diagram (Modified based on [27]).
Symmetry 18 00909 g005
Figure 6. RNN architecture diagram (Modified based on [31]).
Symmetry 18 00909 g006
Figure 7. LSTM architecture diagram (Modified based on [31]).
Symmetry 18 00909 g007
Figure 8. LSTM-Enhanced iTransformer Architecture for Temporal Sequence Modeling (Modified based on [39]).
Symmetry 18 00909 g008
Figure 9. Multi-process Parallel Fatigue Detection System Architecture Based on ProcessPoolExecutor (Modified based on [41]).
Symmetry 18 00909 g009
Figure 10. Sample Images of Driver Facial Features.
Symmetry 18 00909 g010
Figure 11. NITYMED [43,44]. Comparison of driver states across four fatigue levels: Fatigue, Relatively Fatigue, Alert, and Relatively Alert (from left to right).
Symmetry 18 00909 g011
Figure 12. Fatigue Driving Dataset [45]. Comparison of driver states across four fatigue levels: Fatigue, Relatively Fatigue, Alert, and Relatively Alert (from left to right).
Symmetry 18 00909 g012
Figure 13. Dlib-based extraction of 68 keypoints on the face.
Symmetry 18 00909 g013
Figure 14. Eye Aspect Ratio Feature Extraction Points.
Symmetry 18 00909 g014
Figure 15. (A) EAR feature analysis showing time series variations; (B) Multi-channel detection comparisons; (C) Correlations with various physiological parameters.
Symmetry 18 00909 g015
Figure 16. PERCLOS detection utilizes two threshold lines: half-closed (P80) and closed (P20). The temporal progression is defined by four key intervals: t1 and t4 represent the time from full opening to the first and second P80 crossings, respectively; t2 and t3 track the corresponding durations to the P20 crossings. These metrics collectively quantify the dynamics of eye closure for fatigue assessment.
Symmetry 18 00909 g016
Figure 17. Mouth Feature Points Annotation Diagram.
Symmetry 18 00909 g017
Figure 18. Results of fatigue state multi-feature fusion detection.
Symmetry 18 00909 g018
Figure 19. Head Pose and Fatigue State Real-time Monitoring Interface.
Symmetry 18 00909 g019
Figure 20. Facial Feature State Annotation Examples.
Symmetry 18 00909 g020
Figure 21. Hardware environment.
Symmetry 18 00909 g021
Figure 22. YOLO training result graph.
Symmetry 18 00909 g022
Figure 23. PR curve comparison of YOLOv8 and Improved YOLOv8.
Symmetry 18 00909 g023
Table 1. Fatigue state classification criteria and sample distribution after fusion of multi-source datasets.
Standard of ClassificationSample CharacteristicsSample SizeStandard for Evaluation
AlertOpen_eyes + Closed_mouth + Straight_head33004 points
Relatively alertOne fatigue characteristic appears32503 points
FatigueTwo fatigue characteristics appear33502 points
Relatively FatigueClosed_eyes + Open_mouth + Tilted_head33001 point
Table 2. Schematic diagram of software component names and version configurations.
Classified by FunctionName of Software ComponentVersion/Configuration
OSRaspberry Pi
OS
bit Bullseye version
Linux kernel5.15
Core development environmentPython3.9.2
PyTorch1.11.0 (ARM Architecture Optimized Compilation)
Computer vision componentsOpenCV4.5.4 (Enable GTK + 3.0/V4L2 support)
Libcamera driver stack2.4.1
Lightweight deployment frameworkTensorFlow Lite2.8.0
Service interface layerFlask2.1.2 (RESTful API)
Development toolchainThonny IDE3.3.13 (Hardware-level Debugging)
VNC Server6.10.1 (Remote Access)
Git2.30.2
Package managementInstallation sourceapt-get/pip3 (Official Source Verification)
Architectural compatibilityCross-compilation supports ARMv8
Table 3. The performance evaluation results of the improved YOLOv8 + GSConv + Slim Neck model ((A) overall performance indicators; (B) classification performance of each fatigue state; (C) Key feature detection performance).
(A)
Evaluation
Indicators
Original YOLOv8Improved YOLOv8 + GSConv + Slim NeckPerformance Improvement
Comprehensive accuracy rate85.6%88.2%+2.6%
Comprehensive recall rate82.3%84.7%+2.4%
Comprehensive F1 score83.9%86.4%+2.5%
The number of parameters-32.3%Parameters reduced by 32.3%
Optimal confidence threshold0.550.68Slightly lifted
(B)
Fatigue State CategorySignalmentPrecision (%)Recall (%)F1-Score (%)
Alert (4 points)Normal driving state90.192.491.2
Relatively alert (3 points)Mild signs of fatigue80.782.581.6
Fatigue (2 points)Obvious fatigue characteristics78.565.571.4
Relatively fatigue (1 point)Severe fatigue state62.770.866.5
(C)
Feature TypeAccuracy Rate Before Optimization (%)Detection Accuracy Rate (%)
Eye closure state80.386.4
Yawning in the mouth75.784.0
Head tilt state70.778.9
Subtle changes in the eyes82.288.7
Table 4. Evaluation results of LSTM + improved iTransformer for time series modeling performance ((A) overall performance indicators; (B) Key feature timing modeling performance).
(A)
Evaluation IndicatorsOriginal iTransformerLSTM + Improved iTransformerPerformance Improvement
Comprehensive accuracy rate85.1%92.4%+7.3%
Comprehensive recall rate81.4%89.3%+7.9%
Comprehensive F1 score83.4%90.5%+7.1%
Noise suppression rate71.3%84.6%13.3%
Sequence processing frame count10001300+30%
(B)
Accuracy of Traditional LSTMAccuracy of Traditional LSTMSequence Recognition Accuracy Rate (%)
Characteristic sequence of eye fatigue81.492.6
Characteristic sequence of mouth fatigue75.584.7
Abnormal sequence of head posture71.383.3
Progressive fatigue sequence78.685.7
Table 5. Parallel Optimization of The Overall Performance Evaluation Results of The System. (A) Overall Performance Indicators; (B) Classification performance of each fatigue state system; (C) System performance optimization effect; (D) Train convergence analysis; (E) Comparison results of parallel computing optimization reasoning performance; (F) Performance analysis of different optimization strategies; (G) Analysis Of Hardware Resource Utilization Rate; (H) Comparative experiments with different models.
(A)
Evaluation IndicatorsSingle YOLOv8Single LSTMParallel Optimization SystemPerformance Improvement
Comprehensive accuracy rate85.6%85.1%92.4%+7.3%
Comprehensive recall rate82.3%81.4%89.3%+7.9%
Comprehensive F1 score83.9%83.4%90.5%+7.1%
Single-frame processing timeAbout 35 ms45 ms38 ms−15.6%
mAP@0.582.5%81.0%88.3%+6.8%
(B)
Fatigue State CategoryPrecision (%)Recall
(%)
F1-Score
(%)
Safety Assessment
Alert
(4 points)
93.791.492.7Stable recognition in normal state
Relatively alert (3 points)88.786.687.5Early warning is effective
Fatigue (2 points)83.181.482.1Accurate capture of key states
Relatively fatigue (1 point)78.576.477.8Dangerous conditions are identified in a timely manner
(C)
Optimization ModuleMap Value (%)
Eye feature detection86.4
Mouth feature detection84.0
Head posture detection78.9
Four-level fatigue classification90.5
(D)
Loss Function TypeInitial ValueConvergency ValueConvergence PerformanceModel Stability
Spatial detection bounding box loss2.150.32Fast convergence speedHigh stability
Spatial detection classification loss1.830.24Good convergence performanceGood stability
Time series modeling predicts losses1.970.38The convergence speed is relatively fastRelatively high stability
Comprehensive system loss1.980.29Fast convergence speedHigh stability
(E)
Optimization StrategyProcessing MethodImage QuantityImage SizePreprocessing (ms)Inference (ms)Post-Processing (ms)Total Time (s)
Unclipped Original ImageSingle Process PT Model2204096 × 30722.99.51.755.67
Unclipped Original ImageMulti-Process PT Model (11 processes)2204096 × 30722.96.01.113.04
Intelligent Cropping OptimizationSingle Process PT Model219384 × 5121.15.71.63.49
Intelligent Cropping OptimizationMulti-Process PT Model (11 processes)2409384 × 5120.75.71.58.45
TensorRT AccelerationSingle Process Engine Model219384 × 5121.11.31.62.18
TensorRT AccelerationMulti-Process Engine Model (5 processes)1314384 × 5120.61.10.95.86
(F)
Optimization DimensionKey ParametersPerformance MetricsOptimization Effect
Parallel ComputingMaximum 11 processesProcessing time 55.67 s → 13.04 sEfficiency improvement 326%
Image PreprocessingSize 4096 × 3072 → 384 × 512Single inference 14 ms → 8.4 msComputational load reduction 40%
Model OptimizationPT → ONNX → EngineInference time 9.5 ms → 1.3 msInference speed improvement 86%
Comprehensive OptimizationCropping + Parallel + TensorRTTotal processing 55.67 s → 5.86 sOverall efficiency improvement 9.5 times
(G)
Resource TypeSingle Process UtilizationMulti-Process UtilizationResource Optimization StrategyPerformance Benefit
GPU Memory (24 GB)~15%~85%Multi-process parallel loadingMemory utilization improvement 5.7×
GPU Computing Core~25%~90%Parallel inference executionComputing efficiency improvement 3.6×
CPU Multi-core~10%~70%Multi-process task allocationCPU utilization improvement 7×
Memory Bandwidth~20%~75%Batch data transmissionBandwidth efficiency improvement 3.75×
(H)
ModelmAP@50/%Precision/%Recall/%Average Absolute Percentage Error/%MAPE/%
Faster RCNN43.7\\\\
YOLOv5n60.665.256.8\\
YOLOv7-tiny61.464.357.7\\
YOLOv8n60.969.359.1\\
FD-YOLOv8 (GSconv)64.169.059.8\\
YOLOv8s28.941.330.8\\
YOLOv8s-LSTM31.443.233.4\\
YOLOv8 + iTransformer (Flame height)\\\3.49–10.64 11.18–15.06
YOLOv8 + iTransformer (Flame width)\\\2.45–8.89 4.35–8.18
YOLOv8 + iTransformer (Flame longitudinal position)\\\1.61–9.313.37–6.62
Disclaimer/Publisher’s Note: The statements, opinions and data contained in all publications are solely those of the individual author(s) and contributor(s) and not of MDPI and/or the editor(s). MDPI and/or the editor(s) disclaim responsibility for any injury to people or property resulting from any ideas, methods, instructions or products referred to in the content.