1. Introduction
The classic Fuzzy C-Means (FCM) algorithm [
1,
2] operates under the implicit assumption that all features contribute equally to the definition of clusters. This assumption is frequently deemed unrealistic in real-world datasets, which are often characterized by heterogeneous, redundant, or irrelevant features. In order to surmount this limitation, a number of studies have proposed variants of FCM based on the introduction of features associated with weights. The objective of this approach is to adapt the distance metric to the data structure.
In recent years, several weighted variations of FCM have been proposed with the objective of balancing the importance of features in cluster construction. A weighted FCM feature selection method based on the principle of refined justifiable granularity, measuring the significance of features in the feature space, is proposed in [
3]. In [
4], a classification method is proposed that integrates a weighted FCM algorithm and an enhanced adaptive neuro-fuzzy inference model for the classification of chronic kidney disease. In [
5], an algorithm based on a dissimilarity measure is employed for the purpose of clustering gene expression data.
A significant constraint of these methodologies is the complexity involved in assigning a semantic interpretation to the clusters. To address this limitation, Keller and Klawonn [
6] propose a model in which each feature possesses a cluster-dependent weight, that is, a distinct parameter for each feature–cluster pair. In this formulation, each cluster is characterized by its own relevant subspaces. Furthermore, features may possess differing levels of importance across different clusters. This approach exhibits a greater degree of expressiveness in comparison with FCM; however, it concomitantly introduces novel challenges, including a substantial augmentation in the number of parameters, a heightened computational complexity, and an augmented sensitivity to noise and initialization.
In [
7], a weight learning mechanism based on optimization techniques (e.g., gradient descent) is proposed, showing that an appropriate weight assignment can improve clustering quality compared to the standard FCM. This algorithm has been demonstrated to exhibit superior speed and resilience to noise compared to [
6]. However, it should be noted that these weights are global, which means they do not take into account the differences between clusters. Additionally, the estimation of these weights can be unstable and dependent on the initialization process.
In order to enhance the interpretability of the clusters, an entropy-weighted FCM variation based on entropy regularization, termed Entropy-Weighted Fuzzy C-Means (EWFCM), is proposed in [
8]. This approach involves differentiating the weight of the features between the clusters. In EWFCM, feature weights are determined on a per-cluster basis and undergo an exponential transformation of feature costs; an entropy term is incorporated to circumvent degenerate solutions. EWFCM demonstrates superior robustness in comparison with non-regularized methods and exhibits enhanced adaptability in the context of high-dimensional data. Nonetheless, the model exhibits considerable limitations. Primarily, it possesses a high degree of computational complexity. Indeed, the number of model parameters is proportional to the product of the number of features and the number of clusters. This results in a high cost per iteration, protracted convergence times, and suboptimal scalability when dealing with large datasets.
In order to manage high-dimensional datasets, a feature-weighted entropy FCM method was proposed in [
9]. This method allows for the reduction of the feature space by removing irrelevant features with small weights. This method automatically calculates individual feature weights while reducing redundant feature components, thereby enabling the clustering of high-dimensional features.
In [
10], a variation of EWFCM is proposed. In this variation, a subset of the feature space is extracted, and a weight is allocated to each feature dimension based on the feature’s impact on clustering. In [
11], an automatic local feature weighting and cluster weighting mechanism is proposed to properly weigh the features and to attenuate the initialization sensitivity of FCM.
An adaptive feature-weighted entropy FCM algorithm for image segmentation is applied in [
12] to mitigate the contribution of less significant features. The authors employ a distance metric that incorporates both Euclidean and non-Euclidean distances.
In [
13], a novel weighted FCM is proposed, in which an objective function is utilized that is based on a feature-weighted generalized entropy regularization strategy.
These approaches, while endeavoring to reduce the computational complexity of EWFCM, fail to fully capture the semantics of the data and efficiently optimize the interpretability of the results. Additionally, their computational complexity remains high, rendering them ill-suited for the management of high-dimensional datasets.
Table 1 summarize the characteristics, strengths, and limitations of the existing method types. In particular, while EWFCM offers high flexibility thanks to cluster-specific weighting, it suffers from increased computational complexity and limited interpretability.
In a multitude of real-world application contexts, datasets manifest an inherent structural organization, wherein variables can be naturally classified into homogeneous semantic groups. These sets reflect well-defined conceptual categories and not simple arbitrary aggregations of features.
For instance, the criteria employed to assess and appraise the quality of drinking water can be categorized into several domains. These domains include physical characteristics, such as temperature, turbidity, and color; chemical characteristics, such as pH, fixed residue, and hardness; chemical–toxicological characteristics, such as the concentration of heavy metals and organic pollutants; and microbiological characteristics, such as bacterial concentrations and indicators of environmental contamination.
The grouped FCM algorithm [
6] while adapting to this natural way of grouping features into categories, does not capture the different influences of the features in a group, since all the features within a group are treated in the same way, which reduces the model’s ability to capture heterogeneous feature relevance.
In this scenario, traditional fuzzy clustering methods and their feature-weighted extensions, such as EWFCM, treat variables independently, neglecting the hierarchical or semantic structure of the data.
In order to overcome this limitation, a variation of EWFCM was proposed. This variation is referred to as Group-based EWFCM (GEWFCM). GEWFCM introduces a two-level weighting mechanism. In this mechanism, feature groups represent higher-level semantic units. Furthermore, features within each group contribute relatively to the representation of clusters.
In the proposed model, the explicit introduction of groups enables the objective function to be modeled consistently with the data structure. Specifically, the weight assigned to a feature is expressed as the product of the weight assigned to the group to which the feature belongs and the weight of the feature within that group.
In comparison to EWFCM, in which weights are defined independently for each cluster and each feature, the proposed model introduces a structural regularization that reduces uncontrolled weight variability and improves solution stability.
Unlike existing feature-weighted approaches, the proposed GEWFCM does not simply reduce the number of parameters but introduces a structurally constrained weighting model that explicitly reflects the semantic organization of the feature space. In particular, while EWFCM assigns feature weights independently for each cluster, GEWFCM decomposes feature importance into two complementary components: a group-level weight and an intra-group feature weight. This formulation allows the model to capture both the relevance of semantic dimensions and the contribution of individual features within each dimension.
This represents a conceptual shift from unstructured feature weighting to semantically guided clustering. As a result, GEWFCM not only reduces the dimensionality of the optimization problem, but also improves the stability of the solution and provides a more interpretable representation of clusters.
Furthermore, compared to existing grouped approaches, GEWFCM overcomes the limitation of uniform feature importance within groups by introducing intra-group weighting, thereby enabling a more flexible and accurate modelling of heterogeneous feature relevance.
A further objective of the method is to improve the interpretability of the results. In the context of EWFCM, the weights are designated as cluster-specific, not constrained by a semantic structure. This implies that each cluster is characterized by combinations of features that are challenging to interpret and may not be consistent with each other.
In contrast, in GEWFCM, the weights are cluster independent. The group weights provide a direct measure of the importance of each semantic dimension, determining which dimensions of the phenomenon are relevant. The intra-group weights allow us to identify the most relevant features within each group and determine which specific variables contribute to the definition of the clusters. This dual structure is intended to ensure greater semantic interpretability of the clusters.
Additionally, the independence of the weights from the clusters results in enhanced computational efficiency in comparison to EWFCM. This results in a significant reduction in the dimensionality of the optimization problem, greater numerical stability, and shorter convergence times, making GEWFCM suitable for handling high-dimensional data.
In summary, the proposed method is characterized by two main contributions:
Improved interpretability: Partitioning features into groups allows for better semantic meaning to be assigned to clusters. This dual structure enables a two-level interpretation of clusters: a global level for groups, which allows us to determine which dimensions of the phenomenon are relevant, and a local level consisting of features within a group, which allows us to determine which group-specific variables contribute to the definition of a cluster.
Higher computational efficiency: Indeed, the number of parameters is reduced compared to cluster-specific models like EWFCM. The independence of the weights from clusters reduces computational cost, especially when dealing with many clusters.
GEWFCM has been tested as an unsupervised classifier for classifying urban settlements based on a set of residential building characteristics acquired from the population and building census dataset compiled by the Italian National Statistical Institute (ISTAT). The information on residential buildings is summarized by census zone; for each characteristic, the number of residential buildings with that characteristic located in each census zone is measured. These characteristics are grouped into five types: construction technique, construction period, number of floors, number of interiors, and state of conservation.
After introducing the EWFCM algorithm in
Section 2,
Section 3 discusses the proposed algorithm in detail and describes the case studies used.
Section 4 presents the test results and discusses the comparative results.
Section 5 includes concluding remarks.
3. Materials and Methods
3.1. The GEWFCM Algorithm
Let be N samples. Let the p features partitioned into H disjoint semantic groups , where denotes the group to which the jth feature belongs.
GEWFCM introduces a two-level weighting mechanism. To each group is assigned a weight where and To the jth feature belonging to the group is assigned an intra-group weight where and .
The aggregate weight associated with the
jth feature is therefore defined as follows:
where the following constraint holds:
The objective function is given by
Here, is the fuzzy partition matrix, is the set of cluster centroids, and is the fuzzifier.
The parameter controls the entropy regularization of the group weights, whereas controls the entropy regularization of the intra-group feature weights. Small values of and promote concentrated weight distributions; large values produce smoother and more uniform distributions.
The convergence properties of GEWFCM are consistent with those of standard FCM and its weighted extensions. GEWFCM follows an alternating optimization scheme, where the objective function is minimized with respect to one set of variables at a time while keeping the others fixed.
Specifically, the algorithm alternates between the update of membership degrees, cluster centroids, intra-group feature weights, and group weights. Each of these steps corresponds to the solution of a constrained optimization problem, which ensures that the value of the objective function does not increase. Therefore, the sequence of objective function values J(t) at the iteration t is monotonically non-increasing and J(t+1)) ≤ J(t). Moreover, since the objective function is bounded from below, the sequence converges to a stationary point. Although global optimality cannot be guaranteed due to the non-convex nature of the problem, this property ensures the stability of the algorithm.
In particular, GEWFCM minimizes the objective function by an alternating optimization procedure. At iteration
, the aggregate weights are computed from (5) and normalized so that their sum is equal to one. The data are transformed according to the aggregate feature weights:
Standard FCM is applied to the transformed data, yielding the updated memberships
where
, and the centroids in the transformed space are
The centroids in the original feature space are then updated as
For fixed
and
, the intra-group weights are obtained by minimizing the part of the objective function that depends on the weights of the features belonging to the same group. The feature cost is defined as
The quantity measures the intra-cluster dispersion associated with the -th feature. Lower values of indicate that the feature is more effective in describing the cluster structure.
For each group
, the intra-group weights are obtained by minimizing the weight-dependent part of the objective function under the normalization constraint.
subject to
.
Introducing the Lagrange multiplier
, the Lagrangian is
The stationarity condition
leads to the closed-form update
The group cost of the hth group
is defined as the weighted average feature cost within the group:
The quantity measures the average intra-cluster dispersion of the features in group , weighted by their intra-group importance. Lower values of indicate that the corresponding semantic group provides a more informative description of the cluster structure.
For fixed
,
, and
, the group weights are obtained by solving
subject to
.
Introducing the Lagrange multiplier
, the Lagrangian is
The stationarity condition
yields the closed-form update
Finally, convergence is checked through the variation of the aggregate feature weights:
If , the iterative process stops; otherwise, the next iteration is performed.
Below, Algorithm 2 summarizes the GEWFCM procedure.
| Algorithm 2: GEWFCM |
| Input: Set of data points |
| Number of cluster C |
| Fuzzifier parameter m |
Entropy parameters and
Stop iteration error ε |
Output: Partition matrix
Centroids of the clusters
Group weights
Intra-group weights |
| Initialize (or, equivalently, the centroids), the group weights , and the intra-group weights |
| Repeat |
| | Compute the aggregate feature weights from (5) and normalize them |
| | Transform the data according to (8). |
| | Update the partition matrix by (9) |
| | Update the transformed centroids by (10) and the original centroids by (11). |
| | Update the original centroids by (11) |
| | Compute the feature costs by (12) |
| | Update the intra-group weights by (16) |
| | Compute the group costs by (17) |
| | Compute the weight variation by (22) |
| Until |
| Return |
From a computational standpoint, GEWFCM has a significant advantage over EWFCM. In EWFCM, the number of feature weights updated at each iteration is equal to , where is the number of features and is the number of clusters. In contrast, GEWFCM requires the update of weights per iteration, where is the number of semantic groups and typically .
Consequently, GEWFCM reduces the dimensionality of the optimization problem and generally leads to lower computational cost and faster convergence.
3.2. The Case Studies
GWEFCM has been tested to classify urban settlement zones based on residential building fabric characteristics. To this end, the population and building census datasets carried out by the Italian Institute of Statistics (ISTAT) in 2011 were utilized.
The objective of the present study was to conduct a series of tests. To this end, all information relating to the characteristics of residential buildings was extracted.
The information was grouped by census zone, and the samples included 16 Italian cities. Each piece of information corresponds to the number of residential buildings in the census zone that possess a specific characteristic.
The data have been standardized by dividing it by the total number of buildings in the census zone. Consequently, each feature will contain the frequency of residential buildings exhibiting a specific characteristic.
This normalization corresponds to a frequency-based scaling, which is particularly appropriate for this type of data, where each feature represents the relative frequency of a specific building characteristic within a census zone.
Alternative normalization techniques, such as min–max scaling or z-score standardization, could also be considered. However, these approaches may alter the semantic meaning of the features. In particular, z-score normalization assumes a Gaussian distribution and may introduce negative values, which are not meaningful for frequency-based variables. Min–max normalization, on the other hand, may reduce variability in the presence of outliers.
The adopted normalization preserves the relative proportions of the features within each census zone, which is essential for maintaining the interpretability of the clustering results. Preliminary tests showed that the proposed method is robust with respect to the choice of normalization, and the overall clustering structure remains stable. For these reasons, frequency-based normalization was selected as the most appropriate preprocessing step for this study.
The features were grouped into five groups, as specified in
Table 2.
In recent years, urban data analysis has increasingly leveraged advanced machine learning frameworks, including deep learning and spatial analytics techniques, for tasks such as urban morphology analysis and Transit-Oriented Development (TOD). These approaches enable the extraction of complex patterns from large-scale urban datasets.
For example, recent studies have explored the integration of clustering and representation learning methods to capture spatial and functional characteristics of urban environments [
16]. While these approaches are particularly effective for predictive modeling and large-scale pattern recognition, they often rely on complex architectures and may lack interpretability.
In this context, the proposed GEWFCM method provides a complementary approach, focusing on interpretable unsupervised clustering. By introducing a structured feature weighting mechanism based on semantic grouping, GEWFCM enables a meaningful description of urban patterns while maintaining computational efficiency.
In [
17] an unsupervised FCM-based classifier was tested to classify urban patterns based on residential building characteristics related to construction techniques and construction macro-periods.
In the experimental tests conducted on GWEFCM, all the characteristics of the residential buildings present in the datasets provided by ISTAT were considered separately.
For each municipality case study, the dataset was constructed including all the 26 features described in
Table 1, where the instances are the census zones into which the municipality is partitioned.
Each census zone will be assigned to the clustering to which it belongs with the highest membership degree.
GEWFCM was implemented using the Python ArcPy libraries from the GIS tool ArcGIS Pro 3.5.
The Xie–Beni validity index [
18,
19] was employed to ascertain the optimal number of clusters. Xie–Beni determines the optimal number of clusters by minimizing the ratio between the compactness of the clusters (intra-cluster variance) and the minimum separation between the cluster centers. Xie–Beni is the most widely used validity index in FCM to determine the optimal number of clusters [
20].
Several samplings were performed to determine the optimal values of the and parameters. In each trial, different combinations of the two parameters were set, and the combination that generated the minimum value of the Xie–Beni index was selected. The best values are obtained setting and .
To give semantic meaning to the clusters, the centroid values were normalized by dividing them by the sum of the centroid values of the features in the corresponding group. Then, a linguistic label is assigned as the relevance of each feature in a cluster in the following way.
Let vkj be the value of the jth component of the centroid of the kth cluster.
Let h(j) be the group in which the jth feature is inserted and let |h(j)| the cardinality of this group.
The relevance of the jth feature in the cluster is labeled as significant if vkj > 2/|h(j)|. Otherwise, it is labeled as not negligible if vkj > 1/|h(j)| or negligible if vkj ≤ 1/|h(j)|.
For example, suppose that in a given cluster the normalized values obtained for the Construction technique group features are d5 = 0.8, d6 = 0.15, d7 = 0.05. In this case, |h(j)| = 3 and the relevance of each of the three features in the cluster will be, respectively,
r5 = significant r6 = negligible r7 = negligible
This cluster will then group together urban areas with a significant prevalence of masonry buildings.
4. Results and Discussion
The experimental tests were carried out by acquiring ISTAT census data on building characteristics for the 16 most populous Italian cities. The data sources are the ISTAT census datasets conducted in 2011 on all Italian municipalities. They are available at
https://www.istat.it/notizia/basi-territoriali-e-variabili-censuarie, accessed on 1 February 2026.
For each city, a dataset was extracted containing data relating to the frequency of residential buildings with the characteristics described in
Table 1. For reasons of brevity, the results obtained for the cities of Genoa, Bari, and Naples are shown in detail and the results obtained for all cities are summarized.
In
Table 3, the values assigned to the GEWFCM parameters are shown.
As shown in [
21], although the optimal choice for the fuzzifier parameter m depends on the dataset, the optimal range is between 1.5 and 2.5, and the central value of m = 2 is considered a safe and robust choice; it is a well-established best practice in literature that ensures good management of uncertainties and overlaps in the data, avoiding both excessive crispness (m tending towards 1) and excessive blurriness (m greater than 2).
The value of the convergence threshold ε was set to 1 × 10⁻⁵ because it is small enough to ensure that the cluster centers have stabilized and do not undergo significant changes. A lower threshold would increase the number of iterations required for convergence, without significantly improving the quality of the clustering.
The group and feature entropy parameters and were selected through a systematic exploration over the range [1, 100]. For each combination of the two parameters, GEWFCM was executed and the corresponding Xie–Beni validity index was computed.
The optimal values were selected as those minimizing the Xie–Beni index. In addition, a sensitivity analysis was conducted to assess the robustness of the proposed method with respect to variations of and The experimental results show that the clustering structure remains stable over a relatively wide range of parameter values, indicating that the method is not overly sensitive to the specific choice of these parameters. This analysis confirms that the selected values of and provide a good trade-off between sparsity of the weights and stability of the clustering results.
Inn each test, a preprocessing phase is performed to determine the optimal number of clusters. This is accomplished by running GWEFCM while increasing the number of clusters from C = 2 to C = 10. The optimal number of clusters is obtained for the value of C that minimizes the Xie–Beni index.
We performed 20 independent runs of each algorithm with different random initializations for each test case. The results are reported in terms of average.
All experiments were conducted on a machine equipped with an Intel Core i7-12700K processor and 32 GB of RAM. The GEWFCM and EWFCM algorithms was implemented using the Python 3.13 programming language and the NumPy, SciPy, and scikit-learn libraries. The suite ESRI ArcGIS Pro 10.3 release was used to construct all the thematic maps. Both GEWFCM and EWFCM were implemented in the same environment and executed under identical conditions to ensure a fair comparison.
4.1. Building Classification of Genoa
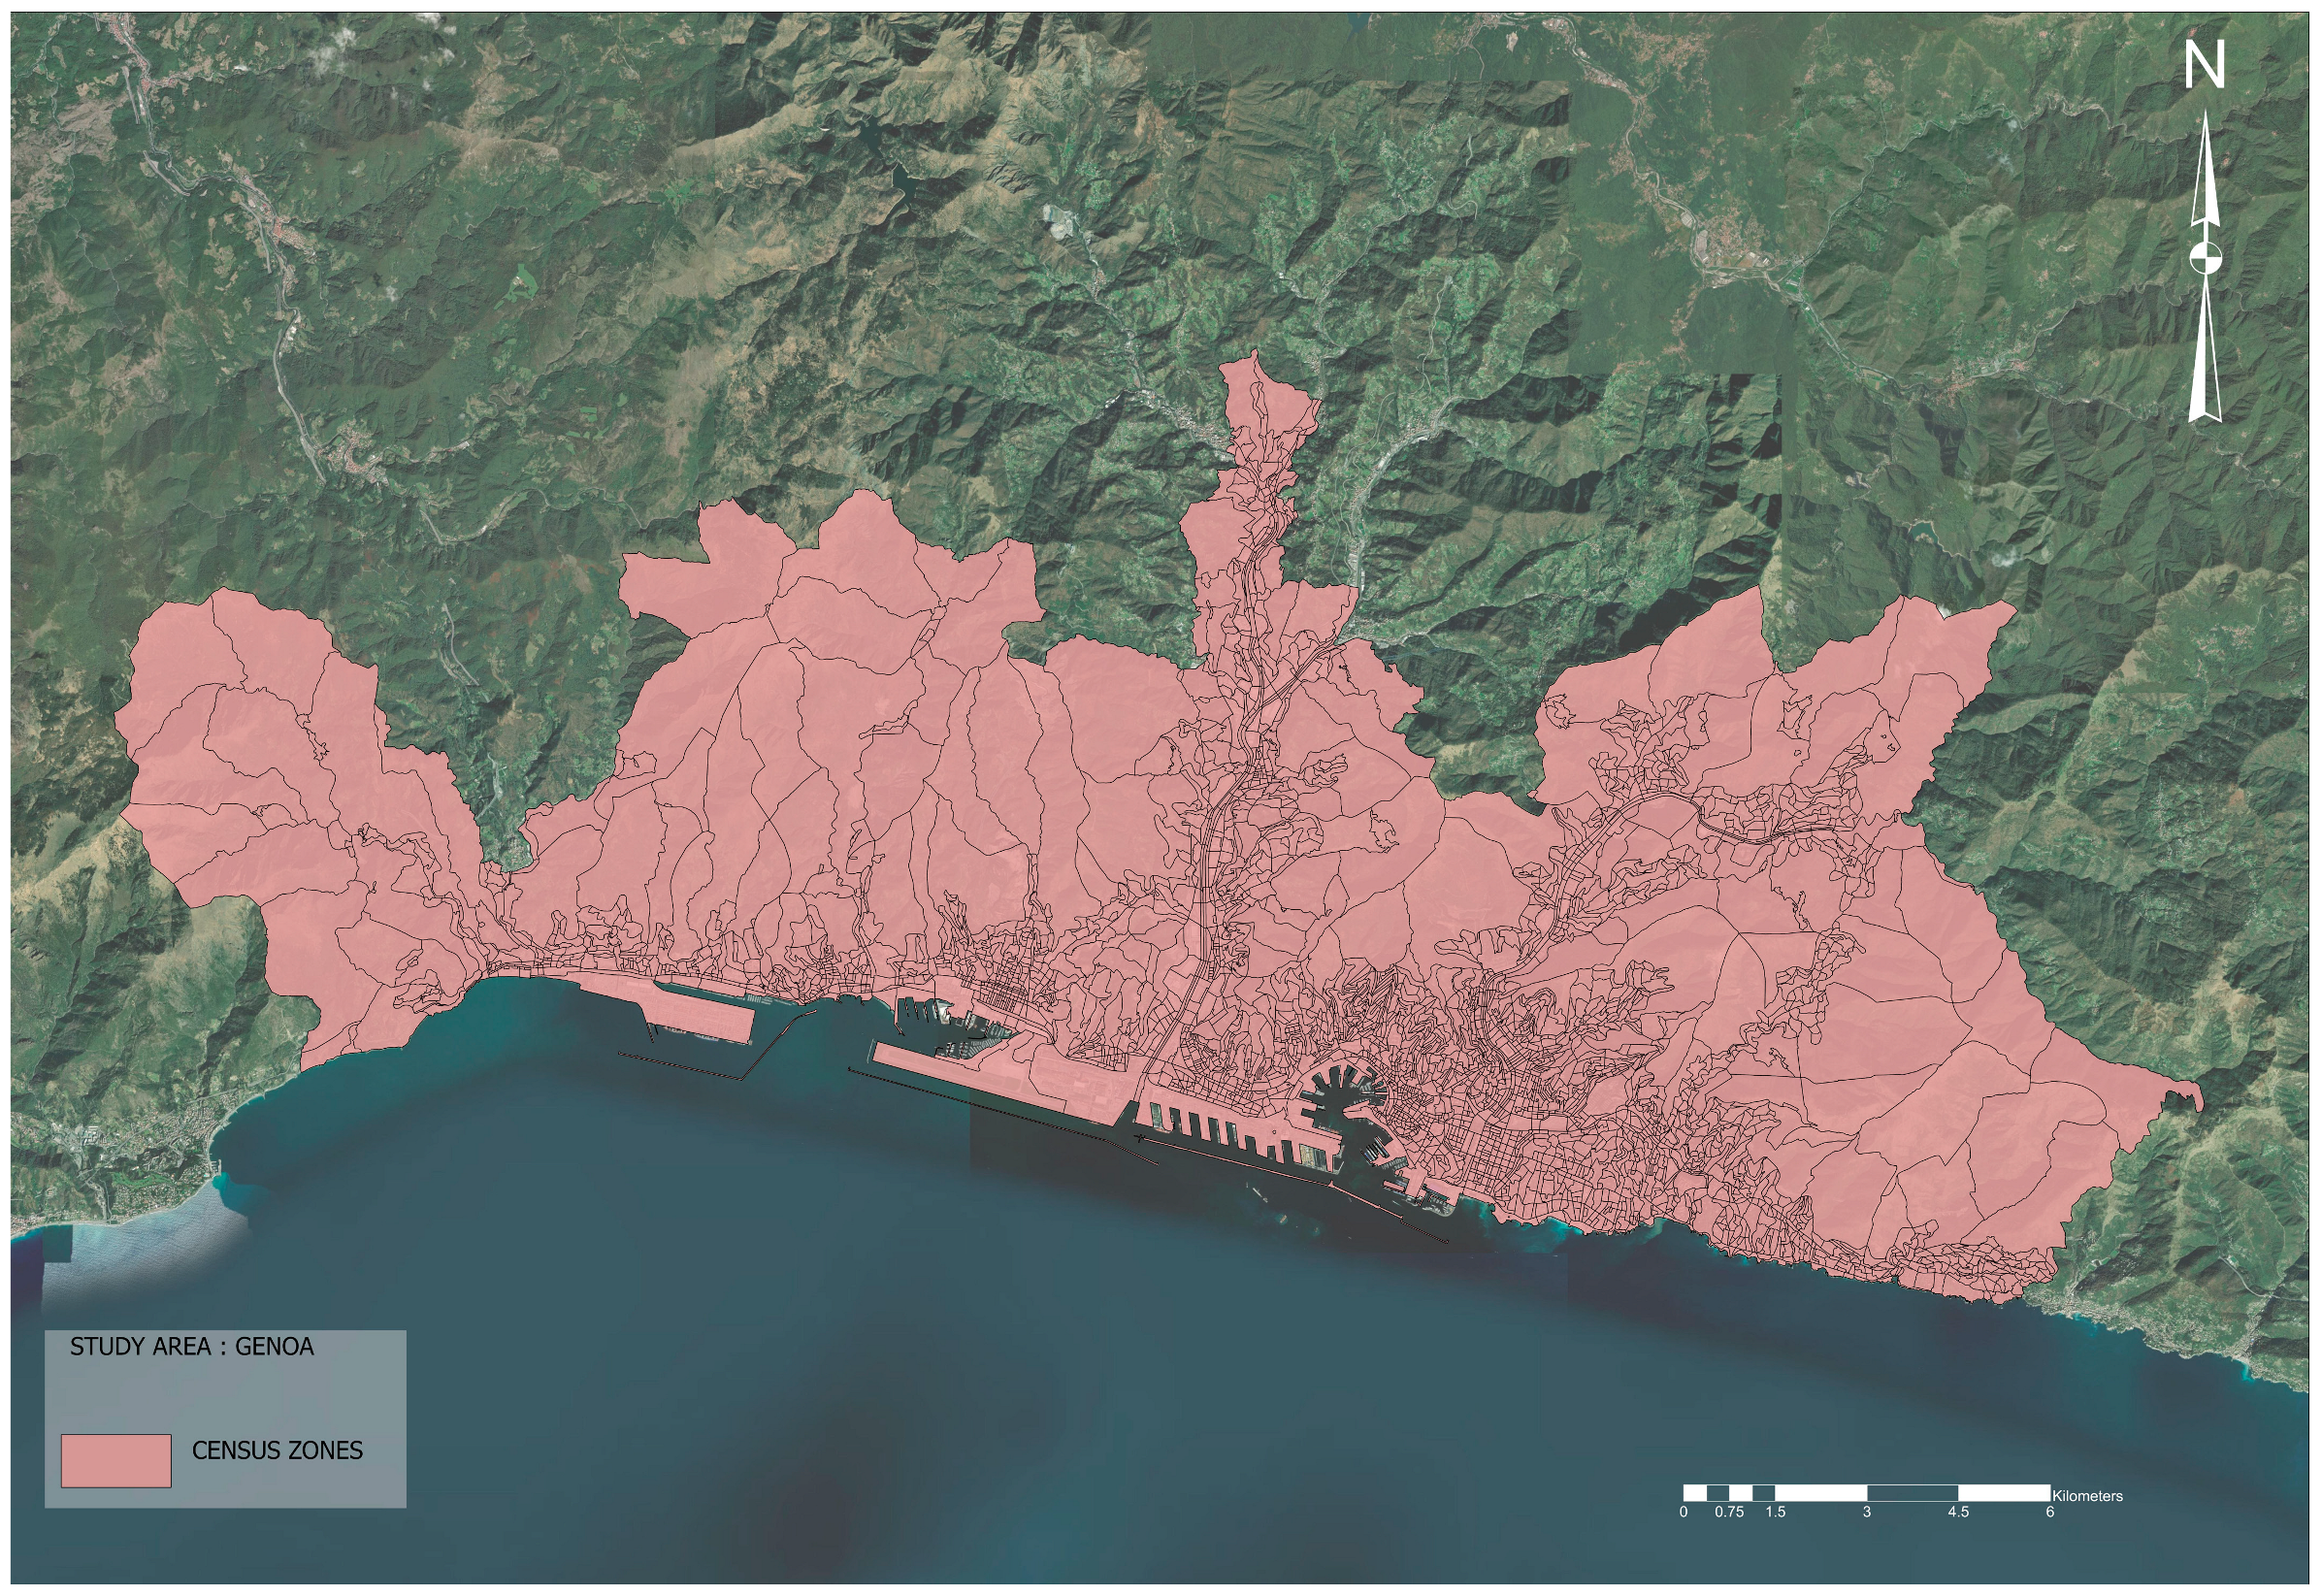
In the 2011 ISTAT census database Genoa is partitioned in 3616 census zones, of which 3454 are residential (
Figure 1).
The input dataset was prepared by selecting only the residential census zones and constructing the 26 features as in
Table 1.
At the end of the preprocessing phase, the optimal number of clusters was obtained with value C = 3, for which the smallest value of the Xie–Beni index was measured to be equal to 0.660.
For C = 3 the convergence is reached after eight iterations, in which the difference Δ between the weights obtained in the last iteration and those obtained in the previous iteration (17) is 2.139 × 10⁻⁶.
Then, the census zones of Genoa were grouped into three clusters, C
1, C
2, and C
3.
Table 4 shows, normalized with respect to the groups to which they belong, the centroids of the three clusters and the relevance of the features with respect to the three clusters.
The Cluster C1 category is comprised of census zones that predominantly feature residential buildings constructed in load-bearing masonry prior to 1919 and that have undergone a relatively intact conservation process. Cluster C2 comprises census zones that are distinguished by the predominant use of reinforced concrete in residential building construction during the post-war period, spanning from 1945 to 1960, and are notable for their state of preservation. The third cluster encompasses census zones characterized by the coexistence of residential buildings in good repair, constructed using load-bearing masonry prior to 1919, and those constructed using reinforced concrete between 1945 and 1960.
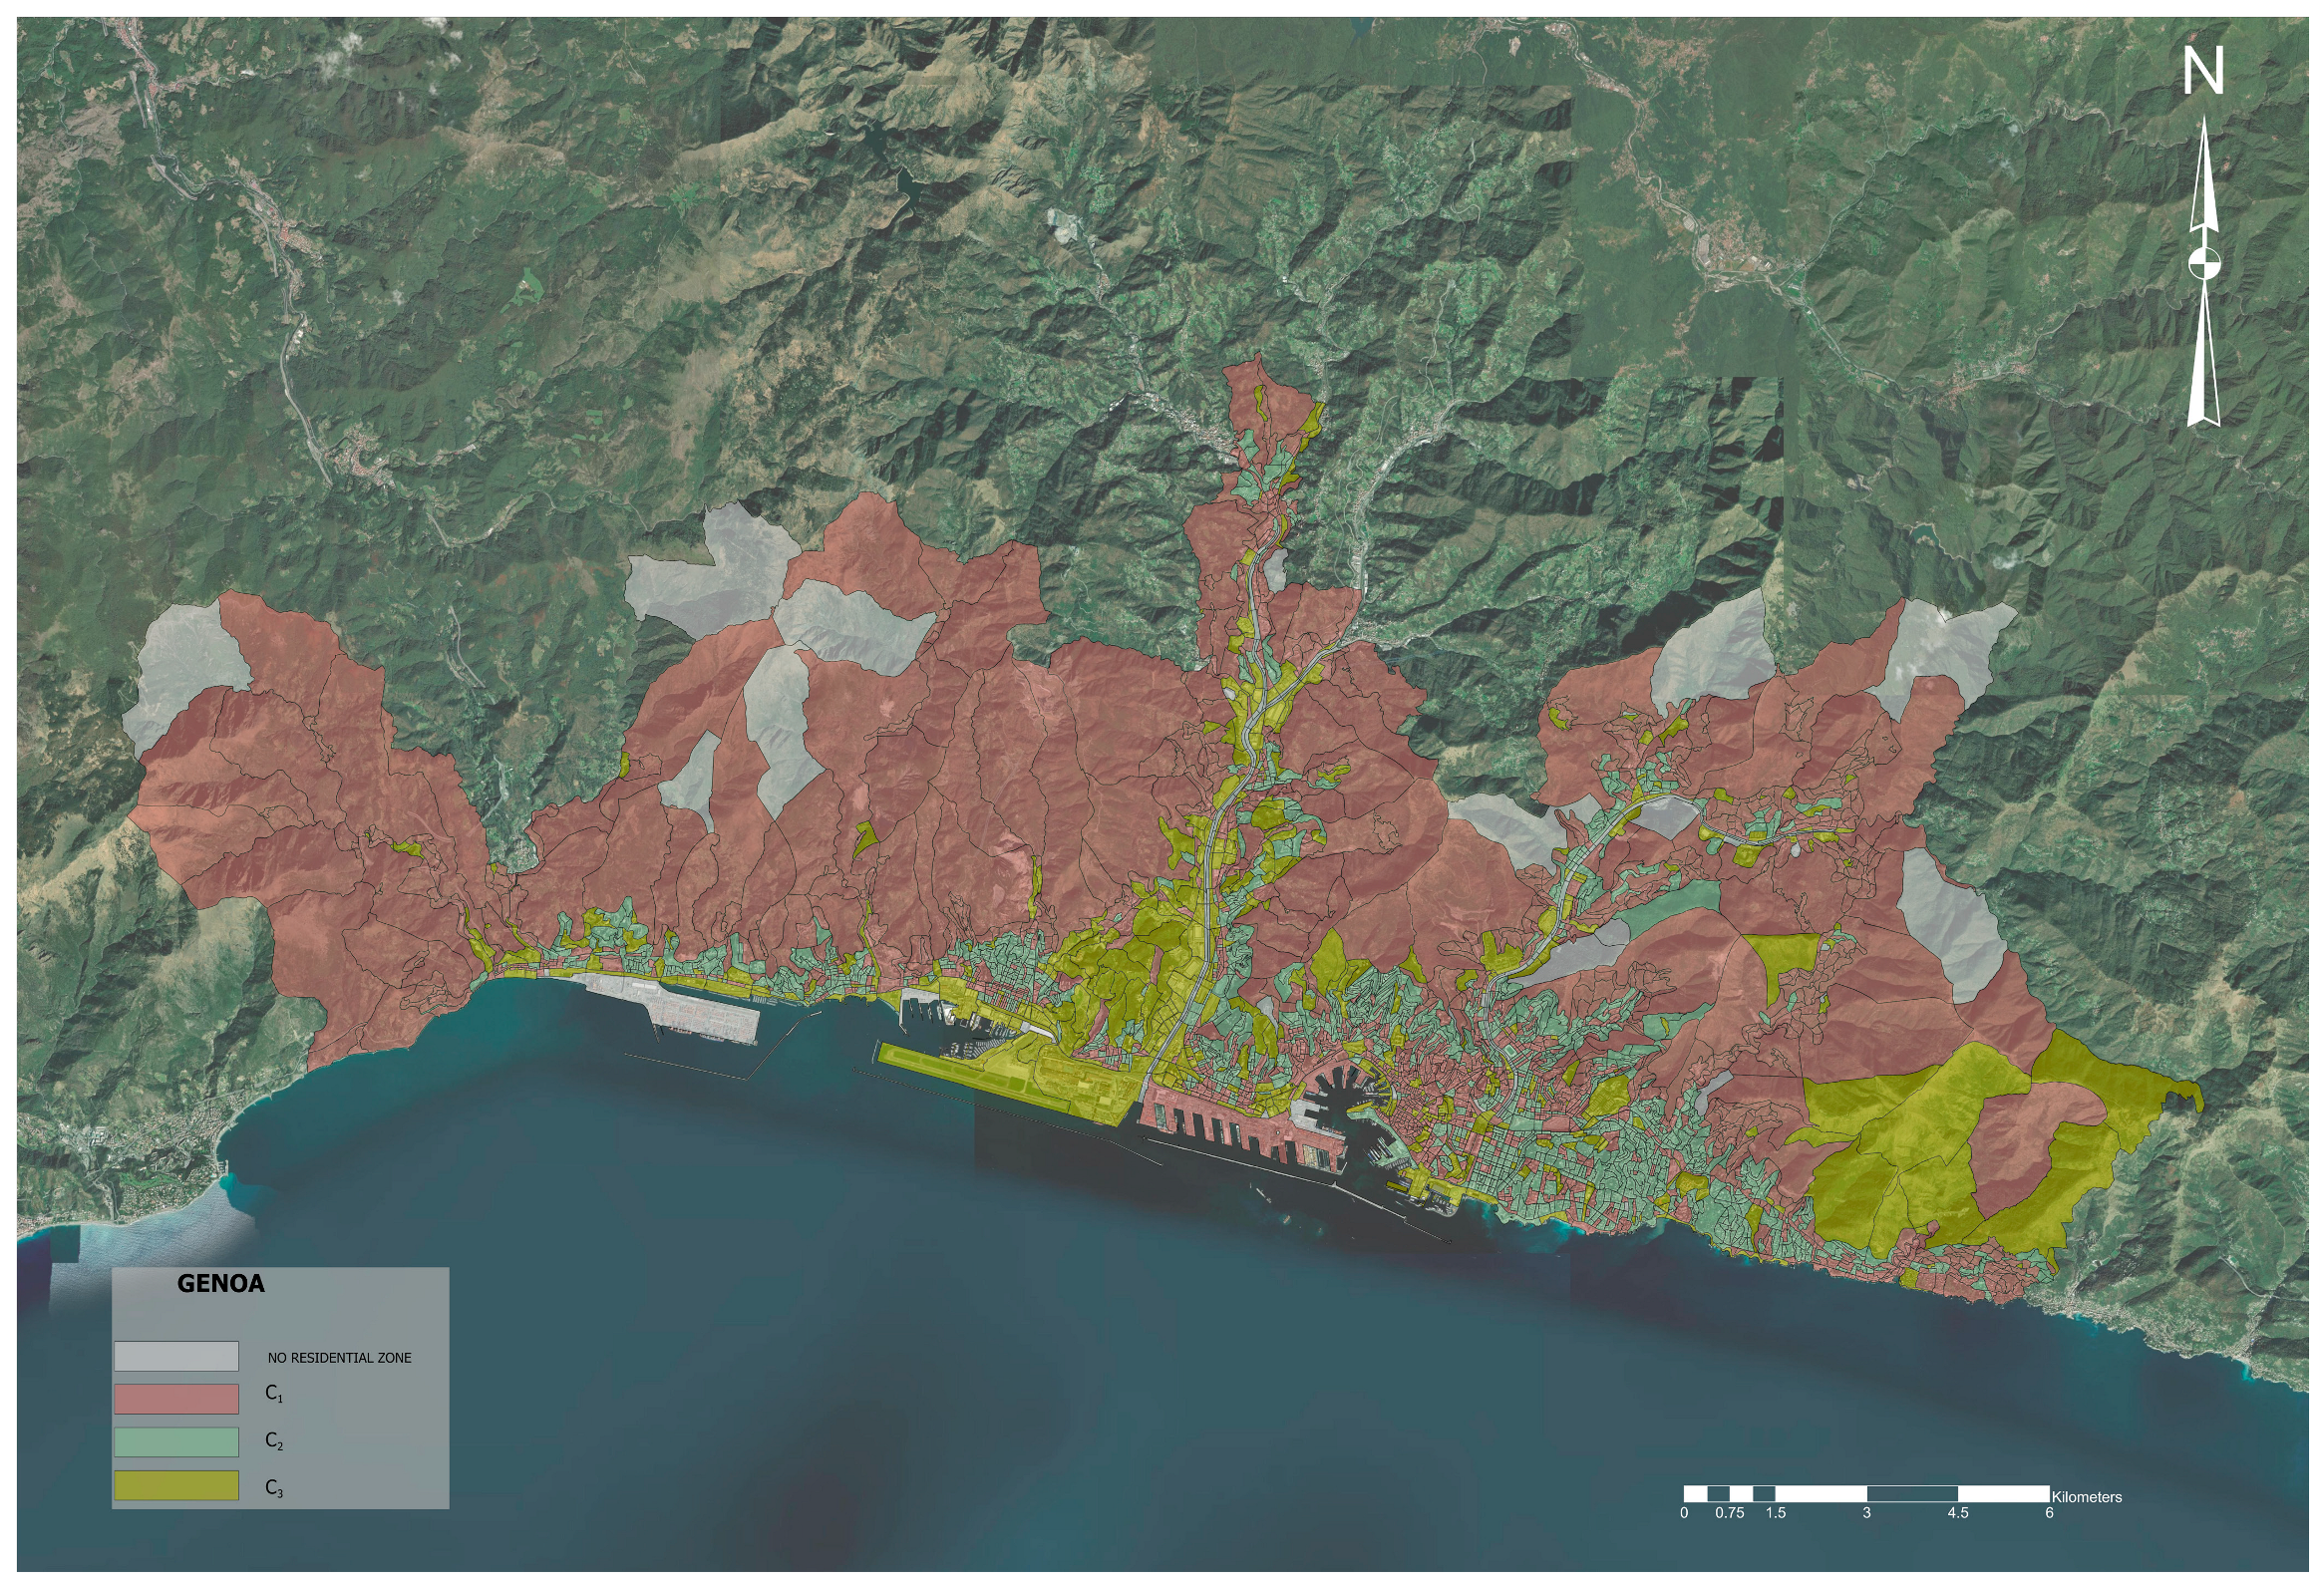
The thematic map in
Figure 2 illustrates the partitioning of the census zones of Genoa into three clusters. Non-residential census zones are indicated by the use of the color gray.
In summary, the urban zone of Genoa appears to be comprised of three distinct categories. The first category, depicted in red on the map, encompasses residential buildings predominantly constructed with load-bearing masonry and erected prior to the onset of the 20th century. These buildings are representative of the historic core of the city. The second category, represented by green on the map, is characterized by later urbanization, with buildings predominantly constructed using reinforced concrete. The third category, represented by orange on the map, comprises buildings that employ a combination of both construction techniques. These buildings were likely inhabited historically and have undergone subsequent urbanization.
4.2. Building Classification of Bari
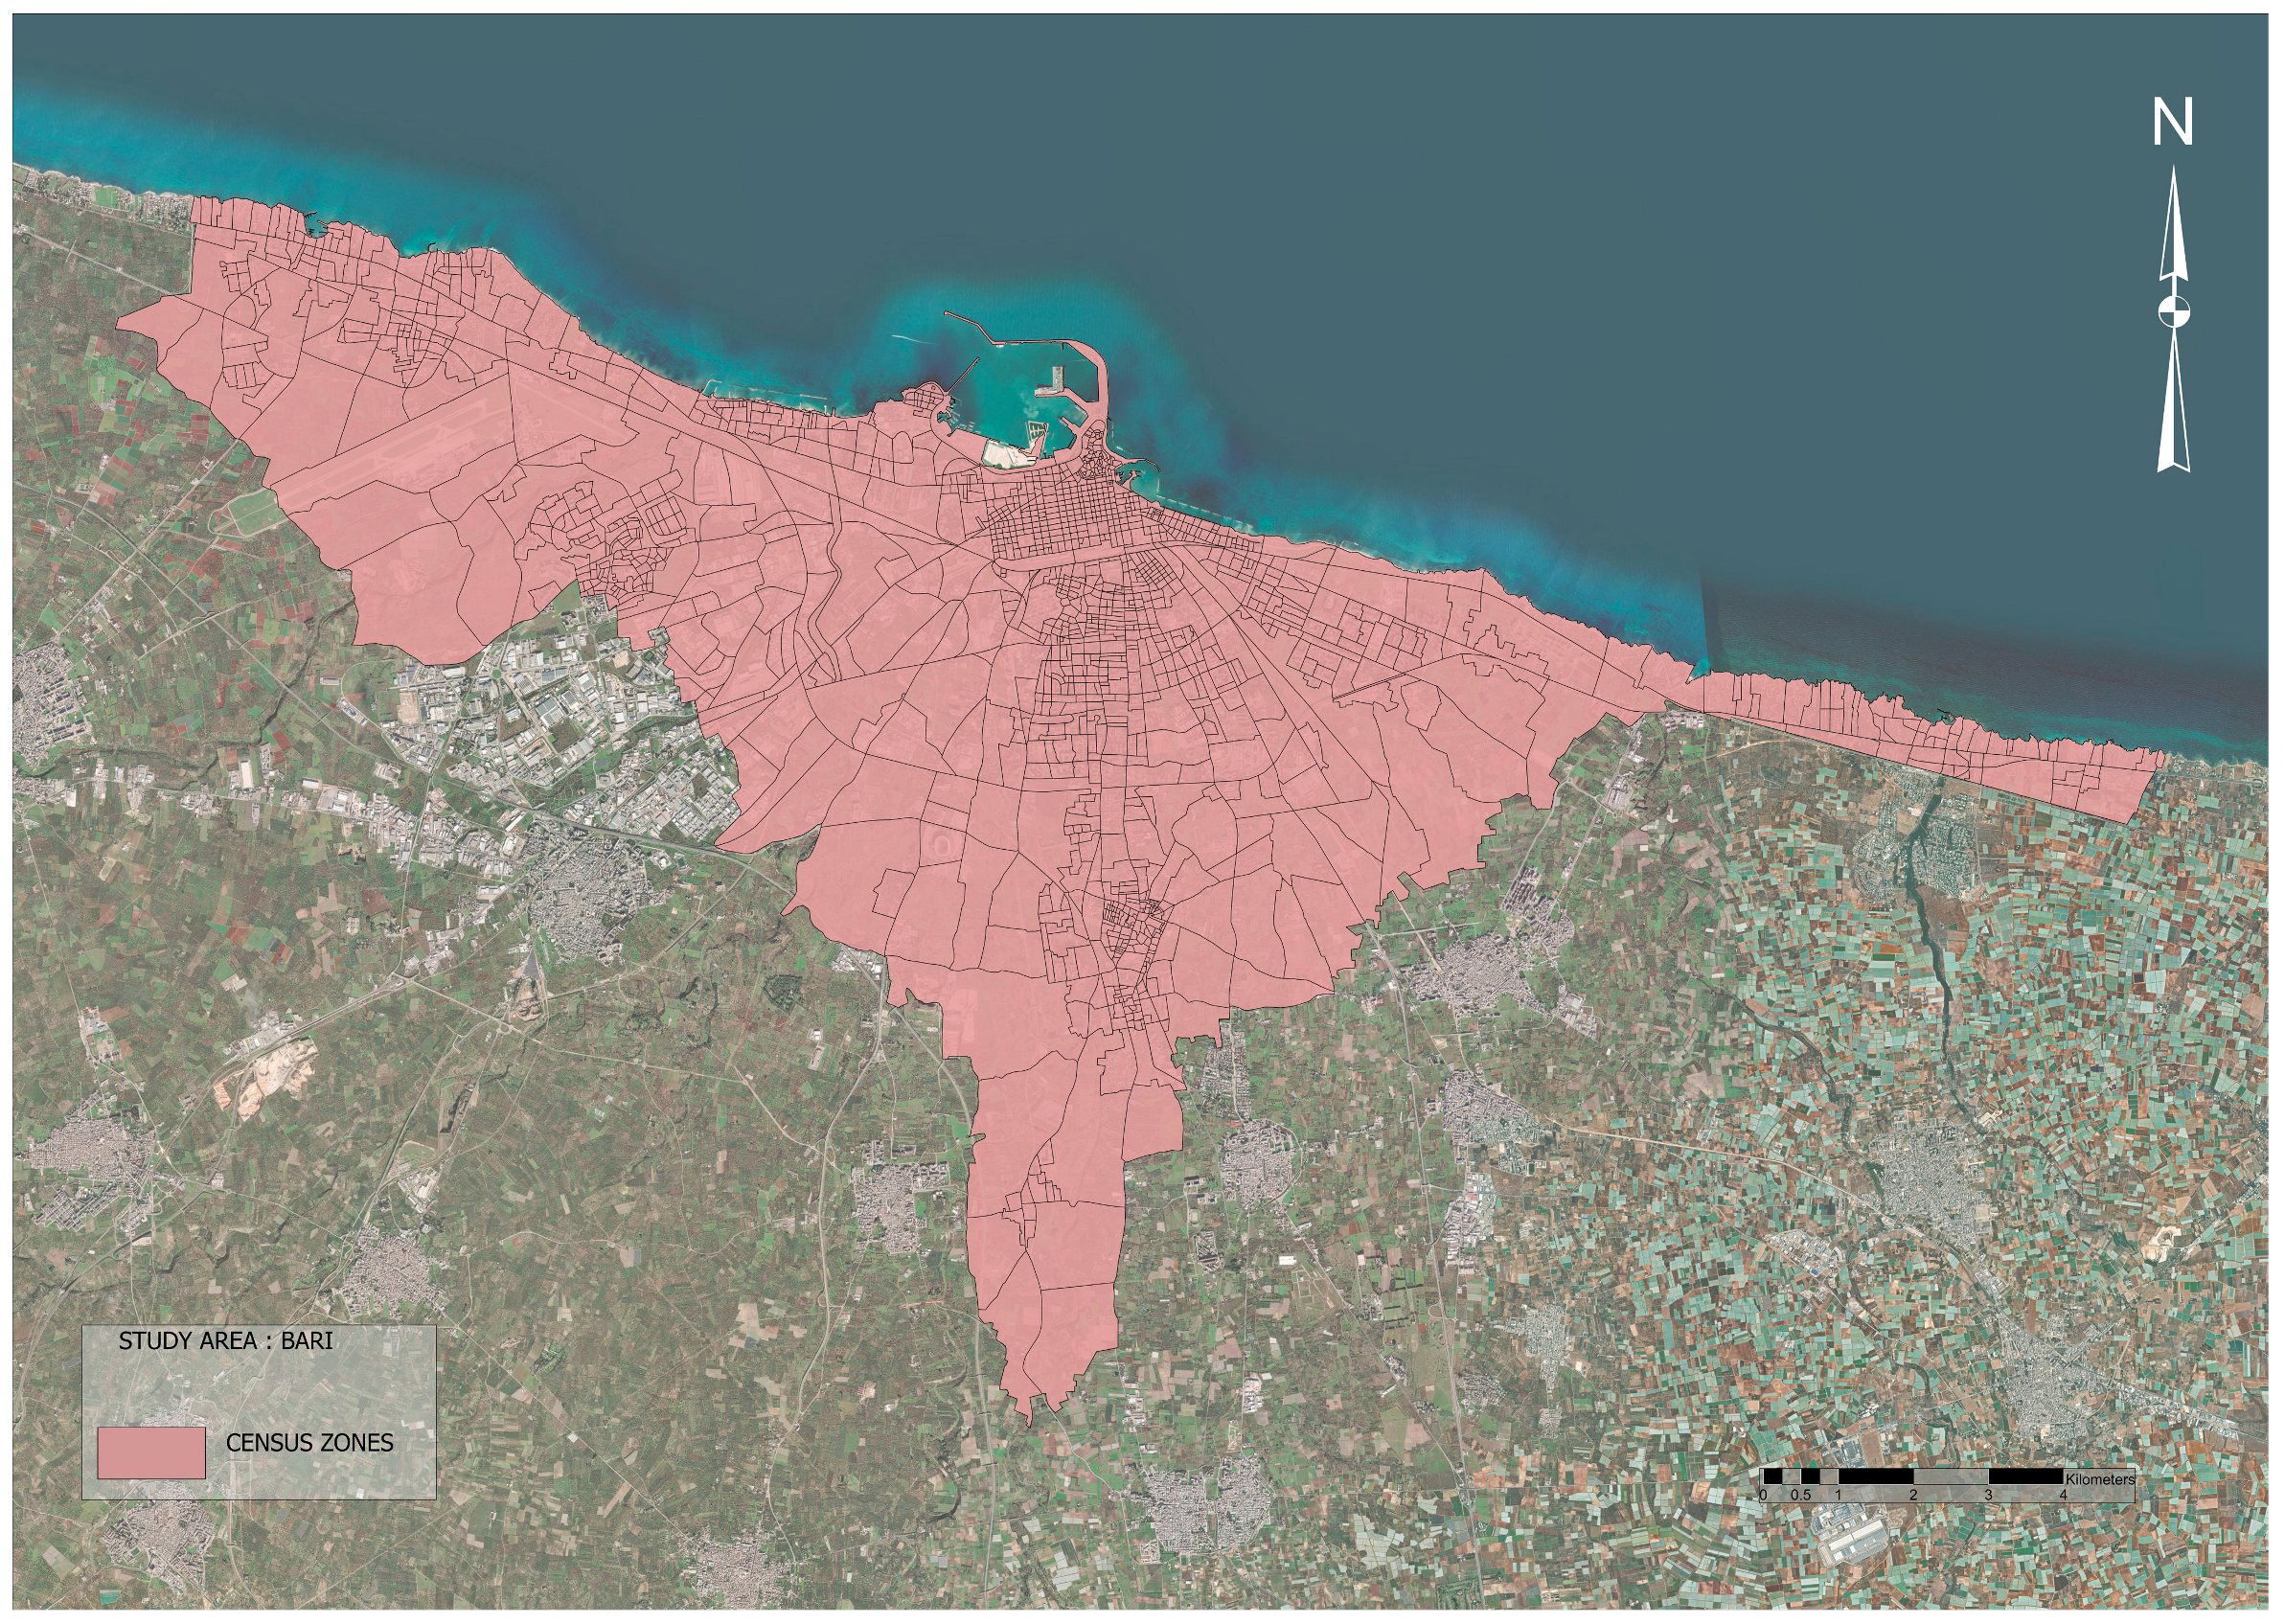
Bari is partitioned in 1502 census zones of which 1450 are residential census zones (
Figure 3).
At the end of the preprocessing phase, the optimal number of clusters was obtained with value C = 2, for which the smallest value of the Xie–Beni index was measured to be equal to 0.225. For C = 2 the convergence is reached after six iterations, in which the value of the difference Δ in (17) is 3.426 × 10⁻⁶.
Then, the census zones of Bari have been grouped into three clusters, C
1 and C
2.
Table 5 shows, normalized with respect to the groups to which they belong, the centroids of the three clusters and the relevance of the features with respect to the three clusters.
Cluster C1 comprises census zones that predominantly contain residential buildings constructed in load-bearing masonry prior to 1919 and that exhibit a satisfactory state of conservation. Cluster C2 comprises census zones that are characterized by the presence of residential buildings constructed in load-bearing masonry and reinforced concrete, with a frequency that is not negligible. The majority of these structures are in fair condition and were constructed primarily between 1919 and 1980, with a notable increase in the period between 1960 and 1970.
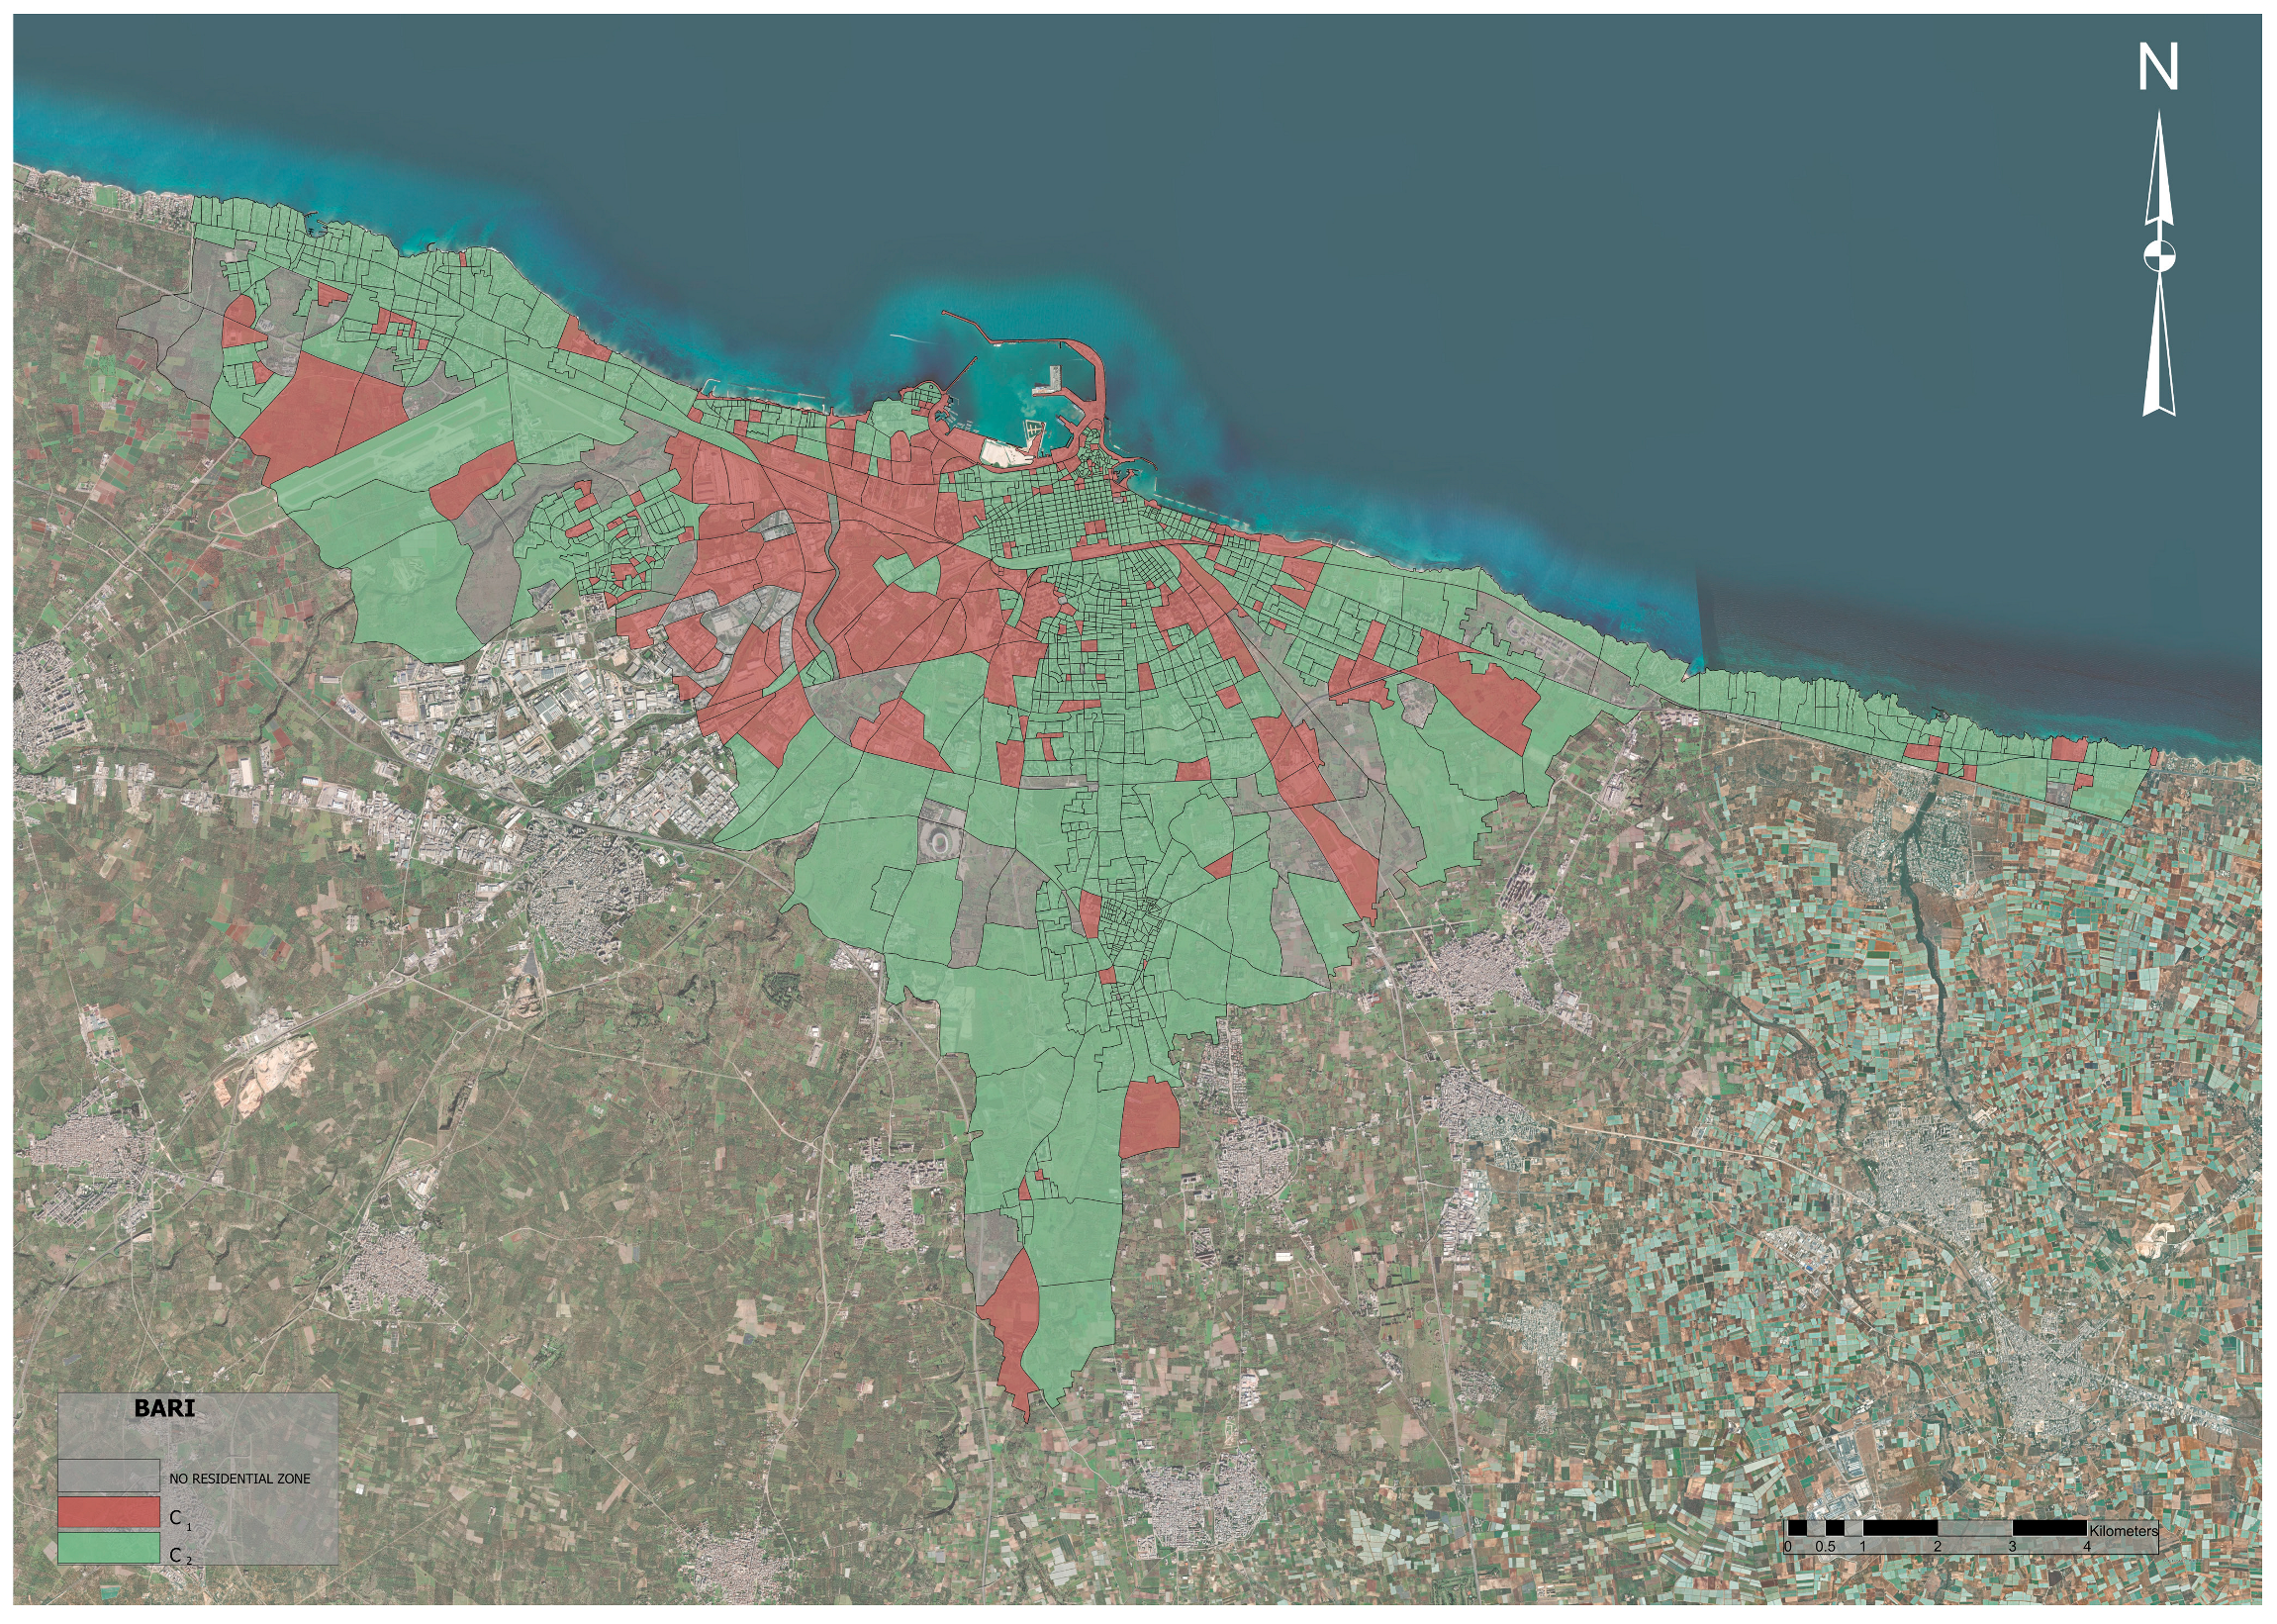
The thematic map in
Figure 4 illustrates the partitioning of the census zones of Bari into three clusters. Non-residential census zones are indicated by the use of the color gray.
Bari’s urban landscape is characterized by the coexistence of two distinct residential zones, as depicted on the provided map. The first zone, delineated in red, comprises historic centers that have remained largely untouched by subsequent urban expansion. In contrast, the second zone, marked in green, consists of equally historic settlements that have undergone substantial building development between the post-war period and the 1980s. This phenomenon is exemplified by the coexistence within these urban areas of load-bearing masonry residential buildings, likely constructed between 1919 and 1945, and reinforced concrete buildings, presumably erected from the post-war period onwards.
4.3. Building Classification of Naples
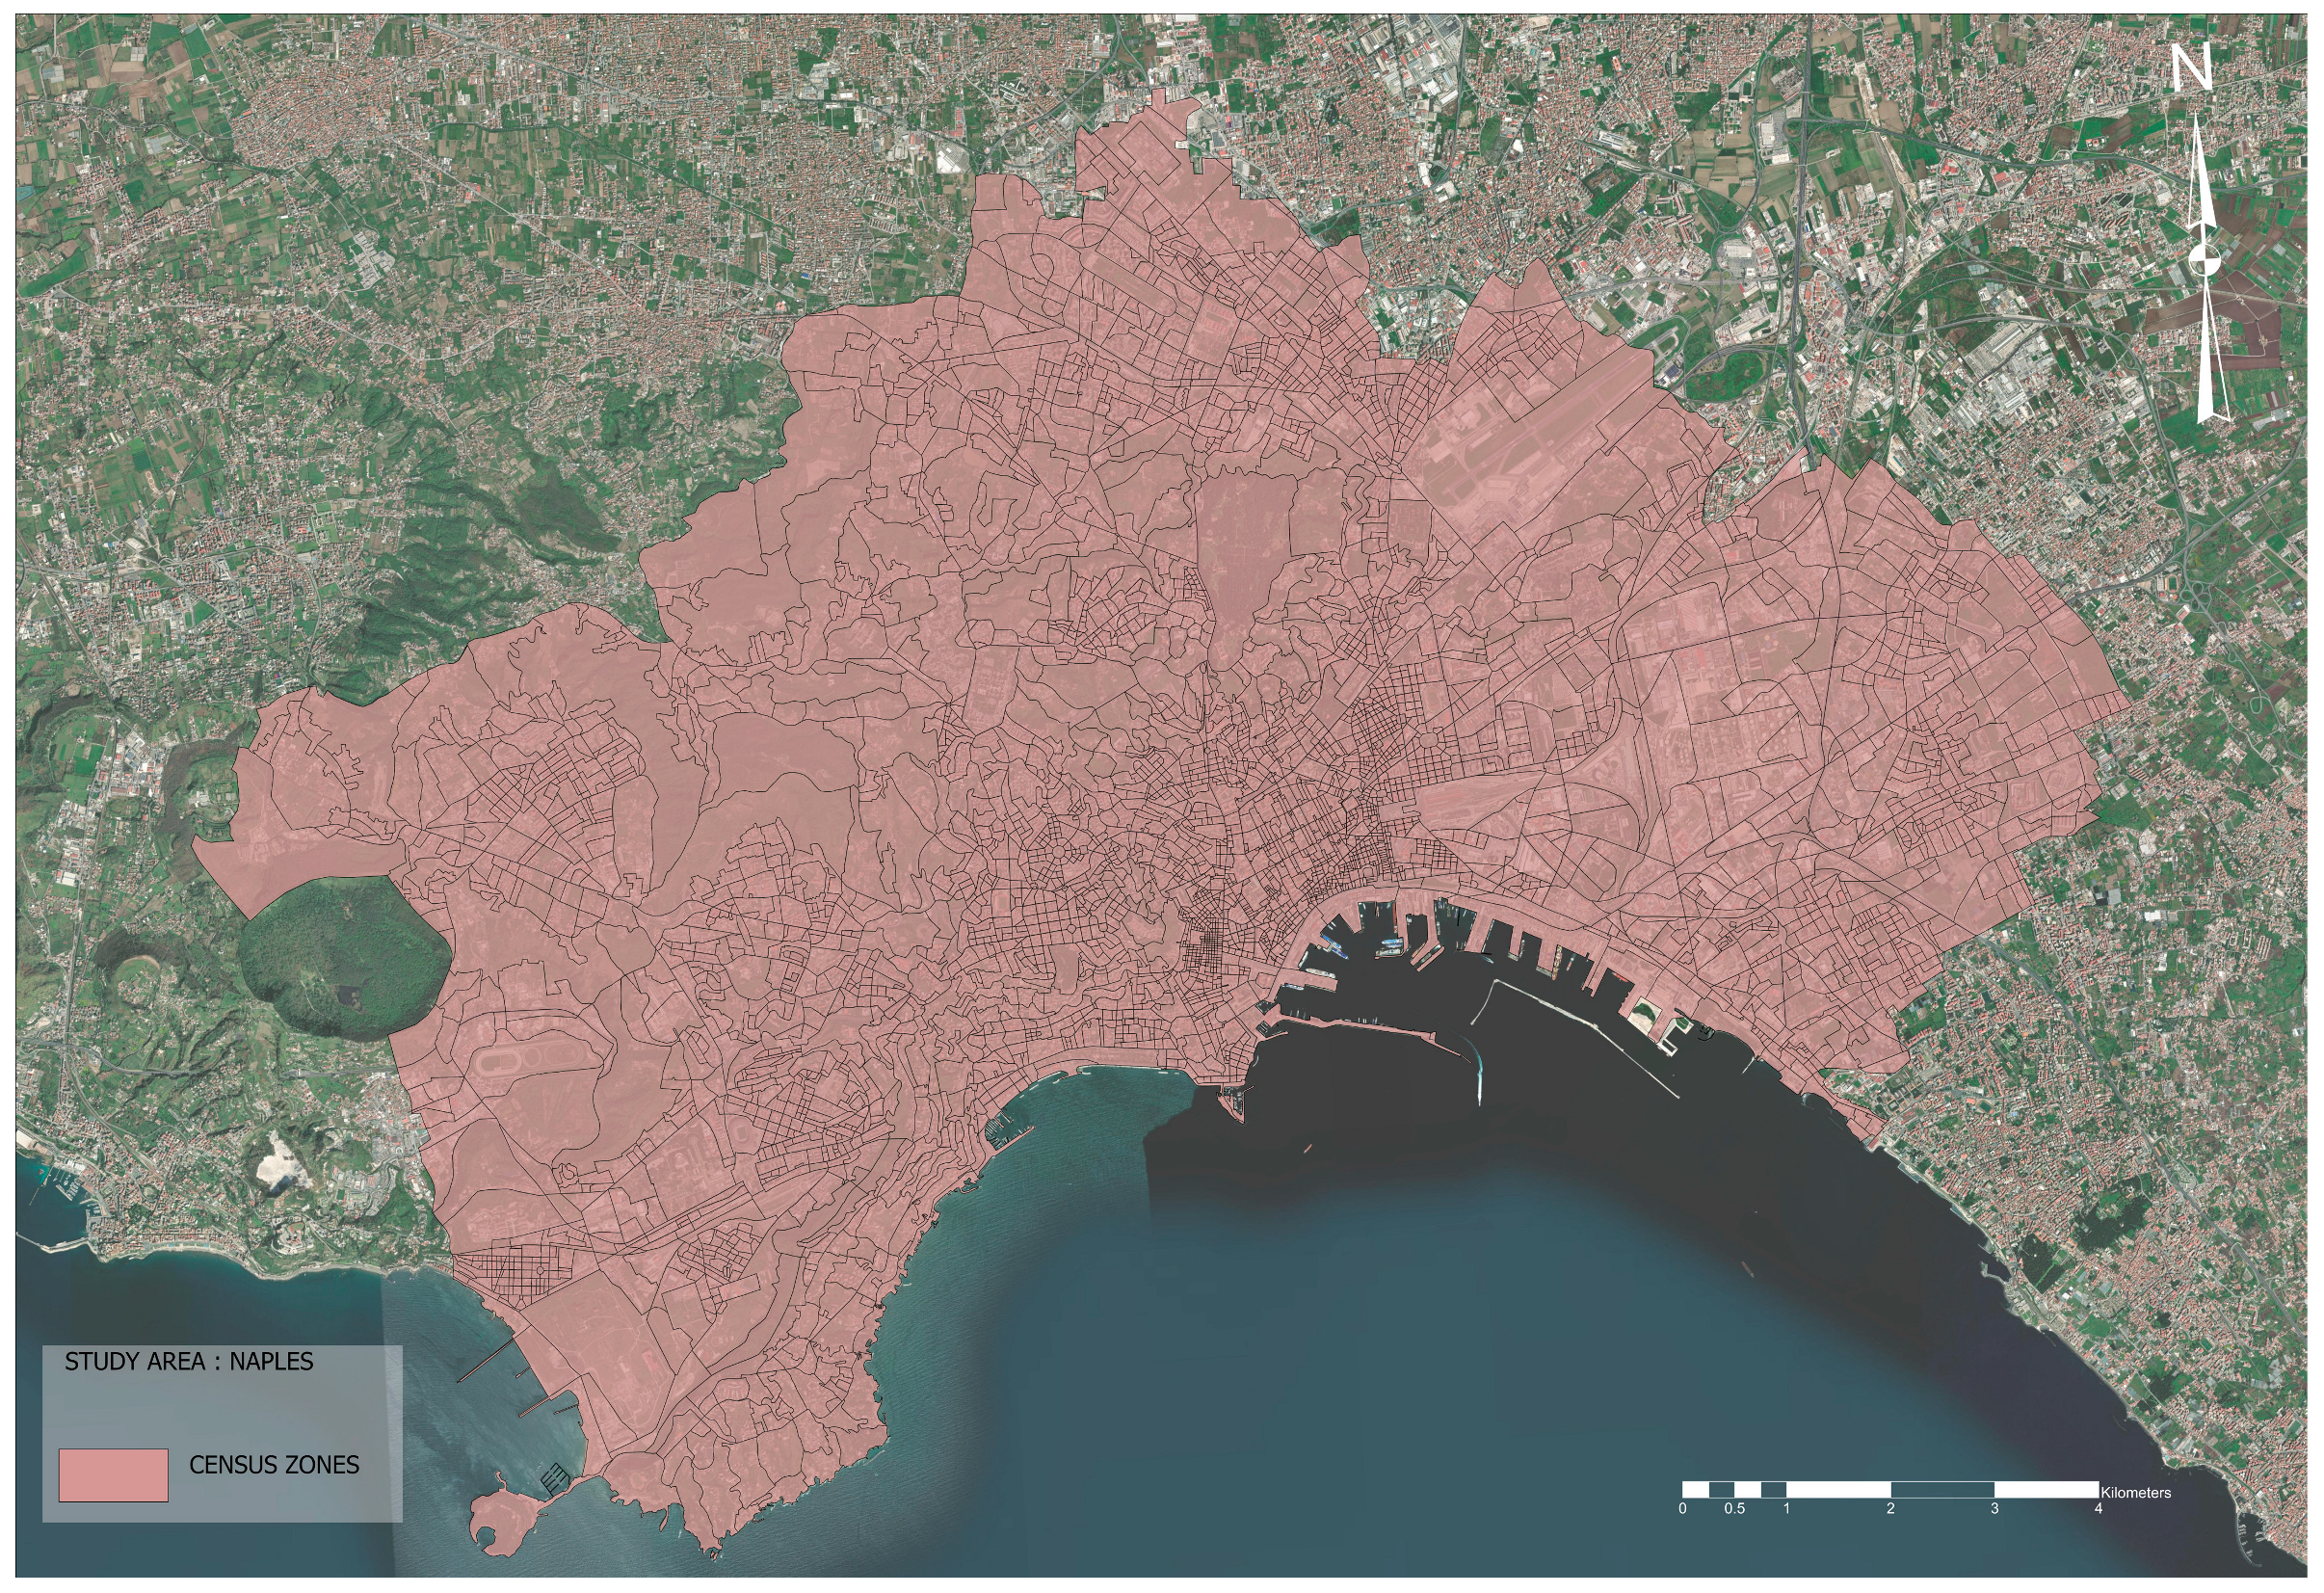
Naples is partitioned in 4301 census zones of which 4049 are residential census zones (
Figure 5).
At the end of the preprocessing phase, the optimal number of clusters was obtained with value C = 3, for which the smallest value of the Xie–Beni index was measured to be equal to 2.480.
For C = 3 the convergence is reached after six iterations, in which the value of the difference Δ in (17) is 2534 × 10−6.
Then, the census zones of Naples have been grouped into three clusters, C
1, C
2, and C
3.
Table 6 shows, normalized with respect to the groups to which they belong, the centroids of the three clusters and the relevance of the features with respect to the three clusters.
Cluster C1 groups together census zones in which residential buildings were predominantly built in load-bearing masonry at a time before 1919, but with a non-negligible frequency of buildings constructed later, up until 1960. These residential buildings are, predominantly, at least four floors high. Cluster C2 groups together census zones in which residential buildings were predominantly built in reinforced concrete in the post-war period, between 1945 and 1960, and in a good state of preservation. In this cluster too, residential buildings are predominantly at least four stories high.
Cluster C3 includes census zones in which mainly residential buildings were constructed in load-bearing masonry before 1919. Most of them are in a poor state of preservation.
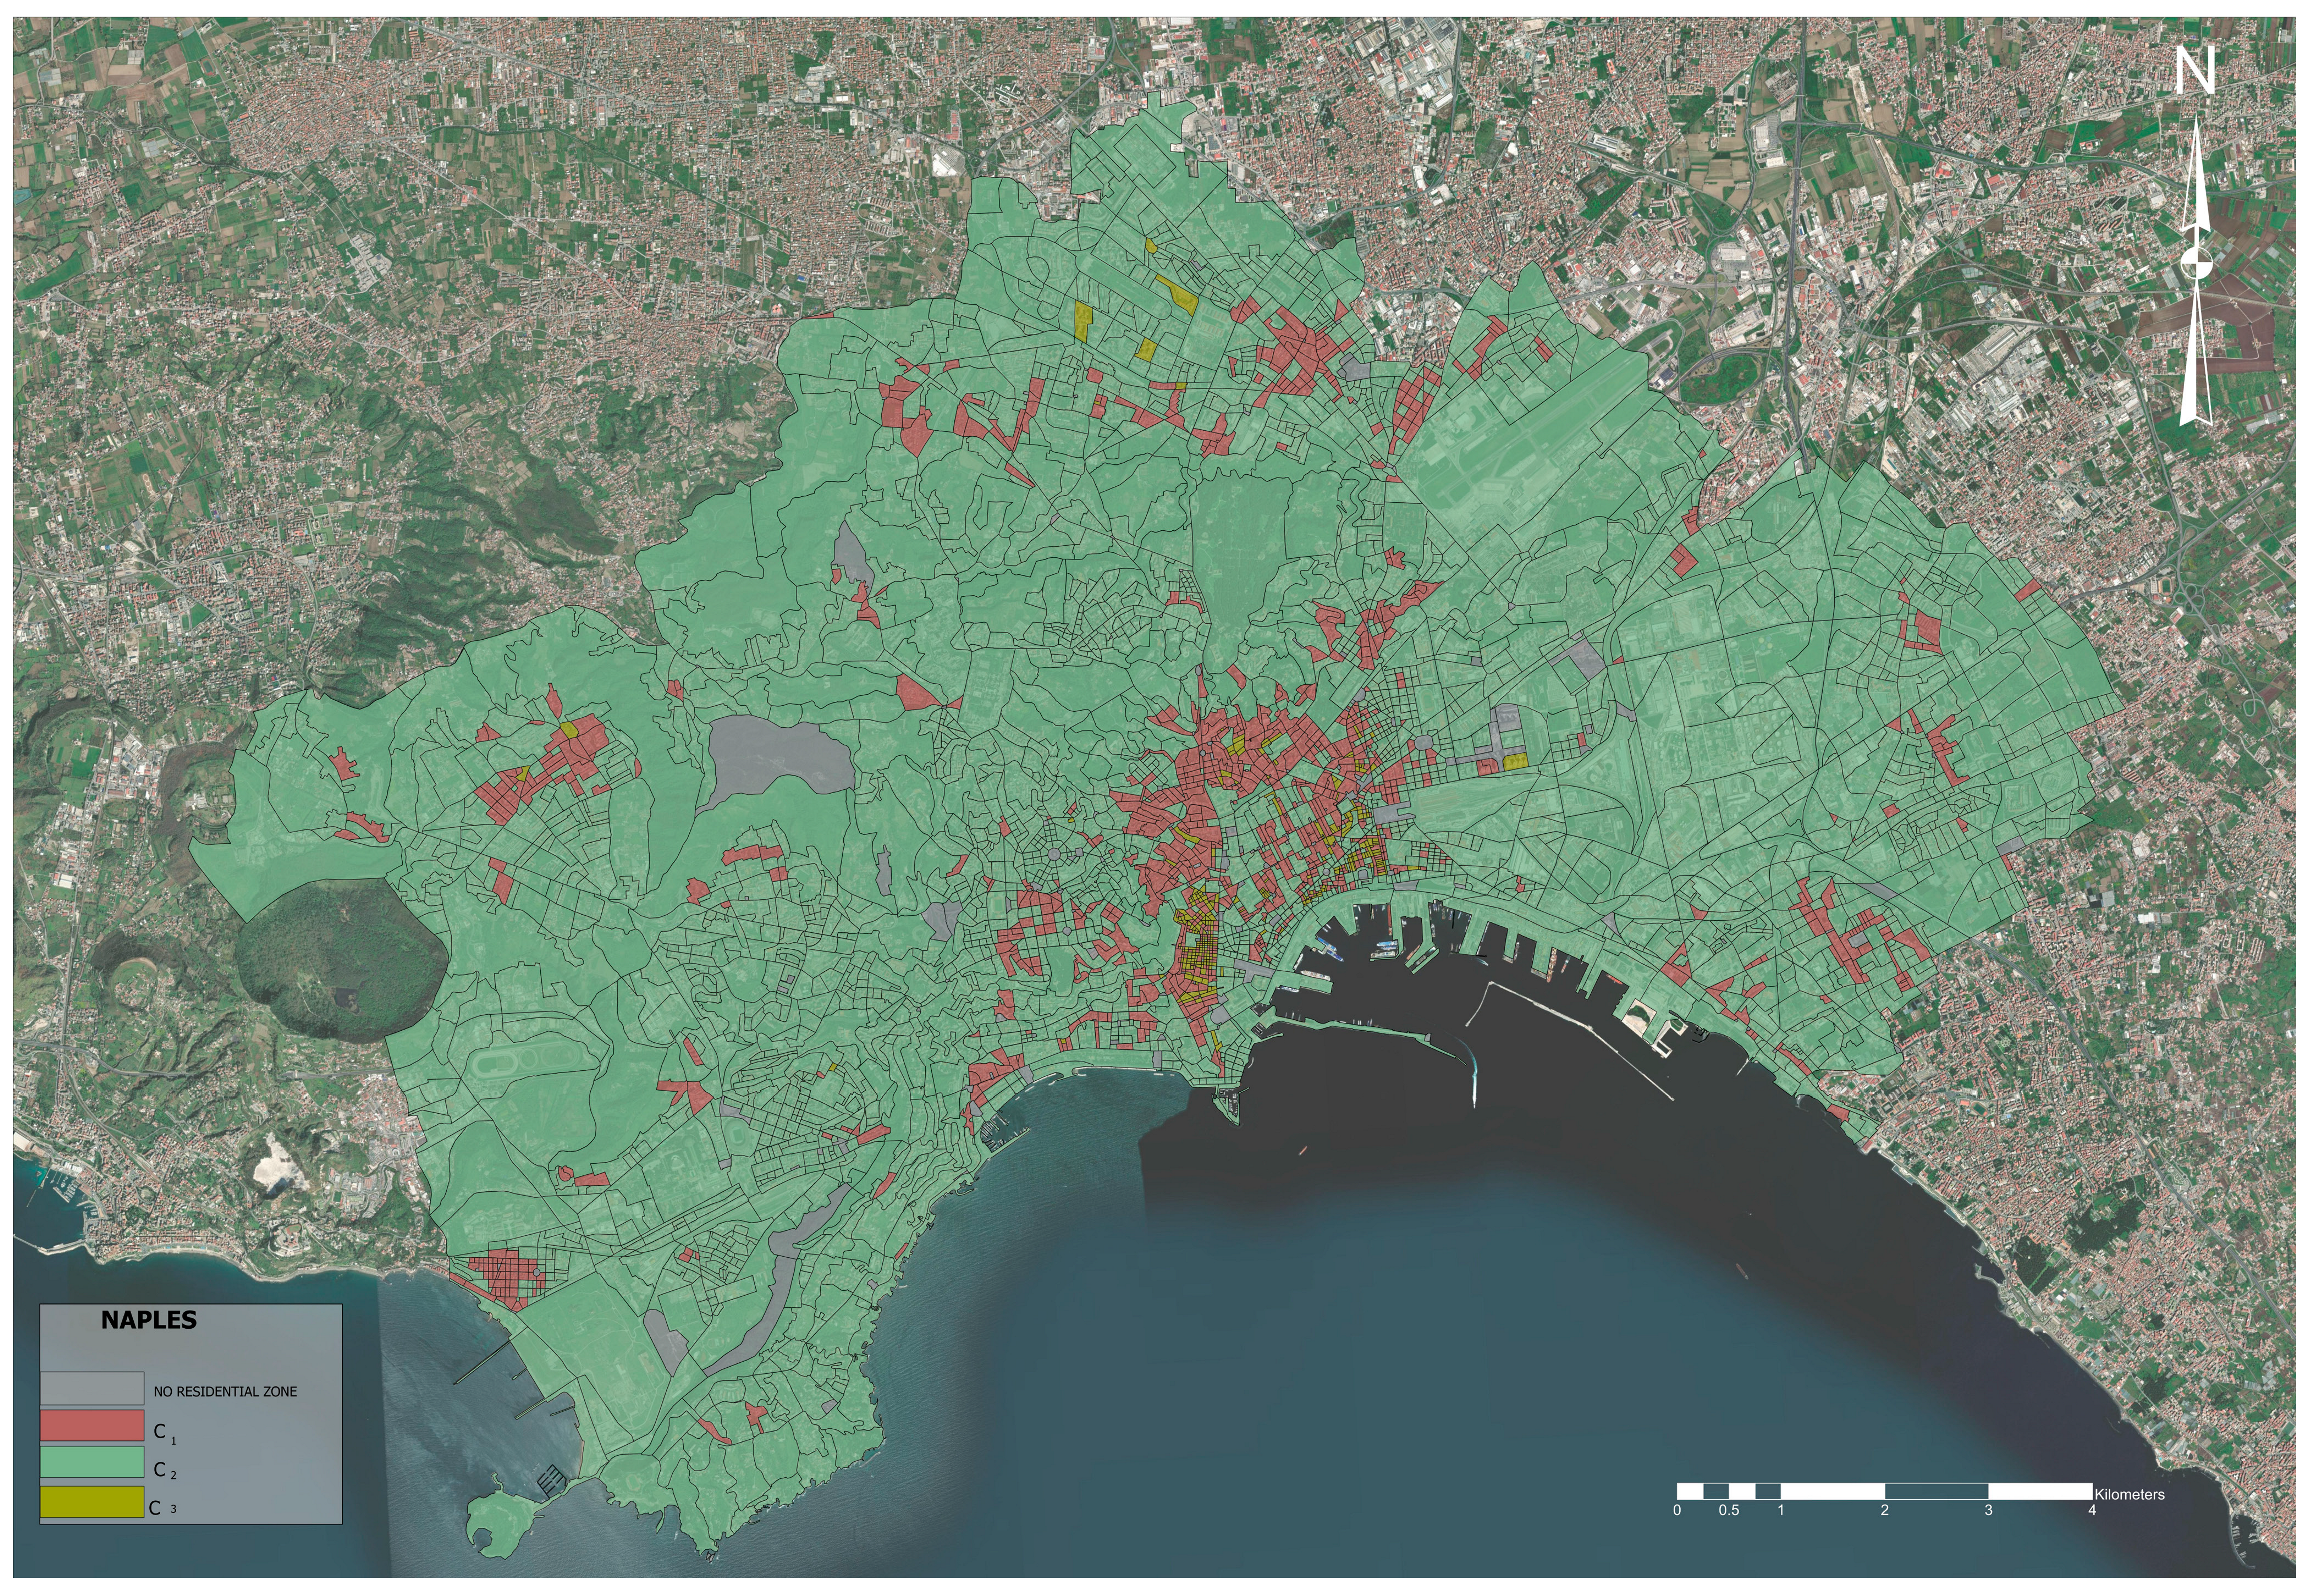
The thematic map in
Figure 6 shows the partitioning of the census zones of Bari into the three clusters. Non-residential census zones are highlighted in grey.
In summary, Naples appears to be made up of three types of urban zones: those, displayed in red on the thematic map, with residential buildings predominantly made of load-bearing masonry and constructed before the beginning of the last century, which characterize the historic center of the city; they are, with high frequency, in poor state of conservation; those, displayed in green on the map, with later urbanization, with buildings constructed predominantly in reinforced concrete; and those, displayed in orange on the map, with buildings built predominantly in load-bearing masonry, but with subsequent constructions, probably in reinforced concrete, carried out up until 1960.
4.4. Comparison Results
The experimental comparison focuses on EWFCM, which is a representative state-of-the-art extension of FCM that incorporates entropy-regularized feature weighting. Comparative tests performed in [
8] have shown that EWFCM consistently outperforms both the classical FCM and weighted FCM (wFCM) on standard benchmark datasets, including those from the UCI repository. Since EWFCM can be regarded as a generalization of these methods, comparing the proposed approach with EWFCM provides a stronger baseline.
These comparative tests have been carried by running WEFCM on all test cases. The stop iteration error ε in WEFCM is fixed to the value 1 × 10⁻⁵.
Additionally, for EWFCM, 20 independent runs of each algorithm with different random initializations for each test case. The results are reported in terms of average.
First, the computational speeds of the two algorithms were measured. In
Table 7 are shown the number of iterations and the CPU times obtained by running WEFCM and GWEFCM in the 16 test cases.
In all cases, GWEFCM reaches convergence in an average number of iterations equal to half the number of iterations of WEFCM, with CPU times on average equal to one third of those obtained by running WEFCM. These results highlight that GWEFCM is much more efficient than WEFCM in terms of execution times. This greater efficiency is since, unlike WEFCM, in which the feature weights vary within each cluster, in GWEFCM the feature weights do not vary across clusters; they are calculated as the product of the weight of the group to which they belong and the weight of the feature within the group.
To assess the statistical significance of the differences between GEWFCM and EWFCM, a Wilcoxon signed-rank test [
22] was performed on the number of iterations and CPU execution times reported in
Table 6. In the test the null hypothesis H
0 is that GEWFCM and EWFCM have the same performance. A significance level α = 0.05 is set. The results of this test are shown in
Table 8.
Therefore, the null hypothesis of equal performance between the two algorithms is rejected, indicating that the observed improvements are statistically significant and not due to random variability. This indicates that the observed improvements of GEWFCM in terms of number of iterations and CPU time are not due to random variability but reflect a systematic advantage of the proposed method.
Further comparative tests were performed to measure the similarity between the results obtained with the two algorithms. To measure this similarity, the Adjusted Rand Index (ARI) [
23,
24] was used; this index allows comparing the similarity between partitions obtained by two clustering algorithms. In
Table 9 the values of the ARI metrics obtained in each test case are shown.
The ARI values range between 0.861 and 0.917, with a mean of 0.896 and a standard deviation of 0.017. Given that ARI values lie in the interval [0, 1], these results demonstrate a strong agreement between the partitions produced by WEFCM and GWEFCM, confirming that the proposed method preserves the clustering structure of the baseline approach.
In summary, GWEFCM is comparable to WEFCM in terms of the quality of the clustering results, but it is computationally much faster.
Furthermore, it allows for assigning greater semantic meaning to clusters, highlighting how significant a feature is within a cluster compared to the group to which it belongs.