Article

Synergistic Regulation of Electric Field and Wettability on Water Molecule Condensation: A Molecular Dynamics Study


School of Emergency Management and Safety Engineering, China University of Mining and Technology-Beijing, D11 Xueyuan Road, Haidian District, Beijing 100083, China
*
Author to whom correspondence should be addressed.
Symmetry 2026, 18(5), 773; https://doi.org/10.3390/sym18050773
Submission received: 19 March 2026 / Revised: 22 April 2026 / Accepted: 26 April 2026 / Published: 30 April 2026
(This article belongs to the Section F: Engineering and Materials)

Abstract

This study employs molecular dynamics simulations to investigate the condensation behavior of water molecules on hydrophilic/hydrophobic substrates under varying electric field strengths. It reveals the synergistic regulation effect between electric field strength and surface wettability from the perspectives of condensation rate and morphological evolution. The results indicate that the condensation rate on hydrophilic surfaces first increases and then decreases with increasing electric field strength; the condensation efficiency reaches its maximum at an electric field strength of 1.6 V/nm. Conversely, the condensation efficiency on hydrophobic surfaces shows a monotonically decreasing trend with increasing electric field strength; the presence of an electric field does not facilitate condensation on hydrophobic surfaces. The orientation of water molecule dipole moments is synergistically regulated by external electric fields, intermolecular interactions, and substrate–water interactions. The weaker the wettability, the more readily the electric field assumes a dominant role. Furthermore, the electric field induces parallel alignment of dipole moments along its direction, enhancing intermolecular attractions along the electric field axis (Z-axis). This also drives the reconfiguration of hydrogen-bond networks, ultimately leading to the aggregation of water molecules into clusters aligned with the electric field, thereby transforming the condensation morphology.

1. Introduction

Mine fog is a prominent hazard in underground mining that significantly reduces air visibility and severely threatens the safety of transportation systems, emerging as a critical issue constraining mine safety production [1,2,3]. Compared to conventional methods such as mechanical ventilation and heating, fog nets demonstrate promising engineering applications due to their simple structure, low cost, and ease of maintenance [4,5]. However, existing research indicates that the current de-fogging efficiency per unit area of fog nets remains insufficient to meet practical engineering demands [6,7]. Therefore, this paper proposes an approach to dehumidification and defogging, which aims to induce directional condensation of water vapor on the surface of the fog net through an electric field before a large amount of fog droplets condense, thereby achieving an active reduction in absolute air humidity and blocking the conditions for fog formation. During this process, the condensation behavior of water vapor on the solid surface is crucial, and the condensation efficiency directly determines the overall dehumidification performance. Therefore, in-depth research on the condensation kinetics and strengthening effect of water vapor on solid surfaces has important theoretical significance and engineering value for enhancing the active dehumidification ability of fog nets in tunnel environments.
The condensation of water vapor is a complex process influenced by multiple factors, including surface properties, vapor characteristics, and environmental conditions [8,9,10,11]. Wang et al. [12] investigated the condensation behavior of molecules on various nanopillar surfaces, finding that different nanopillar heights and solid fractions affect the final morphology of droplet condensation. Huang et al. [6] discovered that taller, denser pillars and stronger wall wettability can suppress vapor condensation at the base of nanopillar arrays, promoting condensation at the upper regions. Liao et al. [13] studied condensation behavior on nanoscale grooved surfaces, demonstrating that the heat transfer efficiency and condensation rate of water molecules increase with groove width and height. Wang et al. [14] examined the influence of hybrid binary substrates on water vapor condensation, revealing that a moderate mixing ratio of substrates facilitates nucleation and condensation of water molecules. Niu et al. [15] explored vapor condensation under high nanopillar conditions, showing that droplets tend to nucleate and grow within the nanopillar structures, while reducing the center-to-center spacing of nanopillars or increasing heat flux promotes preferential droplet growth at the upper regions of the nanostructures.
In addition, electric fields are also an effective external means of regulating the condensation behavior of water vapor, which has shown broad prospects in fog suppression and dehumidification. At present, research has directly applied voltage to the fog net structure to enhance the defogging effect [16,17,18], and multiple basic studies have also shown that electric fields can significantly affect the condensation process of water vapor [19,20,21], providing strong evidence for active dehumidification and fog suppression technology based on electric fields. Existing achievements mainly focus on the mechanism of electric field on the static and dynamic behavior of droplets [22,23,24,25,26,27]: He et al. [22] demonstrated that an electric field can alter the state of a droplet, where an initial Cassie-state droplet can gradually transition to a Wenzel state under an external electric field. Miqdad et al. [28] examined the effect of an external electric field on the wetting transition of nanoscale droplets across different nanopillar structures, revealing that the sagging of the liquid–gas interface between two consecutive pillars determines the charge required for the wetting transition. Zhang et al. [25] employed molecular dynamics simulations to study the wetting statics and dynamics of nanoscale water droplets on nanostructured surfaces under a vertical electric field, finding that the electric field induces electrostretching, electrowetting, changes in solid–liquid interfacial tension, and pinning at the triple line, collectively influencing the spreading exponent and static contact angle of the nanodroplet. Yan et al. [29] showed that the voltage amplitude and frequency of a tangential alternating current (AC) electric field are critical factors affecting droplet dewetting. He et al. [30] investigated the coalescence behavior of two charged droplets under a pulsed direct current (DC) electric field, discovering that different waveforms affect the contact time, deformation ratio, and critical field strength of droplet coalescence.
The above research findings demonstrate that the presence of an electric field can regulate the behavior of water molecules. However, the condensation behavior of water molecules under external electric fields at the nanoscale remains incompletely understood. To reveal the microscopic effect by which electric fields influence the condensation of water molecules on surfaces with different wettability, this study employs molecular dynamics simulations to systematically analyse how electric field strength and surface wettability influence the condensation process of water molecules on hydrophilic and hydrophobic surfaces, examining both condensation rate and condensation morphology.

2. Models and Methods

2.1. Model Specifications

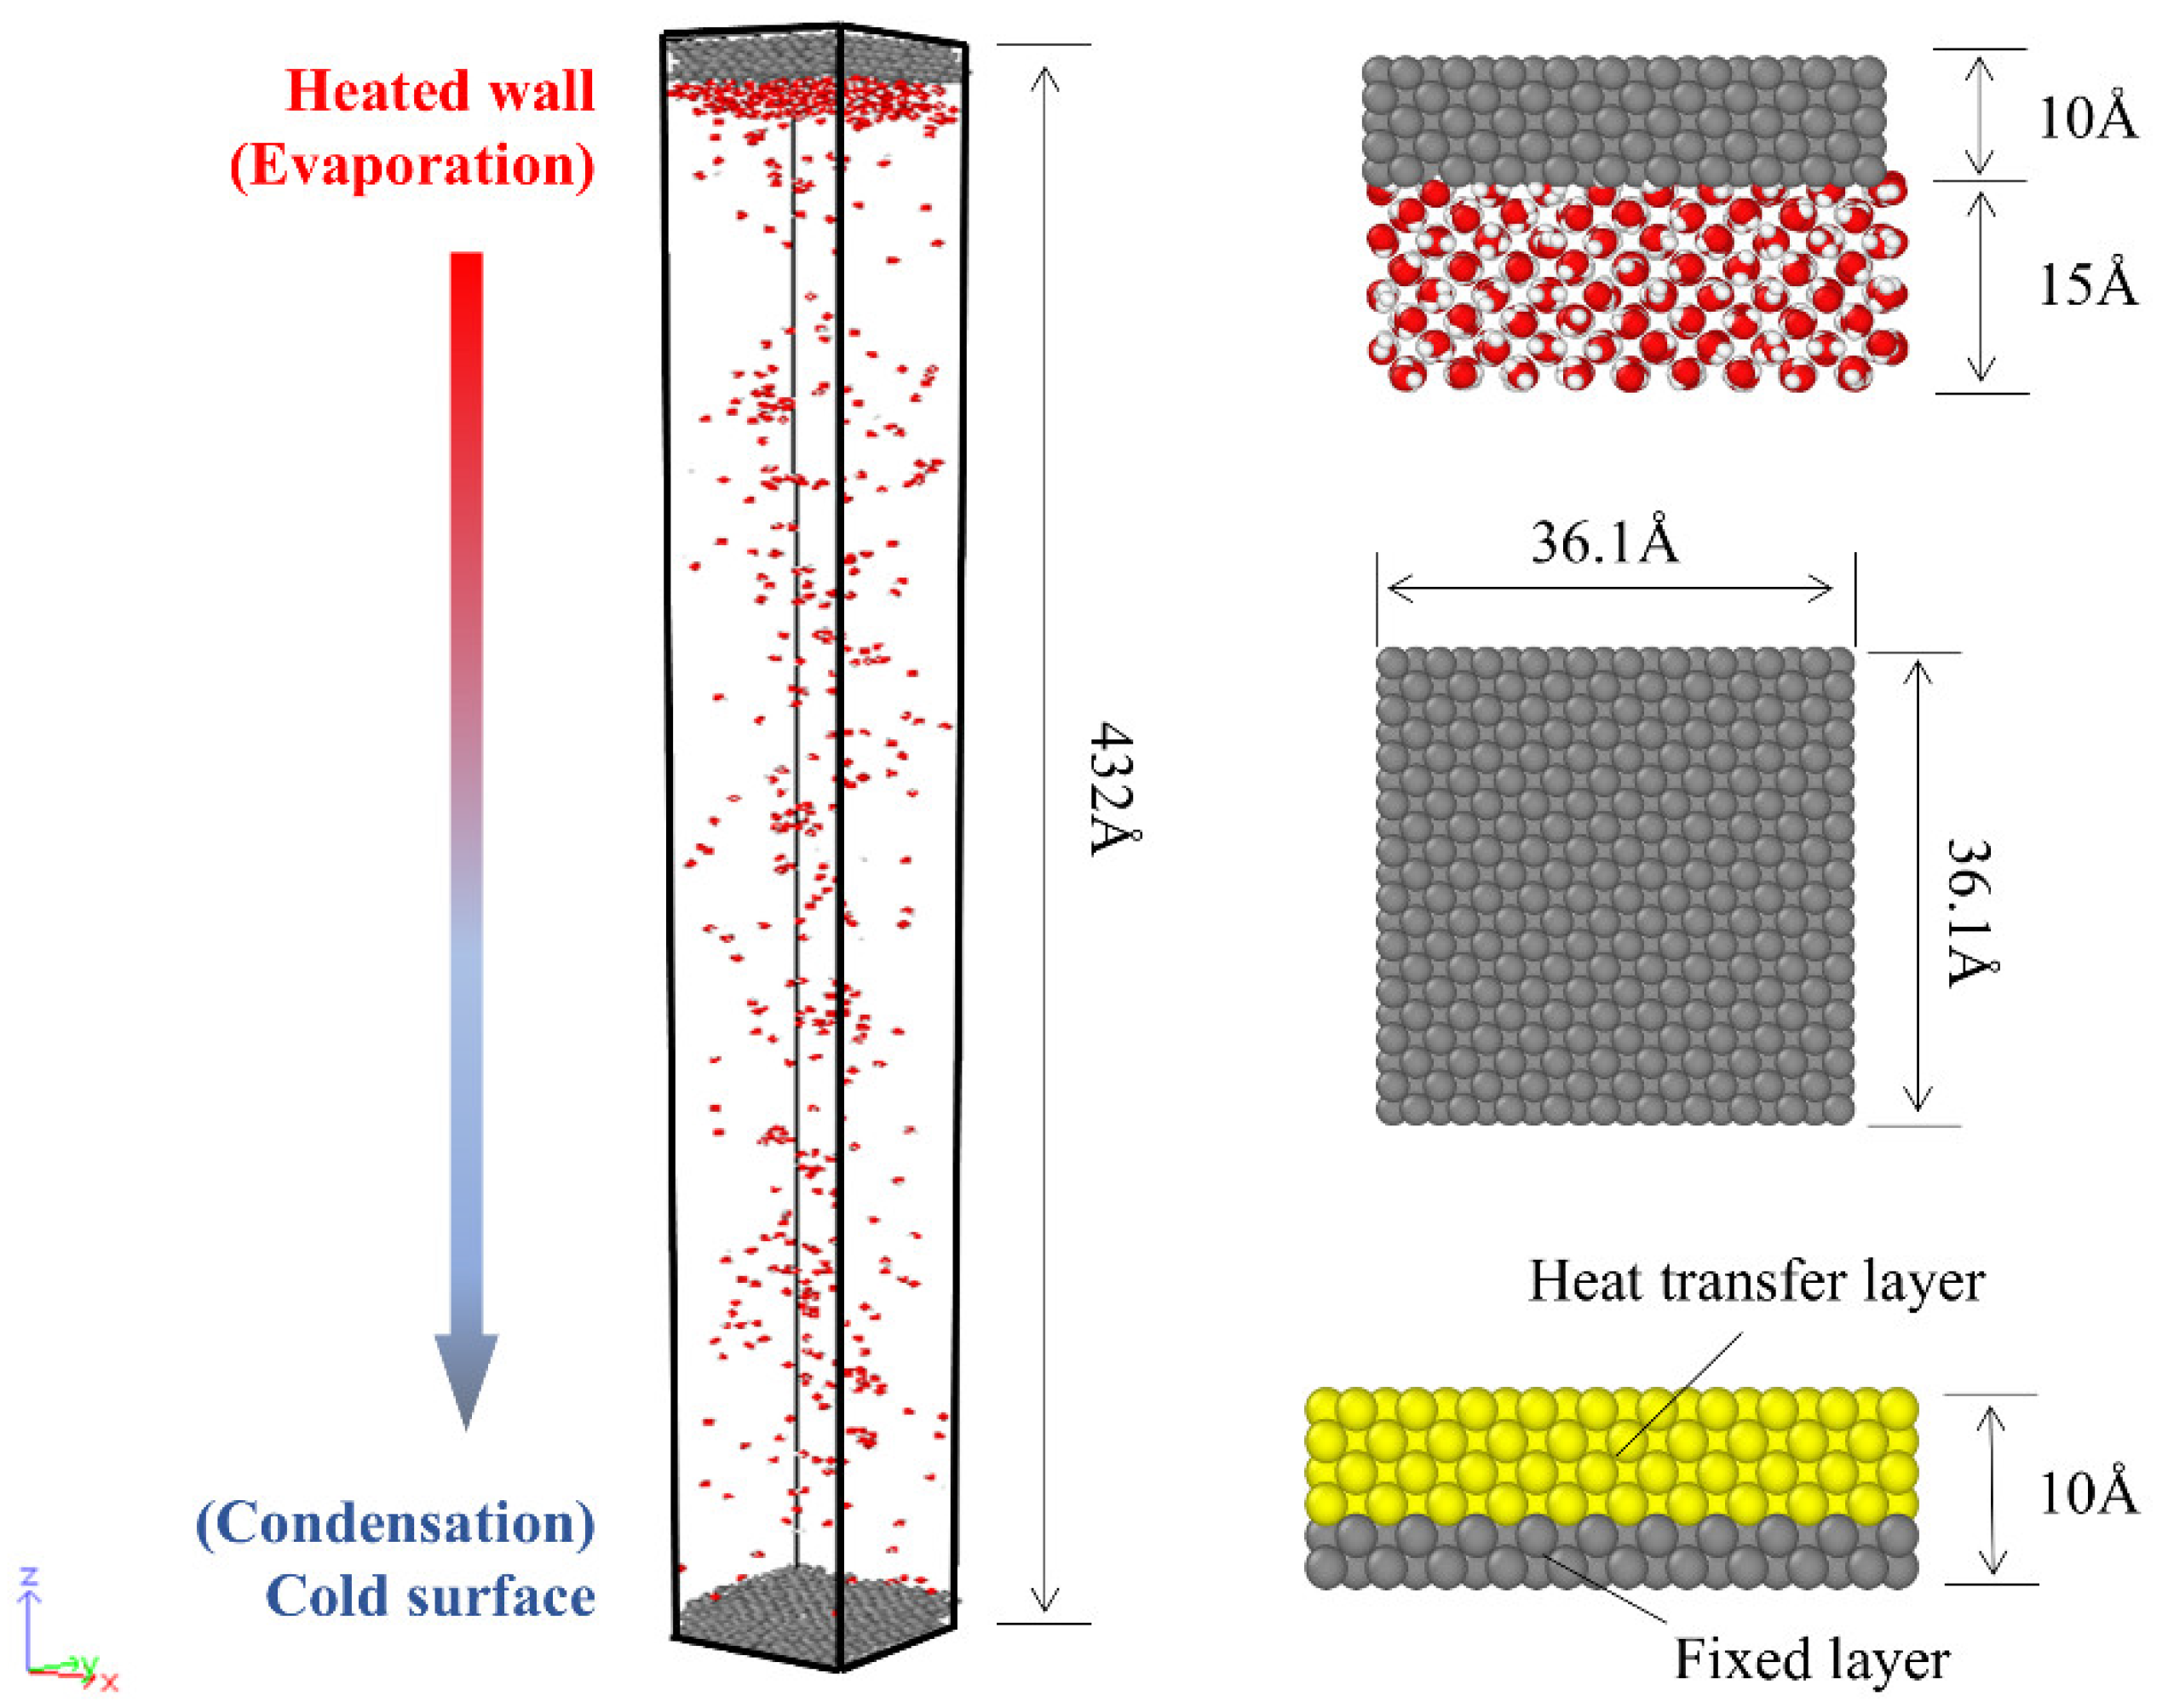
The initial configuration of the Cu-H2O simulation system is shown in Figure 1. The simulated box is a cuboid with a cross-sectional area of 36.1 Å × 36.1 Å and a height set at 432 Å to prevent the influence of condensation on the lower substrate surface from the upper evaporation area [31,32,33]. The upper part consists of a solid copper substrate and a water film adhered to it, while the lower part is another solid copper substrate. The liquid water film has a thickness of 15 Å, containing 624 water molecules. The copper substrate adopts an FCC lattice structure with a lattice constant of 3.61 Å and a density of 8.92 g/cm3. Both the upper substrate and the lower substrate are composed of six layers of copper atoms. The top two layers of the upper substrate and the bottom two layers of the lower substrate are fixed to prevent the substrate from deformation, and the remaining four layers of the substrate are used as thermostats to control the temperature.
The interaction forces between copper atoms in the substrate are described using the embedded-atom method (EAM) potential for Cu [34], which has been widely employed in molecular dynamics simulations of metallic atoms. The SPC/E water model is adopted to estimate the interactions between water molecules, as this model has been demonstrated to adequately describe various properties of water [35,36]. The interaction between water molecules is represented by the following equation [37]:
U i j = 1 4 π ε 0 q i q j r i j + 4 ε i j σ i j r i j 12 σ i j r i j 6
where ε and σ represent the energy and distance unit parameters of the Lennard-Jones (L-J) potential, respectively, where ε denotes the potential well depth and σ indicates the distance at which the interparticle potential equals zero. The term rij denotes the distance between atom i and atom j. ε0 is the permittivity of the vacuum. The first term on the right-hand side of Equation (1) corresponds to the long-range electrostatic force between charged particles, while the second term represents the short-range force between particles. For the interactions between Cu and O atoms, the improved Lorentz–Berthelot combining rules [38,39] are employed to calculate the potential energy ε C u O and characteristic length σ C u O between these two atomic species. In this model, the parameters for Cu atoms are ε C u = 0.40932 eV and σ C u = 2.338 Å.
ε C u O = λ ε C u ε O
σ C u O = σ C u + σ O 2
where λ is the potential energy interaction coefficient between atoms (Cu and O). By adjusting the coefficients, the interaction forces between atoms can be altered, thereby characterizing different surface wettability [40].
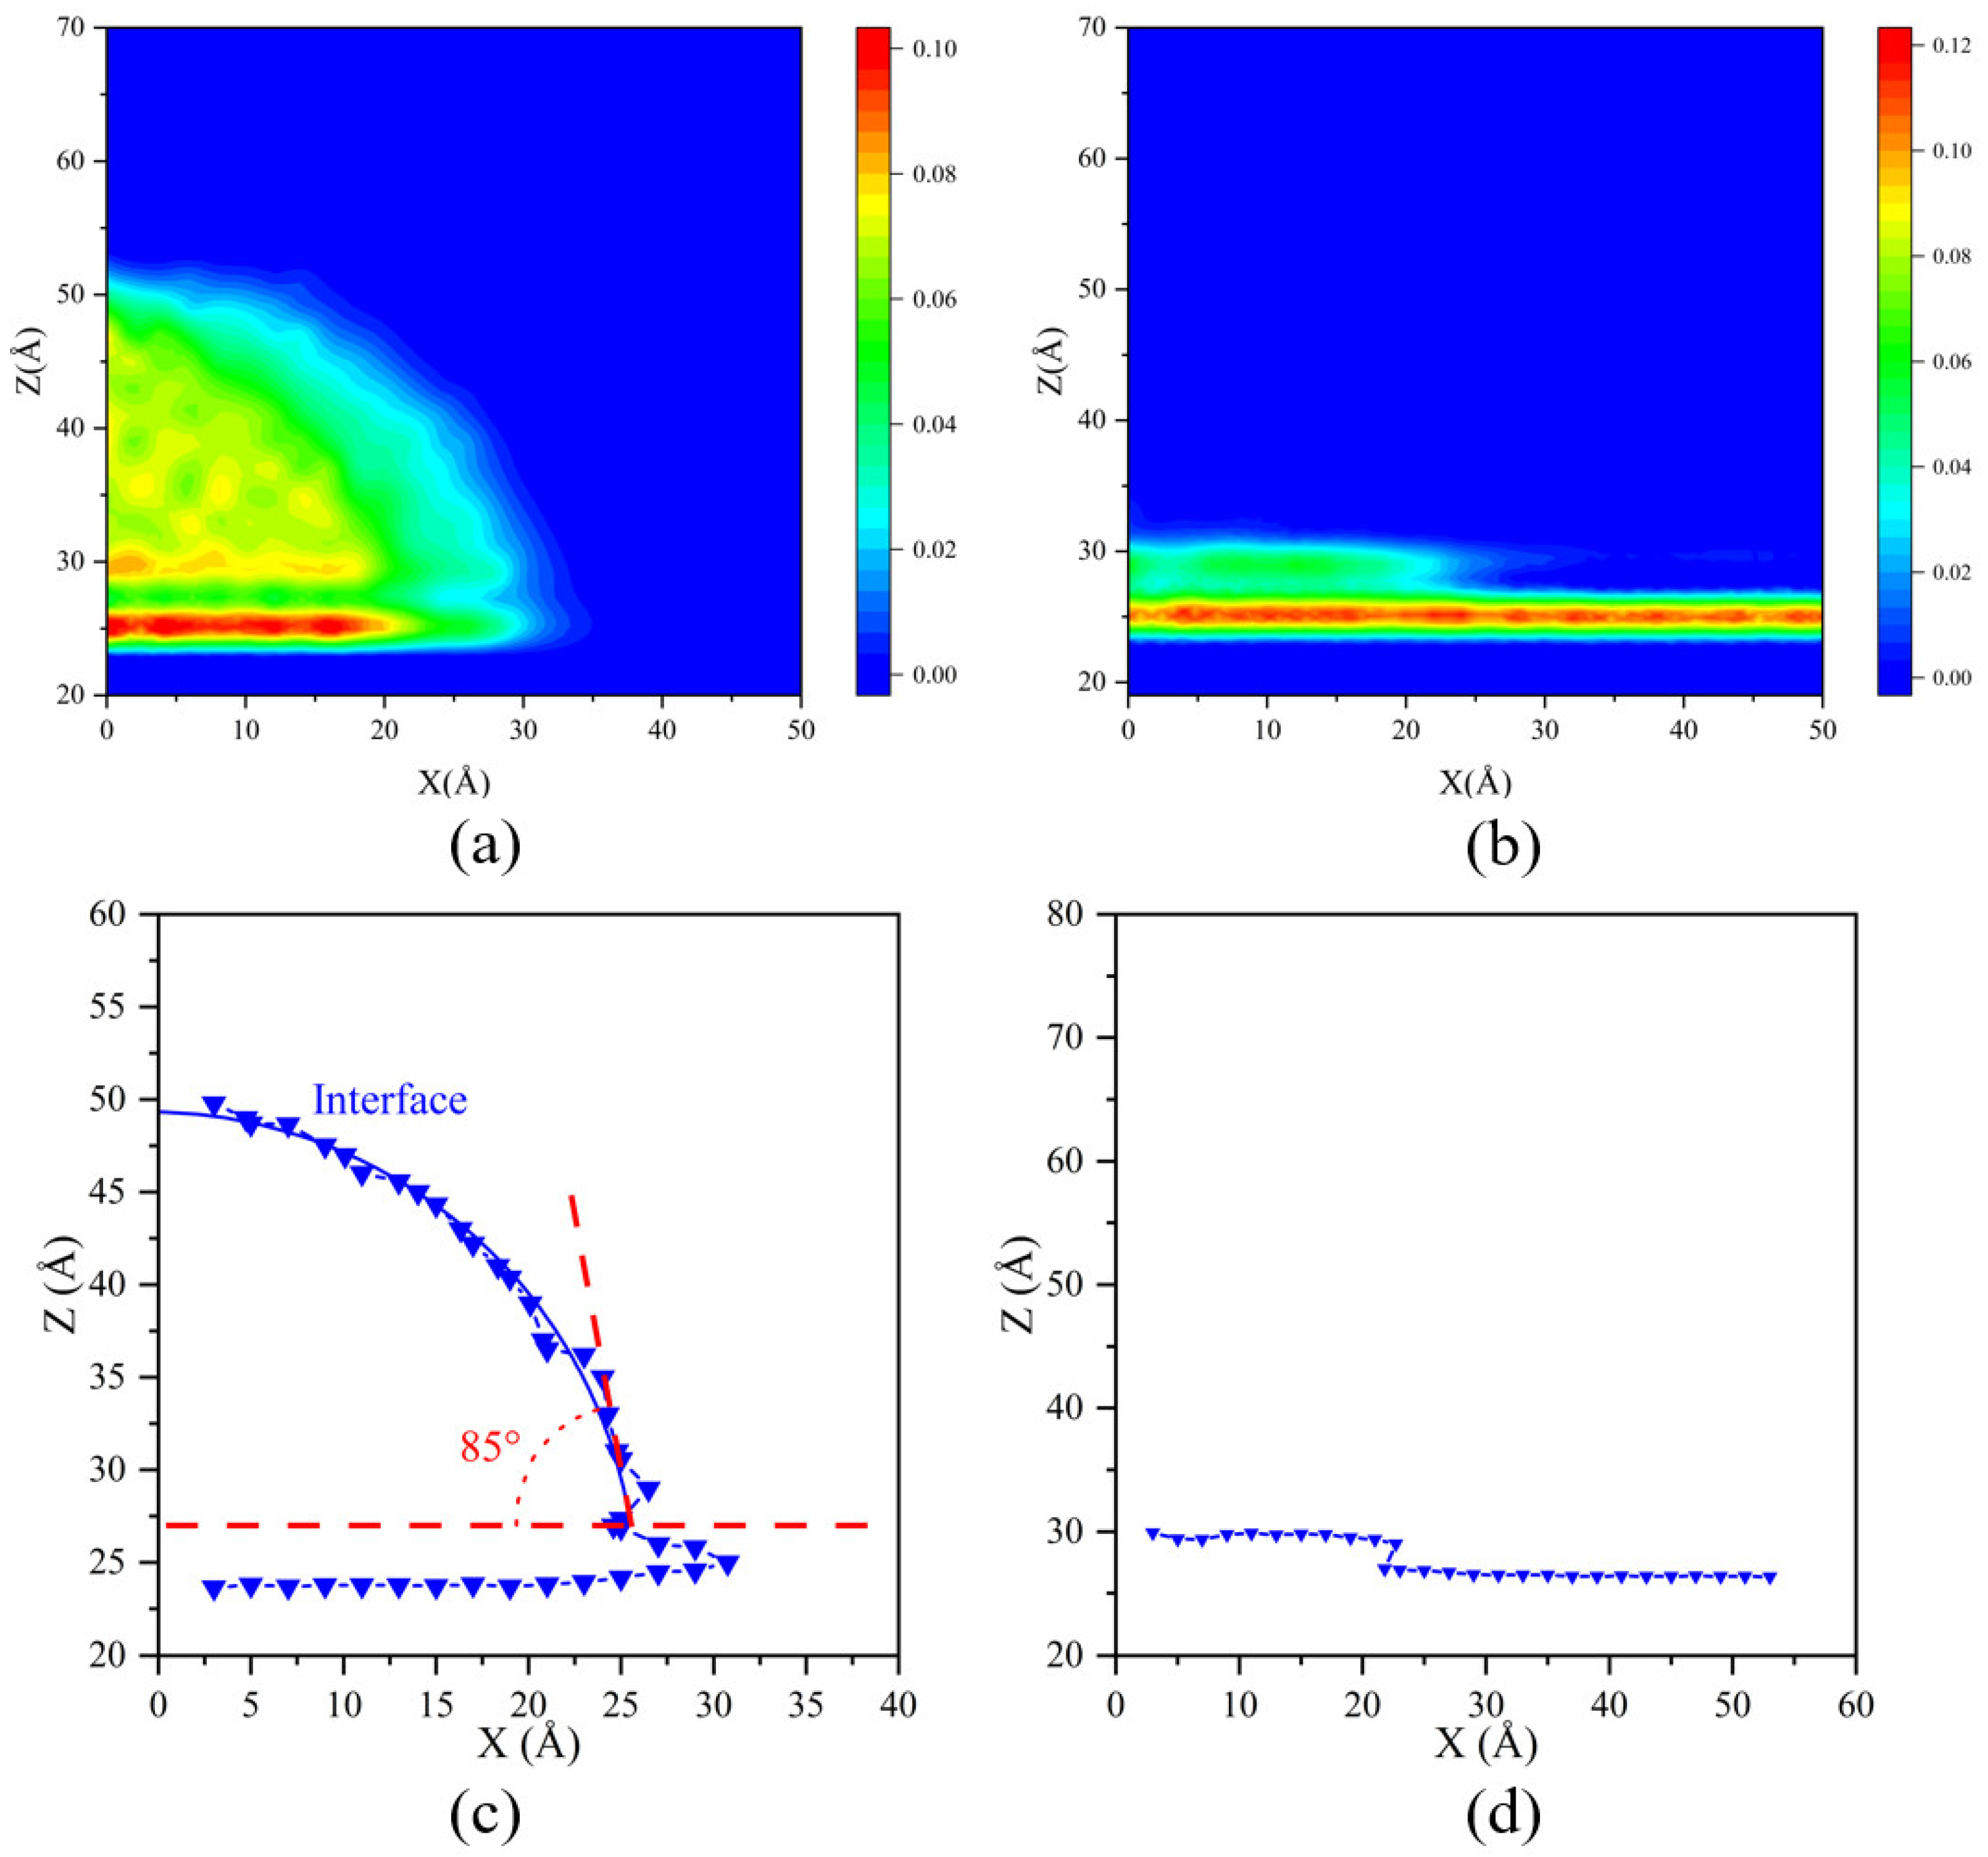
The wettability of an ideal solid surface can be characterised by its intrinsic contact angle, which may be altered by adjusting the solid–liquid interactions to modify the inherent contact angle of the ideal solid surface [41,42]. This study adjusted the α parameter to set the energy parameters between the Cu substrate and O to 0.02 eV and 0.008 eV respectively, representing hydrophilic and hydrophobic surfaces. Figure 2 displays the density maps and contact angles of water droplets on various surfaces. The contact angle can be determined by selecting points with a density of 0.5 g/cm3 to fit the solid–liquid interface curve, and obtaining the tangent at the intersection point of the boundary curve and the substrate surface. It can be observed that when ε C u O is 0.008 eV, H2O appears in the form of droplets, with a contact angle of 85°, indicating that the surface is hydrophilic, whereas at ε C u O = 0.02 eV, H2O fully diffuses on the substrate surface, with a contact angle of 0, indicating that the surface is hydrophobic. The energy parameter ε C u O between the upper Cu substrate and water molecules was uniformly set to 0.02 eV to maintain consistent evaporation conditions across all scenarios, ensuring the rationality of the simulations.

2.2. Simulation Methodology

All molecular dynamics simulations were performed using the LAMMPS-2Aug2023 software package [43]. Throughout the simulations, the cutoff distance for all interactions was set to 10 Å. The Particle–Particle–Particle–Mesh (PPPM) method was employed to calculate long-range electrostatic interactions with an accuracy of 10−4. To enhance computational efficiency, the SHAKE algorithm was utilized to constrain the bonds and angles of water molecules [9]. Periodic boundary conditions were applied in the x and y directions, while non-periodic fixed conditions with elastic and adiabatic boundaries were implemented in the z direction. The Velocity Verlet algorithm was adopted to compute atomic motions with a time step of 1 fs, and the atomic velocities and positions were output every 1000 fs.
All simulations are divided into three stages. Firstly, the whole system is relaxed at 298 K in the NVT ensemble to minimize the energy of the whole system, and the process duration is 0.2 ns. Then, the nose Hoover thermostat is removed, and the NVE ensemble is applied to the system. At the same time, the Langevin thermostat is applied to the upper and lower substrates respectively, and the upper substrate is heated to 498 K, while the lower substrate is stabilized at 298 K, and the process duration is 50 ps. Finally, the vertical upward uniform electric field is applied to the system, and the temperature of the upper substrate is stabilized at 498 K, and the temperature of the lower substrate is stabilized at 298 K. During this phase, as the condensation process on the hydrophobic surface proceeds more slowly, the simulation durations for the hydrophilic and hydrophobic surfaces are set to 2 nanoseconds and 3 nanoseconds respectively. The simulation process and results were visualized using the open-source tool OVITO 3.10.0 [44].

3. Results and Discussion

3.1. Condensation Process of Water Molecules

Before the formal simulation began, we analyzed the impact of the lateral size of the simulation box on condensation behavior. By expanding the lateral size of the system and conducting comparative simulations under the same conditions, the results indicated that the phenomena observed in systems with different sizes were consistent, and no significant differences caused by spatial constraints were observed. The relevant results are provided in the Supplementary Materials.
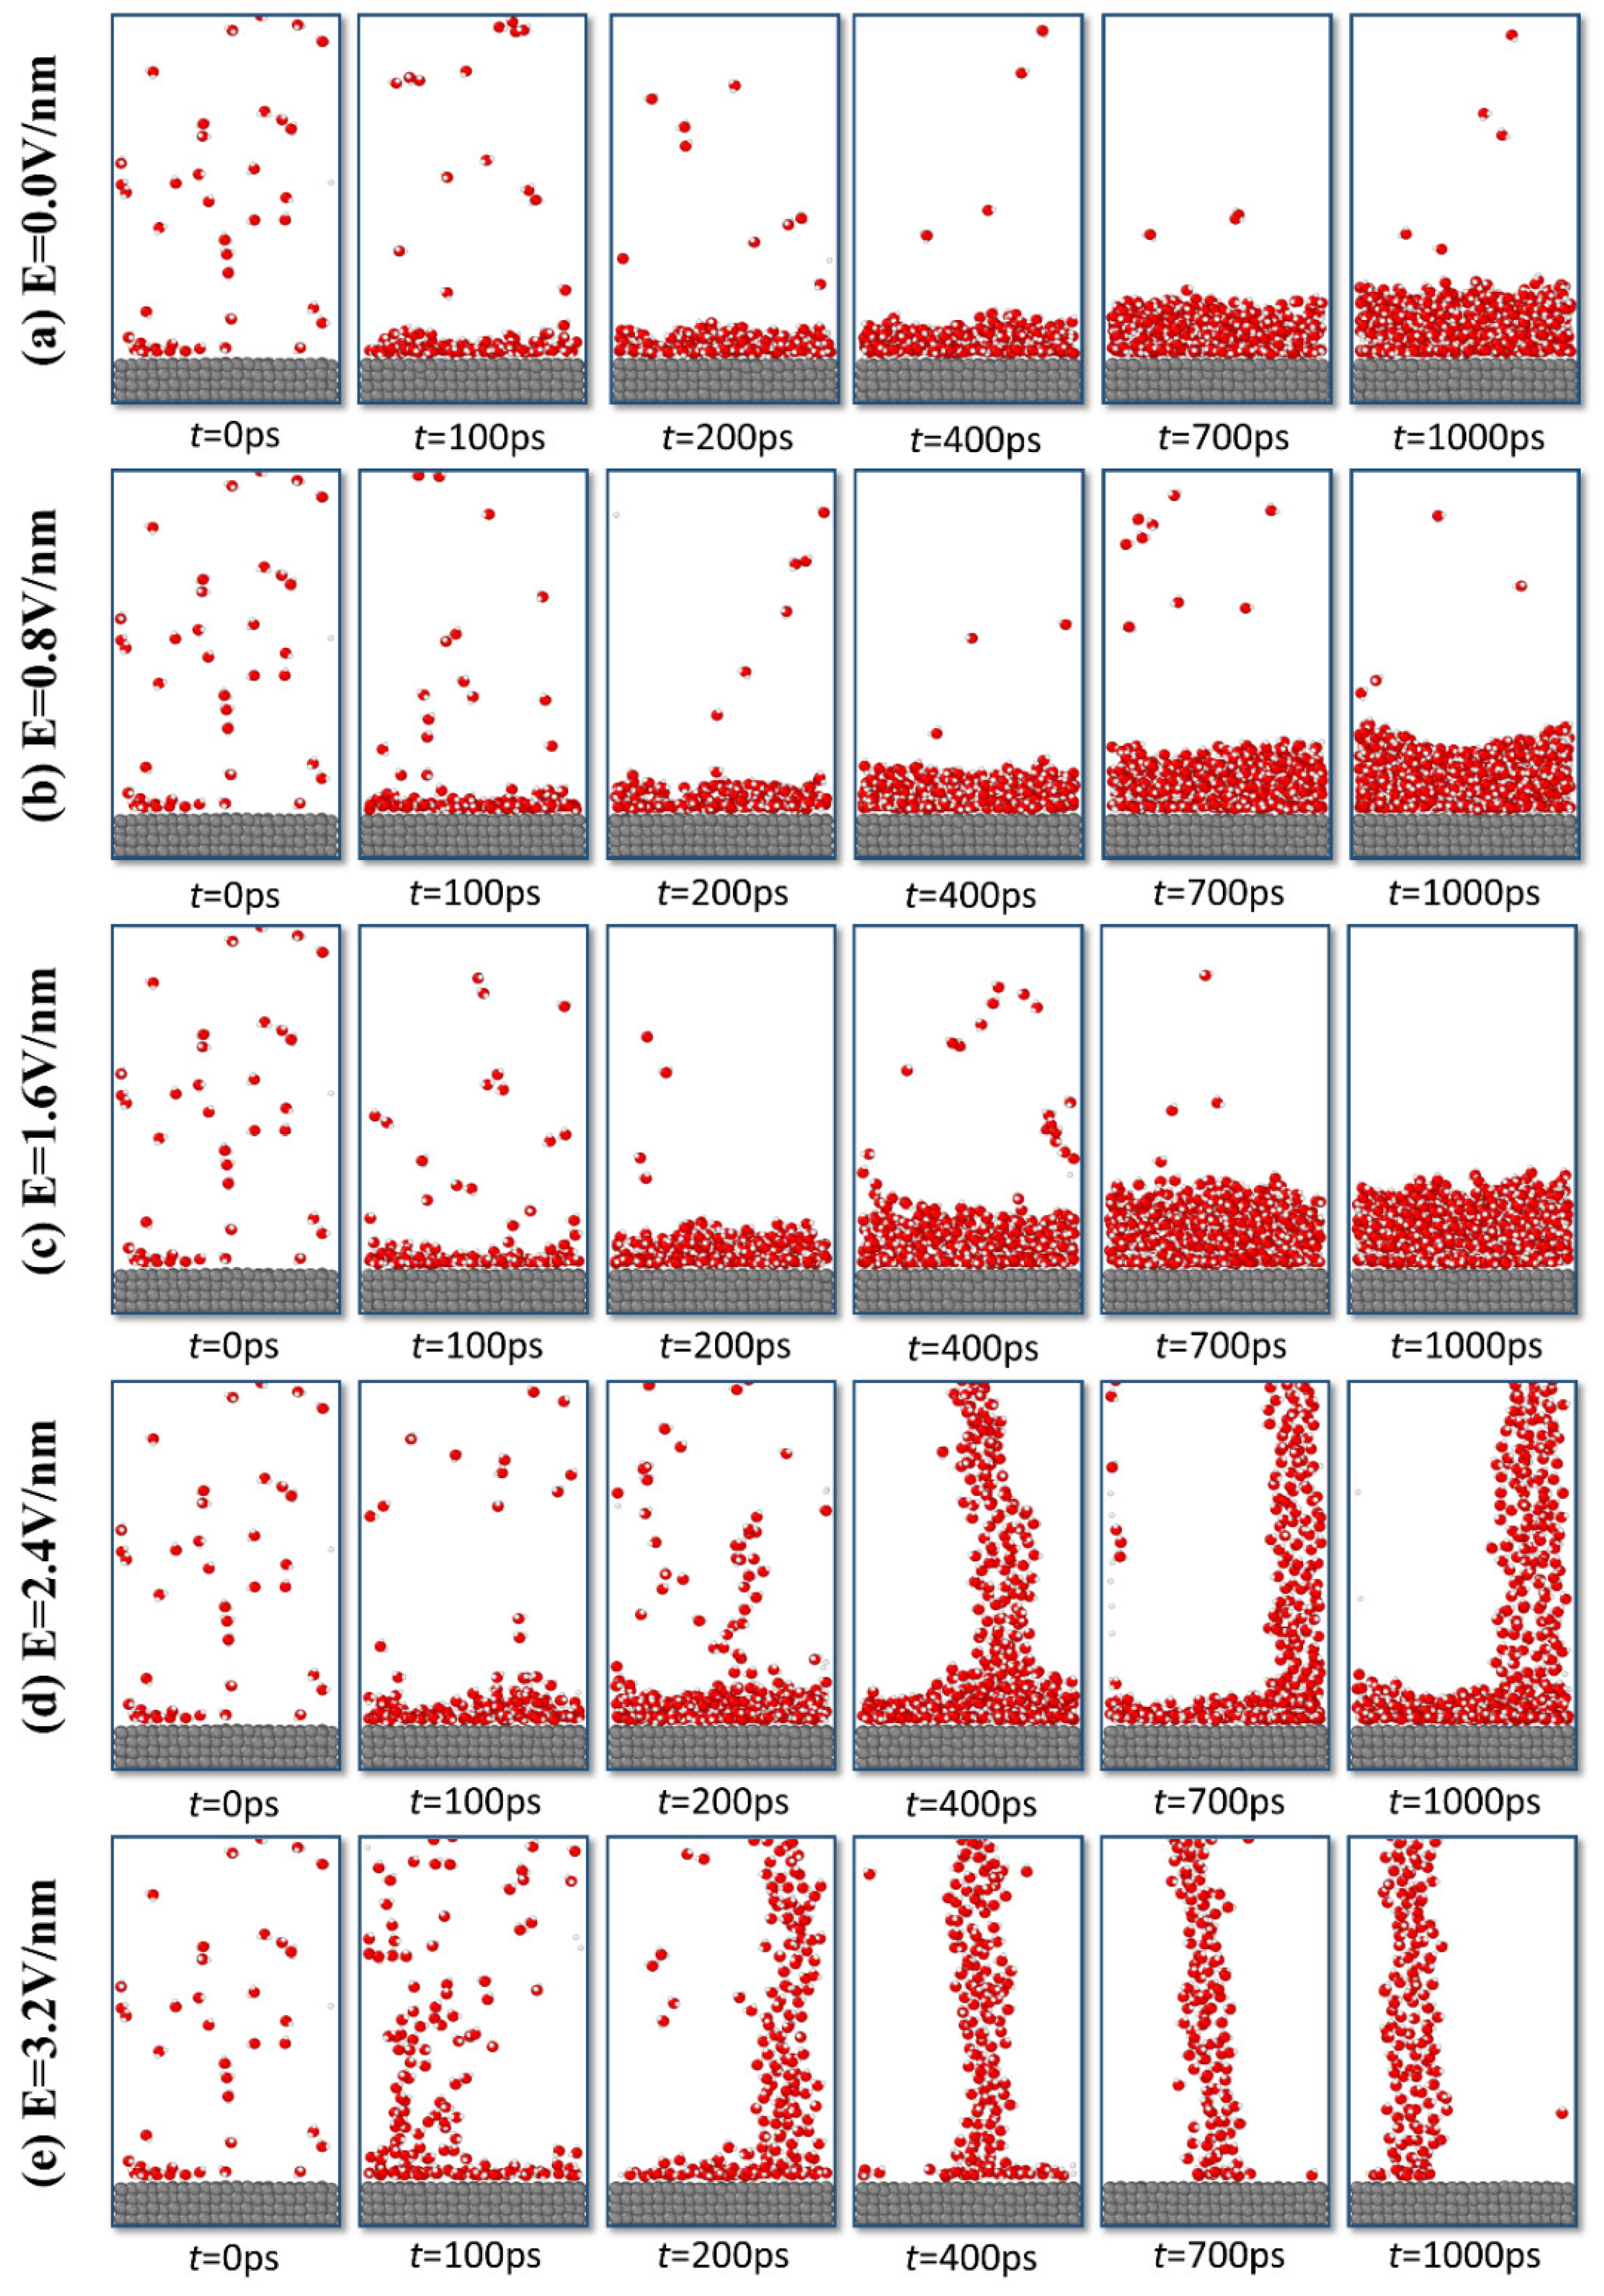
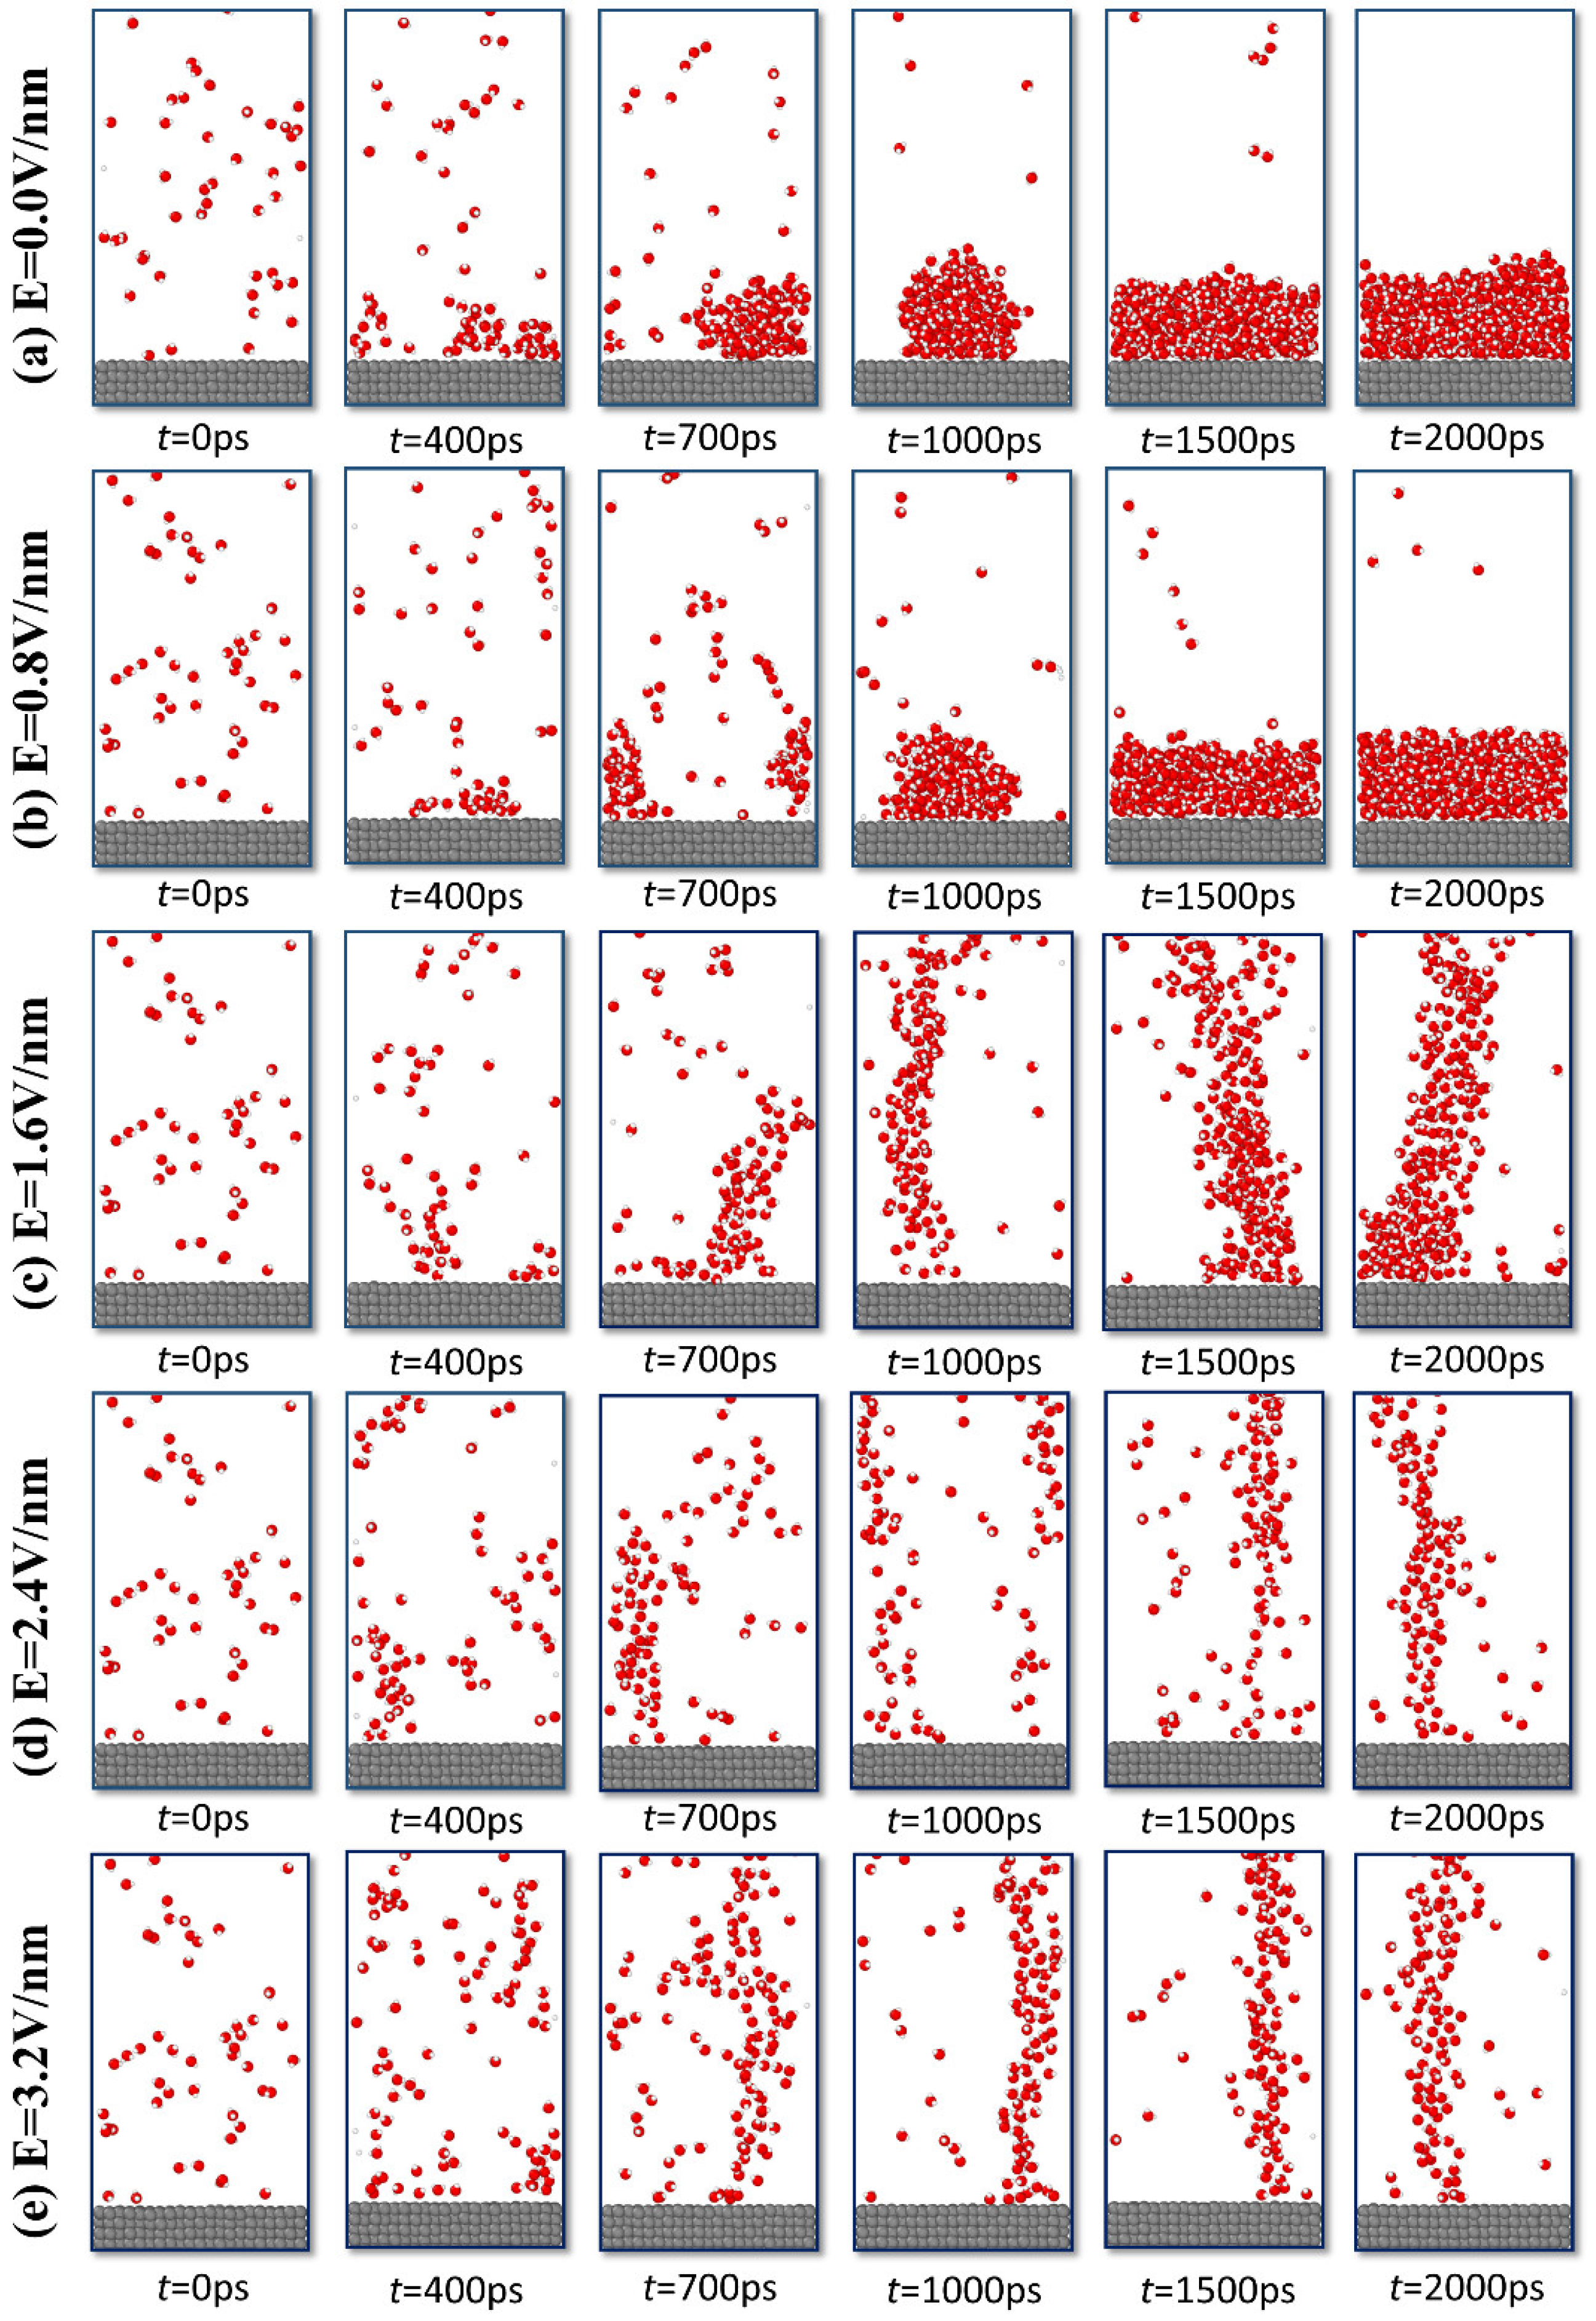
The condensation of water molecules on hydrophilic and hydrophobic surfaces under a vertically upward electric field was simulated, with field strengths set at 0.0 V/nm, 0.8 V/nm, 1.6 V/nm, 2.4 V/nm, and 3.2 V/nm, respectively. Figure 3 and Figure 4 present snapshots of the condensation process on hydrophilic and hydrophobic surfaces, respectively. To clearly demonstrate the condensation behavior under varying electric fields, only the lower portion of the simulated system is displayed.
Figure 3 illustrates the condensation process of water molecules on a hydrophilic surface. Since the condensation process stabilizes after 1 ns with minimal variation, these diagrams only depict the 0–1 ns period to better showcase dynamic details. At the onset of condensation, water molecules undergo random motion within the system and collide with the substrate. Upon contact with the substrate surface, part of their kinetic energy is converted into heat. Since the substrate temperature is lower than that of the water molecules, they transfer a portion of their energy to the substrate, resulting in a decrease in their movement speed. Simultaneously, under the influence of van der Waals forces and Coulomb forces, some water molecules gradually adsorb onto the cold surface, initiating cluster formation. Due to the stronger interaction between water molecules and copper atoms compared to that among water molecules themselves, water molecules preferentially adsorb onto the copper surface. As more water molecules attach to the cold surface, a thin film forms. Subsequently, the condensation morphology under different electric fields changed. At low electric field strength (E < 2.4 V/nm) it was a process of the film getting thicker and thicker; at the electric field strength E of 2.4 V/nm, the newly condensed water molecules formed a column in the upper part of the film, and at the electric field strength E of 3.2 V/nm, the film was disappearing, and the whole condensation changed into a columnar condensation.
Figure 4 illustrates the condensation process of water molecules on a hydrophobic surface. Since the condensation stabilizes after 2 ns, only the process from 0 to 2 ns is displayed. Similar to the condensation on hydrophilic surfaces, the final condensation morphology can still be categorized into filmwise condensation and columnar condensation. The differences lie in the following aspects: First, during the initial stage of condensation, the morphology is dropwise condensation. As the number of condensed water molecules increases and is constrained by the limited surface area, the droplets gradually expand and eventually merge to form a continuous liquid film. Second, the critical electric field strength required to trigger columnar condensation is lower on hydrophobic surfaces. On hydrophilic surfaces, columnar condensation occurs only when the electric field strength reaches E = 2.4 V/nm, whereas on hydrophobic surfaces, it occurs at a lower E = 1.6 V/nm. Finally, it is clearly observable that in the column-wise condensation structures formed on hydrophobic surfaces, the arrangement of water molecules is more loosely packed. Additionally, the radial dimensions of the columnar structures decrease as the electric field strength increases.

3.2. Condensation Rate

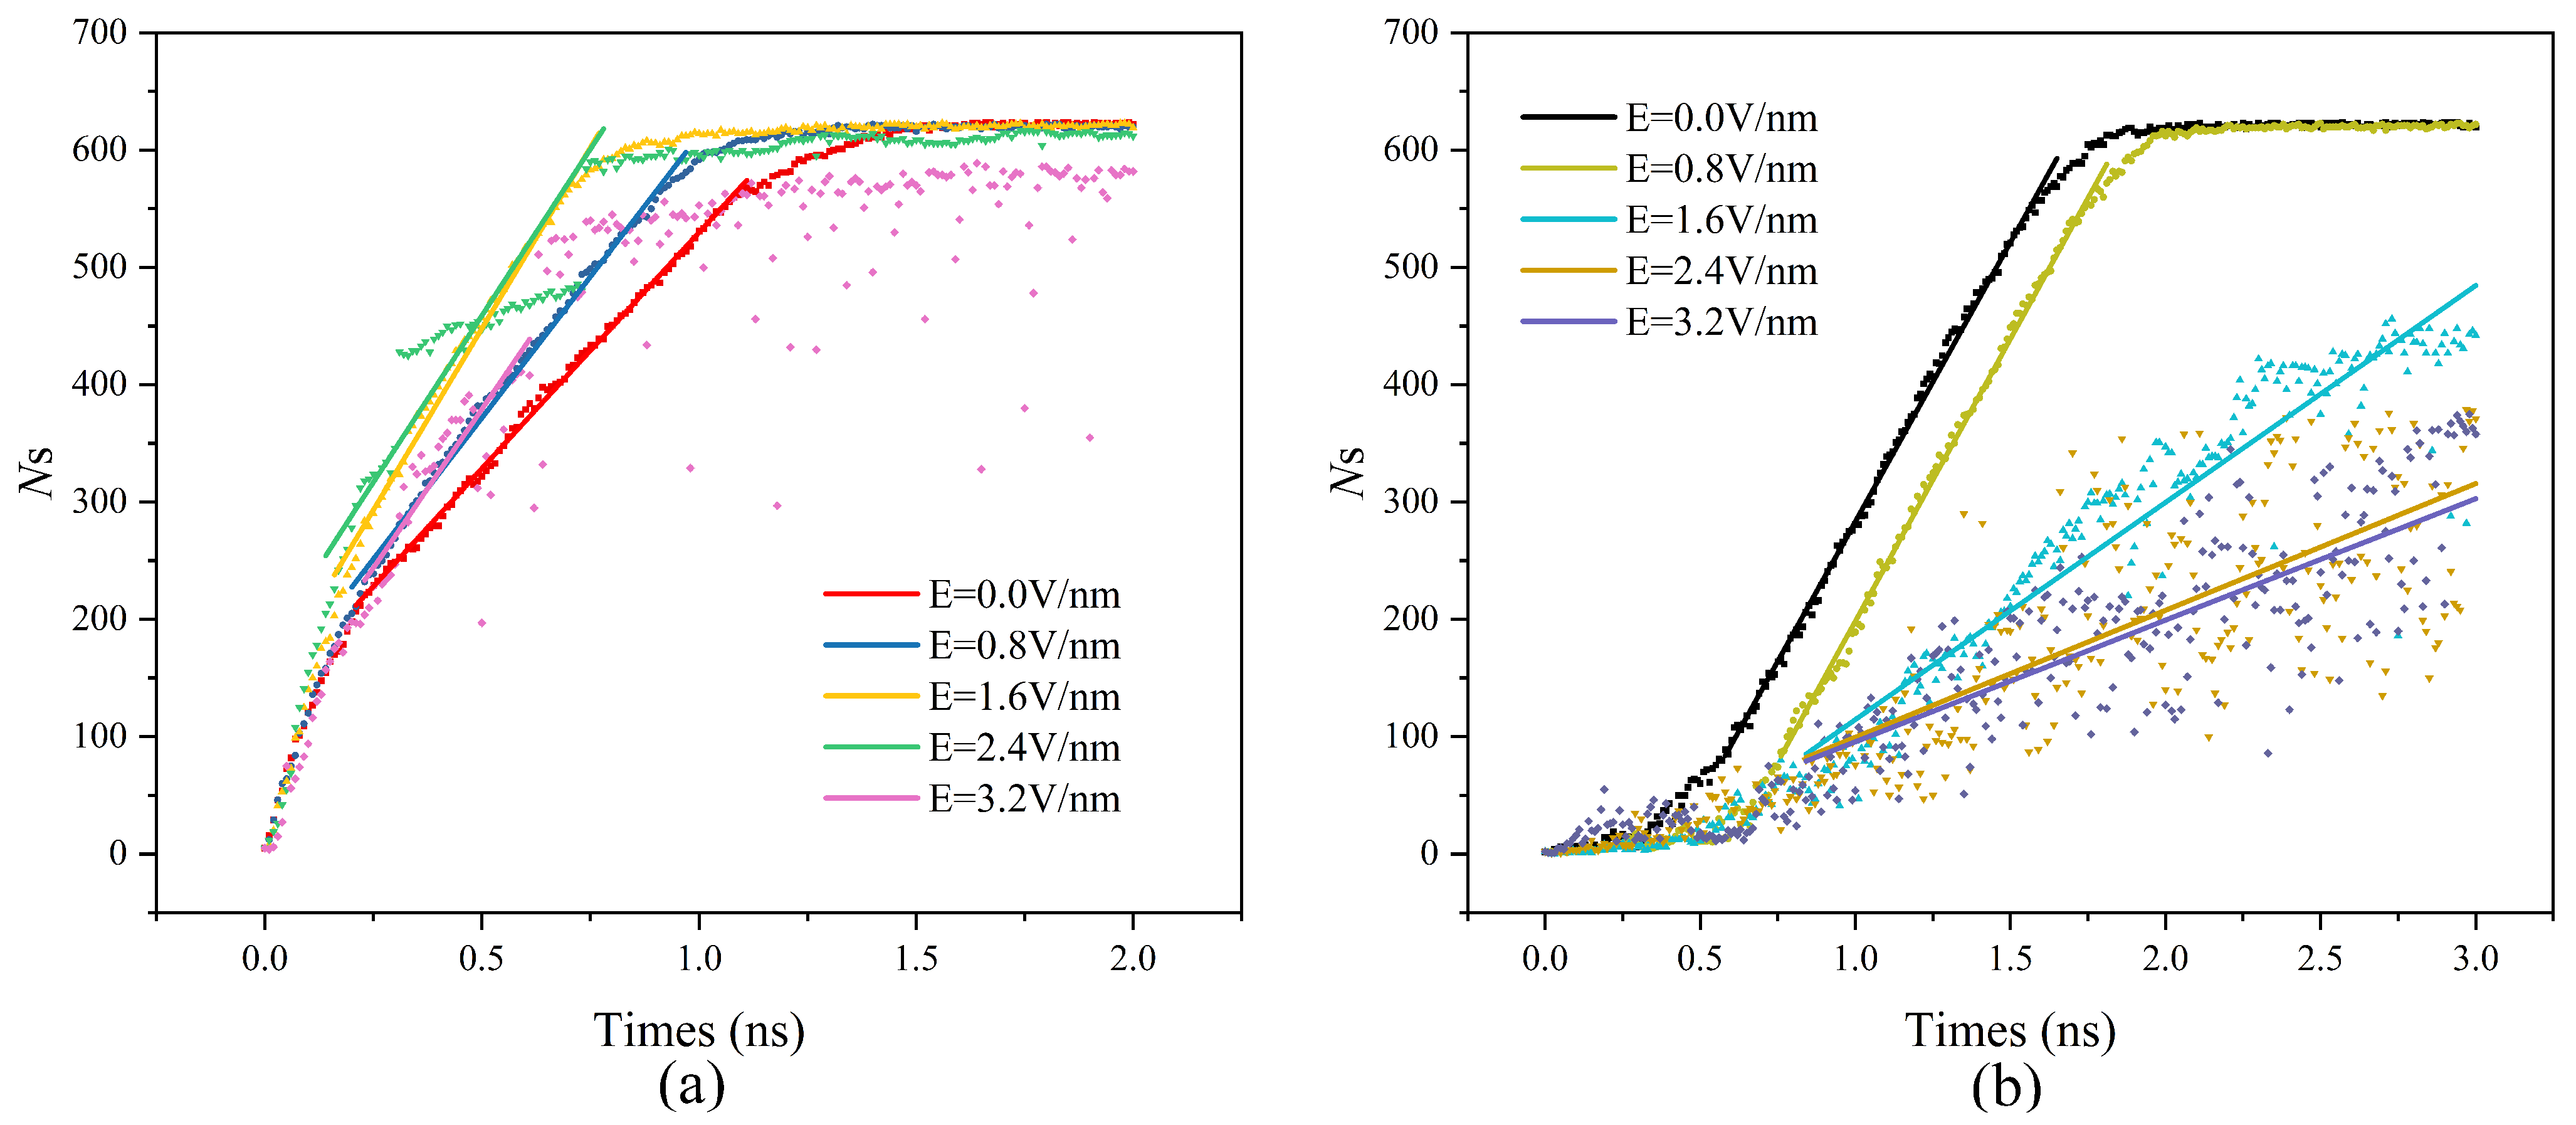
To provide a more detailed description of water molecule behavior during the condensation process, the changes in the number of clusters and molecules condensed on the base surface over time were counted separately. The Stillinger criterion was employed to determine whether a water molecule belonged to a cluster [45]. In this study, the threshold distance between two oxygen atoms was set at 3.36 Å [9,46]. Based on this, we further define: when the distance between any water molecule in a certain cluster and the substrate is less than 3.36 Å, the entire cluster is considered “condensed”. The condensation rate J = d N s / d t is defined as the rate of change in the number of water molecules Ns that are determined to be in a condensed state per unit time.
Figure 5 illustrates the temporal evolution of condensed molecular numbers on the substrate surface under varying electric field strength. The results demonstrate that under identical electric field strengths, hydrophilic surfaces exhibit a higher growth rate of condensed water molecules compared to hydrophobic surfaces, with their condensation processes reaching a steady state earlier. Hydrophilic surfaces typically stabilize around t = 1.4 ns, whereas hydrophobic surfaces require at least t = 1.6 ns to achieve equilibrium. This indicates that enhanced wettability significantly accelerates the condensation rate of water molecules, attributable to strengthened solid–liquid interactions that facilitate faster energy exchange between water molecules and the solid surface. Furthermore, fitting the condensation process during the stage where the number of condensed water molecules remains relatively stable allows for a more intuitive observation of the change in condensation rate J. The results in Figure 5a indicate that as the electric field strength increases, the condensation rate first increases and then decreases. Under high electric field conditions, a sudden surge in the number of condensed water molecules occurs. This is because, under strong electric fields, water molecules undergo homogeneous nucleation, and when pre-condensed molecular clusters in the space contact substrate-bound clusters, it triggers a sharp increase in condensation. The results in Figure 5b show that the increase in condensation rate with increasing electric field strength gradually decreases. These findings suggest that the influence of electric field strength on the condensation rate is modulated by surface wettability.
Furthermore, regardless of wettability, all curves can be classified into two types: when the condensation morphology is filmwise, the curves remain relatively smooth. Whereas in columnar condensation, the curves exhibit significant fluctuations, with hydrophobic surfaces displaying much larger amplitude variations than hydrophilic ones. This indicates that the bonding of water molecules in columnar condensation is unstable, undergoing continuous aggregation and separation. It is worth noting that the fluctuation amplitude increases with the increase in electric field strength. This is because as the electric field strengthens, water molecules become increasingly inclined to grow along the direction of the electric field, forming thinner columnar clusters that are more prone to fragmentation.
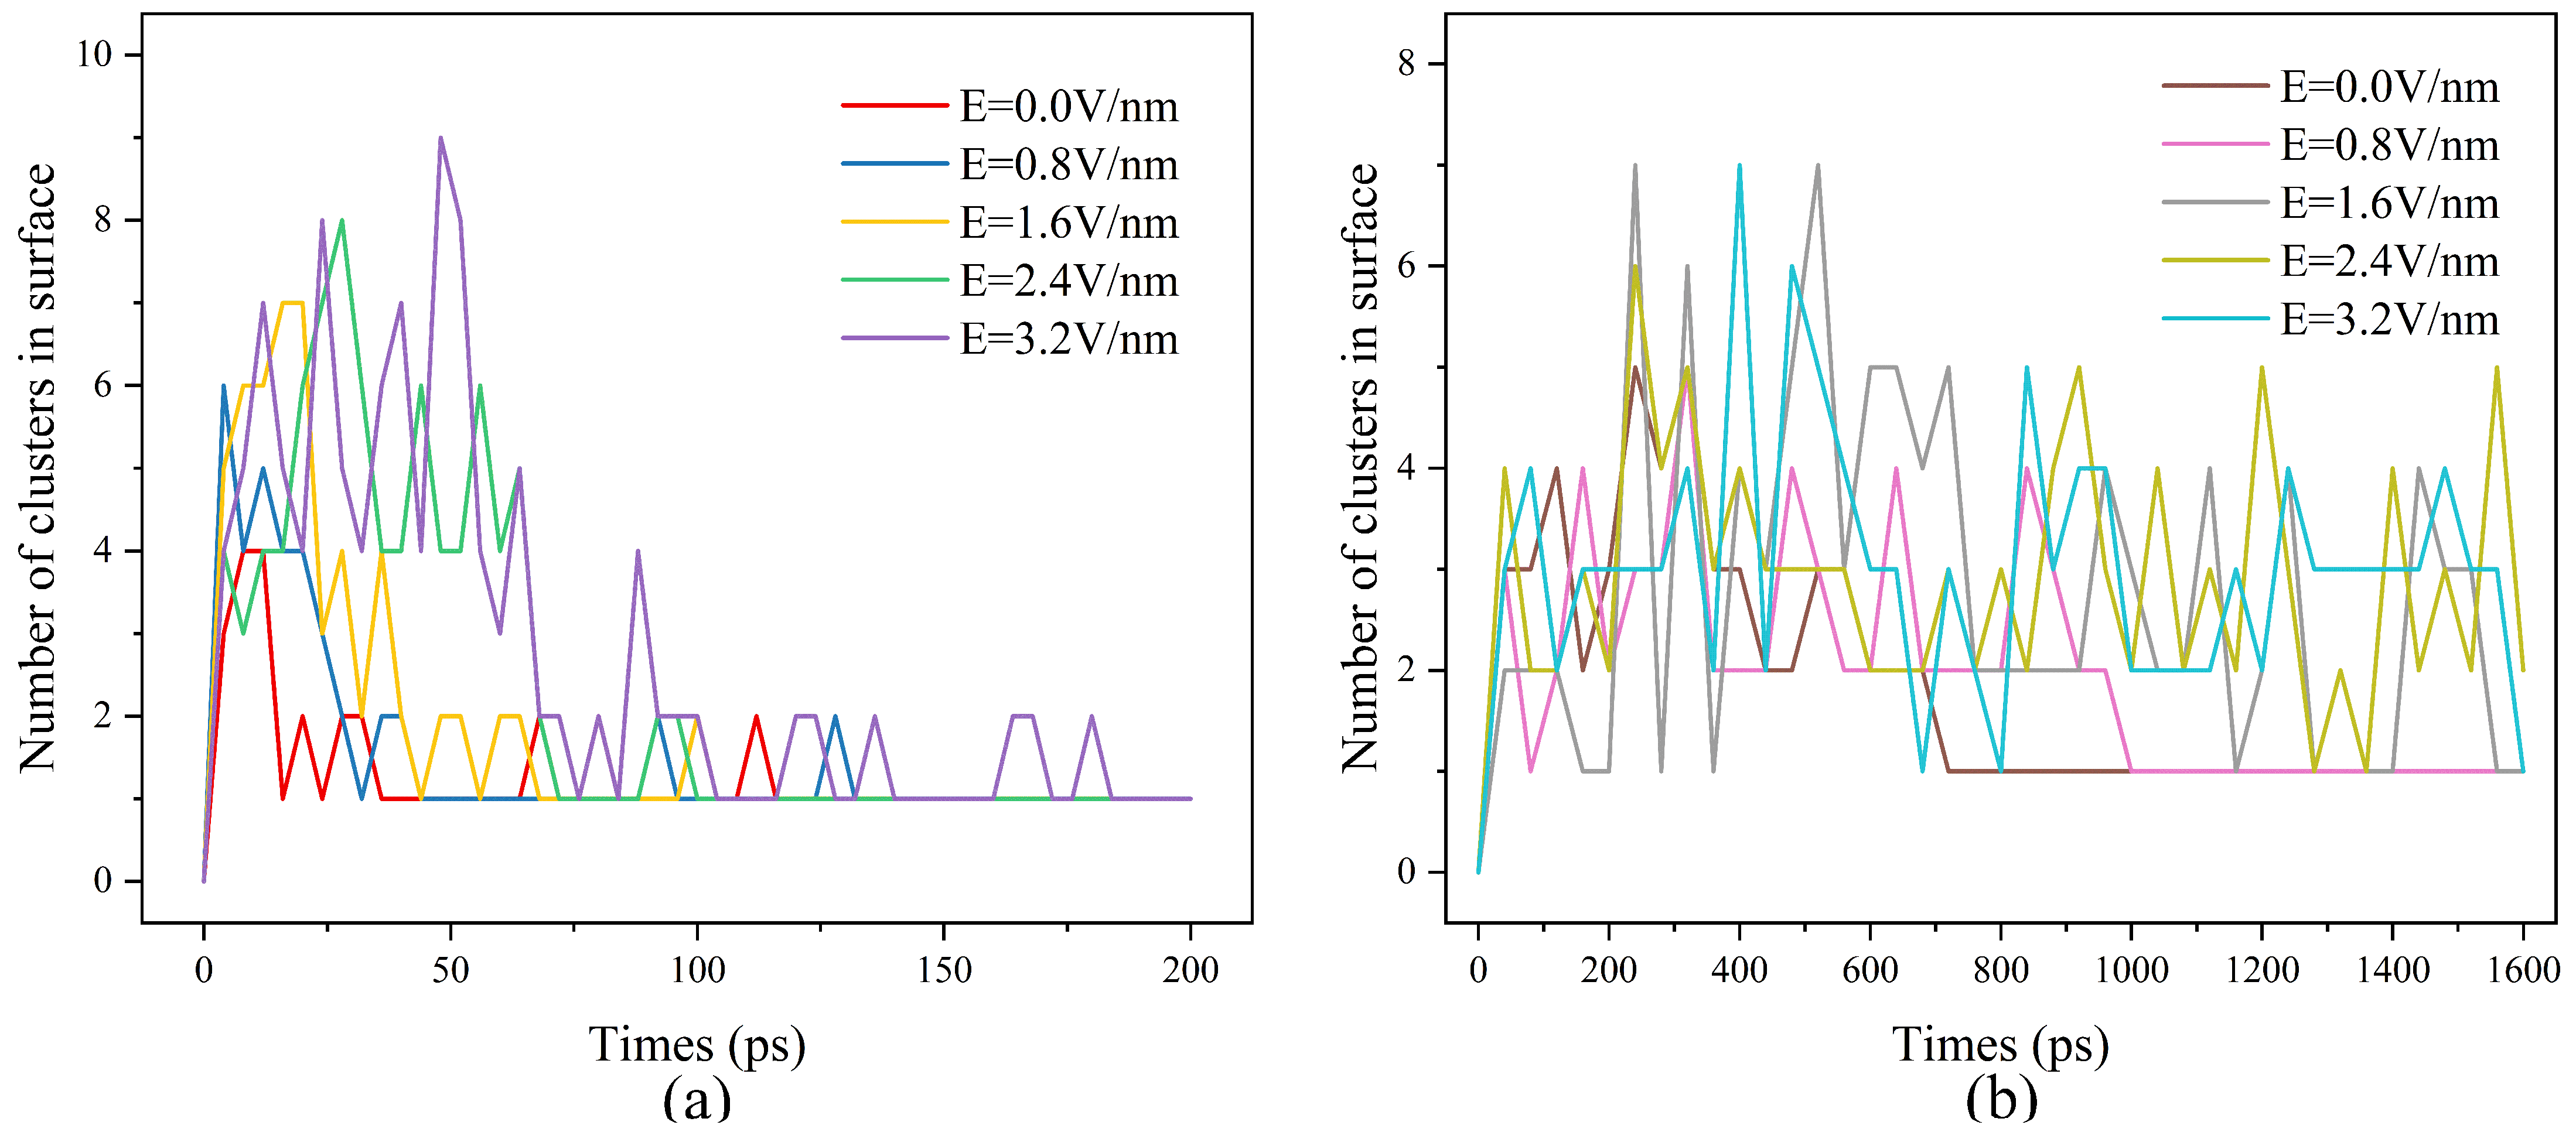
Figure 6 illustrates the temporal evolution of cluster counts on the substrate surface under varying electric field strength. To better demonstrate the dynamic patterns, the hydrophilic surface displays cluster count variations only within the 0–200 ps timeframe, while the hydrophobic surface shows changes within 0–1600 ps. As depicted in Figure 6a, during the 0–100 ps phase, the number of clusters rapidly increases, reaches a peak, and then gradually declines before stabilizing into a single large cluster. This demonstrates that at the onset of condensation, water molecules continuously form small clusters through mutual attraction. Over time, the number of small clusters increases until reaching a peak due to spatial constraints, during which clusters collide and merge with one another. After approximately 150 ps, the cluster count stabilizes—maintaining a value of 1 under electric field strengths of E ≤ 2.4 V/nm, while occasional fluctuations occur at E = 3.2 V/nm. This is attributed to the greater available space on the substrate surface in columnar condensation, allowing some water molecules to occasionally overcome the attraction of larger clusters and form small clusters on the substrate.
The evolution trend of clusters on hydrophobic surfaces is similar to that on hydrophilic surfaces (Figure 6b), but the time required to reach stability is significantly prolonged. Under E = 0.0 V/nm, stability is achieved around 760 ps, while under E = 0.8 V/nm, it occurs at approximately 990 ps. At higher electric field conditions (E = 1.6 V/nm, E = 2.4 V/nm, E = 3.2 V/nm), due to columnar condensation, the number of clusters remains in a fluctuating state. Moreover, the fluctuation amplitude of cluster numbers on hydrophobic surfaces is notably greater than that on hydrophilic surfaces, reflecting weaker intermolecular bonding and poorer cluster stability on hydrophobic surfaces.
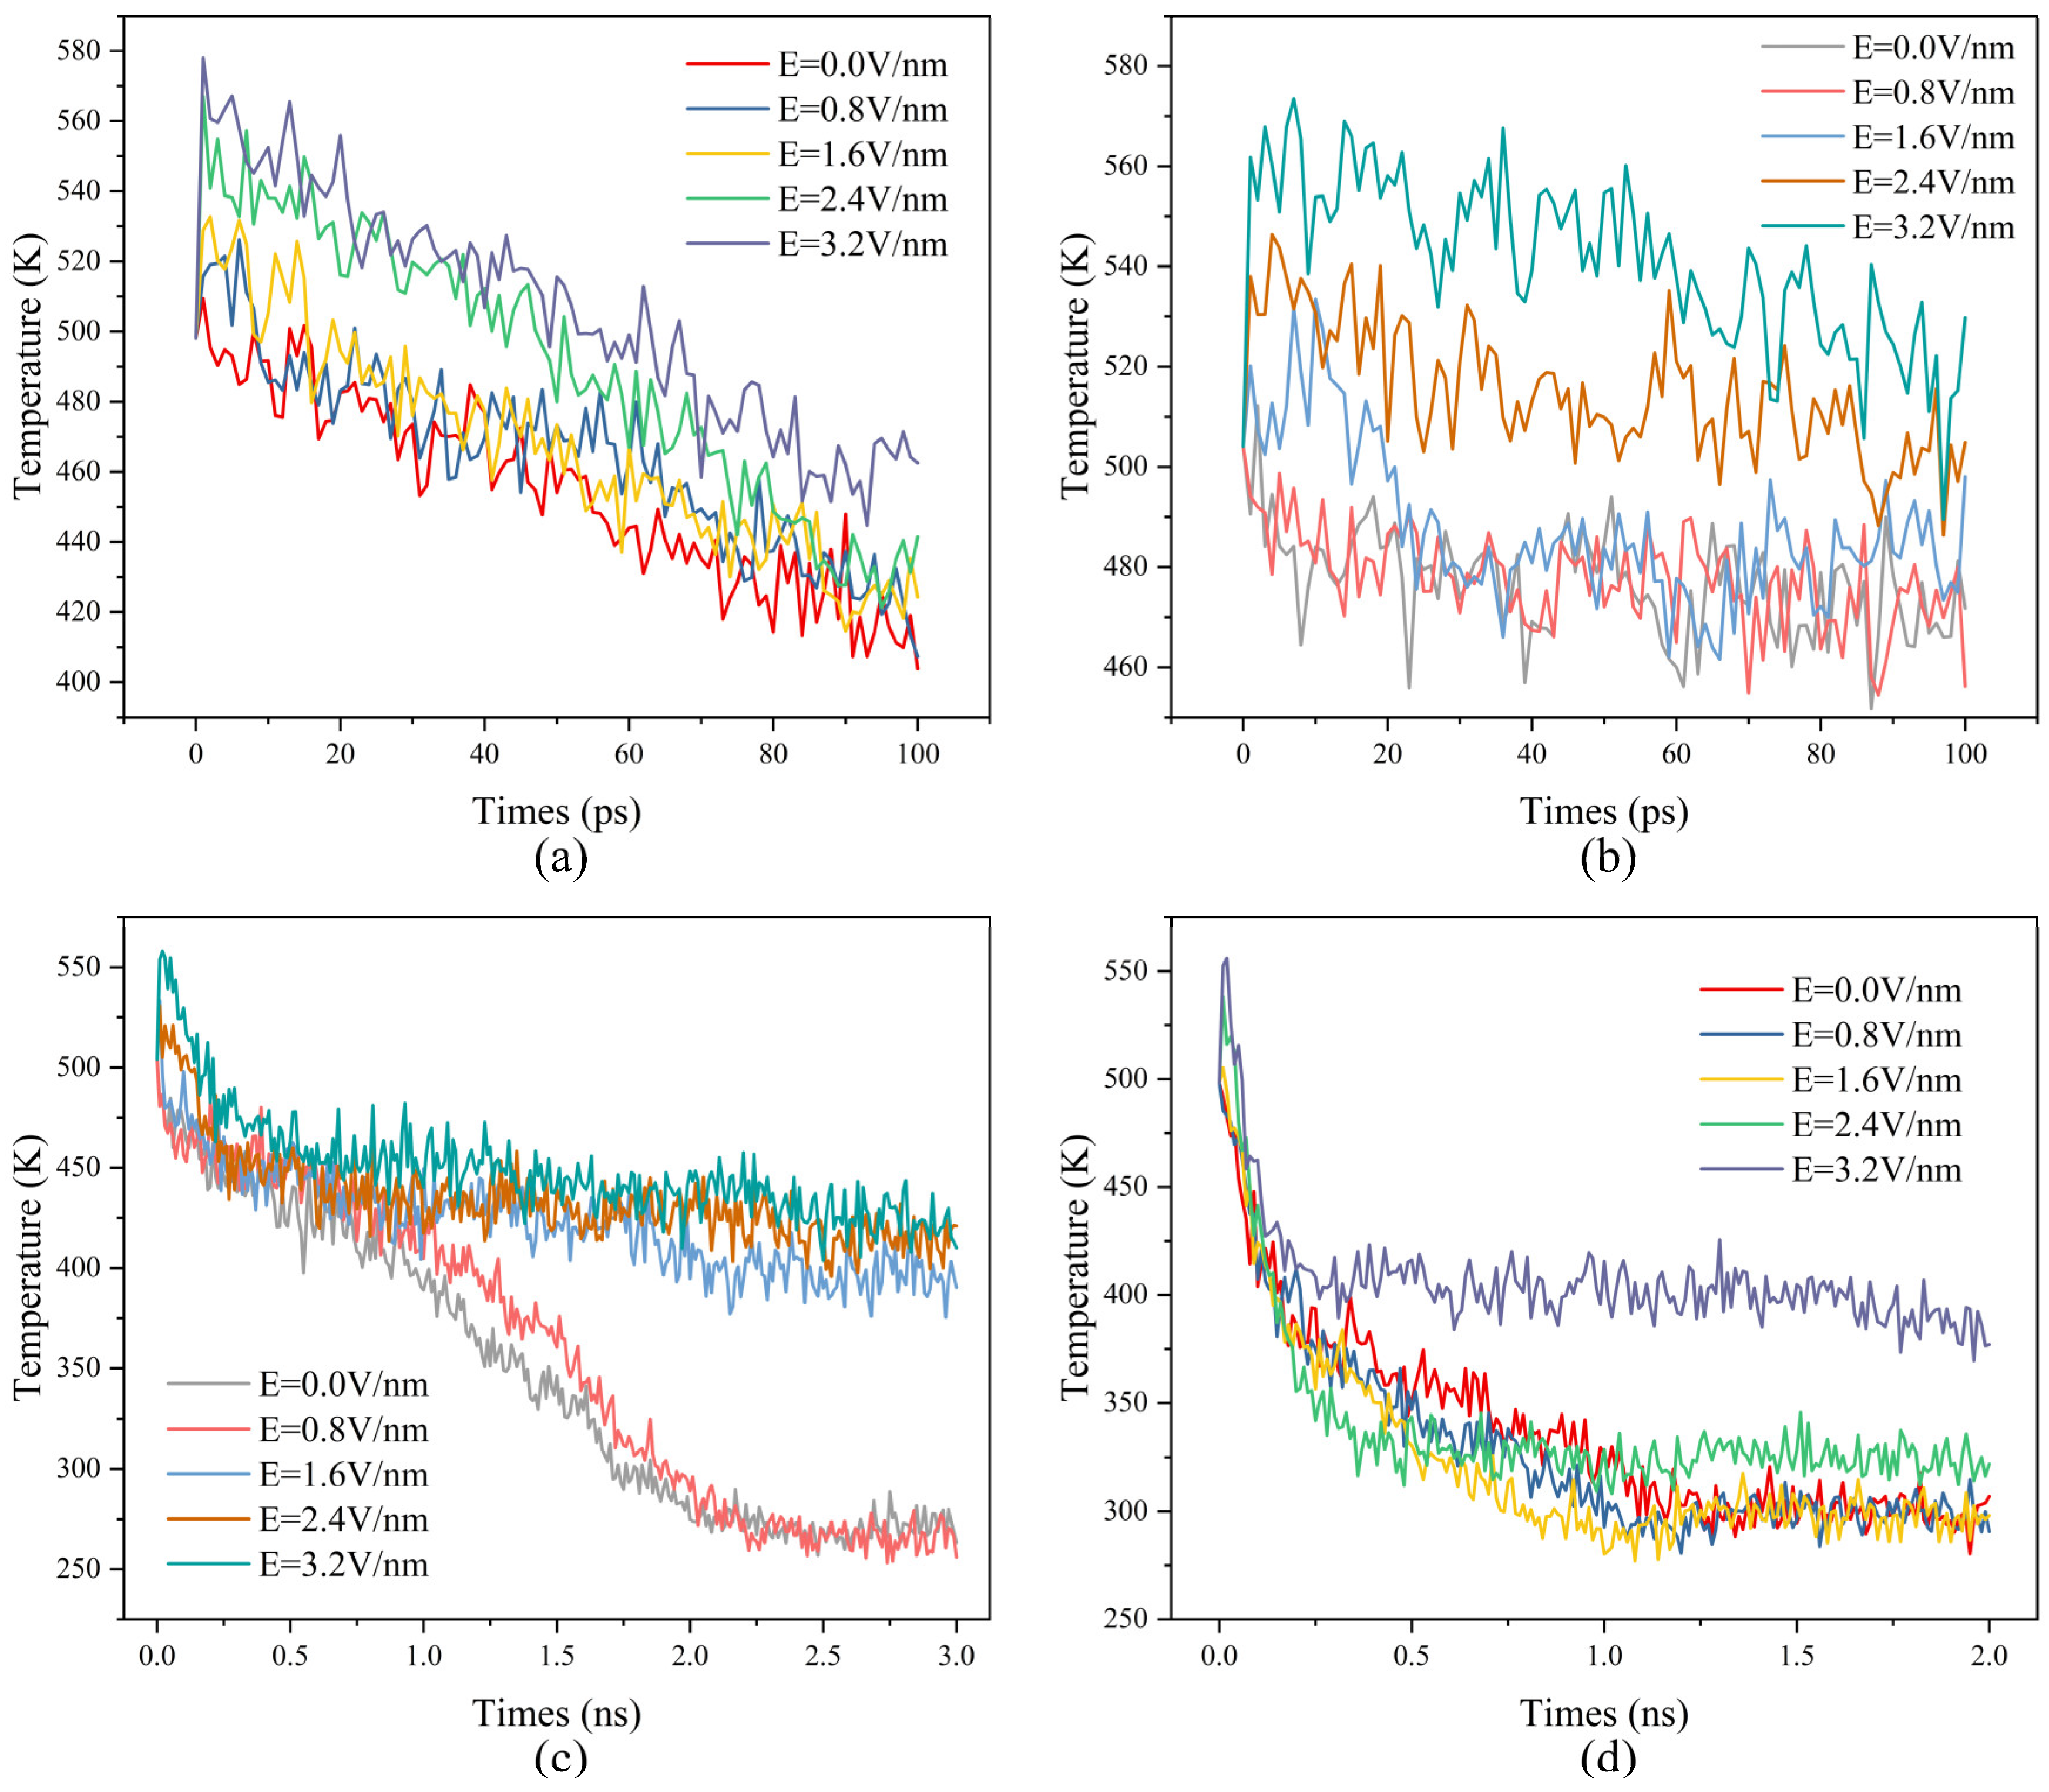
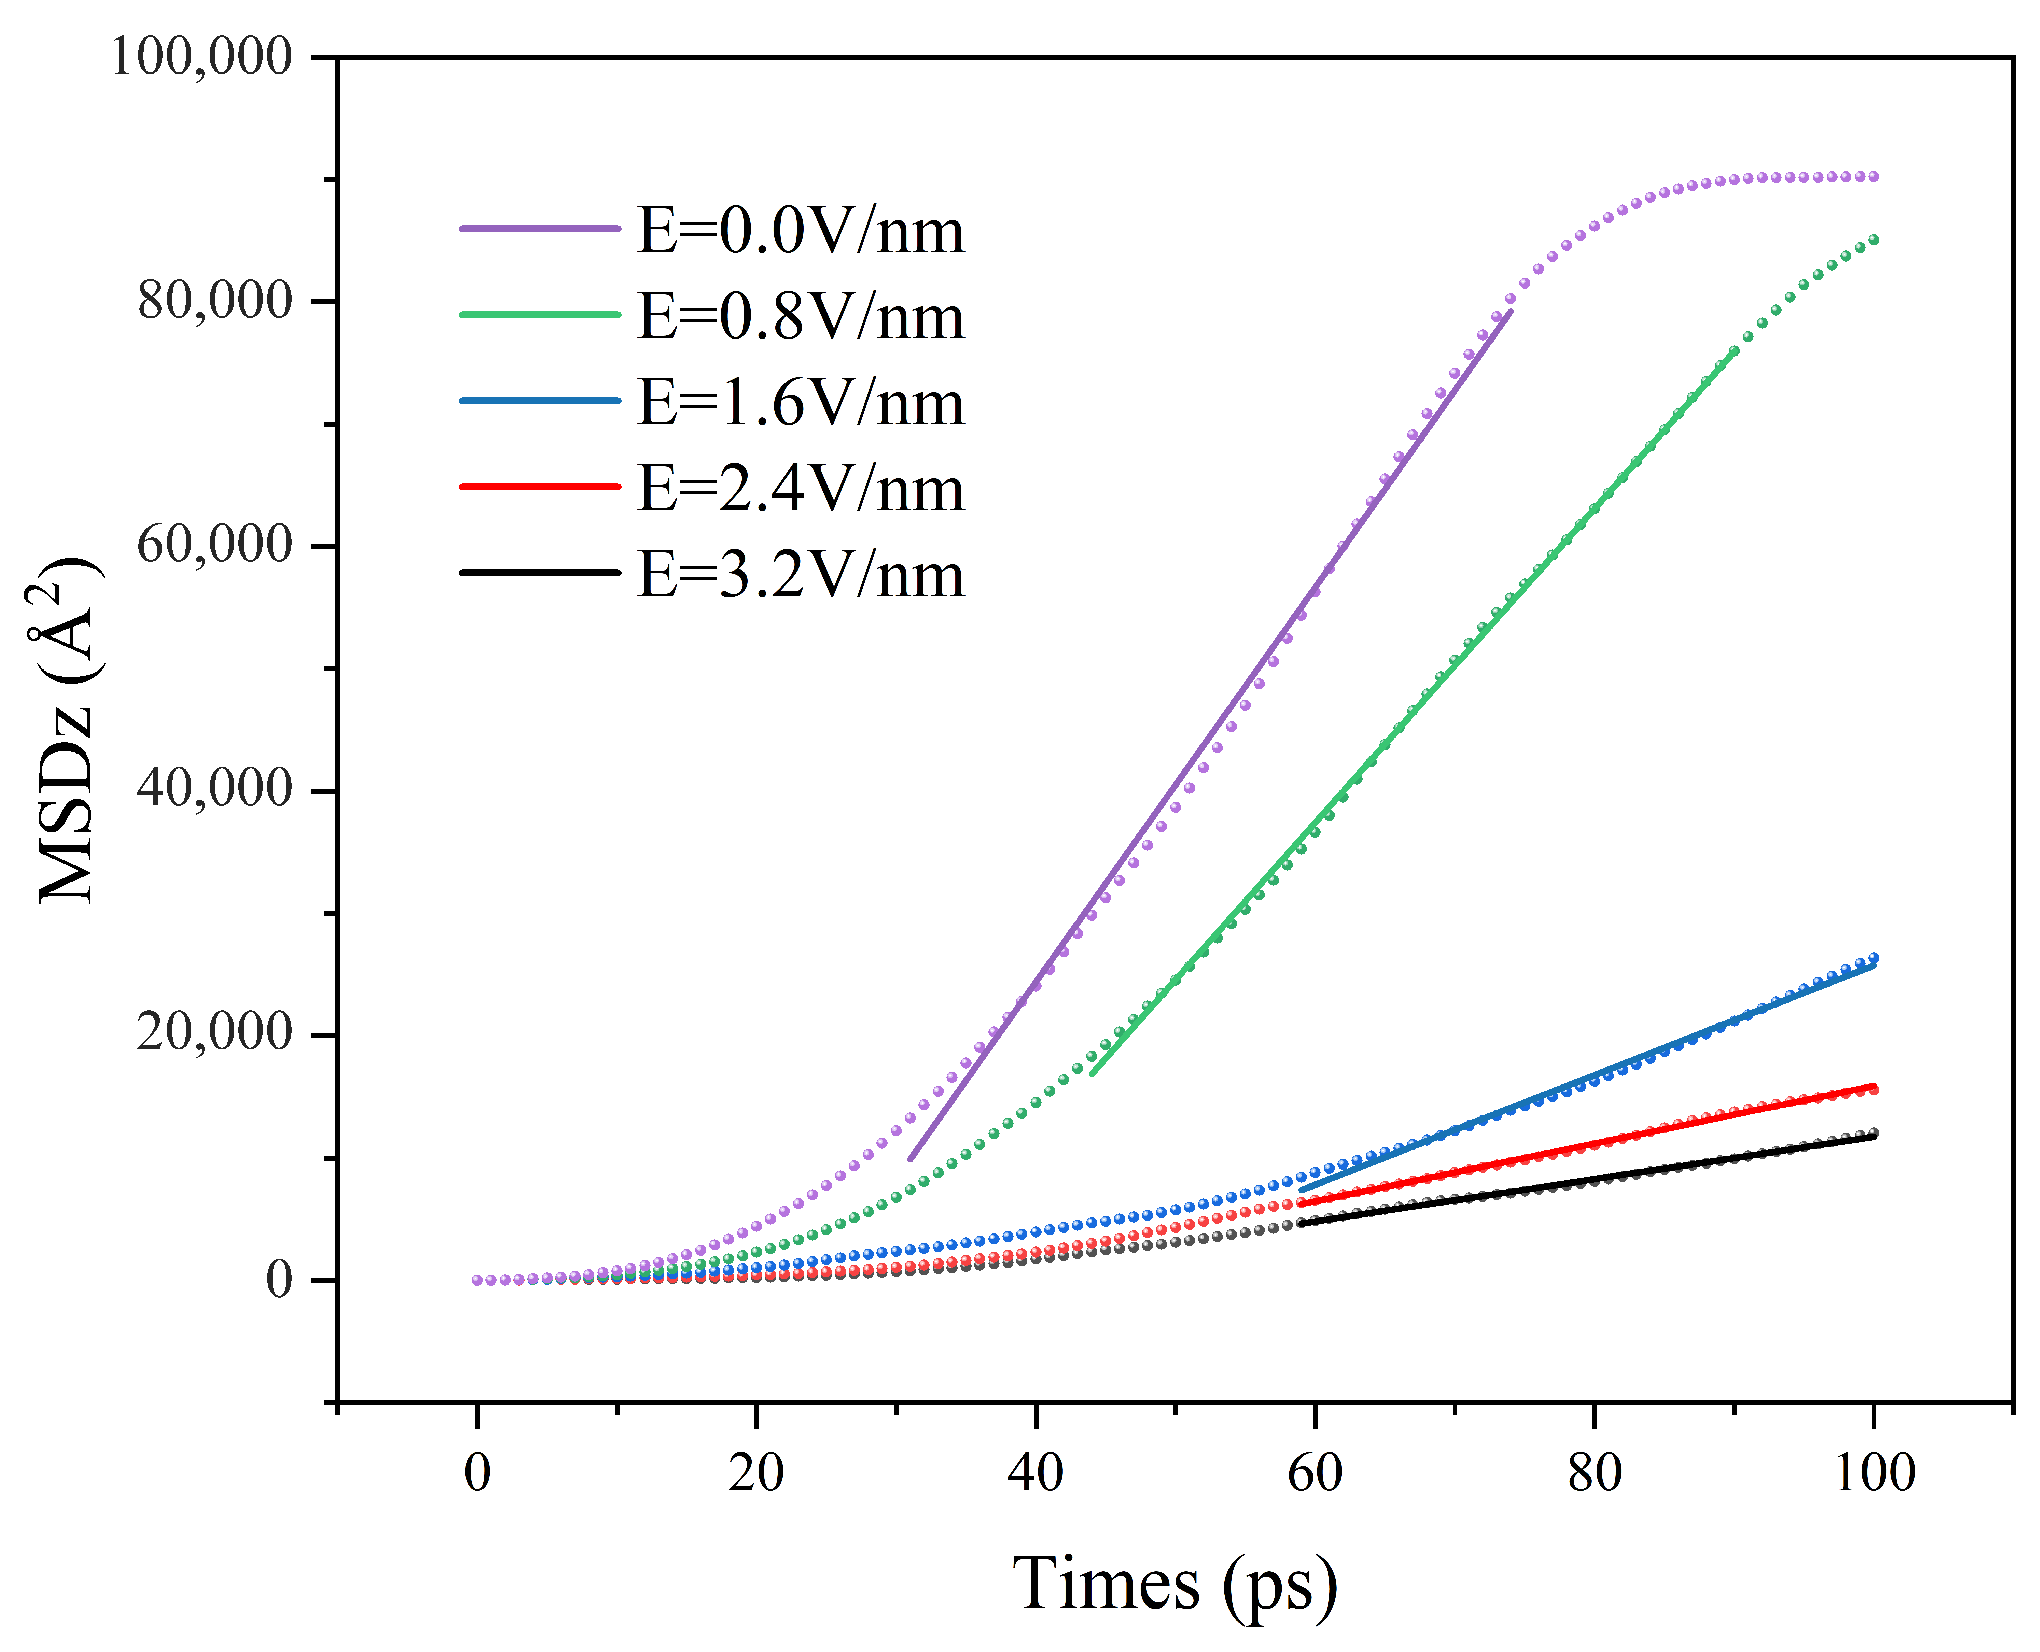
To investigate the reasons behind the variation in condensation rate with electric field strength, the average temperature of all water molecules over time was statistically analyzed (Figure 7), while the influence of the electric field on the mean square displacement of water molecules along the Z-direction was also examined (Figure 8). As shown in Figure 7a,b, during the 0–100 ps stage, in the presence of an electric field, the average temperature of water molecules will rapidly rise in a short period of time, exceeding the temperature of the upper substrate. When the electric field is 3.2 V/nm, the temperature reaches as high as 580 K. What’s more, its average temperature increases with the increase in electric field strength. This indicates that the electric field has a heating effect on water molecules, and the degree of heating is positively correlated with the electric field strength. The higher temperature, in turn, suppresses the condensation phase process. Furthermore, the condensation morphology plays a decisive role in heat transfer efficiency. As shown in Figure 7c,d, after the system reaches stability, the average temperature of water molecules in columnar condensation is significantly higher than that in filmwise condensation. This is due to the sufficient contact between the condensed molecules and the lower substrate surface in filmwise condensation. However, in columnar condensation, the contact area between water molecules and the lower substrate, as well as between water molecules themselves, gradually decreases, making it increasingly difficult for heat between water molecules to transfer to the condensation surface. This restricts heat transfer from the water molecules to the condensation surface. The constrained heat transfer efficiency, combined with the continuous heating effect of the electric field, leads to a sustained higher average temperature in dropwise condensation, further hindering molecular coalescence. This also explains the greater fluctuation in the number of condensed water molecules on the substrate surface under high electric field strengths.
Figure 8 shows the mean square displacement of water molecules along the Z-direction under different electric field strength. Since the mean square displacement of water molecules in the Z-direction is influenced by temperature and condensation, we removed the lower substrate of the system to prevent the impact of water molecule condensation on the overall mean square displacement. As shown in Figure 8, the MSD curves exhibit a clear enhancement with increasing electric field strength, indicating accelerated molecular motion along the z-direction. To further quantify this effect, the effective diffusion coefficient Dz was calculated from the linear regime of the MSD curves based on the relation, D Z = 1 2 d d t z 2 t . The results show that Dz increases monotonically with electric field strength, demonstrating that the electric field significantly enhances molecular transport in the direction normal to the substrate. This enhanced diffusion implies that under stronger electric fields, water molecules can reach the condensation interface more rapidly, thereby increasing their collision frequency with the substrate and facilitating the heat exchange process in the initial stage.
In summary, the influence of electric field strength on overall condensation efficiency is determined by its combined effects on the thermodynamic state (temperature increase) and kinetic behavior (enhanced mean square displacement along the Z-axis) of water molecules. This explains the observed phenomenon on hydrophilic surfaces where condensation rate initially increases and then decreases with rising electric field strength. Specifically, when water molecules come into contact with the surface of the underlying substrate, due to the stronger solid–liquid interaction, they are more likely to stay on the substrate surface. This further enhances the heat exchange between the water molecules and the lower substrate, and accelerates the condensation of water molecules. However, on hydrophobic surfaces, even though water molecules can reach the underlying substrate surface more quickly, due to the weak solid–liquid interaction, it is difficult for water molecules to be adsorbed on the substrate surface. As a result, the heat transfer efficiency remains low, making it difficult to offset the impact of temperature rise. Consequently, the condensation rate on hydrophobic surfaces exhibits a monotonically decreasing trend with increasing electric field intensity.

3.3. Condensation Morphology Transformation

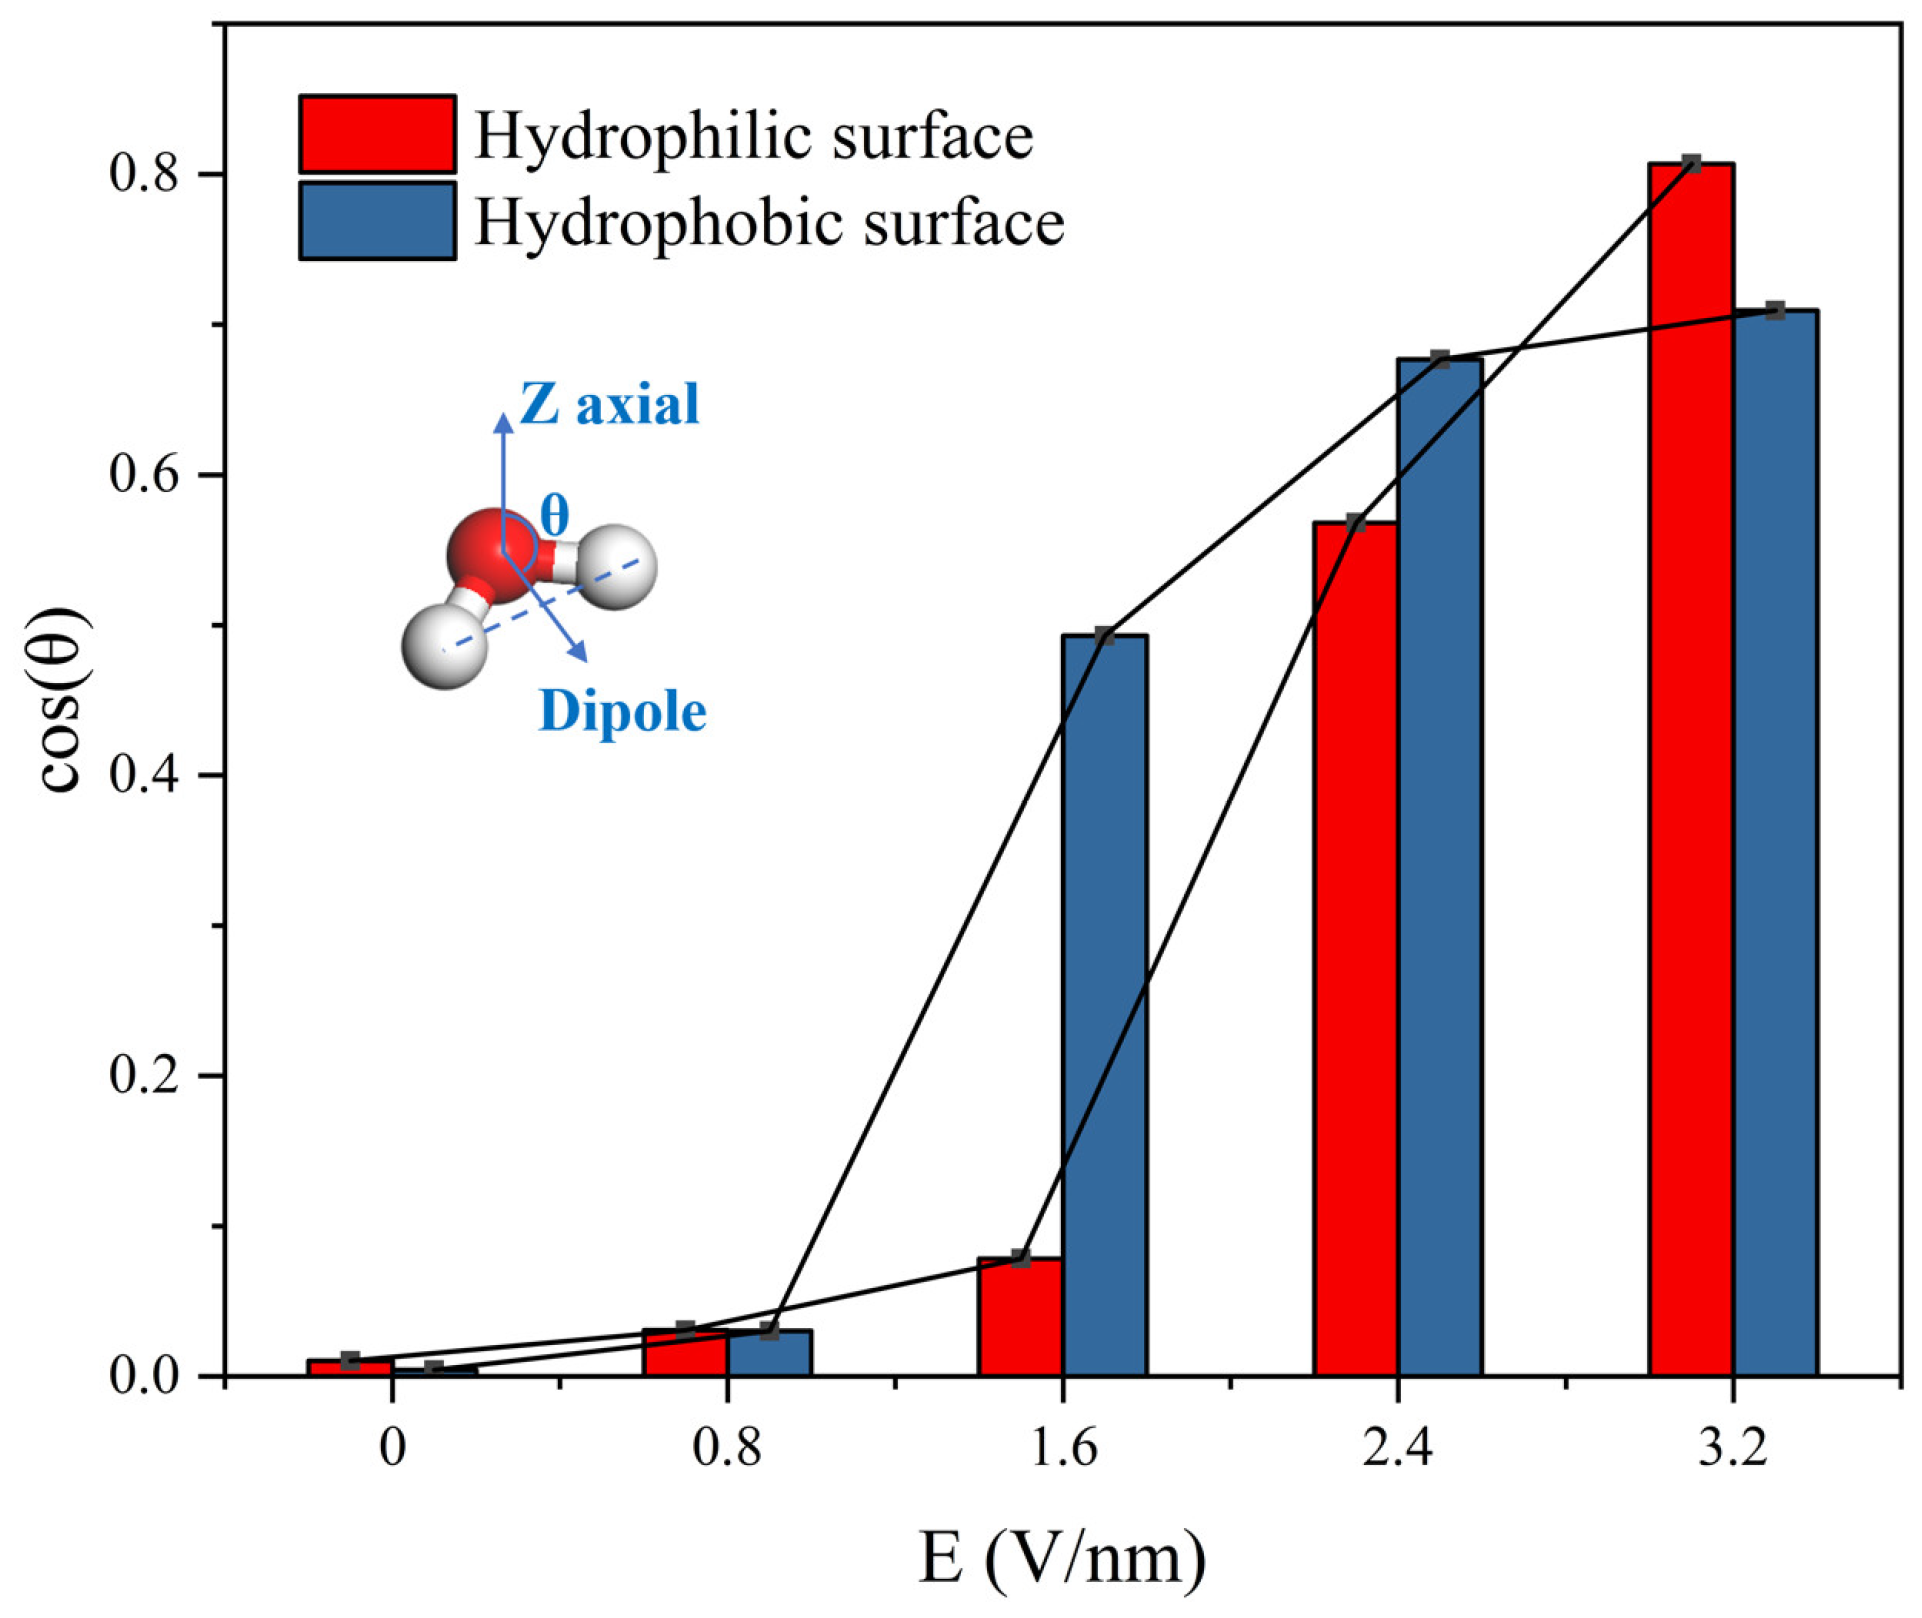
The dipole moment of a water molecule is a key indicator of its orientation under the influence of an electric field. The average cosine value, cos(θ), of the angle θ between the water molecule’s dipole moment vector and the direction of the electric field was calculated statistically for different electric field strengths, as shown in Figure 9. In the absence of an electric field, water molecules exhibit a disordered state, with the value of cos(θ) approaching zero, indicating a random distribution of molecular orientations. As the electric field intensity increases, the value of cos(θ) gradually rises. This indicates that under the influence of electric field force, the dipole moment of water molecules begins to rearrange. The stronger the electric field, the greater the degree of alignment of the dipole moment towards the direction of the electric field, ultimately achieving parallel alignment. Notably, when the system’s condensed morphology transitions from a filmwise to a columnar structure, the increase in cos(θ) becomes particularly pronounced.
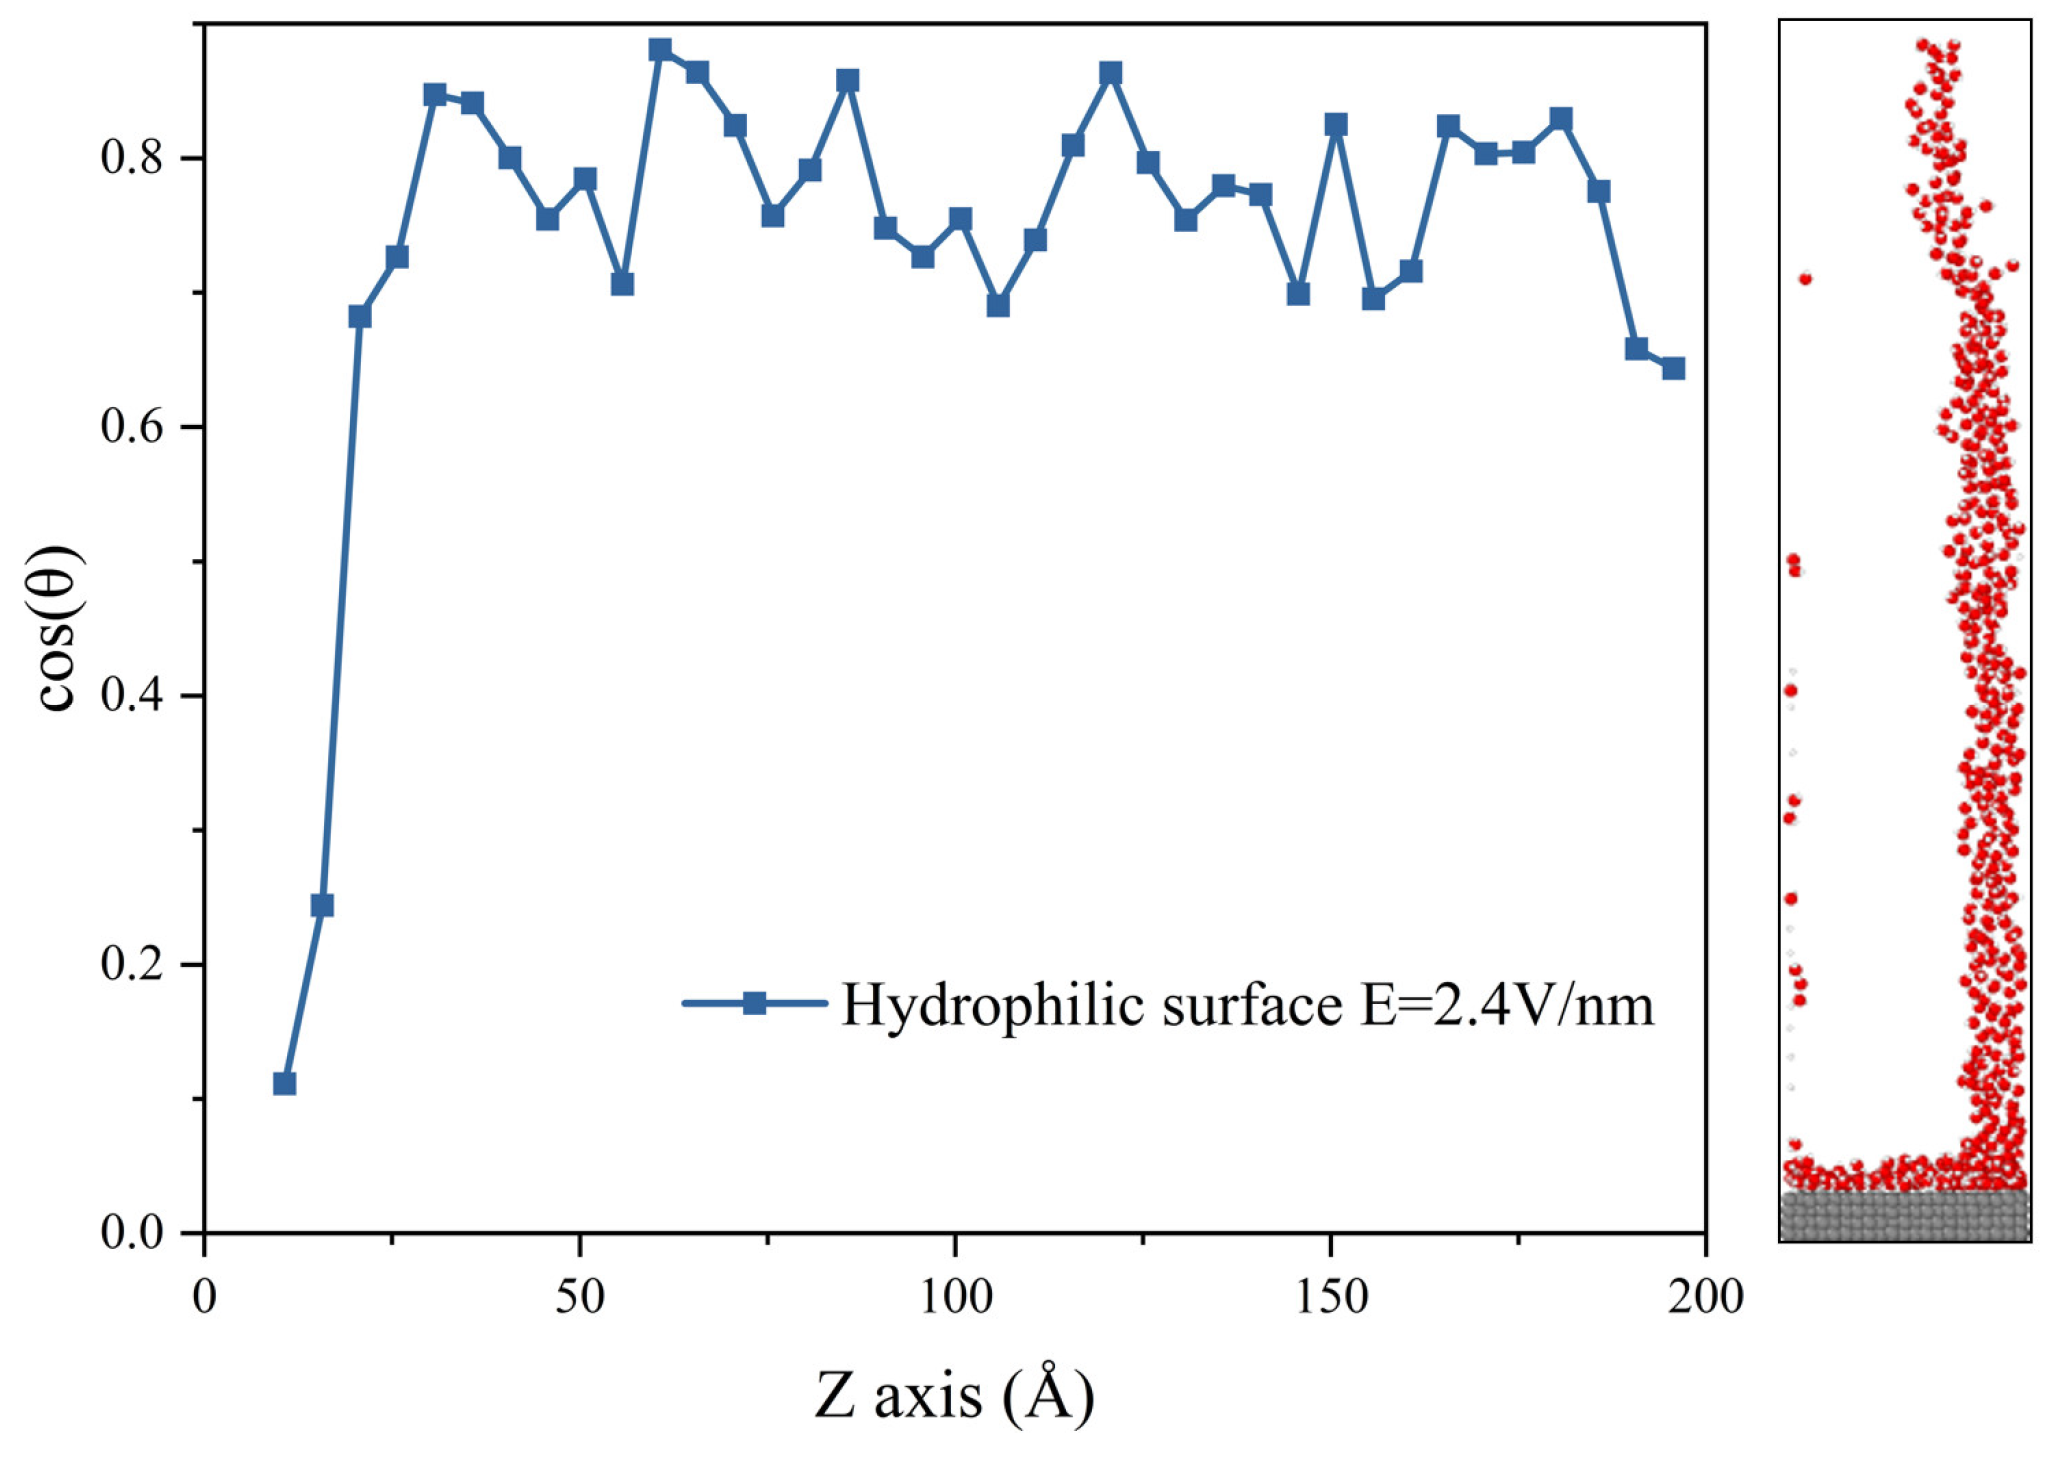
In all simulated calculations, the hydrophilic surface at 2.4 V/nm electric field is the sole system exhibiting distinct coexistence of filmwise condensation and columnar condensation. This condition enables clearer observation of the evolution patterns of dipole moments between different condensation states. To investigate the intrinsic causes of condensation morphology transition, this study statistically analyzed the spatial distribution of the value of cos(θ) along the Z-axis under this condition (Figure 10). Analysis of Figure 10 reveals that the value of cos(θ) is significantly lower in the filmwise condensation region (Z ≈ 10–20 Å), whereas it markedly increases and stabilizes around 0.7 in the columnar condensation region. This spatial characteristic indicates that the dipole moment orientation of water molecules is not only governed by the external electric field but also jointly influenced by intermolecular interactions and substrate–water molecule interactions. As the electric field strength gradually increases, the condensation morphology transitions from filmwise to columnar condensation. During this process, the constraining effect of the substrate on water molecules weakens substantially, leading to a sharp rise in the value of cos(θ). When the surface wettability shifts from hydrophilic to hydrophobic, the substrate’s influence on water molecules diminishes, allowing the electric field to dominate more easily. Consequently, hydrophobic surfaces exhibit more pronounced morphological changes in condensation compared to hydrophilic surfaces.
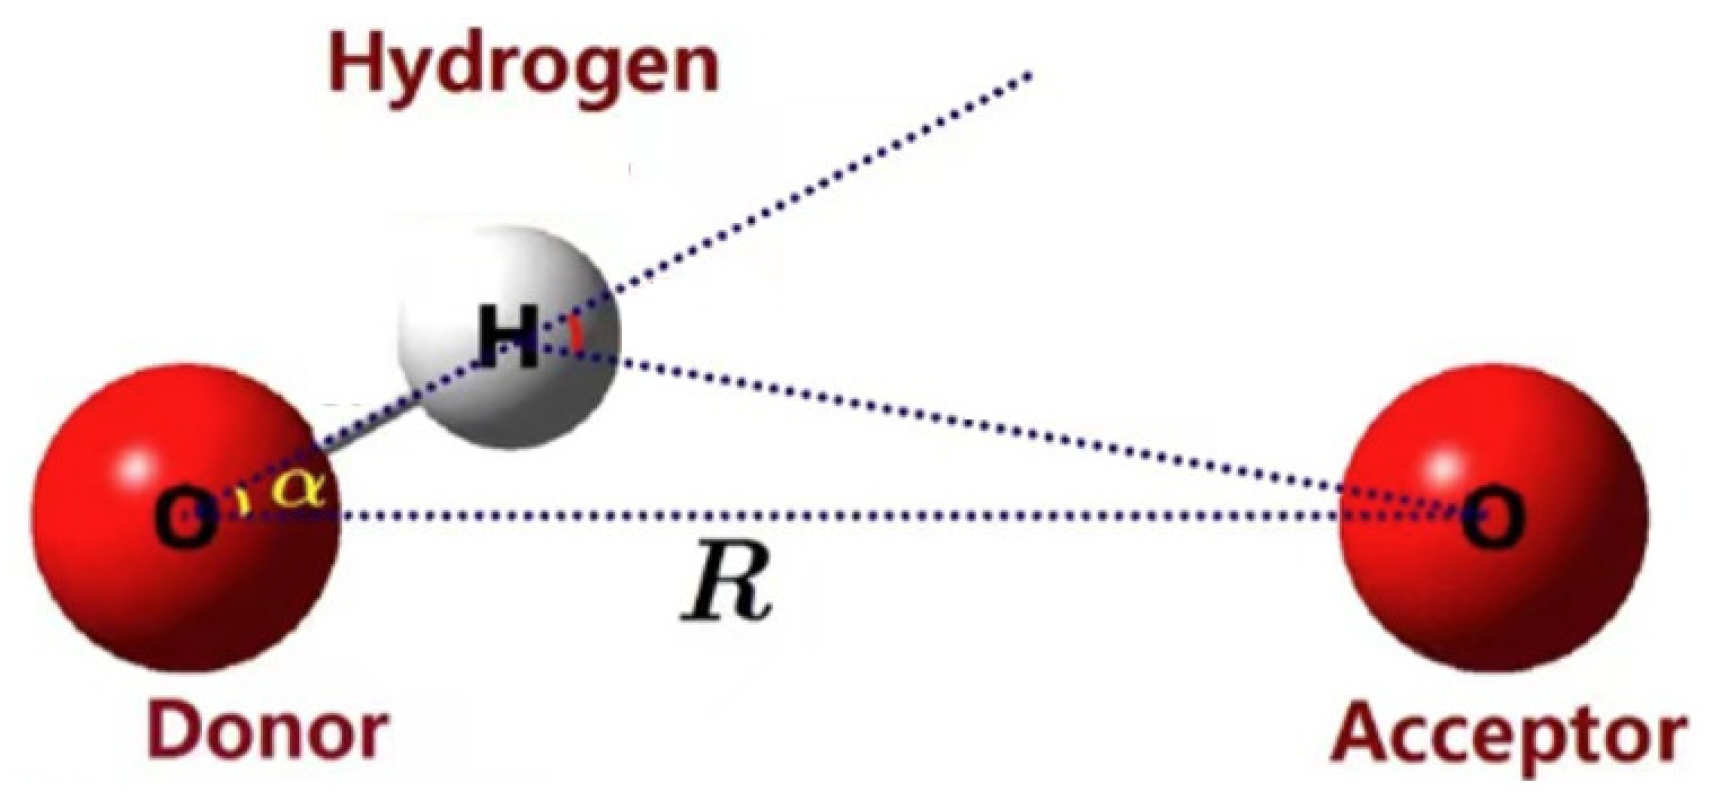
When an external electric field forces all water molecular dipoles to align parallel to its direction, this uniform parallel orientation maximizes the dipole–dipole attraction (head-to-tail configuration) between water molecules along the field direction while weakening the perpendicular attraction. Simultaneously, the hydrogen bond network reorganizes to accommodate this strong alignment constraint, forming structures elongated along the electric field direction. Therefore, the hydrogen bond in the simulation is statistically analyzed, and the geometric standard is used to determine the hydrogen bond. The judgment standard is that the distance between the donor oxygen atom and the acceptor oxygen atom R ≤ 3.5 Å, and the angle α ≤ 30°, as shown in Figure 11 [47,48].
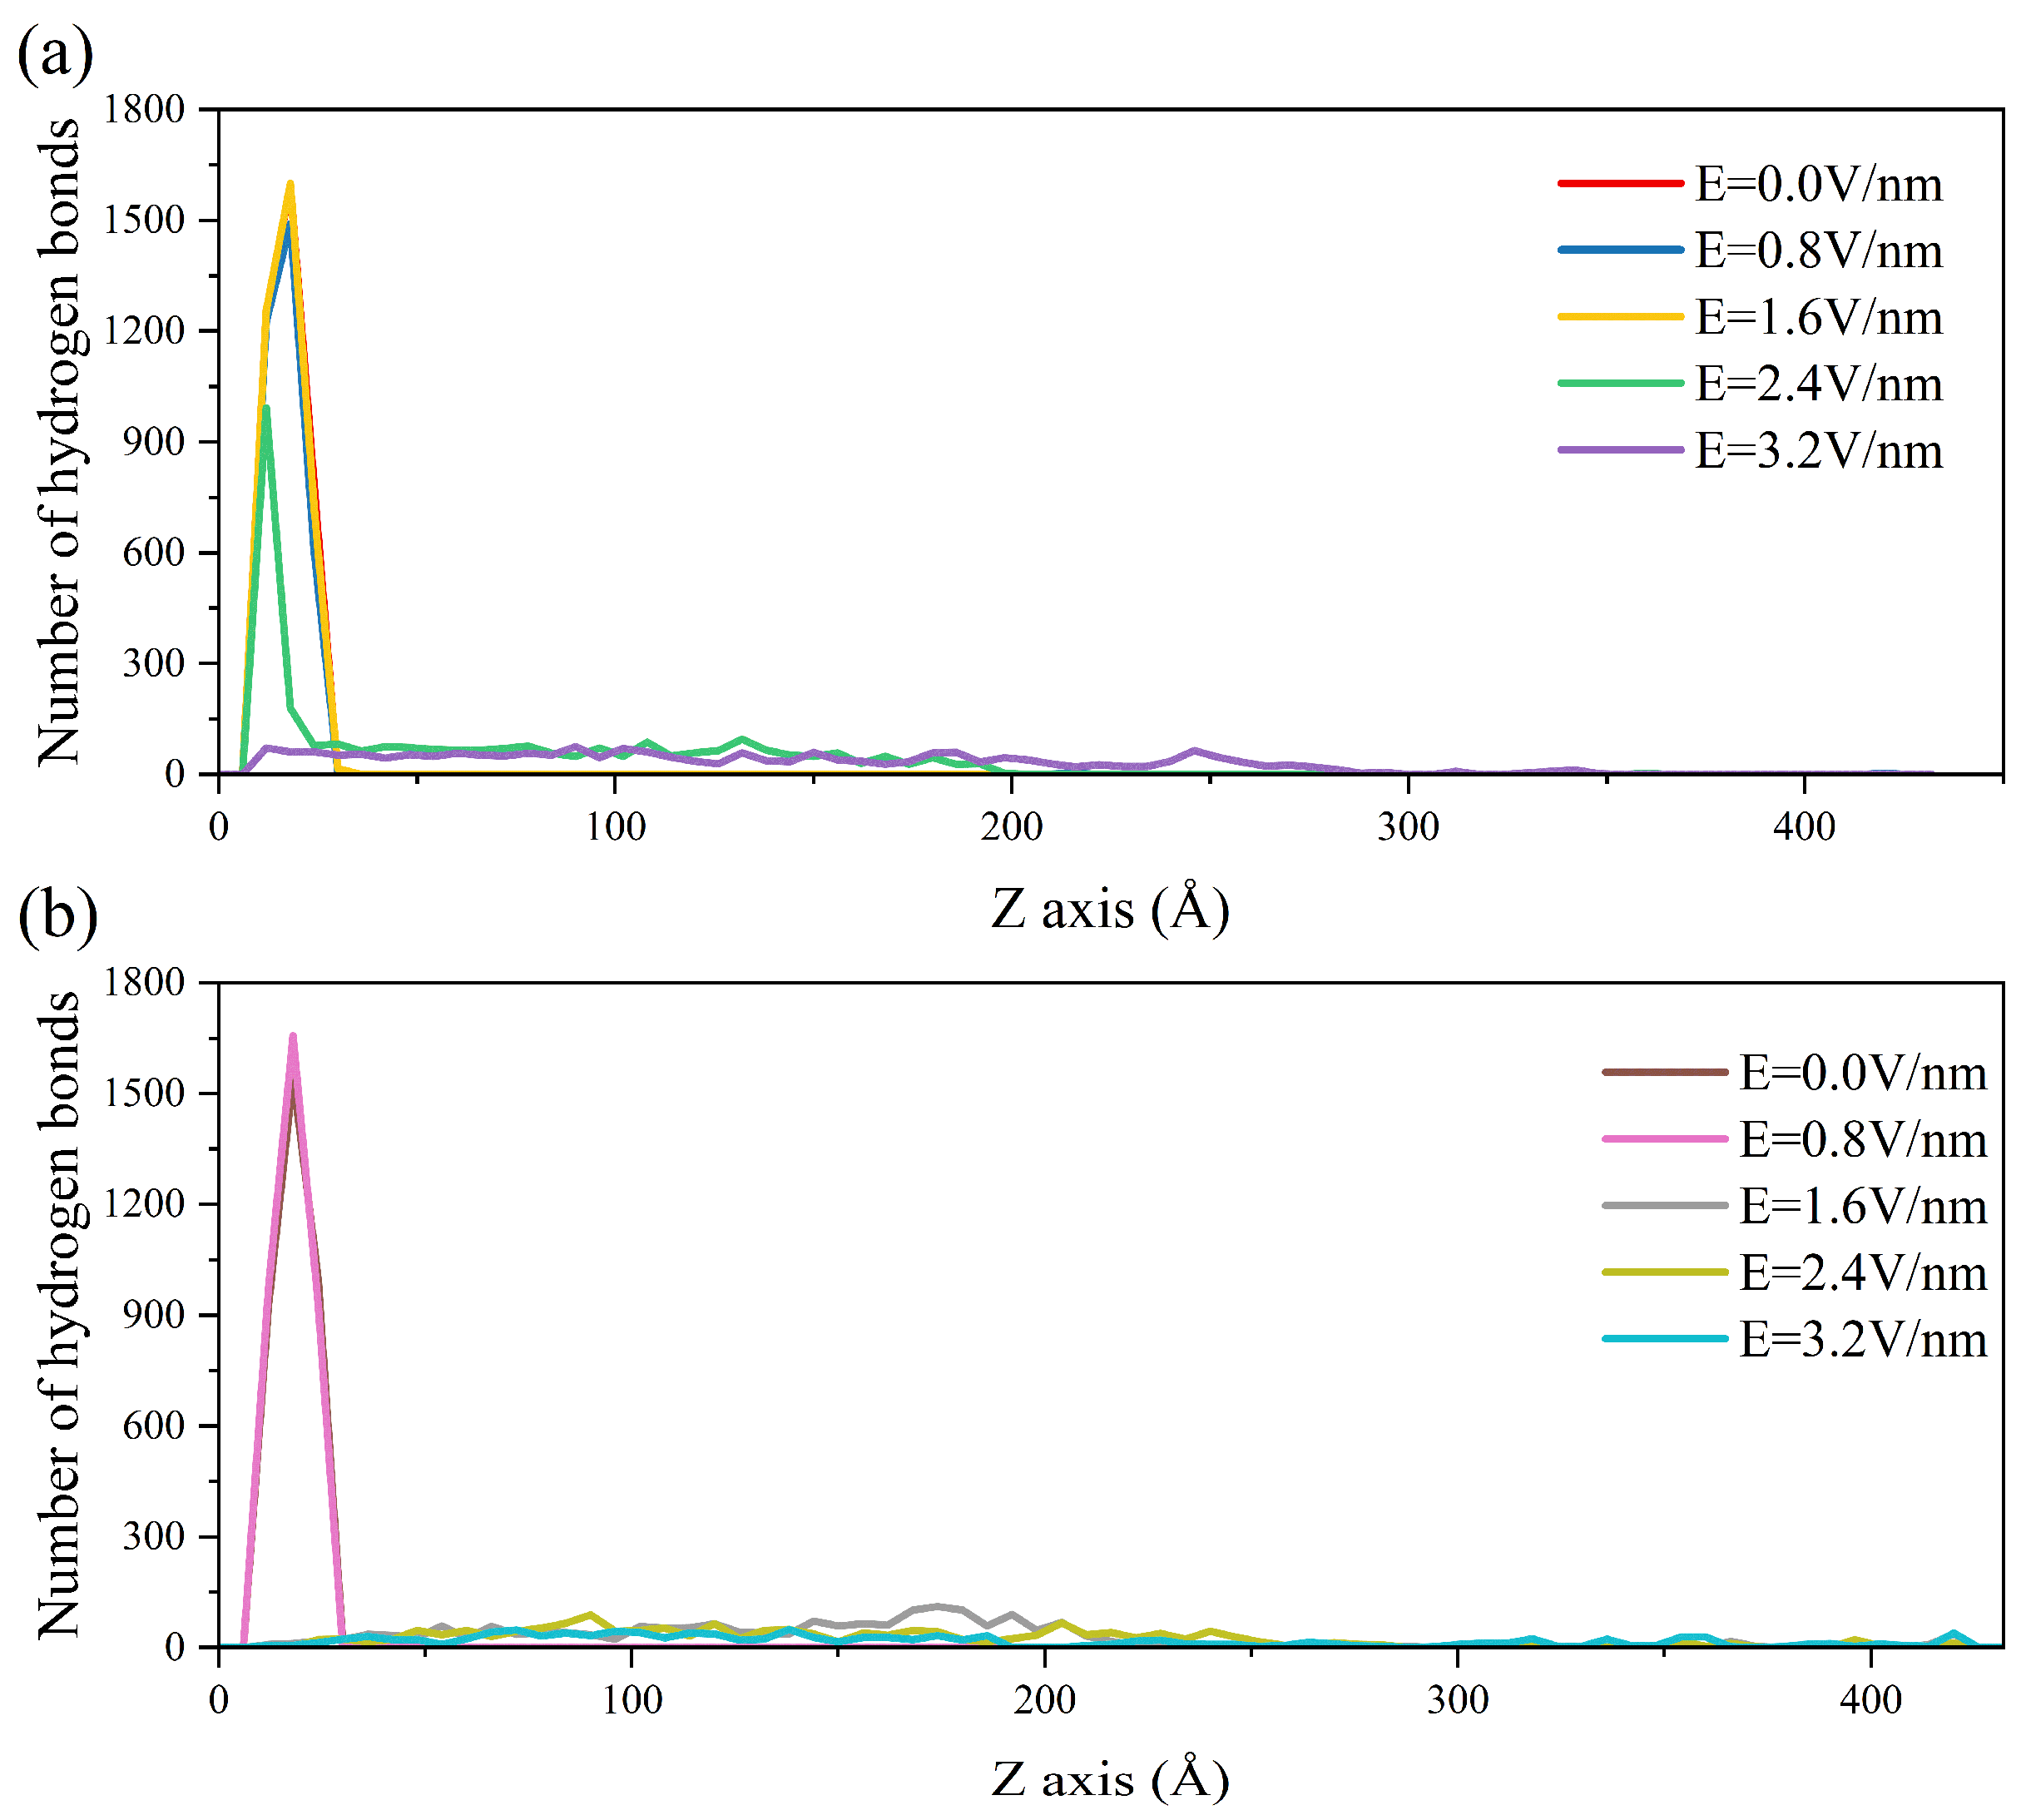
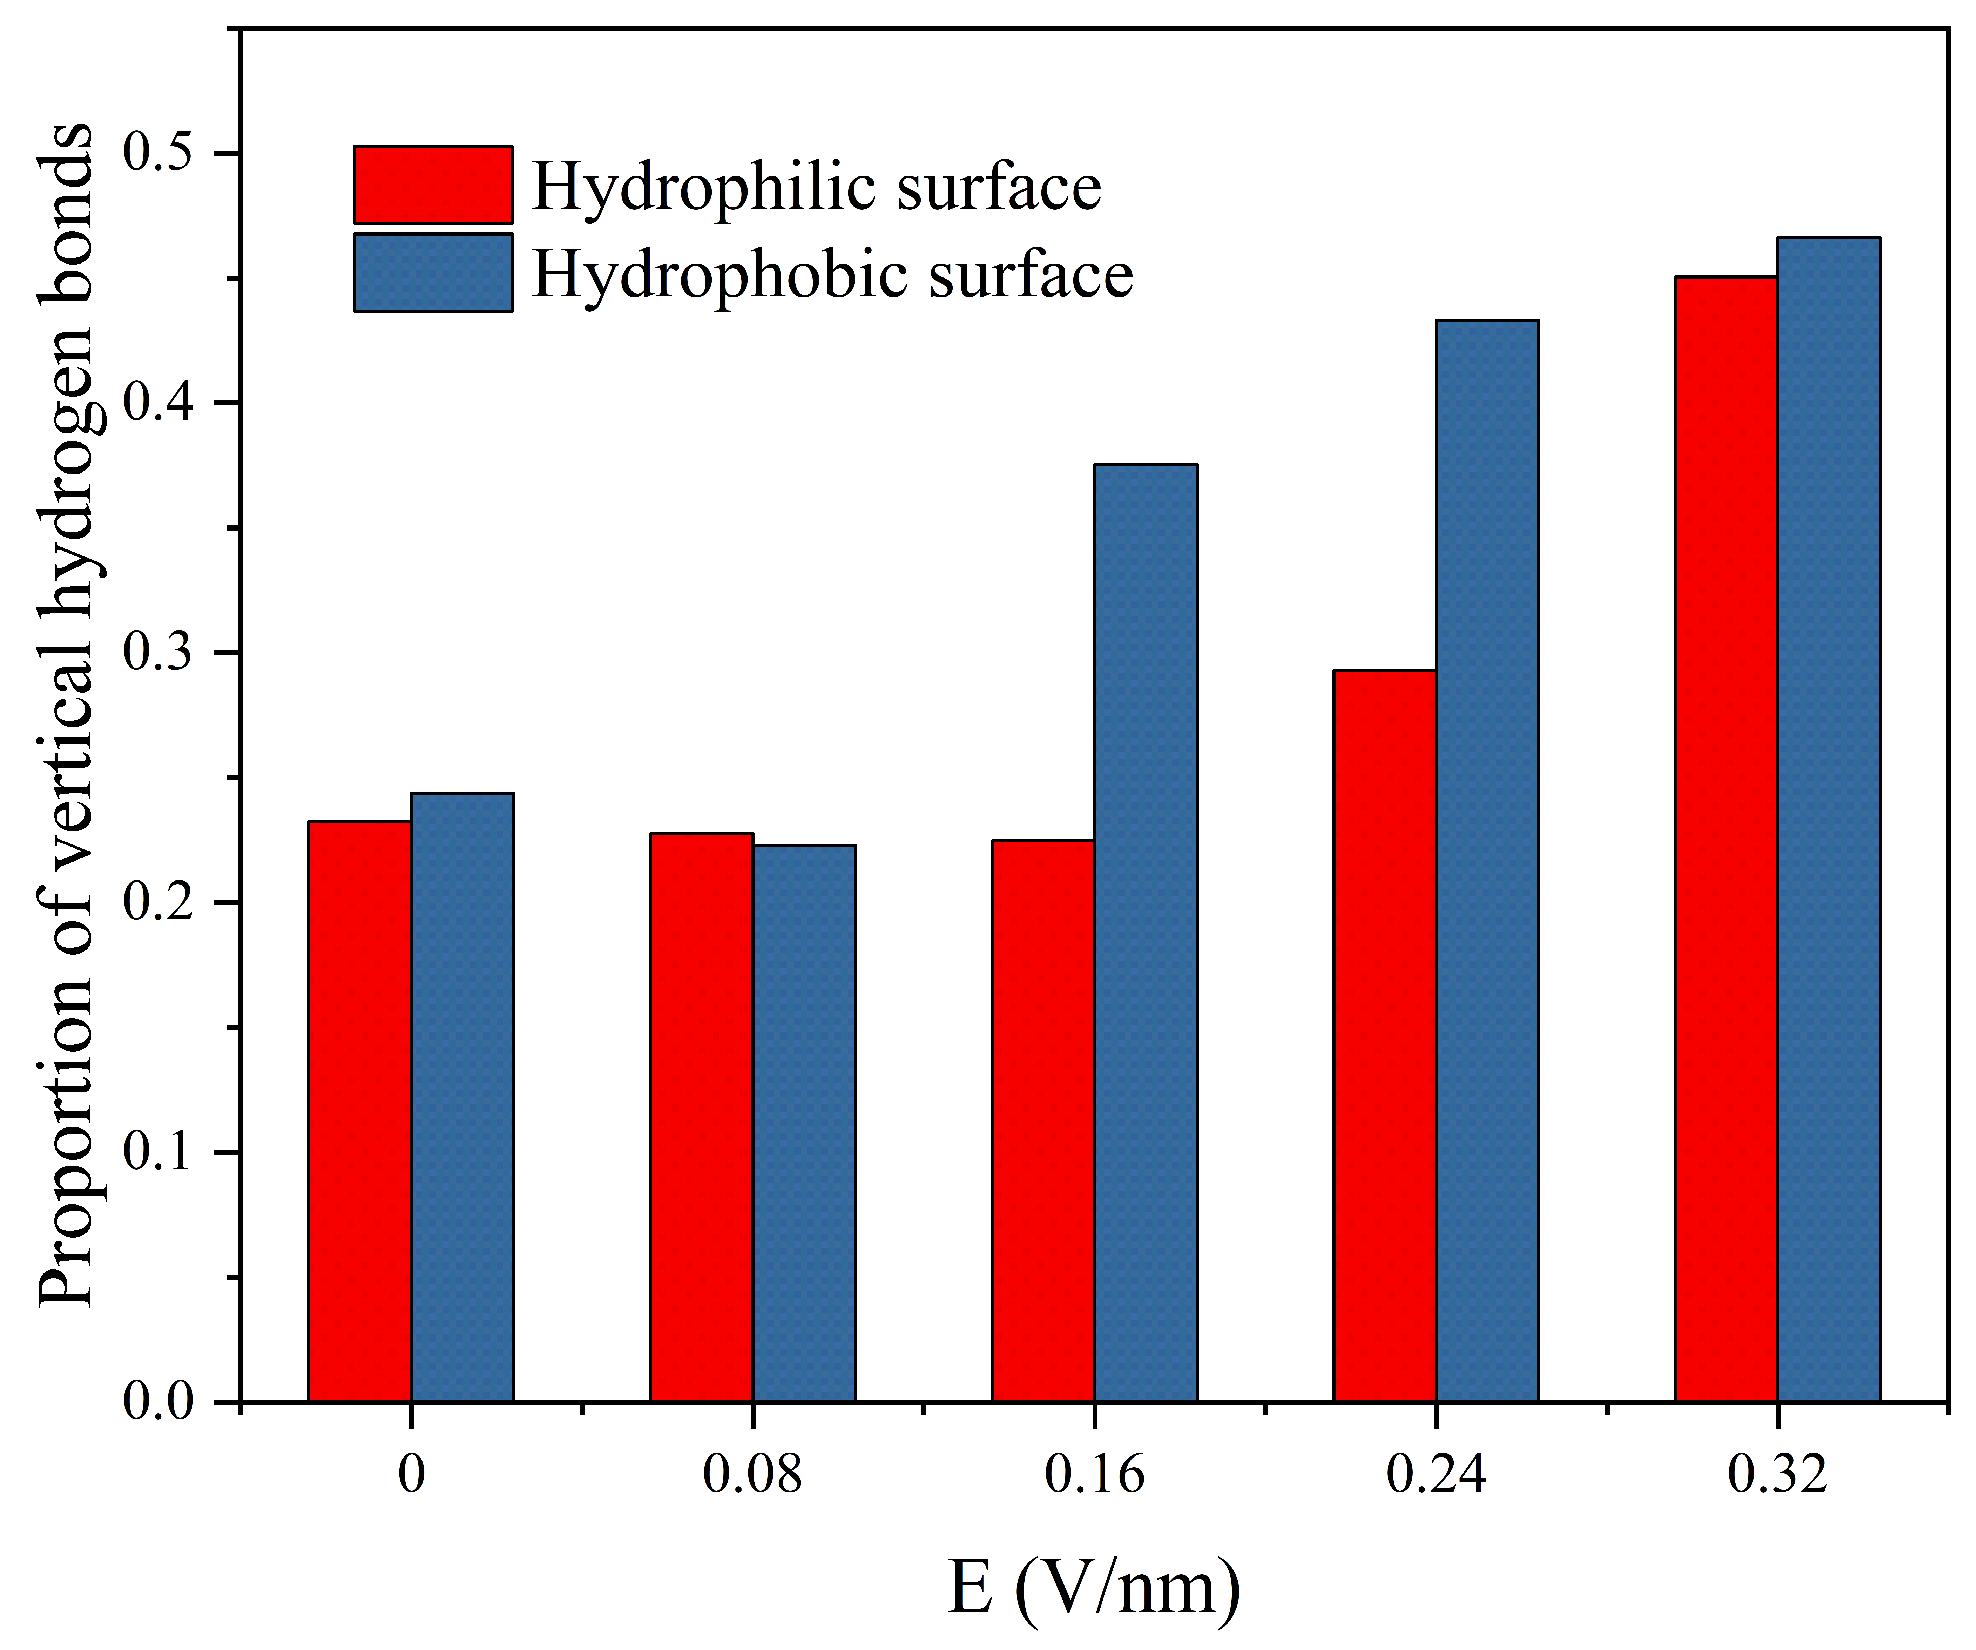
Figure 12 shows the distribution of hydrogen bonds along the Z-axis under different electric field conditions: when the electric field strength is low, hydrogen bonds are mainly concentrated in the local region of 10 Å to 28 Å. As the electric field strength increases to a certain threshold, hydrogen bonds exhibit a wide range of uniform distribution in the Z-axis direction, indicating that the electric field promotes the extension of the hydrogen bond network in the direction of the electric field. Furthermore, this study defines hydrogen bonds with an angle of less than 45° between the hydrogen bond direction and the Z-axis as vertical hydrogen bonds. The statistical results in Figure 13 indicate that when the electric field dominates, the proportion of vertical hydrogen bonds increases with the increase in electric field strength. This trend further confirms that the electric field can drive the directional reconstruction of hydrogen bonds, making them preferentially arranged along the direction of the electric field, thereby guiding water molecule aggregation and structure formation at the microscale.

4. Conclusions

This study investigates the condensation processes of water molecules on hydrophilic and hydrophobic surfaces under varying electric field strengths using molecular dynamics simulations. The main conclusions are as follows:
  • The effect of electric field strength on the condensation rate is regulated by surface wettability. On hydrophilic surfaces, the condensation rate initially increases and then decreases with increasing electric field strength; the highest condensation efficiency is observed at an electric field strength of 1.6 V/nm. On hydrophobic surfaces, the condensation efficiency gradually decreases with increasing electric field strength. This is primarily due to the combined effects of increased temperature and enhanced mean square displacement in the Z direction.
  • The orientation of the water molecule dipole moment is jointly regulated by the external electric field, intermolecular interactions between water molecules, and substrate–water interactions. The weaker the wettability, the more readily the electric field assumes a dominant role. Once the electric field becomes dominant, the condensation morphology of water molecules changes, shifting from filmwise condensation to columnar condensation.
  • Under the influence of the electric field, the dipole moments tend to align parallel to the direction of the electric field. This enhances the intermolecular attractive forces in the Z-direction, driving the restructuring of the hydrogen-bond network along the Z-axis. Following this restructuring, water molecules aggregate along the Z-direction electric field, thereby undergoing a morphological transformation.

Supplementary Materials

The following supporting information can be downloaded at: https://www.mdpi.com/article/10.3390/sym18050773/s1, Figure S1: Condensation snapshots under boxes of different sizes; Table S1: Model Size Settings.

Author Contributions

Formal analysis, writing—original draft, H.Z.; Formal analysis and supervision, Y.W.; software, Q.Y. All authors have read and agreed to the published version of the manuscript.

Funding

This research received no external funding.

Data Availability Statement

The original contributions presented in this study are included in the article/Supplementary Materials. Further inquiries can be directed to the corresponding author.

Conflicts of Interest

The authors declare no conflicts of interest.

References

  1. Qin, X.; Sun, J. Analysis of the causes of underground fog in Dongrong Second Mine. Saf. Coal Mines 2005, 36, 37–39. [Google Scholar] [CrossRef]
  2. Qingwen, Y.; Yongxing, L.; Haonan, F.; Xiaodong, W.; Mengjiao, J. Experimental Research on the Defogging Efficiency of Wellhead in a Lead-zinc Mine. Min. Res. Dev. 2021, 41, 168–174. [Google Scholar] [CrossRef]
  3. Mengjiao, J.; Xiaodong, W.; Haonan, F.; Shupeng, C.; Xuelin, T. Research on the Generating Mechanism and Treatment of Fog in the Return Air Wellhead of a Metal Mine. Saf. Environ. Eng. 2023, 30, 44–52+60. [Google Scholar] [CrossRef]
  4. Martikainen, A. Fog Removal in the Declines of Underground Mines in Sub-Arctic Regions. Ph.D. Thesis, Helsinki University of Technology, Espoo, Finland, 2007. [Google Scholar]
  5. Martikaninen, A. Fog mesh as an alternative fog removal method in mine ramps. Trans.-Soc. Min. Metall. Explor. Inc. 2007, 320, 38. [Google Scholar]
  6. Huang, D.B.; Quan, X.J.; Cheng, P. An investigation on vapor condensation on nanopillar array surfaces by molecular dynamics simulation. Int. Commun. Heat Mass Transf. 2018, 98, 232–238. [Google Scholar] [CrossRef] [Scilit]
  7. Xu, W.; Lan, Z.; Peng, B.L.; Wen, R.F.; Ma, X.H. Effect of surface free energies on the heterogeneous nucleation of water droplet: A molecular dynamics simulation approach. J. Chem. Phys. 2015, 142, 054701. [Google Scholar] [CrossRef] [Scilit] [PubMed]
  8. Gao, S.; Liao, Q.W.; Liu, W.; Liu, Z.C. Effects of Solid Fraction on Droplet Wetting and Vapor Condensation: A Molecular Dynamic Simulation Study. Langmuir 2017, 33, 12379–12388. [Google Scholar] [CrossRef] [Scilit]
  9. Gao, S.; Liu, W.; Liu, Z.C. Tuning nanostructured surfaces with hybrid wettability areas to enhance condensation. Nanoscale 2019, 11, 459–466. [Google Scholar] [CrossRef] [Scilit]
  10. Hu, H.W.; Li, Q.; Liu, S.; Fang, T.Y. Molecular dynamics study on water vapor condensation and infiltration characteristics in nanopores with tunable wettability. Appl. Surf. Sci. 2019, 494, 249–258. [Google Scholar] [CrossRef] [Scilit]
  11. Xu, W.; Lan, Z.; Peng, B.L.; Wen, R.F.; Ma, X.H. Effect of nano structures on the nucleus wetting modes during water vapour condensation: From individual groove to nano-array surface. RSC Adv. 2016, 6, 7923–7932. [Google Scholar] [CrossRef] [Scilit]
  12. Wang, Q.; Xie, H.; Liu, J.; Liu, C. Heterogeneous nucleation of argon vapor on the nanostructure surface with molecular dynamics simulation. J. Mol. Graph. Model. 2020, 100, 107674. [Google Scholar] [CrossRef] [Scilit]
  13. Liao, M.J.; Duan, L.Q. Dependencies of Surface Condensation on the Wettability and Nanostructure Size Differences. Nanomaterials 2020, 10, 1831. [Google Scholar] [CrossRef] [Scilit] [PubMed]
  14. Wang, Z.J.; Wang, S.Y.; Wang, D.Q.; Yang, Y.R.; Wang, X.D.; Lee, D.J. Water vapor condensation on binary mixed substrates: A molecular dynamics study. Int. J. Heat Mass Transf. 2022, 184, 122281. [Google Scholar] [CrossRef] [Scilit]
  15. Niu, D.; Gao, H.T.; Yan, Y.Y. A discussion for the formation of cassie droplet on nanostructured surface using molecular dynamics simulation. Case Stud. Therm. Eng. 2021, 25, 100976. [Google Scholar] [CrossRef] [Scilit]
  16. Li, D.; Li, C.; Li, J.; Yang, W.; Xiao, M.; Zhang, M.; Yang, Y.; Yu, K.; Pan, Y. Efficient Corona Discharge Fog Collector: Multiple Mesh Electrodes with Electric Field Enhances Fog Harvesting. Plasma Chem. Plasma Process. 2022, 42, 1249–1264. [Google Scholar] [CrossRef] [Scilit]
  17. Li, D.C.; Li, C.; Xiao, M.H.; Li, J.W.; Yang, Z.W.; Fu, Q.X.; Zhang, M.; Yu, K.X.; Pan, Y. Deconstructing plasma fog collection technology: An experimental study on factors impacting collection efficiency. J. Phys. D Appl. Phys. 2024, 57, 075201. [Google Scholar] [CrossRef] [Scilit]
  18. Zhang, M. Electric Field Facilitated and Enhanced Dehumidification: Multiscale Numerical Transportmodeling and Experimental Study. Ph.D. Thesis, Southeast University, Nanjing, China, 2021. [Google Scholar]
  19. Wang, P. Research on the Mechanism of Corona Discharge Promoting Water Vapor Condensation and Droplet Growth. Ph.D. Thesis, Huazhong University of Science and Technology, Wuhan, China, 2021. [Google Scholar]
  20. Morcelli, S.; Cremaschi, L. Analysis of Electro-Static Assisted Air Dehumidification; Auburn Univeristy: Auburn, AL, USA, 2021. [Google Scholar]
  21. Song, F.H.; Chen, R.F.; Wang, G.; Fan, J.; Niu, H. Coalescence and Break-Up Behaviors of Nanodroplets under AC Electric Field. Molecules 2023, 28, 3064. [Google Scholar] [CrossRef] [Scilit]
  22. He, X.; Zhang, B.X.; Wang, S.L.; Wang, Y.F.; Yang, Y.R.; Wang, X.D.; Lee, D.J. Electrowetting-based control of wetting transition of a nanodroplet on pillar-arrayed surfaces. J. Mol. Liq. 2022, 345, 117049. [Google Scholar] [CrossRef] [Scilit]
  23. Song, F.H.; Ma, L.; Fan, J.; Chen, Q.C.; Zhang, L.H.; Li, B.Q. Wetting Behaviors of a Nano-Droplet on a Rough Solid Substrate under Perpendicular Electric Field. Nanomaterials 2018, 8, 340. [Google Scholar] [CrossRef] [Scilit] [PubMed]
  24. Wen, K.Q.; Chen, X.M.; Cheng, S.Y.; Wang, X.; Ma, H.C.; Song, Q.H.; Zhao, Q.Y.; Tian, H.M.; Zhang, J.; Shao, J.Y. Modulation of wetting state switching of droplets on superhydrophobic microstructured surfaces by external electric field. J. Colloid Interface Sci. 2024, 672, 533–542. [Google Scholar] [CrossRef] [Scilit]
  25. Zhang, B.X.; Wang, S.L.; He, X.; Yang, Y.R.; Wang, X.D. Dynamic spreading of a water nanodroplet on a nanostructured surface in the presence of an electric field. J. Mol. Liq. 2021, 333, 116039. [Google Scholar] [CrossRef] [Scilit]
  26. Kargar, M.; Lohrasebi, A. Deformation of water nano-droplets on graphene under the influence of constant and alternative electric fields. PCCP 2017, 19, 26833–26838. [Google Scholar] [CrossRef] [Scilit]
  27. Zong, D.; Yang, Z.; Duan, Y. Wettability of a nano-droplet in an electric field: A molecular dynamics study. Appl. Therm. Eng. 2017, 122, 71–79. [Google Scholar] [CrossRef] [Scilit]
  28. Miqdad, A.M.; Datta, S.; Das, A.K.; Das, P.K. Effect of electrostatic incitation on the wetting mode of a nano-drop over a pillar-arrayed surface. RSC Adv. 2016, 6, 110127–110133. [Google Scholar] [CrossRef] [Scilit]
  29. Yan, X.Z.; Li, J.; Li, L.C.; Huang, Z.Y.; Wang, F.P.; Wei, Y.A. Droplet condensation on superhydrophobic surfaces with enhanced dewetting under a tangential AC electric field. Appl. Phys. Lett. 2016, 109, 161601. [Google Scholar] [CrossRef] [Scilit]
  30. He, X.; Wang, S.-L.; Yang, Y.-R.; Wang, X.-D.; Chen, J.-Q. Electro-coalescence of two charged droplets under pulsed direct current electric fields with various waveforms: A molecular dynamics study. J. Mol. Liq. 2020, 312, 113429. [Google Scholar] [CrossRef] [Scilit]
  31. Ding, W.Y.; Wang, M.; Dai, X.B.; Zhang, J.Z.; Xin, G.M.; Wang, X.Y. Dewetting transition of water on nanostructured and wettability patterned surfaces: A molecular dynamics study. J. Mol. Liq. 2021, 336, 116869. [Google Scholar] [CrossRef] [Scilit]
  32. Ghahremanian, S.; Abbassi, A.; Mansoori, Z.; Toghraie, D. Effect of nanostructured surface configuration on the interface properties and heat transfer of condensation process of argon inside nanochannels using molecular dynamics simulation. J. Mol. Liq. 2021, 339, 117281. [Google Scholar] [CrossRef] [Scilit]
  33. Hasan, M.N.; Rabbi, K.F.; Sabah, A.; Ahmed, J.; Kuri, S.K.; Rakibuzzaman, S.M. Molecular Dynamics Study on Evaporation and Condensation Characteristics of Thin Film Liquid Argon on Nanostructured Surface in Nano-scale Confinement. In Proceedings of the 7th Bangladesh-Society-of-Mechanical-Engineers (BSME) International Conference on Thermal Engineering (ICTE), Dhaka, Bangladesh, 22–24 December 2016; Bangladesh University of Engineering and Technology (BUET): Dhaka, Bangladesh, 2017. [Google Scholar]
  34. Mishin, Y.; Mehl, M.J.; Papaconstantopoulos, D.A.; Voter, A.F.; Kress, J.D. Structural stability and lattice defects in copper: Ab initio, tight-binding, and embedded-atom calculations. Phys. Rev. B 2001, 63, 224106. [Google Scholar] [CrossRef] [Scilit]
  35. Mark, P.; Nilsson, L. Structure and dynamics of the TIP3P, SPC, and SPC/E water models at 298 K. J. Phys. Chem. B 2001, 105, 9954–9960. [Google Scholar] [CrossRef] [Scilit]
  36. Varilly, P.; Chandler, D. Water Evaporation: A Transition Path Sampling Study. J. Phys. Chem. B 2013, 117, 1419–1428. [Google Scholar] [CrossRef] [Scilit]
  37. Wang, Y.-H.; Wang, S.-Y.; Lu, G.; Wang, X.-D. Effects of wettability on explosive boiling of nanoscale liquid films: Whether the classical nucleation theory fails or not? Int. J. Heat Mass Transf. 2019, 132, 1277–1283. [Google Scholar] [CrossRef] [Scilit]
  38. Seyf, H.R.; Zhang, Y. Effect of nanotextured array of conical features on explosive boiling over a flat substrate: A nonequilibrium molecular dynamics study. Int. J. Heat Mass Transf. 2013, 66, 613–624. [Google Scholar] [CrossRef] [Scilit]
  39. Wang, W.; Zhang, H.; Tian, C.; Meng, X. Numerical experiments on evaporation and explosive boiling of ultra-thin liquid argon film on aluminum nanostructure substrate. Nanoscale Res. Lett. 2015, 10, 158. [Google Scholar] [CrossRef] [Scilit]
  40. Guo, W.T.; Zeng, L.C.; Lu, Y.; Chen, J. Tuning surface hybrid-wettability to enhance the vapour film phenomenon induced by boiling heat transfer: Molecular dynamics. Int. Commun. Heat Mass Transf. 2022, 136, 106172. [Google Scholar] [CrossRef] [Scilit]
  41. Chen, L.; Wang, S.Y.; Xiang, X.; Tao, W.Q. Mechanism of surface nanostructure changing wettability: A molecular dynamics simulation. Comput. Mater. Sci. 2020, 171, 109223. [Google Scholar] [CrossRef] [Scilit]
  42. Wang, S.Y.; Wang, Z.J.; Wang, D.Q.; Yang, Y.R.; Zheng, S.F.; Gao, S.R.; Wang, X.D.; Lee, D.J. Nucleation of water vapor on nanodimpled surfaces: Effects of curvature radius and surface wettability. Appl. Therm. Eng. 2023, 219, 119437. [Google Scholar] [CrossRef] [Scilit]
  43. Plimpton, S. Fast Parallel Algorithms for Short-Range Molecular Dynamics. J. Comput. Phys. 1995, 117, 1–19. [Google Scholar] [CrossRef] [Scilit]
  44. Stukowski, A. Visualization and analysis of atomistic simulation data with OVITO-the Open Visualization Tool. Modell. Simul. Mater. Sci. Eng. 2010, 18, 015012. [Google Scholar] [CrossRef] [Scilit]
  45. Stillinger, F.H., Jr. Rigorous basis of the frenkel-band theory of association equilibrium. J. Chem. Phys. 1963, 38, 1486–1494. [Google Scholar] [CrossRef] [Scilit]
  46. Hou, Y.M.; Yu, M.; Chen, X.M.; Wang, Z.K.; Yao, S.H. Recurrent Filmwise and Dropwise Condensation on a Beetle Mimetic Surface. ACS Nano 2015, 9, 71–81. [Google Scholar] [CrossRef] [Scilit]
  47. Chen, J.; Pan, Z. Comparative analysis of two kinds of hydrogen bond criteria in the liquid water system. J. Mol. Sci. 2015, 31, 497–501. [Google Scholar] [CrossRef]
  48. Luzar, A.; Chandler, D. Effect of environment on hydrogen bond dynamics in liquid water. Phys. Rev. Lett. 1996, 76, 928. [Google Scholar] [CrossRef] [Scilit]
Figure 1. Schematic of the initial simulation system.
Symmetry 18 00773 g001
Figure 2. (a) Density contour map of hydrophilic surface, (b) density contour map of hydrophobic surface, (c) contact angle of water droplet on hydrophilic surface, (d) Contact angle of water droplet on hydrophobic surface.
Symmetry 18 00773 g002
Figure 3. Condensation snapshot of water molecules on hydrophilic surfaces.
Symmetry 18 00773 g003
Figure 4. Condensation snapshot of water molecules on hydrophobic surface.
Symmetry 18 00773 g004
Figure 5. Condensation number of water molecules on the substrate surface under different electric field strengths: (a) hydrophilic surface, (b) hydrophobic surface.
Symmetry 18 00773 g005
Figure 6. Number of clusters on the substrate surface under different electric field strengths: (a) hydrophilic surface, (b) hydrophobic surface.
Symmetry 18 00773 g006
Figure 7. Average temperature of water molecules under different electric field strengths: (a) hydrophilic surface 0–100 ps, (b) hydrophobic surface 0–100 ps, (c) hydrophilic surface 0–2 ns, (d) hydrophobic surface 0–2 ns.
Symmetry 18 00773 g007
Figure 8. Mean square displacement (msdz) of water molecules in Z direction under different electric field strengths.
Symmetry 18 00773 g008
Figure 9. The value of cos(θ) for different electric field strengths.
Symmetry 18 00773 g009
Figure 10. Variation in average cos (θ) on hydrophilic surface with Z-axis at E = 2.4 V/nm.
Symmetry 18 00773 g010
Figure 11. Schematic diagram of hydrogen bond determination standard.
Symmetry 18 00773 g011
Figure 12. Variation in hydrogen bond number with z-axis under different electric field strengths: (a) hydrophilic surface, (b) hydrophobic surface.
Symmetry 18 00773 g012
Figure 13. The proportion of vertical hydrogen bonds relative to the total number of hydrogen bonds under different conditions.
Symmetry 18 00773 g013
Disclaimer/Publisher’s Note: The statements, opinions and data contained in all publications are solely those of the individual author(s) and contributor(s) and not of MDPI and/or the editor(s). MDPI and/or the editor(s) disclaim responsibility for any injury to people or property resulting from any ideas, methods, instructions or products referred to in the content.