Article

Modeling and Analysis of a Thermal Expansion and Poisson’s Ratio Integrated Tunable Metamaterial Structure

1
School of Mechanical Engineering, Zhejiang Sci-Tech University, Hangzhou 310018, China
2
National and Local Joint Engineering Research Center of Reliability Analysis and Testing for Mechanical and Electrical Products, Zhejiang Sci-Tech University, Hangzhou 310018, China
*
Author to whom correspondence should be addressed.
Symmetry 2026, 18(5), 727; https://doi.org/10.3390/sym18050727
Submission received: 31 March 2026 / Revised: 17 April 2026 / Accepted: 21 April 2026 / Published: 24 April 2026
(This article belongs to the Section Engineering and Materials)

Abstract

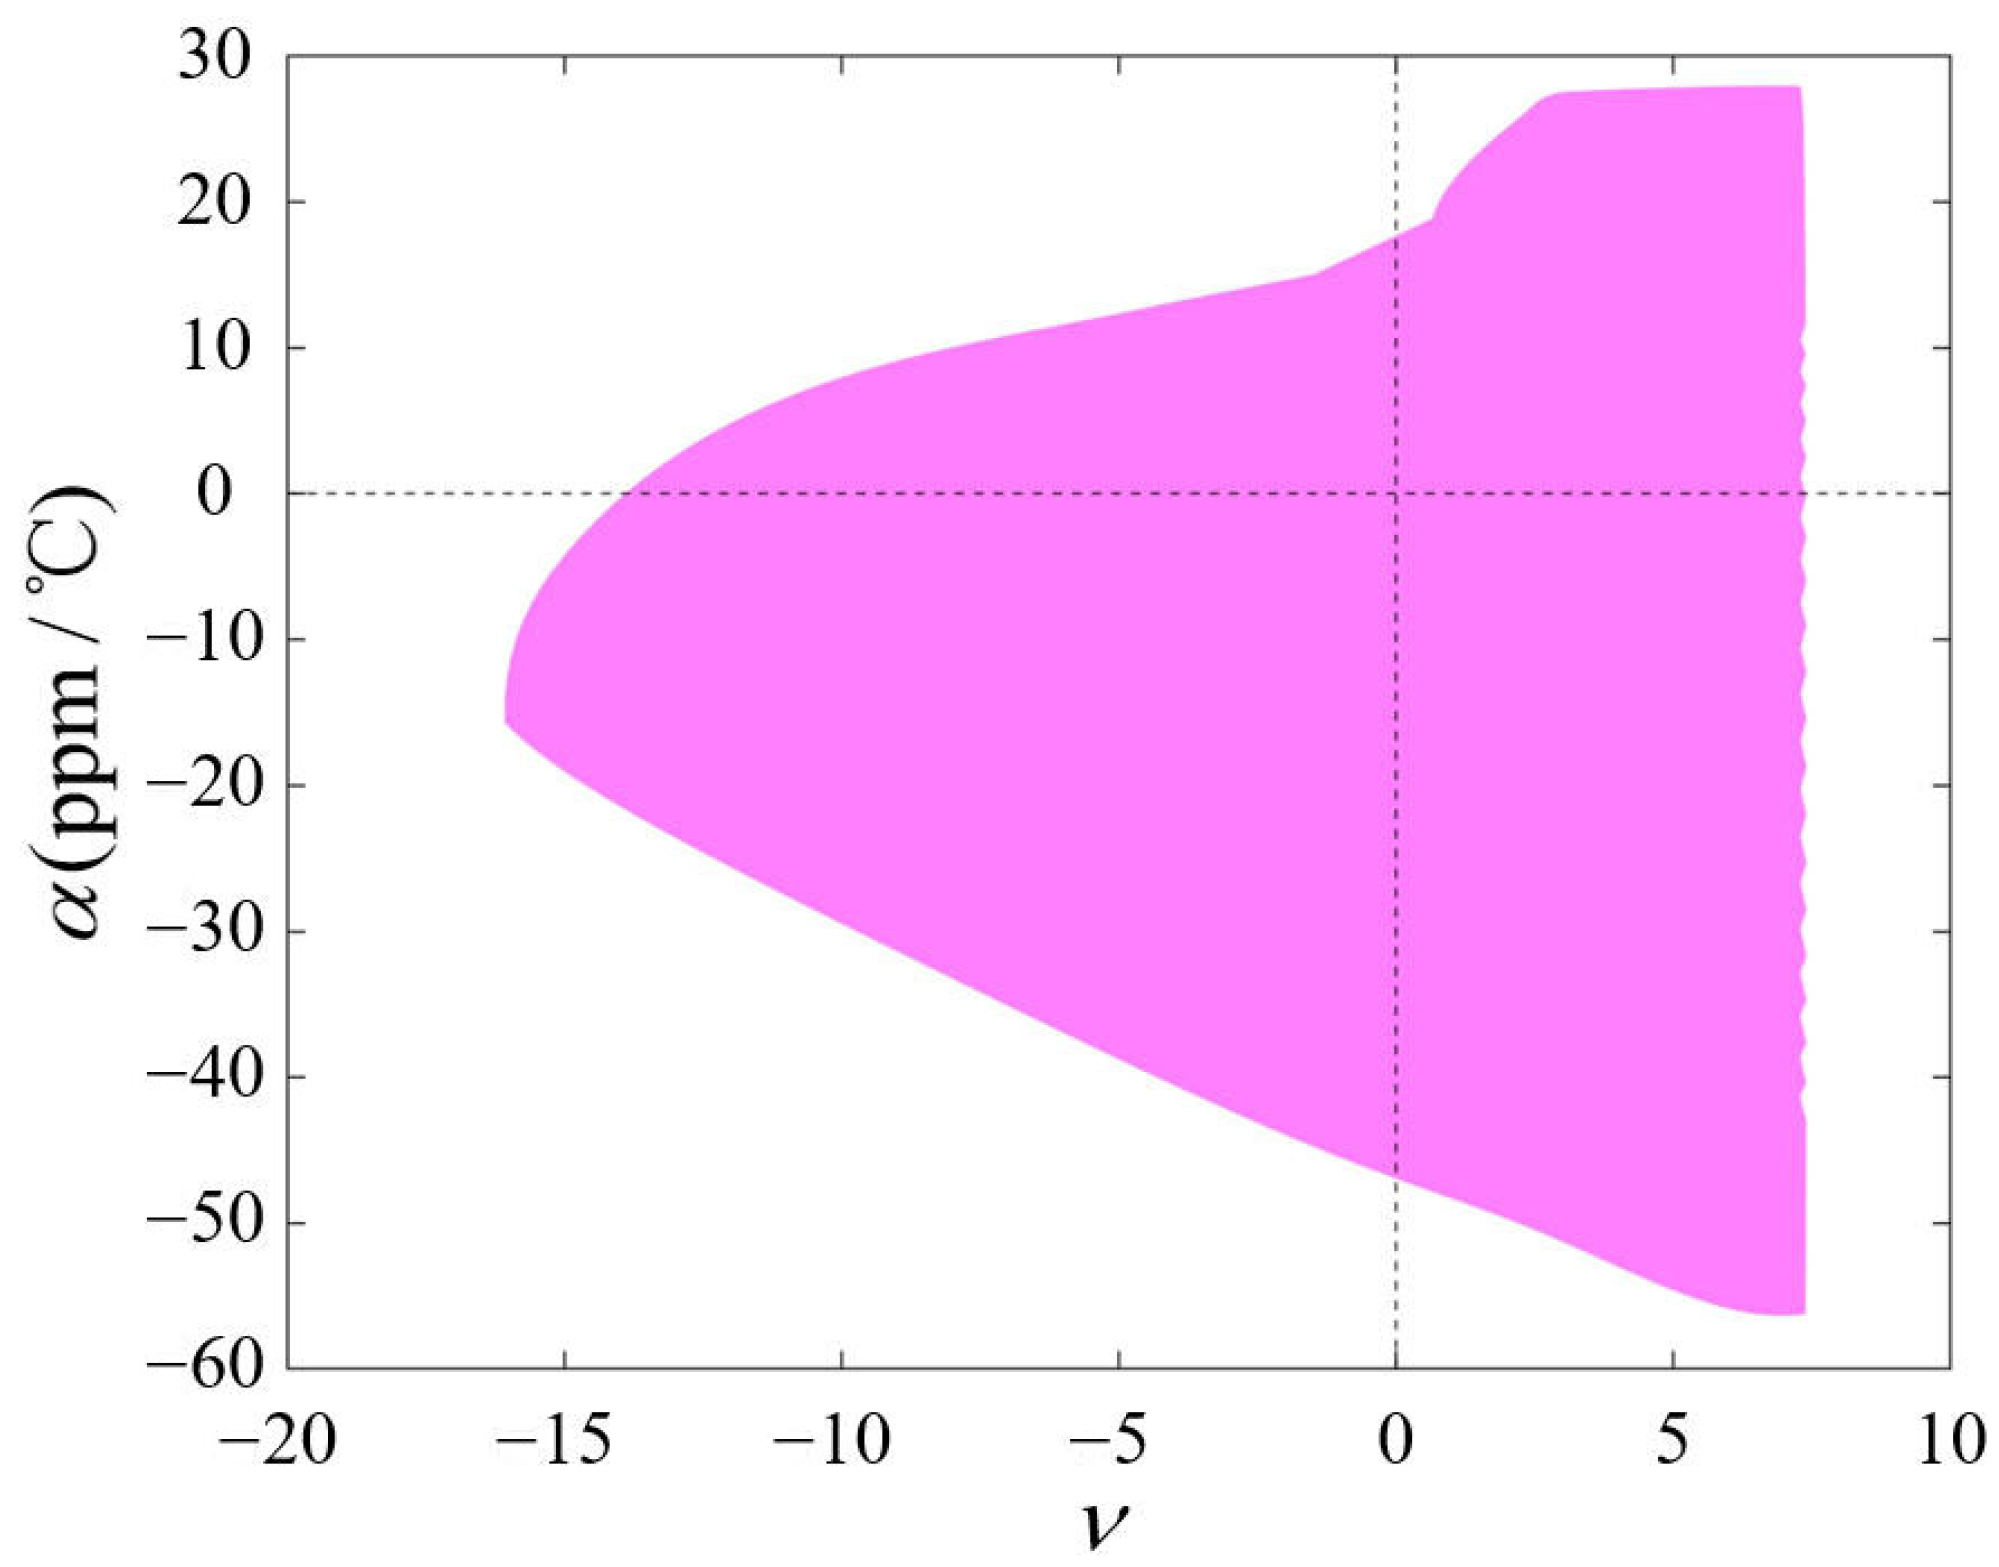
The tunable coefficient of thermal expansion (CTE) and Poisson’s ratio (PR) properties of metamaterials help address issues caused by drastic temperature variations and external loads. In this work, we propose a novel bimaterial thermal expansion and PR integrated tunable 2D metamaterial structure. Under certain parameter constraints, the structure based on an Al alloy/low carbon steel (LCS) combination demonstrates a wide tunability, with the CTE ranging from −47 to 28 ppm/°C and the PR varying from −14.8 to 7.3. A general thermoelastic equation is adopted to establish the relationship between temperature, external force, and displacement, which is then assembled into a theoretical model. Through theoretical analysis and numerical simulations, the underlying mechanisms of the proposed 2D metamaterial structure’s CTE, PR, and their relationship with geometric parameters and elastic modulus ratios are revealed. CTE and PR experiments are conducted to validate the theoretical modeling. Finally, the coupling relationship between CTE and PR is revealed.

1. Introduction

Mechanical metamaterials are materials that acquire unconventional properties through the deliberate design of microstructures [1,2]. Since their ability to achieve negative CTE [3,4,5,6,7,8], negative Poisson’s ratio(NPR) [9,10,11,12,13], and complex spatial deformations [14,15] that are difficult to achieve with conventional materials, mechanical metamaterials have attracted increasing interest in recent years.
Different microstructure designs endow mechanical metamaterials with diverse mechanical properties. Among the various performance indices, CTE and PR are of particular importance. Mechanical metamaterials with tunable CTE can effectively regulate structural deformation induced by temperature changes, and thus exhibit significant application potential in aerospace engineering, precision instruments, and electronic packaging. Mechanical metamaterials with NPR tend to contract toward the loading or impact region under external loads, thereby exhibiting energy absorption and cushioning capabilities.
Thermal expansion metamaterials can be categorized into tensile-dominated and bending-dominated types based on their deformation characteristics. Tensile-dominated thermal expansion metamaterials are typically developed from the bimaterial triangular model proposed by Miller [16,17,18,19]. Bending-dominated thermal expansion metamaterials are commonly derived from the bimaterial beam model proposed by Timoshenko [20,21,22,23,24]. NPR metamaterials are classified into re-entrant, perforated, and chiral types based on their deformation mechanisms. Typical re-entrant structures include re-entrant hexagonal [25] and re-entrant triangular configurations [26,27], in which NPR is associated with geometric rotation and unfolding of the unit cells when an external load is applied. Perforated structures exhibit unconventional deformation through the introduction of holes with specific shapes and distributions [28,29,30]. Chiral structures exhibit NPR due to geometric coupling among rotating units [31,32].
In practical engineering applications, structures are commonly subjected to the combined effects of thermal and mechanical loads. To meet the requirements of multi-field coupled operating conditions and to improve the overall material performance, integrating multiple mechanical properties within a single material has been considered an effective approach. A commonly adopted design strategy is to combine tensile-dominated thermal expansion with re-entrant structures [33,34,35,36,37]. For example, Ai et al. [38,39] designed several mechanical metamaterials with simultaneously tunable CTE and PR based on bimaterial star-shaped re-entrant structures. Wei et al. [11,40] combined bimaterial triangular units with re-entrant triangular configurations to develop a series of 2D and 3D metamaterials. In addition, bimaterial curved beams have been introduced into chiral and anti-chiral structures to achieve integrated tunability of CTE and PR [41,42,43,44,45].
Considering the pros and cons of tensile-dominated and bending-dominated metamaterials, it is preferable to make modifications to tensile-dominated structures to achieve an extended tunable range of CTE and PR. In this work, tensile-dominated thermal expansion metamaterials and re-entrant NPR metamaterials are combined within a modified bimaterial rhombic structure incorporating a symmetric arrow-shaped configuration, resulting in a novel two-dimensional metamaterial with tunable CTE and PR. The remainder of this paper is organized as follows: Section 2 introduces the architectural design of the proposed metamaterial and establishes the corresponding theoretical and finite element models. Section 3 systematically investigates the effects of geometric parameters and material combinations on CTE and PR. Section 4 summarizes the main findings of this study.

2. Model and Method

2.1. Structure Introduction

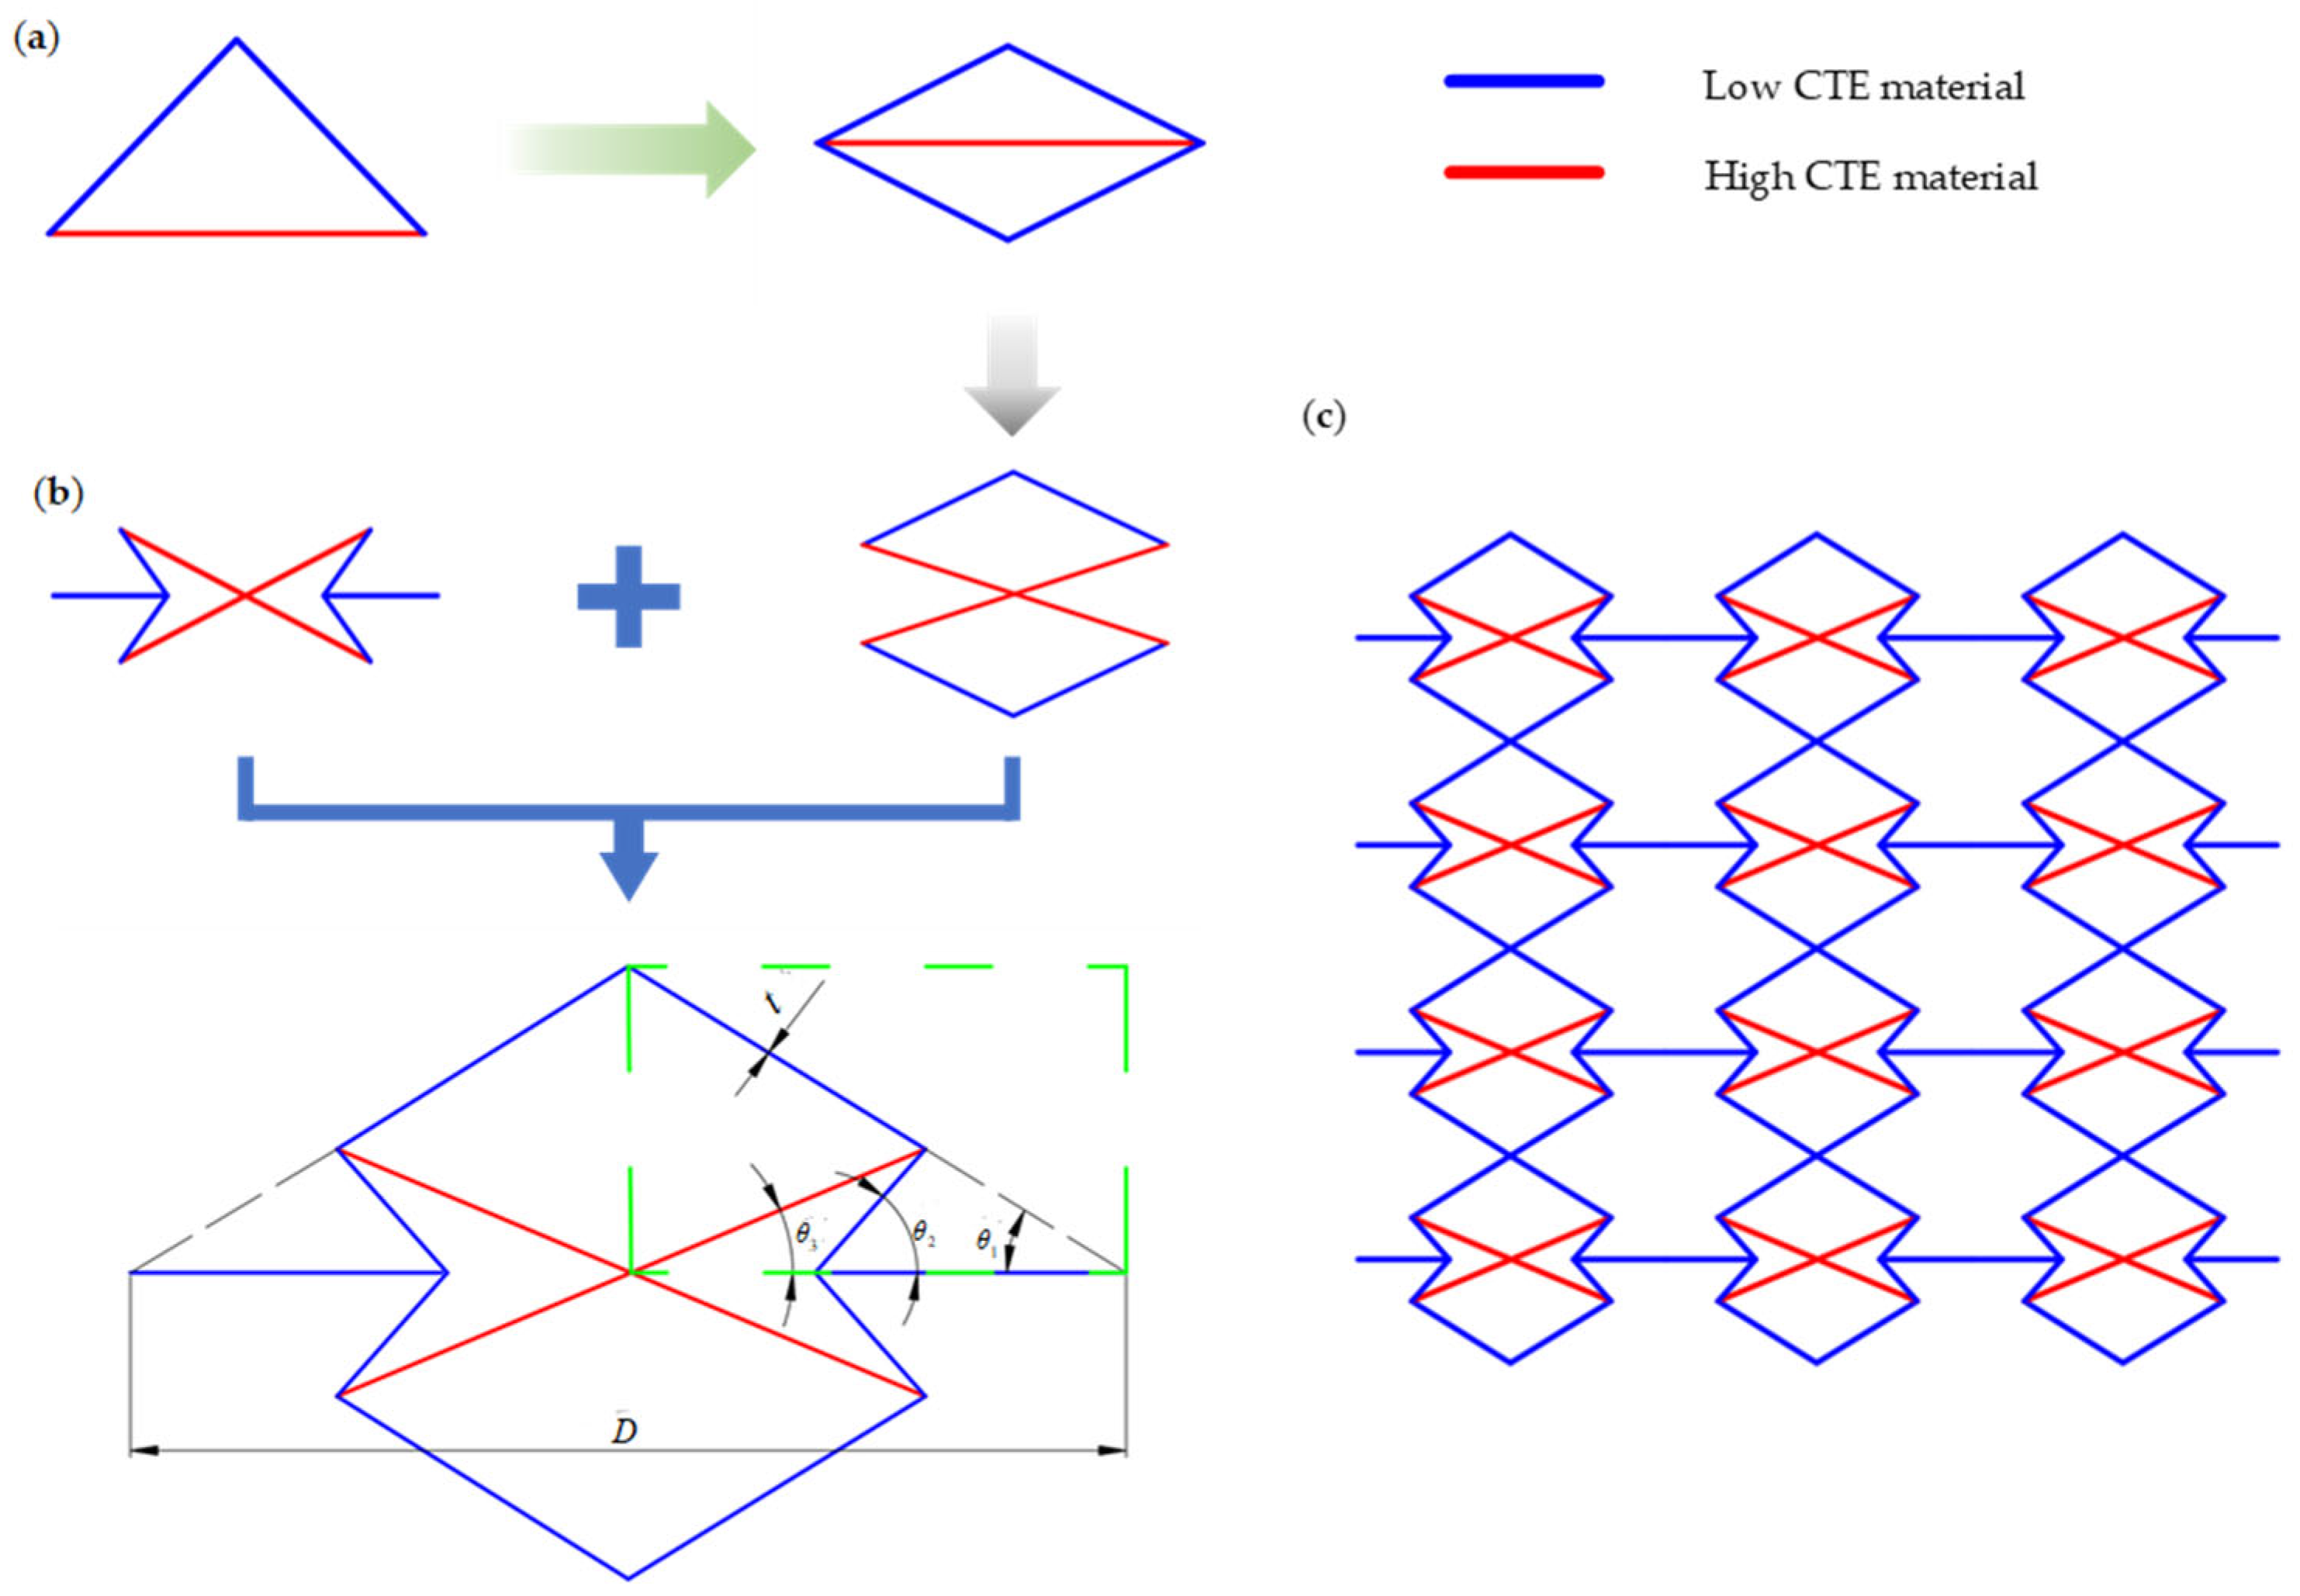
The tensile-dominated bimaterial triangular model proposed by Miller et al. [16] is shown in Figure 1a. In the isosceles triangle structure, the base beam is made of a material with a high CTE, while the side beams are made of a material with a low CTE. With the material combination determined, the CTE of this structure depends on two geometric parameters: the base beam length D and the angle θ1 between the base beam and the side beams. By mirroring two bimaterial triangles along the base beam, a bimaterial rhombus structure is obtained. The regulatory range of CTE is limited, and it cannot regulate PR in such a structure. Accordingly, a new metamaterial unit cell structure is proposed in this work, as shown in Figure 1b. Starting from a bimaterial rhombic structure, a longitudinal tensile deformation is applied, thereby transforming the rhombus into a scissor-like configuration. Based on this scissor mechanism, a symmetric arrow-shaped structure is subsequently integrated, resulting in a unit cell that preserves the original structural symmetry [46]. Compared to the bimaterial rhombus structure, the proposed metamaterial structure has more tunable geometric parameters and enables the regulation of both CTE and PR from negative to positive.
The proposed metamaterial fully exploits structural symmetry in its design, modeling, and deformation behavior. In the design stage, a symmetric arrow-shaped configuration is integrated into the modified bimaterial rhombic structure, ensuring geometric symmetry of the unit cell. This symmetry not only preserves uniform mechanical response but also enables coordinated regulation of both CTE and PR. In the modeling stage, the structural symmetry allows the unit cell to be simplified into a quarter model, significantly reducing computational cost while maintaining accuracy in both theoretical analysis and finite element simulations. In terms of deformation behavior, the symmetric arrangement ensures that thermal expansion and mechanical loading induce coordinated and uniform deformation patterns, avoiding asymmetric distortions and enabling predictable tuning of macroscopic properties.
As shown in Figure 1b, the structure has four geometric parameters, including three angular parameters θ1, θ2, θ3 and the length parameter D. The CTE, elastic modulus, and density of the blue beams are represented by αL, EL, and ρL, respectively, while the CTE, elastic modulus, and density of the red beams are represented by αH, EH, and ρH, respectively. All beams have a rectangular cross-section of 2 mm × 3 mm. Based on the proposed structure, a planar metamaterial, as shown in Figure 1c, can be constructed.

2.2. Modeling Theory

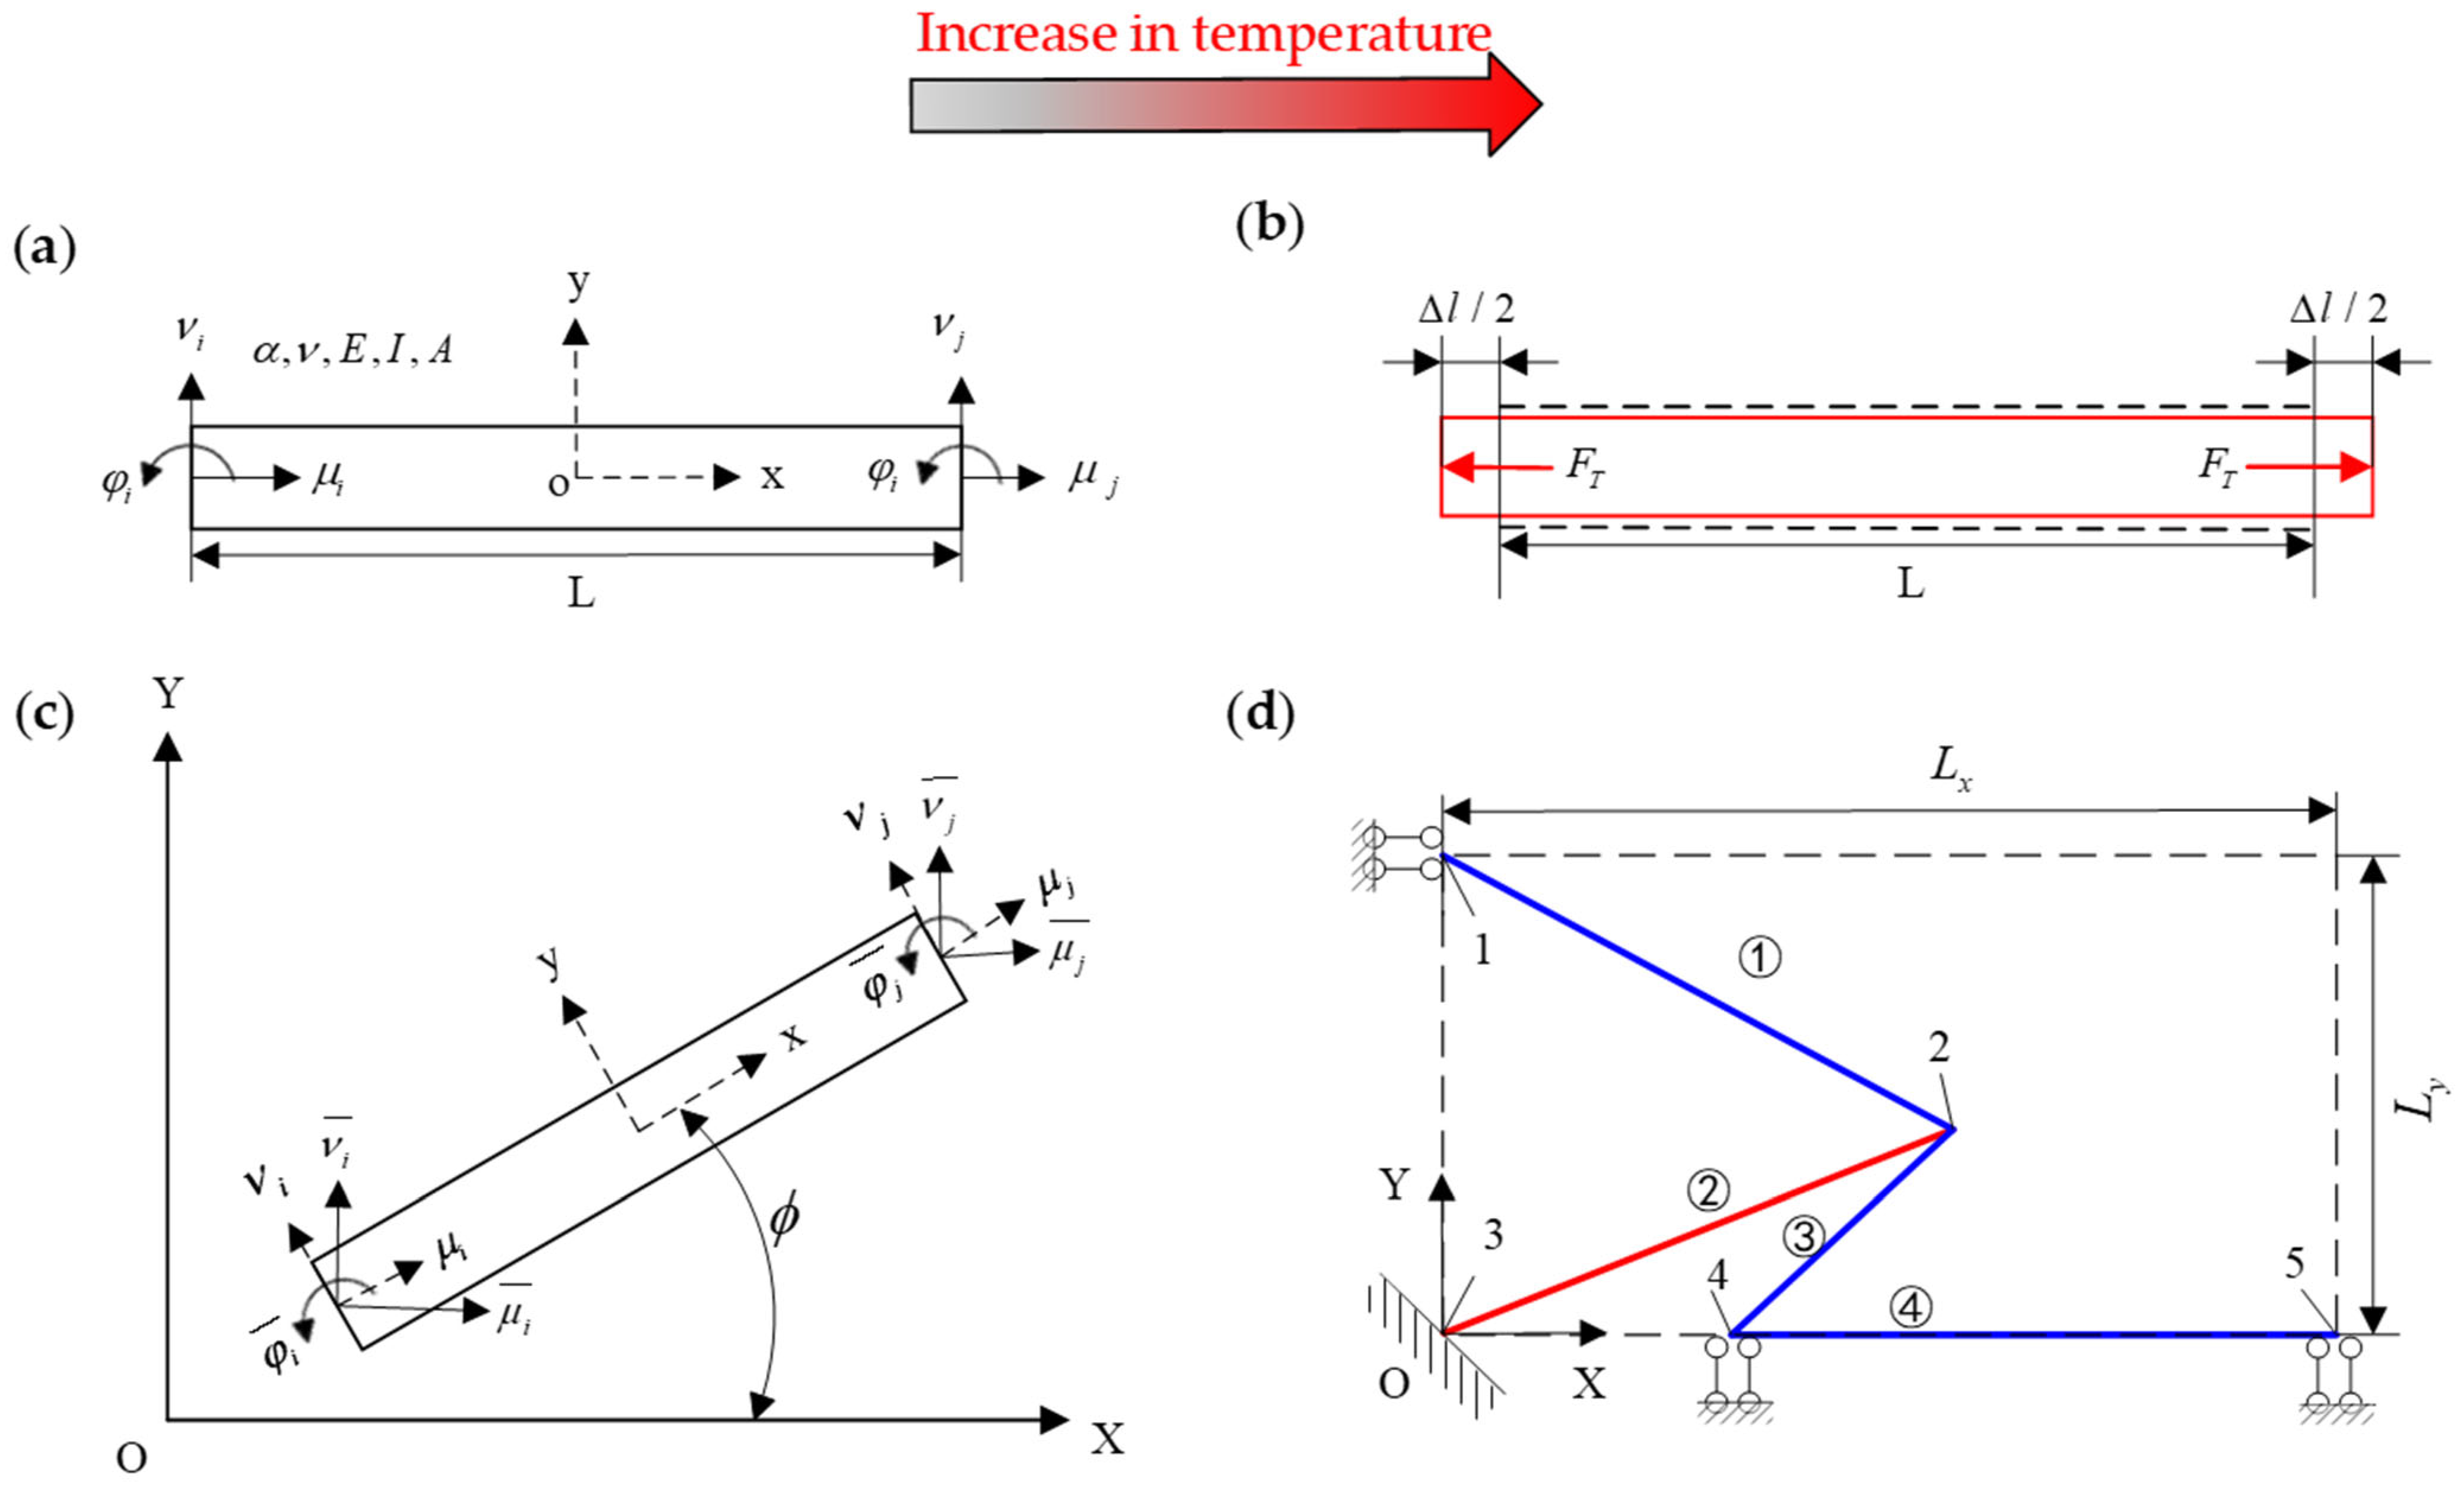
In this paper, the stiffness matrix method is used to analyze the equivalent CTE and PR of the metamaterial unit cell structure. Based on the symmetrical characteristics of the overall unit cell structure, the equivalent representation of a quarter of the structure is used to simplify the modeling process. As shown in Figure 2d, constraints are applied so that the deformation of the equivalent structure matches that of the overall unit cell structure. The specific constraint conditions are as follows: the displacement of point 1 in the X direction is restricted to zero, the displacement of point 3 in both the X and Y directions is restricted to zero, the displacement of points 4 and 5 in the Y direction is restricted to zero, and the rotations at points 1, 3, 4, and 5 are also restricted to zero.
The theoretical modeling process follows the methodology presented in previous work [15], and the general thermoelastic equation for the unit cell structure is:
P ν 1 ¯ P μ 2 ¯ P ν 2 ¯ M φ 2 ¯ P μ 4 ¯ P μ 5 ¯ = K 11 K 12 K 13 K 14 K 15 K 16 K 21 K 22 K 23 K 24 K 25 K 26 K 31 K 32 K 33 K 34 K 35 K 36 K 41 K 42 K 43 K 44 K 45 K 46 K 51 K 52 K 53 K 54 K 55 K 56 K 61 K 62 K 63 K 64 K 65 K 66 ν 1 ¯ μ 2 ¯ ν 2 ¯ φ 2 ¯ μ 4 ¯ μ 5 ¯ T 1 T 2 T 3 T 4 T 5 T 6
α = ν 1 ¯ L y Δ T
ν = ε y ε x = ν 1 ¯ / L y μ 5 ¯ / L x
Equation (1) simultaneously considers both external loads and temperature variations, and the specific expressions of K11K66 are shown in Appendix A. The equivalent CTE of the structure is calculated using Equations (1) and (2), while the equivalent PR is calculated using Equations (1) and (3). Here, Ly represents the equivalent length of the structure in the Y direction, and Lx represents the equivalent length of the structure in the X direction.

2.3. Model Verification

To verify the correctness of the theoretical model presented in Section 2.2 for the 2D metamaterial unit cell, finite element simulations are performed using ABAQUS. In the theoretical model, only a quarter of the unit cell structure is analyzed to simplify the modeling process. In contrast to the theoretical model, the full 2D metamaterial unit cell is modeled in the finite element simulations. The 2D metamaterial model is created in the Part module. In the Property module, the material properties of the beams are defined, along with the cross-sectional dimensions and beam orientations. The cross-sectional width of the middle beam (Beam④ in Figure 2d) is twice that of the other beams, with the middle beam’s cross-section being (2 mm × 6 mm) and the others being (2 mm × 3 mm). In the Mesh module, the model is meshed with a global size of 1 mm, and the element type is set to B22.
Table 1 lists the physical properties of the four materials used in this study, assuming that these material properties are independent of temperature variations. To facilitate manufacturing and to mitigate the local buckling effect in the beams, the geometric parameters of the 2D metamaterial unit cell structure are subject to the following range limitations: θ1 ∈ (20°, 60°), θ2 ∈ (20°, 160°), θ3 ∈ (10°, 60°), D ∈ (100 mm, 500 mm), and θ2θ3 > 5°. Table 2 provides the material combinations and their respective physical property ratios. The A/B combination represents a hypothetical material combination used for subsequent mechanical performance analysis.

2.3.1. Mesh Convergence Analysis

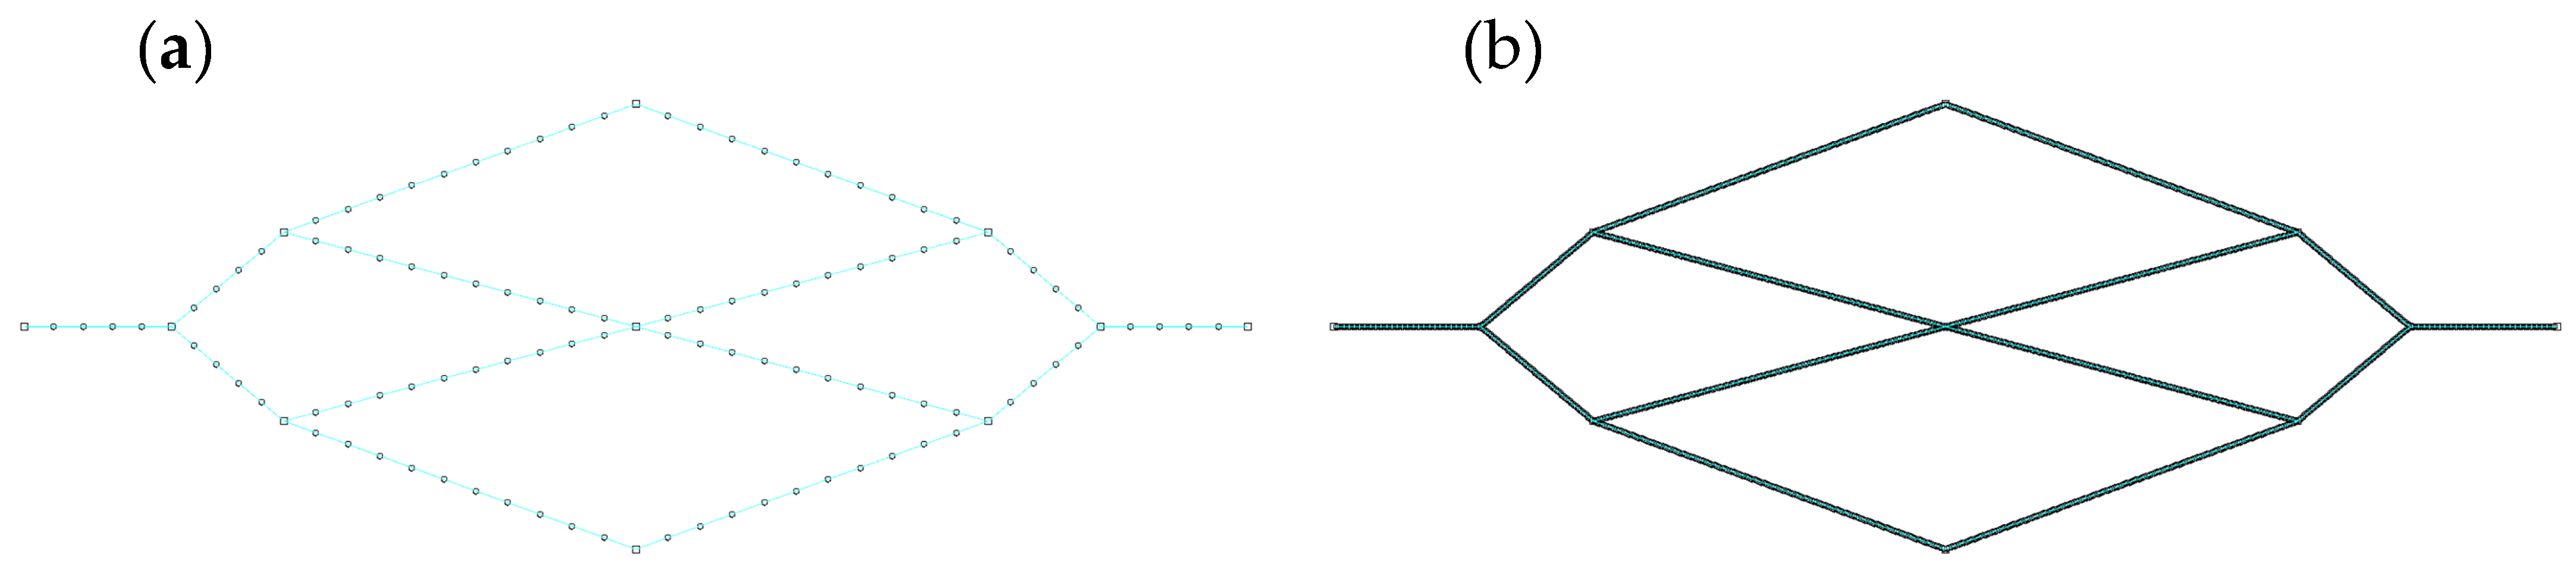
To ensure that the numerical results are independent of mesh size, a mesh convergence analysis is conducted. A representative metamaterial model is selected, and five different global seed sizes, namely 0.5 mm, 1 mm, 2 mm, 4 mm, and 8 mm, are employed to generate meshes with increasing refinement. Figure 3 shows the distribution of grid seeds under different mesh seed sizes for the structure. For each mesh density, the CTE is calculated under the same boundary and loading conditions. The results are summarized in Table 3. It can be observed that the CTE gradually converges as the mesh is refined. For the finest meshes, the differences between successive refinements become negligibly small.
These results indicate that further mesh refinement has an insignificant effect on the predicted CTE, demonstrating that the numerical solutions are mesh-independent. Considering both computational efficiency and accuracy, a global seed size of 1 mm is adopted in all subsequent simulations.

2.3.2. CTE Simulation

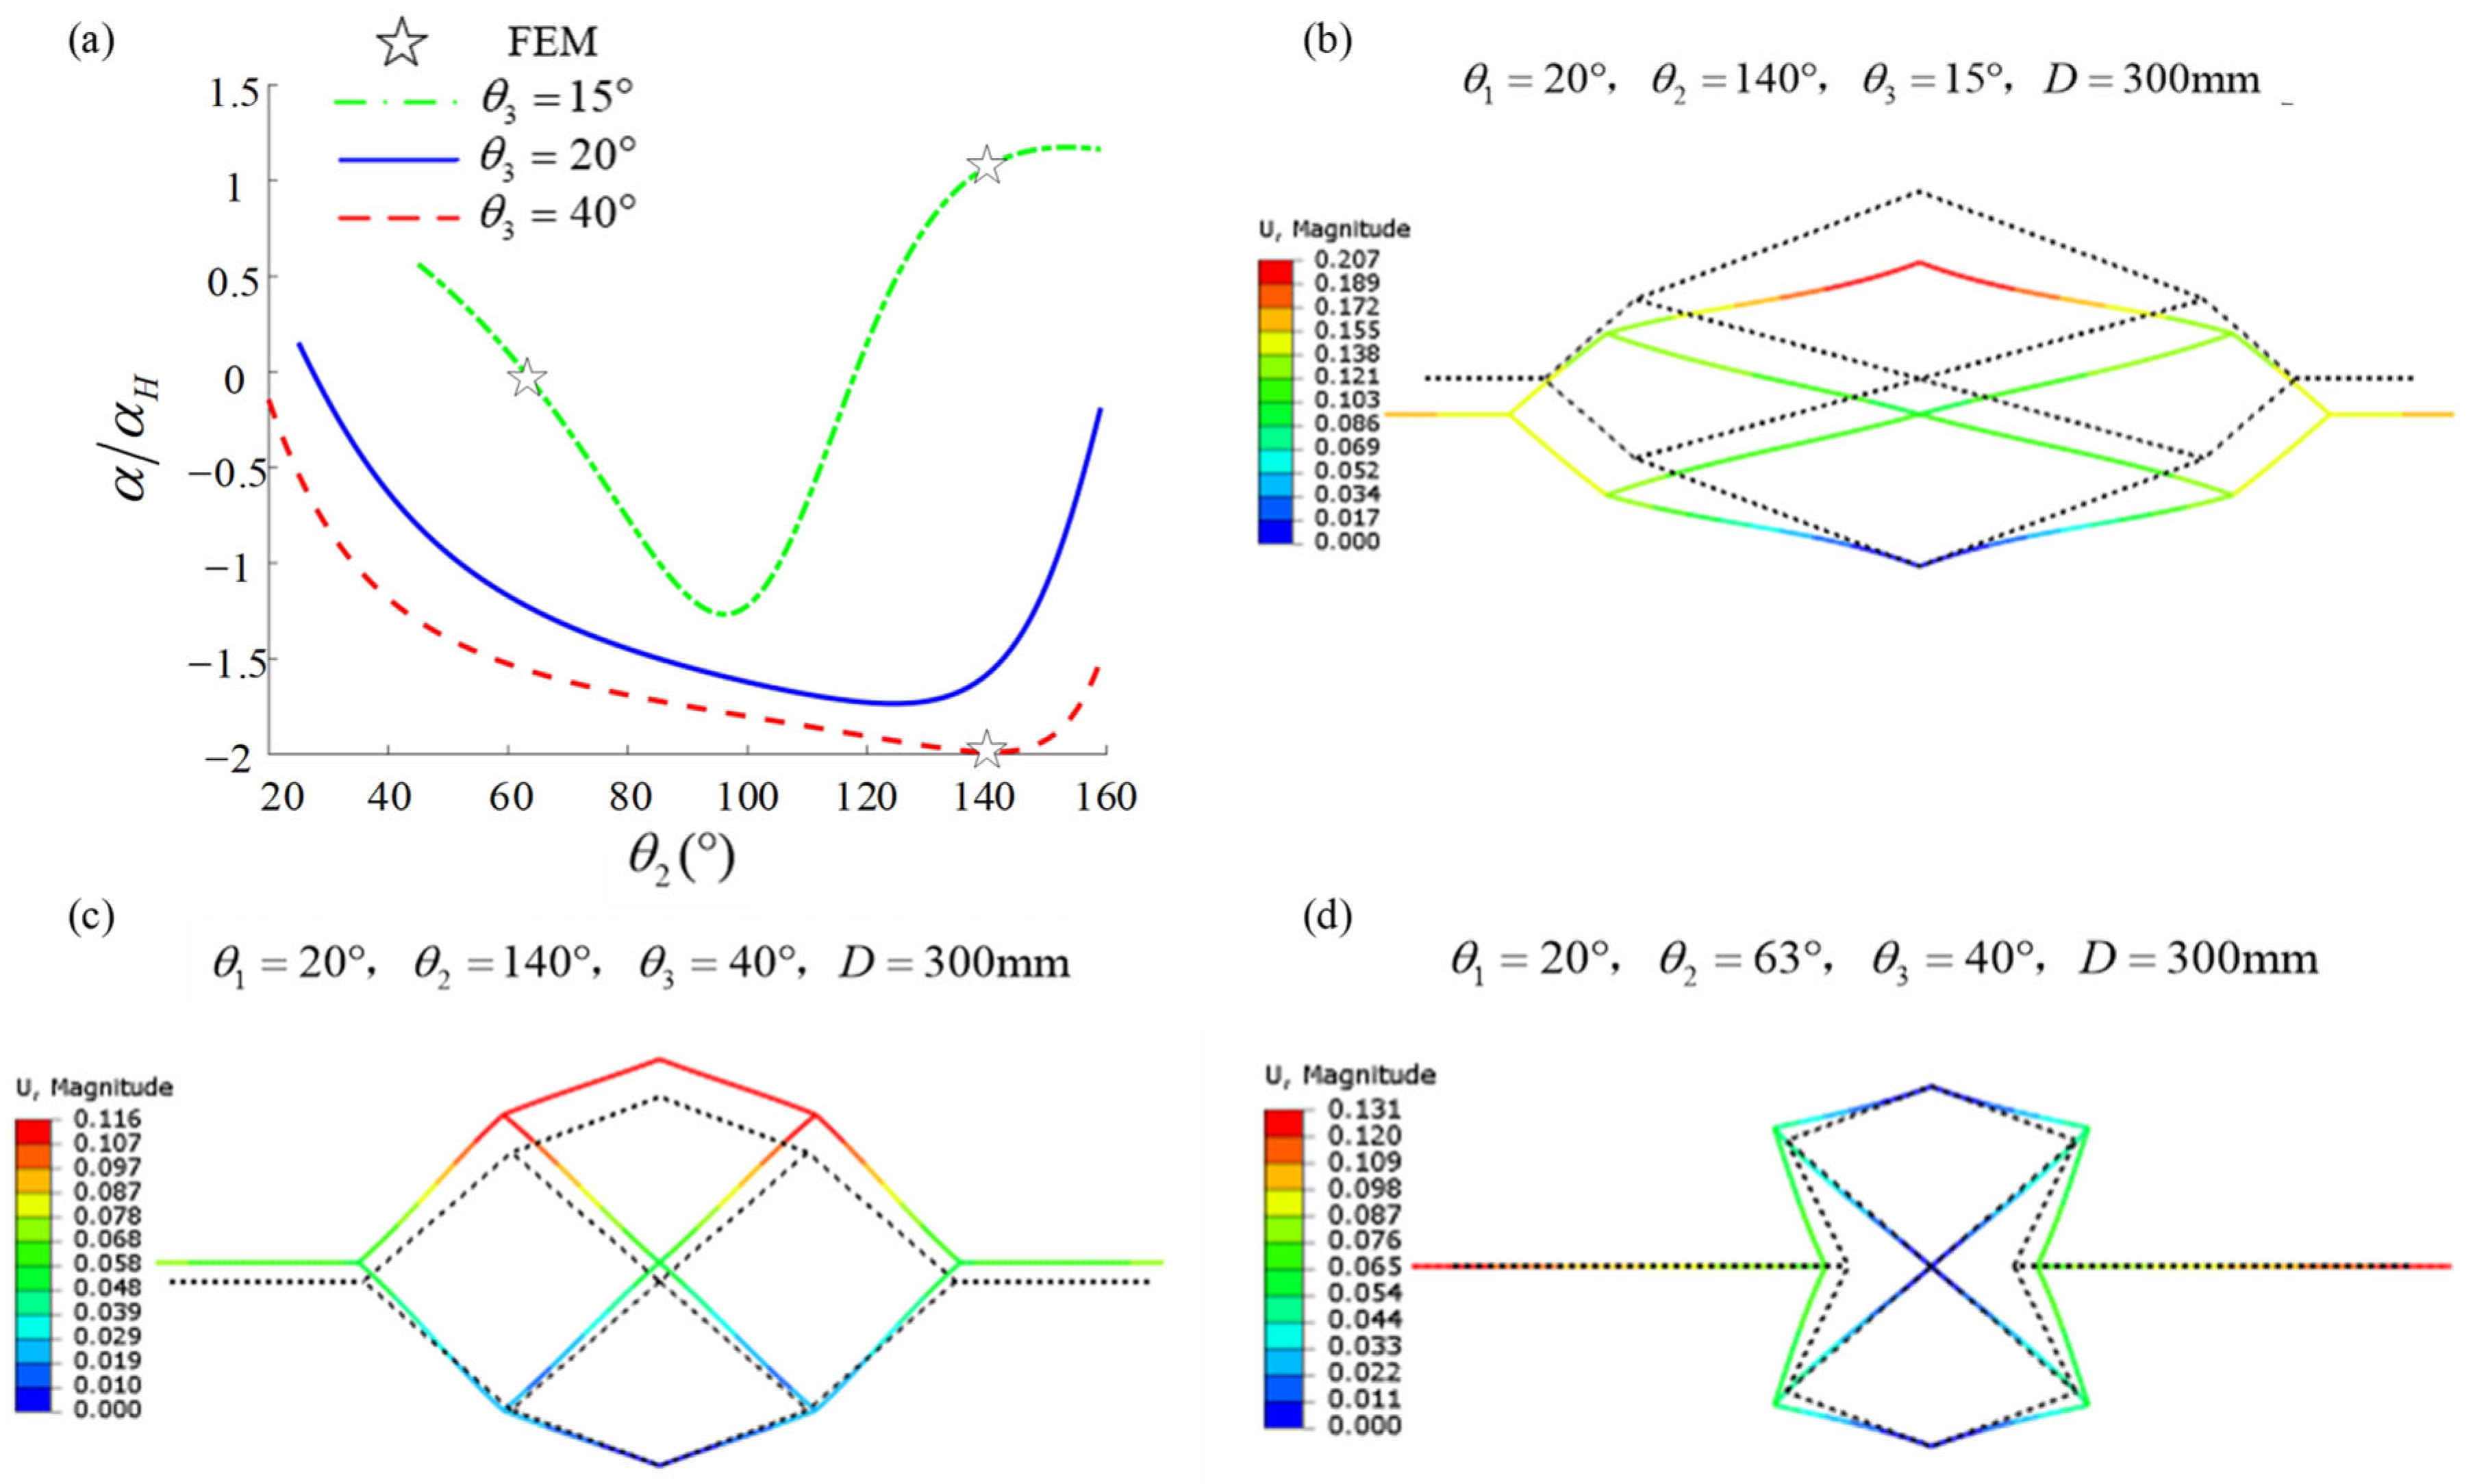
To simulate the thermal expansion process of the 2D metamaterial unit cell structure, a temperature field uniformly increasing from 20 °C to 60 °C is applied in the Load module. The boundary conditions for the 2D metamaterial unit cell structure are set as follows: the lower endpoint of the structure is fixed, and the upper endpoint can only move along the Y direction. Using an Al alloy/LCS material combination as an example, when θ1 = 20° and D = 300 mm, the variation curve of the relative CTE (α/αH) with respect to θ2 and θ3 is shown in Figure 4a. It can be observed that: (i) As θ2 increases, α/αH first decreases and then increases; (ii) As θ3 increases, the range of α/αH in the negative region decreases, while the range in the positive region increases; (iii) As θ3 increases, the point of minimum α/αH shifts to the left. As shown in Figure 4a, three representative size combinations are selected for CTE simulations. The corresponding results in Figure 4b–d demonstrate negative, positive, and quasi-zero thermal expansion, respectively. The black dashed line in the simulation figures represents the initial state at 20 °C, and the colored lines represent the deformed state at 60 °C. Table 4 provides the theoretical and simulation results for the three structures along with their relative errors, where SCTE represents the simulation result for CTE and TCTE represents the theoretical result. It can be observed that the relative errors for positive and negative thermal expansion are negligible, while the relative error for the quasi-zero thermal expansion is higher. Since the denominator in the error index (TCTE) is very small, even a small difference between SCTE and TCTE leads to a high relative error. The simulation results validate the correctness of the theoretical model.

2.3.3. PR Simulation

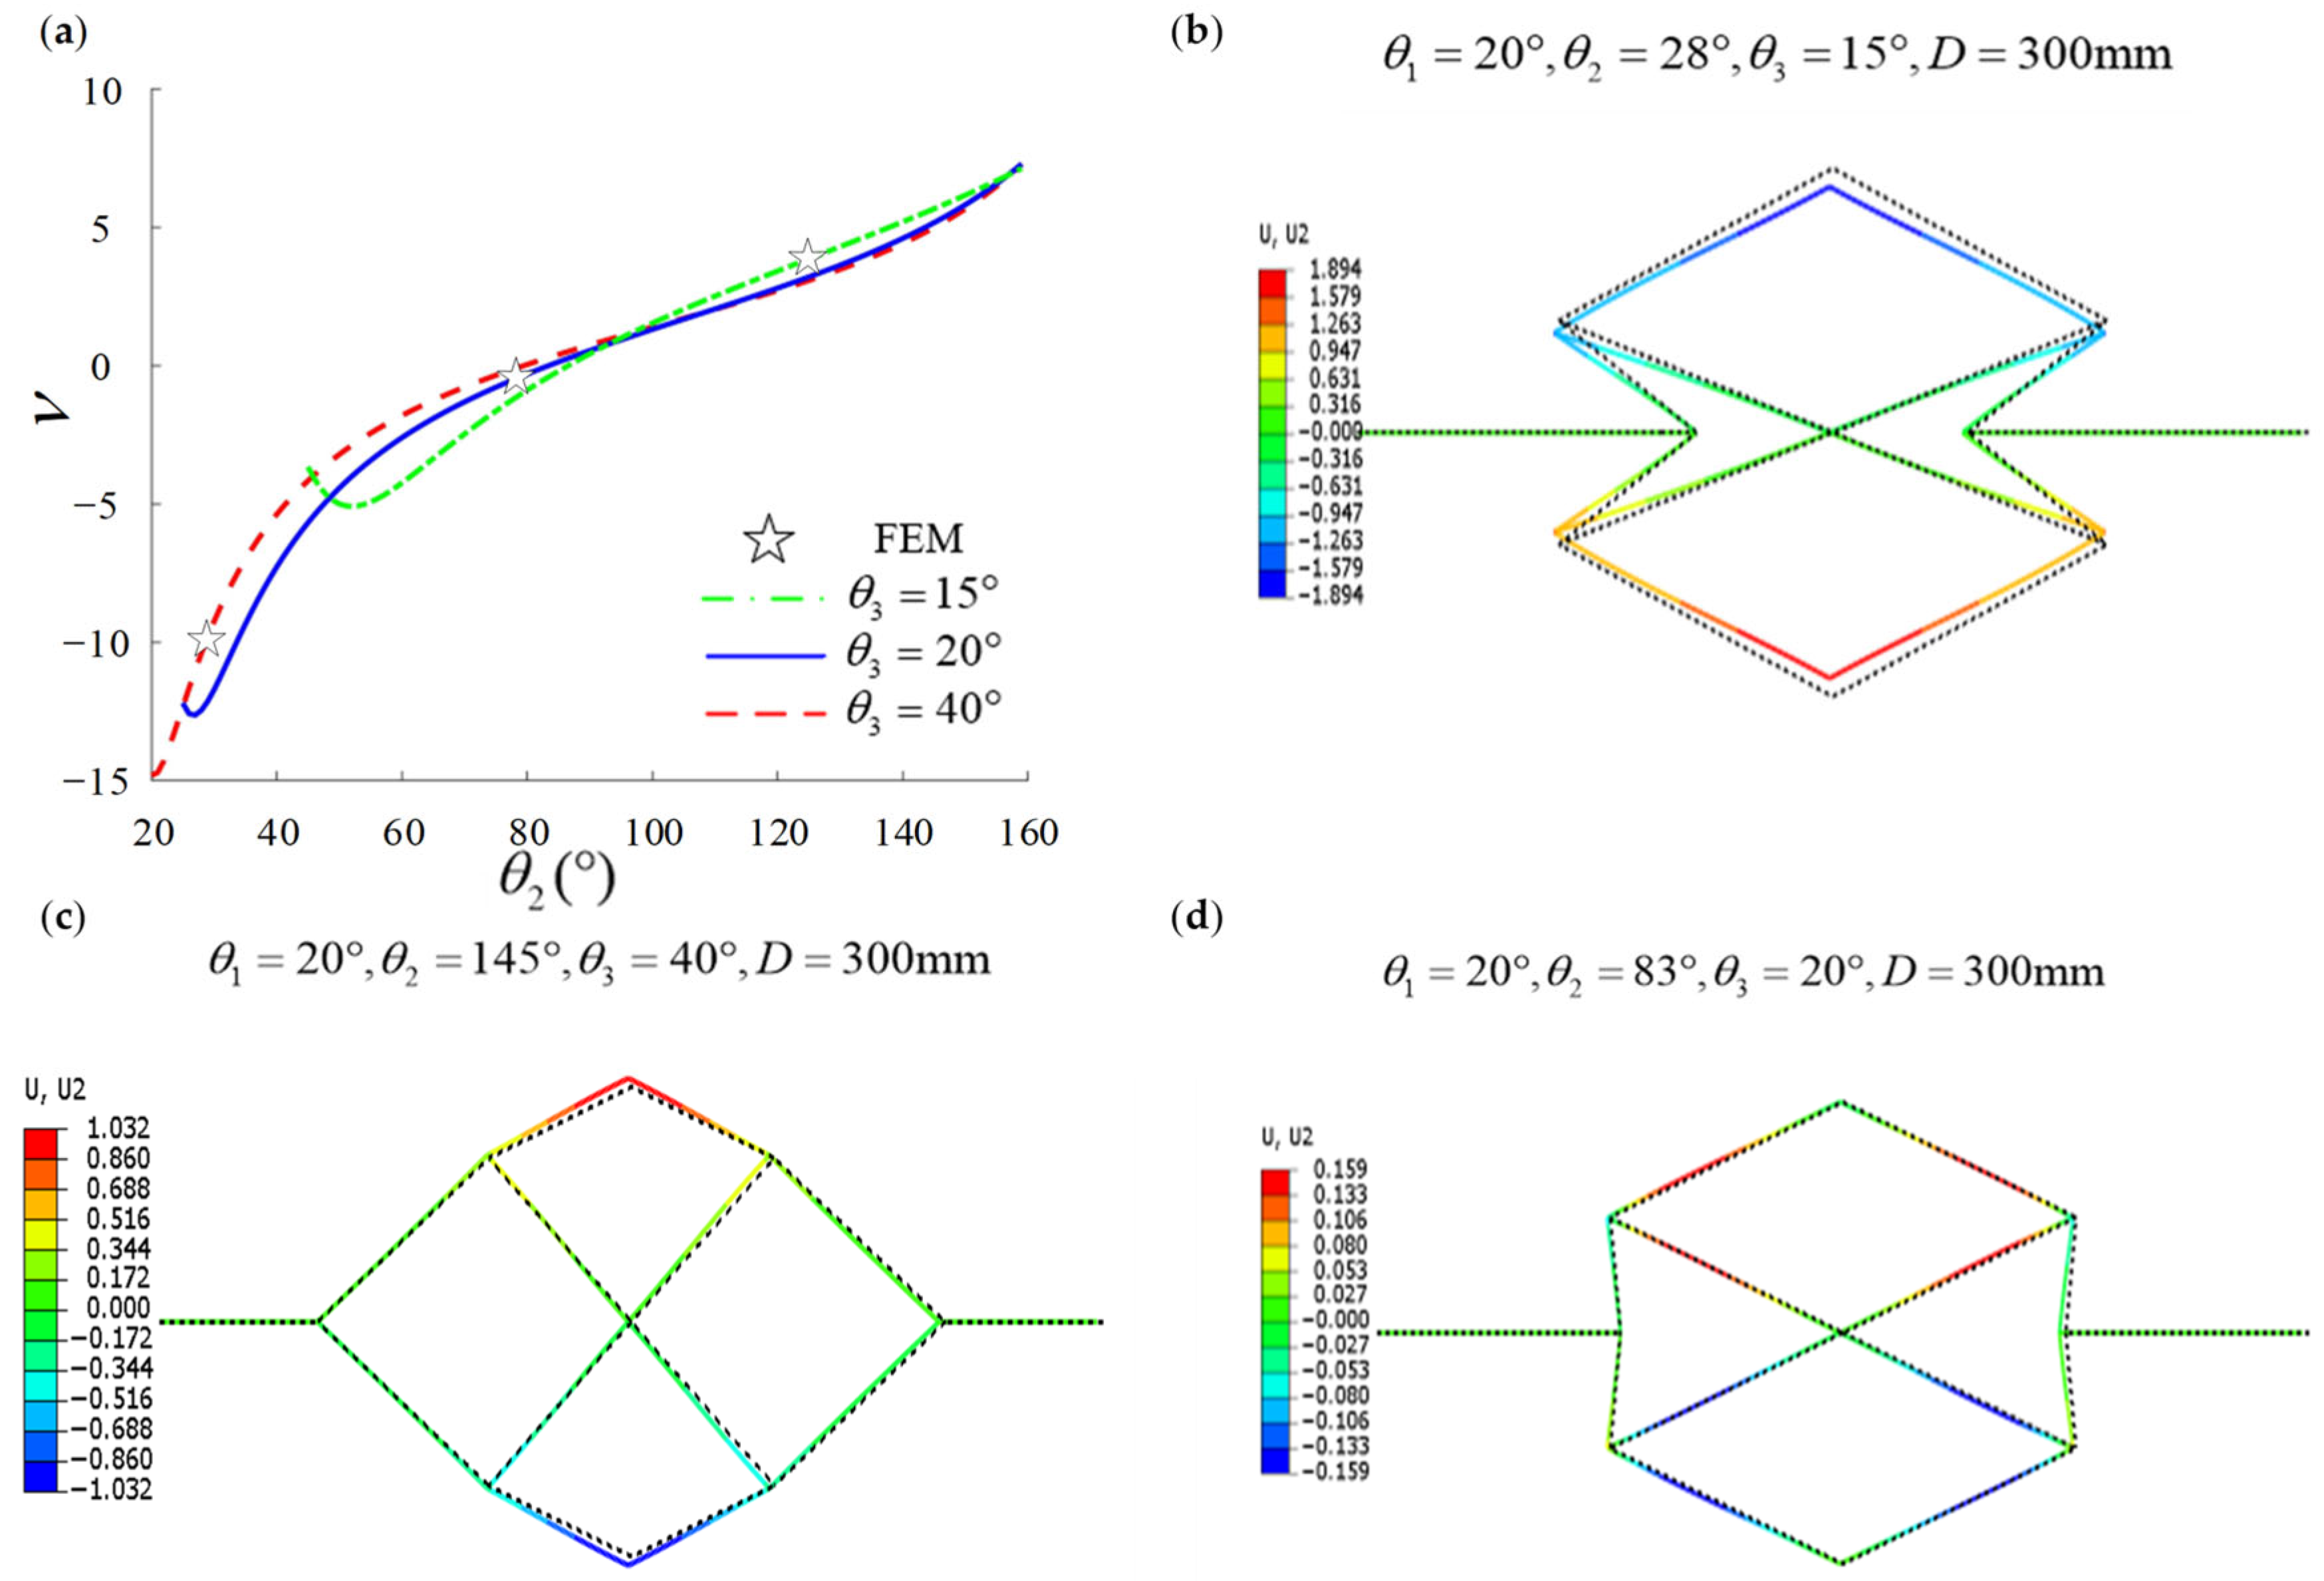
To simulate the PR characteristics of the 2D metamaterial unit cell structure, a horizontal displacement of 1 mm in the positive X-direction is applied at the right endpoint of the structure in the Load module. The boundary conditions for the 2D metamaterial unit cell structure are set as follows: the left endpoint of the structure is fixed. Using an Al alloy/LCS material combination as an example, when θ1 = 20° and D = 300 mm, the variation curve of PR with respect to θ2 and θ3 is shown in Figure 5a.
It can be observed that: (i) As θ2 increases, PR first decreases and then increases, (ii) As θ3 increases, the adjustable range of PR decreases, (iii) As θ3 increases, the point of minimum PR shifts to the right. As shown in Figure 5a, three size combinations are selected for PR simulation, and the simulation results are shown in Figure 5b–d, which correspond to NPR, positive PR, and quasi-zero PR, respectively. The black dashed line in the simulation figures represents the initial state before the displacement of the right endpoint, and the colored lines represent the deformed state after the displacement. Table 5 provides the theoretical and simulation results for the three structures along with their relative errors, where SPR represents the simulation result for PR and TPR represents the theoretical result. It can be observed that the relative errors for both positive PR and NPR are very small and negligible, while the relative error for the quasi-zero PR is higher. Since the denominator in the error index (TPR) is very small, even a small difference between SPR and TPR leads to a high relative error. The simulation results validate the correctness of the theoretical model.
In this study, geometric nonlinearity is not considered, and the analysis is conducted under the assumption of small deformation. However, under large deformation conditions, geometric nonlinearity may influence Poisson’s ratio, leading to deviations from the linear prediction.

2.3.4. Elastic Modulus Simulation

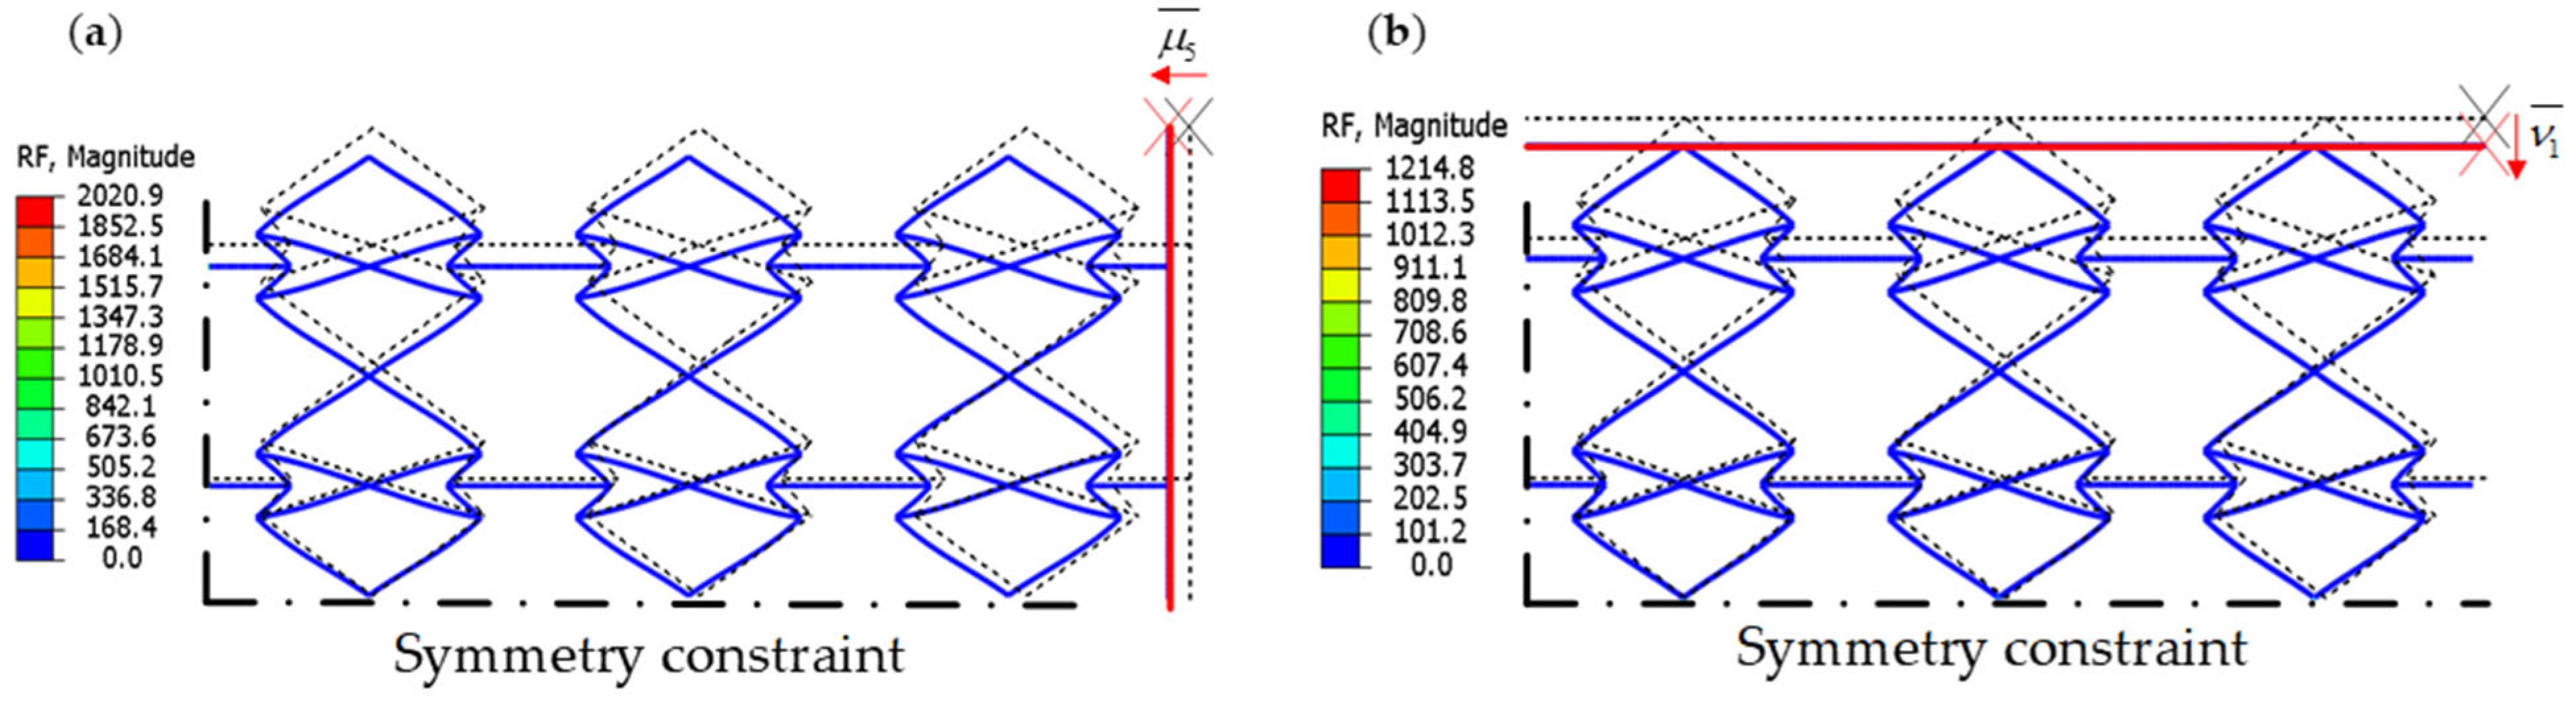
To further verify the correctness of the theoretical model for the 2D metamaterial unit cell structure when an external load is applied, load-deformation simulations are conducted. Figure 6 shows the simulation results for a planar 2 × 3 periodic array structure. Symmetric boundary conditions are applied in the Load module, as indicated by the black dashed lines. In the Interaction module, surface-to-surface contact is established between the rigid line and the array structure, and the displacement of the rigid line is set to 10 mm. The array structure is then compressed using vertical and horizontal rigid lines (represented by the red lines in Figure 6). From the legend on the left side of the simulation results, the reaction forces Q1 (Figure 6a) and R1 (Figure 6b) on the rigid lines can be obtained. The obtained reaction forces Q1 and R1 are substituted into Equations (4) and (5) to calculate the elastic modulus along the X and Y axes, respectively. The theoretical and simulation results for the elastic modulus are listed in Table 6, showing good agreement.
E x = Q 1 / A y μ 5 ¯ / L x
E y = R 1 / A x ν 1 ¯ / L y

2.3.5. Stress Concentration Simulation

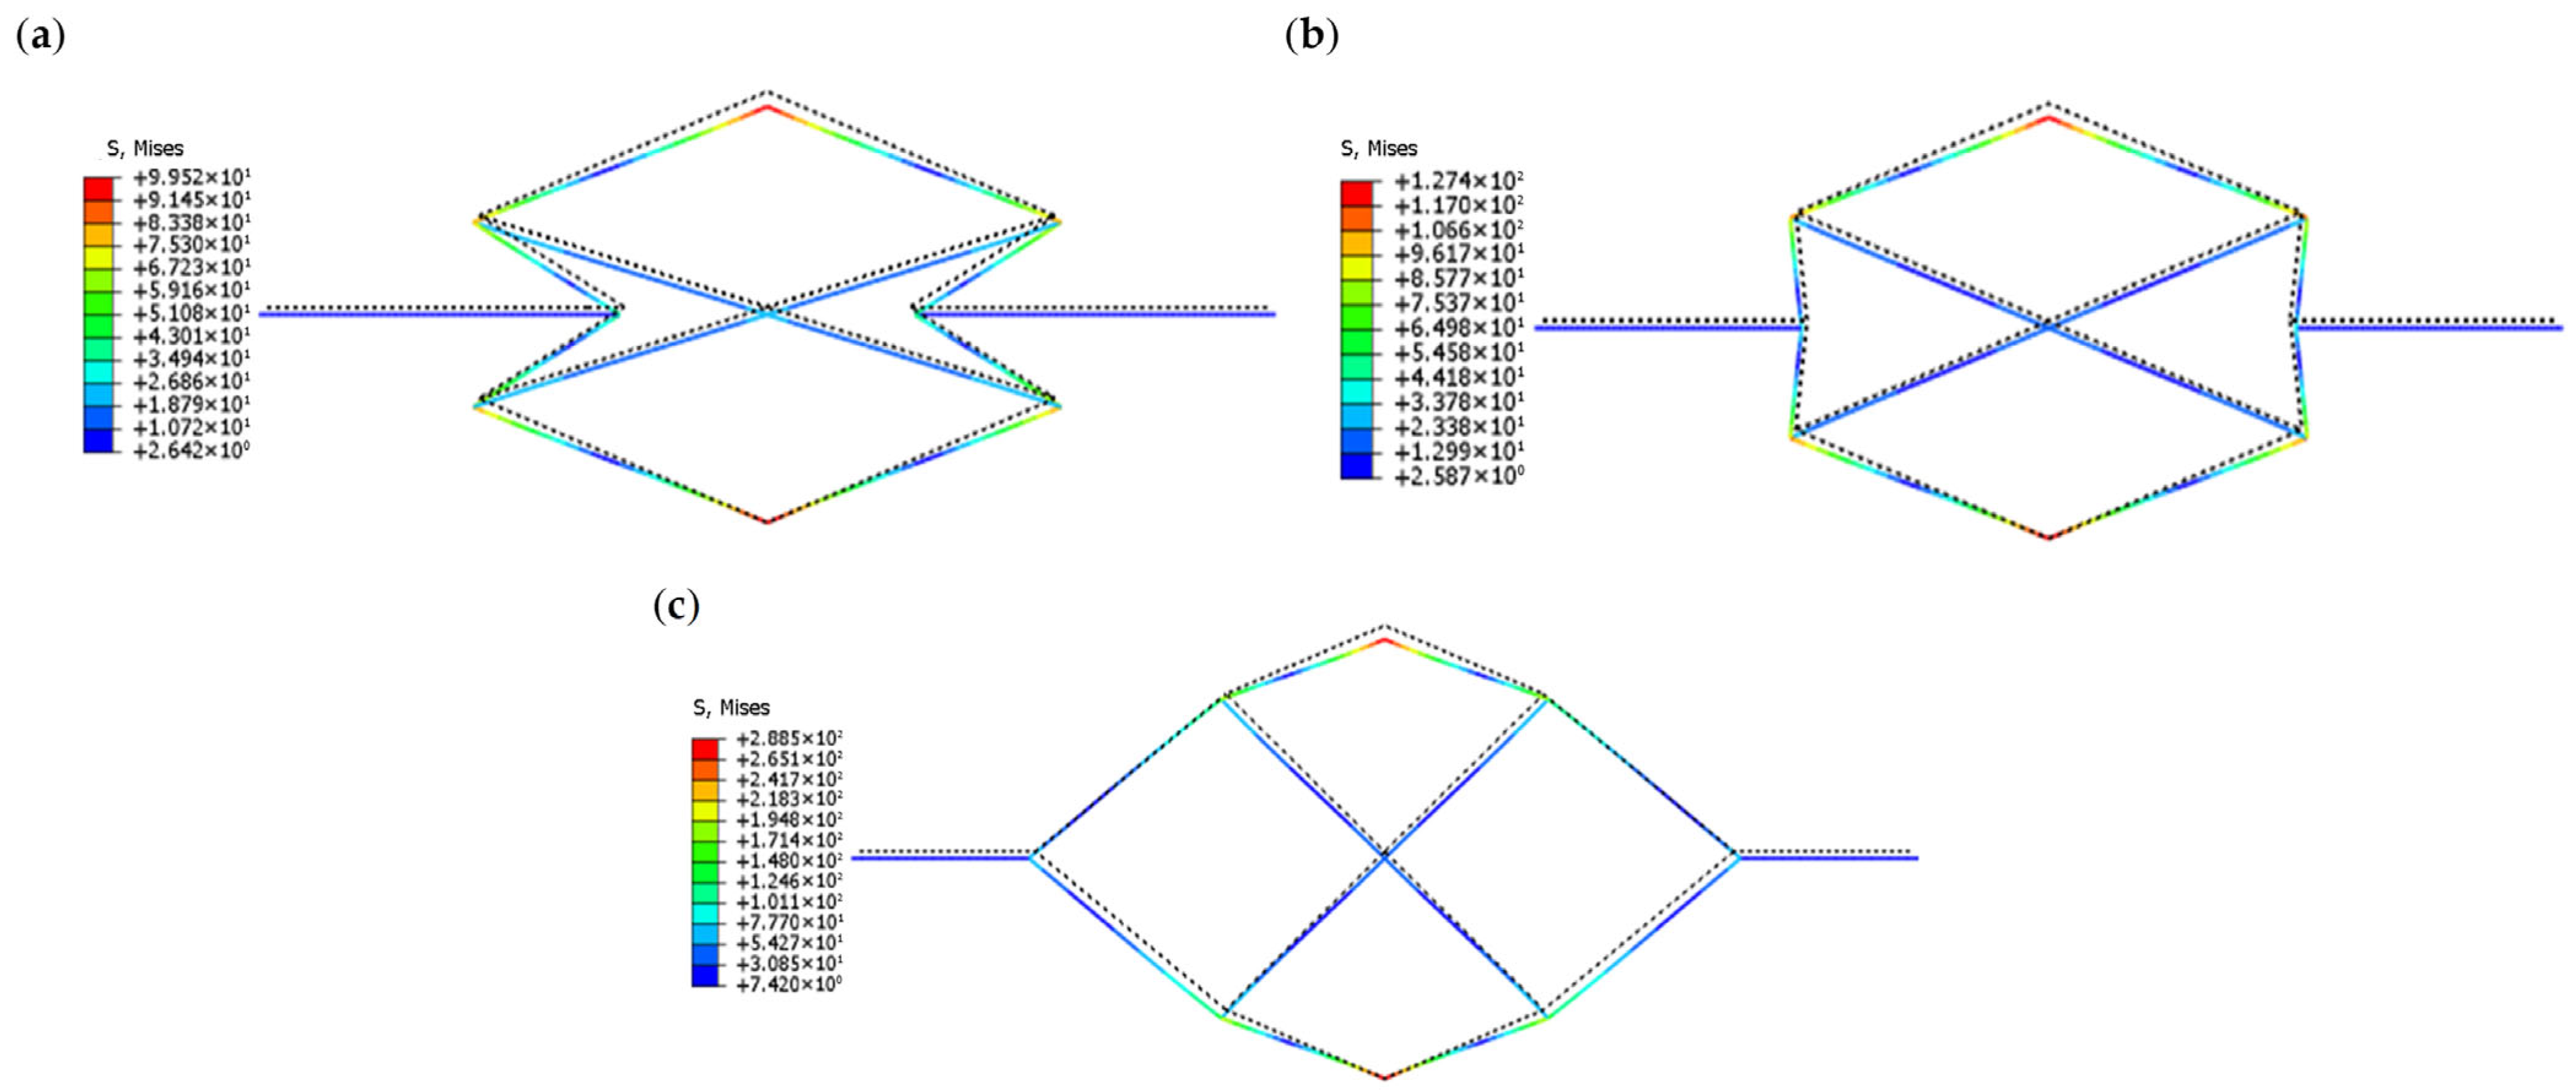
For mechanical metamaterials with porous structures, stress concentration is often unavoidable and frequently occurs at the junctions between different beams. Therefore, a finite element simulation of the Mises stress is performed for the proposed 2D metamaterial unit cell structure to evaluate this phenomenon. In the Load module, boundary conditions consistent with those used in the thermal expansion simulation are applied. To make the Mises stress more evident, a 0.5 mm displacement is applied to the left endpoint towards the left, and a 0.5 mm displacement is applied to the right endpoint towards the right. Additionally, a temperature change from 20 °C to 200 °C is simulated. The Mises stress results for NPR, positive PR, and quasi-zero PR are shown in Figure 7. The maximum stress is observed to occur at the connection regions of the structure, and in some cases, the maximum stress may exceed the yield strength of the constituent materials (Al alloy: 231 MPa; LCS: 235 MPa). Therefore, in practical applications, stress mitigation strategies such as introducing fillets and applying surface strengthening treatments should be adopted to reduce stress concentration and prevent structural failure.

2.4. Experimental Verification

2.4.1. Experimental Verification of CTE

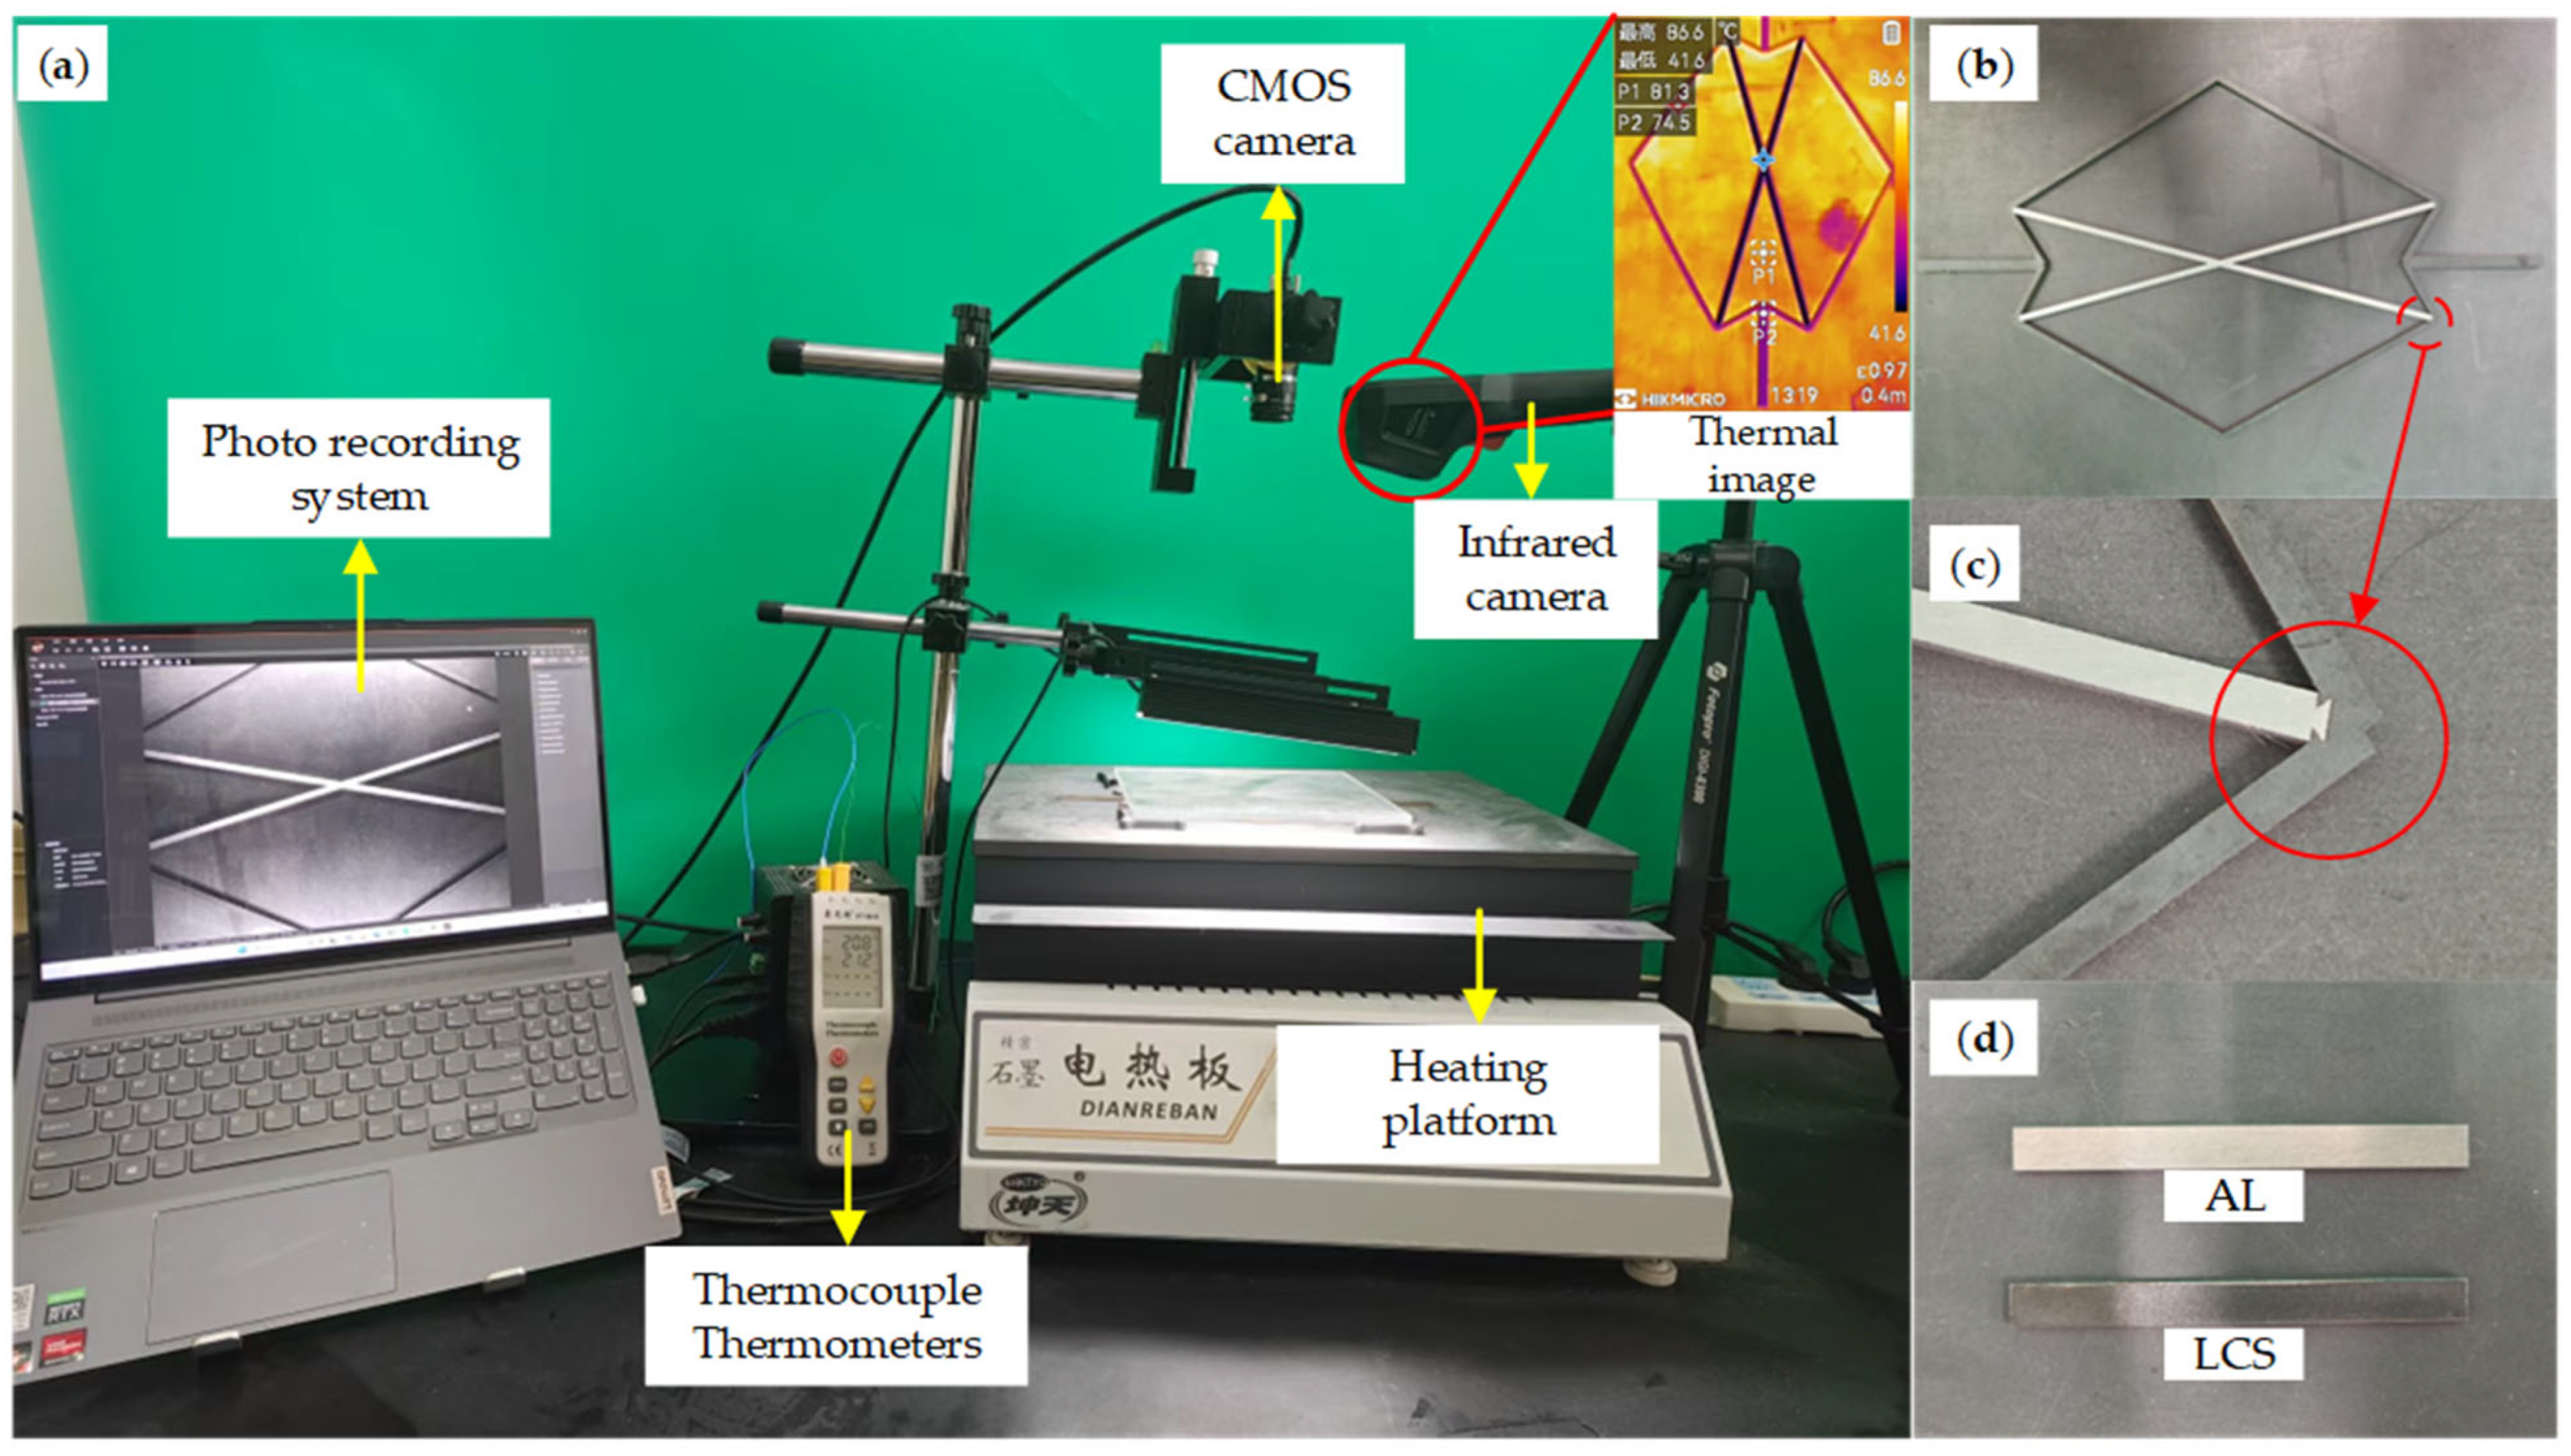
The CTE experimental study aims to explore the thermal expansion characteristics of the unit cell structure. The experimental setup is shown in Figure 8. It mainly consists of a temperature-controlled heating platform with an emissivity of 0.97, which uniformly heats the sample and monitors temperature changes. The sample is placed on the heating platform and covered with a 6 mm thick quartz plate to reduce thermal convection between the heating platform and the camera. The quartz plate is supported by four black spacers, each 4 mm thick, ensuring no direct contact between the plate and the sample. The image acquisition uses a CMOS camera (Hikvision, Hangzhou, China, 2448 × 2048 pixels) equipped with a 16 mm fixed lens, two LED lights, and a computer. The camera and LED lights are mounted on a vertical bracket, and real-time image capture is achieved through a USB 3.0 interface. The temperature at the contact points of the sample is measured using a thermocouple thermometer (HT9815). Additionally, an infrared thermal camera (HKMICRO, H21pro, Beijing, China) is used to measure the surface temperature distribution of the sample. In the thermal image, the highest temperature is shown to be 86.6 °C and the lowest temperature is 41.6 °C. The thermal displacement before and after heating the sample is analyzed using Ncorr program. Ncorr is an open-source Digital Image Correlation (DIC) tool based on MATLAB (2021a) code, which is used for precise analysis of thermal deformation and thermal expansion characteristics.
The manufactured experimental sample is composed of an aluminum alloy and low-carbon steel combination, which theoretically exhibits negative thermal expansion characteristics. The geometric parameters of the sample are as follows: θ1 = 30°, θ2 = 60°, θ3 = 15°, D = 300 mm, and the cross-sectional dimensions are 3 mm × 3 mm. The sample consists of two parts: the outer main structure and the central component. The outer main structure is fabricated from a low CTE material (LCS), while the central component is made of a high CTE material (Al alloy). The experimental specimen is manufactured using a DK7735 wire electrical discharge machining (EDM) system, and the two components are assembled via dovetail grooves. During the experiments, CTEs of Al alloy and LCS calibration specimens (80 mm × 8 mm × 3 mm) are measured to determine the CTE of the constituent materials. After the metamaterial specimen is heated to the target temperature, images are captured and processed using the Ncorr software to evaluate the effective CTE of the structure. To validate the accuracy of the experimental system, a 6061 aluminum plate with dimensions of 80 mm × 80 mm × 3 mm and CTE of 23.6 ppm/°C in the temperature range of 20–100 °C is also tested. The measured CTE is 23.52 ppm/°C, corresponding to a deviation of 0.34% from the nominal value, which demonstrates the reliability of the experimental setup. Similarly, the measured linear CTEs of the Al alloy and LCS specimens are 33.8 ppm/°C and 20.1 ppm/°C, respectively. These experimentally obtained CTE values are subsequently adopted in the theoretical analysis and finite element simulations.
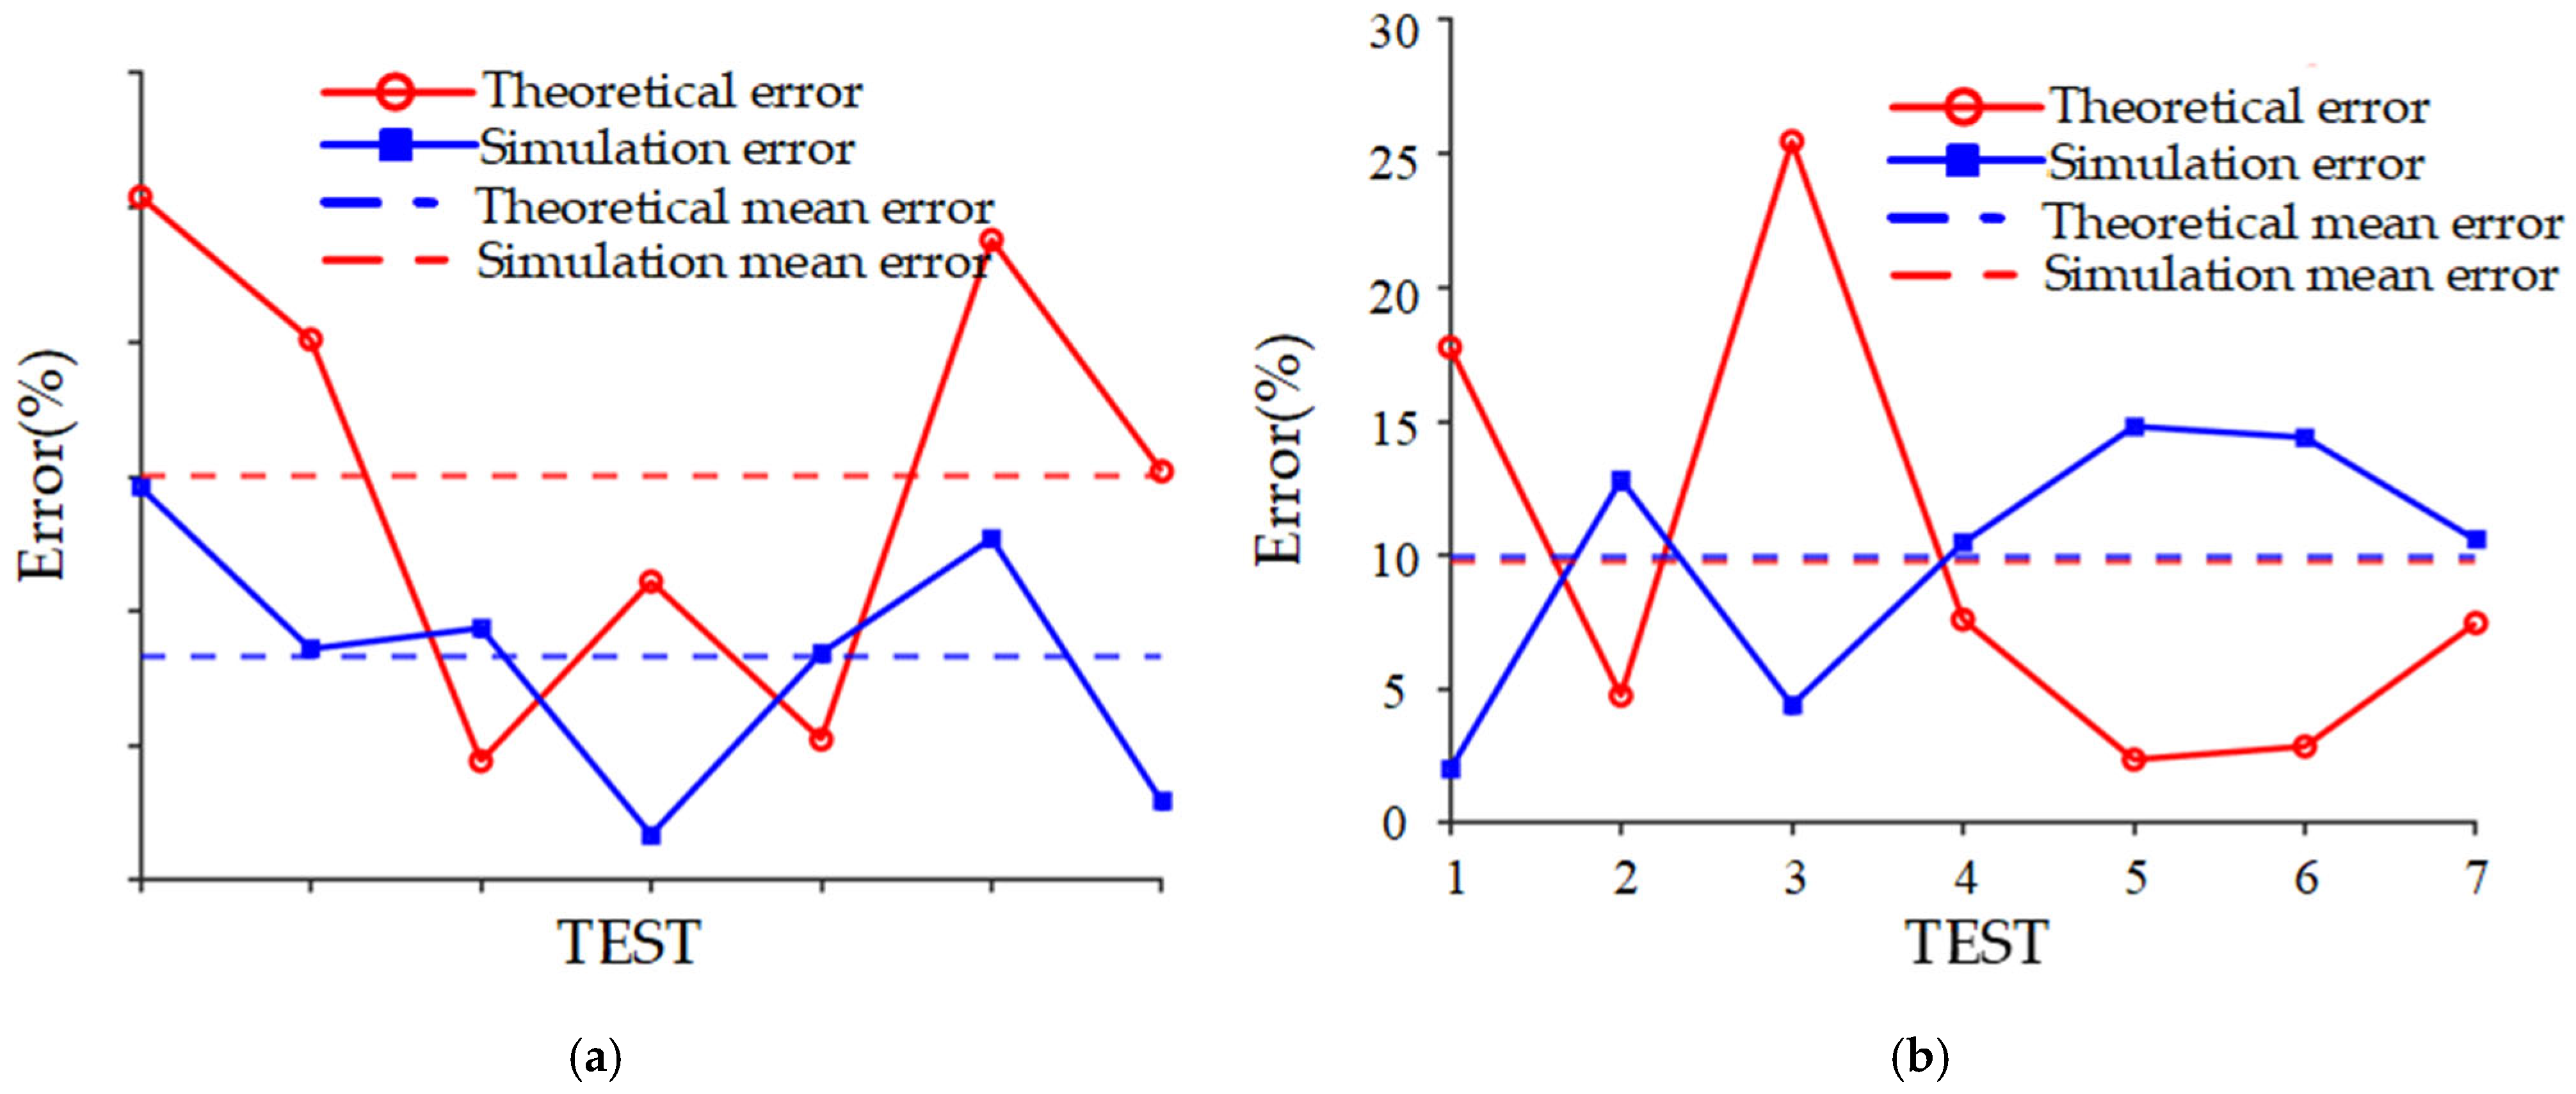
In the experiments, seven independent tests are conducted, and the average value is taken as the final experimental result. The experimental results are summarized in Table 7. And the relative errors between the theoretical results and the simulation results of CTE are shown in Figure 9a. The experimental CTE of the unit cell structure is −6.33 ± 0.56 ppm/°C (mean ± standard deviation, n = 7). For comparison, the corresponding theoretical and simulation results are −7.45 ppm/°C and −6.51 ppm/°C, respectively. The maximum deviation of the experimental results from the theoretical prediction is 25.4%, while the maximum deviation from the simulation result is 14.6%. The relative errors between the average experimental result and the theoretical and simulation results are 15% and 2.76%, respectively. Considering possible gaps between the central and peripheral components, manufacturing tolerances, and uncertainties in temperature measurement, these discrepancies are within an acceptable range. Overall, the experimental results show good agreement with both the theoretical and numerical predictions, confirming the validity of the theoretical model and demonstrating that the proposed unit cell structure exhibits negative thermal expansion behavior.

2.4.2. Experimental Verification of PR

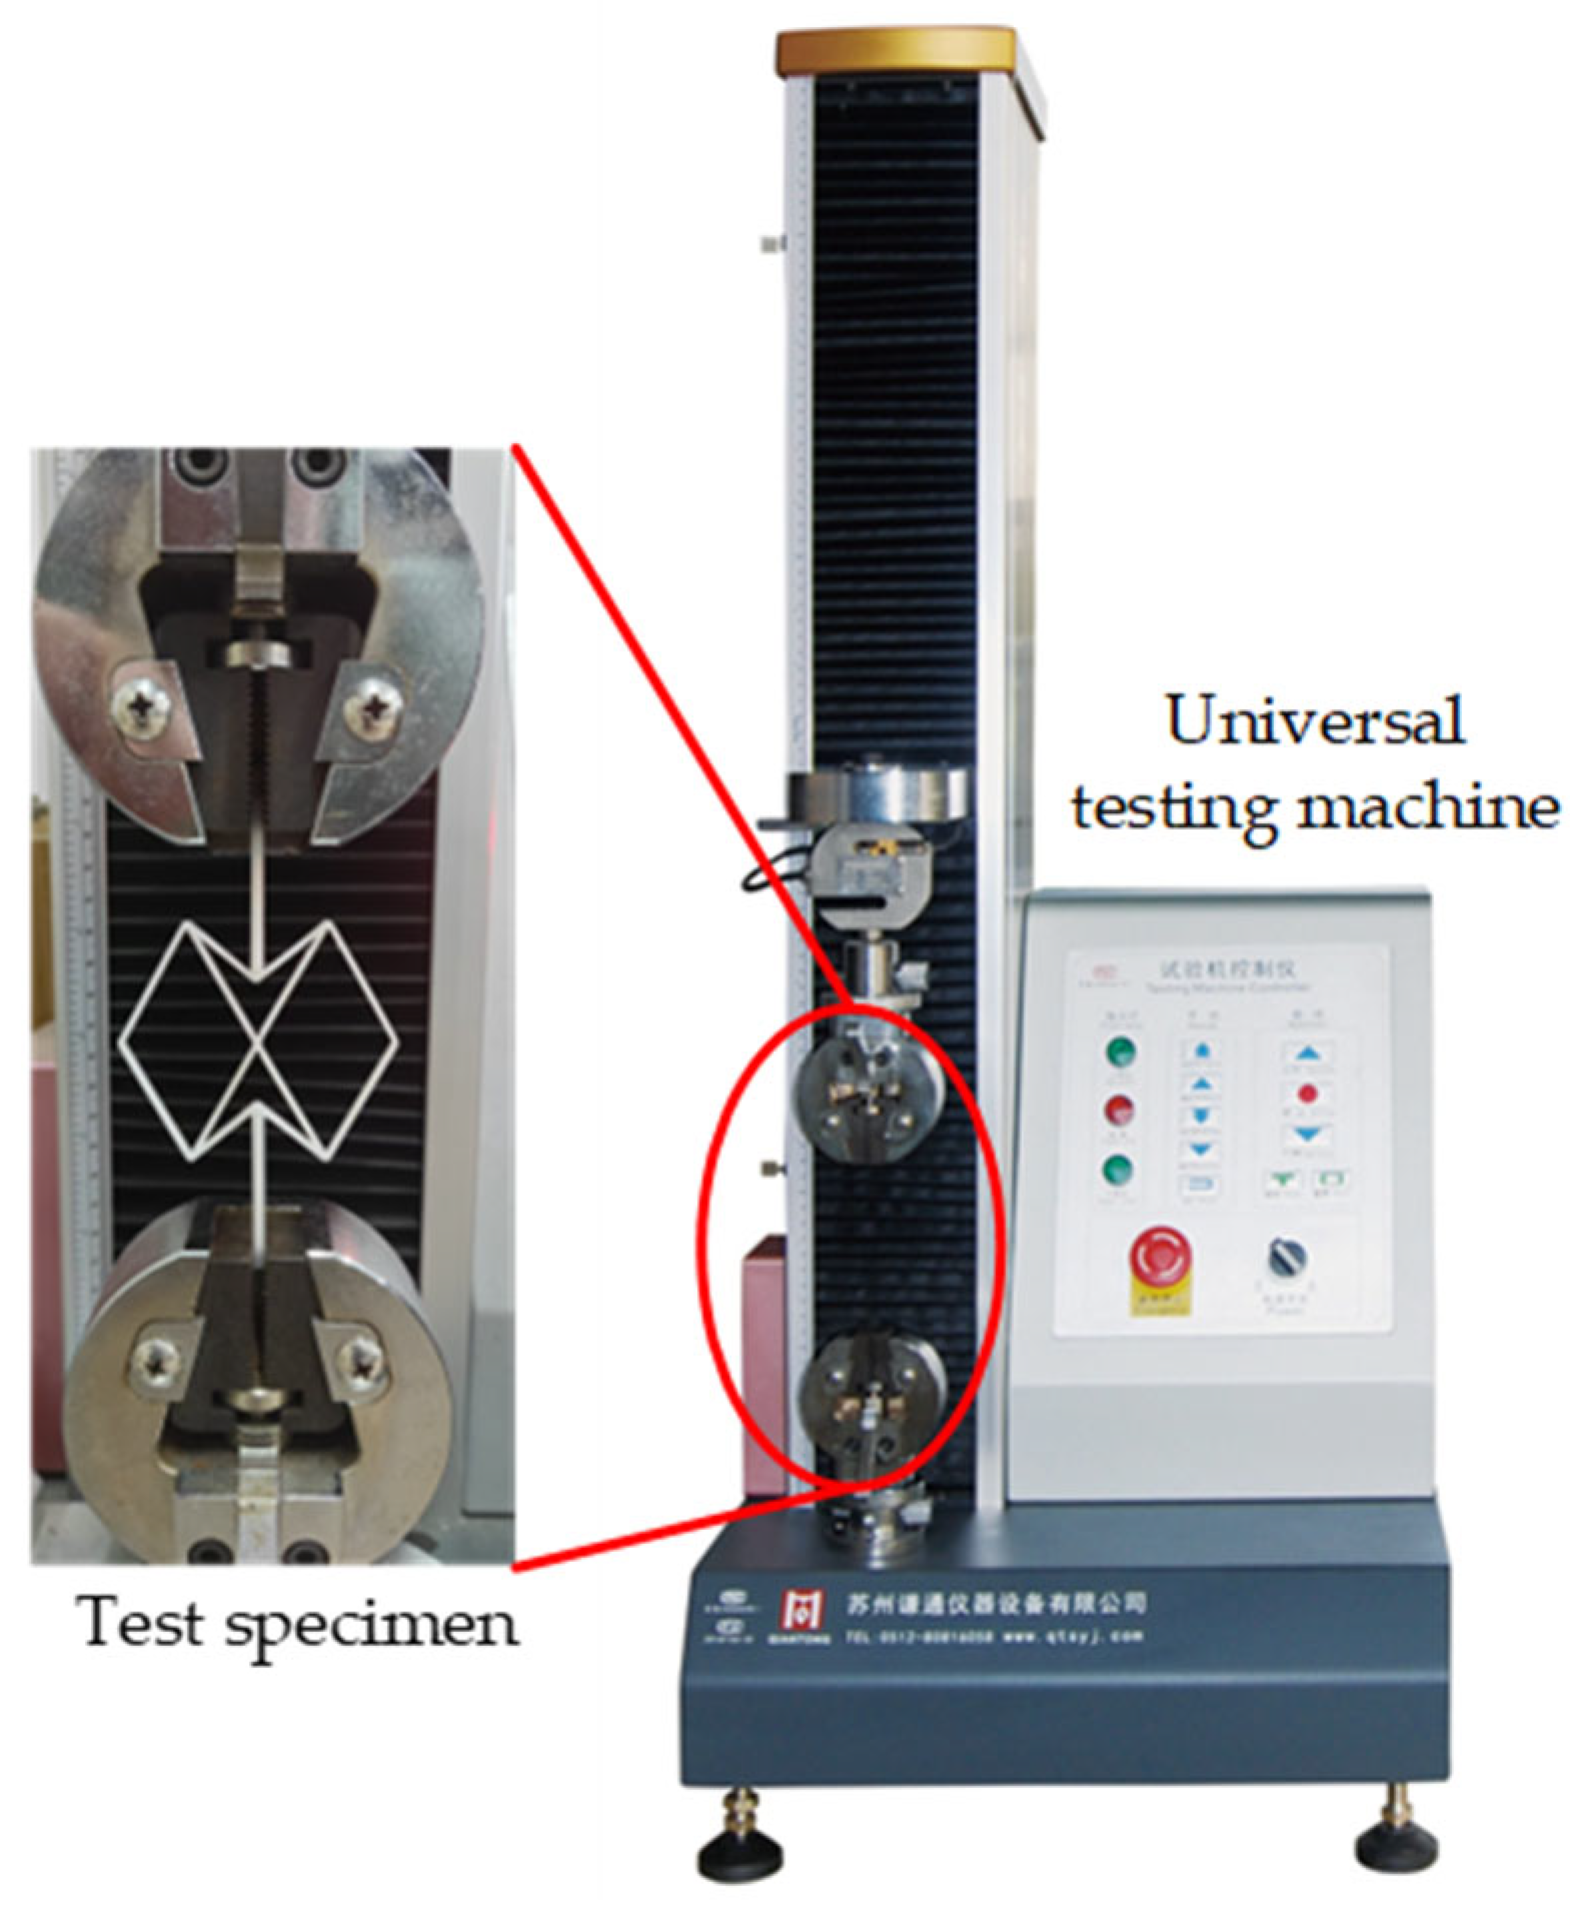
The PR experimental study aims to explore the PR characteristics of the unit cell structure. Since the effect of material on PR is minimal, the PR experimental samples are manufactured using 3D printing technology to evaluate their in-plane tensile behavior. The PR experimental sample parameters are as follows: θ1 = 30°, θ2 = 50°, θ3 = 30°, D = 100 mm and the cross-sectional dimensions are 1.2 mm × 3 mm. The experimental setup is shown in Figure 10. The tensile test is conducted using a universal materials testing machine (Suzhou Qiantong Instruments, Suzhou, China, QT-6203A), with the longitudinal deformation of the structure controlled directly by the testing machine, and the lateral deformation measured and recorded using a vernier caliper (SYNTEK, Shanghai, China, JS20-GTG).
In the experiments, seven independent tests are conducted, and the average value is taken as the final experimental result. The experimental results are summarized in Table 8. And the relative errors between the theoretical results and the simulation results of CTE are shown in Figure 9b. The experimental PR of the unit cell structure is −5.100 ± 0.385 (mean ± standard deviation, n = 7). For comparison, the corresponding theoretical and simulation results are −4.647 and −5.584, respectively. The maximum deviation between the experimental and theoretical results is 14.81%, while the maximum deviation between the experimental and simulation results is 25.46%. The relative errors between the average experimental result and the theoretical and simulation results are 8.67% and 9.75%, respectively. Considering manufacturing tolerances and possible uncertainties in deformation measurement, these discrepancies are within an acceptable range. Overall, the experimental and numerical results validate the theoretical analysis and demonstrate that the proposed unit cell structure exhibits a negative PR.

2.4.3. Uncertainty Analysis and Error Mitigation

A brief uncertainty analysis is conducted to evaluate the reliability of the experimental results for both CTE and PR measurements. The primary sources of uncertainty include temperature measurement, displacement/strain measurement, and manufacturing tolerances. In the CTE experiments, the thermocouple (HT9815) introduces temperature measurement uncertainty, while the infrared thermal camera may also contribute to deviations due to emissivity assumptions and surface reflections. The displacement measurement based on DIC using Ncorr is affected by image resolution (2448 × 2048 pixels), speckle quality, and noise, which may influence the accuracy of strain calculation. In addition, small assembly gaps between the aluminum alloy and LCS components, as well as machining tolerances from wire EDM, can lead to geometric deviations and affect the measured effective CTE.
For the PR experiments, uncertainties mainly arise from deformation measurement using a vernier caliper, which has limited resolution compared to full-field optical methods such as DIC, and from fabrication inaccuracies associated with 3D printing. These factors contribute to the observed deviations between experimental, theoretical, and simulation results.
To reduce these uncertainties in future work, higher-precision temperature sensors and improved thermal calibration methods can be employed. The use of higher-resolution cameras and the adoption of full-field DIC techniques for PR experiments would significantly improve displacement measurement accuracy. Moreover, adopting precision manufacturing methods with tighter tolerances and improving assembly techniques to eliminate interfacial gaps would further improve the consistency between experimental and theoretical results.

3. Results and Discussion

3.1. Relative CTE Analysis

3.1.1. Influence of Geometric Parameters

Based on the theoretical model and simulation results in Section 2, the CTE of the proposed 2D metamaterial unit cell structure can be adjusted by changing the geometric parameters. Therefore, the material combinations listed in Table 2 are selected to study the relationship between α/αH and the geometric parameters.
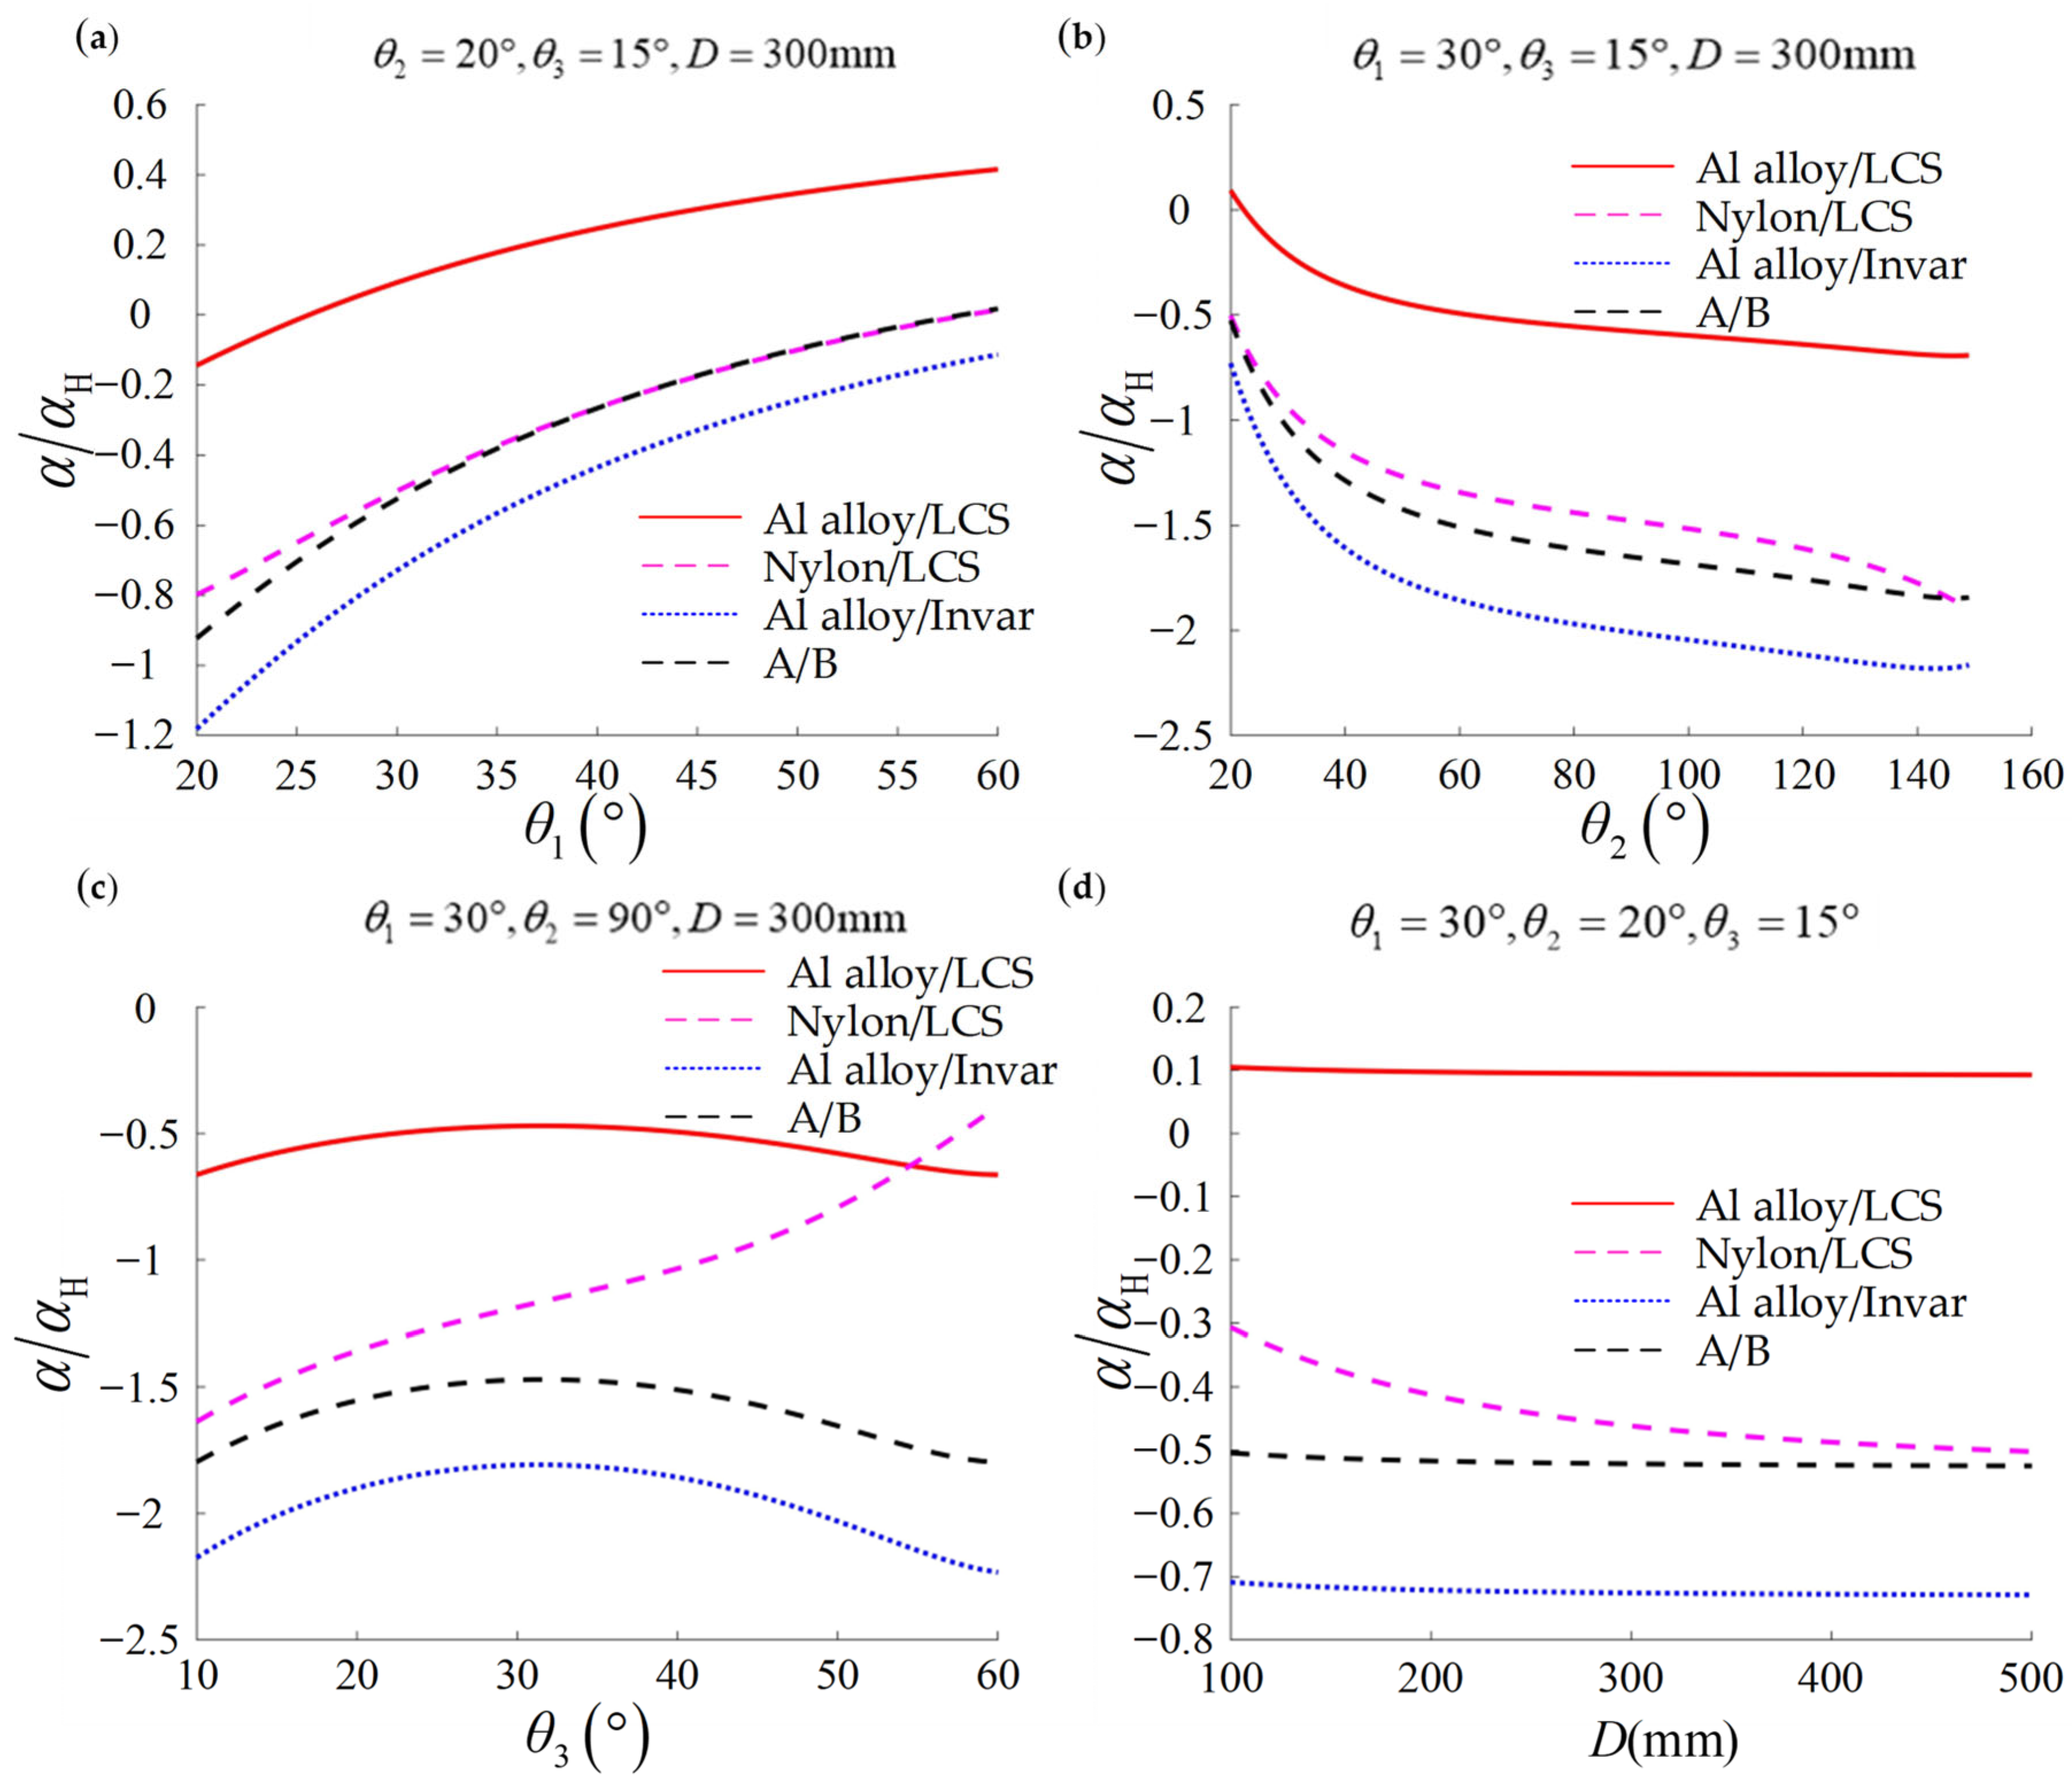
When θ2 = 20°, θ3 = 15° and D = 300 mm, the relationship between α/αH and θ1 for different material combinations is shown in Figure 11a. It can be observed that α/αH for all three combinations starts with negative values. The α/αH for all three combinations monotonically increases as θ1 increases. The α/αH of the Al alloy/LCS combination changes from negative to positive, while α/αH for the other two combinations remains negative. It is hypothesized that the special behavior of the Al alloy/LCS combination curve is related to its small CTE ratio (αH/αL). To verify this hypothesis, a hypothetical material combination A/B listed in Table 2 is used. The elastic modulus ratio of this combination is defined as the same as that of the Al alloy/LCS combination, while the CTE ratio and density ratio are the same as those of the Nylon/LCS combination. The α/αH for the A/B combination is shown by the black dashed line, and its trend is similar to that of the pink dashed line and blue dashed line, confirming the hypothesis.
When θ1 = 30°, θ3 = 15° and D = 300 mm, the relationship between α/αH and θ2 is shown in Figure 11b. It can be observed that the curves for all three material combinations decrease monotonically in the initial part, with the exception that the α/αH curve for the Nylon/LCS combination shows a significant decrease towards the end, while the α/αH curves for the other two combinations show a slight increase in the latter part. It is hypothesized that the special behavior of the Nylon/LCS combination curve is due to its small elastic modulus ratio (EH/EL). The α/αH for the A/B combination is shown by the black dashed line, and its trend is similar to that of the red solid line and blue dashed line, confirming the hypothesis.
When θ1 = 30°, θ2 = 90° and D = 300 mm, the relationship between α/αH and θ3 is shown in Figure 11c. As θ3 increases, α/αH for the Nylon/LCS combination increases monotonically, while CTEs for the other two combinations increase initially and then decrease. The reason is again that EH/EL for the Nylon/LCS combination is too small.
When θ1 = 30°, θ2 = 20° and θ3 = 15°, the relationship between α/αH and D is shown in Figure 11d. It can be observed that as increases, α/αH for all three combinations decreases monotonically. Since the small EH/EL for the Nylon/LCS combination, its α/αH shows the largest decrease.

3.1.2. Influence of Material Physical Properties

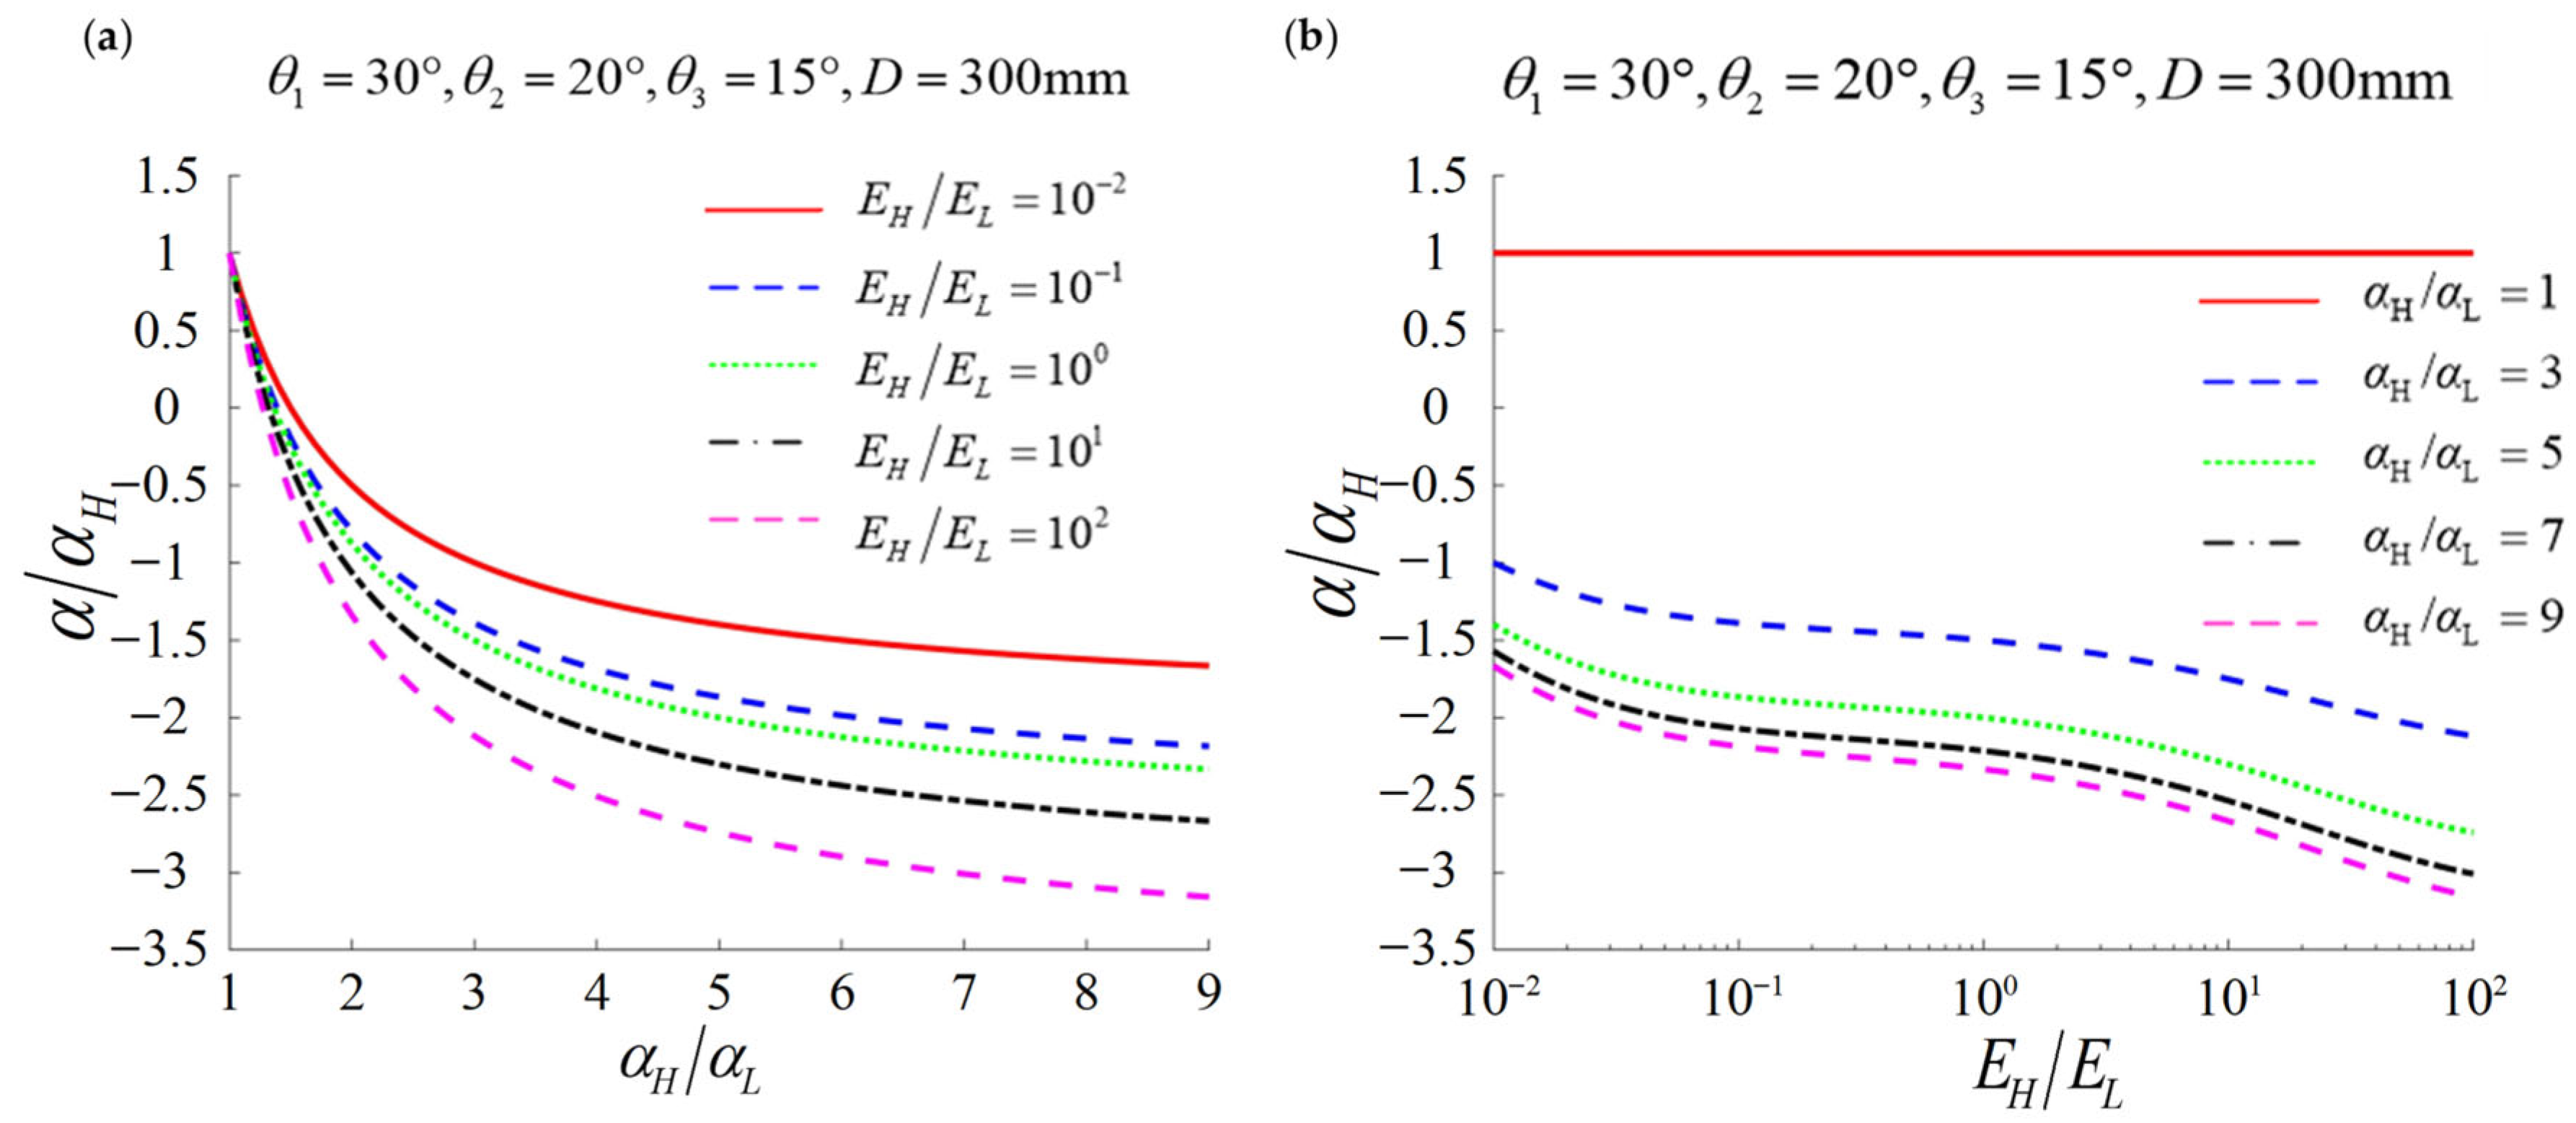
Based on the results shown in Figure 11, it can be observed that the physical properties of the constituent materials also have an impact on α/αH. The geometric parameters are fixed at θ1 = 30°, θ2 = 20°, θ3 = 15°, D = 300 mm. This allows the influence of the physical properties of the constituent materials on α/αH to be investigated without the interference of geometric variations. The relationship between α/αH, αH/αL and EH/EL is shown in Figure 12a and Figure 12b, respectively. It can be observed that α/αH monotonically decreases as the value of αH/αL increases. Excluding the line for αH/αL = 1, the other four curves in Figure 12b decrease monotonically. When αH/αL = 1, it indicates that the two constituent materials have the same CTE. In this case, during the heating process, the structural components expand proportionally without bending deformation, effectively resulting in an isometric scaling that keeps α/αH unchanged. When the geometric parameters are fixed, a smaller α/αH can be achieved by selecting the largest possible values for αH/αL and EH/EL. Therefore, from the material combinations listed in Table 2, the Al alloy/Invar combination can be selected to achieve a smaller α/αH. Figure 13 shows the variation of CTE of the structure in the θ2θ3 parameter space under different material combinations.

3.2. PR Analysis

3.2.1. Influence of Geometric Parameters

Similarly, the PR of the proposed 2D metamaterial unit cell structure can be adjusted by changing the geometric parameters. Material combinations listed in Table 2 are selected to study the relationship between PR and the geometric parameters.
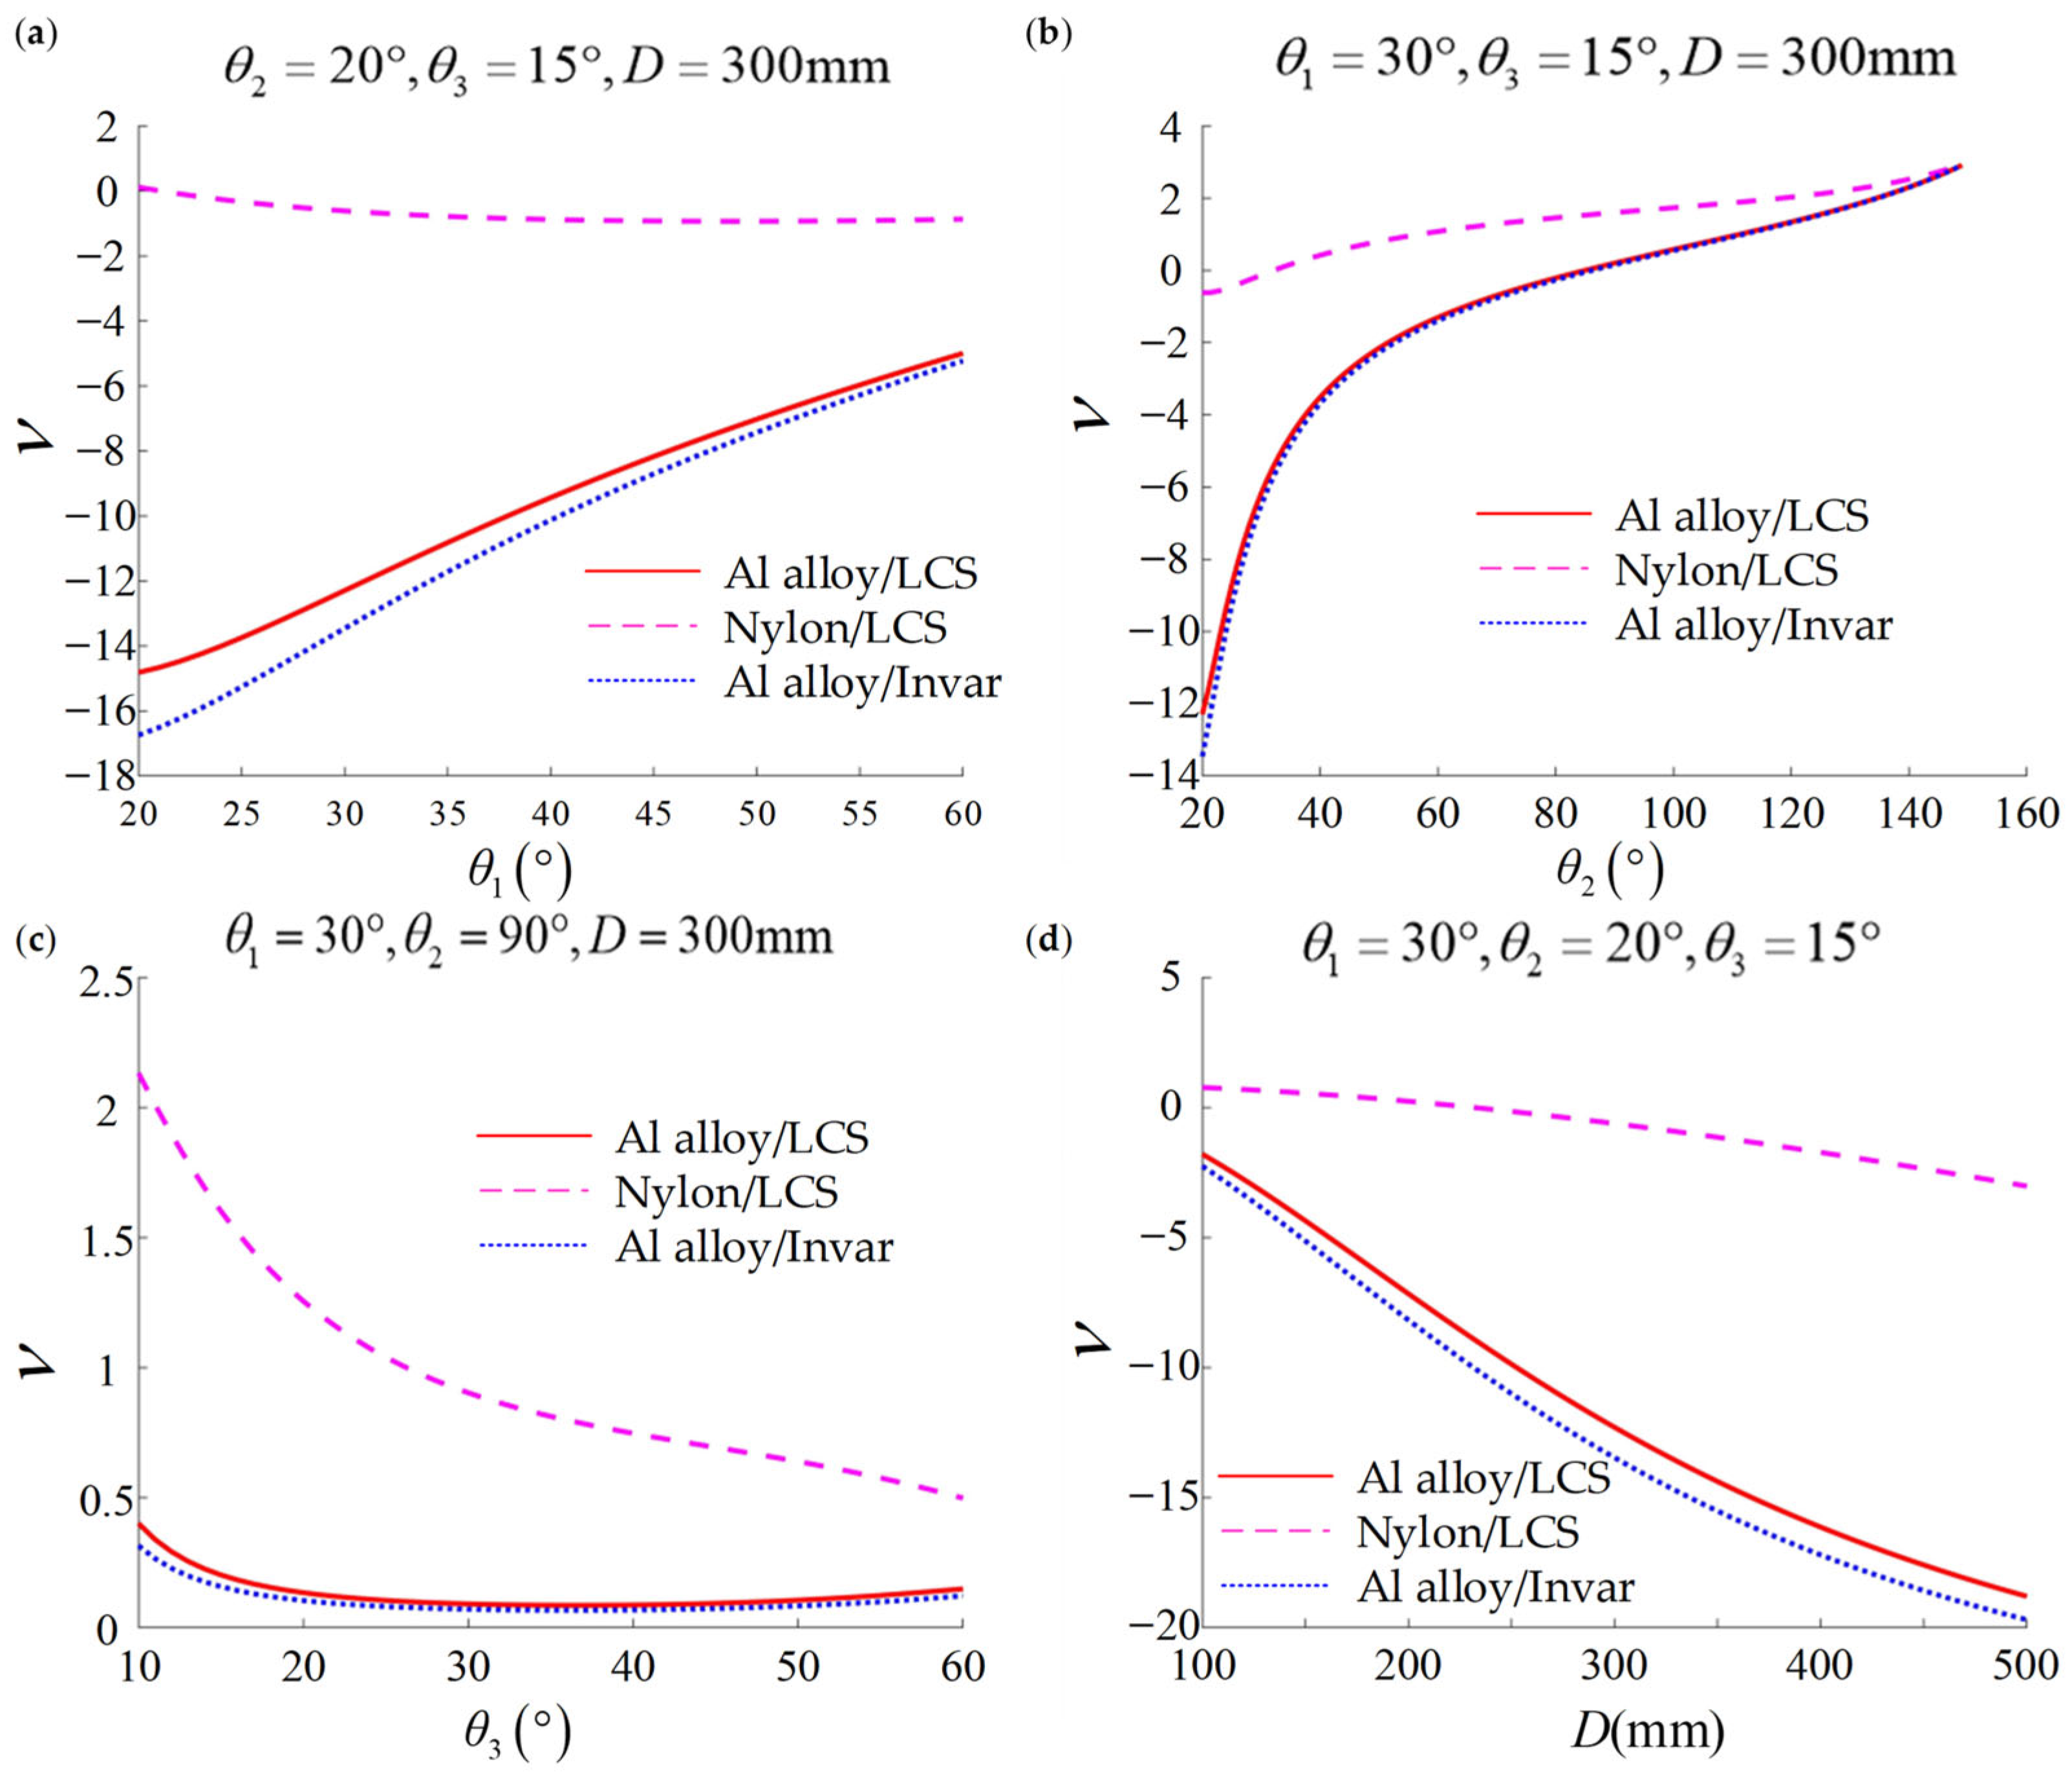
When θ2 = 20°, θ3 = 15° and D = 300 mm, the relationship between PR and θ1 for different material combinations is shown in Figure 14a. It can be observed that PR for the Nylon/LCS combination starts with a positive value, while PR for the Al alloy/LCS and Al alloy/Invar combinations start with negative values. Additionally, PR for the Nylon/LCS combination decreases monotonically as θ1 increases, while PR for the other two combinations increases monotonically as θ1 increases.
When θ1 = 30°, θ3 = 15° and D = 300 mm, the relationship between PR and θ2 is shown in Figure 14b. It can be observed that the curves for all three material combinations increase monotonically. The difference is that the PR curve for the Nylon/LCS combination has a higher initial value and a slower rate of increase, while the PR curves for the other two combinations start lower and increase more rapidly.
When θ1 = 30°, θ2 = 90° and D = 300 mm, the relationship between PR and θ3 is shown in Figure 14c. As θ3 increases, PR for the Nylon/LCS combination decreases monotonically, while PR for the other two combinations decreases initially and then increases.
When θ1 = 30°, θ2 = 20° and θ3 = 15°, the relationship between PR and D is shown in Figure 14d. It can be observed that as D increases, PR for all three combinations decreases monotonically. Additionally, the rate of decrease in PR for the Nylon/LCS combination is slower, while the rate of decrease for the other two combinations is faster.
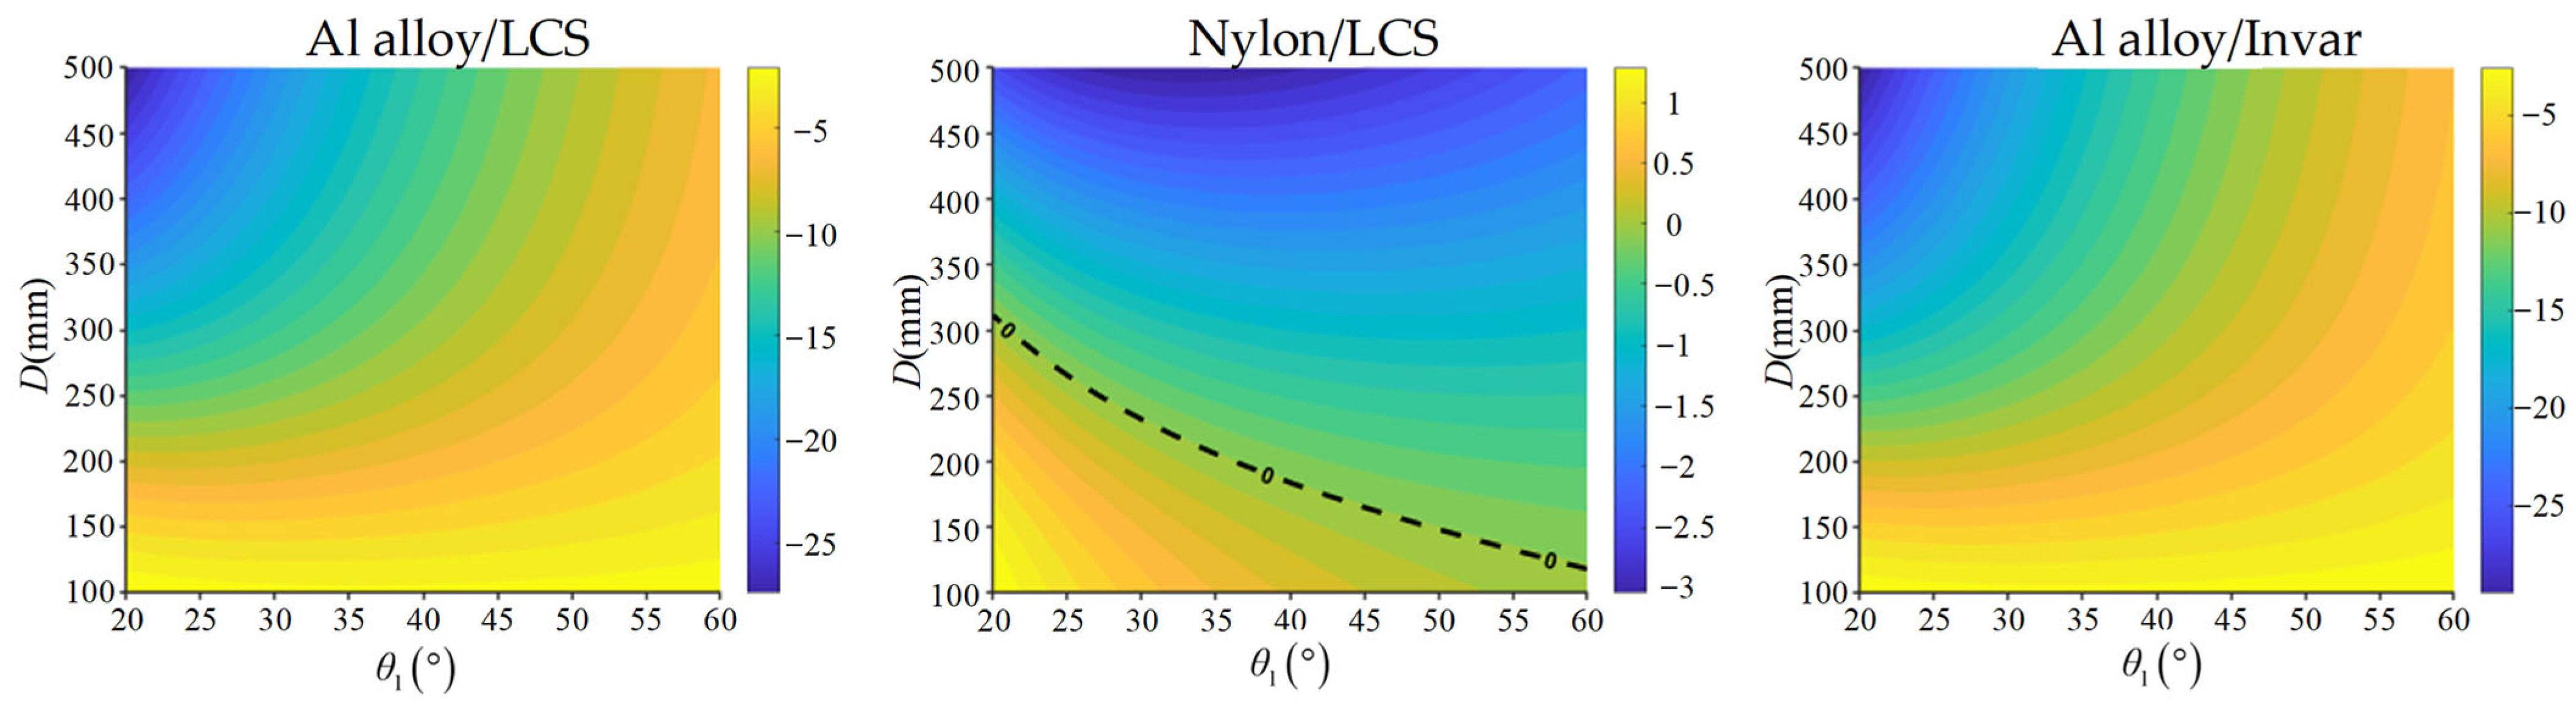
A common feature can be identified across all four cases: the PR curve for the Nylon/LCS combination is higher than that of the Al alloy/LCS combination, and the Al alloy/LCS combination is higher than the Al alloy/Invar combination. This trend is consistent with the elastic modulus ratios for the three combinations: the elastic modulus ratio for the Nylon/LCS combination is smaller than that for the Al alloy/LCS combination, and the elastic modulus ratio for the Al alloy/LCS combination is smaller than that for the Al alloy/Invar combination. A preliminary observation indicates that, with fixed geometric parameters and EH/EL < 1, an increase in EH/EL leads to a reduction in PR. This has been validated in subsequent studies. Figure 15 shows the variation of PR of the structure in the θ1D parameter space under different material combinations.

3.2.2. Influence of Material Physical Properties

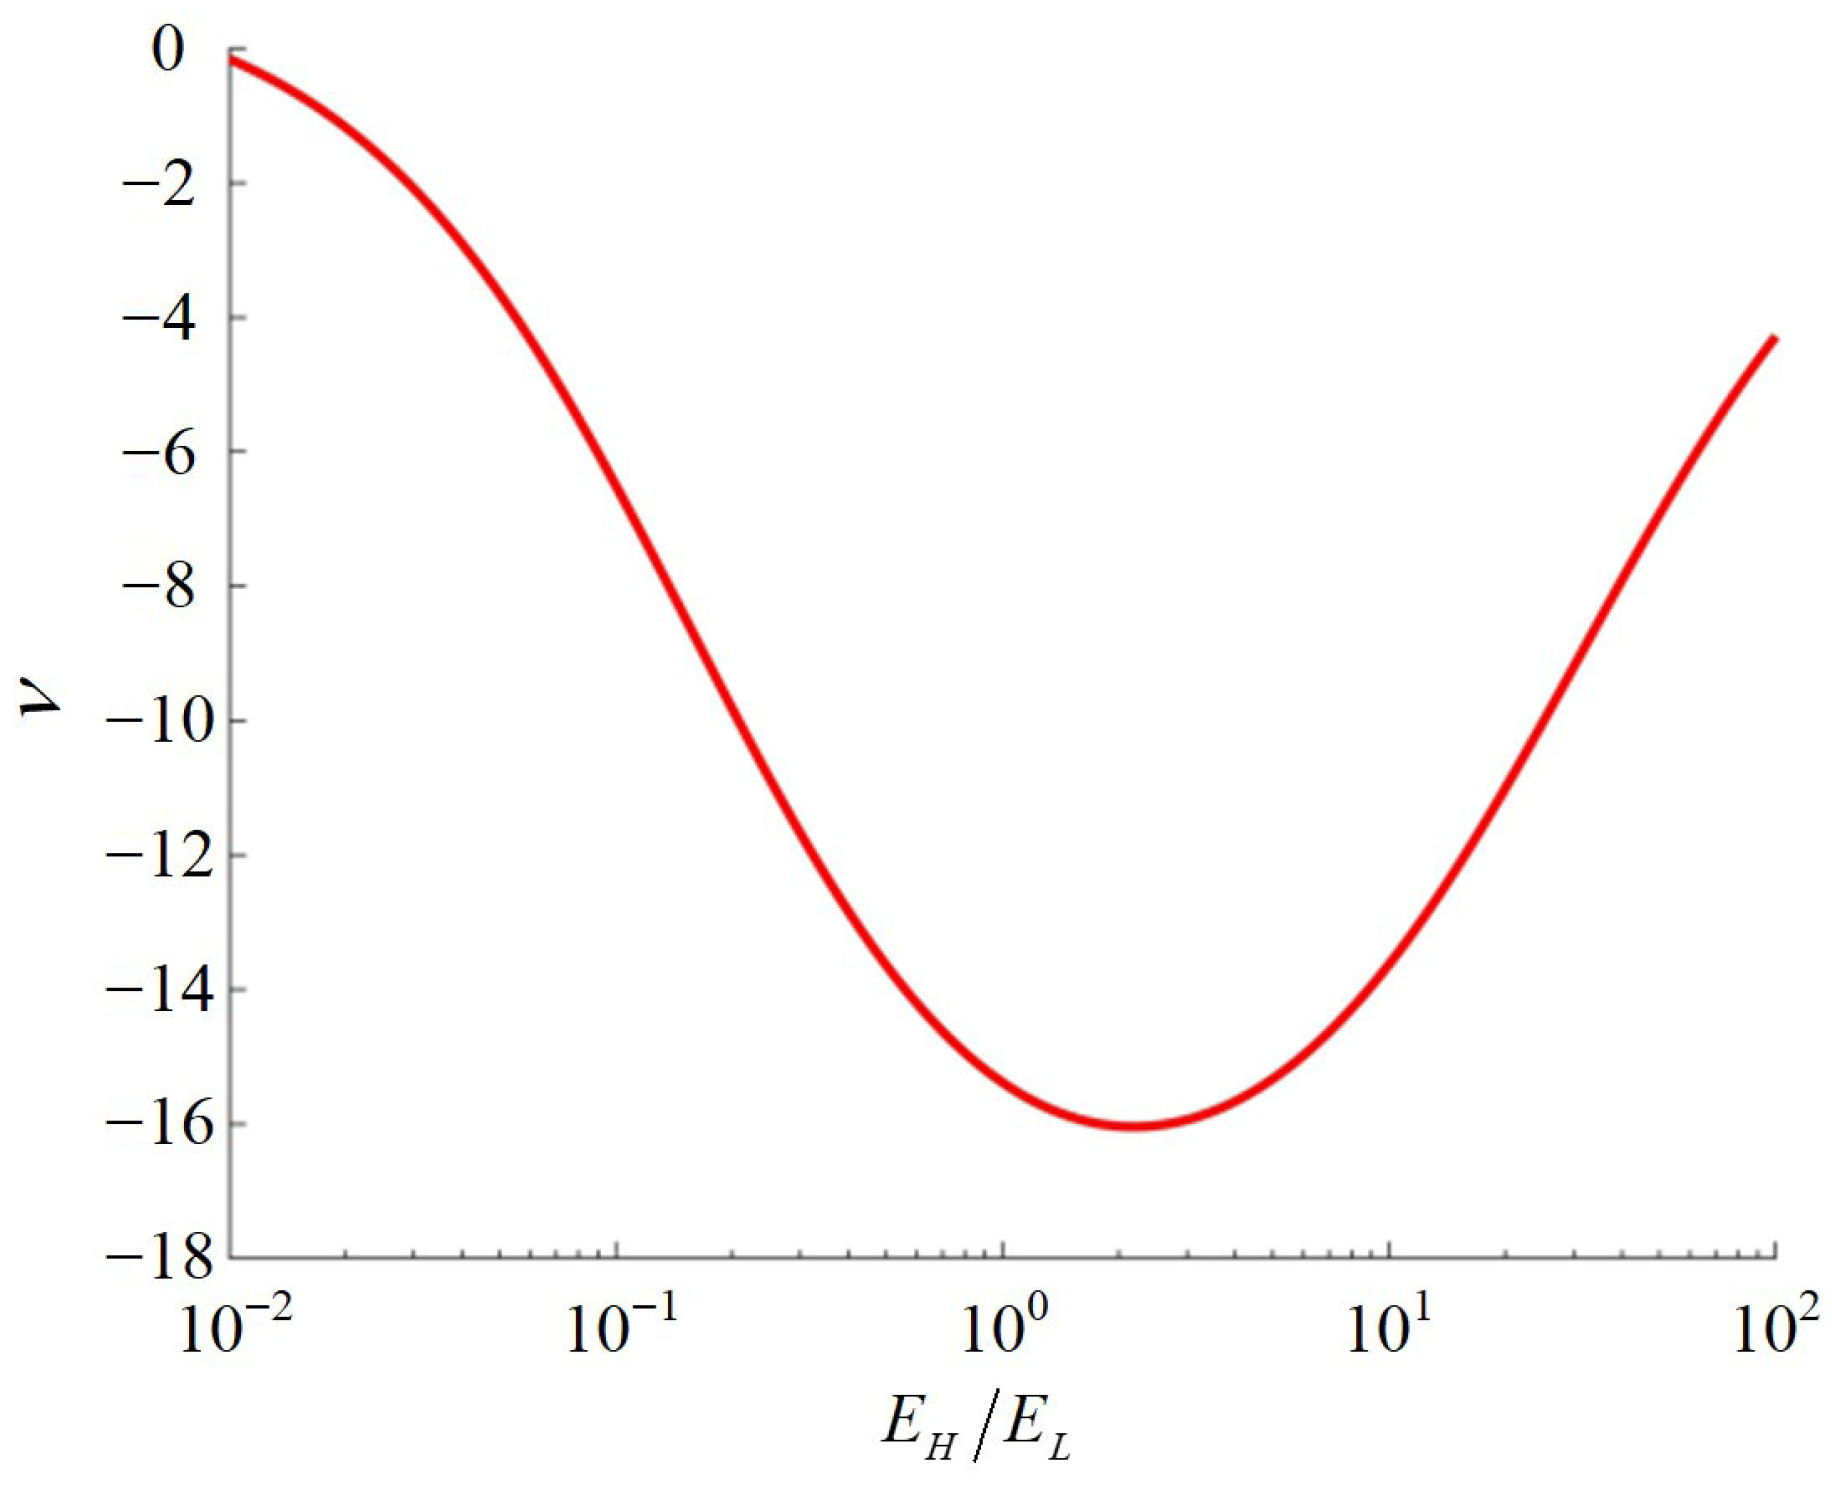
According to the theoretical analysis in Section 2, PR of the structure is independent of CTE. Nevertheless, the physical properties of the constituent materials can affect PR based on the results shown in Figure 14. Therefore, a fixed set of geometric parameters (θ1 = 30°, θ2 = 20°, θ3 = 15°, D = 300 mm) is selected to investigate the relationship between the elastic modulus of the constituent materials and PR. The relationship between PR and EH/EL is shown in Figure 16. It can be observed that PR decreases and then increases as EH/EL increases, with a minimum PR value occurring at EH/EL = 2. When the geometric parameters are fixed, selecting an EH/EL ratio close to 2 can result in a smaller PR. Therefore, from the material combinations in Table 2, the Al alloy/Invar combination can be selected to achieve a smaller PR.

3.3. Coupling Analysis

The coupling effect discussed in this subsection refers to the paired tunability of the thermal expansion and PR within the unit cell structure. Specifically, different combinations of thermal expansion and PR, including positive thermal expansion with NPR, positive thermal expansion with positive PR, negative thermal expansion with NPR, and negative thermal expansion with positive PR, can be simultaneously realized in the same unit cell architecture. Taking the aluminum alloy/low carbon steel material combination as an example, the achievable ranges of CTE and PR of the unit cell structure are investigated, as shown in Figure 17. The results indicate that CTE can be continuously regulated within a range of −47 to 28 ppm/°C, while PR varies from −14.8 to 7.3.

4. Conclusions

Inspired by traditional bimaterial triangular structures and symmetric arrow configurations, a novel bimaterial mechanical metamaterial structure is proposed. Based on beam element theory and thermoelastic formulations, a theoretical model is constructed and validated by simulations. According to theoretical analysis, it is found that the CTE of the structure is related to geometric parameters, the CTE ratio of the constituent materials, and the elastic modulus ratio, while PR is related to geometric parameters and the elastic modulus ratio of the constituent materials.
Experimental investigations on both thermal expansion and PR are conducted to validate the theoretical predictions. Taking the Al alloy/LCS material combination as an example, the adjustable ranges of CTE and PR for the unit cell structure are studied. It is found that the unit cell structure can achieve a tunable CTE ranging from −47 ppm/°C to 28 ppm/°C and a tunable PR ranging from −14.8 to 7.3, enabling the realization of targeted values for both CTE and PR. This study provides a new direction for the design of mechanical metamaterials with integrated and tunable CTE and PR.

Author Contributions

Writing—original draft, software, investigation, methodology, validation, and data curation, Z.W.; formal analysis, visualization, resources, and writing—review and editing, J.L.; supervision, funding acquisition, writing—review and editing, project administration, and conceptualization, W.Y. All authors have read and agreed to the published version of the manuscript.

Funding

The work is supported by the National Natural Science Foundation of China (NSFC) under Grant No. 52375033.

Data Availability Statement

Data will be made available on request.

Conflicts of Interest

The author declares that he has no competing interests.

Appendix A

K 11 = A E L sin 2 θ 1 L 1 + 12 A E L I cos 2 θ 1 L 1 3
K 12 = K 21 = A E L cos θ 1 sin θ 1 L 1 12 A E L I cos θ 1 sin θ 1 L 1 3
K 13 = K 31 = A E L sin 2 θ 1 L 1 12 A E L I cos 2 θ 1 L 1 3
K 14 = K 41 = 6 A E L I cos θ 1 L 1 2
K 22 = A E H cos 2 θ 3 L 2 + A E L cos 2 θ 1 L 1 + A E L cos 2 θ 2 L 3 + 12 A E H I sin 2 θ 3 L 2 3 + 12 A E L I sin 2 θ 1 L 1 3 + 12 A E L I sin 2 θ 2 L 3 3
K 23 = K 32 = A E H cos θ 3 sin θ 3 L 2 A E L cos θ 1 sin θ 1 L 1 + A E L cos θ 2 sin θ 2 L 3 12 A E H I cos θ 3 sin θ 3 L 2 3 + 12 A E L I cos θ 1 sin θ 1 L 1 3 12 A E L I cos θ 2 sin θ 2 L 3 3
K 24 = K 42 = 6 A E H I sin θ 3 L 2 2 6 A E L I sin θ 1 L 1 2 + 6 A E L I sin θ 2 L 3 2
K 25 = K 52 = A E L cos 2 θ 2 L 3 12 A E L I sin 2 θ 2 L 3 3
K 33 = A E H sin 2 θ 3 L 2 + A E L sin 2 θ 1 L 1 + A E L sin 2 θ 2 L 3 + 12 A E H I cos 2 θ 3 L 2 3 + 12 A E L I cos 2 θ 1 L 1 3 + 12 A E L I cos 2 θ 2 L 3 3
K 34 = K 43 = 6 A E H I cos θ 3 L 2 2 6 A E L I cos θ 1 L 1 2 6 A E L I cos θ 2 L 3 2
K 35 = K 53 = 12 A E L cos θ 2 sin θ 2 L 3 3 A E L I cos θ 2 sin θ 2 L 3
K 44 = 4 A E H I L 2 + 4 A E L I L 1 + 4 A E L I L 3
K 45 = K 54 = 6 A E L I sin θ 2 L 3 2
K 55 = A E L L 4 + A E L I cos 2 θ 2 L 3 + 12 A E L I sin 2 θ 2 L 3 3
K 56 = K 65 = K 66 = A E L L 4
K 15 = K 16 = K 26 = K 36 = K 46 = K 51 = K 61 = K 62 = K 63 = K 64 = T 4 = 0
T 1 = A E L α L Δ T sin θ 1
T 2 = A E H α H Δ T c o s θ 3 + A E L α L Δ T c o s θ 1 + A E L α L Δ T c o s θ 2
T 3 = A E H α H Δ T s i n θ 3 A E L α L Δ T s i n θ 1 + A E L α L Δ T s i n θ 2
T 5 = A E L α L Δ T A E L α L Δ T c o s θ 2
T 6 = A E L α L Δ T

References

  1. Surjadi, J.U.; Gao, L.; Du, H.; Li, X.; Xiong, X.; Fang, N.X.; Lu, Y. Mechanical Metamaterials and Their Engineering Applications. Adv. Eng. Mater. 2019, 21, 1800864. [Google Scholar] [CrossRef]
  2. Wu, W.; Hu, W.; Qian, G.; Liao, H.; Xu, X.; Berto, F. Mechanical Design and Multifunctional Applications of Chiral Mechanical Metamaterials: A Review. Mater. Des. 2019, 180, 107950. [Google Scholar] [CrossRef]
  3. Xu, H.; Pasini, D. Structurally Efficient Three-Dimensional Metamaterials with Controllable Thermal Expansion. Sci. Rep. 2016, 6, 34924. [Google Scholar] [CrossRef]
  4. Lim, T.-C. Metamaterial with Tunable Positive and Negative Hygrothermal Expansion Inspired by a Four-Fold Symmetrical Islamic Motif. Symmetry 2023, 15, 462. [Google Scholar] [CrossRef]
  5. Li, Y.; Chen, Y.; Li, T.; Cao, S.; Wang, L. Hoberman-Sphere-Inspired Lattice Metamaterials with Tunable Negative Thermal Expansion. Compos. Struct. 2018, 189, 586–597. [Google Scholar] [CrossRef]
  6. Wang, Q.; Jackson, J.A.; Ge, Q.; Hopkins, J.B.; Spadaccini, C.M.; Fang, N.X. Lightweight Mechanical Metamaterials with Tunable Negative Thermal Expansion. Phys. Rev. Lett. 2016, 117, 175901. [Google Scholar] [CrossRef] [PubMed]
  7. Wei, T.; Lu, F.; Zhang, C.; Mo, K.; Liu, Y.; Zhu, Y. A 3D Kirigami Meta-Structure with Programmable and Directionally Tailored Thermal Expansion. Thin-Walled Struct. 2026, 218, 114002. [Google Scholar] [CrossRef]
  8. Xie, Z.; Tian, B.; Li, Y.; Zhang, C.; Liu, Y.; Guo, H. A Novel Lightweight Mechanical Metamaterial with a Tunable Thermal Expansion Coefficient. Materials 2025, 18, 1761. [Google Scholar] [CrossRef]
  9. Wang, Z.; Cheng, Y.; Zhao, H.; Zhang, H. Design of Bi-Material Triangle Curved Beam Honeycomb Metamaterial with Tunable Poisson’s Ratio, Thermal Expansion, and Band Gap Characteristics. Materials 2025, 18, 2408. [Google Scholar] [CrossRef]
  10. Lim, T.-C. An Auxetic System Based on Interconnected Y-Elements Inspired by Islamic Geometric Patterns. Symmetry 2021, 13, 865. [Google Scholar] [CrossRef]
  11. Wei, K.; Xu, W.; Ling, B.; Yang, X.; Fang, D. Multi-Functional Cylindrical Metastructures to Simultaneously Program Both Thermal Expansion and Poisson’s Ratio. Extrem. Mech. Lett. 2021, 43, 101177. [Google Scholar] [CrossRef]
  12. Li, Z.; Gao, W.; Kessissoglou, N.; Oberst, S.; Wang, M.Y.; Luo, Z. Multifunctional Mechanical Metamaterials with Tunable Double-Negative Isotropic Properties. Mater. Des. 2023, 232, 112146. [Google Scholar] [CrossRef]
  13. Dong, Y.; Li, Q.; Cui, F.; Bai, L.; Xu, W. Impact Resistance Analysis of a Dual-Constituent Negative Poisson’s Ratio Lattice Metamaterial with Tailorable Coefficient of Thermal Expansion. Phys. Scr. 2024, 99, 065903. [Google Scholar] [CrossRef]
  14. Zhou, X.; Zang, S.; You, Z. Origami Mechanical Metamaterials Based on the Miura-Derivative Fold Patterns. Proc. R. Soc. A Math. Phys. Eng. Sci. 2016, 472, 20160361. [Google Scholar] [CrossRef]
  15. Misseroni, D.; Pratapa, P.P.; Liu, K.; Paulino, G.H. Experimental Realization of Tunable Poisson’s Ratio in Deployable Origami Metamaterials. Extrem. Mech. Lett. 2022, 53, 101685. [Google Scholar] [CrossRef]
  16. Miller, W.; Mackenzie, D.S.; Smith, C.W.; Evans, K.E. A Generalised Scale-Independent Mechanism for Tailoring of Thermal Expansivity: Positive and Negative. Mech. Mater. 2008, 40, 351–361. [Google Scholar] [CrossRef]
  17. Wei, K.; Chen, H.; Pei, Y.; Fang, D. Planar Lattices with Tailorable Coefficient of Thermal Expansion and High Stiffness Based on Dual-Material Triangle Unit. J. Mech. Phys. Solids 2016, 86, 173–191. [Google Scholar] [CrossRef]
  18. Huang, J.; Fu, M.; Zheng, B. A Novel Series of Mechanical Metamaterials with Sign-Changing Coefficient of Thermal Expansion and Their Parameter Analysis. Compos. Struct. 2022, 299, 116082. [Google Scholar] [CrossRef]
  19. Ye, W.; Zhou, Z.; Li, Q. Modelling and Verification of a Novel Bi-Material Mechanical Metamaterial Cellular Structure with Tunable Coefficient of Thermal Expansion. Mater. Today Commun. 2022, 33, 104940. [Google Scholar] [CrossRef]
  20. Timoshenko, S. Analysis of Bi-Metal Thermostats. J. Opt. Soc. Am. 1925, 11, 233–255. [Google Scholar] [CrossRef]
  21. Wu, L.; Li, B.; Zhou, J. Isotropic Negative Thermal Expansion Metamaterials. ACS Appl. Mater. Interfaces 2016, 8, 17721–17727. [Google Scholar] [CrossRef] [PubMed]
  22. Bai, L.; Wang, W.; Xu, W.; Cheng, S.; Yu, X. Dual-Constituent Anti-Tetra-Chiral Lattice Metamaterial with Tailorable Coefficient of Thermal Expansion and Excellent Bandgap. Mater. Today Commun. 2023, 34, 105047. [Google Scholar] [CrossRef]
  23. Bai, L.; Xu, W.; Wang, W.; Cheng, S. Thermal Expansion Regulation and Bandgap Analysis of a Novel Dual-Constituent Negative Poisson’s Ratio Lattice Metamaterial. Mater. Today Commun. 2023, 35, 106311. [Google Scholar] [CrossRef]
  24. Liu, S.; Li, F.; Peng, J.; Zhang, X. Universal Model Describing the Negative Thermal Expansion Coefficients of Bending-Type Two-Dimensional Metamaterials with Chiral/Anti-Chiral Structures. Compos. Commun. 2023, 39, 101559. [Google Scholar] [CrossRef]
  25. Fey, T.; Eichhorn, F.; Han, G.; Ebert, K.; Wegener, M.; Roosen, A.; Kakimoto, K.; Greil, P. Mechanical and Electrical Strain Response of a Piezoelectric Auxetic PZT Lattice Structure. Smart Mater. Struct. 2015, 25, 015017. [Google Scholar] [CrossRef]
  26. Zhang, W.; Ma, Z.; Hu, P. Mechanical Properties of a Cellular Vehicle Body Structure with Negative Poisson’s Ratio and Enhanced Strength. J. Reinf. Plast. Compos. 2014, 33, 342–349. [Google Scholar] [CrossRef]
  27. Wang, Y.; Wang, L.; Ma, Z.D.; Wang, T. A negative Poisson’s ratio suspension jounce bumper. Mater. Des. 2016, 103, 90–99. [Google Scholar] [CrossRef]
  28. Grima, J.N.; Gatt, R.; Ellul, B.; Chetcuti, E. Auxetic Behaviour in Non-Crystalline Materials Having Star or Triangular Shaped Perforations. J. Non-Cryst. Solids 2010, 356, 1980–1987. [Google Scholar] [CrossRef]
  29. Mizzi, L.; Azzopardi, K.M.; Attard, D.; Grima, J.N.; Gatt, R. Auxetic Metamaterials Exhibiting Giant Negative Poisson’s Ratios. Phys. Status Solidi (RRL)–Rapid Res. Lett. 2015, 9, 425–430. [Google Scholar] [CrossRef]
  30. Yuan, S.; Shen, F.; Bai, J.; Chua, C.K.; Wei, J.; Zhou, K. 3D Soft Auxetic Lattice Structures Fabricated by Selective Laser Sintering: TPU Powder Evaluation and Process Optimization. Mater. Des. 2017, 120, 317–327. [Google Scholar] [CrossRef]
  31. Alderson, A.; Alderson, K.L.; Attard, D.; Evans, K.E.; Gatt, R.; Grima, J.N.; Miller, W.; Ravirala, N.; Smith, C.W.; Zied, K. Elastic Constants of 3-, 4- and 6-Connected Chiral and Anti-Chiral Honeycombs Subject to Uniaxial in-Plane Loading. Compos. Sci. Technol. 2010, 70, 1042–1048. [Google Scholar] [CrossRef]
  32. Fu, M.H.; Zheng, B.B.; Li, W.H. A novel chiral three-dimensional material with negative Poisson’s ratio and the equivalent elastic parameters. Compos. Struct. 2017, 176, 442–448. [Google Scholar] [CrossRef]
  33. Li, X.; Gao, L.; Zhou, W.; Wang, Y.; Lu, Y. Novel 2D Metamaterials with Negative Poisson’s Ratio and Negative Thermal Expansion. Extrem. Mech. Lett. 2019, 30, 100498. [Google Scholar] [CrossRef]
  34. Li, J.; Yang, Q.; Wei, Y.; Huang, N.; Tao, R. A Synergistic Design of Composite Metamaterial with Drastically Tailorable Thermal Expansion and Poisson’s Ratio. Compos. Struct. 2021, 275, 114446. [Google Scholar] [CrossRef]
  35. Wu, H.; Fu, M.; Chen, M.; Jiang, W.; Zhong, R.; Zheng, B.; Huang, J. A Novel Metamaterial with Instantaneously Sign-Switchable Coefficient of Thermal Expansion and Poisson’s Ratio. Mech. Mater. 2024, 192, 104974. [Google Scholar] [CrossRef]
  36. Zhang, Q.; Sun, Y. Anisotropic Thermal Expansion Based on a Novel Metamaterial. Int. J. Mech. Sci. 2024, 268, 109024. [Google Scholar] [CrossRef]
  37. Zhang, X.; Zhu, W.; Tian, R.; Chen, L.; Guan, H. Dual Arrowhead-Shaped Re-Entrant Auxetic Hybrid Metamaterial with Adjustable Thermal Expansion. Mater. Today Commun. 2024, 40, 109456. [Google Scholar] [CrossRef]
  38. Ai, L.; Gao, X.-L. Metamaterials with Negative Poisson’s Ratio and Non-Positive Thermal Expansion. Compos. Struct. 2017, 162, 70–84. [Google Scholar] [CrossRef]
  39. Ai, L.; Gao, X.-L. Three-Dimensional Metamaterials with a Negative Poisson’s Ratio and a Non-Positive Coefficient of Thermal Expansion. Int. J. Mech. Sci. 2018, 135, 101–113. [Google Scholar] [CrossRef]
  40. Wei, K.; Peng, Y.; Qu, Z.; Pei, Y.; Fang, D. A Cellular Metastructure Incorporating Coupled Negative Thermal Expansion and Negative Poisson’s Ratio. Int. J. Solids Struct. 2018, 150, 255–267. [Google Scholar] [CrossRef]
  41. Zhang, H.; Guo, X.; Wu, J.; Fang, D.; Zhang, Y. Soft Mechanical Metamaterials with Unusual Swelling Behavior and Tunable Stress-Strain Curves. Sci. Adv. 2018, 4, eaar8535. [Google Scholar] [CrossRef]
  42. Lim, T.-C. Composite Metamaterial Square Grids with Sign-Flipping Expansion Coefficients Leading to a Type of Islamic Design. SN Appl. Sci. 2020, 2, 918. [Google Scholar] [CrossRef]
  43. Lim, T.-C. Metamaterial with Sign-Toggling Thermal Expansivity Inspired by Islamic Motifs in Spain. J. Sci. Adv. Mater. Devices 2022, 7, 100401. [Google Scholar] [CrossRef]
  44. Lim, T.-C. Metamaterial Honeycomb with Sign-Toggling Expansion Coefficients That Manifests an Islamic Mosaic Pattern at the Alhambra Palace. Adv. Compos. Hybrid Mater. 2021, 4, 966–978. [Google Scholar] [CrossRef]
  45. Yang, H.; Ma, L. 1D to 3D Multi-Stable Architected Materials with Zero Poisson’s Ratio and Controllable Thermal Expansion. Mater. Des. 2020, 188, 108430. [Google Scholar] [CrossRef]
  46. Marin, M. Composite Structures with Symmetry. Symmetry 2021, 13, 792. [Google Scholar] [CrossRef]
Figure 1. The metamaterial structure design: (a) bimaterial triangle and bimaterial rhombus; (b) design concept of the novel metamaterial structure; (c) planar metamaterial array.
Symmetry 18 00727 g001
Figure 2. Planar beam element and structure: (a) planar beam element in the local coordinate system; (b) schematic diagram of the thermal effect of the planar beam element; (c) planar beam element in the global coordinate system; (d) boundary conditions of the quarter structure.
Symmetry 18 00727 g002
Figure 3. Mesh seed parameter setting: (a) mesh seed size is 8 mm; (b) mesh seed size is 0.5 mm.
Symmetry 18 00727 g003
Figure 4. (a) Relative CTE curve; (b) Simulation results of negative thermal expansion; (c) Simulation results of positive thermal expansion; (d) Simulation results of quasi-zero thermal expansion.
Symmetry 18 00727 g004
Figure 5. (a) PR curve; (b) Simulation results of NPR; (c) Simulation results of positive PR; (d) Simulation results of quasi-zero PR.
Symmetry 18 00727 g005
Figure 6. (a) Simulation of elastic modulus in the X direction; (b) Simulation of elastic modulus in the Y direction.
Symmetry 18 00727 g006
Figure 7. (a) Stress simulation of NPR; (b) Stress simulation of positive PR; (c) Stress simulation of quasi-zero PR.
Symmetry 18 00727 g007
Figure 8. (a)Experimental setup for CTE measurement; (b) Sample with negative thermal expansion characteristics; (c) Interlocking structure with interference fit; (d) Aluminum alloy and low carbon steel samples.
Symmetry 18 00727 g008
Figure 9. Relative error w.r.t. theoretical result and simulated result (a) CTE results; (b) PR results.
Symmetry 18 00727 g009
Figure 10. Experimental setup for PR measurement.
Symmetry 18 00727 g010
Figure 11. (a) Relationship between α/αH and θ1; (b) Relationship between α/αH and θ2; (c) Relationship between α/αH and θ3; (d) Relationship between α/αH and D.
Symmetry 18 00727 g011
Figure 12. (a) Relationship between α/αH and αH/αL; (b) Relationship between α/αH and EH/EL.
Symmetry 18 00727 g012
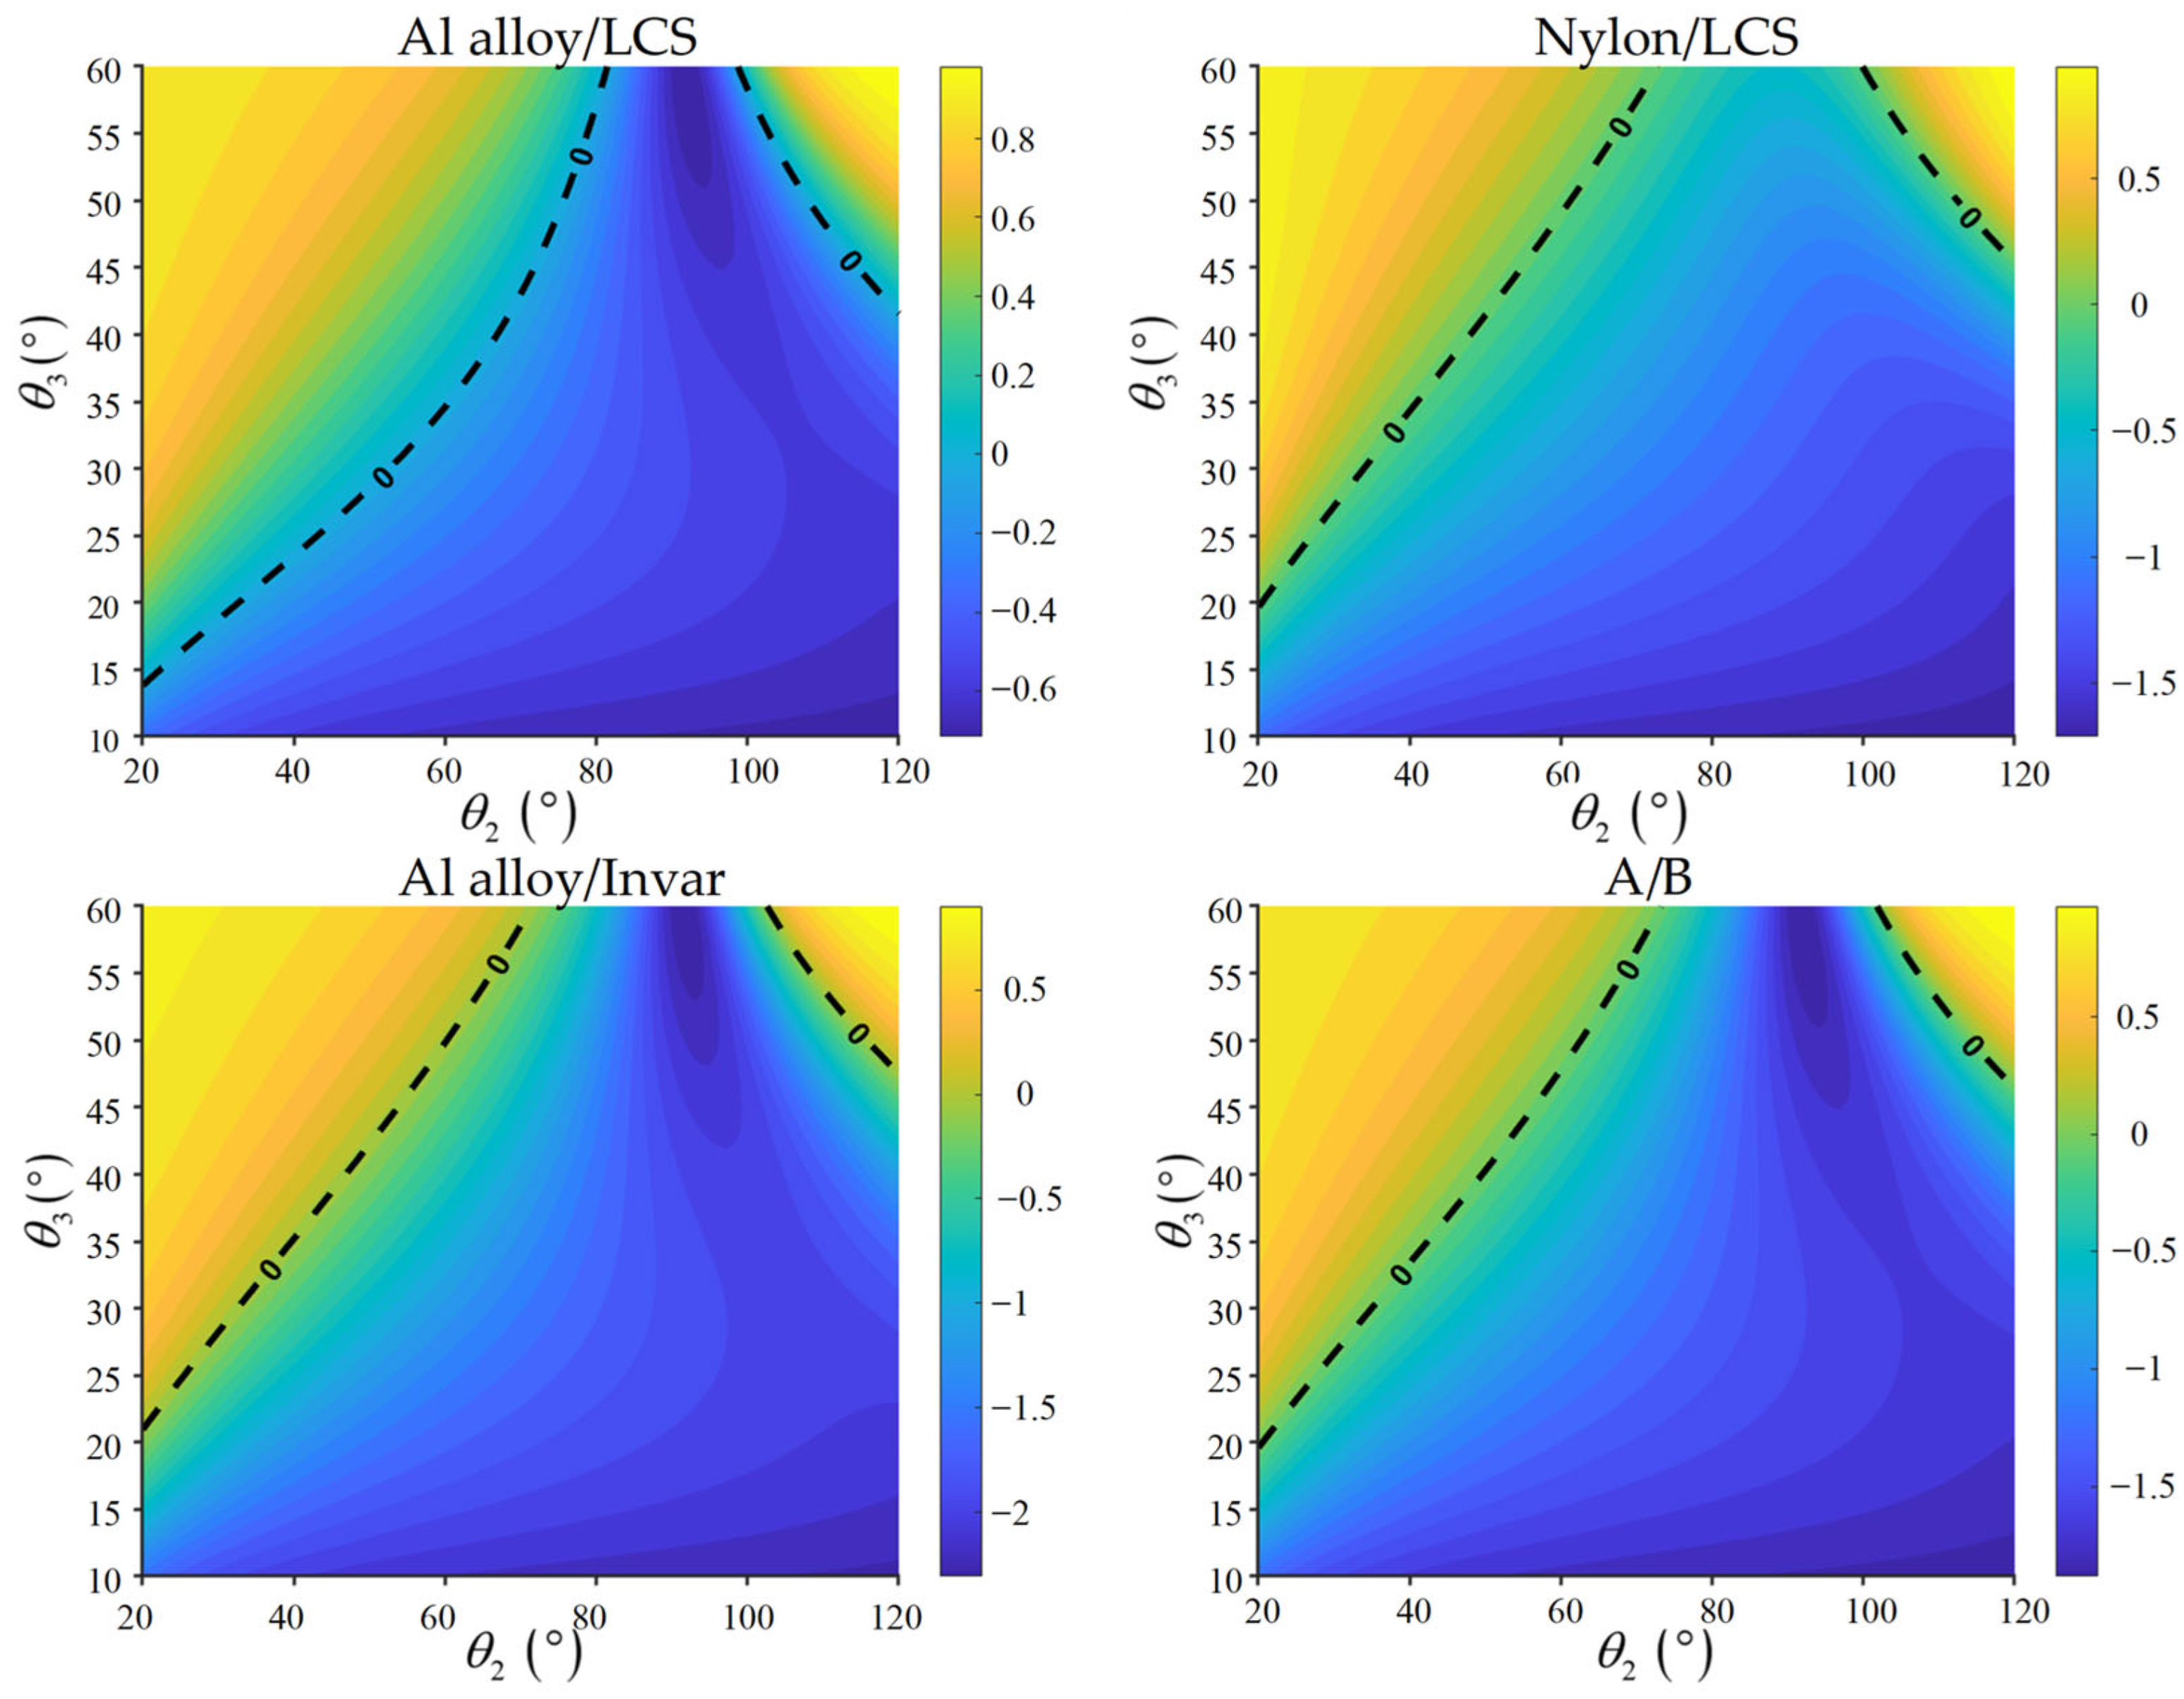
Figure 13. Contour maps of CTE in the θ2θ3 parameter space for different material combinations (θ1 = 30°, D = 300mm) and the dashed line indicates α/αH = 0.
Symmetry 18 00727 g013
Figure 14. (a) Relationship between PR and θ1; (b) Relationship between PR and θ2; (c) Relationship between PR and θ3; (d) Relationship between PR and D.
Symmetry 18 00727 g014
Figure 15. Contour maps of PR in the θ1D parameter space for different material combinations (θ2 = 20°, θ3 = 15°), and the dashed line indicates v = 0.
Symmetry 18 00727 g015
Figure 16. Relationship between PR and EH/EL.
Symmetry 18 00727 g016
Figure 17. Coupled relationship between CTE and PR.
Symmetry 18 00727 g017
Table 1. Physical properties of four materials.
MaterialElastic Modulus (GPa)CTE (ppm/°C)Density (g/cm3)
Nylon2.90721.16
Invar1481.38.05
Al alloy70.323.82.68
LCS202127.85
Table 2. Property ratios of material combinations.
Material CategoryElastic Modulus RatioCTE RatioDensity Ratio
Al alloy/LCS0.3481.980.341
Nylon/LCS0.014460.148
Al alloy/Invar0.47518.310.333
A/B0.34860.148
Table 3. Mesh convergence study of CTE.
Global Seed Size (mm)Number of ElementsSimulation CTE (ppm/°C)Change in CTE (%)
0.5118447.312841716442819-
194047.3128417164428190.0000
247247.3117294460008470.0024
423447.3117294460008470.0000
811847.2891847910790590.0476
Table 4. Comparison of theoretical and simulated CTE.
Thermal Expansion TypeCTE Simulation
Results (ppm/°C)
CTE Theoretical
Results (ppm/°C)
Error   S CTE T CTE T CTE (%)
Negative
thermal expansion
−47.4−47.30.211
Positive
thermal expansion
25.425.50.392
Quasi-zero
thermal expansion
−0.240−0.2472.834
Table 5. Comparison of theoretical and simulated PR.
PR TypePR Simulation
Results
PR Theoretical
Results
Error   S PR T PR T PR (%)
NPR−10.407−10.3840.221
Positive PR5.6715.6710
Quasi-zero PR0.045−0.03625
Table 6. Comparison of theoretical and simulated elastic modulus.
Direction of ExtrusionElastic Modulus
Simulation Results (MPa)
Elastic Modulus
Theoretical Results (MPa)
Error (%)
X direction (EX)262.5264.10.606
Y direction (EY)23.423.50.426
Table 7. CTE measurement experiment results and error analysis.
Test
No
Test CTE
(ppm/°C)
Theoretical Error
(%)
Simulation Error
(%)
Test1−5.5625.414.6
Test2−5.9520.18.6
Test3−7.124.439.37
Test4−6.6211.11.69
Test5−7.065.238.45
Test6−5.6823.812.7
Test7−6.3215.22.92
Mean−6.33--
Std. Dev.0.56--
Table 8. PR measurement experiment results and error analysis.
Test
No
Test PRTheoretical Error
(%)
Simulation Error
(%)
Test1−5.47317.771.99
Test2−4.8684.7612.82
Test3−5.83025.464.41
Test4−5.0007.6010.46
Test5−4.7572.3714.81
Test6−4.7802.8614.40
Test7−4.9947.4710.57
Mean−5.100--
Std. Dev.0.385--
Disclaimer/Publisher’s Note: The statements, opinions and data contained in all publications are solely those of the individual author(s) and contributor(s) and not of MDPI and/or the editor(s). MDPI and/or the editor(s) disclaim responsibility for any injury to people or property resulting from any ideas, methods, instructions or products referred to in the content.