Article

Recognition of Electricity Meter Digits Based on Improved YOLOv10n and Cascaded Visual-Semantic Processing

Department of Electrical Engineering, North China Electric Power University, Baoding 071003, China
*
Author to whom correspondence should be addressed.
Symmetry 2026, 18(4), 694; https://doi.org/10.3390/sym18040694
Submission received: 16 March 2026 / Revised: 14 April 2026 / Accepted: 20 April 2026 / Published: 21 April 2026

Abstract

Digital electricity meters display readings via digits, but accurate image-based recognition faces a key challenge: the frequent omission of decimal points creates a critical asymmetry between the visual image and its true semantic meaning. To address this visual-semantic asymmetry, we propose an improved YOLOv10n approach incorporating cascaded Visual-Semantic processing. We introduce a Reparameterized Convolution Single-Shot Aggregation (RCSOSA) module and a SimAM attention mechanism to enhance feature extraction, and employ Normalized Wasserstein Distance (NWD) Loss to boost small-target detection. To rectify the visual-semantic asymmetry, we introduce domain-specific format rules based on power industry standards (taking GB/T 17215-2018 as an example) to provide structural constraints for digit recognition. Experimental results show superior performance with 0.870 precision, 0.932 mAP50, and 116 FPS inference speed, outperforming reference models in both precision and efficiency for real-time meter inspection.

1. Introduction

With the rapid development and intelligent transformation of power systems, the inspection of power equipment has become increasingly important. A digital electricity meter is a basic device in power systems, which shows the measured information with digits. To recognize these digits accurately via image is crucial for smart-grid development. Therefore, automated inspection technologies based on computer vision have become a research hotspot. A correctly displayed meter reading maintains a symmetrical mapping between the image and its semantic meaning. However, this symmetry is often disrupted in real-world settings. Complex backgrounds introduce visual noise, and the critical decimal point is frequently missed—because it is too small and has low contrast against the meter dial. For instance, an illegible decimal point may cause a vision system to erroneously extract a physical reading of “123.45” as “12345”, thereby amplifying the measurement error by two orders of magnitude. This phenomenon engenders a profound visual-semantic asymmetry, wherein the extracted digit string fundamentally deviates from the ground-truth semantic value. Rectifying this visual-semantic asymmetry is the core motivation of this work.
Target detection technology based on YOLO serves as the foundation for electricity detection [1,2,3,4,5]. YOLOv10 is an advanced real-time object detection model, yet it still faces multiple challenges in recognition performance and adaptability to complex environments. Sriram et al. [6] demonstrated that underwater optical interference, glare, and complex background noise significantly reduce the robustness of YOLOv10. The model required additional mechanisms such as DPAM and DALSM to achieve effective detection, revealing its inherent limitations in feature extraction under challenging conditions. Furthermore, Li and Song [7] emphasized that YOLOv10 is highly susceptible to background interference in small object detection scenarios, and its original architecture struggles to efficiently distinguish targets from complex environmental information. Consistent evidence indicates that YOLOv10 still exhibits considerable deficiencies in recognition performance and anti-interference capability in complex backgrounds, calling for the development of more powerful feature fusion and environment-adaptive mechanisms.
After the electric meter is recognized, it is necessary to read the numbers in the target area. Currently, the main methods for electric meter digit recognition include Optical Character Recognition (OCR) technology [8] and deep learning algorithms [9]. Traditional OCR methods [10,11] mainly rely on character segmentation and pattern matching technologies, which are suitable for standardized text recognition. However, when facing the diversity of substation instruments and severe environmental interference, they are easily affected by factors such as lighting changes, occlusion, and background interference, leading to a decline in recognition accuracy. In recent years, deep learning technology has been introduced into the field of intelligent instrument recognition [12,13,14]. By combining Convolutional Neural Networks (CNN), Long Short-Term Memory Networks (LSTM), and self-attention mechanisms, the accuracy of character recognition has been significantly improved. Nevertheless, many general deep learning methods are highly dependent on large-scale labeled data and have limited model generalization capabilities. Thus, they are difficult to directly adapt to instrument styles with significant differences and complex on-site environments. To tackle the challenges of complex scene interference and few-shot samples in industrial vision recognition, recent studies have explored domain adaptation and generative data augmentation, such as self-modified dynamic domain adaptation for soft sensing [15] and training-free large-model augmentation for few-shot surface defect recognition [16]. Although these methods effectively handle cross-domain distribution alignment or synthetic data generation, they do not address the visual-semantic asymmetry caused by missing decimal points that leads to misinterpretation of electricity meter readings.
To address the aforementioned challenges of visual-semantic asymmetry, this study enhances digit recognition for electricity meters by integrating an improved YOLOv10n, EasyOCR, and a semantically guided framework that combines visual perception with rule-based semantic reasoning. This integration aims to re-establish the symmetrical integrity of the meter reading and achieve full-process automation from meter localization to digit recognition. The main contributions of this paper are as follows:
  • YOLOv10-RSN model is proposed for meter recognition from complex environments. The introduction of the Reparameterized Convolution Single-Shot Aggregation (RCSOSA) module to balance computational efficiency and feature representation, the SimAM attention mechanism to adaptively calibrate features and reduce spatial attention asymmetry, and the Normalized Wasserstein Distance (NWD) Loss to provide a scale-similarity measure that is more symmetrical across object sizes significantly improves both accuracy and speed for electricity meter digit detection. The model enhances feature extraction and spatial perception capabilities, making it suitable for object detection in complex scenarios.
  • Following target detection, the EasyOCR module is employed for accurate digit recognition. Domain-specific format rules (taking GB/T 17215-2018 as the standard for Chinese electricity meters) provide structural constraints during post-processing to automatically rectify common OCR errors like decimal point omissions. This semantic correction ensures that the final reading format aligns with industry standards, effectively resolving the visual-semantic inconsistency caused by missing decimal points.

2. Materials and Methods

2.1. Overall Framework of YOLOv10-RSN

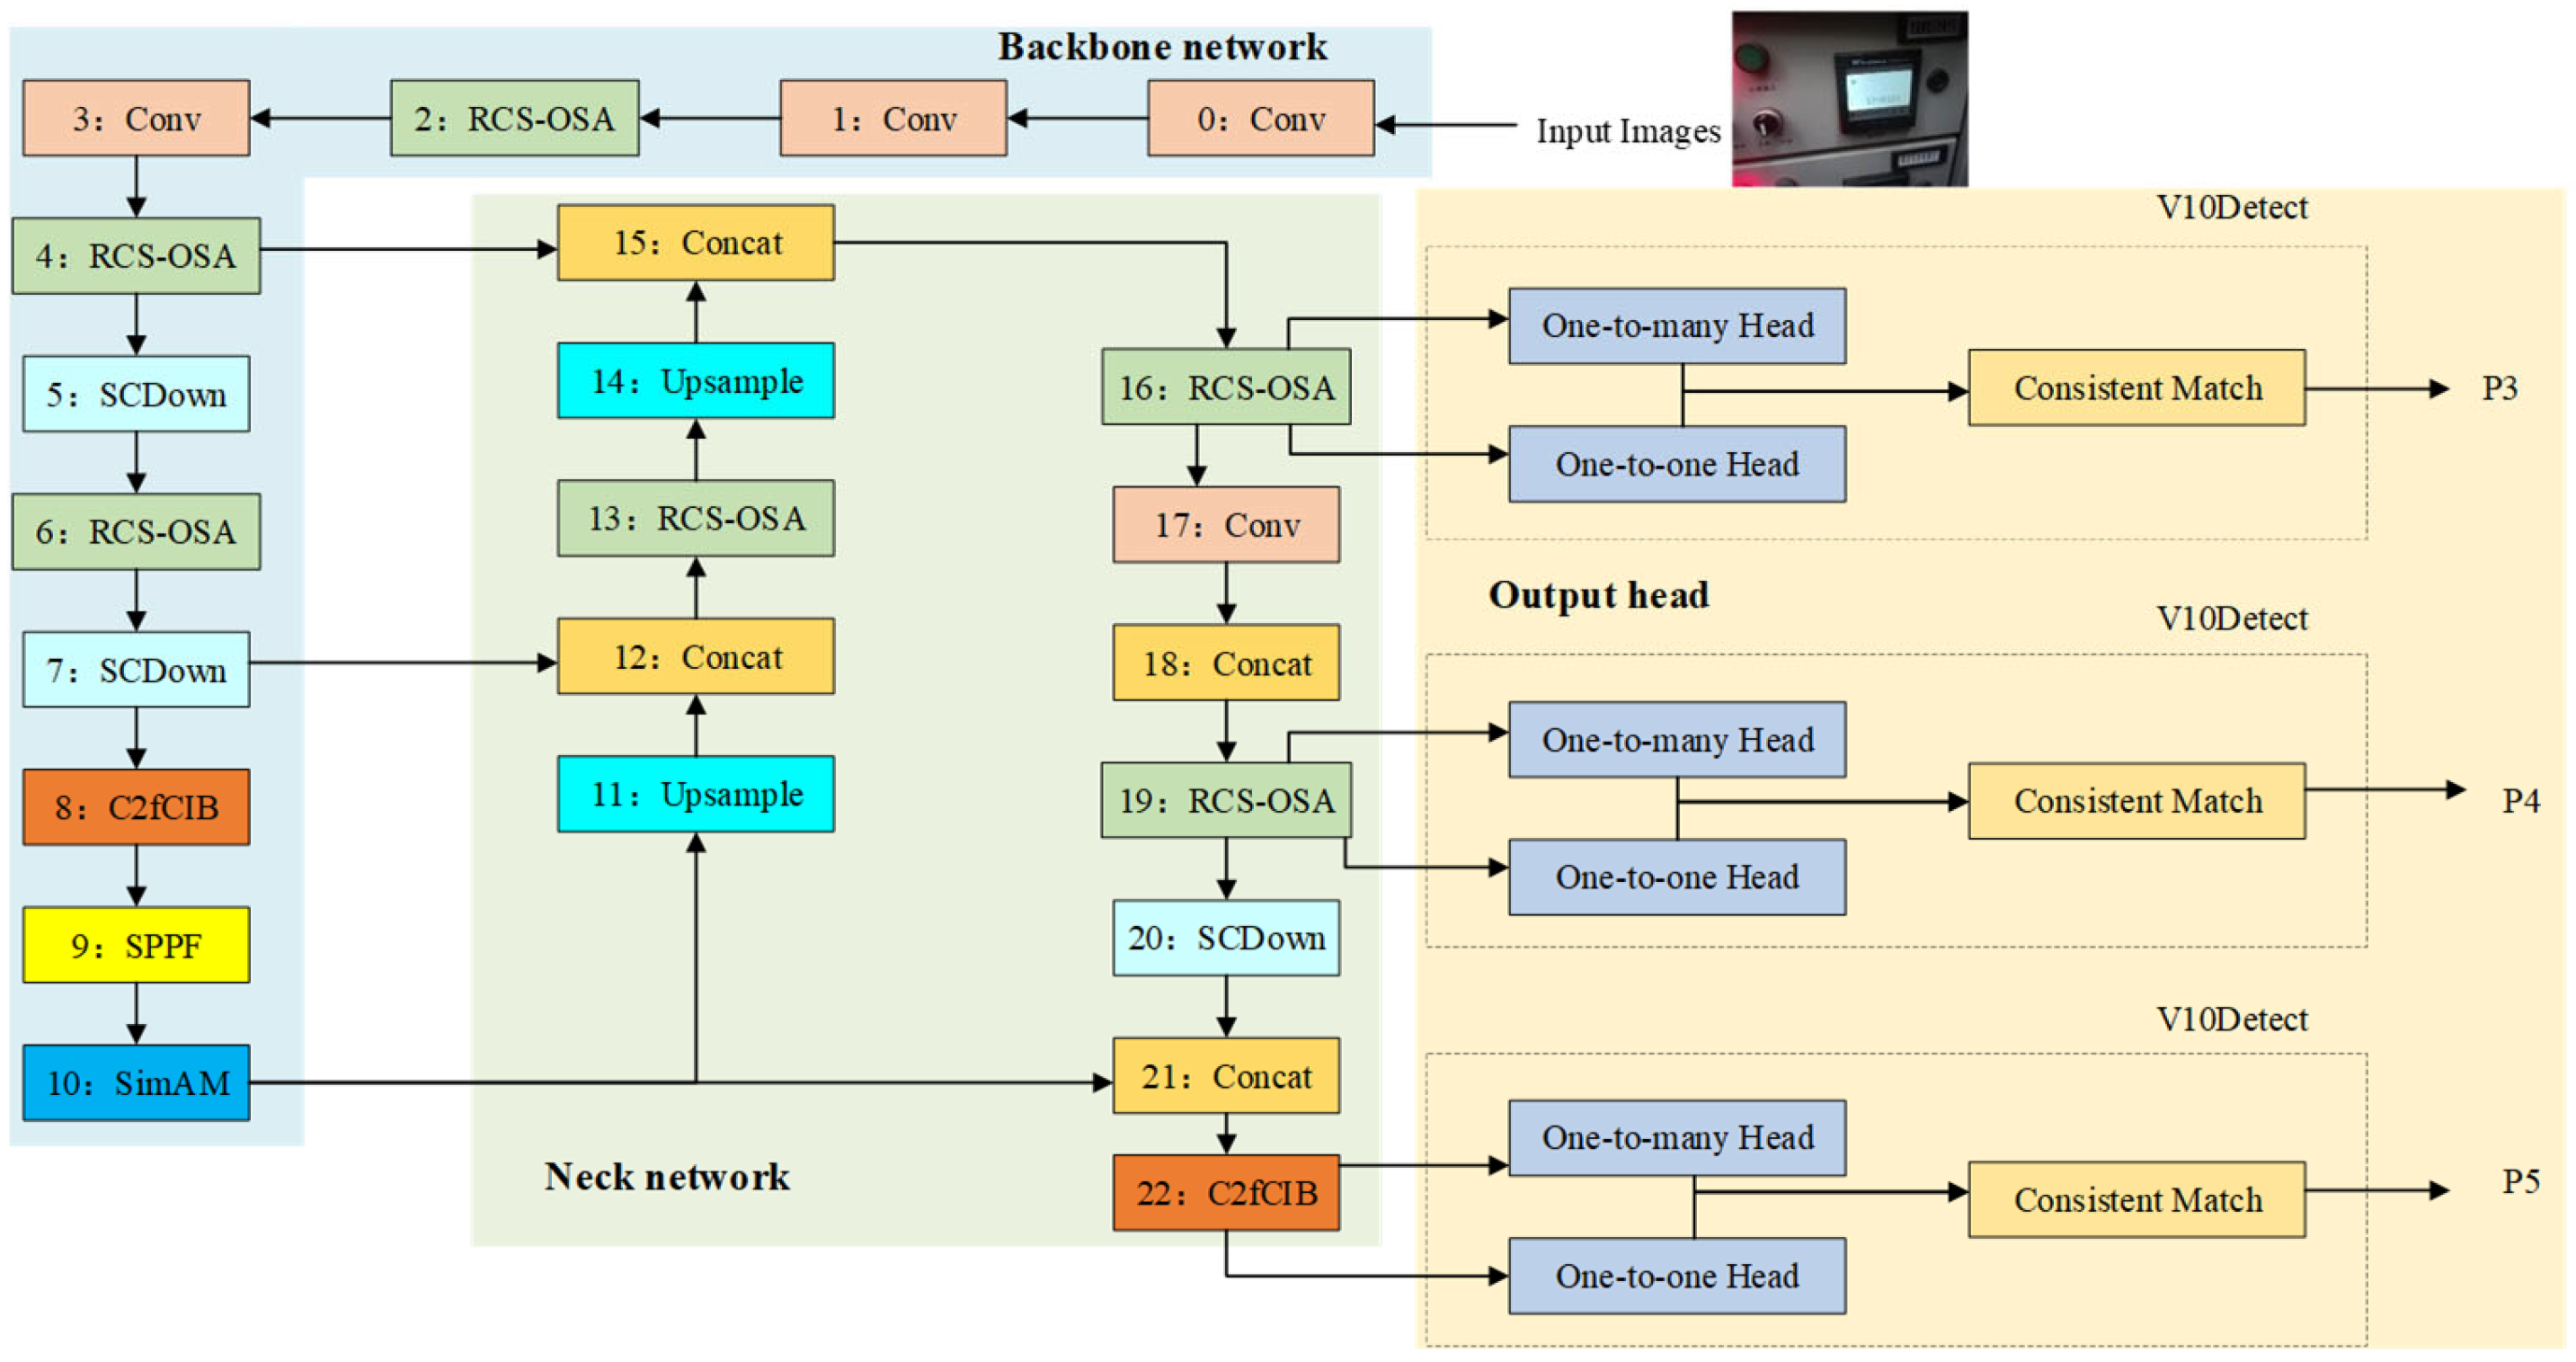
The electricity meter recognition imposes stringent requirements on both efficiency and accuracy of target detection models. To fulfill the demands, this study improves the feature extraction, information fusion, and spatial perception capabilities of the YOLOv10n model while optimizing its inference speed. Overall, this enhanced model is able to better recognize the electricity meter from complex background. As shown in Figure 1, the improved YOLOv10-RSN model consists of three main components: a backbone network, a neck network, and an output head.

2.1.1. Backbone

In YOLOv10n, the C2f module fails to adequately extract shape features from electricity meter images when fusing features from different levels, resulting in suboptimal performance in meter detection tasks [17]. To overcome this limitation, this study replaces the original feature extraction module with a Reparameterized Convolution Single-Shot Aggregation (RCSOSA) module based on channel shuffling. This modification aims to comprehensively extract meter image information, providing more accurate foundations for subsequent meter reading.
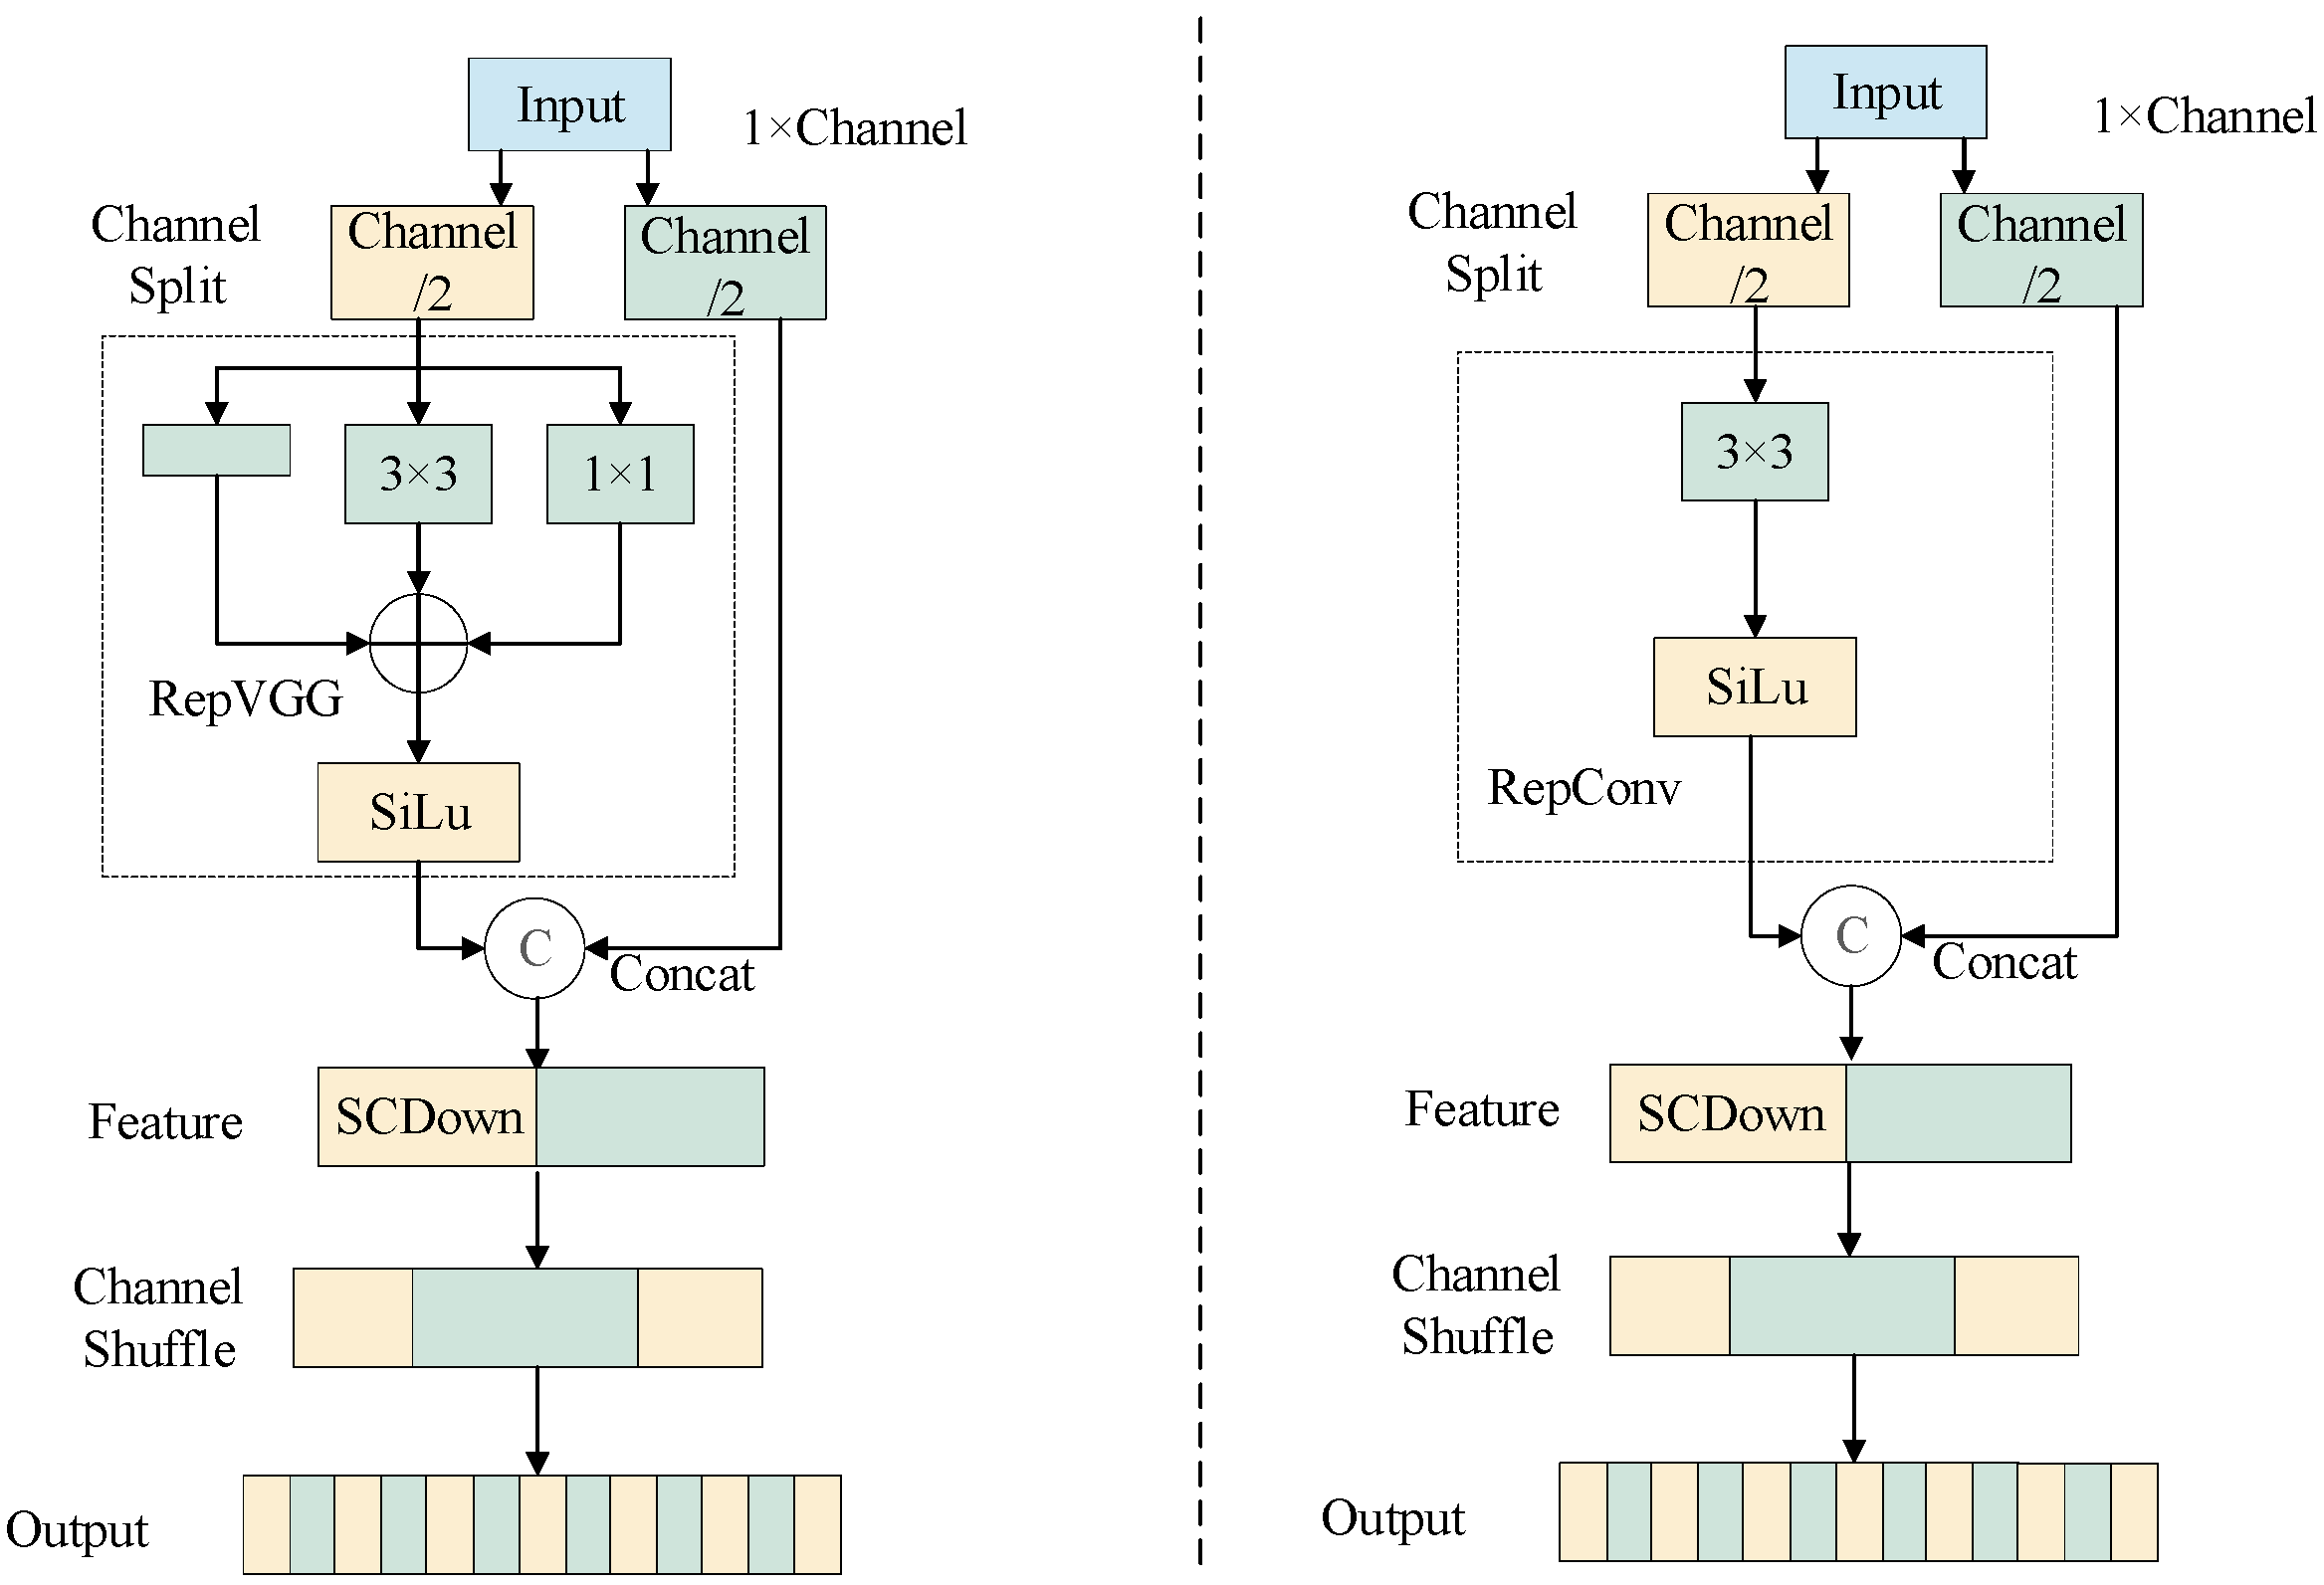
The RCSOSA module combines Channel-Shuffled Reparameterized Convolution (RCS) and One-Shot Aggregation (OSA) architectures [18]. The structure of RCS is illustrated in Figure 2.
The RCS structure processes an input tensor of dimensions C × H × W. After channel splitting, the tensor divides into two feature maps with equal channel dimensions. During training, one branch adopts a multi-branch structure—comprising an identity mapping, a 1 × 1 convolution, and a 3 × 3 convolution, each followed by a Batch Normalization (BN) layer—to learn richer feature representations.
To formalize the structural reparameterization process during inference, let W ( i ) denote the convolutional kernel weights for branch i (where i { 3 , 1 , 0 } represents the 3 × 3, 1 × 1, and identity branches, respectively), and let μ i , σ i , γ i , β i denote the corresponding BN parameters (mean, variance, scaling factor, and bias). First, the convolution and BN layers of each branch are fused into an equivalent weight W i and bias b i :
W i = γ i σ i W ( i )
b i = β i μ i γ i σ i
Next, the 1 × 1 kernel and the identity mapping (mathematically treated as a 1 × 1 convolution with an identity matrix) are zero-padded (denoted as PAD) to match the 3 × 3 spatial dimensions. The final reparameterized weight W r e p and bias b r e p are obtained via element-wise addition:
W r e p = W 3 × 3 + PAD ( W 1 × 1 ) + PAD ( W i d )
b r e p = b 3 × 3 + b 1 × 1 + b i d
Through this mathematical transformation, the multi-branch structure is seamlessly converted into a single 3 × 3 RepConv, significantly reducing computational complexity while maintaining cross-channel information exchange. Finally, channel shuffling enhances feature fusion across channels and further optimizes efficiency. This design perfectly balances computational efficiency and feature extraction capability.
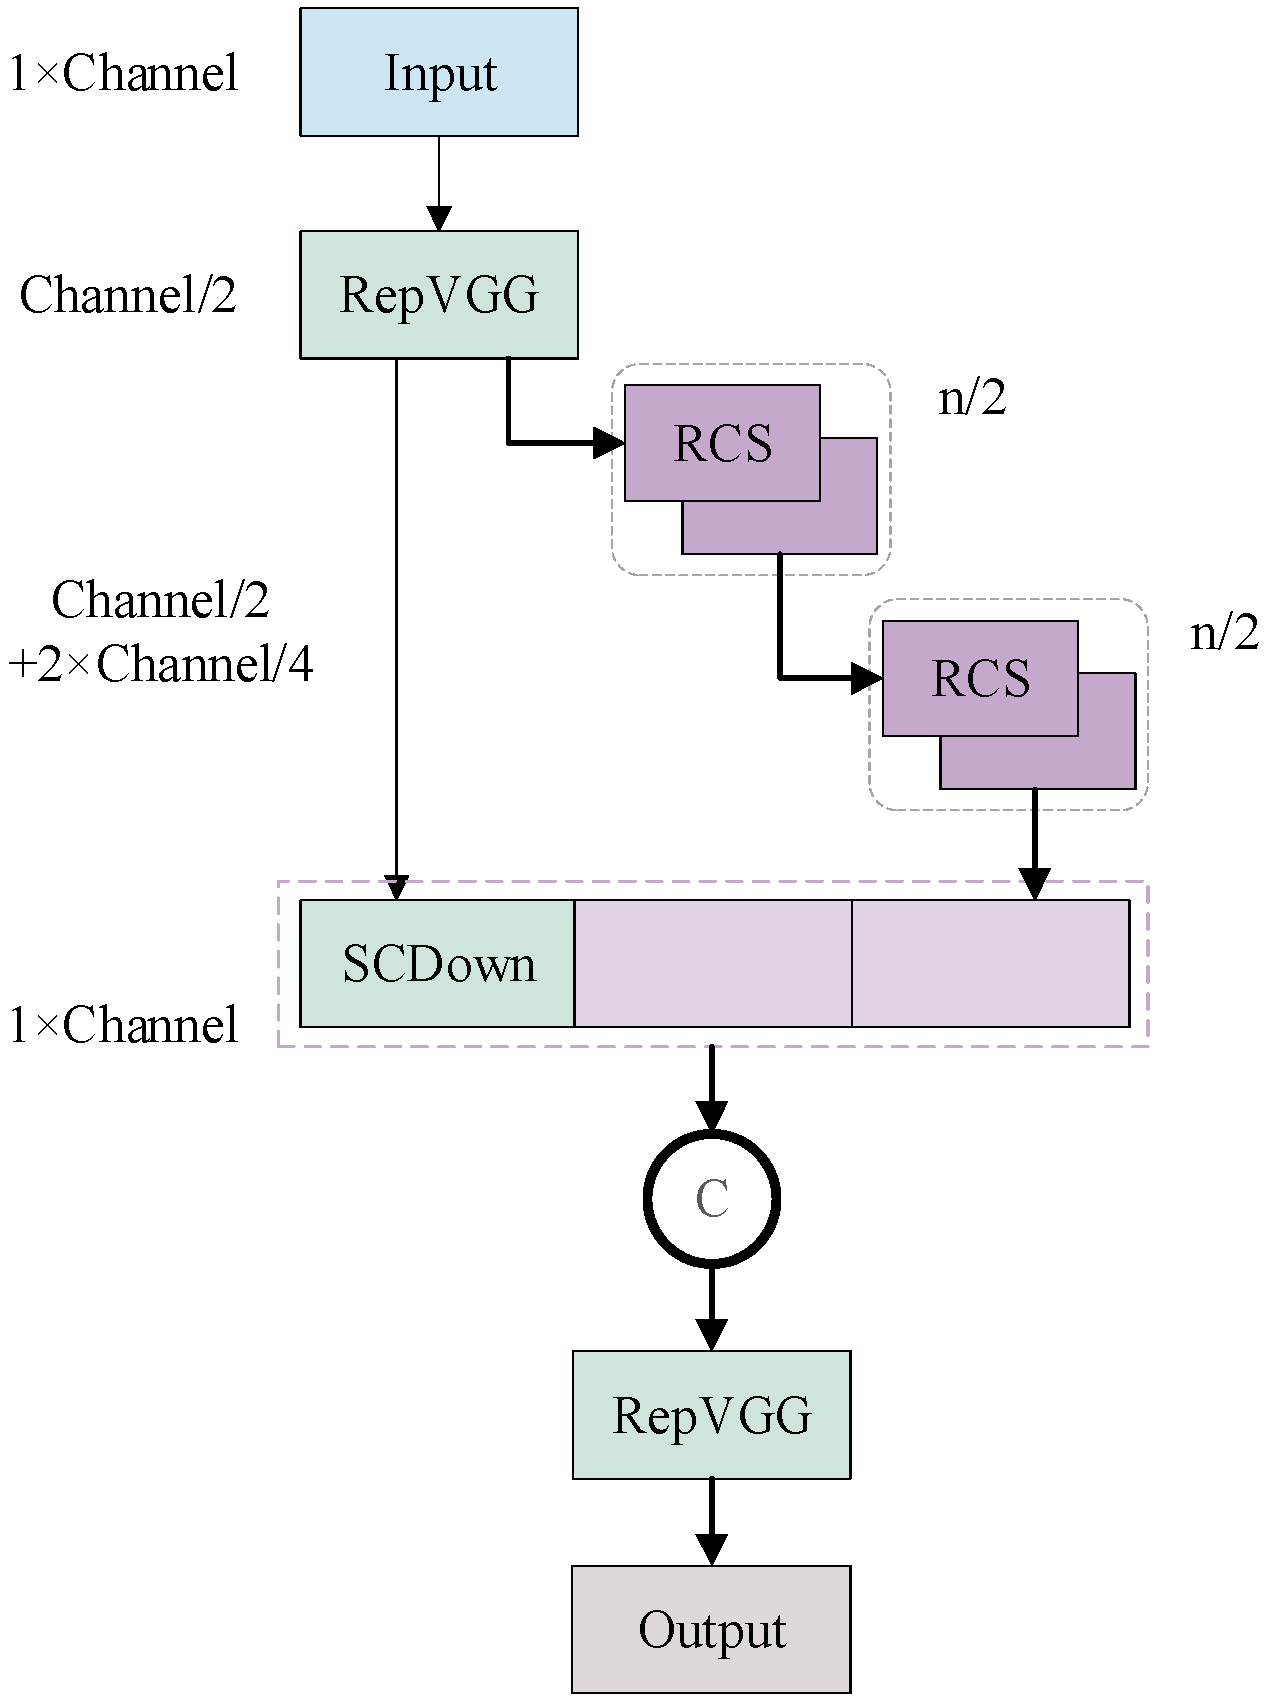
As shown in Figure 3, the RCSOSA module employs OSA to directly fuse multi-level features, eliminating redundant layer-by-layer computations. By stacking RCS blocks, it strengthens feature reuse and cross-channel interaction, maintaining high performance while addressing the inefficiency of traditional dense connections. While the general OSA architecture is defined by aggregating all intermediate multi-level features in a single shot at the end of the block, our specific implementation within the RCSOSA module selectively retains only three feature maps for this final concatenation. This targeted architectural adaptation effectively reduces computational load and memory usage while preserving the necessary cross-channel feature interactions.
Through one-shot feature fusion (OSA) and residual connections (RCS), the RCSOSA module achieves a balance between efficiency and representation power. This optimized design provides a more reliable deep learning solution for smart meter detection in power systems.

2.1.2. SimAM Attention Mechanism

The PSA module in YOLOv10n enhances model performance through local self-attention mechanisms. However, its high computational complexity and limited spatial modeling capability affect its effectiveness in precise positioning tasks like meter recognition. To address this, we replace PSA with the SimAM module.
Attention mechanisms mainly include channel attention, spatial attention, and their hybrid forms. Traditional methods like SE [19] and CBAM [20] effectively model channel relationships but often neglect spatial information. Other solutions tend to introduce excessive parameters, making them impractical for deployment.
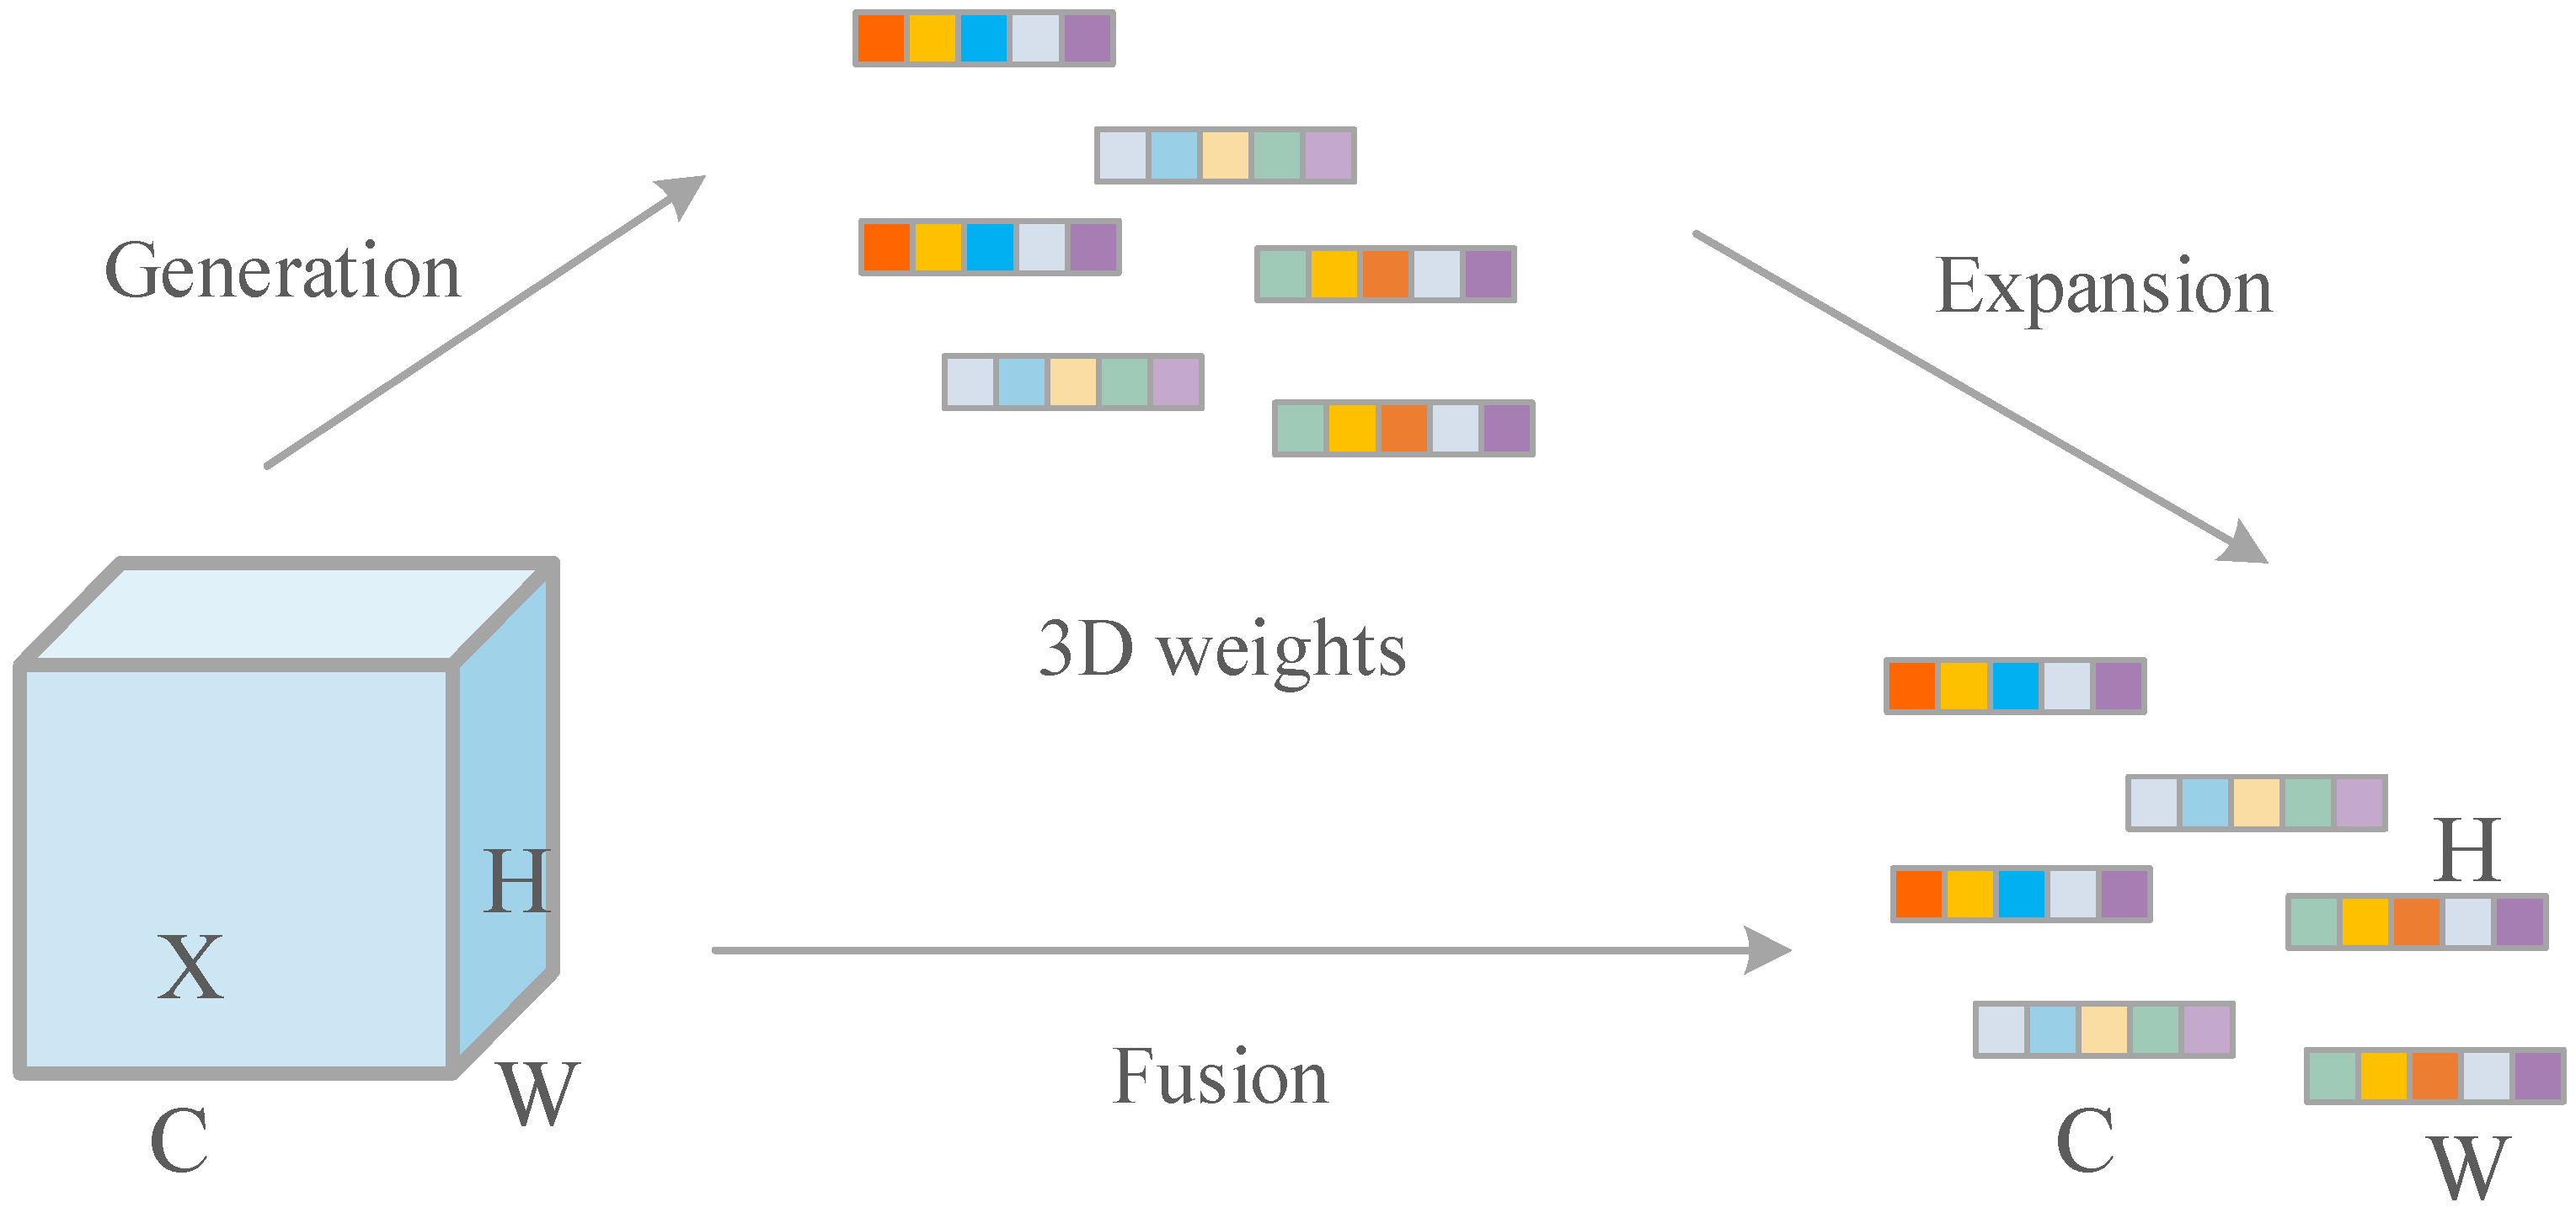
SimAM [21] is a parameter-free 3D attention mechanism (Figure 4). It generates 3D attention weights through an energy function, which are then fused with input features X to produce the final output. This approach dynamically evaluates neuron importance via the energy function, optimizing attention weight distribution to enhance network performance.
This energy function treats each pixel in the input feature map as a neuron, with the minimum energy defined as:
e t = 4 M i = 1 M ( x i α ) 2 + 4 β ( t α ) 2 + 2 M i = 1 M ( x i α ) 2 + 2 β
α = 1 M i = 1 M x i
In the SimAM attention mechanism, et represents the energy of the target neuron. t and i respectively represent target neurons and spatial dimension indices of input features. Here, H, W and C correspond to pixel count per channel (H × W) and channel number (C). M denotes neuron quantity across channels (M = H × W), while β is a parameter typically valued at 1 × 10⁻⁴. α represents the mean of all neurons except target neuron t within a channel, whereas xi characterizes other neurons in the same channel as t.
Spatially inhibited neurons exhibit high linear separability (showing significant differences from other neurons), manifesting distinct deviations in both α and t that result in lower energy values et. Equation (5) demonstrates that lower neuronal energy indicates higher distinguishability between target neuron t and surrounding neurons. Consequently, weight parameters for each neuron can be calculated via (1/et). According to attention mechanism principles, the feature matrix enhancement is computed as:
X ¯ = s i g m o i d ( 1 E ) X
This study integrates the SimAM module into YOLOv10’s backbone, enabling automatic attention weight adjustment to effectively capture key meter dial features while filtering interference, thereby significantly improving detection accuracy. The module adaptively processes feature variations across different distances, including fine textures of distant targets and holistic characteristics of nearby objects.

2.1.3. Adopting NWD Loss for Bounding Box Regression

YOLOv10n employs Complete Intersection over Union (CIoU) for loss calculation, which may lead to suboptimal optimization of similarity measurement between predicted and ground truth boxes, causing loss fluctuation and affecting model convergence. To address this, we introduce Normalized Wasserstein Distance (NWD) Loss [22]. NWD Loss demonstrates lower sensitivity to target scale variations and provides more accurate similarity measurement for small targets, showing stronger robustness across different scales and significant advantages in micro-target localization.
NWD Loss evaluates the geometric similarity between predicted and ground truth boxes by modeling them as 2D Gaussian distributions [23]. In real-world object detection, the informative pixels of a target are generally concentrated near the center of the bounding box and become sparser toward the boundaries. Therefore, a bounding box B = ( c x , c y , w , h ) can be effectively mapped to a 2D Gaussian distribution N ( μ , Σ ) . Specifically, the center coordinates determine the mean vector μ = [ c x , c y ] T , and the box dimensions define the covariance matrix Σ = diag ( w 2 4 , h 2 4 ) . Based on this Gaussian representation, the second-order Wasserstein distance between the predicted box N p and the ground truth box N g is calculated (Equation (8)), then normalized via an exponential function (Equation (9)), and finally constructed into the NWD Loss function (Equation (10)):
W 2 2 N p , N g = c x p , c y p , w p 2 , h p 2 T c x g , c y g , w g 2 , h g 2 T 2 2
V NWD N p , N g = exp W 2 2 ( N p , N g ) n
L NWD = 1 V NWD N p , N g
where
cx, cy—bounding box center coordinates (x,y);
w, h—width and height;
n—scaling constant (typically target average size).
NWD Loss evaluates bounding box position and shape more accurately through Wasserstein distance measurement, particularly suitable for multi-scale object detection and demonstrating superior robustness in small target detection.

2.2. Cascaded Visual-Semantic Processing Framework

2.2.1. EasyOCR Module Architecture and Advantages

The precisely segmented text boxes output by the electricity meter detection module are fed into the EasyOCR text recognition module. EasyOCR [24] is a deep learning tool capable of efficiently recognizing various printed characters, particularly suitable for electricity meter digit recognition tasks.
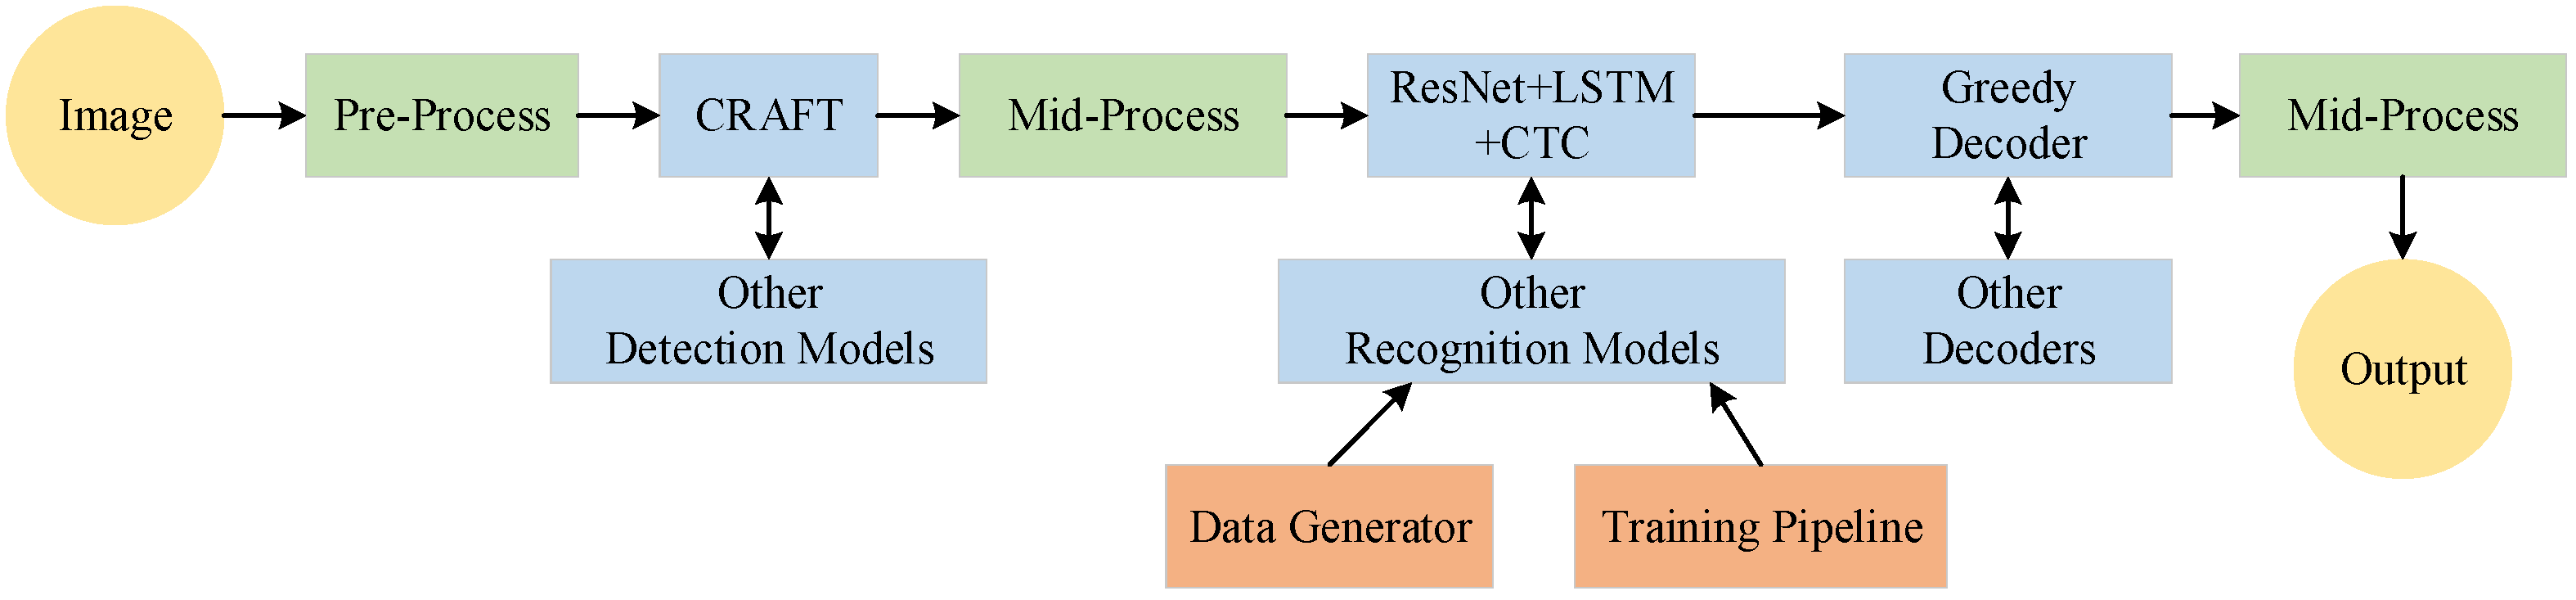
As shown in Figure 5, EasyOCR’s workflow consists of three steps: CRAFT text detection → ResNet/VGG feature extraction → LSTM + CTC sequence recognition.
EasyOCR employs the Character Region Awareness for Text Fusion (CRAFT) algorithm for text detection. CRAFT accurately detects text regions of arbitrary shapes by predicting the area of each character and the connections between characters. The algorithm utilizes multi-scale feature fusion technology to adapt to text of varying sizes and orientations in complex scenes. The detection results are output as bounding boxes, serving as input for text recognition.
After text region detection is completed, EasyOCR’s text recognition module processes the detected text regions. It uses a convolutional neural network (CNN) to extract features from the text regions, employing ResNet and VGG networks to capture high-level features:
X res = ResNet ( X ) , X vgg = VGG ( X )
where X is the input image, and Xres and Xvgg are the features extracted using ResNet and VGG, respectively.
Next, a recurrent neural network (RNN) is used to model the text sequence. The RNN captures contextual information in the sequence through memory units (e.g., LSTM, CTC). The LSTM network captures temporal dependencies between characters:
Y = LSTM ( X res ) = LSTM ( X vgg )
where Y represents the token sequence obtained from the LSTM network.
The CTC algorithm is employed to align and decode the character sequence:
Recognized   Text = CTC ( Y )
Finally, a fully connected layer and Softmax function classify each character, outputting the recognition result. For digit recognition tasks, the character categories are 0–9.

2.2.2. Integration of EasyOCR with Domain-Specific Format Rules

To ensure high recognition accuracy, domain-specific format rules are established based on the industry standard for electricity meter digit display (“5 fixed integer digits + 2 decimal digits”) (taking GB/T 17215-2018 as an example for Chinese meter). These rules define the legal space for digit sequences as follows:
L = { d 1 d 2 d 3 d 4 d 5 . d 6 d 7 | d i { 0 , , 9 } }
When EasyOCR outputs S Σ 7 ( Σ = { 0 , , 9 } ) and S L   S L , the format-based auto-correction process is triggered:
First, the validity of the raw S Σ 7 ( Σ = { 0 , , 9 } ) output by EasyOCR is verified. Then, a decimal point is inserted at the standardized position to ensure uniform output format, and numerical rationality is validated using:
V ( S ) = { 0 s 99 } { v ( S ) v h i s t 0.2 v h i s t }
where v ( ) is the numerical conversion function for readings.
This paper integrates the improved YOLOv10n electricity meter detection module with EasyOCR, first locating the meter region, then recognizing the reading, and finally post-processing the EasyOCR output using domain-specific format rules to rectify common errors such as missing decimal points.

2.3. Summary of the Cascaded Framework

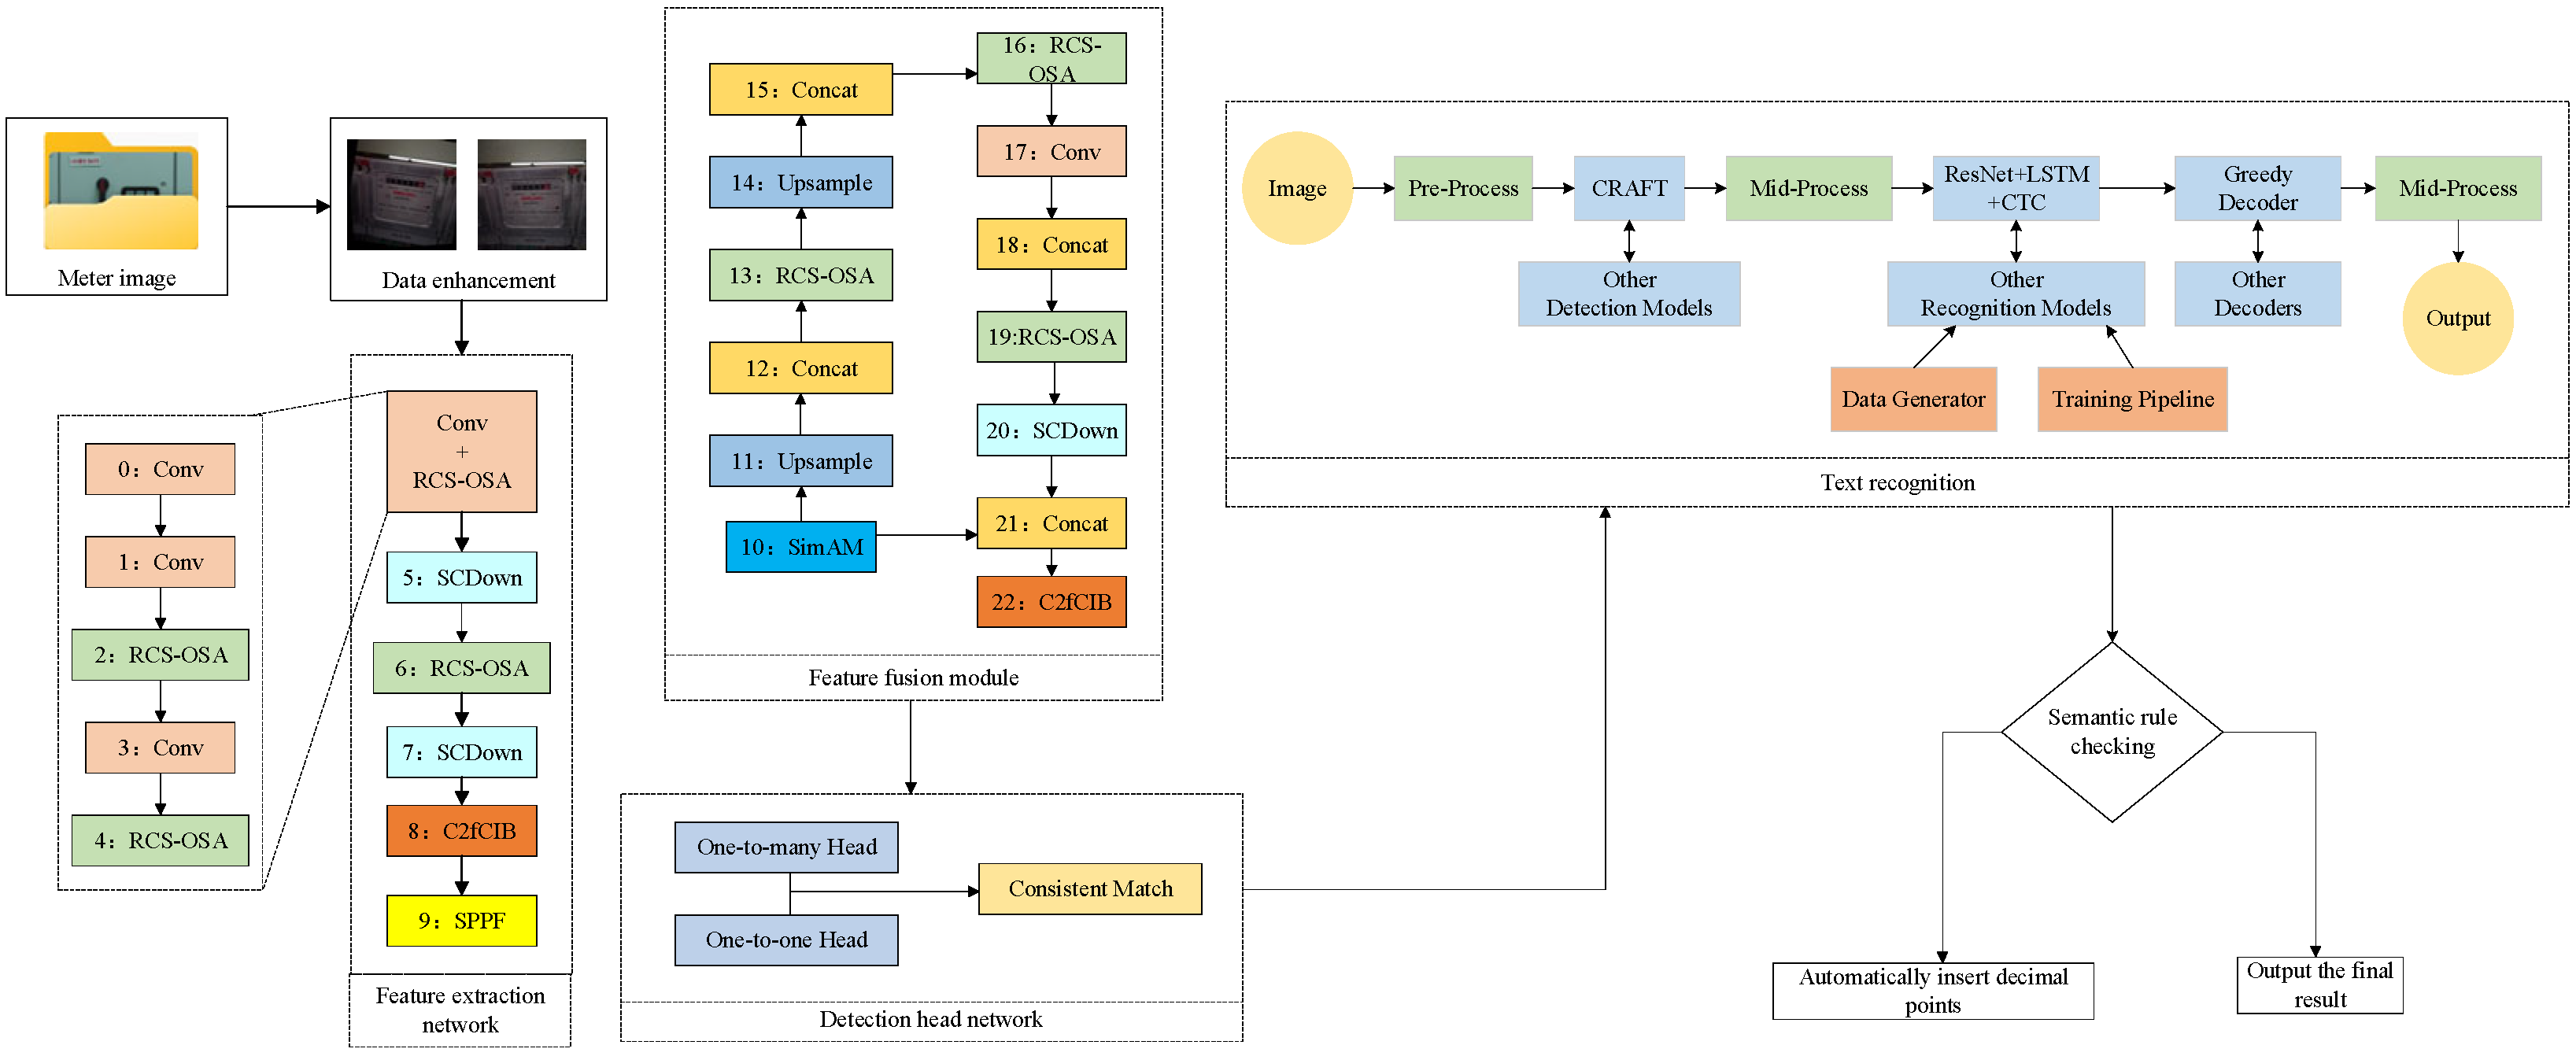
The model achieves full-process optimization through cascaded visual-semantic processing: First, the improved YOLOv10n (Section 2.1) detects the meter region from complex scenes. Second, EasyOCR (Section 2.2.1) recognizes digit strings from the cropped meter image. Third, domain-specific format rules based on GB/T 17215-2018 (Section 2.2.2) automatically rectify common errors, such as missing decimal points, and validate numerical rationality.
As illustrated in Figure 6, this cascaded design re-establishes the visual-semantic symmetry of meter readings, completing the entire recognition pipeline from raw image to standardized digital output.

2.4. Dataset Construction and Data Augmentation

The initial dataset consists of 260 electric meter images, each annotated with bounding boxes around the meter and its reading. The accompanying annotation label files for each image contain detailed coordinates of the target region bounding boxes.
For dataset preprocessing, all images were resized to a standard resolution of 640 × 640 pixels to ensure consistency across the dataset. The CVAT tool was employed to annotate the bounding boxes of the meter regions, facilitating model training.
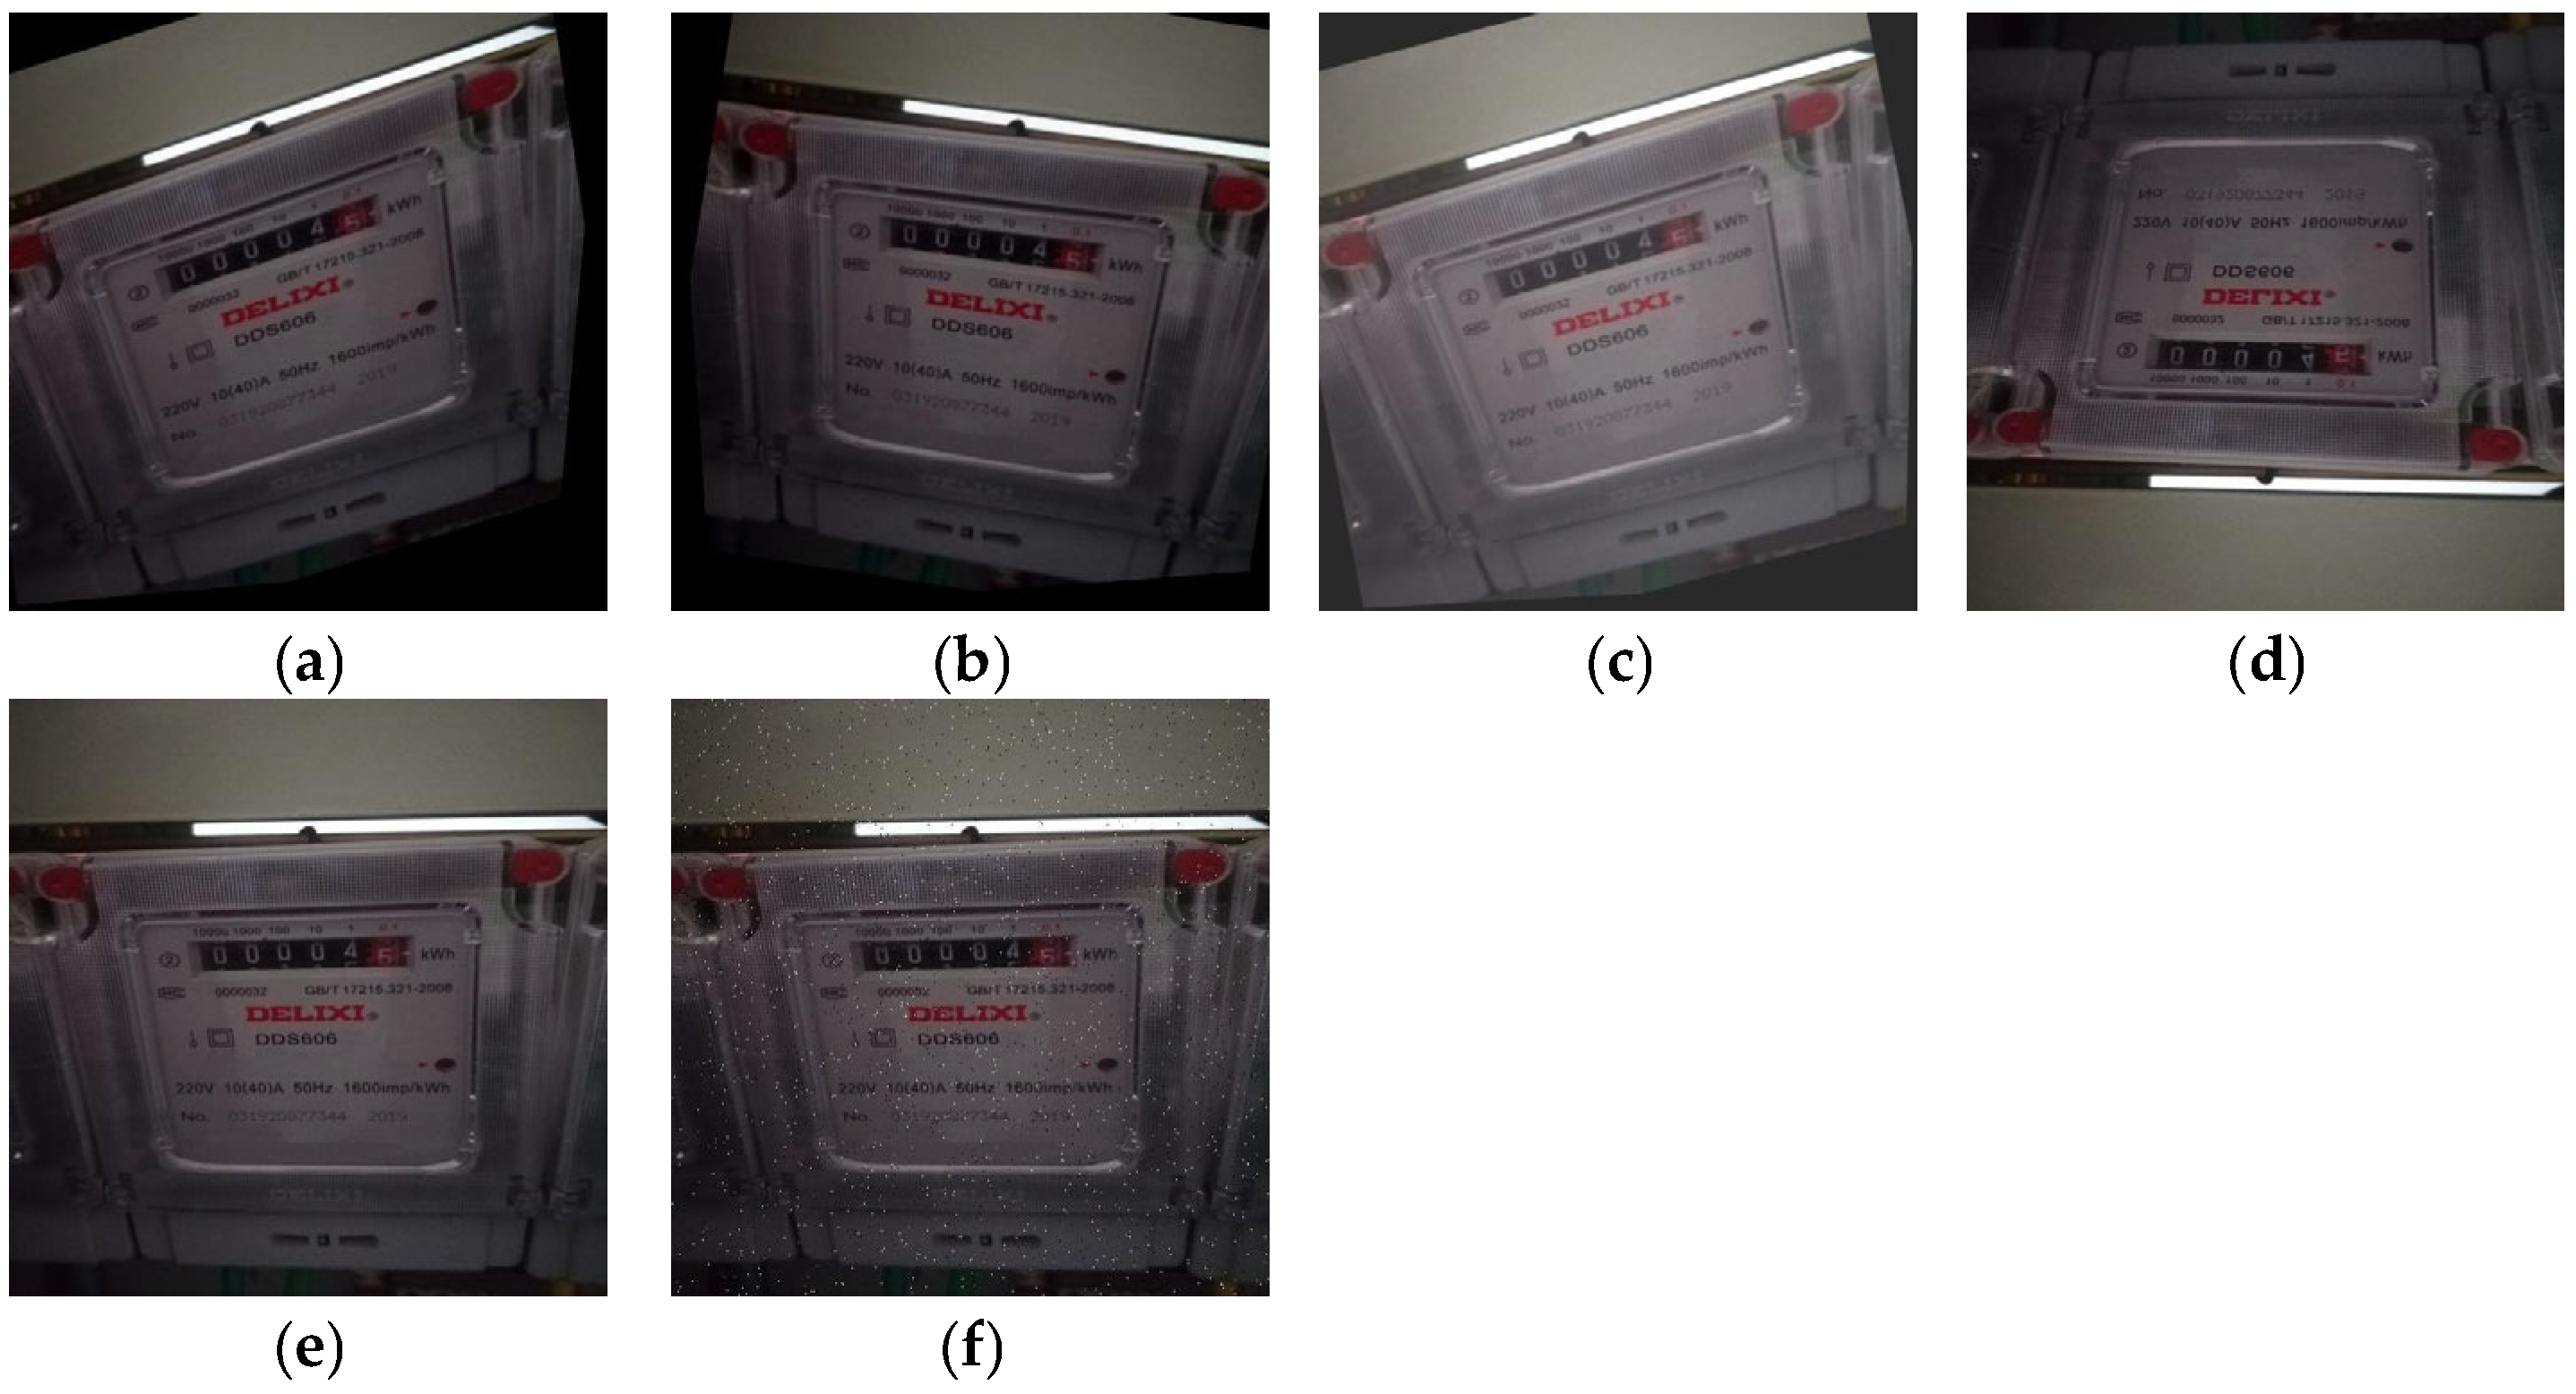
To enhance the model’s ability to discern target features, this study adopted a multimodal data augmentation strategy to improve generalization performance in complex scenarios. Using the Roboflow platform, the original annotated dataset was subjected to transformations such as rotation, shearing, blurring, noise addition, brightness adjustment, and flipping. These methods were randomly combined, expanding the dataset from the original 260 images to 1735 after augmentation. The effects of data augmentation are illustrated in Figure 7, where the transformed images retain the validity of the original annotations while significantly increasing background complexity and target morphology diversity. This approach forces the model to learn more discriminative feature representations by generating realistic interference, rather than memorizing specific patterns in the training set. Our dataset encompasses electricity meters from 8 different mainstream manufacturers, covering 6 common display formats such as LCD digital and mechanical roller displays. These images were captured across real-world environments, including indoor distribution boxes, dust-covered aging panels, and complex wiring scenarios. This quantitative diversity ensures that the model learns robust features applicable to various inspection conditions.

2.5. Evaluation Metrics

The evaluation metrics for YOLO-series object detection models typically include precision, recall, F1 score, and mean Average Precision (mAP).
Precision: The proportion of correctly predicted positive samples out of all samples predicted as positive.
p r e c i s i o n = T P T P + F P
Here, TP (True Positive) denotes correct positive predictions, where the model accurately identifies the target, while FP (False Positive) represents incorrect positive predictions, where the model mistakenly labels non-target regions as targets.
Recall: The proportion of correctly identified actual positive samples out of all actual positive samples. Here, FN (False Negative) denotes false negative predictions, where the model fails to detect actual targets.
R e c a l l = T P T P + F N
Mean Average Precision (mAP): The average precision (AP) is calculated for each class, and the mean is taken across all classes.
m A P = 1 C c = 1 C A P c
Here, C represents the total number of classes, and APc is the average precision for the i-th class.
In this study, mAP@0.5 is selected as the primary metric because the detection stage aims to provide a sufficient Region of Interest (RoI) for subsequent OCR. An IoU threshold of 0.50 ensures that the digits are fully captured; conversely, stricter thresholds (e.g., mAP@0.5:0.95) might lead to overly tight bounding boxes that risk truncating digit edges, thereby degrading recognition accuracy.

3. Experiment and Results

3.1. Experimental Environment

To validate the effectiveness of the proposed method, a unified testing platform was established with the specifications detailed in Table 1.
To ensure the technical rigor and reproducibility of the performance evaluation, all inference speeds (FPS) were measured under standardized conditions: a batch size of 1 and an input resolution of 640 × 640 pixels on the RTX 3090 GPU. Furthermore, a GPU warm-up procedure was implemented to ensure the stability of the recorded hardware performance. This involved pre-inference processing of 50 images prior to data collection, allowing the GPU to reach and maintain its steady-state clock frequency. This protocol minimizes experimental error caused by initial hardware latency or frequency scaling, ensuring that the reported efficiency metrics accurately reflect the model’s real-time operational capacity.

3.2. Result Analysis

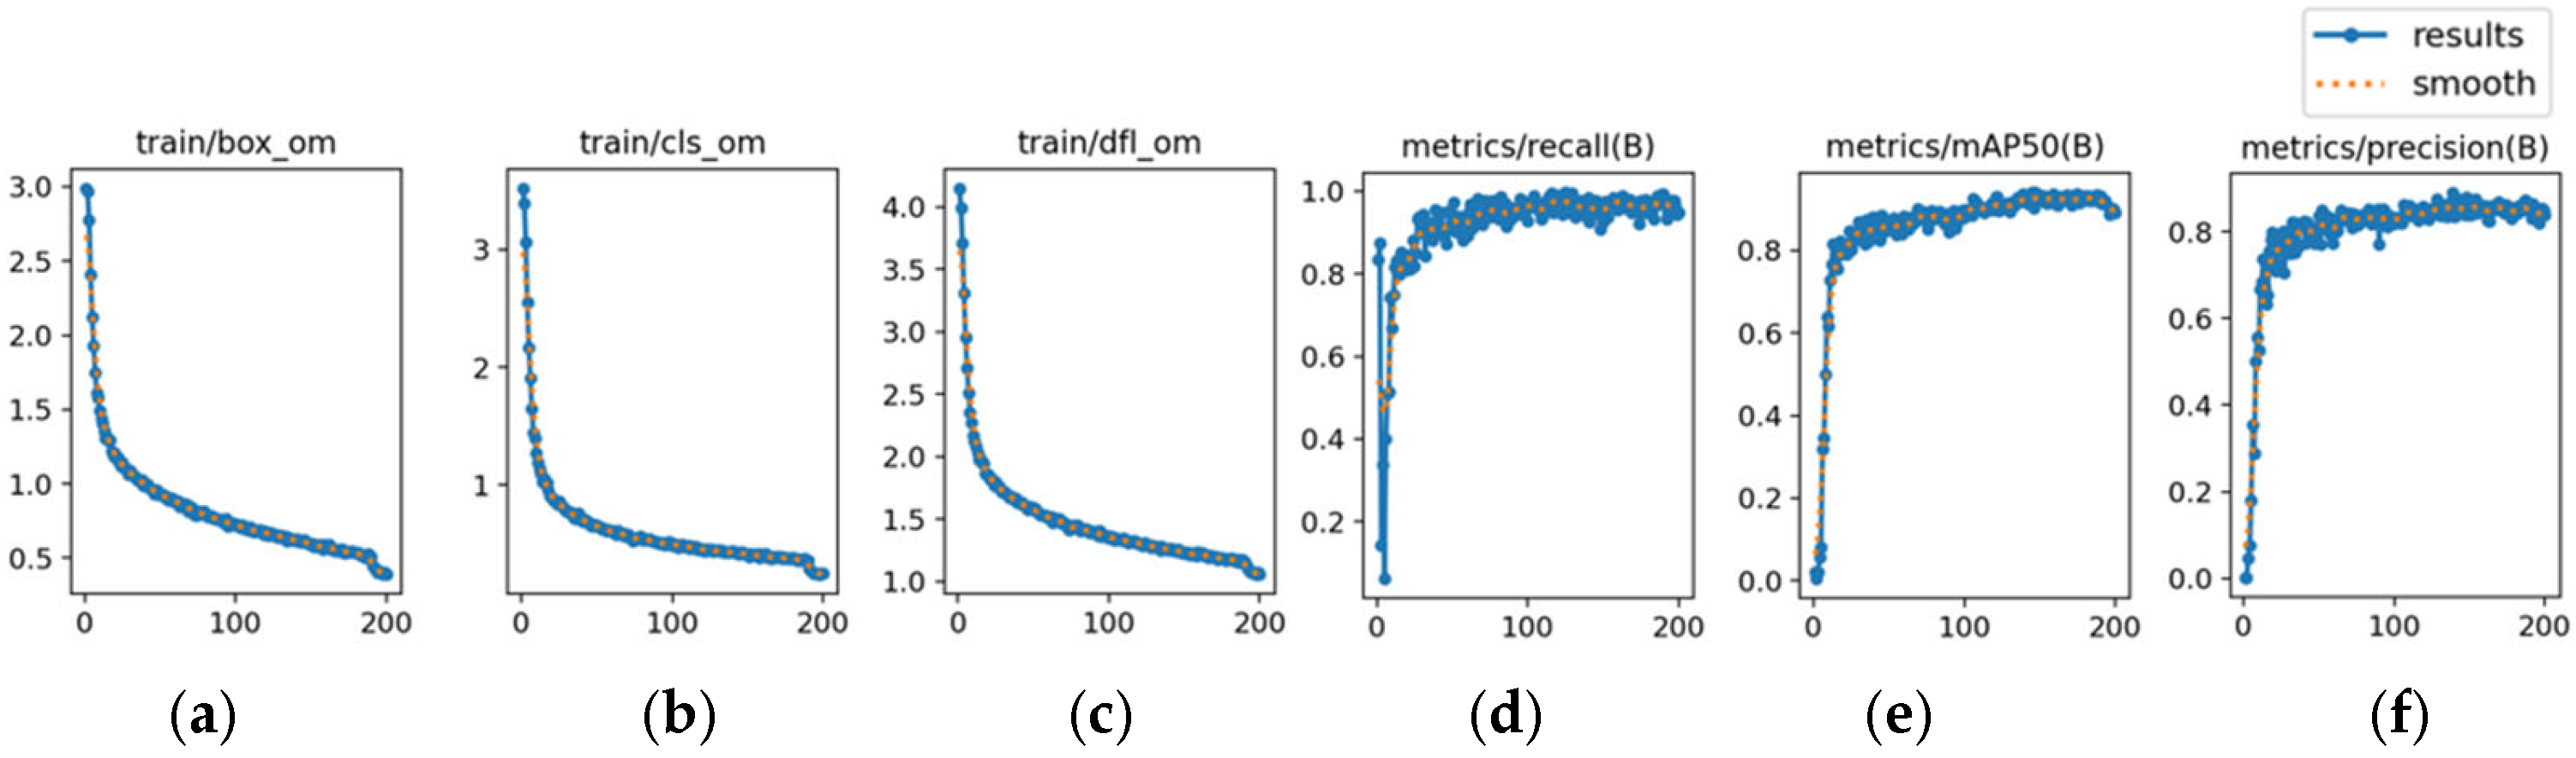
The model was trained on the augmented dataset, with the results shown in Figure 8. The experiments indicate that the model achieved convergence within 200 epochs; thus, the training cycle was set to 200. The results demonstrate that all three loss curves exhibited a continuous decline before stabilizing. The loss values decreased rapidly within the first 50 epochs. The recall curve rose quickly before plateauing, eventually maintaining a high value close to 1, indicating that the model effectively identifies true positives with minimal false negatives (FN). Both mAP50 and precision rose rapidly and remained at high, stable levels. Ultimately, the model achieved excellent convergence, with significant reductions in bounding box regression, classification, and distribution focal loss, while recall, mAP50, and precision all reached high levels.
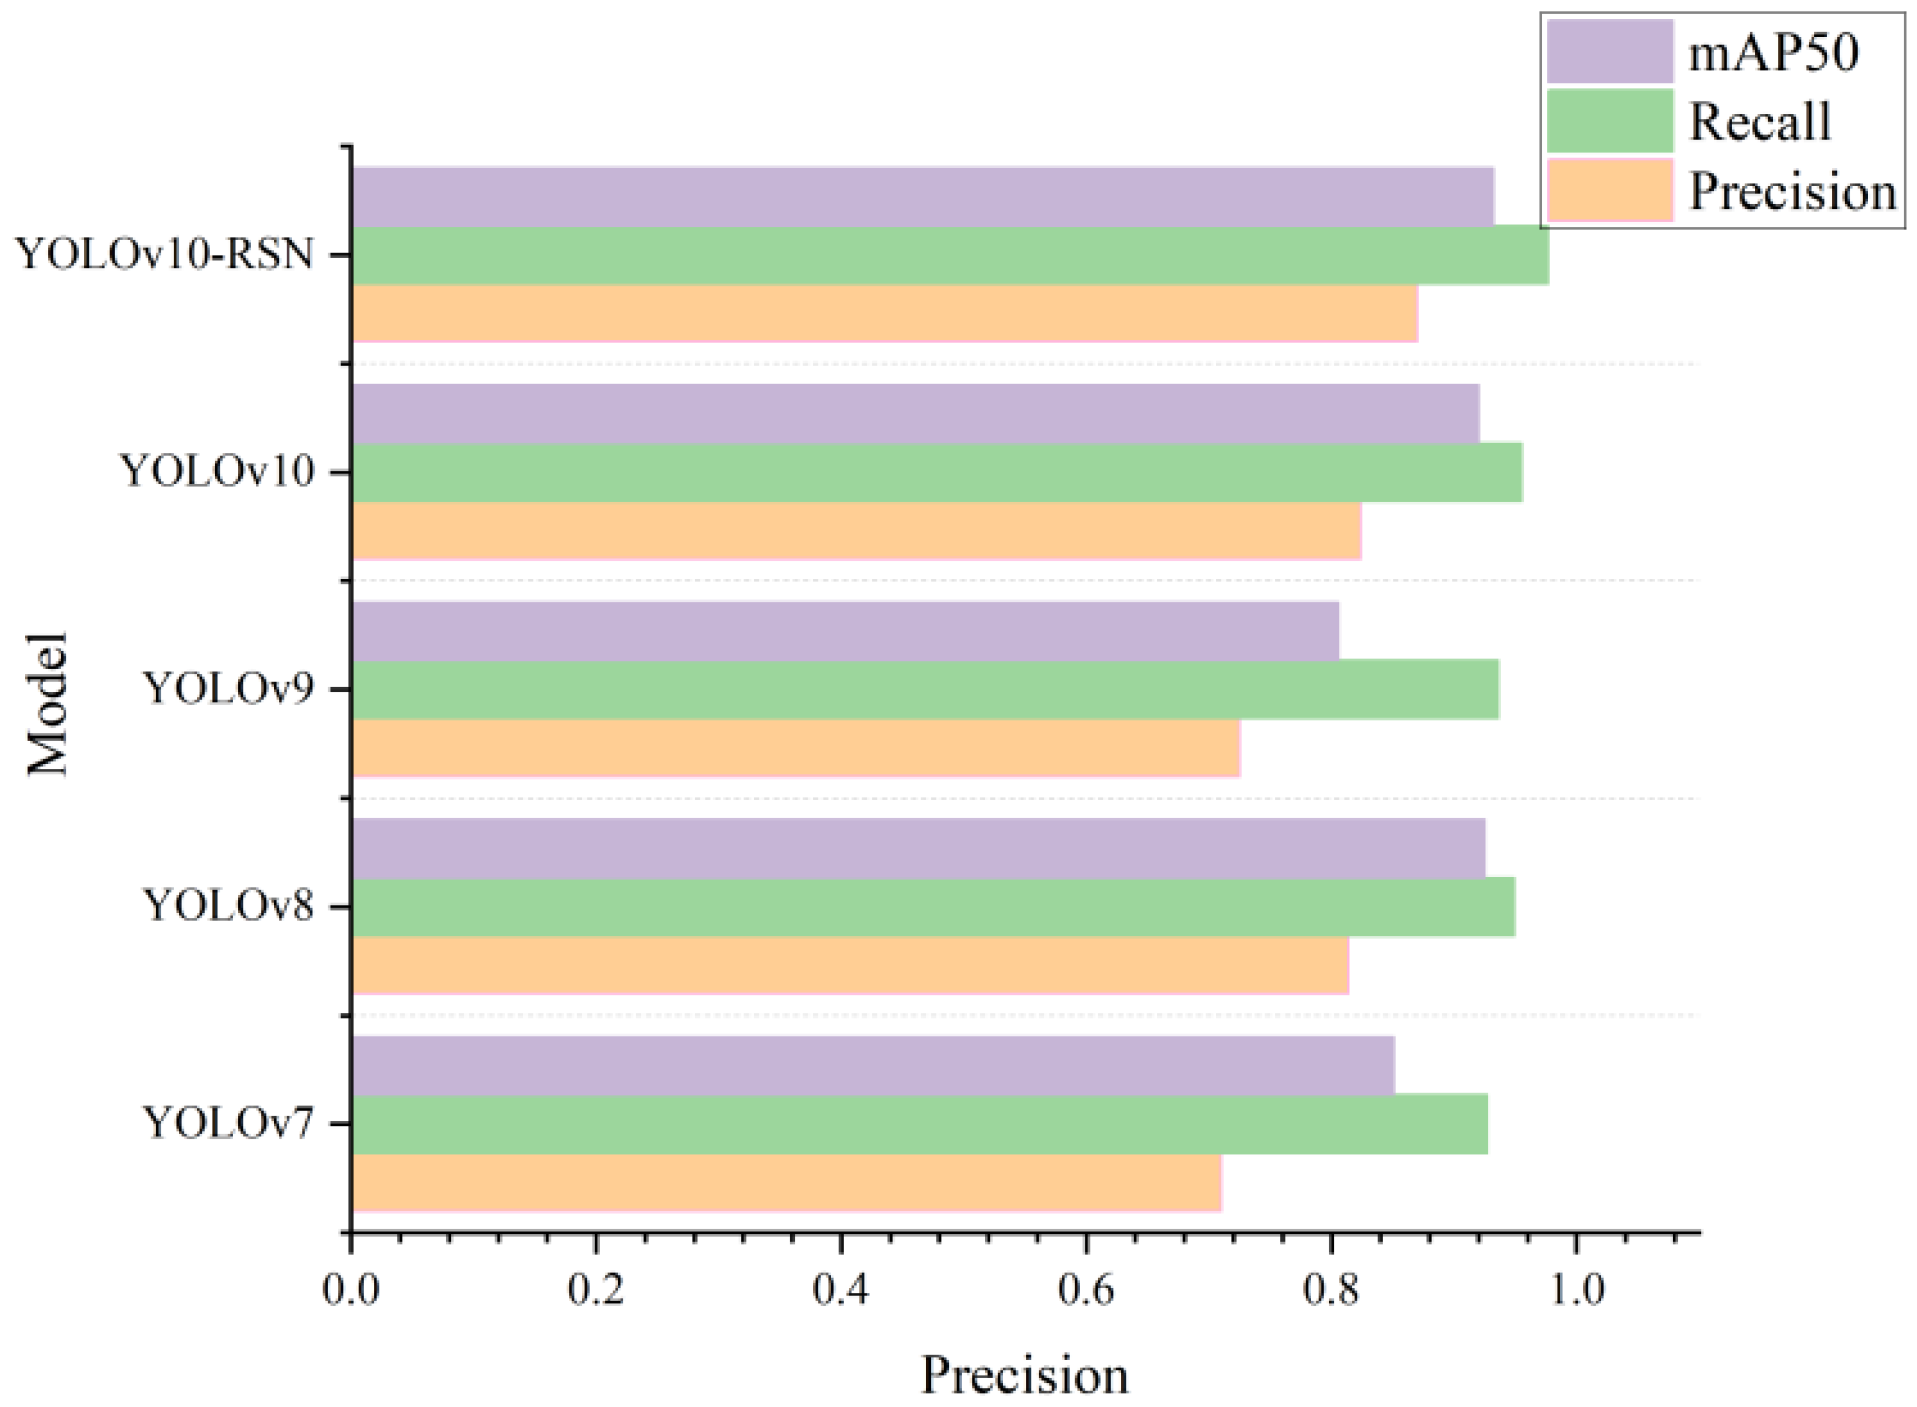
To further validate the effectiveness of the improved algorithm, comparative experiments were conducted, pitting YOLOv10-RSN against YOLOv10, YOLOv9, YOLOv8, and YOLOv7. To ensure a fair and rigorous comparison, all models in this experiment were initialized with their official COCO pre-trained weights and subsequently fine-tuned on our augmented electricity meter dataset under identical hyperparameter settings. The results are presented in Table 2 and Figure 9.
The experimental evaluation of detection models revealed significant differences among the tested models. In comparison, the proposed improved algorithm exhibited superior performance metrics: the model achieved a precision of 0.87, representing a 5.58% improvement over YOLOv10n (0.824); a recall of 0.977, a 2.3% increase over YOLOv10n (0.955); and an mAP50 of 0.932, a 1.30% enhancement over YOLOv10n. In terms of inference speed, the model achieved 116 FPS, a 12.66% improvement over YOLOv10n. Overall, this joint optimization scheme significantly improves detection accuracy while maintaining real-time performance, making it an ideal solution.
A longitudinal comparison of successive YOLO model generations reveals a continuous optimization trend from YOLOv7 to YOLOv10-RSN. Notably, YOLOv8 achieved a major breakthrough over YOLOv7, improving precision by 14.65% and mAP50 by 8.70%. While YOLOv9 increased recall to 0.936, its precision and mAP50 saw noticeable declines. The latest YOLOv10 series reestablished performance benchmarks, with the base version surpassing all previous models. Particularly noteworthy is that YOLOv10-RSN achieved comprehensive improvements over the original YOLOv7: a 22.54% increase in precision, a 5.39% boost in recall, a 9.52% rise in mAP50, and a 26.09% enhancement in FPS, fully validating the effectiveness of the algorithmic improvements.

3.3. Ablation Experiment

In order to verify the effectiveness of the improved YOLOv10-RSN algorithm, an ablation experiment was conducted, where ‘√’ indicates that the improved method was adopted, and ‘×’ indicates that it was not adopted. The experimental results are shown in Table 3.
Analysis of the table shows that Model 1, which is YOLOv10 incorporating RCSOSA, improved both mean average precision and accuracy while slightly reducing detection frame rate. This indicates that the Reparameterized Convolution Single-Shot Aggregation (RCSOSA) module enhances detection performance by strengthening feature interaction, improving precision metrics without compromising inference speed due to its optimized structure. Model 2, integrating SimAM, improved average precision and accuracy at a slight cost to inference speed, demonstrating that the attention-based feature optimization module enhances detection accuracy through adaptive feature calibration while maintaining a reasonable balance between precision and speed. Model 3, employing NWD Loss, improved precision, recall, and mAP50 while increasing FPS by 6.60%, proving that the Normalized Wasserstein Distance Loss significantly enhances small-object detection via distribution matching without additional computational overhead. While Model 4 yields a slightly lower mAP50 (0.926) compared to Model 1 (0.927), this 0.001 difference is negligible and falls within typical training variability. Importantly, Model 4 achieves higher Precision and Recall (0.858 and 0.972, respectively, versus 0.838 and 0.966 for Model 1), indicating a tangible improvement in detection quality. The marginal decrease in mAP50 likely arises from NWD Loss altering the confidence score distribution compared to CIoU. Similarly, Model 5 (integrating SimAM and NWD Loss) exhibited comprehensive improvements, further indicating synergistic optimization effects between the modules. Ultimately, the full YOLOv10-RSN model, which integrates all three modules, attains the highest mAP50 of 0.932, confirming their synergistic effectiveness.
By integrating RCSOSA, SimAM, and NWD Loss, YOLOv10-RSN achieved a 5.58% increase in precision, a 2.30% boost in recall, a 1.30% rise in mAP50, and a 12.62% improvement in FPS. While Model 4 yields a slightly lower mAP50 of 0.926 compared to the 0.927 achieved by Model 1, this 0.001 difference is negligible and falls within typical training variability. Importantly, Model 4 achieves higher precision and recall scores of 0.858 and 0.972, respectively, outperforming the 0.838 and 0.966 obtained by Model 1. This indicates a tangible improvement in detection quality. The marginal decrease in mAP50 likely arises from NWD Loss altering the confidence score distribution compared to CIoU. Similarly, Model 5, which integrates SimAM and NWD Loss, exhibited comprehensive improvements, further indicating synergistic optimization effects between the modules. Ultimately, the full YOLOv10-RSN model, integrating all three modules, attains the highest mAP50 of 0.932, confirming their synergistic effectiveness.
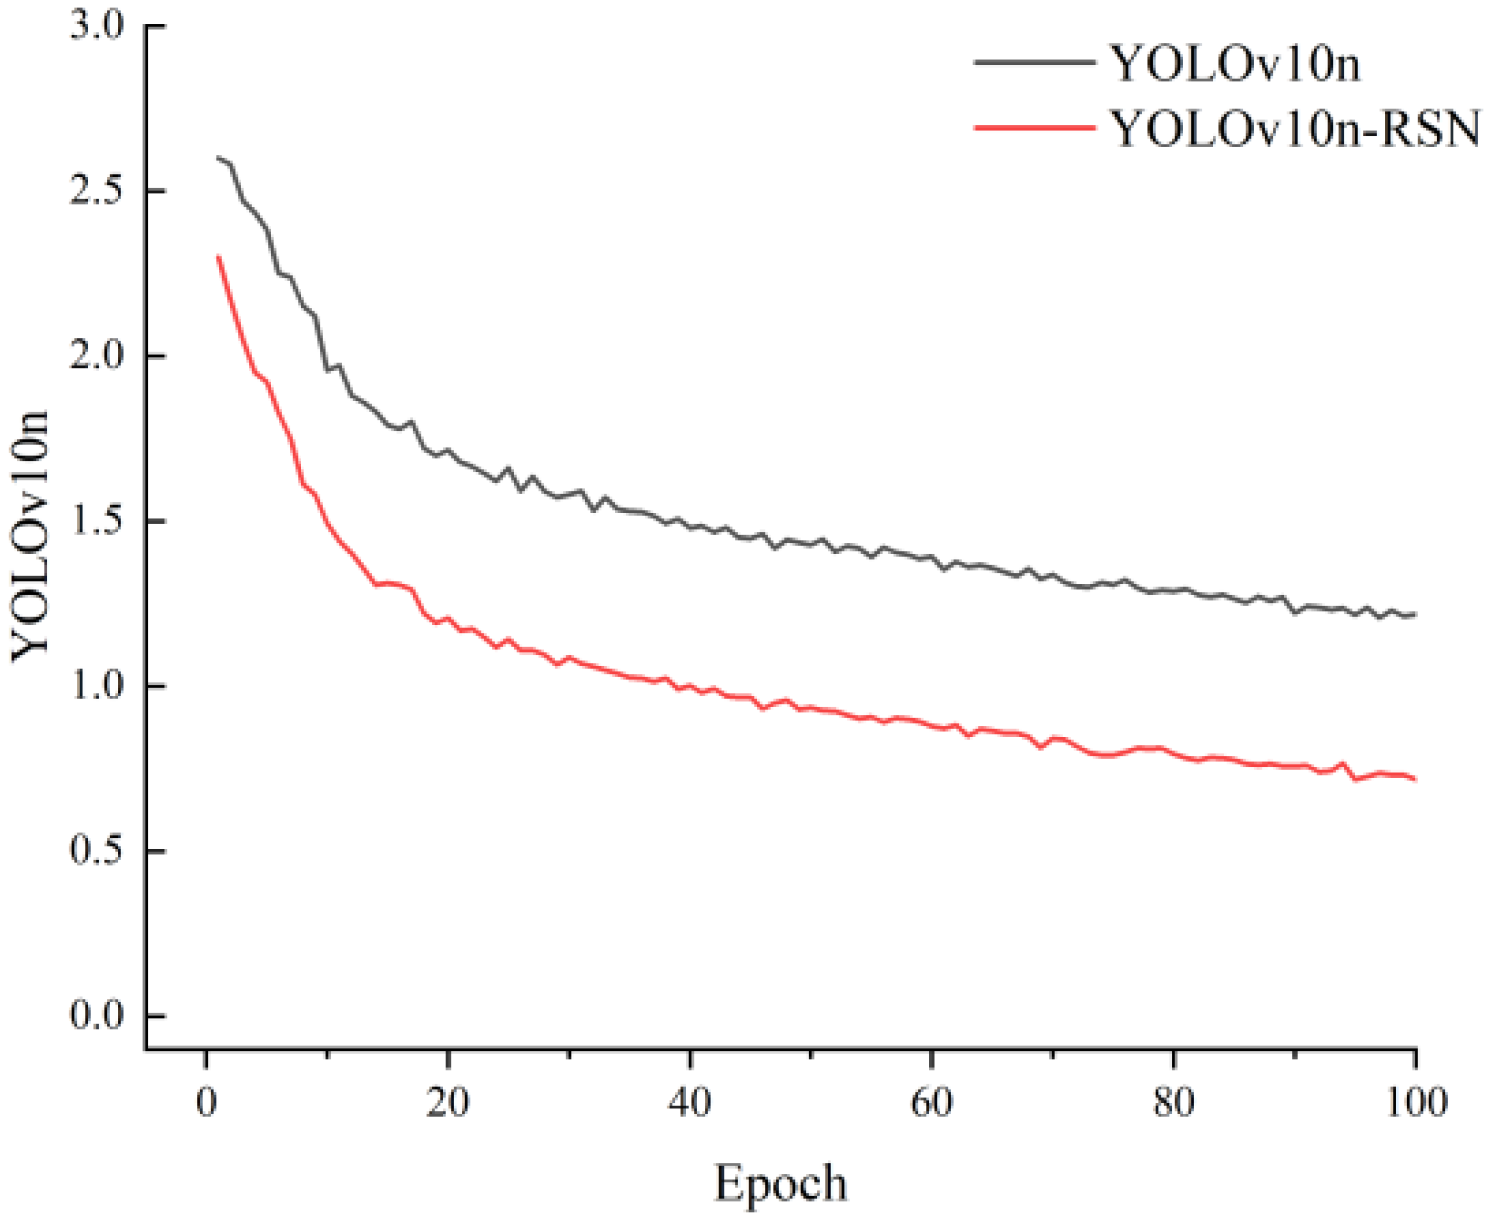
As shown in Figure 10, the loss curves of the baseline YOLOv10n algorithm and the improved algorithm with CIoU replaced by NWD Loss demonstrate distinct characteristics during the training process. The improved model exhibits faster convergence speed and lower loss values, particularly within the first 20 epochs, where the loss decreases rapidly and stabilizes. In contrast, the YOLOv10n model shows slower loss reduction, with the final converged loss value significantly higher than that of the improved model. These results indicate that the improved model achieves superior performance in loss optimization.

3.4. Visualization Results

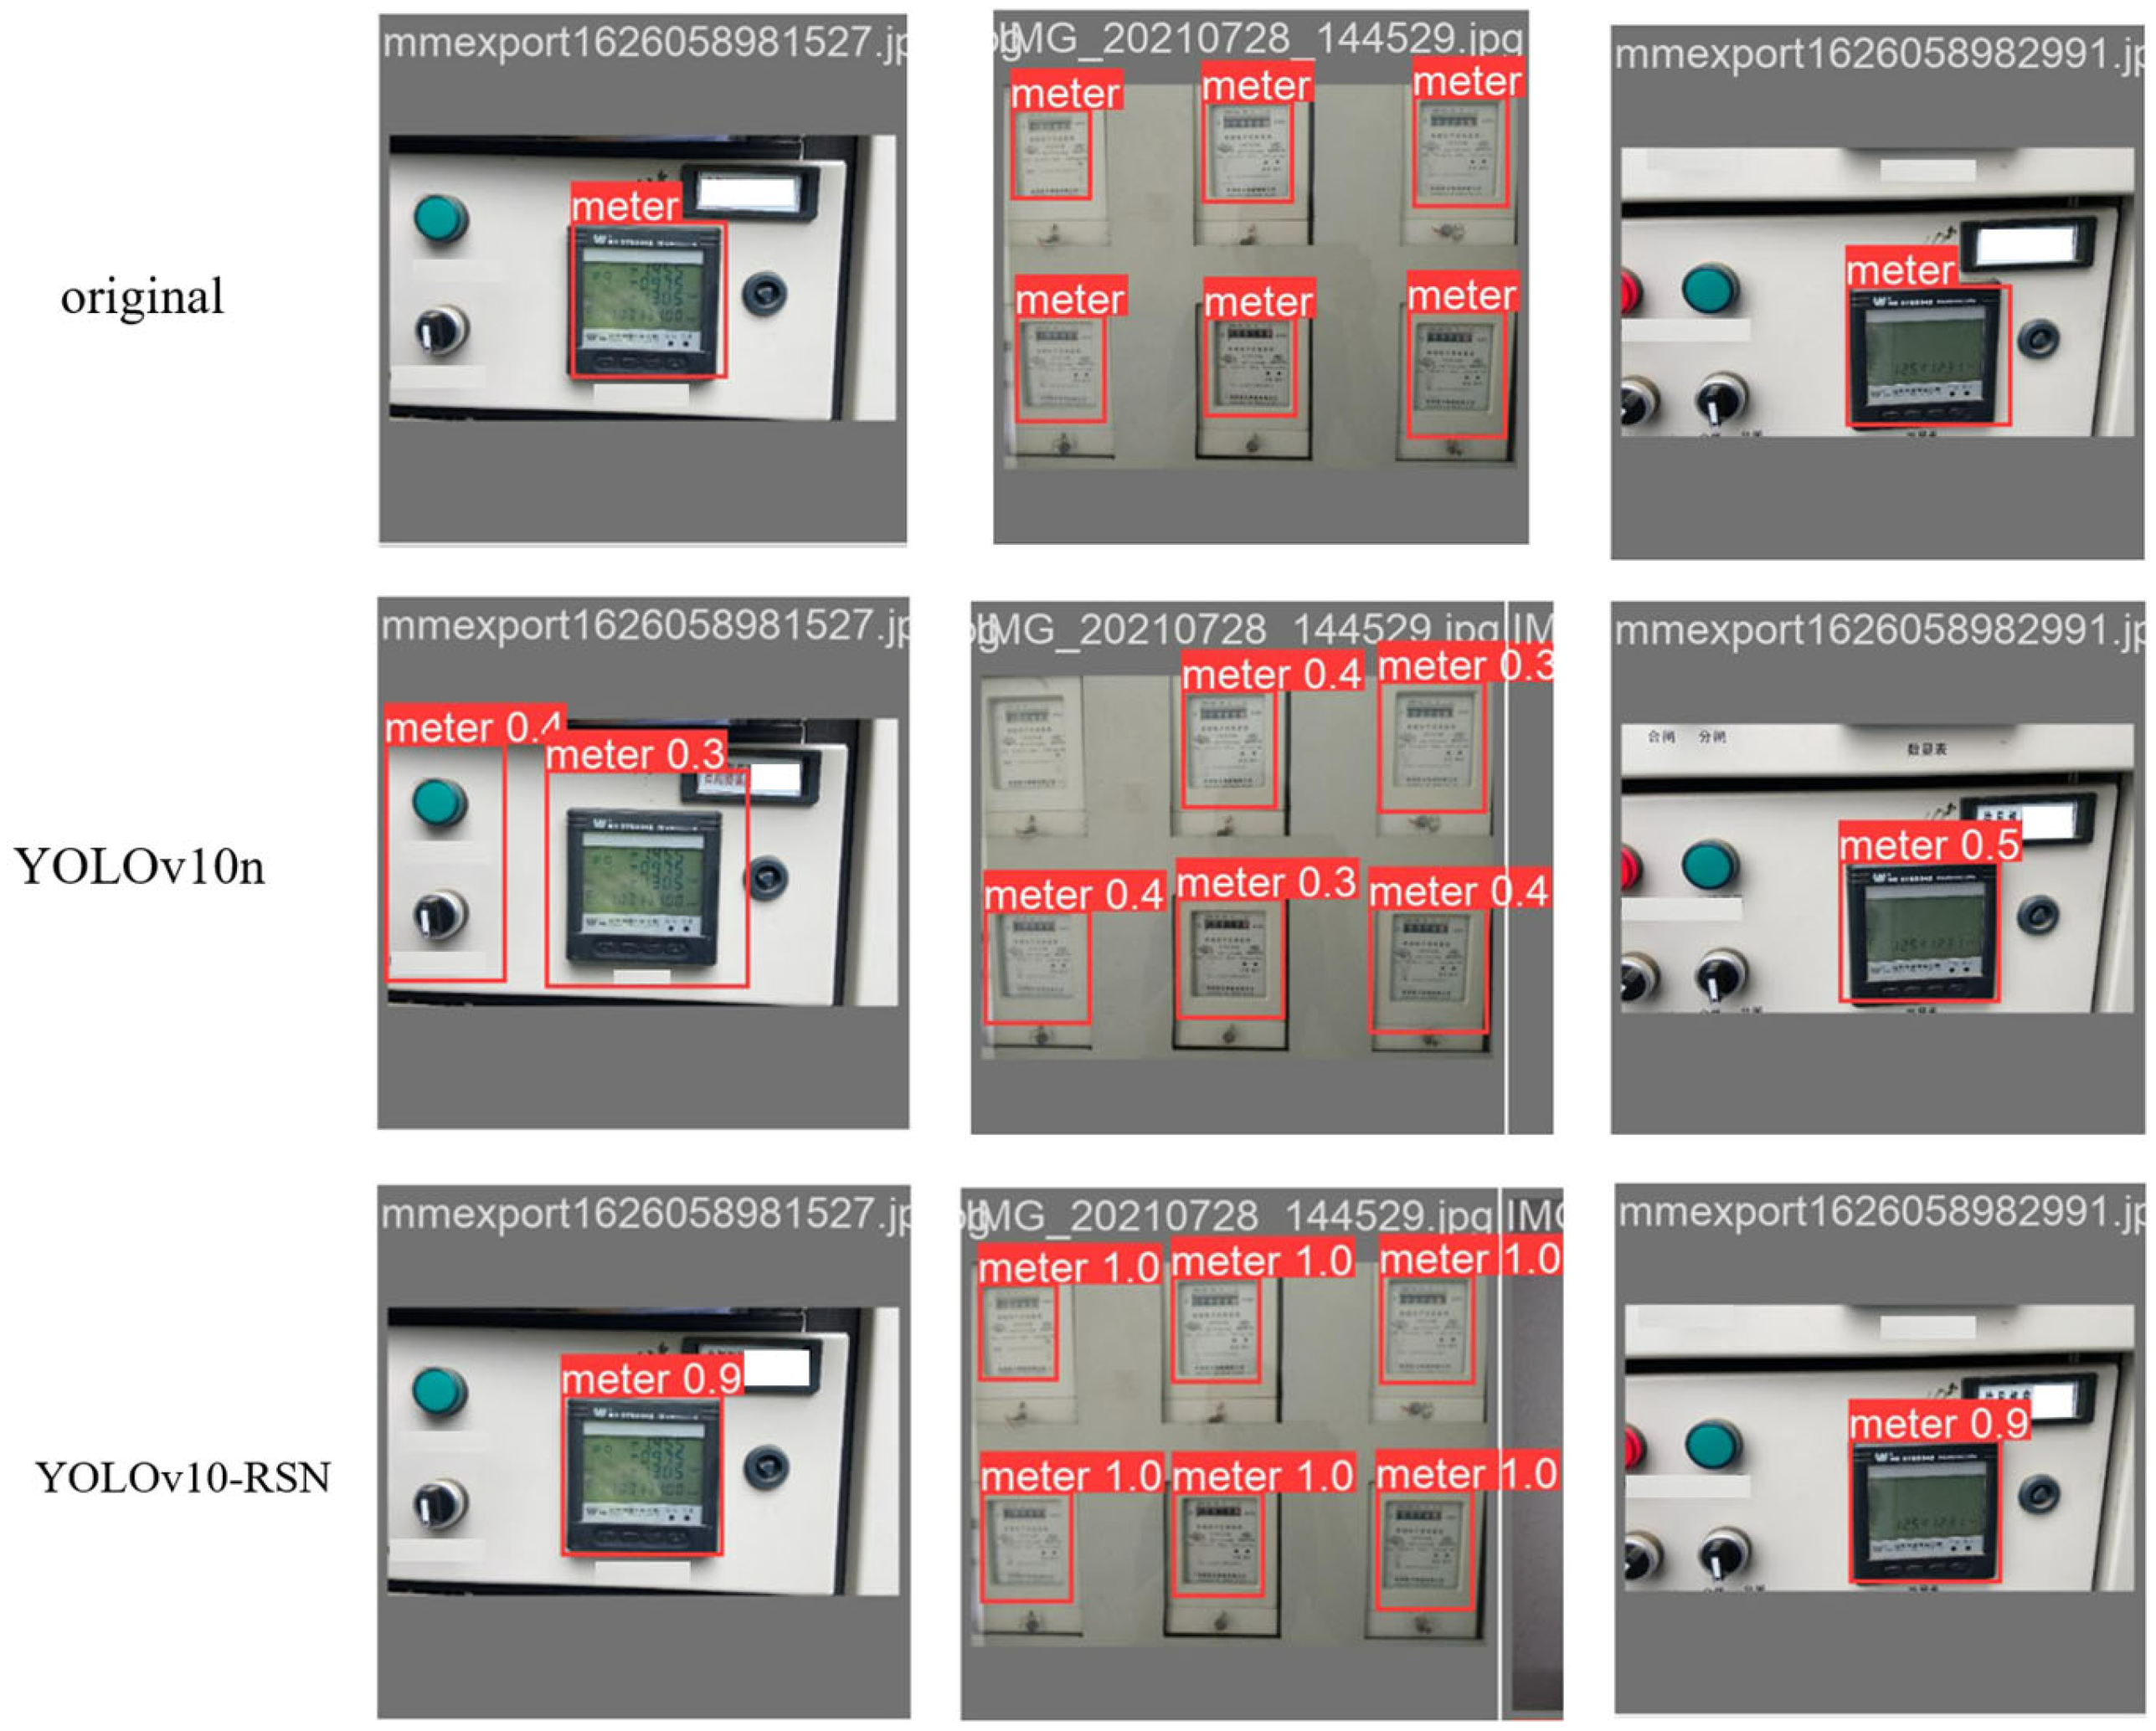
To validate the advantages of the improved algorithm in electric meter detection, comparative tests were conducted. During detection, rectangular bounding boxes were used to mark targets, with confidence scores displayed beside the labels. In Figure 11, the first row shows the original annotated images, the second row displays the detection results of YOLOv10n, and the third row presents the results of the improved YOLOv10n.
Figure 11 illustrates the detection results before and after network improvement. The first column reveals false detections in YOLOv10n, while the improved YOLOv10n achieves accurate detection, effectively reducing false positives and enhancing detection accuracy. The second and third columns demonstrate that the improved YOLOv10n achieves higher detection precision than the baseline, indicating improved accuracy in electric meter detection.

3.5. Semantic Rule Library Validation Experiment

To address the unique numerical representation standards in the power industry, this study constructed a semantic rule library based on the GB/T 17215-2018 standard, establishing a complete processing pipeline from visual recognition to semantic parsing.
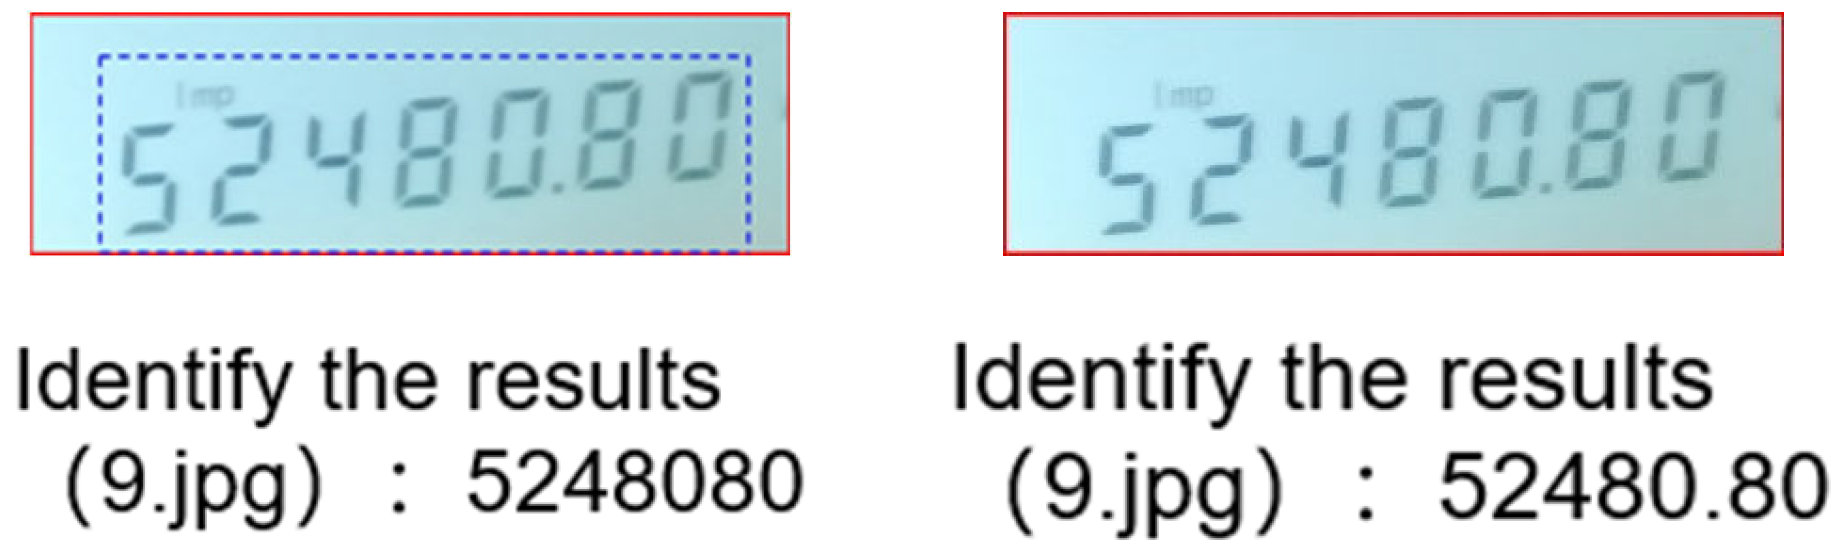
Extensive experimental tests show that after processing by the semantic rule library, the original OCR results are automatically corrected to comply with power industry standards. Additionally, numerical rationality verification ensures that the output values fall within the valid measurement range of electric meters. Partial experimental results are shown in Figure 12. The rule library significantly improves the standardization and usability of recognition results.

4. Conclusions

This paper proposes a cascaded recognition method combining YOLOv10-RSN with visual-semantic cascaded processing. In the backbone network, the C2f module is replaced with a reparameterized convolution single-shot aggregation module based on channel rearrangement, and the original PSA module is substituted with the SimAM parameter-free 3D attention mechanism. These modifications strengthen the model’s feature extraction capability and improve its sensitivity to target spatial locations.
A correctly displayed meter recognition algorithm integrating electric meter image information and semantic information is proposed to extract numerical data from electric meters. Building upon image information, the EasyOCR text recognition module is combined with a power industry semantic rule library. Following the GB/T 17215-2018 standard, the recognition results undergo format validation and automatic correction to resolve issues such as missing decimal points and digit misalignment.
Experimental results demonstrate that the improved model achieves an mAP50 of 93.2%, representing a 1.3% improvement over the original network, and an FPS of 116, a 12.62% increase compared to the baseline. The proposed method exhibits clear advantages over classical object detection algorithms and effectively meets the requirements for electric meter digit recognition tasks. This approach provides a high-precision, high-efficiency solution for intelligent power inspection.
While our targeted data augmentation strategy improves model robustness, a limitation of this work is the lack of validation on a large-scale external dataset due to data access restrictions. Future research will focus on collaborating with industrial partners to verify the model’s generalization capabilities across a wider range of unseen power equipment datasets.

Author Contributions

Conceptualization, Y.L.; methodology, Y.L.; software and validation, Y.L.; formal analysis, Y.B.; investigation, Y.B.; resources, data curation, writing—original draft preparation, Y.B.; writing—review and editing, visualization, Y.L. and Y.B.; supervision, project administration, funding acquisition, Y.L. All authors have read and agreed to the published version of the manuscript.

Funding

This research received no external funding.

Data Availability Statement

The dataset is available on request from the authors.

Conflicts of Interest

The authors declare no conflicts of interest.

References

  1. Zhang, R.; Yan, K.; Ye, J. Lightweight YOLO-v7 for Digital Instrumentation Detection and Reading. Comput. Eng. Appl. 2024, 60, 192–201. [Google Scholar]
  2. Liu, T.; Peng, F.; Lu, W.; Pan, J.; Zhang, W. Identification and detection of external risk factors for safety helmet wearing in smart grid based on YOLOv7. Electr. Meas. Instrum. 2024, 61, 42–48. [Google Scholar]
  3. Yang, Y.; Yang, S.; Li, C.; Wang, Y.; Pi, X.; Lu, Y.; Wu, R. Insulator defect detection under extreme weather based on synthetic weather algorithm and improved YOLOv7. High Volt. 2025, 10, 69–77. [Google Scholar] [CrossRef]
  4. Li, S.; Li, J. Condition monitoring and diagnosis of power equipment: Review and prospective. High Volt. 2017, 2, 82–91. [Google Scholar] [CrossRef]
  5. Liu, Y.; Ji, X.; Pei, S.; Ma, Z.; Zhang, G.; Lin, Y.; Chen, Y. Research on automatic location and recognition of insulators in substation based on YOLOv3. High Volt. 2020, 5, 62–68. [Google Scholar] [CrossRef]
  6. Sriram, S.; Aburvan, P.; TP, A.K.; Vijayaraj, N.; Murugan, T. Enhanced yolov10 framework featuring dpam and dalsm for real-time underwater object detection. IEEE Access 2025, 13, 8691–8708. [Google Scholar] [CrossRef]
  7. Li, M.; Song, C. YOLOv10-CMR: An Improved Small Object Detection Algorithm Based on YOLOv10. In Proceedings of the 2025 5th International Conference on Neural Networks, Information and Communication Engineering (NNICE), Guangzhou, China, 10–12 January 2025; pp. 85–93. [Google Scholar]
  8. Kanagarathinam, K.; Sekar, K. Text detection and recognition in raw image dataset of seven segment digital energy meter display. Energy Rep. 2019, 5, 842–852. [Google Scholar] [CrossRef]
  9. Zhang, S.; Wan, J.; Wang, H.; Guan, M.; Yang, B.; Li, F. Convolutional neural network based on attention mechanism for reading recognition of pointer-type meter images. Electr. Power Autom. Equip. 2022, 42, 218–224. [Google Scholar]
  10. Cai, Z.; Wei, C.; Yuan, Y. An efficient method for electric meter readings automatic location and recognition. Procedia Eng. 2011, 23, 565–571. [Google Scholar] [CrossRef][Green Version]
  11. Sultana, U.; Bilal, S.; Naqvi, S.H.A.; Iqbal, R. Smart OCR application for meter reading. Eng. Proc. 2022, 20, 25. [Google Scholar]
  12. Zhang, Y.; Yang, S.; Su, X.; Shi, E.; Zhang, H. Automatic reading of domestic electric meter: An intelligent device based on image processing and ZigBee/Ethernet communication. J. Real-Time Image Process. 2016, 12, 133–143. [Google Scholar] [CrossRef]
  13. Shuo, H.; Ximing, Y.; Donghang, L.; Shaoli, L.; Yu, P. Digital recognition of electric meter with deep learning. In Proceedings of the 2019 14th IEEE International Conference on Electronic Measurement & Instruments (ICEMI), Changsha, China, 1–3 November 2019; pp. 600–607. [Google Scholar]
  14. Sharma, A.K.; Kim, K.K. Lightweight CNN based meter digit recognition. J. Sens. Sci. Technol. 2021, 30, 15–19. [Google Scholar] [CrossRef]
  15. Yang, Z.; Gao, W.; Chen, G.; Yu, J.; He, B.; Ye, L. Self-Modified Dynamic Domain Adaptation for Industrial Soft Sensing. IEEE Trans. Autom. Sci. Eng. 2026, 23, 4679–4692. [Google Scholar] [CrossRef]
  16. Jiang, X.; Lin, Z.; Kong, X.; Chen, J.; Song, Z.; Xie, M. Enhancing Few-Shot Surface Defect Recognition via Pre-Trained Large Generative Models. IEEE Trans. Autom. Sci. Eng. 2025, 23, 643–654. [Google Scholar] [CrossRef]
  17. Wang, M.; Liang, Z.; Huang, H.; Liang, A.; Sun, H.; Zhao, Y. Research and application of yolov10 algorithm based on image recognition. In Proceedings of the 5th International Conference on Artificial Intelligence and Computer Engineering, Wuhu, China, 8–10 November 2024; pp. 535–540. [Google Scholar]
  18. Kang, M.; Ting, C.M.; Ting, F.F.; Phan, R.C.-W. RCS-YOLO: A fast and high-accuracy object detector for brain tumor detection. In Proceedings of the International Conference on Medical Image Computing and Computer-Assisted Intervention, Vancouver, BC, Canada, 8–12 October 2023; pp. 600–610. [Google Scholar]
  19. Hu, J.; Shen, L.; Sun, G. Squeeze-and-Excitation Networks. In Proceedings of the IEEE Conference on Computer Vision and Pattern Recognition, Salt Lake City, UT, USA, 18–23 June 2018; pp. 7132–7141. [Google Scholar]
  20. Woo, S.; Park, J.; Lee, J.Y.; Kweon, I.S. CBAM: Convolutional Block Attention Module. In Proceedings of the European Conference on Computer Vision (ECCV), Munich, Germany, 8–14 September 2018; pp. 3–19. [Google Scholar]
  21. Yang, L.; Zhang, R.Y.; Li, L.; Xie, X. SimAM: A simple, parameter-free attention module for convolutional neural networks. In Proceedings of the International Conference on Machine Learning, Virtual, 18–24 July 2021; pp. 11863–11874. [Google Scholar]
  22. Zhang, J.; Wei, X.; Zhang, L.; Yu, L.; Chen, Y.; Tu, M. YOLO v7-ECA-PConv-NWD detects defective insulators on transmission lines. Electronics 2023, 12, 3969. [Google Scholar] [CrossRef]
  23. Wang, J.; Xu, C.; Yang, W.; Yu, L. A normalized Gaussian Wasserstein distance for tiny object detection. ISPRS J. Photogramm. Remote Sens. 2022, 187, 429–442. [Google Scholar]
  24. Prethi, K.N.A.; Palanisamy, S.; Nithya, S.; Salau, A.O. Edge based intelligent secured vehicle filtering and tracking system using YOLO and EasyOCR. Int. J. Intell. Transp. Syst. Res. 2025, 23, 330–353. [Google Scholar] [CrossRef]
Figure 1. Block diagram of the improved YOLOv10n-RCSOSA-SimAM structure.
Symmetry 18 00694 g001
Figure 2. RCS architecture. RepVGG during training phase (left). RepConv during inference (right).
Symmetry 18 00694 g002
Figure 3. RCSOSA architecture.
Symmetry 18 00694 g003
Figure 4. Schematic diagram of SimAM attention mechanism.
Symmetry 18 00694 g004
Figure 5. EasyOCR Workflow.
Symmetry 18 00694 g005
Figure 6. System Architecture Diagram.
Symmetry 18 00694 g006
Figure 7. Examples of Data Augmentation. (a) Cropping; (b) Rotation; (c) Brightness Adjustment; (d) Flipping; (e) Blurring; (f) Noise Addition.
Symmetry 18 00694 g007
Figure 8. Model training results: (ac) Changes in loss during training; (d,e) Model recall and average precision; (f) Model accuracy.
Symmetry 18 00694 g008
Figure 9. Precision, Recall, and mAP50 comparison of different object detection models.
Symmetry 18 00694 g009
Figure 10. Training loss convergence comparison.
Symmetry 18 00694 g010
Figure 11. Visualization comparison of electricity meter detection results.
Symmetry 18 00694 g011
Figure 12. Comparison of partial recognition results on electric meter images without (left) and with (right) the semantic rule library.
Symmetry 18 00694 g012
Table 1. Experimental Environment Configuration.
ConfigurationParameter
CPUIntel(R) Xeon(R) Platinum 8369B
GPURTX 3090
Deep Learning FrameworkPyTorch 1.13.1 with CUDA 11.6
Operating SystemWindows 11
Programming LanguagePython 3.9
Table 2. Comparative experiments.
ModelPrecisionRecallmAP@0.5FPS
YOLOv70.7100.9270.85192
YOLOv80.8140.9490.925105
YOLOv90.7250.9360.806101
YOLOv100.8240.9550.920103
YOLOv10-RSN0.870.9770.932116
Table 3. Results of the ablation experiment.
ModelRCSOSASimAMNWD LossPrecisionRecallmAP50FPS
YOLOv10n×××0.8240.9550.920103
Model 1××0.8380.9660.927106.1
Model 2××0.8320.960.924102.3
Model 3××0.8450.9710.929109.8
Model 4×0.8580.9720.926109.3
Model 5×0.8520.9680.930110
YOLOv10-RSN0.870.9770.932116
Disclaimer/Publisher’s Note: The statements, opinions and data contained in all publications are solely those of the individual author(s) and contributor(s) and not of MDPI and/or the editor(s). MDPI and/or the editor(s) disclaim responsibility for any injury to people or property resulting from any ideas, methods, instructions or products referred to in the content.