Abstract
The development of technology has influenced changes in agricultural production. Farmers are increasingly using modern devices and machinery that provide valuable information, and to manage this information effectively, it is necessary to use specialized applications. This research aims to evaluate various applications and determine which one is most suitable for small- and medium-sized farmers to adopt in precision agriculture. This research employed expert decision-making to determine the importance of criteria and evaluate applications using linguistic values. Due to the presence of uncertainty in decision-making, an interval type-2 fuzzy (IT2F) set was used, which addresses this problem through the support of a membership function. This approach allows for the display of uncertainty and imprecision using an interval rather than a single exact value. This enables a more flexible and realistic representation of ratings, leading to more confident decision-making. These membership functions are formed in such a way that there is symmetry around the central linguistic value. To use this approach, the SiWeC (simple weight calculation) and CORASO (compromise ranking from alternative solutions) methods were adapted. The results of the IT2F SiWeC method revealed that the most important criteria for experts are data accuracy, efficiency, and simplicity. The results of the IT2F CORASO method displayed that the A3 application delivers the best results, confirmed by additional analyses. This research has indicated that digital tools, in the form of applications, can be effectively used in small- and medium-scale precision agriculture production.
1. Introduction
The advancement of technology is influencing changes across all sectors of production. Production methods are evolving, and modern technology is increasingly being integrated into these processes [1]. Technology is also reshaping how agricultural production is conducted [2]. In agriculture, tools such as drones, sensors, and automated machinery are now being used. To improve agricultural productivity, it is essential to process field data and make timely, informed decisions [3]. Such equipment enables the implementation of precision agriculture, allowing actions to be taken exactly when needed, improving productivity, and reducing resource consumption.
To support these advancements, appropriate software applications are required. These applications collect real-time data from the field and provide farmers with suggestions on which measures to implement in the context of precision farming. Furthermore, such applications help manage agricultural resources to optimize production outcomes. As the cost of modern agricultural equipment decreases, it becomes accessible not only to large-scale producers but also to smaller farmers. Additionally, many agricultural applications are now more affordable or even available for free in some cases [4].
With the rise of artificial intelligence, agricultural applications are becoming increasingly “smart,” capable of autonomously handling specific tasks. For example, certain applications can now manage irrigation systems [5], enabling the creation of optimal conditions for crop production. However, the wide range of available applications on the market presents a challenge, as farmers need to select the one best suited to their specific needs.
The adoption of applications in agriculture has become necessary due to the increasing use of various technological devices. These devices collect large volumes of data using sensors or other mechanisms, and this data must be processed efficiently [6]. Each application must be tailored to the needs of farmers to ensure more effective outcomes. The selection process should incorporate multiple goals that the chosen application needs to fulfill. This decision-making process can be supported by multi-criteria decision-making (MCDM) methods, which enable the evaluation of alternatives from different perspectives and enable trade-offs between competing objectives [7].
In practice, it is often the case that a single application cannot meet all requirements. Therefore, a compromise must be made to select the application that most effectively satisfies the key goals. This process becomes even more complex when the decision maker (DM) lacks complete information about the available applications. Ideally, the DM should have the opportunity to use each application for a period of time to evaluate its advantages and disadvantages before making a final choice. However, time limits the practicability of this approach. Additionally, financial limitations, such as subscription costs, may prevent farmers from testing multiple applications. As a result, farmers tend to choose the application that best suits their needs based on the information at hand. This introduces a degree of uncertainty into the decision-making process [8].
To address incomplete information, the classical fuzzy approach can be applied, allowing decisions to be made using imprecise evaluations in the form of linguistic values. However, since classical fuzzy logic does not fully account for uncertainty, other approaches have been developed to extend it. One such approach used in this study is based on the fuzzy type-2 set.
The fuzzy type-2 set enables the modeling of uncertainty in the membership function, distinguishing it from the classical fuzzy set, where ratings are fine-tuned using a fixed membership function [9]. In a fuzzy type-2 set, membership values are defined within the interval [0, 1], enabling the representation of more complex decisions by incorporating uncertainty into the process. This approach is instrumental in scenarios with incomplete data. Also, the fuzzy type-2 set can be enhanced by introducing intervals into the process of defining the membership function [10]. This enhancement provides additional flexibility in incorporating the subjective assessments of the DM. The main advantage of the interval type-2 fuzzy (IT2F) set lies in its ability to capture uncertainty and subjectivity more effectively [11]. This results in more precise and reliable outcomes. Furthermore, this method allows for a more comprehensive aggregation of experts’ ratings, resulting in more stable and realistic outcomes. Unlike other approaches, such as Pythagorean fuzzy or hesitant fuzzy, which represent uncertainty through the membership function [12,13], the IT2F approach embeds uncertainty within the upper and lower bounds of the interval. This enables a more robust representation of uncertainty, especially in situations with high variability or uncertainty in decision-making.
By introducing intervals, the variability of decision-relevant data can be managed better, leading to the creation of more realistic and dynamic decision-making models [14]. Such a model is particularly well-suited where decision-making involves inherent uncertainty and subjectivity. This process requires considering a wide set of criteria to evaluate applications from various perspectives. As the number of criteria increases, it becomes difficult to gather complete information for each application, further complicating the decision-making process. Therefore, it is essential to adopt advanced fuzzy set approaches that account for uncertainty and vagueness. This study adopts the IT2F approach for this very reason. By applying the IT2F method, a more flexible and reliable framework for evaluating applications can be established, which is important in a dynamic and unpredictable market environment.
Applications can help farmers improve productivity, reduce costs, and promote the optimal use of resources, all key goals in precision agriculture. Additionally, this research aims to improve the application selection process by using the IT2F approach to enhance the adoption of digital technologies in agriculture. Based on this motivation, the central research question of this study is as follows: How can the selection of agricultural applications be optimized under conditions of uncertainty using the IT2F approach?
The primary objective of this study is to enhance the efficiency of application selection in agriculture by developing new IT2F-based approaches, thereby enabling the digital transformation of agricultural production and promoting the broader adoption of precision agriculture. The specific objectives of this research are as follows:
- -
- To develop an IT2F-based methodology for application selection that incorporates uncertainty into the decision-making process.
- -
- To identify key criteria necessary for the selection of applications in precision agriculture.
- -
- To improve the decision-making process in agriculture to ensure more objective application choices.
This research offers several key contributions. First, it provides a theoretical advancement in understanding the application of IT2F logic in decision-making. Additionally, new versions of methods tailored to this approach are being developed. Second, it supports the development of innovative decision-making models and methodologies that incorporate IT2F. Third, by identifying relevant applications, the study helps farmers enhance productivity, reduce costs, and optimize resource usage, improving the overall efficiency of precision agriculture. Fourth, the research promotes the adoption of digital tools in agriculture, contributing to the modernization of agricultural practices and helping address the challenges posed by climate change. Finally, this paper contributes to scientific knowledge by proposing new approaches to applying MCDM methods in agriculture. It provides guidelines for future research in precision agriculture, particularly in managing uncertainty within the decision-making process.
2. Materials and Methods
The fuzzy approach was first introduced by Zadeh [15], enhancing the decision-making process. This approach enables a subtle range of responses, where values can vary between [0, 1] [16]. Within this, rating limits are not sharply defined, allowing for the inclusion of imprecise data in the decision-making process [17]. However, in more complex scenarios involving subjective judgments, it often happens that DMs feel uncertain about their evaluations [18]. As a result, newer fuzzy-based methods have been developed to incorporate both uncertainty and imprecision into decision-making [19]. These methods aim to address the limitations of the traditional fuzzy approach.
IT2F allows higher-level modeling while maintaining the simplicity of the fuzzy logic framework [20]. A key advantage of IT2F lies in its use of interval membership functions, which adapt linguistic values typically used in evaluating criteria and alternatives, enabling greater variability in linguistic value usage. The grounds behind applying this approach to application selection in agriculture are that it allows for the inclusion of linguistic expressions, which are often easier to use, particularly when dealing with qualitative criteria where assigning precise numerical ratings can be challenging. Also, IT2F enables the parsing of linguistic evaluations using membership functions that span a broader range. In such cases, values of membership functions for bordering evaluations may overlap. This approach also addresses the issue of assigning exact membership functions within fuzzy sets, which can otherwise lead to an inaccurate representation of uncertainty [21].
In defining IT2F sets, two membership boundaries are established: the upper membership function () and the lower membership function () (Figure 1). As such, the extent of the membership function is considerably broader than in traditional fuzzy logic [22]. Each membership function is defined so that the first and fourth values represent the support, while the second and third values denote the core. The IT2F set A is formed using the following:
where and are elements of the trapezoidal type-2 fuzzy set, and are boundaries within the interval [0, 1].
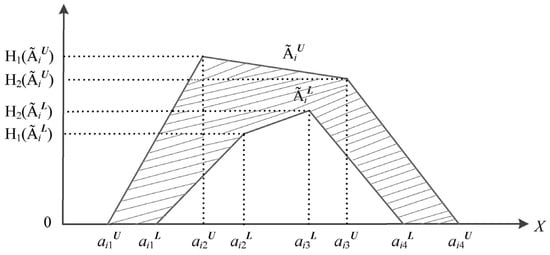
Figure 1.
Interval type-2 fuzzy set.
Given two sets and , the operations between them are as follows [23]:
These basic operations are applied in the development of SiWeC (simple weight calculation) and CORASO (compromise ranking from alternative solutions) methods, which will be used to determine the importance of criteria and rank the analyzed applications. These methods are chosen because they are relatively new and have not yet been extensively used in practice, nor have IT2F versions been previously developed. With this, the paper contributes by offering these new implementations.
2.1. IT2F SiWeC Method
The SiWeC method was designed to provide a simple tool for evaluating the weights of criteria based on assessments provided by DMs [24]. This method belongs to the category of subjective weight-determination techniques. It uses linguistic ratings provided by DMs, which are further evaluated. For the IT2F implementation, the traditional steps defined by Puška et al. [25] are adapted and extended:
Step 1. Determination of the importance of the criteria. DMs assess the importance of each criterion using linguistic values. In this study, a seven-level linguistic scale is used (Table 1). When defining the membership function for the first interval, symmetry is centered around the main value. At this stage, the supports add up to one, and the membership values are paired accordingly. In total, three pairs are created in this way. This symmetry will be illustrated with an example of the worst and best linguistic values. In this example, the supports for the worst linguistic value are (0, 0.1), while those for the best are (0.9, 1). The sum of the first support of the worst value and the last support of the best value equals one, and vice versa. Furthermore, the core of these linguistic values is equal to one. Using this symmetry, additional pairs are formed within this membership function and in the second interval. When determining the membership function, it is ensured that each higher value is assigned the corresponding higher value in the fuzzy number [26]. Starting from the central value, we attempted to apply an identical deviation for larger and smaller values. This means that as the value increases, the smaller value decreases by the same amount, maintaining the symmetry of the function. Applying this approach to defining the membership function guarantees that each linguistic value is given equal importance. If the membership function were asymmetric, it would imply that specific linguistic values are given more or less importance, which would reduce the importance of the evaluation of criteria and alternatives.

Table 1.
Criteria value scale.
Step 2. Transformation of the linguistic values into IT2F numbers using the defined membership functions (Table 1).
Step 3. Calculation of the standard deviation for each expert’s ratings () [27].
Step 4. Multiplication of the IT2F numbers by the standard deviation.
Step 5. Summarizing the weighted IT2F values for all criteria.
Step 6. Calculation of the criteria weights.
Compared to the fuzzy SiWeC method, these steps are different primarily due to the absence of a normalization step. This is because IT2F values already fall within the [0, 1] range, making normalization needless. Given that the maximum value of these interval fuzzy numbers is one, the fuzzy numbers would be divided by one, resulting in the same value [28]. With this outcome, there is no bias introduced by an uneven distribution of data.
2.2. IT2F CORASO Method
The CORASO method is designed to rank alternatives based on their deviation from ideal solutions, defined as either the maximum or minimum values for individual criteria across all alternatives, first applied by Puška et al. [29] to rank agricultural drones. The CORASO method was chosen because previous research showed it had a strong correlation with other methods, confirming the results obtained with this approach [30]. This method allows consideration of deviations between the best and worst values among the alternatives [31]. Its flexibility and simplicity are additional characteristics. Furthermore, it was selected due to its promotion within the scientific community, aiming to diversify the range of methods used in decision-making. This sets CORASO apart from other similar ranking methods.
Steps for IT2F-CORASO are as follows:
Step 1. To evaluate applications using the same linguistic values as in the SiWeC method.
Step 2. To convert linguistic values into IT2F numbers using the membership function (Table 1).
Step 3. To normalize IT2F numbers. In this step, it is first necessary to determine whether the values of the alternatives for individual criteria should be as large or as small as possible. In this way, it is determined whether normalization should be performed for benefit criteria or cost criteria.
Step 4. To determine ideal alternative solutions—maximum and minimum values for each criterion.
Step 5. To multiply normalized values, including ideal solutions, by criteria weights.
Step 6. To calculate summed scores for each alternative.
Step 7. To defuzzify the utility function using the centroid method, resulting in averaging values for both upper and lower limits of the IT2F number.
Step 8. To calculate the deviation from alternative solutions.
Step 9. To calculate the final CORASO values.
3. Case Study
Changes in agricultural production influence the use of different equipment and machinery to enhance productivity. To manage the data received from various types of equipment, it is necessary to use different applications to process data more efficiently and make informed decisions promptly. The choice of application presents a particular challenge for farmers who have not previously used such tools. These farmers often have no idea what specific applications can offer, which is why this study involved experts with significant experience in working with agricultural applications. Their task was to evaluate the applications that small- and medium-sized farmers could use most effectively in the Semberija region, located in northeastern Bosnia and Herzegovina. For that reason, experts with experience in agricultural production in Semberija were selected. Specifically, efforts were made to select experts with similar research focuses so they could contribute based on their expertise. Those employed at nearby agricultural research institutes were chosen, and among them, individuals with the most experience in agricultural applications and their functionalities were identified. A total of 14 experts were selected and invited to participate in the study. Out of the 14, eight agreed to participate. These experts were then sent a questionnaire via email. However, only six completed and returned the questionnaire, while two experts informed the researchers that they could not participate due to other commitments.
To evaluate the applications, it was necessary to define a set of criteria. A review of the literature revealed a wide range of criteria that could be used to assess agricultural applications. However, through further systematization and harmonization, the list was narrowed down to 15 criteria and afterward reduced to 10 to simplify the task for the experts (Table 2). The reduction was achieved using the Delphi method, where experts first identified the most important criteria for this decision-making problem. These criteria were then organized and sent back to the experts. After that, the experts selected from all these criteria those that were most important in their opinion and reduced the total number. After three rounds, only 10 criteria remained. Based on this selection, it was evident that most criteria were qualitative, except for the cost criterion. However, since this criterion covered all costs from purchase to implementation, it was also converted into a qualitative criterion—using linguistic (fuzzy) values in the evaluation process. Although all criteria could be quantified and measured, doing so would limit the research to a different approach, focusing on how easy the applications are to use. This would require obtaining all applications, testing them, and choosing the best based on performance. To keep costs down, publishers would need to be contacted and asked to provide applications for testing. Due to geographical limitations and the underdeveloped state of applications in this area, publishers from other countries would need to be approached.
Table 2.
Research criteria.
Once the evaluation criteria were selected, a set of applications also needed to be chosen. The main selection criterion was that the annual usage cost of each application should not exceed EUR 200 and that it should support data tracking from precision agriculture devices. This ensured the evaluation was appropriate for small- and medium-sized producers in Semberija. To avoid promoting any specific application or presenting others in a negative light, all applications were labeled from 1 to 10, and their features were presented in general values. Another reason for using coded names is that the study relies on subjective expert assessments, which may vary depending on the experts involved, as well as the resulting rankings. Therefore, an application may be ranked differently under different conditions.
The characteristics of the selected applications are as follows:
- Application 1 (A1) enables data collection and machine management to reduce costs and resources, optimizing yields.
- Application 2 (A2) supports farm resource management, report generation, and analysis.
- Application 3 (A3) tracks agricultural production, inventory, costs, and yields, contributing to more efficient farm management.
- Application 4 (A4) facilitates farm management by organizing crop data, tracking, and optimizing yields.
- Application 5 (A5) supports real-time execution of agricultural operations.
- Application 6 (A6) specializes in livestock management and provides financial tracking options.
- Application 7 (A7) tracks all farm operations, reporting, and analysis for farm management.
- Application 8 (A8) is used for task organization and monitoring daily task progress on the farm.
- Application 9 (A9) offers livestock monitoring through feed tracking and farm inventory management.
- Application 10 (A10) assists in tracking agricultural production and provides reporting and analytics to support better farm decision-making.
Research Methodology
After selecting the criteria and applications to be evaluated, it was necessary to define the methodology for conducting the research (Figure 2). The research was conducted in four phases:
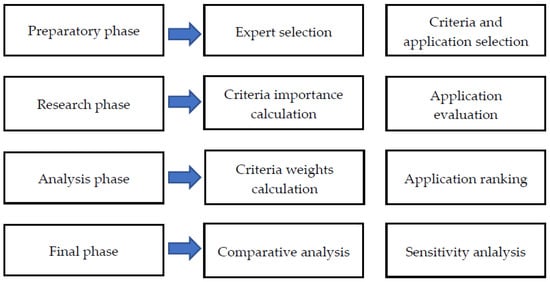
Figure 2.
Research methodology.
- Preparation phase;
- Research phase;
- Analysis phase;
- Final phase (additional analyses).
In the preparation phase, the experts, criteria, and applications to be used in the study were determined. In the research phase, based on the defined criteria and applications and using a predefined scale of linguistic values, a survey questionnaire was developed and sent to the experts for completion. By filling out this questionnaire, the experts assessed the importance of each criterion and rated the applications accordingly. The completed questionnaires were then returned for the next phase. In the analysis phase, the collected questionnaires were processed and prepared for evaluation. The IT2F SiWeC method was used to determine the importance of the criteria by establishing their weights, while the IT2F CORASO method was applied to rank the applications. The final phase involved conducting comparative and sensitivity analyses.
During the comparative analysis, the same initial decision matrix and criteria weights used in the CORASO method were applied, but different methodological steps were followed. This analysis served to either confirm or challenge the ranking obtained via CORASO and helped determine the most suitable application for small- and medium-sized farmers in Semberija. In the sensitivity analysis, the weights of the criteria were modified, and a new ranking of alternatives was established based on these changes. Since sensitivity analysis can be conducted in various ways, this study used the initial weights obtained from the IT2F SiWeC method. With the first sensitivity analysis, individual criterion weights were reduced by 30%, 60%, and 90%, while the remaining nine criteria were proportionally increased to maintain an average weight of approximately one (1). In the second sensitivity analysis, the individual criteria were increased by 30%, 60%, and 90%, while the other criteria were decreased so that the sum of weights remained approximately the same. Given that there are three levels of weight change for each of the 10 criteria, a total of 30 scenarios were generated to evaluate the alternative rankings. Conducting this analysis reveals the improvements needed for each application to become a better option for small- and medium-sized farmers in Semberija.
4. Results
In studies using subjective evaluations and MCDM methods, the process begins by determining the importance of the criteria, followed by the ranking of alternatives [35]. This is achieved using linguistic assessments provided by selected experts. When assigning weights, experts use linguistic values to express the importance of specific criteria (Table 3). Once the importance of each criterion is evaluated using linguistic expressions, the IT2F SiWeC method is applied.
Table 3.
Expert’s criteria evaluation.
The first step involves transforming the linguistic values into IT2F numbers using a predefined membership function (Table 1). For instance, the value Medium good (MeG) is transformed into the IT2F number (0.5, 0.7, 0.7, 0.9; 1, 1), (0.6, 0.7, 0.7, 0.8; 0.9, 0.9), while Good (Goo) becomes (0.7, 0.9, 0.9, 1; 1, 1), (0.8, 0.9, 0.9, 0.95; 0.9, 0.9). Other linguistic values are transformed similarly (Table 4).
Table 4.
IT2F criteria values.
After the membership function is applied, all values are converted into IT2F numbers, and the standard deviation is calculated. Then, all IT2F numbers are multiplied by the standard deviation for the values assigned by each expert.
Using the example of Expert 1 and Criterion C1, the calculation is as follows:
Next, the values from all experts are summed for each criterion. For Criterion C1, this is represented as follows:
The same process is followed to sum the weights for all criteria. The final step of the IT2F SiWeC method involves determining the final criterion weights. Here, individual summed values are divided by the total summed values. Using the same example, the calculation is as follows:
This process delivers the weights for all criteria (Table 5). The resulting weights indicate that the most important criterion is C7—Data accuracy, followed by C5—Efficiency, and then C4—Ease of use. The least important are C3—Popularity and C9—Upgrade capability. When viewed globally, the differences among weights are not substantial, suggesting that each weight has a significant influence on the final ranking of applications.
Table 5.
Criteria weights values.
Once the criteria weights are determined, the next step is ranking the alternatives. The first step involves evaluating the alternatives using linguistic values (Table 6). These are transformed into IT2F numbers in the same way as with the SiWeC method, forming an IT2F decision matrix for each expert.
Table 6.
Application evaluations using linguistic values.
To obtain a collective decision matrix, the average values across experts are calculated (Table 7). This summed decision matrix forms the base for the IT2F CORASO method.
Table 7.
Summary decision matrix.
The next step is to normalize the summed decision matrix. Using the example of Application A1 and Criterion C1, the normalization is calculated as follows:
Normalization is applied likewise to all values, resulting in a normalized decision matrix. Once formed, the maximum and minimum values for each criterion are calculated for the alternatives, representing the ideal solutions. For Criterion C1, the maximum alternative solution is as follows: (0.80, 0.95, 0.95, 1.00; 1, 1), (0.88, 0.95, 0.95, 0.98; 0.9, 0.9), while the minimum is as follows: (0.33, 0.53, 0.53, 0.77; 1, 1), (0.43, 0.53, 0.53, 0.63; 0.9, 0.9). Next comes weighting, where normalized values are multiplied by the corresponding criterion weights. For the same example, the calculation is as follows:
The next step is summing the alternative values across all criteria, including ideal solutions (Table 8). Then, the centroid value is calculated using Expression (13), and the summed defuzzified value () is calculated as the average between the centroid values of the upper and lower membership functions of the IT2F set. This serves as the base for calculating deviation from the ideal solutions. For Alternative A1, this is calculated as follows:
Table 8.
CORASO method results.
According to expert evaluations through the CORASO method, Application A3 achieved the highest ranking, followed by A9 and A1. The lowest-ranked application was A2.
To confirm or refute the results of the CORASO method, a comparative analysis was conducted [36,37], and five methods were selected for this analysis. The RAWEC (ranking of alternatives with weights of criterion) method was chosen because it uses two normalizations to rank alternatives, and the ranking is performed in relation to the weights of the criteria. In this way, it differs from other methods. SAW (simple additive weighting) is the simplest MCDM method, ranking alternatives based on weighted values. Due to its simplicity, it is often employed in comparative studies. ARAS (additive ratio assessment) is also a straightforward method that ranks according to a utility function and applies a different normalization type. MABAC (multi-attributive border approximation area comparison) uses a unique normalization and weighting process. CRADIS (compromise ranking of alternatives from distance to ideal solution) is the most complex of these methods, ranking alternatives based on their deviation from ideal solutions. The TOPSIS method uses the same normalization [38], while the procedure for calculating deviations from ideal and anti-ideal points is specific to this method.
By using these methods, the study aimed to identify whether normalization techniques or method-specific steps influenced the final rankings. The results revealed that the MABAC and TOPSIS methods give a different ranking order compared to other methods (Figure 3). With the MABAC method, differences were observed between applications A1 and A9, as well as between A5 and A6. With the TOPSIS method, the ranking order is different for applications A1 and A9. In-depth analysis revealed that CORASO had shown minimal differences among these applications, which explains why a different method might alter the rankings. Based on the analysis, it can be concluded that the ranking order of applications in the CORASO method aligns more closely with other methods than the ranking orders of the TOPSIS or MABAC methods. For the MABAC method, the difference in rank orders results from using different normalization techniques, while TOPSIS used the same normalization but still showed a partially different rank order compared to the other methods. To measure the extent of deviation between the rank orders of different applications, Spearman’s correlation coefficient will be calculated (Table 9). The analysis results show a strong correlation between the rank orders of applications obtained using different methods. The weakest correlation appears between the results of the TOPSIS and MABAC methods (r = 0.952; p < 0.01). Nonetheless, there remains a strong statistical correlation between the ranking orders.
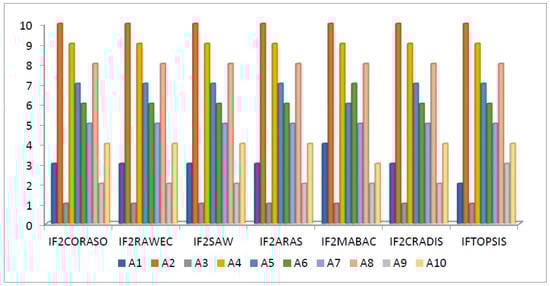
Figure 3.
Comparative analysis results.
Table 9.
Ranking correlation results.
Based on the results, Application A3 appears as the top choice and should be the first recommendation for small- and medium-sized farmers in the Semberija region, followed by Application A9.
Sensitivity analysis is a crucial part of any decision-making model [39]. The most common approach is varying the weight coefficients, as discussed in numerous studies [40]. It can also be conducted by applying different normalization types, as shown in Stević et al. [41], or by modifying other model parameters [42,43]. Here, it involved evaluating outcomes based on changes to the weight coefficients [44]. Two sensitivity analyses were performed. In the first analysis, the value of individual criteria was decreased, while in the second analysis, the value of individual criteria was increased. Each analysis included 30 scenarios. In the first analysis, each criterion’s weight was reduced by 30%, 60%, and 90%, whereas in the second analysis, the weight was increased by these same percentages.
Results of the first sensitivity analysis showed that the ranking order remained unchanged for two applications: A3, which consistently ranked highest, and A2, which consistently ranked lowest (Figure 4). The smallest ranking change occurred with A9, which ranked below A10 in only one scenario. This was due to a 90% reduction in the weight of Criterion C3, where A10 had weaker performance. With the reduced importance of C3, A10 received a better ranking. This logic applies to all changes in ranking and helps identify what each application needs to improve to become more suitable for small- and medium-sized farmers in Semberija. For example, Application A10 needs to gain more popularity, which requires increased marketing efforts. Application A5 must become more efficient in task execution. However, to outperform A3, these applications must improve across multiple criteria since A3 did not exhibit significant weaknesses in any particular area.
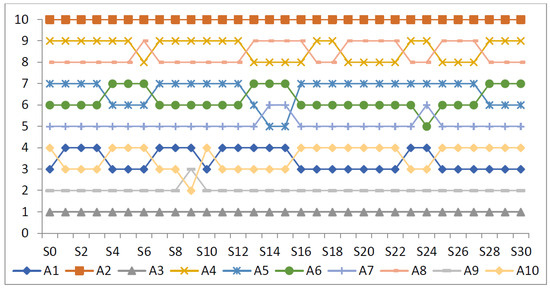
Figure 4.
First sensitivity analysis results.
The second sensitivity analysis examines what happens when the importance of one criterion increases. It determines whether enhancing a single criterion can also improve its ranking. The results show that the ranking order stayed the same for application A3, which remained in the top position in all scenarios, and for application A2, which was consistently ranked last (Figure 5). For example, with applications A1 and A9, it is clear that A1 needs to improve its efficiency to surpass A9. However, to outperform A3, multiple criteria must be improved since A3 did not show any signs of changing the importance of a single criterion. From this, we can conclude that if other applications aim to be top-ranked and the preferred choice when purchasing, they must improve multiple criteria.
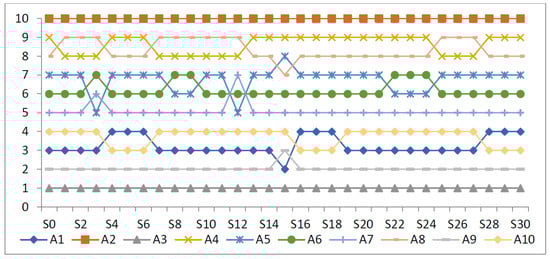
Figure 5.
Second sensitivity analysis results.
5. Discussion
With the advancement of technology in agriculture, an increasing amount of information is being generated directly from the field. To leverage this data for the development of precision agriculture, the use of software applications has become essential [45]. These tools ease the workload of farmers by supporting their decision-making processes. Also, versions of these applications that incorporate artificial intelligence can even perform specific actions to enhance productivity within precision agriculture systems. This is particularly important for resource management, as applications can notify farmers when specific actions, such as irrigation or fertilization, are needed [46]. As a result, applications have become a necessary tool in modern agricultural production. With the rise of free applications or freemium models offering limited features at no cost, their usage in practice has increased [4]. Therefore, the use of these applications is now more common among small- and medium-sized agricultural producers.
As the number of applications on the market continues to grow, this decision-making process is becoming more complex [47]. The use of these tools, especially among small- and medium-sized farmers, is quite specific. In most cases, farming activities are carried out within family-run farms. Farmers are unfamiliar with new technologies emerging in precision agriculture [6]. Therefore, experts experienced in applying these technologies in agriculture were chosen for this research. The selected experts are researchers at nearby institutes with extensive experience in applying modern equipment and mechanization in agriculture, as well as in using precision farming applications [3]. Choosing such experts is a logical solution, as those without experience cannot provide a fair evaluation of agricultural software. Additionally, these experts maintain regular contact with local farmers and are well-acquainted with their specific needs.
In this research, mostly qualitative criteria were used, mainly those assessing user experience with the applications. For an application to meet farmers’ expectations, it must be user-friendly, offer diverse features, and support informed decision-making processes. Thus, the chosen criteria were aligned with these requirements. Linguistic values were used for rating both criteria and applications, as they are easier to apply, especially when dealing with qualitative measures [8]. Nevertheless, even among experienced experts, a certain degree of uncertainty persists in their evaluations.
In today’s information-rich environment, accessing all relevant and accurate data for informed decision-making has become challenging. When experts do not have complete information, their judgments may become uncertain. Therefore, it is essential to incorporate a degree of uncertainty into the decision-making process [48]. Traditional fuzzy sets allow decisions to be made under conditions of incomplete information [9]. Building on this, more advanced fuzzy models have been developed. This study used the IT2F approach, which employs interval type-2 fuzzy numbers with bounded upper and lower membership functions. The membership functions were formed in a symmetrical way, where the sum of the support and the core was considered to be equal to one. This approach enables decision-making under uncertainty by using membership functions. While this is not a novel theoretical concept, this research developed new methods, SiWeC and CORASO, within the IT2F framework.
Using the IT2F SiWeC method, the importance of the criteria for evaluating the applications was determined. A key advantage of this method is that DMs are not required to compare criteria pairwise; instead, they assess the individual importance of each criterion, thereby simplifying the evaluation process [24]. To apply this technique effectively, normalization was bypassed. This adjustment was justified because the membership function values of IT2F numbers were already within the [0, 1] interval, making normalization unnecessary. Similarly, in the application of the CORASO method, normalization adjustments were only required in the upper membership bounds since the maximum value in the lower membership function was already one (1), and dividing by this value had no impact [25]. In addition to the IT2F SiWeC method, the IT2F CORASO method was also developed, although no methodological changes were made to it.
The results obtained using the IT2F SiWeC method indicated that the criteria of data accuracy, efficiency, and ease of use held a slight advantage. This perspective aligns with the principles of precision agriculture, where the role of modern technology is essential. The accuracy of data is crucial for the successful implementation of measures designed to enhance productivity. Moreover, efficiency ensures that farmers can obtain the most valuable data in the shortest time. Ease of use is also vital, as small- and medium-sized farmers often lack experience with such technologies and require training on how to use the applications. In this context, it is recommended that distributors of the applications provide training to support the adoption of these solutions. On the other hand, criteria such as popularity and upgrade capability were found to be less important. Farmers unfamiliar with agricultural applications may not be aware of which applications are popular, and they tend to prefer ready-to-use solutions that require no configuration or upgrades.
The application of the CORASO method identified Application A3 as the best option for small- and medium-sized farmers in the Semberija region. This application was chosen because it received better ratings than other applications in the criteria of Ease of use, Clarity, and Upgrade capability, while the other criteria were rated equally well as those of other applications. Based on this, it can be said that, according to the DMs, this application is easier to use, simpler, and offers better support for future upgrades to meet users’ needs. This application supports comprehensive monitoring of agricultural production—from crop tracking to resource management. It enables the collection of various field data, which supports informed decision-making. Also, the application can be installed on various devices, including mobile phones, allowing the farmers to monitor farm conditions at any time and from anywhere, provided they have an internet connection. Based on these features, A3 was selected as the most suitable application. These findings were further validated through comparative and sensitivity analyses, confirming it as the top expert recommendation for farmers in Semberija.
This research shows that the SiWeC and CORASO methods have excellent features, are highly flexible, and are easy to use. Additionally, these methods have proven stable in assessing the importance of weights and ranking alternatives. Therefore, it is recommended to use these methods in future studies. The CORASO method, when compared with others, demonstrates a good correlation between its results and those of other methods. This is because its steps are similar to existing methods but differ enough to not be just a modification of them. As the comparison shows, the ranking order produced by this method differs from that of the MABAC and TOPSIS methods. This difference is likely due to the MABAC method using different normalization and weighting, which sets it apart further. The TOPSIS method’s ranking order is also different because it calculates deviation from the ideal solutions using Euclidean deviation, which makes its approach distinct from the simpler deviation calculations used by other methods.
5.1. Research Implications
The primary motivation for this research was to showcase the potential of modern technologies in agriculture, particularly through digitalization. These applications enable farmers to access a wealth of data, enhancing productivity through precision agriculture. The study demonstrates that small- and medium-sized producers can successfully implement these technologies in practice, thereby improving their operations. This study has revealed several important implications for further development in both scientific theory and practical application. The most significant contribution is the evaluation model used for assessing agricultural software. This model introduced criteria tailored to users with little or no prior experience with agricultural applications. As such, the criteria were largely qualitative, focusing on specific application functionalities. This enables further theoretical exploration of these criteria and supports their practical implementation. Another significant contribution is the advancement of the IT2F approach through the development of the IT2F versions of the SiWeC and CORASO methods, laying the groundwork for new methodologies within this framework. Furthermore, this research introduced a hybrid methodology in which weight values were not defuzzified but were used in their original form to determine importance. This creates opportunities for the development of additional hybrid methods within both IT2F systems and other fuzzy frameworks.
5.2. Research Limitations and Future Directions
Every research study has inherent limitations, primarily rooted in its methodology. One such limitation in this study is the number of experts involved. Although more experts could provide additional perspectives on the criteria and the importance of application, the selected participants were chosen for their expertise, and the sample size is not critical to the validity of the results. Future studies could include more experts to determine whether their inclusion alters the results or if the number of experts has a negligible effect on outcomes. Another limitation lies in the selection of evaluation criteria. While different criteria could be considered, the ones used here were specifically chosen to align with the objectives of this study. Future research could test different sets of criteria to see whether the results vary. Additionally, the number of evaluated applications is a limitation. It is not possible to include every agricultural application on the market, especially since many are developed for other markets and are not suitable for the regional context of this research. Subjective assessment studies often face the challenge of personal bias. This raises an important question: would the ranking results change if the study were conducted in a different region or with a different panel of experts? The answer is likely yes. Even when starting from the same decision matrix and weightings, different rankings may emerge. As a result, efforts were made to ensure that no application was overly promoted or criticized based on subjective proclivity. Additional analyses were also conducted to verify the consistency of application rankings when different methods or weightings were applied. Lastly, it is worth noting that individual farmers may prefer different applications. The practices that are effective for one farmer may not deliver the same results for another. Therefore, future studies should involve the farmers themselves, as they are the ultimate end-users of these applications. The methodology itself can be applied to future research. In this research, the IT2S methodology was used, so future research should consider comparing this approach with the fuzzy 3 set approach, which allows for a different way of modeling uncertainty. Future studies should focus on practical problems to help develop new decision-making and problem-solving approaches.
6. Conclusions
The research was designed to use expert decision-making when selecting applications for small- and medium-scale agricultural production. The research was also conducted in the Semberija area, which has its specificities compared to other farming areas. Ten criteria were used during the research, and ten applications were observed, which were evaluated in linguistic values. These values were used due to the specificity of the criteria themselves, which were formulated in a qualitative form. To reduce the uncertainty in expert decision-making, the IT2F approach was used. The results of this approach indicated that certain criteria were more important than others, which is not significant, as all criteria influenced the final selection of the application. However, three criteria stand out: data accuracy, efficiency, and simplicity. These results also indicated that the A3 application is the best option for small- and medium-sized agricultural producers in Semberija. The research conducted demonstrated that the application of the hybrid IT2F methodology is highly flexible and can be used in all research where a certain level of uncertainty exists in decision-making. Therefore, future research should develop this approach not only in agriculture but also in other areas where informed judgment is required.
Based on the research findings, the paper’s originality primarily lies in its application of precision agriculture concepts within the Semberija region to enhance agricultural productivity. This is particularly significant for residents of Bosnia and Herzegovina, where most farming activities occur. Additionally, the paper introduces innovative use of the IF2S with the SiWeC and CORASO methods—methods that are newer and have not been previously used in this format, resulting in the development of new versions. Additionally, the paper emphasizes the importance of promoting application-based tools as vital components of precision agriculture in Semberija and Bosnia and Herzegovina, especially given that, as a developing country, it often overlooks emerging agricultural technologies.
Author Contributions
Conceptualization, R.D. and B.D.; methodology, A.P.; software, A.P.; validation, A.Š., L.S., M.J. and M.N.; formal analysis, R.D. and B.D.; investigation, B.D.; resources, R.D.; data curation, R.D.; writing—original draft preparation, A.P.; writing—review and editing, A.Š.; visualization, A.P.; supervision, L.S.; project administration, B.D.; funding acquisition, M.N. All authors have read and agreed to the published version of the manuscript.
Funding
This paper is part of research financed by the MSTDI RS, agreed in decision no. 451-03-136/2025-03/200009, from 4 February 2025.
Data Availability Statement
The authors confirm that the data supporting the findings of this study are available within the article.
Conflicts of Interest
The authors declare no conflicts of interest.
Abbreviations
The following abbreviations are used in this manuscript:
| SiWeC | simple weight calculation |
| CORASO | compromise ranking from alternative solutions |
| IT2F | interval type-2 fuzzy |
| MCDM | multi-criteria decision making |
| DM | decision maker |
| RAWEC | ranking of alternatives with weights of criterion |
| SAW | simple additive weighting |
| ARAS | additive ratio assessment |
| MABAC | multi-attributive border approximation area comparison |
| CRADIS | compromise ranking of alternatives from distance to ideal solution |
References
- Alroud, S.F. Digital Transformation as a Moderator: A Study of the Impacts of Sustainability Reporting Disclosure on Financial Reporting Quality in the Jordanian Banking Sector. Econ. Innov. Econ. Res. J. 2025, 13, 389–413. [Google Scholar] [CrossRef]
- Zhang, Y.; Lu, X.; Li, J.; Lin, C. Dynamic selection of cooperative partners of agricultural science and technology industry-university-research system based on field theory. Kybernetes 2025. online first. [Google Scholar] [CrossRef]
- Krisnawijaya, N.N.K.; Tekinerdogan, B.; Catal, C.; van der Tol, R. Multi-Criteria decision analysis approach for selecting feasible data analytics platforms for precision farming. Comput. Electron. Agric. 2023, 209, 107869. [Google Scholar] [CrossRef]
- dos Santos, R.P.; Fachada, N.; Beko, M.; Leithardt, V.R.Q. A Rapid Review on the Use of Free and Open Source Technologies and Software Applied to Precision Agriculture Practices. J. Sens. Actuator Netw. 2023, 12, 28. [Google Scholar] [CrossRef]
- Gueye, P.E.H.A.; Deme, C.B.; Basse, A. RTCNet: A Robust Hybrid Deep Learning Model for Soil Property Prediction Under Noisy Conditions. Inf. Dyn. Appl. 2025, 4, 36–52. [Google Scholar] [CrossRef]
- Mishra, A.; Alzoubi, Y.I.; Gavrilovic, N. Quality attributes of software architecture in IoT-based agricultural systems. Smart Agric. Technol. 2024, 8, 100523. [Google Scholar] [CrossRef]
- Krstić, M.; Tadić, S.; Spajić, A. Application of a Hybrid MCDM Model for Locating a Humanitarian Logistics Center. J. Oper. Strateg. Anal. 2024, 2, 160–176. [Google Scholar] [CrossRef]
- Akbulut, O.Y. Assessing the Environmental Sustainability Performance of the Banking Sector: A Novel Integrated Grey Multi-Criteria Decision-Making (MCDM) Approach. Int. J. Knowl. Innov. Stud. 2024, 2, 239–258. [Google Scholar] [CrossRef]
- Nikolić, I.; Milutinović, J.; Božanić, D.; Dobrodolac, M. Using an Interval Type-2 Fuzzy AROMAN Decision-Making Method to Improve the Sustainability of the Postal Network in Rural Areas. Mathematics 2023, 11, 3105. [Google Scholar] [CrossRef]
- Tadić, D.; Komatina, N. A Hybrid Interval Type-2 Fuzzy DEMATEL-MABAC Approach for Strategic Failure Management in Automotive Manufacturing. J. Eng. Manag. Syst. Eng. 2025, 4, 21–38. [Google Scholar] [CrossRef]
- Du, X.C.; Zhou, Z.H.; Chen, Q.Z.; Mao, Y.L. An Integrated Quality Function Deployment Framework Incorporating Interval Type-2 Fuzzy Sets and Behavioural Decision Theory for Optimising Smart Community Technology Adoption. J. Intell. Manag. Decis. 2025, 4, 92–117. [Google Scholar] [CrossRef]
- Yan, D.; Wu, K.; Ejegwa, P.A.; Xie, X.; Feng, Y. Pythagorean Fuzzy Partial Correlation Measure and Its Application. Symmetry 2023, 15, 216. [Google Scholar] [CrossRef]
- Zhang, G.; Yuan, G. Hesitant Fuzzy Variable and Distribution. Symmetry 2022, 14, 1184. [Google Scholar] [CrossRef]
- Sarfraz, M.; Božanić, D. Optimization of Market Risk via Maclaurin Symmetric Mean Aggregation Operators: An Application of Interval-Valued Intuitionistic Fuzzy Sets in Multi-Attribute Group Decision-Making. J. Eng. Manag. Syst. Eng. 2024, 3, 100–115. [Google Scholar] [CrossRef]
- Zadeh, L.A. Fuzzy sets. Inf. Control 1965, 8, 338–353. [Google Scholar] [CrossRef]
- Radovanović, M.; Jovčić, S.; Petrovski, A.; Cirkin, E. Evaluation of University Professors Using the Spherical Fuzzy AHP and Grey MARCOS Multi-Criteria Decision-Making Model: A Case Study. Spectr. Decis. Mak. Appl. 2025, 2, 198–218. [Google Scholar] [CrossRef]
- Ayub, S.; Shabir, M.; Riaz, M.; Waqus, M.; Bozanic, D.; Marinkovic, D. Linear Diophantine Fuzzy Rough Sets: A New Rough Set Approach with Decision Making. Symmetry 2022, 14, 525. [Google Scholar] [CrossRef]
- Biswas, A.; Gazi, K.H.; Bhaduri, P.; Mondal, S.P. Neutrosophic fuzzy decision-making framework for site selection. J. Decis. Anal. Intell. Comput. 2024, 4, 187–215. [Google Scholar] [CrossRef]
- Precup, R.; Roman, R.; Hedrea, E.; Petriu, E.; Bojan-Dragos, C.; Szedlak-Stinean, A. Metaheuristic-based tuning of proportional-derivative learning rules for proportional-integral fuzzy controllers in tower crane system payload position control. Facta Univ. Ser. Mech. Eng. 2024, 22, 567–582. [Google Scholar] [CrossRef]
- Li, W.; Wang, L.; Rehman, O.U. A novel interval type-2 fuzzy CPT-TODIM method for multi-criteria group decision making and its application to credit risk assessment in supply chain finance. Int. J. Fuzzy Syst. 2024, 27, 54–76. [Google Scholar] [CrossRef]
- Pritika; Shanmugam, B.; Azam, S. Risk Evaluation and Attack Detection in Heterogeneous IoMT Devices Using Hybrid Fuzzy Logic Analytical Approach. Sensors 2024, 24, 3223. [Google Scholar] [CrossRef]
- Rokhva, S.; Teimourpour, B.; Babaei, R. Enhanced sentiment analysis of Iranian restaurant reviews utilizing sentiment intensity analyzer & fuzzy logic. Food Humanit. 2025, 5, 100658. [Google Scholar] [CrossRef]
- Chatterjee, S.; Saha, D. IT2F-SEDNN: An interval type-2 fuzzy logic-based stacked ensemble deep learning approach for early phase software dependability analysis. Innov. Syst. Softw. Eng. 2025, 21, 727–746. [Google Scholar] [CrossRef]
- Katrancı, A.; Kundakcı, N.; Arman, K. Fuzzy SIWEC and Fuzzy RAWEC Methods for Sustainable Waste Disposal Technology Selection. Spectr. Oper. Res. 2025, 3, 87–102. [Google Scholar] [CrossRef]
- Puška, A.; Nedeljković, M.; Pamučar, D.; Božanić, D.; Simić, V. Application of the new simple weight calculation (SIWEC) method in the case study in the sales channels of agricultural products. MethodsX 2024, 13, 102930. [Google Scholar] [CrossRef]
- Bhadani, V.; Singh, A.; Kumar, V.; Gaurav, K. Nature-inspired optimal tuning of input membership functions of fuzzy inference system for groundwater level prediction. Environ. Model. Softw. Environ. Data News 2024, 175, 105995. [Google Scholar] [CrossRef]
- Boz, E. Evaluation for the selection of agricultural spraying drones using p, q-Quasirung orthopair fuzzy logic and multi-criteria methods. Sci. Rep. 2025, 15, 27606. [Google Scholar] [CrossRef]
- Şimşek, E.; Eti, S.; Yüksel, S.; Dinçer, H. Evaluation of Purchasing Process in Solar Energy Investment Projects via SIWEC Methodology. Spectr. Oper. Res. 2025, 3, 81–86. [Google Scholar] [CrossRef]
- Puška, A.; Nedeljković, M.; Božanić, D.; Štilić, A.; Muhsen, Y.R. Evaluation of agricultural drones based on the COmpromise Ranking from Alternative SOlutions (CORASO) methodology. Eng. Rev. 2024, 44, 77–90. [Google Scholar] [CrossRef]
- Puška, A.; Igić, S.; Prdić, N.; Dudić, B.; Stojanović, I.; Stošić, L.; Nedeljković, M. Application of Intuitionistic Fuzzy Approaches and Bonferroni Mean Operators in the Selection of Suppliers of Agricultural Equipment and Machinery for the Needs of the Agriculture 4.0 System. Mathematics 2025, 13, 2268. [Google Scholar] [CrossRef]
- Tufan, D.; Ulutaş, A. Supplier Selection in the Food Sector: An Integrated Approach Using LODECI and CORASO Methods. Spectr. Decis. Mak. Appl. 2025, 3, 40–51. [Google Scholar] [CrossRef]
- Elsayed, A.; Abouhawwash, M. An Effective Model for Selecting the Best Cloud Platform for Smart Farming in Smart Cities: A Case Study. Optim. Agric. 2024, 1, 66–80. [Google Scholar] [CrossRef]
- Tolga, A.C.; Basar, M. The assessment of a smart system in hydroponic vertical farming via fuzzy MCDM methods. J. Intell. Fuzzy Syst. 2021, 42, 1–12. [Google Scholar] [CrossRef]
- Guresci, E.; Tekinerdogan, B.; Babur, Ö.; Liu, Q. Feasibility of Low-Code Development Platforms in Precision Agriculture: Opportunities, Challenges, and Future Directions. Land 2024, 13, 1758. [Google Scholar] [CrossRef]
- Razak, S.A.; Rodzi, Z.M.; Al-Sharqi, F.; Ramli, N. Revolutionizing Decision-Making in E-Commerce and IT Procurement: An IVPNS-COBRA Linguistic Variable Framework for Enhanced Multi-Criteria Analysis. Int. J. Econ. Sci. 2025, 14, 1–31. [Google Scholar] [CrossRef]
- Zulqarnain, R.M.; Siddique, I.; Ali, R.; Pamucar, D.; Marinkovic, D.; Bozanic, D. Robust Aggregation Operators for Intuitionistic Fuzzy Hypersoft Set with Their Application to Solve MCDM Problem. Entropy 2021, 23, 688. [Google Scholar] [CrossRef] [PubMed]
- Çalikoğlu, C.; Łuczak, A. Multidimensional assessment of SDI and HDI using TOPSIS and Bilinear Ordering. Int. J. Econ. Sci. 2024, 13, 116–128. [Google Scholar] [CrossRef]
- Şahin, M.; Deliktaş, D. Multi-Criteria Evaluation of Wind Turbines using Entropy-based-TOPSIS and CoCoSo Methods: Insights from a Turkish Case Study. Spectr. Oper. Res. 2025, 3, 339–351. [Google Scholar] [CrossRef]
- Tešić, D.; Khalilzadeh, M. Development of the rough Defining Interrelationships Between Ranked criteria II method and its application in the MCDM model. J. Decis. Anal. Intell. Comput. 2024, 4, 153–164. [Google Scholar] [CrossRef]
- Yalçın, G.C.; Kara, K.; Özyürek, H. Evaluating Financial Performance of Companies in the Borsa Istanbul Sustainability Index Using the CRITIC-MABAC Method. Spectr. Oper. Res. 2025, 2, 323–346. [Google Scholar] [CrossRef]
- Stević, Ž.; Baydaş, M.; Kavacık, M.; Ayhan, E.; Marinković, D. Selection of data conversion technique via sensitivity-performance matching: Ranking of small e-vans with probid method. Facta Univ. Ser. Mech. Eng. 2024, 22, 643–671. [Google Scholar] [CrossRef]
- Trung, D.D.; Dudić, B.; Dung, H.T.; Truong, N.X. Innovation in financial health assessment: Applying MCDM techniques to banks in Vietnam. Econ. Innov. Econ. Res. J. 2024, 12, 21–33. [Google Scholar] [CrossRef]
- Petchimuthu, S.; Palpandi, B. Sustainable Urban Innovation and Resilience: Artificial Intelligence and q-Rung Orthopair Fuzzy ExpoLogarithmic Framework. Spectr. Decis. Mak. Appl. 2025, 2, 242–267. [Google Scholar] [CrossRef]
- Deivanayagampillai, N.; Kuppulakshmi, V.; Sugapriya, C. Optimum production lot size for a perishable product under exponential demand with partial backordering and rework. Spectr. Mech. Eng. Oper. Res. 2024, 1, 206–214. [Google Scholar] [CrossRef]
- Charchafa, I.; Kimouche, B. Understanding environmental transparency: A study of Saudi Arabian companies. Oeconomica Jadertina 2024, 14, 22–40. [Google Scholar] [CrossRef]
- Hristozov, Y.; Nozharov, S. Prerequisites for business development in South-Eastern Europe in the conditions of polycrisis and digital transformation. Econ. Innov. Econ. Res. J. 2024, 12, 163–175. [Google Scholar] [CrossRef]
- He, Y.; Wu, H.; Wu, A.Y.; Li, P.; Ding, M. Optimized shared energy storage in a peer-to-peer energy trading market: Two-stage strategic model regards bargaining and evolutionary game theory. Renew. Energy 2024, 224, 120190. [Google Scholar] [CrossRef]
- Lukić, R. Evaluation of trade performance dynamics in Serbia using ARAT and Rough MABAC methods. Oeconomica Jadertina 2024, 14, 34–44. [Google Scholar] [CrossRef]


Disclaimer/Publisher’s Note: The statements, opinions and data contained in all publications are solely those of the individual author(s) and contributor(s) and not of MDPI and/or the editor(s). MDPI and/or the editor(s) disclaim responsibility for any injury to people or property resulting from any ideas, methods, instructions or products referred to in the content. |
© 2025 by the authors. Licensee MDPI, Basel, Switzerland. This article is an open access article distributed under the terms and conditions of the Creative Commons Attribution (CC BY) license (https://creativecommons.org/licenses/by/4.0/).