Article

Feature Equalization and Hierarchical Decoupling Network for Rotated and High-Aspect-Ratio Object Detection

1
School of Information and Engineering, Beijing Electronic Science and Technology Institute, Beijing 100070, China
2
Shanghai Aerospace Control Technology Institute, Shanghai 201109, China
3
Research and Development Center of Infrared Detection Technology, China Aerospace Science and Technology Corporation, Shanghai 201109, China
*
Author to whom correspondence should be addressed.
Symmetry 2025, 17(9), 1491; https://doi.org/10.3390/sym17091491
Submission received: 14 June 2025 / Revised: 18 August 2025 / Accepted: 26 August 2025 / Published: 9 September 2025
(This article belongs to the Special Issue Symmetry and Asymmetry Study in Object Detection)

Abstract

Current mainstream remote sensing target detection algorithms mostly estimate the rotation angle of targets by designing different bounding box descriptions and loss functions. However, they fail to consider the symmetry–asymmetry duality anisotropy in the distribution of key features required for target localization. Moreover, the equivalent feature extraction mode of shared convolutional kernels may lead to difficulties in accurately predicting parameters with different attributes, thereby reducing the performance of the detector. In this paper, we propose the Feature Equalization and Hierarchical Decoupling Network (FEHD-Net), which comprises three core components: a Symmetry-Enhanced Parallel Interleaved Convolution Module (PICM), a Parameter Decoupling Module (PDM), and a Critical Feature Matching Loss Function (CFM-Loss). PICM captures diverse spatial features over long distances by integrating square convolution and multi-branch continuous orthogonal large kernel strip convolution sequences, thereby enhancing the network’s capability in processing long-distance spatial information. PDM decomposes feature maps with different properties and assigns them to different regression branches to estimate the parameters of the target’s rotating bounding box. Finally, to stabilize the training of anchors with different qualities that have captured the key features required for detection, CFM-Loss utilizes the intersection ratio between anchors and true value labels, as well as the uncertainty of convolutional regression during training, and designs an alignment criterion (symmetry-aware alignment) to evaluate the regression ability of different anchors. This enables the network to fine-tune the processing of templates with different qualities, achieving stable training of the network. A large number of experiments demonstrate that compared with existing methods, FEHD-Net can achieve state-of-the-art performance on DOTA, HRSC2016, and UCAS-AOD datasets.

1. Introduction

Remote sensing (RS) image target detection serves as a pivotal technology for identifying and localizing ground targets via remote sensing images, holding significant importance in domains like environmental monitoring, urban planning, and disaster evaluation. As remote sensing optoelectronic devices and image resolution continue to advance, remote sensing target detection algorithms are tasked with processing increasingly rich feature information. Most of these algorithms adhere to the framework of “feature extraction—bounding box regression/target classification” and are enhanced around these two aspects to boost detector accuracy.
In the realm of feature extraction, traditional methods based on convolutional neural networks primarily concentrate on fusing multi-scale target features and extracting rotational features. For instance, ReDet [1] is crafted to directly model rotational variance features in RS images. Simultaneously, the RiRoI Align module is designed to extract rotationally invariant features from the rotational variance features obtained in the preceding step, thereby achieving the accurate detection of remote sensing targets. For emerging Transformer-based approaches, they leverage the unique global information extraction capability of Transformer to deepen the network’s comprehension of the image’s overall structure. LPSW [2] incorporates a CNN-based local sensing module into the Transformer network, enabling the network to extract both local and global image information while reinforcing its learning of local correlations and structural information, along with multi-scale target detection capabilities. O2DETR [3] is built on the transformer structure; it simplifies the detection process by omitting post-processing steps like non-maximum suppression (NMS) and prior knowledge constraints such as anchors. Additionally, by integrating depth-deformable convolution, it matches the rotating anchors predicted by the network with targets in an end-to-end manner, realizing the detection of rotating targets while reducing the network’s computational complexity.
In terms of rotational anchor representation, GWD [4] employs a Gaussian distributed ellipse to approximate the rotating rectangle. GLDet [5] utilizes sliding four-vertex to represent the rotating anchor, designs a tilt factor based on the anchor’s area, and selects different regression modes according to the tilt factor’s value during inference. RIFDCNN [6] adds rotationally invariant regular constraints to the objective functions of networks like Faster RCNN [7,8,9], ensuring that the feature representation of training samples remains approximately unchanged during target rotation and achieving rotationally invariant feature extraction. However, this method features a complex structure and high computational complexity, making it challenging to apply to resource-constrained on-orbit platforms. FFA [10] incorporates angular information into the Region Proposal Network (RPN) of Faster RCNN, specifically using a five-parameter representation consisting of center point coordinates, width, height, and angle to denote the rotated anchor, and adds angular information to the localization loss function. SCRDet [11] adopts a smoothing loss function that combines IoU and coordinate regression, promoting smooth network training by suppressing drastic changes in the regression loss of rotating and high-aspect-ratio targets. The AZ-Net algorithm developed by Lu et al. [12] further enhances contextual utilization through adjacent region prediction and zoom indicators, focusing on critical areas to improve detection performance in complex scenarios. Despite the fact that image pyramids facilitate the exploitation of contextual information, their high-resolution inputs result in significant memory and computational burdens.
However, from the above analysis, it is evident that despite notable advancements in prior research, the high aspect ratio and multi-directional rotation of targets cause existing detection frameworks to encounter feature distribution anisotropy during feature extraction. Specifically, there exist significant feature discrepancies across various spatial directions and in the dimensions of bounding box representation parameters, rendering accurate detection of such targets still challenging. These challenges are as follows (as shown in Figure 1).
(1)
Spatial distribution differences of features: For targets with arbitrary orientations and high aspect ratios, their feature information is intensely clustered in the spatial dimension aligned with the target direction, whereas features in the spatial dimension orthogonal to this direction are relatively sparse. For instance, ship features in remote sensing images are mainly concentrated along their long edges, with fewer features distributed on the wide edges. Current convolutional structures adopt square convolution kernels sliding horizontally for feature extraction of such targets. This inflexible sampling mode with a fixed shape struggles to address the misalignment in anisotropic target representation within irregular feature spaces. To enhance the feature representation of rotating targets, some methods dynamically rotate convolution kernels according to the orientations of different objects in images, aiming to extract high-quality features of rotating targets more accurately. Nevertheless, due to the heavy concentration of ship features on long edges, this approach lacks the capability to model long-range information in the target’s directional dimension, making it hard to effectively capture features in distal or edge regions of the ship, thereby impairing detection accuracy.
(2)
Differential coupling of bounding box characterization parameters: Owing to their unique geometric properties, high-aspect-ratio objects are highly sensitive to angular changes during detector regression. Remote sensing target detection requires additional angular regression, and for high-aspect-ratio targets, even a small angular prediction error can lead to a significant deviation between the predicted bounding box and the real label. This deviation causes drastic fluctuations in the loss function gradient, making it difficult to find a suitable optimization direction when updating bounding box parameters and thus resulting in unstable training processes. Consequently, extremely precise prediction of the angle of elongated bounding boxes is required. However, among the parameters describing a rotating target, the target’s category and scale need to be predicted based on rotationally invariant features, while the target’s positional coordinates and orientation rely on rotationally isotropic features. Existing remote sensing multi-orientation target detection methods employ a set of shared feature maps to predict the above parameters, causing features describing the target’s shape to mix with those reflecting changes in its position and angle. This easily leads to inaccurate parameter prediction.
To address these issues, this paper proposes the Feature Equalization and Hierarchical Decoupling Detector, which comprises three key components: the Parallel Interleaved Convolution Module (PICM), Parameter Decoupling Module (PDM), and Critical Feature Matching Loss (CFM-Loss). First, PICM captures diverse spatial features by sequentially combining square convolution and orthogonal kernel strip convolution. It can extract local details while capturing rich long-range contextual information, compensating for the shortcomings of traditional square convolution in detecting such rotating and elongated targets. Additionally, PDM decomposes the prediction process of each bounding box parameter, enabling different parameters to be regressed based on distinct feature maps. This solves the problem of coupling between target shape and orientation features in existing target detection algorithms. CFM-Loss leverages prior information on spatial matching and the degree of anchor change during training to construct an alignment criterion for measuring anchor quality, assigning different weights accordingly. This integrates the quality of anchors that capture key features with their inherent attributes. High-quality anchors capturing key features are set as positive samples, and negative samples with potential regression ability are mined. This allows the network to fine-tune the processing of anchors with different qualities, achieving stable network training. The main contributions of this paper are as follows:
(1)
We systematically analyze the difficult problem of anisotropy of feature distributions for detecting targets with high aspect ratios in any direction, revealing the inherent conflict between directional asymmetry and detection parameter symmetry.
(2)
A parallel interleaved convolution module is proposed, the core of which is to construct a large kernel strip convolution with multi-branch sequential orthogonalization for feature extraction. This architecture simultaneously captures the rotationally symmetric context and directionally specific details through multi-scale orthogonal receptive fields, effectively modeling geometric symmetry variations across targets with diverse aspect ratios.
(3)
A parametric regression decoupling (PRD) method is proposed, which decomposes the regression process of different bounding box parameters into different network branches so that they no longer share a set of shared feature maps for computation in order to solve the problem of mutual coupling between rotationally isotropic and rotationally invariant features. This symmetry-driven decoupling resolves the inherent conflict between isotropic position estimation and anisotropic orientation prediction in shared feature spaces.
(4)
A joint loss function (Critical Feature Matching, CFM-Loss) based on critical feature matching is proposed to assign weight factors according to the degree of change before and after the correction of different templates, which enhances the detector’s focus on high-quality samples and promotes stable training of the network.

2. Related Works

RS images are more complex than natural scene images. In addition to having many similar objects that can easily interfere with the target, the diverse scales and large changes in aspect ratios of the target make it difficult to accurately locate and recognize the object, posing a huge challenge for target detection. The present research works [13,14,15,16] focus on the extraction of rotation features, the merging of features, and other aspects.

2.1. Rotation Feature Extraction

Deformable convolution (DConv) [17] introduces extra offsets into the backbone architecture to adjust spatial sampling positions, and it can be trained in an end-to-end manner via backpropagation. This allows the receptive field to deviate from a horizontal rectangular shape and instead approximate the actual contour of aerial targets. Ran developed a lightweight rotational detection network by integrating an enhanced channel attention module (ECA) [18] into each layer, aiming to boost the model’s feature representation ability. Nevertheless, this approach tends to lose the feature information of small-scale targets during downsampling. RoDFormer leverages a structured Transformer to gather feature information across various resolutions, which is beneficial for achieving accurate detection of densely distributed multi-angle targets in remote sensing images. AlignDet [19] devises RoI convolution to attain an effect comparable to that of region pooling. However, when applied to the task of detecting rotating and dense targets, the aforementioned methods are vulnerable to interference from the features of adjacent targets, resulting in suboptimal performance.

2.2. Rotating Bounding Box Representation

GGHL [5] proposes a jointly optimized loss function to tackle the issue where the network struggles to learn optimal parameters due to inconsistent evaluation metrics between classification and bounding box regression tasks. This algorithm employs region normalization and a loss weight weighting mechanism to adaptively adjust loss weights for positive and negative sample positions across different locations, as well as for rotated bounding box regression and classification tasks. The RoI operator [20] splits the feature map into multiple grid subregions and applies a maximum pooling operation on each subregion to determine the target location. However, the RoI pooling operation quantizes floating-point boundaries into integers, leading to misalignment between the extracted target regions and the target features. To avoid the quantization errors caused by RoI pooling, rotation offsets can be introduced to deform the RoI pooling [21]; these offsets are added to each subregion to accommodate remote sensing targets with varied appearances. Nevertheless, such methods typically involve numerous feature transformation operations, which significantly slow down the network’s detection speed.

3. Methodology

3.1. Basic Architecture

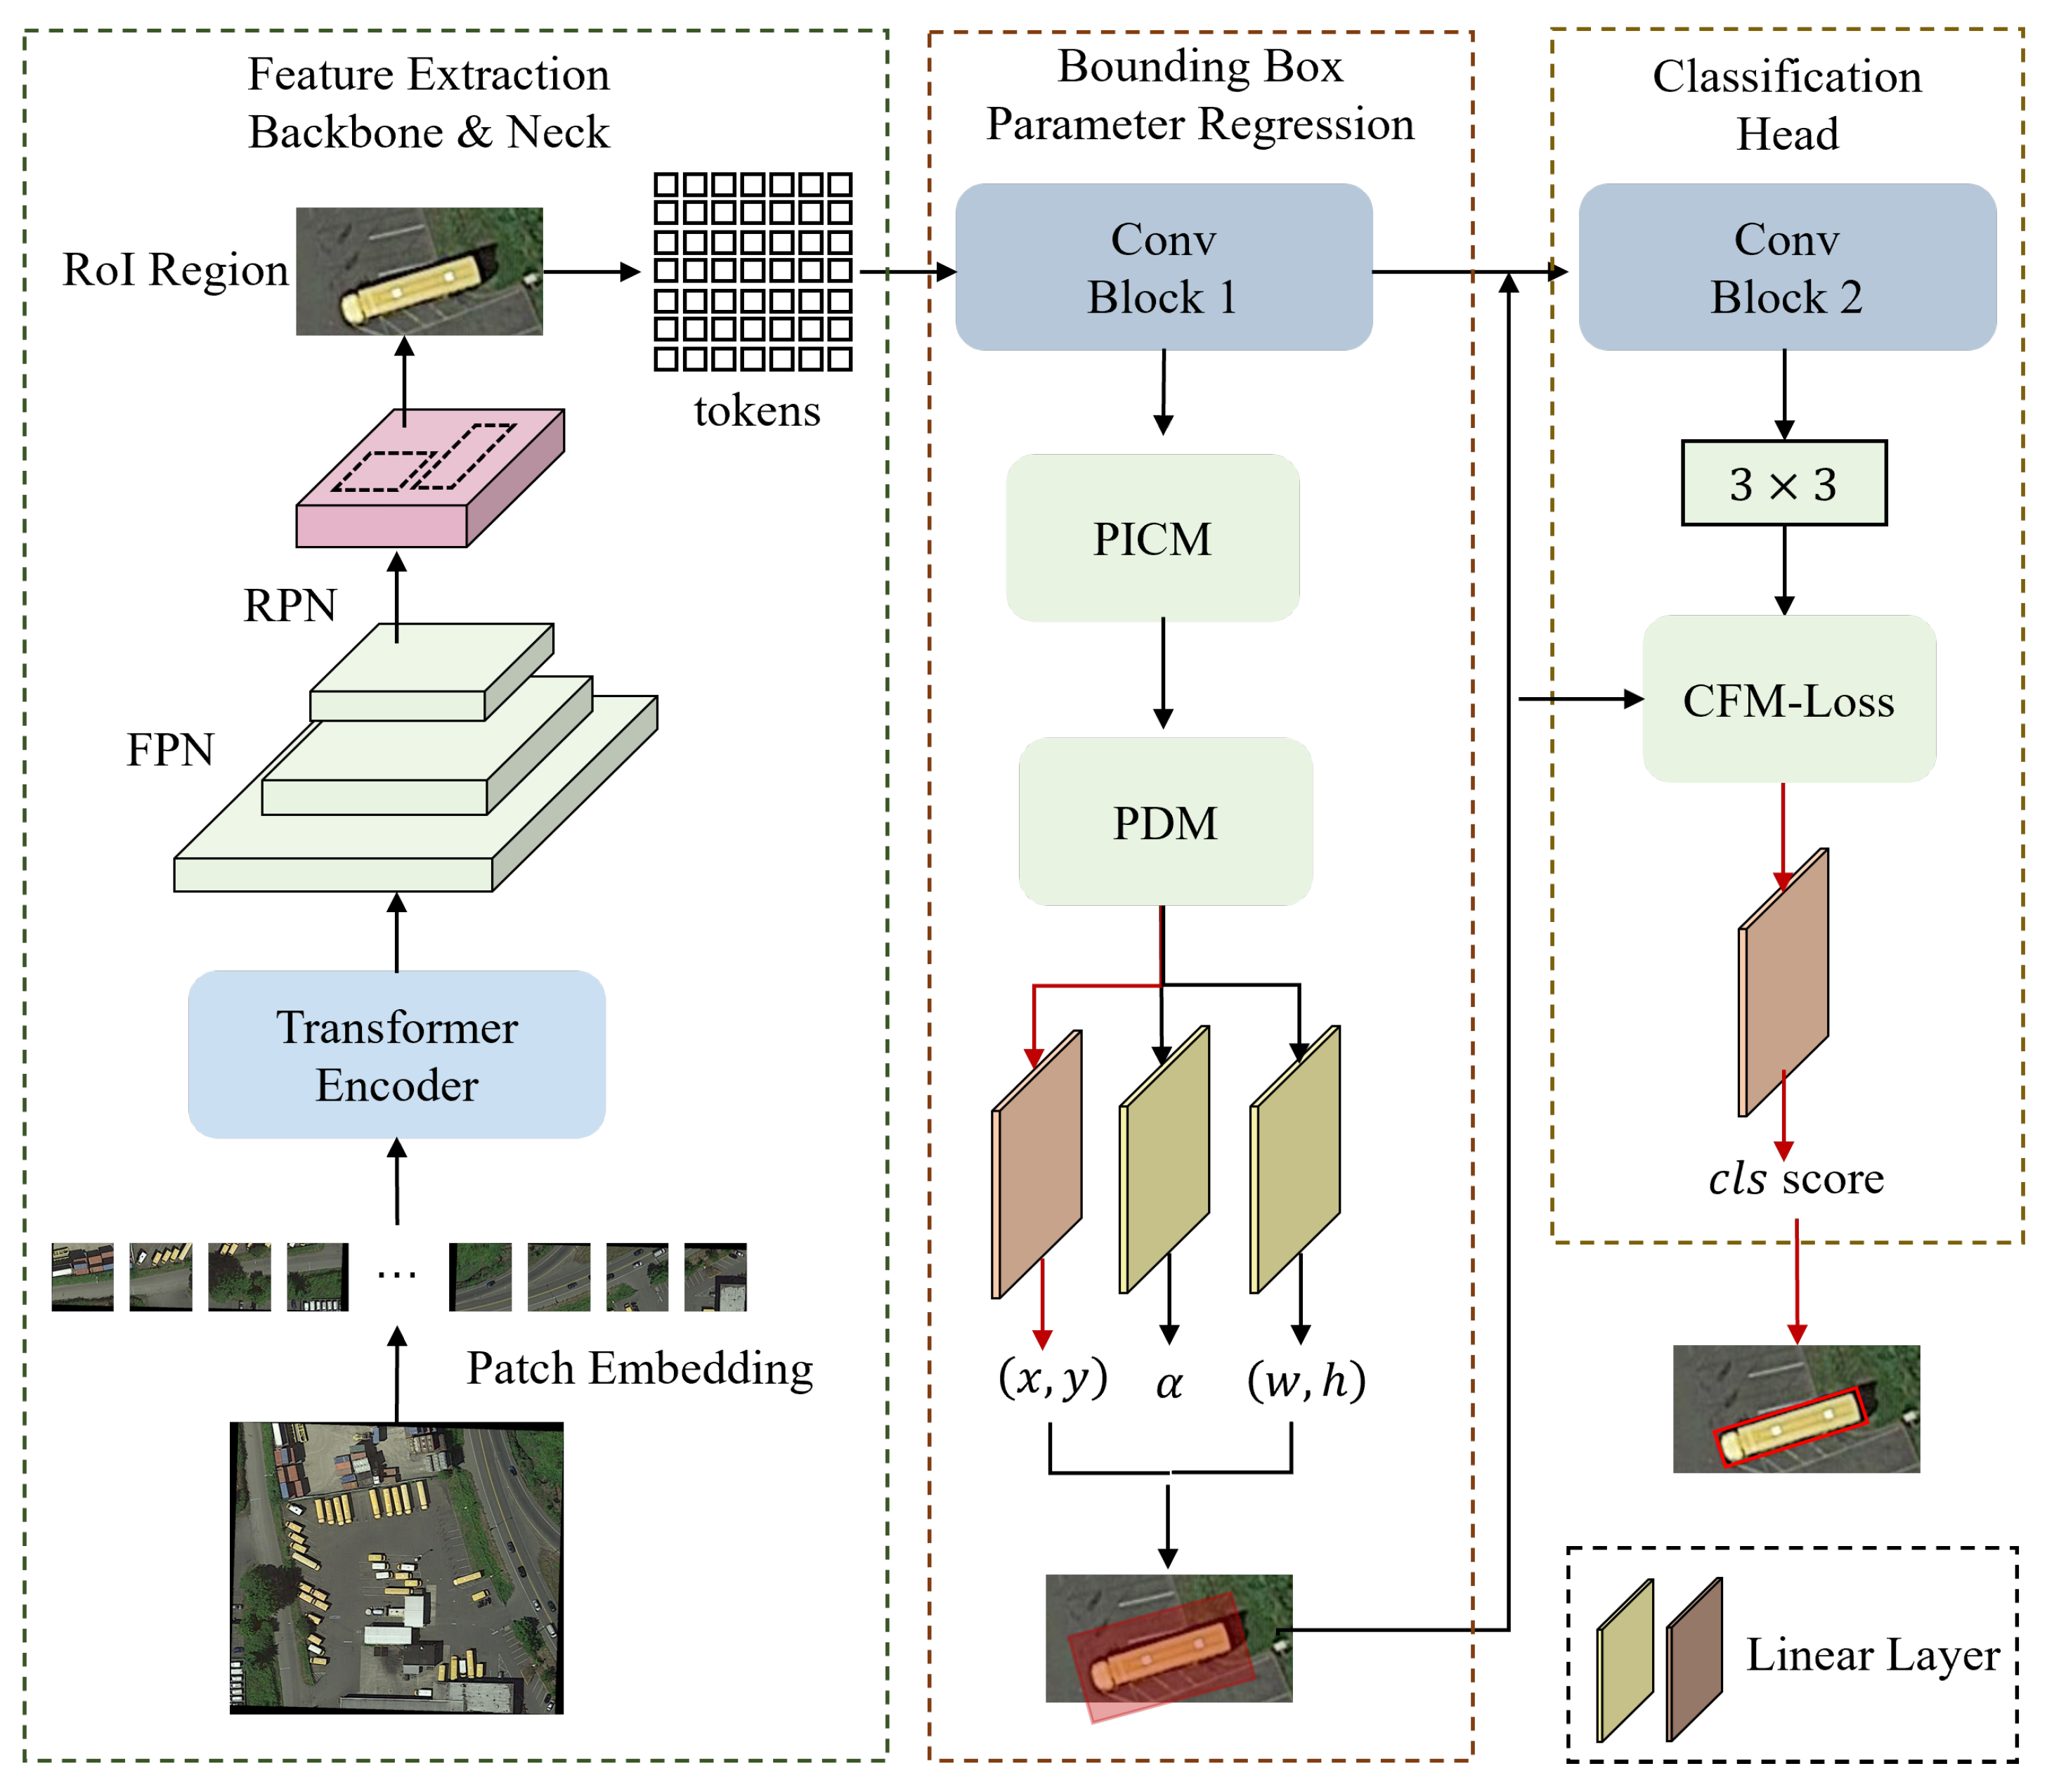
In this paper, a Feature Equalization and Hierarchical Decoupling Detector is proposed (as shown in Figure 2). The network consists of three core components: Parallel Interleaved Convolution Module (PICM), Parameter Decoupling Module (PDM), and Critical Feature Matching (CFM-Loss). PICM captures diverse spatial feature information over long distances by combining square convolution with a sequence of large kernel strips with continuous orthogonal multi-branches. This enhances the network’s adaptability to objects with different aspect ratios. PDM decomposes the feature maps with different properties and assigns them to different regression branches to estimate the parameters of the target’s rotating bounding box so that the features characterizing the shape and orientation of the target are no longer coupled. Finally, in order to stabilize the training of different anchor frames that have captured the key features required for detection, CFM-Loss utilizes the intersection and concurrency ratio of the anchor frames to the truth labels, and the uncertainty of convolutional regression during the training process; designs the alignment criterion to evaluate the regression ability of different anchor frames; and assigns different training loss weights to each anchor frame so as to make the network fine-tuned to different templates and realize the stabilized training of the network.

3.2. Parallel Interleaved Convolution Module

When detecting objects with high aspect ratios, conventional square convolution exhibits a localized receptive field, which fails to fully encompass the target area—ultimately leading to insufficient feature extraction. In contrast, large-kernel square convolution effectively expands the model’s receptive field and enables the capture of long-range contextual information, yet it also risks introducing irrelevant features from the background region.
To address this and enhance the detector’s performance on high-aspect-ratio objects, we propose a Parallel Interleaved Convolution Module (PICM). This module adopts a multi-branch parallel architecture to fuse two types of features: local features extracted by square convolution and direction-aware contextual features obtained via large-kernel strip convolution. By doing so, it can effectively model long-range information across multiple spatial scales, mitigate the interference of background noise, and achieve precise extraction of critical features for targets with varying aspect ratios.
Given an input feature map X R C × H × W , we first utilize a square convolutional kernel K R C × H k × W k from deep convolutional layers to extract local detailed features. Here, C denotes the number of channels, and H k × W k represents the size of the convolutional kernel (with a default setting of 3 × 3). Following this initial square convolution step, we employ a set of parallel depthwise convolutions; each branch within this set comprises a sequence of horizontal and vertical large-kernel convolutions of different scales, which facilitates better feature capture for high-aspect-ratio objects. The detailed calculation process is as follows:
Y = C o n v 3 × 3 ( X ) , Y ^ = Y + i = 0 N V Conv i ( H Conv i ( Y ) )
In the equation, H Conv i and V Conv i stand for the horizontal strip convolution and vertical strip convolution of the i-th branch, respectively. The strip convolution kernel sizes for each branch are set to 5, 7, and 9. Unlike standard convolution, which extracts features from a square window, large-kernel strip convolution enables the network to prioritize long-range spatial features along either the horizontal or vertical direction. Through a group of parallel orthogonal large-kernel strip convolutions, the network can acquire integrated directional features from both the horizontal and vertical spatial axes. This allows for the effective modeling of multi-scale long-range contextual information, thereby strengthening the spatial-dimensional feature representation of high-aspect-ratio targets in remote sensing images. Additionally, our experiments reveal that the order of applying horizontal and vertical strip convolutions (whether horizontal first followed by vertical, or vice versa) has no significant impact on performance.
To boost feature interactions across different channels, we further apply a pointwise convolution to Y ^ to generate the fused feature map F. Each position in F encodes horizontal and vertical features that span long-distance spatial regions. Finally, we map the features from the pointwise convolution to attentional weights, which are then used to weight the input X. The output feature map Y o u t can be expressed as follows:
Y o u t = X C o n v 1 × 1 ( Y ^ ) ,
where ⊙ denotes element-wise multiplication operation. In this way, our parallel interleaved convolution module can fully extract different ranges of long-range spatial features, which effectively improves the network’s detection ability for high-aspect-ratio targets.

3.3. Parameter Decoupling Module

Most rotating target detection techniques base the prediction of all rotating bounding box parameters on a single shared feature map. Yet, each parameter of the rotating bounding box exhibits distinct characteristics: the prediction of center coordinates, width, height, and rotation angle relies on rotationally varying features, rotation-invariant features, and rotation-equivariant features, respectively. Employing shared feature maps can cause confusion and mutual interference among feature representations, thereby diminishing the prediction accuracy of individual parameters. Consequently, it is essential to predict rotating anchor parameters in a hierarchical manner using feature maps from different semantic levels. To address this issue, we introduce a hierarchical decoupling network, where branches at various levels handle the prediction of rotating bounding box parameters with distinct attributes, enabling hierarchical and decoupled parameter prediction.
We break down the regression process of the rotated bounding box into multiple branches for implementation. For different parameters within the bounding box, we group them by their characteristics and perform predictions in separate branches using distinct feature maps from the convolution module (as shown in Figure 3). This approach allows different parameters to be regressed independently without mutual interference, resulting in more accurate target rotation anchors. We calculate the various parameters of the rotated bounding box in a cascaded fashion using feature maps from different stages. A rotated anchor contains three parameter sets: the center point coordinates x , y , the size w , h , and the rotation angle α of the rotated anchor. These, along with classification scores, are derived from the 1st, 2nd, 3rd, and 4th layer feature maps of the Transformer module, respectively.
To elaborate, consider an input image represented as X R H × W × C ; we define the discrete output generated by the Transformer model as X p R N × ( P 2 · C ) . In this notation, ( H , W ) corresponds to the dimensions of the original image, C denotes the number of image channels, ( P , P ) specifies the size of each image patch, and N (calculated as H W / P 2 ) represents the total number of such patches.
Within the Parameter Regression Decoupling Module, we first resize the Transformer output X p to an n × n dimension. To further enhance the discriminative power of the feature maps, a convolutional layer is applied, leading to the following expression:
X m a p = C o n v R e s h a p e ( X p )
Subsequently, Global Average Pooling (GAP) is employed to capture the global characteristics of the patch-wise features. This operation aggregates information across the entire feature map, resulting in a compact global feature representation:
X g a p = 1 | | ( p , q ) X m a p ( p , q )
Here, X m a p ( p , q ) refers to the feature value at the ( p , q ) -th spatial position in the feature map X m a p , and | R | = n 2 denotes the total number of elements in X m a p (i.e., the number of spatial positions).
It is important to note that the above process describes the feature transformation for a single set of convolutional kernels. When three independent sets of convolutional kernels are utilized, three distinct groups of feature vectors—denoted as G 1 , G 2 , G 3 —are obtained. These feature vectors are then fed into separate fully connected layers to produce the final predictions for different bounding box parameters. The specific prediction formulas are given below:
d x , d y = W f c 1 ( G 1 ) θ = W f c 2 ( G 2 ) d w , d h = W f c 3 ( G 3 )
In these equations, ( d x , d y ) represents the predicted offset for the target’s center position, θ denotes the predicted rotation angle, and ( d w , d h ) stands for the predicted offset for the target’s size (width and height). W f c 1 , W f c 2 , W f c 3 are the learnable parameters of the three respective fully connected layers, which are optimized by analyzing the feature vectors G 1 , G 2 , G 3 .
To enable effective feature decoupling, the three groups of predicted parameters (position, angle, and size) are paired with the corresponding loss function components that are constructed based on grouped features (the detailed construction process is provided in Section 3). During model training, backpropagation is utilized to update the parameters of the convolutional layers. This iterative update process continuously strengthens the convolutional layers’ ability to extract feature representations tailored to each specific parameter, ultimately achieving the goal of decoupling the features associated with position, angle, and size.

3.4. Critical Feature Matching Loss Function

In remote sensing target detection, the key features essential for object localization are not evenly or regularly distributed across the entire object; instead, they are concentrated in specific regions. For instance, in ship detection, critical features lie in areas like the bow and stern—regions that distinctly reflect the target’s characteristics and differ significantly from the background. Some anchors may have a high intersection-over-union (IoU) with the target but fail to cover its key features, making their quality lower than that of positive samples with a lower IoU but which do encompass these critical features. Traditional approaches treat anchors with high IoU but varying quality equally, resulting in unstable network training.
To address the training instability caused by the detector’s uniform handling of templates of differing quality, this section proposes a dynamic matching cascade loss function based on anchor correction and convolutional alignment. This function leverages the IoU between anchors and ground-truth labels, along with the uncertainty of convolutional regression during training, to develop an alignment criterion for assessing the regression capability of different anchors. By assigning distinct training loss weights to each anchor, the network can fine-tune its processing of templates with varying quality, thereby achieving stable training.
Typically, existing methods involve selecting a positive sample frame that contains the target from thousands of preset frames and adjusting its shape and orientation to tightly enclose the target. This selection is usually determined by the IoU between the preset frames and the nearby ground-truth-labeled boxes. A preset frame is classified as a positive sample if its IoU exceeds a fixed threshold (commonly set to 0.5) and as a negative sample otherwise. This is calculated as follows (where denotes the positive/negative sample label assigned to the preset frame):
y = 1 , I o U ( b , g ) u 0 , otherwise
However, the targets in remote sensing images are characterized by large scale differences, various aspect ratios and multiple rotations, and the preset frames contain both targets and a large number of backgrounds, so it is difficult to accurately select the positive sample frames. Although the problem can be alleviated to a certain extent by manually setting preset frames with multiple directions, scales and aspect ratios, the computational complexity will increase exponentially. This phenomenon is especially obvious in remote sensing images with a large number of targets densely arranged. In target detection, the features for classifying and localizing objects are not regularly distributed at the same location of the objects, especially for those targets with arbitrary orientations and high aspect ratios, the label assignment strategy based on the input IoU values is difficult to capture the required useful features. Based on the above analysis, this section introduces the concept of alignment (ad) instead of IoU, which is defined as follows:
ad = ε · I in + ( 1 ε ) · I out μ σ I out I in
where σ denotes the sigmoid function; I i n is the input IoU representing the a priori informationabout the spatial matching; the I o u t denotes the feature alignment capability, whose value is the IoU between the prediction result and the corresponding label, i.e., the output IoU; and ε , μ are used to represent the regression uncertainty. When the difference between I i n and I o u t is too large, the regression process produces a large gradient, which indicates that the anchor frame regression process is unstable in network training, and the drastic changes in IoU represent anchors of lower quality. According to the defined alignment, negative samples with potential regression ability can be mined. In the training phase, the alignment degree of labels and preset frames is calculated, and preset frames whose alignment degree is higher than a fixed threshold are selected as positive samples. For the labels that do not match the preset frames, the preset frames with the maximum alignment degree are selected as positive samples, retaining potentially high-quality negative samples.
After obtaining the quality of the alignment evaluation for the different anchors, this section uses the regression power of the alignment characterization to weight the classification loss function and establish a strong correlation between the classification and regression tasks. In the existing remote sensing detectors, the classification score acquired by a preset frame does not accurately reflect the localization ability of that preset frame, which leads to a weak correlation between the classification and regression ability, making the detection results selected by the classification score inaccurately localized, and thus omitting or suppressing the preset frames with high regression potential. In order to fully exploit the ignored preset boxes with potentially high regression potential, for the categorization branch, a dynamic matching function is designed in this section, and w i is defined as
w i = a d p o s + 1 a d max
where w i is a compensation factor characterizing the localization ability of the preset anchor. It is weighted into the classification loss function as follows:
L c l s = w i · L c l s ( p , t )
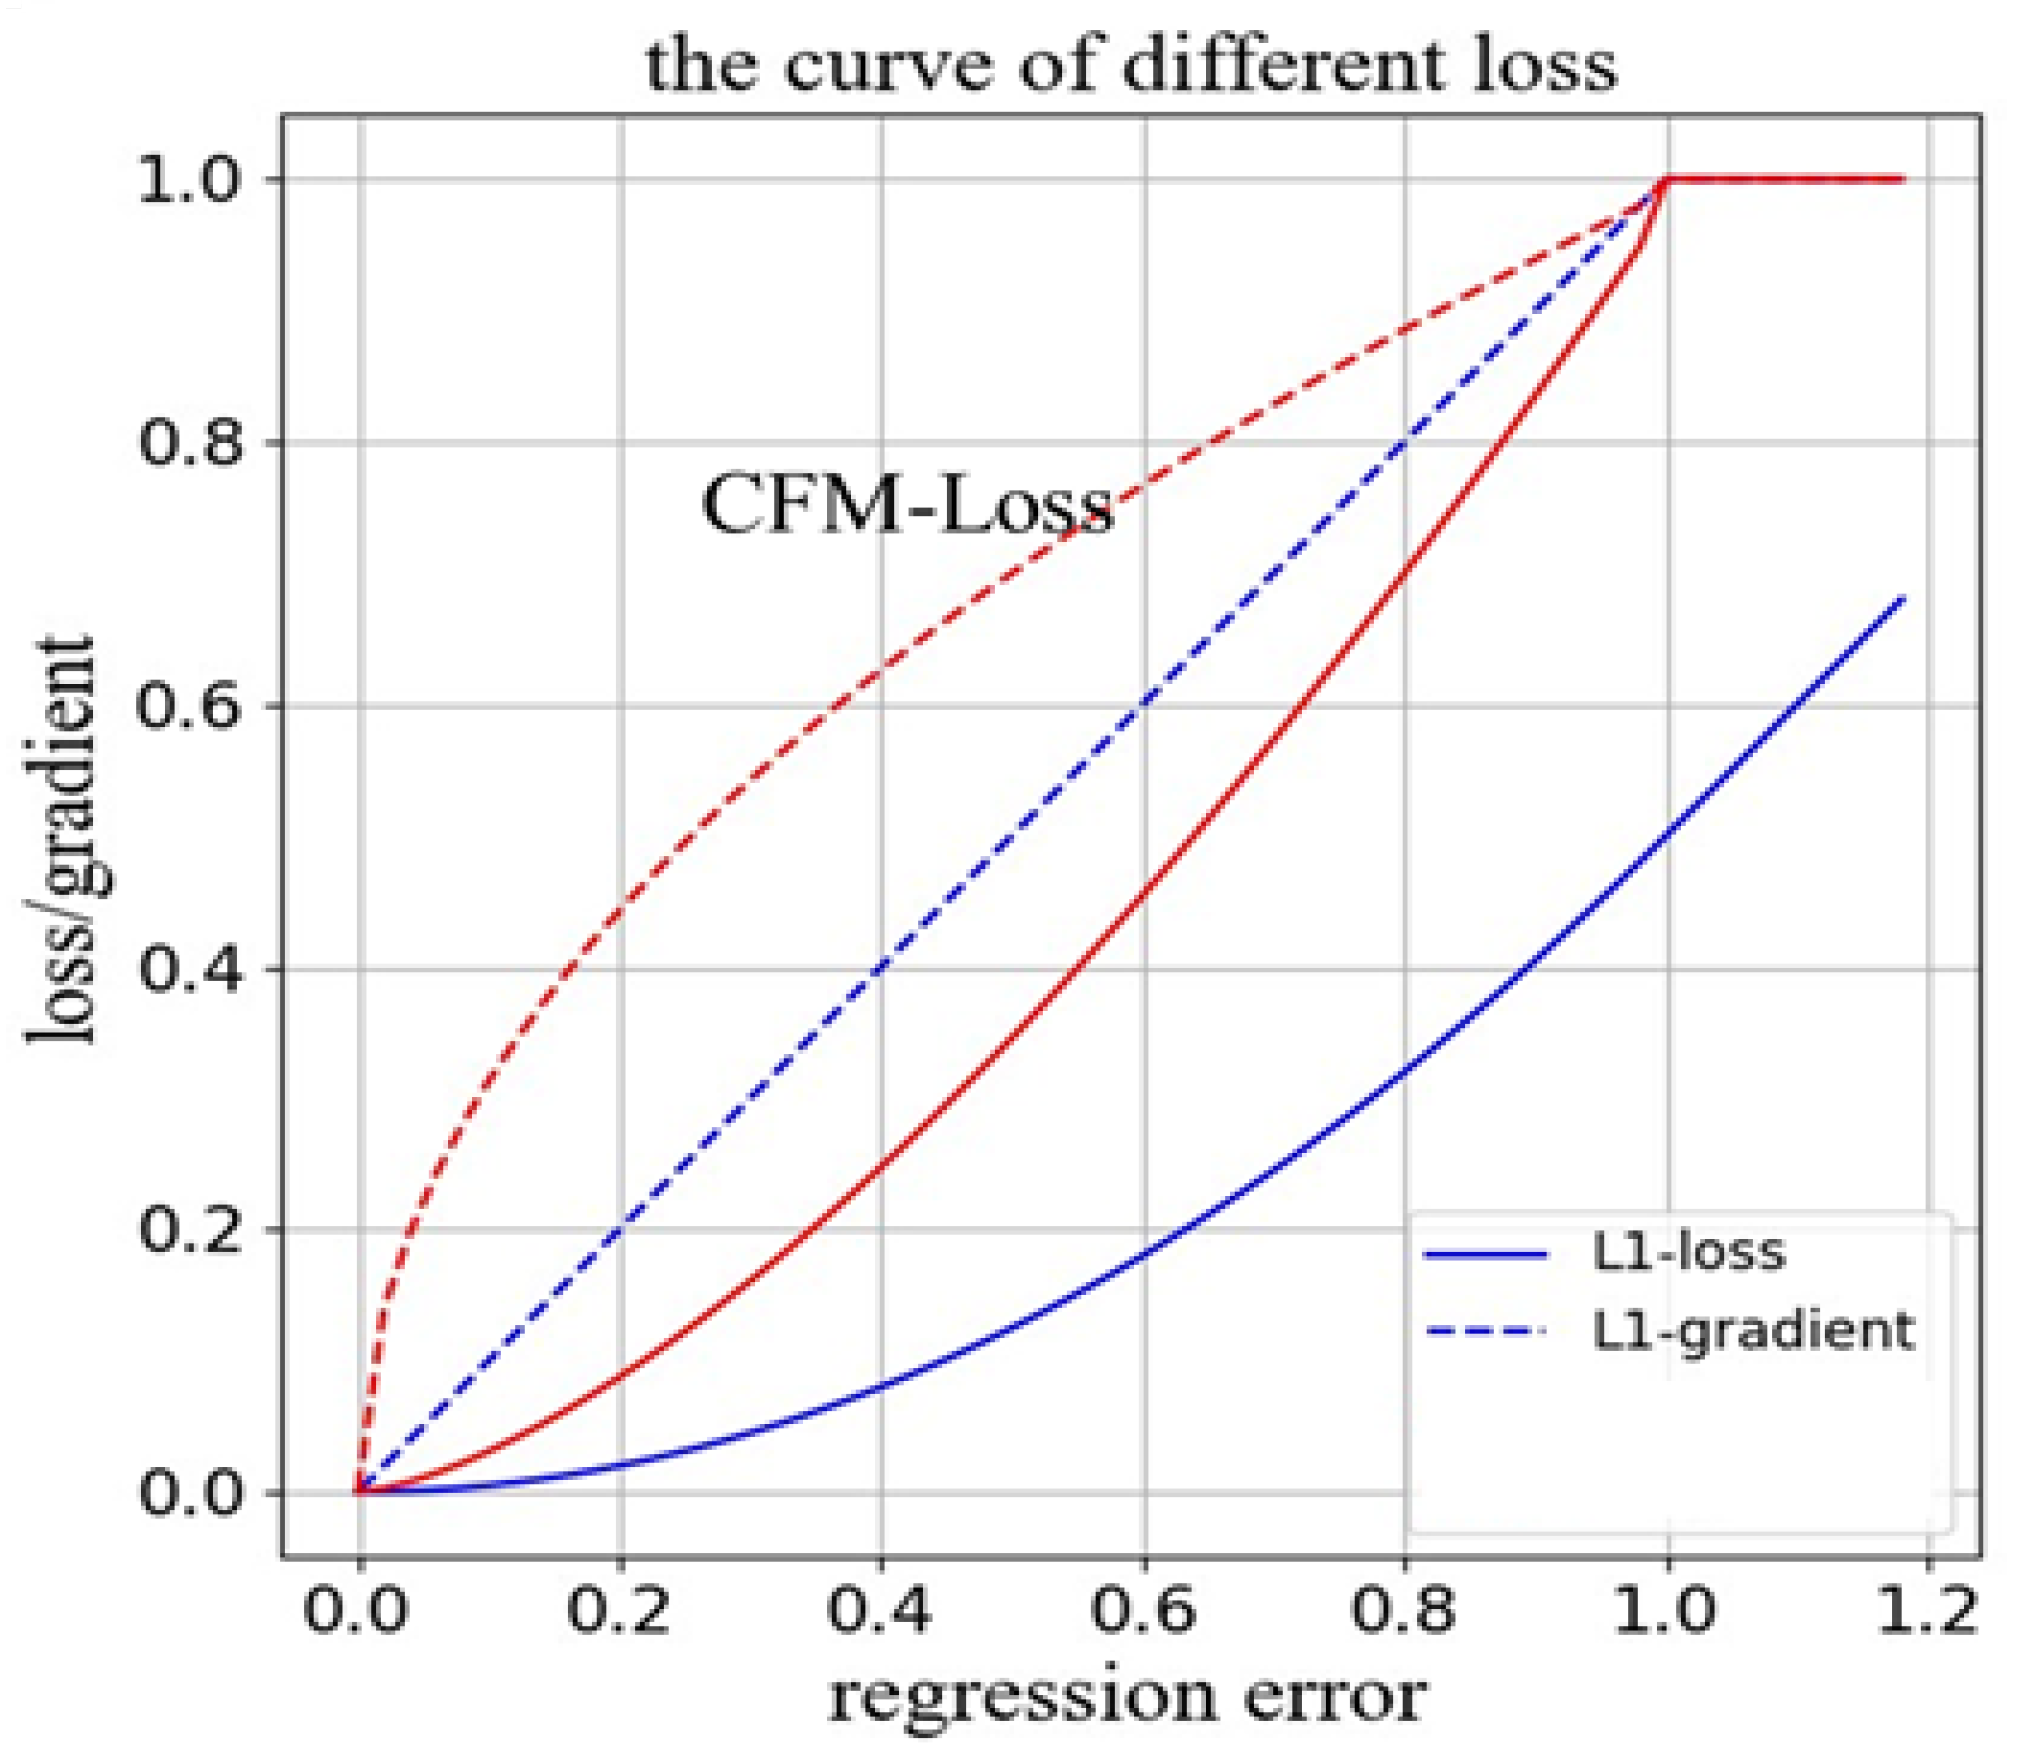
where p , t denote the category prediction results and category labels of the network, respectively. As can be seen from the above equation, higher classification scores accurately reflect higher localization performance (shown in Figure 4), which enhances the classifier’s recognition of high-quality regression-capable samples and can be further used to facilitate the regression of predefined frames in network training. The correlation between classification and regression is enhanced by jointly weighting the regression localization ability and classification ability for more accurate remote sensing target detection.
The multitask loss function of a hierarchical adaptive alignment network is a weighted sum of three losses:
L = L c l s ( p , t ) + λ L r e g ( p r , t r )
where L c l s , L r e g represent classification loss and regression loss, respectively.

4. Experiments

4.1. Experimental Dataset

Experiments were carried out using three widely adopted remote sensing image datasets: DOTA-v1.0 [22], HRSC2016 [23], and UCAS-AOD [24].
The DOTA-v1.0 dataset is extensively utilized in aerial image target detection tasks. It serves to train and test target detection algorithms, enhancing their accuracy and robustness in aerial scenarios. Moreover, this dataset supports various computer vision tasks such as classification, detection, segmentation, and tracking, along with specific applications like building reconstruction, feature extraction, and feature attribute prediction. It comprises 2806 images of varying sizes, with width and height ranging from 800 to 4000 pixels. In total, the dataset includes 188,282 independent instances categorized into 15 classes, each annotated with oriented bounding boxes. These classes are bridge (BR), harbor (HA), ship (SH), airplane (PL), helicopter (HC), small vehicle (SV), large vehicle (LV), baseball diamond (BD), ground track field (GTF), tennis court (TC), basketball court (BC), soccer field (SBF), roundabout (RA), swimming pool (SP), and storage tank (ST).
HRSC2016 is an optical remote sensing image dataset specifically designed for ship detection. It contains 1061 images with sizes ranging from 300 × 300 to 1500 × 900. The training set (436 images) and validation set (181 images) are employed for training purposes, while the remaining images are used for testing. The dataset covers seven common ship types: aircraft carrier, buoy, fishing boat, freighter, sailboat, tanker, and warship. The ships within the dataset exhibit diverse sizes, significant shape variations, and some ambiguous target characteristics.
The UCAS-AOD dataset includes samples of airplanes and automobiles as well as a certain number of negative samples (backgrounds). In total, it contains 2420 images and 14,596 instances. Specifically, the vehicle subset consists of 510 images with 7114 vehicle samples, and the aircraft subset includes 1000 images with 7482 aircraft samples.

4.2. Parameter Settings

Our model uses the swin-transformer as the backbone of the model. The original swin-transformer is fully pre-trained on ImageNet. The threshold of the positive sample matching process is 0.5, and the confidence of the detection head is 0.6. In addition, Adam optimizer is used to optimize the proposed Head network when the momentum is 0.9. The batch size is set to be 16. The initial learning rate is set to be 1.0 × 10 4 , and the decay rate is 0.33 after 1000 iterations. All experiments are performed on a Pytorch-equipped framework on a server with 4 NVIDIA RTX4070.

4.3. Evaluation Metrics

The main evaluation indexes in the field of rotating target detection include accuracy and speed. In terms of speed, FLOPs is the number of floating point operations, which can be interpreted as the amount of network computation, and is used to measure the complexity of the model. In terms of precision, this paper adopts Mean Average Precision (mAP) as the evaluation index of different detectors. mAP integrates precision and recall, and is affected by the IoU threshold, which is a recognized performance index in the field of target detection. mAP is calculated by the following formula:
mAP = 1 N c i = 1 N c 0 1 P i ( R i ) dR i
where N c represents the number of categories. R i represents the recall of the ith category. P i ( R i ) represents the i-th category in the recall rate R i . The formula for the precision and recall is as follows:
P = P T P T + P F , R = P T P T + N F
In rotating target detection, the P T is the number of correctly detected targets, the P F is the number of targets that were misdetected, and the N F is the number of missed targets. The precision rate refers to the proportion of correctly detected targets to the total number of detected targets, and the recall rate refers to the proportion of correctly detected targets to the number of real labeled targets. In order to determine whether a detection anchor is correctly detected, it is also necessary to calculate the ratio of the area of intersection between the predicted anchor and the real anchor and the area of concatenation between the predicted anchor and the real anchor, i.e., IoU (Intersection Over Union). Generally speaking, the IoU will set a threshold, usually 0.5, if the IoU is greater than the threshold, then the prediction result is determined to be correct.

4.4. Comparative Experiments

4.4.1. Comparative Experiment Results on DOTA

A comprehensive comparison of FEHD-Net with other state-of-the-art methods are performed on the DOTA dataset. As shown in Table 1, for plane (PL), bridge (BR), ground traffic (GTF), ship (SH), soccerball field (SBF), roundabout (RA), and helicopter (HC), our proposed FEHD-Net achieves the best AP values of 90.12, 67.43, 82.17, 89.93, 79.85, 76.04, 83.42. In addition, we achieve the best average result in all categories with a mAP value of 81.73. The classical R3Det recodes the corrected bounding box position information into the original feature map by pixel-by-pixel feature interpolation, which allows the feature expression to match the position of the predicted box more accurately, and improves the detection accuracy effectively. The detection accuracy is effectively improved. However, the global features of the objects are not fully extracted, and thus the accuracy is slightly lower than that of our method in detecting objects with high aspect ratios, such as bridges and ships. The previous best method S2ANet is able to model the differentiated contextual information requirements of different types of objects more accurately by dynamically adjusting the large spatial sensing field of the network, but the use of inflated convolution may lead to the sparsity of key features. Therefore, the mAP value is 2.11% different from that of the proposed FEHD-Net. Our method achieves the optimal accuracy by simultaneously extracting local detail features and multi-scale long-range context features through spatially interleaved convolutional modules and realizes accurate rotated anchor parameter prediction through a decoupled network.
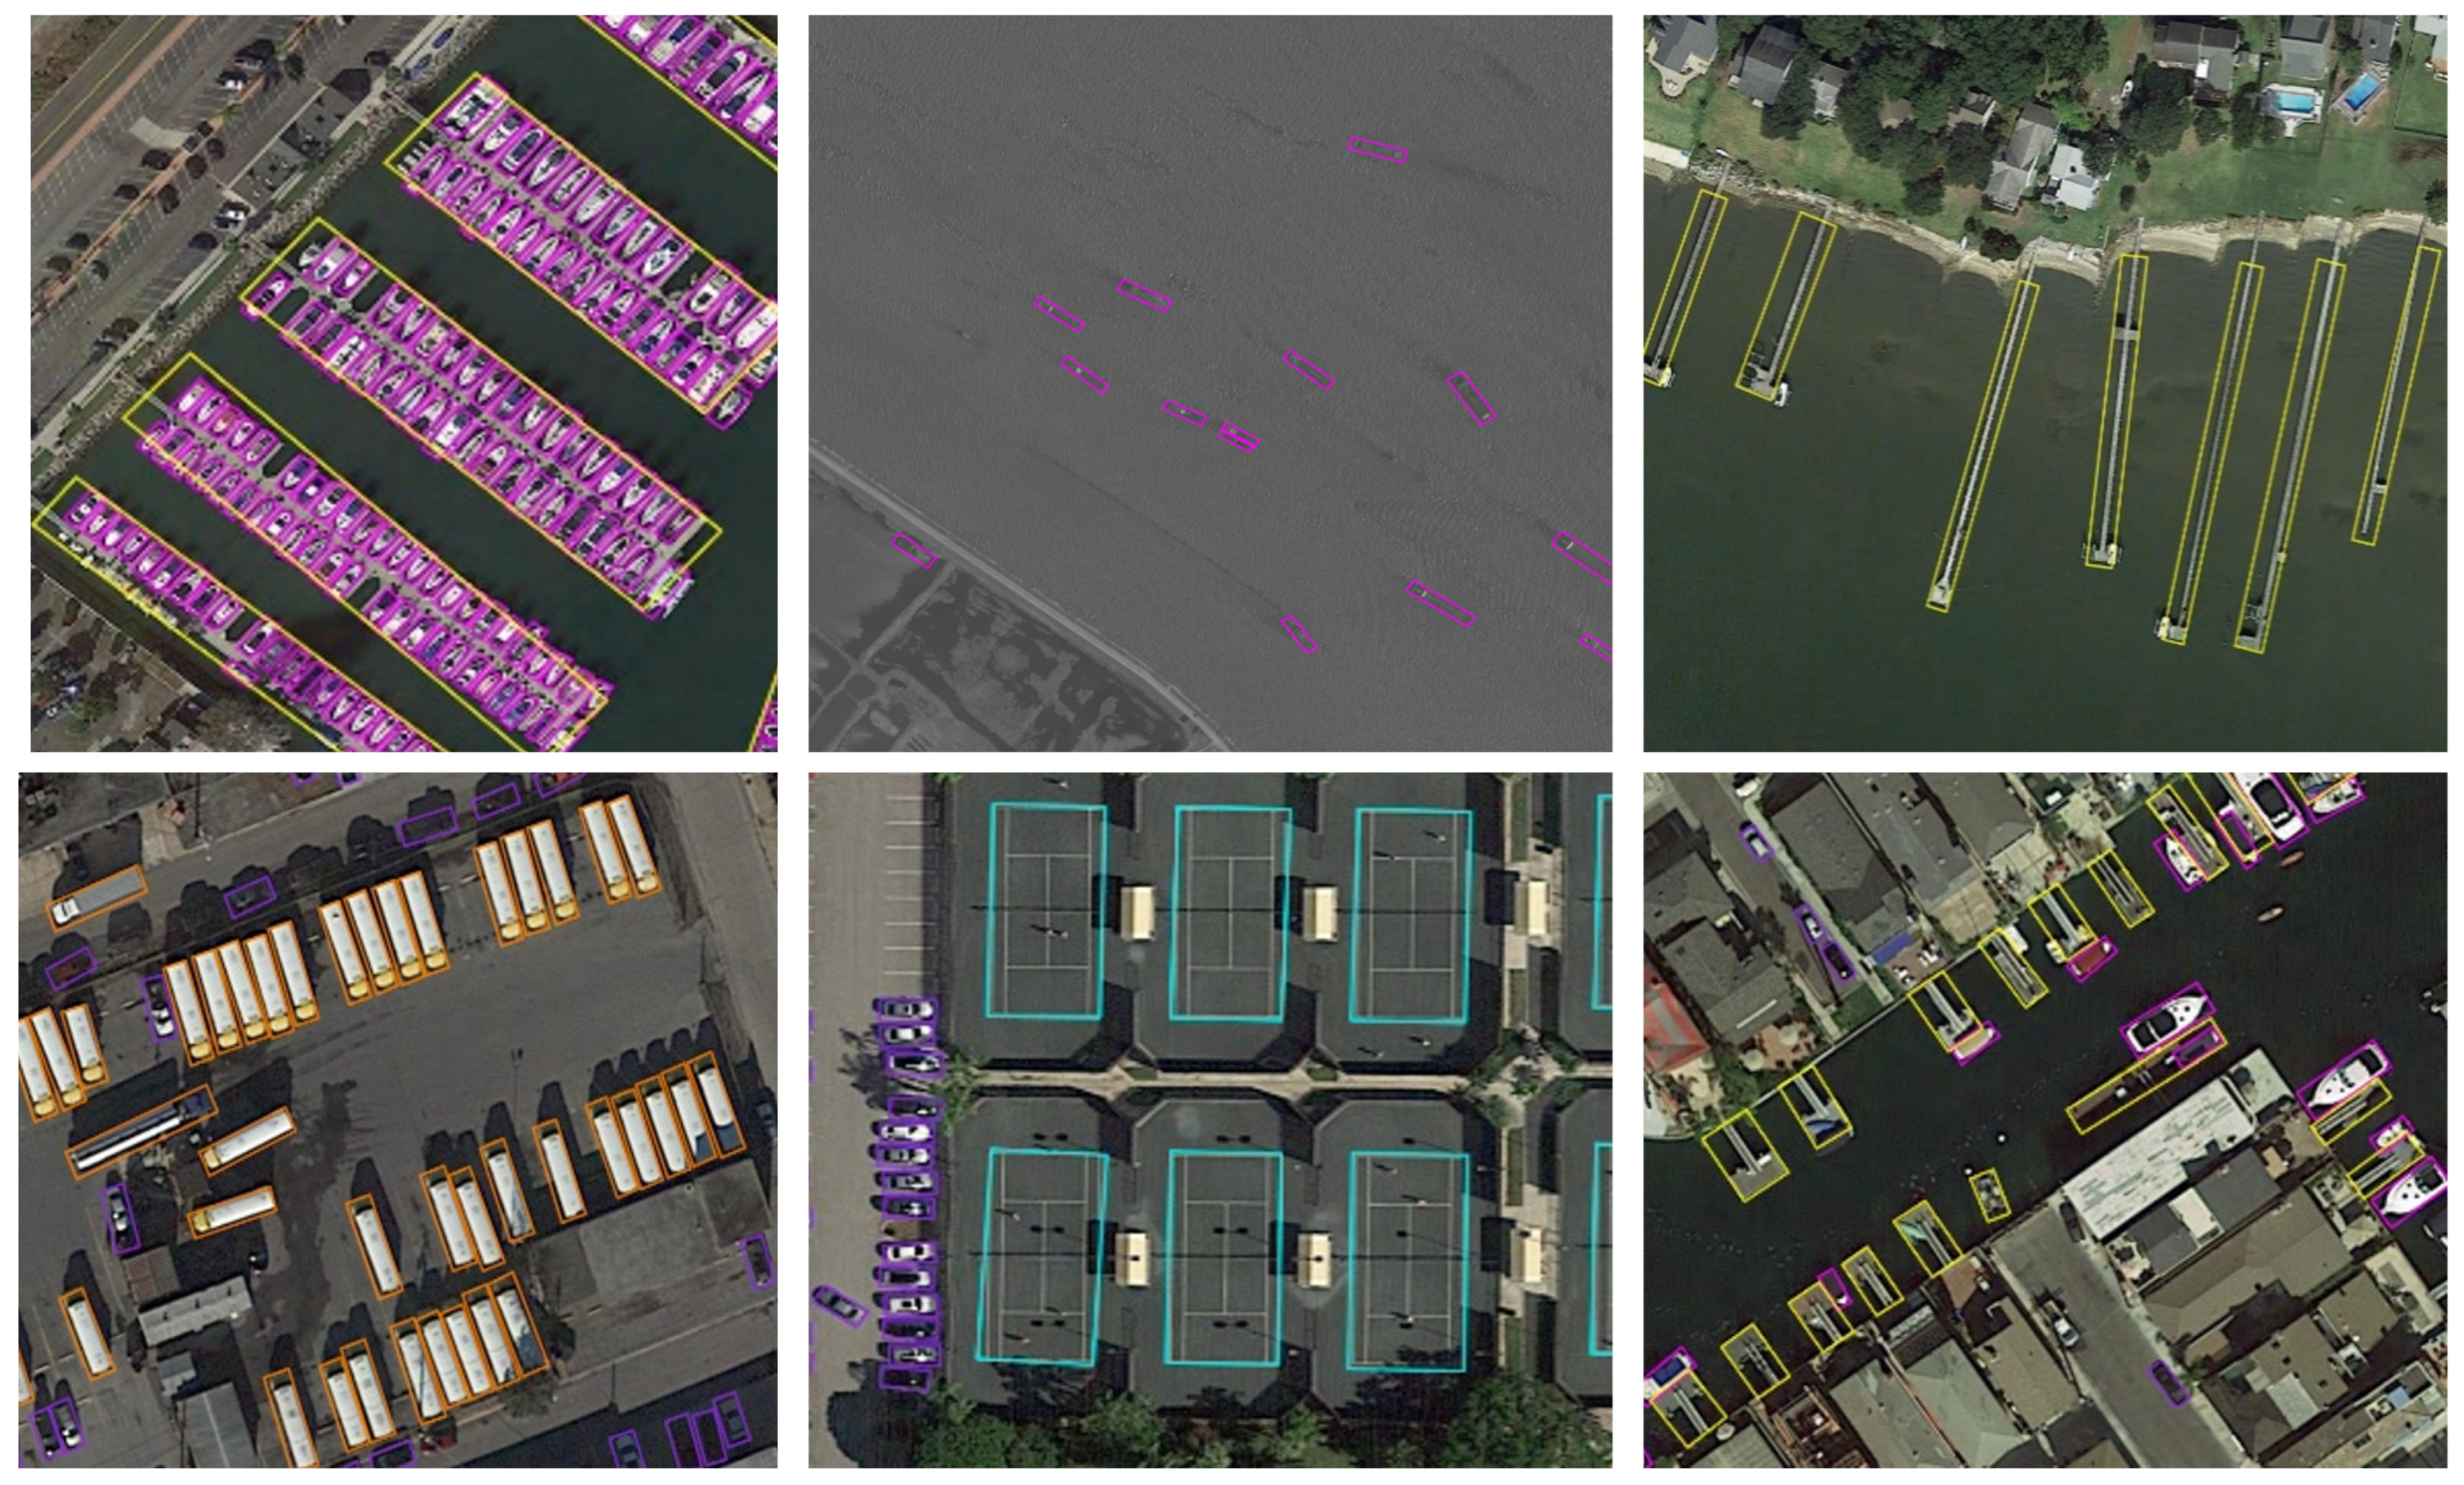
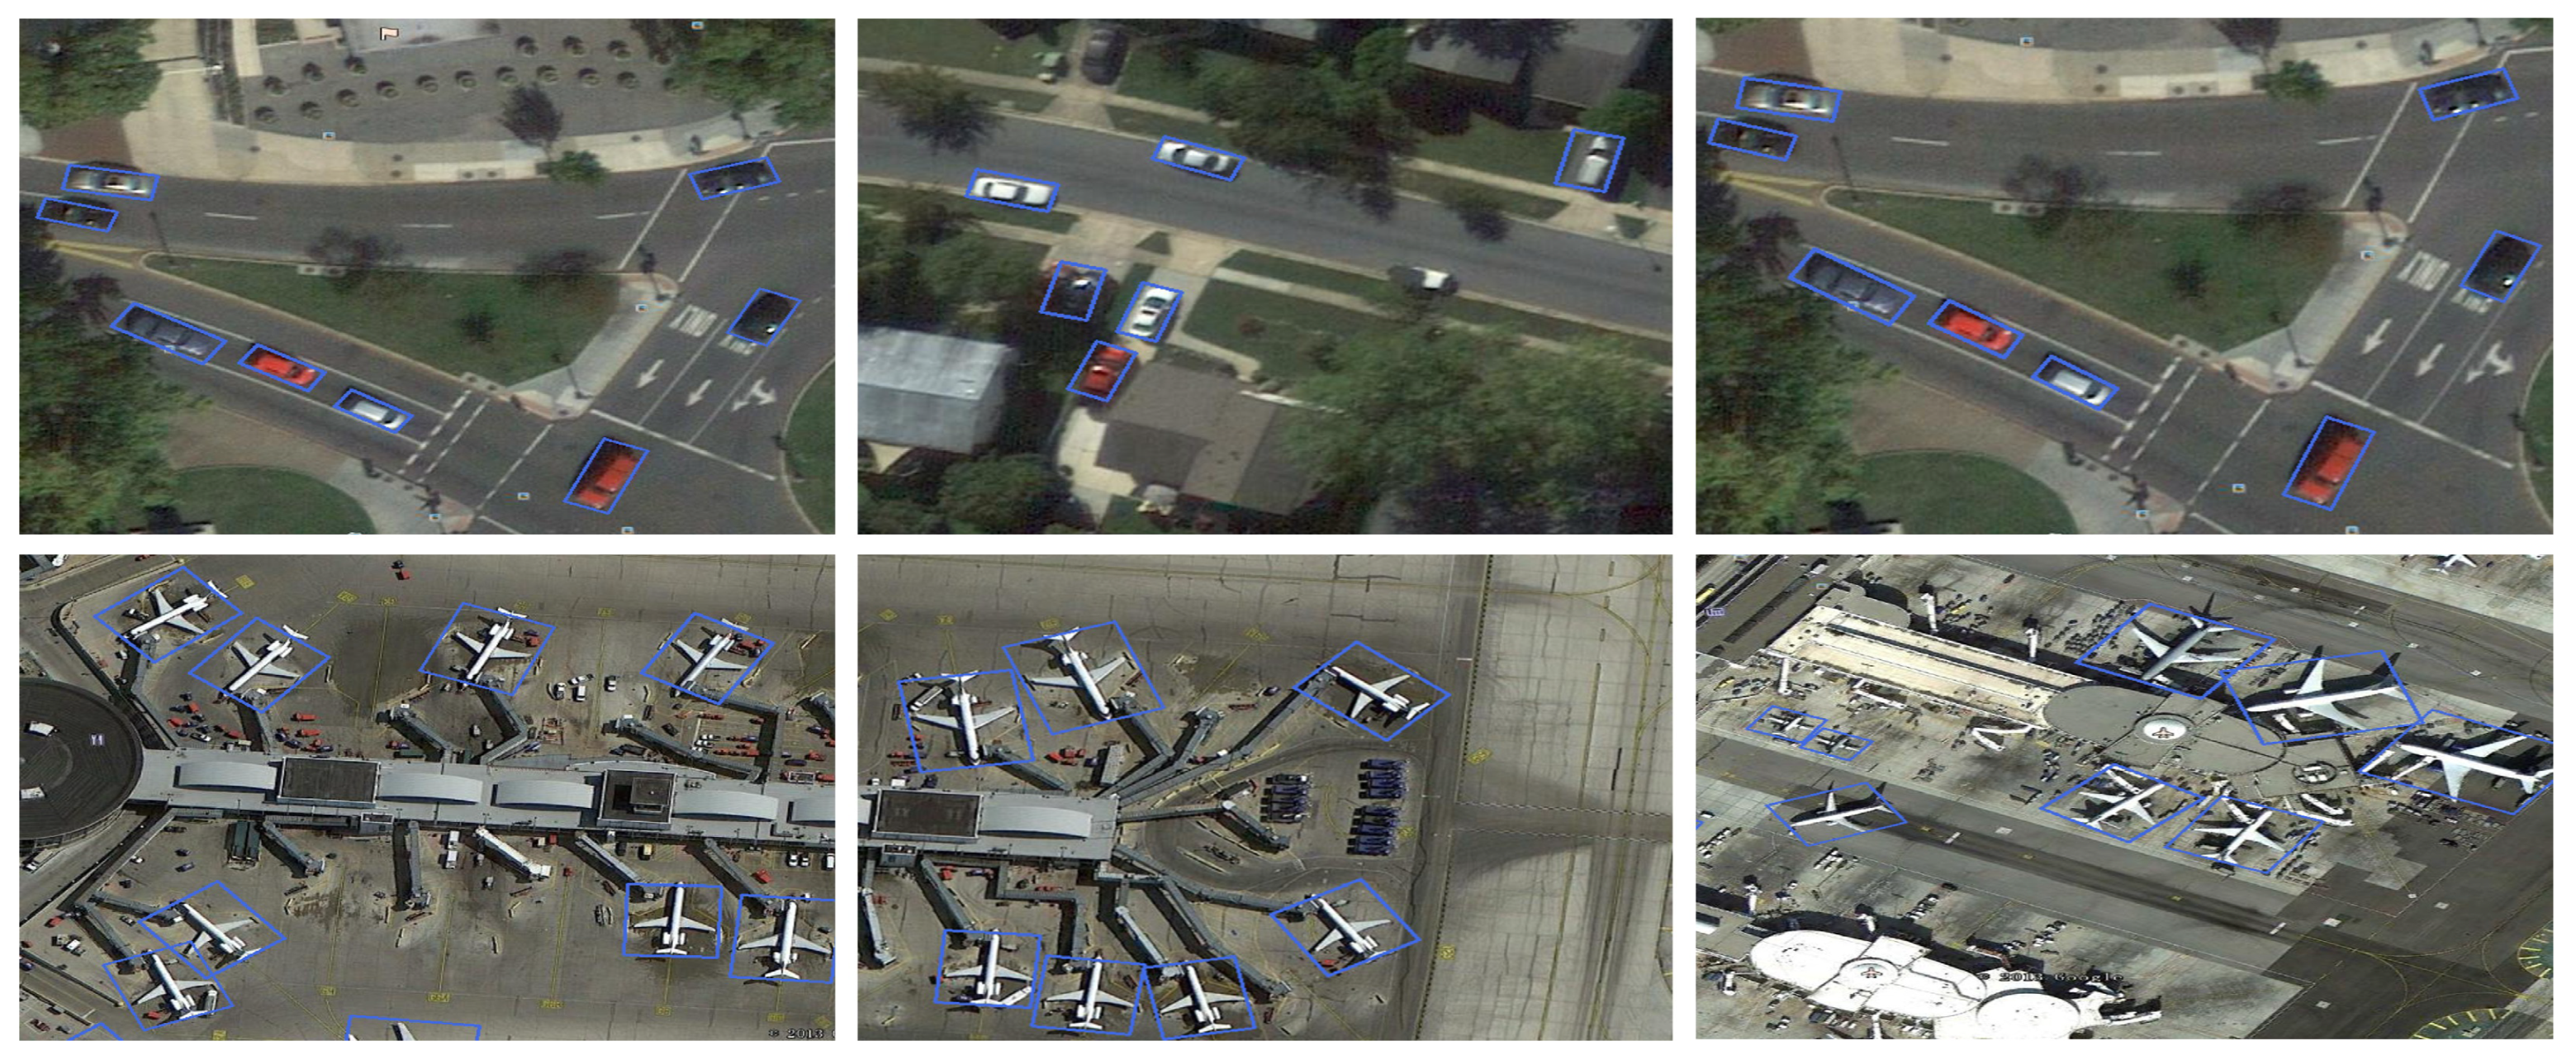
The visualized detection results of some DOTA datasets are shown in Figure 5. The proposed FEHD-Net can effectively localize the boundaries of different targets through decoupled parameter prediction, and thus accurately detect densely distributed small targets (e.g., boats and small vehicles). For targets with arbitrary orientations (e.g., airplanes), FEHD-Net can accurately capture their spatial orientations in order to realize the adaptation to arbitrary rotation angles. In addition, FEHD-Net can also realize the detection effect of targets with high aspect ratio (e.g., ships and bridges) which is closer to the real label of the target. Even when the contrast between the foreground objects and the background is low (e.g., the last column of images), our method is still able to accurately detect bridges and ships with ambiguous texture detail information, which demonstrates the good generalization ability of the method.

4.4.2. Comparative Experiment Results on HRSC2016

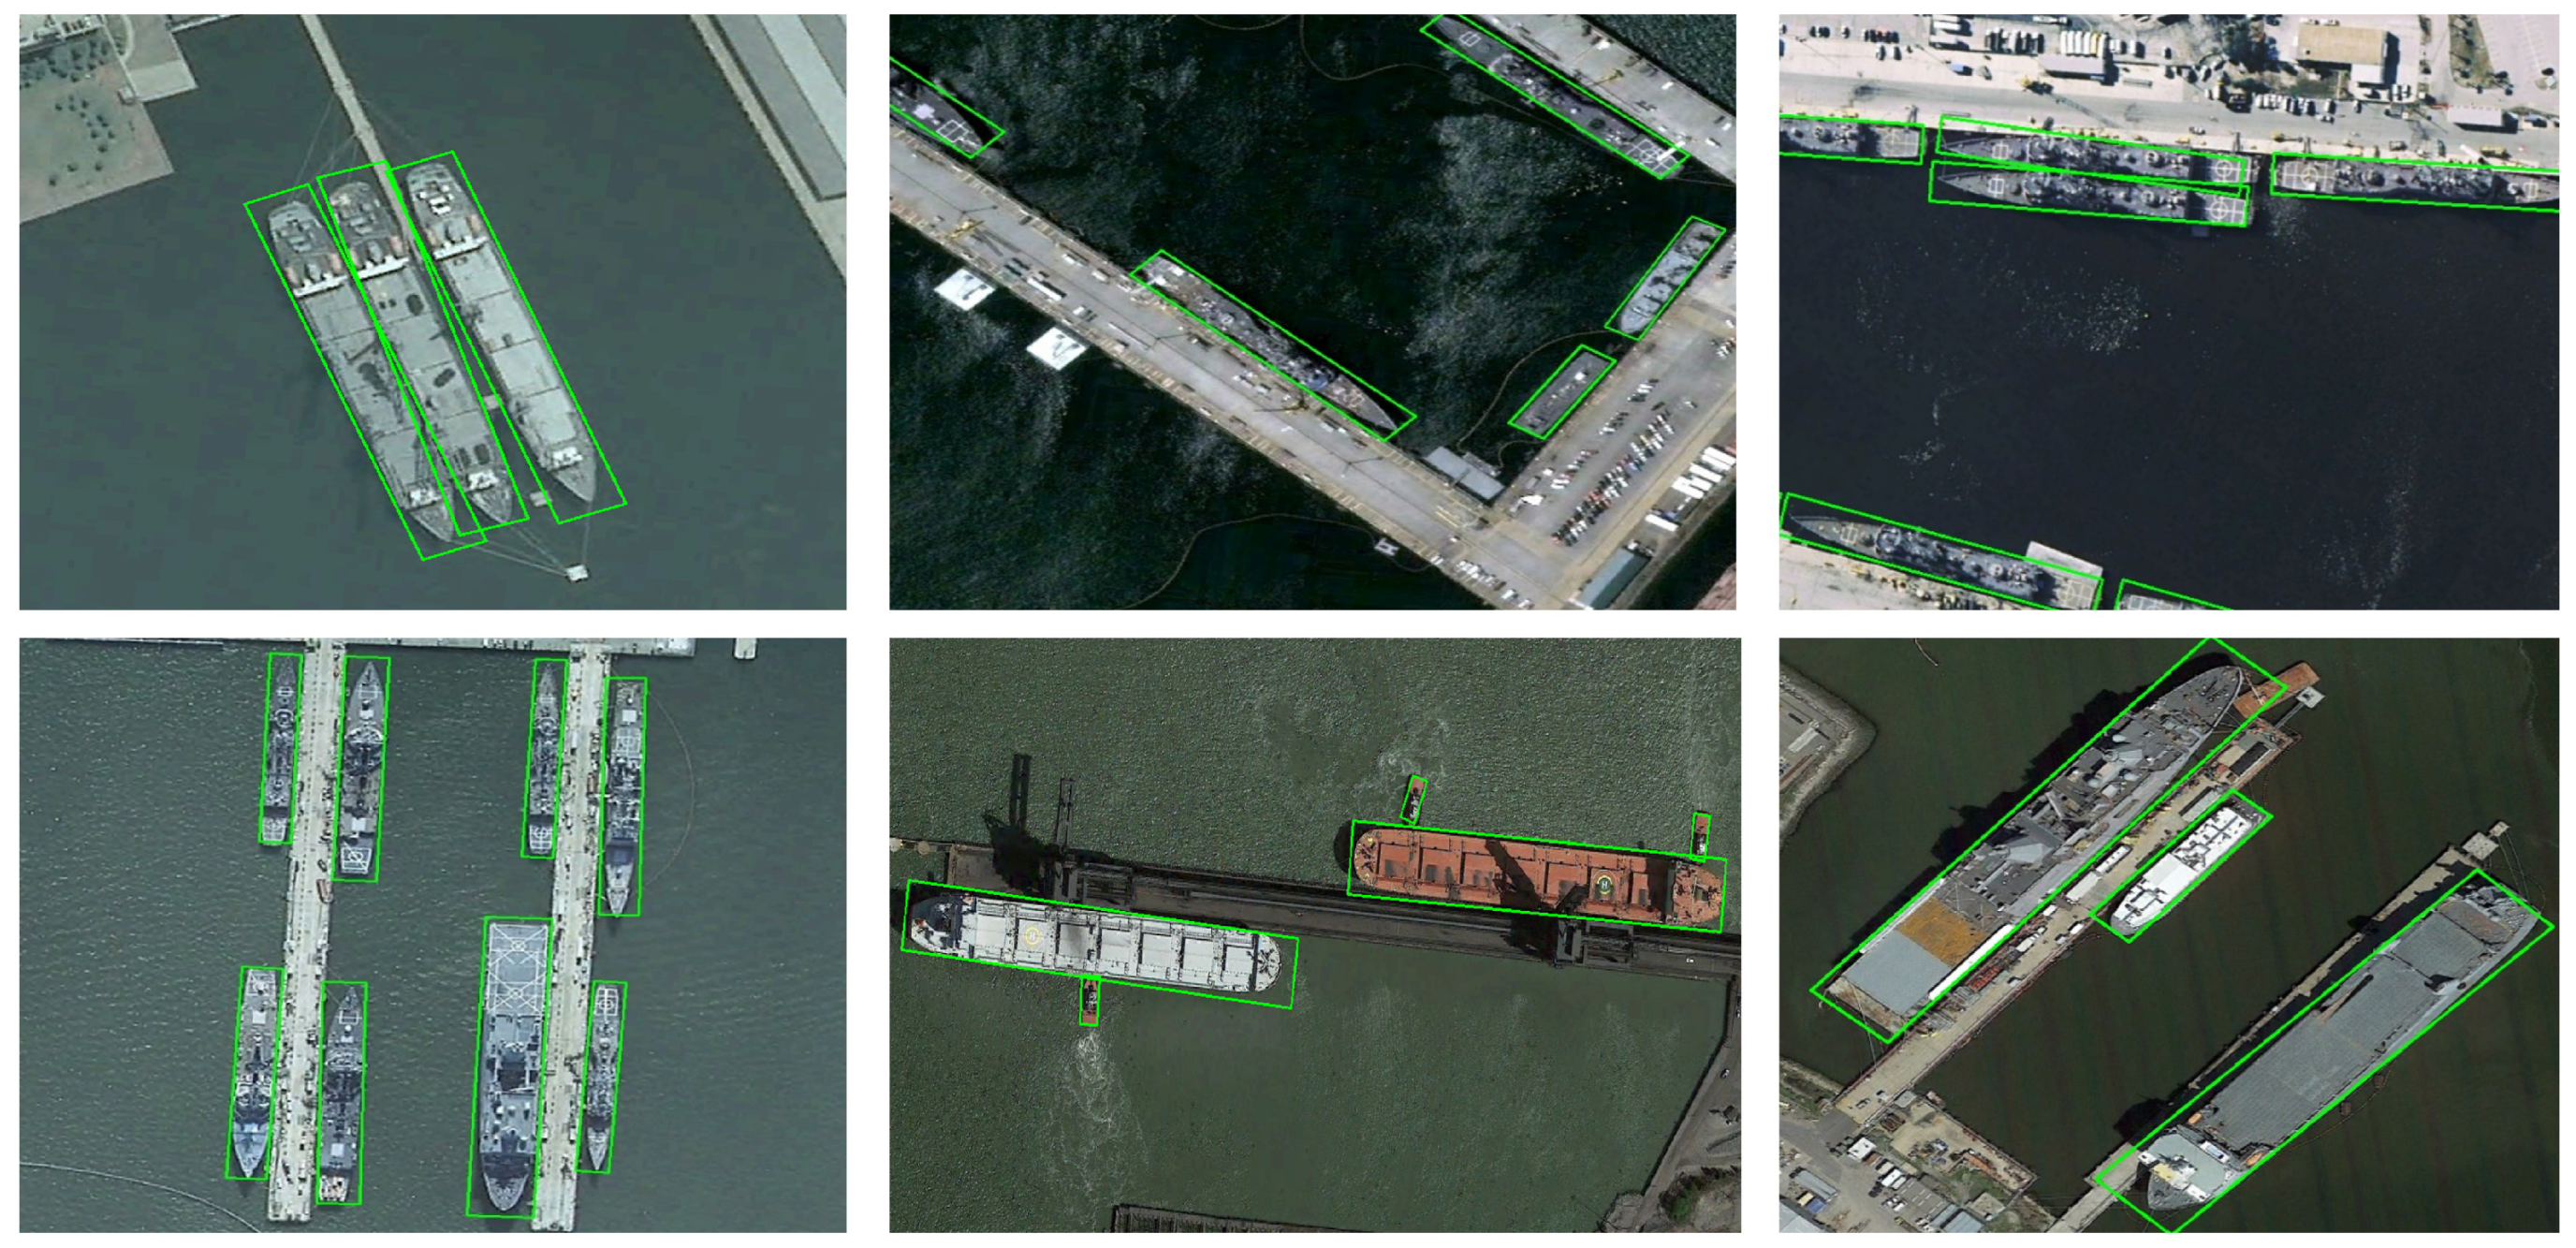
Table 2 demonstrates the detection results of comparison methods and FEHD-Net on the HRSC2016 dataset, and it can be seen that the mAP of FEHD-Net is 92.73%, which is more than the other methods. Figure 6 shows some detection results of FEHD-Net on HRSC2016. It can be seen that this dataset contains mostly rotating multi-directional ship-like targets with extreme aspect ratios. In the case of image background complexity (first column of the second row), similar appearances of the background and the target (third column of the first row), and large variations of light and darkness in the image (third column of the second row), FEHD-Net can successfully distinguish the target from the background, which indicates that our proposed feature decoupling method can separate the background and target features, and enable the network to estimate the target scale and boundary more accurately.

4.4.3. Comparative Experimental Results on UCAS-AOD

On the UCAS-AOD dataset, the best average result for all categories is obtained with 91.67% mAP (as shown in Table 3). S2A-Net uses the Orientation Detection Module to perform regression tasks on Orientation-Sensitive Features and orientation-invariant features. The Orientation Detection Module (ODM) in S2ANet performs the regression task on the Orientation-Sensitive Features (OSF) and the classification task on the Orientation-Invariant Features (OIF). The performance is improved because the variability in the feature maps is taken into account in the classification and regression tasks. However, there are still differences in the features required for predicting each parameter in the regression task, such as the features required for predicting the position parameter ( x , y ) , the rotation-invariant features for the shape parameter ( w , h ) , and the rotated isovariant features needed for the predicted angle θ . So our method has a further improvement in performance.
As shown in the first row and first column of Figure 7, there are a large number of densely parked airplanes, and at the same time, there is a strong similarity between the background and the target, and our method has a good recognition effect on this image. As shown in the second column of the third row of Figure 7, there are a large number of densely traveling vehicles on the traffic section, and our method has no obvious omission.
The above results fully demonstrate the effectiveness of our method, in which the feature decoupling module fully decouples the shared feature maps and accurately extracts the target spatial features required for the prediction parameters. Meanwhile, the cascading activation mask makes the network more focused on the target features and suppresses the background features; the cascading feature also makes the decoupling modules interrelated; and the use of backpropagation also makes the decoupling more accurate, thus making the prediction results more accurate.

4.5. Ablation Studies

4.5.1. Analysis Experiment of Different Components

The relevant ablation experiments are conducted on HRSC2016 to validate the performance of each module proposed in FEHD-Net. The experimental results are shown in Table 4. The baseline model uses a single feature map for the prediction of all the parameters may lead to the mutual interference among the features, and thus only achieves a 83.47% mAP. When the hierarchical decoupling network is added, the performance of the detector is improved by 3.16%, which indicates that the decoupled parameter prediction through multiple independent stages in a cascade manner can achieve better classification and localization results. On this basis, after adding the strip convolution module, the module effectively models the long-range context information of multiple spatial directions through multi-branch orthogonal large kernel strip convolution, which enhances the feature representation of the network for objects with different aspect ratios, and improves the overall detection performance of FEHD-Net by 4.68%. Finally, with the introduction of the dynamic progressive activation mask, the model accuracy is improved by 2.43%, which indicates that the dynamic progressive activation mask provides fine-grained guidance for the hierarchical decoupling network, and makes the network more focused on the target foreground region, thus realizing the accurate prediction of rotated anchor parameters. The above experimental results also verify the compatibility among the modules, and the detector achieves the best performance of 92.73% mAP when all the proposed modules are used simultaneously.

4.5.2. Effects of Cascaded Parameter Branches

To further validate the effect of the proposed PDM, we modify the number of parametric regression branches in the cascade and conduct experiments on HRSC2016 and UCAS-AOD datasets. As shown in Table 5, in HRSC2016, the detection performance of FEHD-Net gradually improves with the increase in the number of cascaded branches and reaches the highest value of 92.73% after cascading three branches, which is 2.42% higher than that of the single-level branch. This indicates that under the guidance of PDM, the regression results of the rotated bounding box parameters in the previous cascade will help the subsequent cascade to recognize the features and improve the regression accuracy of the box. However, when the number of branches in the cascade continues to increase, the detection accuracy of FEHD-Net begins to decrease. This is due to the fact that the regression accuracy of each branch in the PDM will have a great impact on the prediction of the subsequent branches, and once the prediction result of one branch is wrong, it is difficult to obtain the correct result of the subsequent branches; too many cascaded branches will bring the overfitting problem of the model, and the wrong prediction of one branch will affect the overall detection accuracy of the model. Therefore, we finally choose to cascade the 3-layer rotating bounding box parameter regression branch. As shown in Table 5, experimental results on the UCAS-AOD can also prove our theoretical analysis.

4.5.3. Analysis of Parallel Interleaved Convolution Module’s Parameters

The ablation experiments are conducted on the design of each component of the PICM module as shown in Table 6. The results indicate that the proposed multi-branch large-kernel bar convolution structure achieves the best detection performance. This can be explained by the fact that through orthogonal bar convolutions of different scales, the network can effectively capture anisotropic feature representations in long-range space, thereby enhancing the model’s perception ability for common elongated objects in remote sensing images. Meanwhile, we find that changing the order of horizontal and vertical convolutions has almost no impact on the performance of the detector. Next, we evaluate the role of depthwise separable square convolutions. Removing this component leads to a significant decrease in detection accuracy, which also indicates that using square convolutions for local detail feature extraction is crucial for the precise detection of remote sensing targets. Additionally, replacing bar convolutions with square convolutions and dilated convolutions of the same scale results in a decrease in mAP, which further validates the effectiveness of using large-kernel orthogonal strip convolutions.

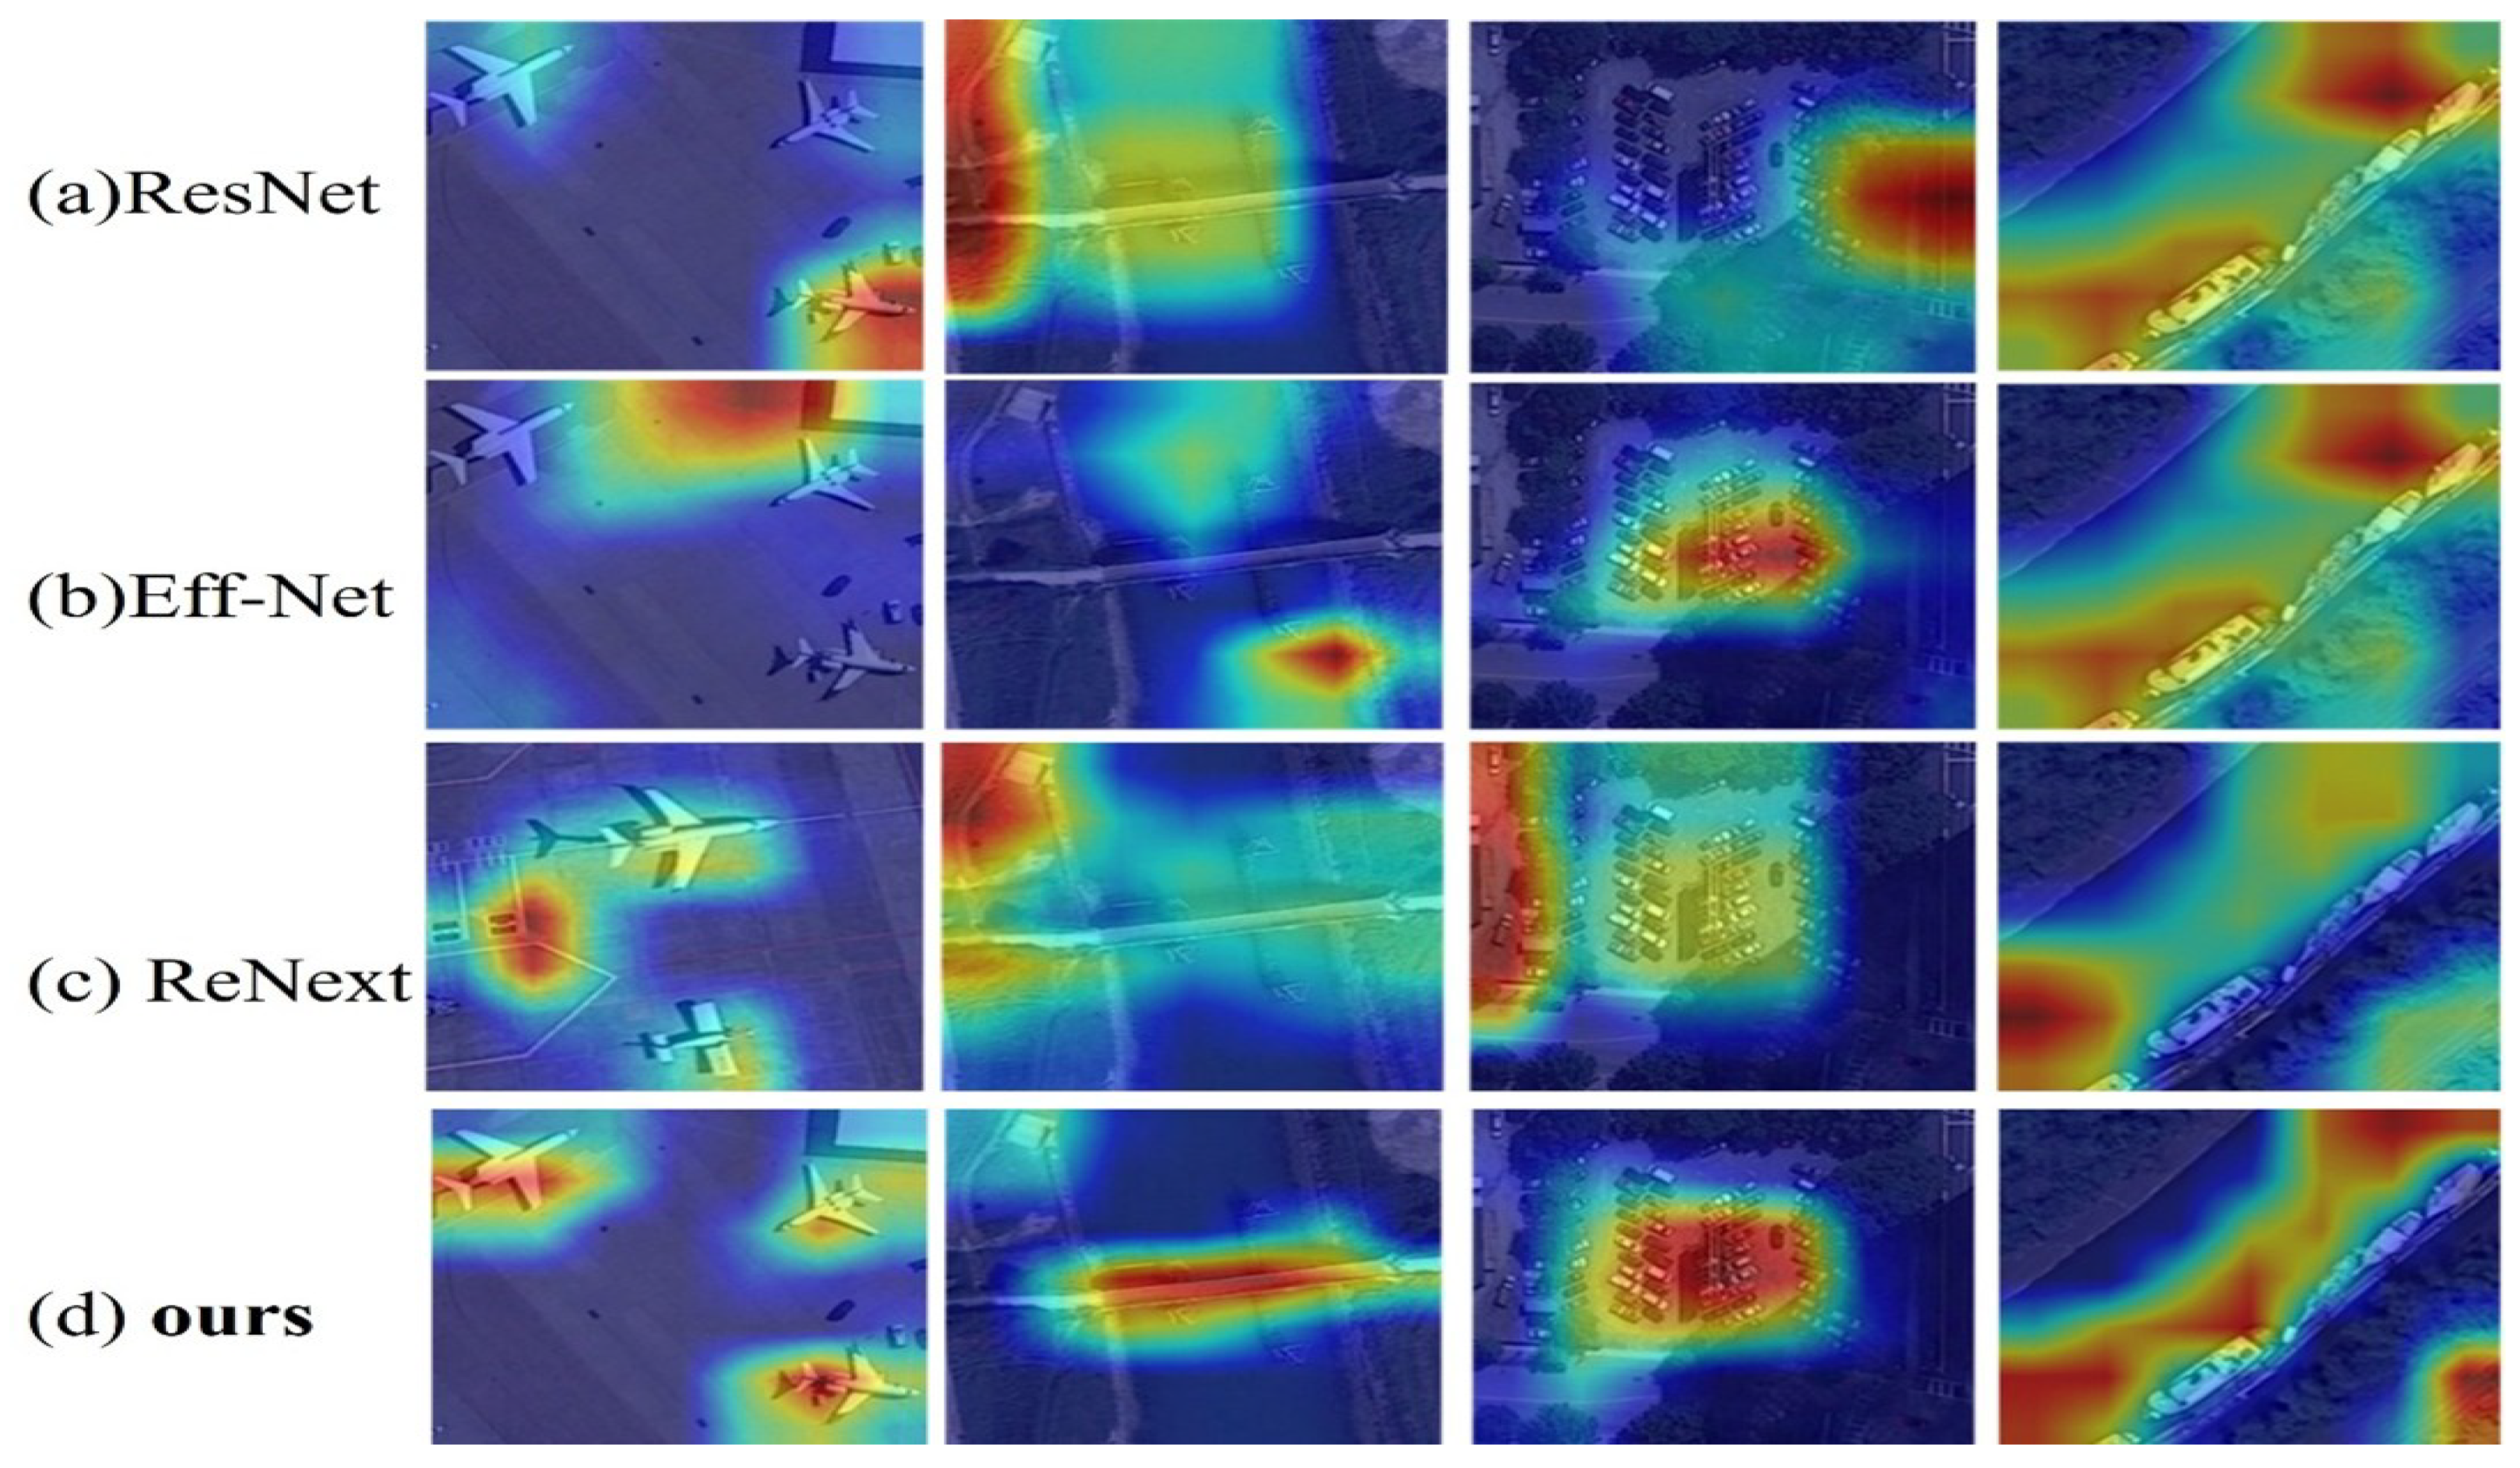
4.5.4. Intermediate Feature Visualization Analysis

This section visualizes intermediate feature maps generated by detectors with different feature extraction architectures. As shown in Figure 8, the yellow elliptical curves indicate regions with relatively strong feature responses; the redder the color, the stronger the feature response. It can be seen from this figure that the method in this paper can achieve a high thermal response to the features of the key regions of the target. For targets such as bridges—characterized by large scales and extreme aspect ratios—feature maps from networks like ResNet exhibit high feature responses only in partial regions of the bridge. In contrast, the method proposed in this section shows robust feature responses across the entire bridge area, with weak responses in the surrounding backgrounds (e.g., shorelands and seawater). This indicates that our proposed PICM (Progressive Interactive Context Module) has strong adaptability to targets with extreme aspect ratios and large scales. For winding scenarios like rivers, existing convolutional neural networks (e.g., EfficientNet and ResNeXt) generate strong responses to substantial irrelevant backgrounds on both sides of the river during feature extraction. However, intermediate feature maps from the PICM in this section reveal that regions with strong feature responses of the network can adaptively adjust as the river’s shape changes. Visualization results demonstrate that the proposed method enhances spatial feature expression in key regions and suppresses interference from complex backgrounds. By adaptively integrating feature maps from receptive fields of different scales and performing feature screening, it effectively improves the recognition accuracy of candidate regions.
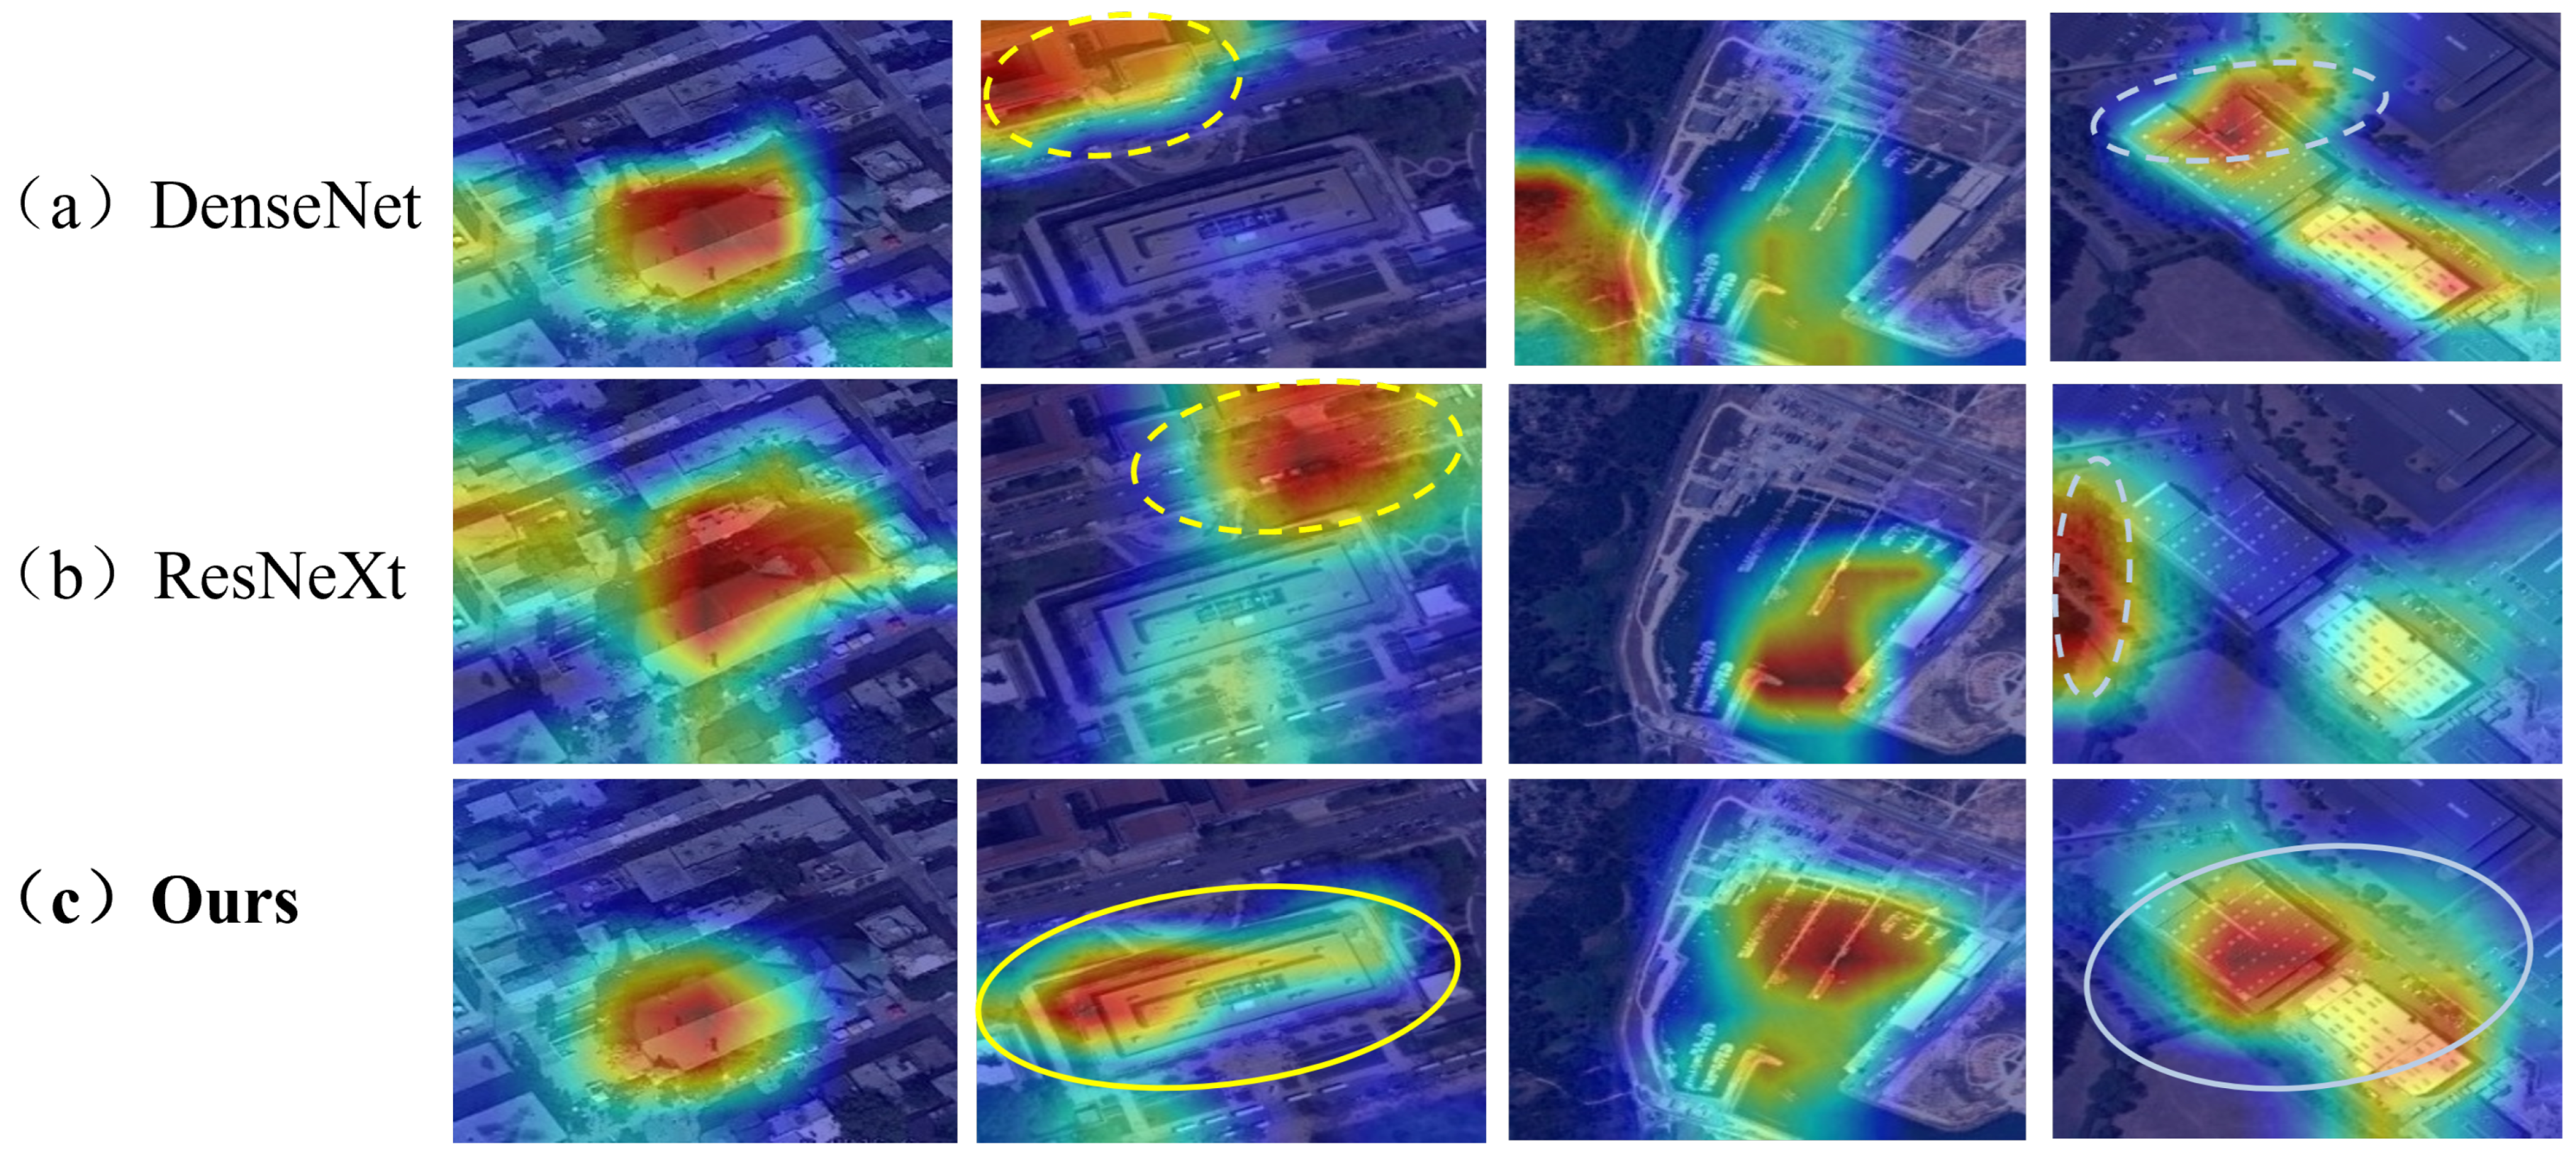
To intuitively assess the performance of the fine-grained extraction method based on local feature enhancement, this section visualizes its intermediate feature maps and compares them with those from other networks. As shown in Figure 9, in easily confusing scenarios like industrial zones, other approaches exhibit strong feature responses to numerous irrelevant surrounding backgrounds, while the method in this section shows robust feature responses only in industrial areas. This suggests that the method can dynamically adjust the attention region of the receptive field according to the spatial scope of the scene. For scenarios where churches are easily confused with other urban structures, baseline methods generate strong feature responses to buildings outside the church, with relatively scattered focus regions. In contrast, the method in this section concentrates on regions with distinct feature differences (e.g., church domes). These experimental results indicate that the method more accurately characterizes regional scale features, can effectively perceive local discriminative regions of different scenes, and minimizes interference from irrelevant backgrounds.

4.5.5. Discussion

Although FEHD-Net exhibits excellent performance on multiple datasets, it has certain limitations: In complex scenes where background and target features are highly similar (such as small vehicles in dense building clusters), false detections are prone to occur, which may be due to the limited ability of the PICM module to distinguish extremely similar features. For extremely small and densely distributed targets (such as small ships in long-distance aerial images), missed detections exist, presumably related to the transmission loss of tiny features in cascaded branches and the insufficiently refined weight allocation of CFM-Loss for low-quality anchors. In addition, when targets are under extreme lighting or blurred textures, the weakened feature response may also lead to a decline in detection accuracy.

5. Conclusions

In this paper, the Feature Equalization and Hierarchical Decoupling Detector is proposed to address the problem of anisotropy in the distribution of key features required for remote sensing target localization. The network consists of three core components: Parallel Interleaved Convolution Module (PICM), Parameter Decoupling Module (PDM), and Critical Feature Matching (CFM-Loss). PICM captures diverse spatial information over long distances and enhances the network’s performance. The PICM captures diverse spatial feature information under long distance conditions, which enhances the adaptability of the network to objects with different aspect ratios, while the PDM decomposes the feature maps with different properties and assigns them to different regression branches to estimate the parameters of the target’s rotating bounding box so that the features characterizing the shape and orientation of the target are no longer coupled. Finally, CFM-Loss utilizes the intersection ratio of the anchor and true value label and the uncertainty of convolutional regression in the training process, and designs the alignment criterion to evaluate the regression ability of different anchors so that the network can fine-tune the different quality templates to realize the stable training of the network. A large number of experiments show that FEHD-Net can realize the effect of the state of the art on the DOTA, HRSC2016, and UCAS-AOD datasets compared with the existing methods.

Author Contributions

Conceptualization, W.G. and D.J.; methodology, W.G. and D.J.; software, W.G. and D.J.; validation, W.G. and D.J.; formal analysis, J.J.; investigation, J.J.; resources, W.G.; data curation, J.J.; writing—original draft preparation, W.G.; writing—review and editing, D.J.; visualization, D.J.; validation, W.G. and D.J.; funding acquisition, W.G. All authors have read and agreed to the published version of the manuscript..

Funding

This work was supported by the Fundamental Research Funds for the Central Universities (Grant Number: 3282025010, 3282024058).

Data Availability Statement

The original contributions presented in this study are included in the article. Further inquiries can be directed to the corresponding author.

Conflicts of Interest

Authors Jinda Ji and Donglin Jing were employed by the company China Aerospace Science and Technology Corporation. The remaining author declares that the research was conducted in the absence of any commercial or financial relationships that could be construed as potential conflicts of interest.

References

  1. Han, J.; Ding, J.; Xue, N.; Xia, G.S. ReDet: A Rotation-Equivariant Detector for Aerial Object Detection. In Proceedings of the IEEE/CVF Conference on Computer Vision and Pattern Recognition 2021, Virtually, 19–25 June 2021. [Google Scholar]
  2. Xu, X.; Feng, Z.; Cao, C.; Li, M.; Wu, J.; Wu, Z.; Shang, Y.; Ye, S. An improved swin transformer-based model for remote sensing object detection and instance segmentation. Remote Sens. 2021, 13, 4779. [Google Scholar] [CrossRef]
  3. Ma, T.; Mao, M.; Zheng, H.; Gao, P.; Wang, X.; Han, S.; Ding, E.; Zhang, B.; Doermann, D. Oriented object detection with transformer. arXiv 2021, arXiv:2106.03146. [Google Scholar] [CrossRef]
  4. Yang, X.; Yan, J.; Ming, Q.; Wang, W.; Zhang, X.; Tian, Q. Rethinking rotated object detection with gaussian wasserstein distance loss. In Proceedings of the International Conference on Machine Learning, Virtual, 18–24 July 2021; pp. 11830–11841. [Google Scholar]
  5. Huang, Z.; Li, W.; Xia, X.G.; Tao, R. A General Gaussian Heatmap Label Assignment for Arbitrary-Oriented Object Detection. IEEE Trans. Image Process. 2022, 31, 1895–1910. [Google Scholar] [CrossRef] [PubMed]
  6. Dai, J.; Li, Y.; He, K.; Sun, J. R-FCN: Object Detection via Region-Based Fully Convolutional Networks. Adv. Neural Inf. Process. Syst. 2016, 29, 379–387. [Google Scholar]
  7. Ren, S.; He, K.; Girshick, R.; Sun, J. Faster R-CNN: Towards Real-Time Object Detection with Region Proposal Networks. IEEE Trans. Pattern Anal. Mach. Intell. 2017, 39, 1137–1149. [Google Scholar] [CrossRef]
  8. Qiu, H.; Li, H.; Wu, Q.; Meng, F.; Ngan, K.N.; Shi, H. A2RMNet: Adaptively Aspect Ratio Multi-Scale Network for Object Detection in Remote Sensing Images. Remote Sens. 2019, 11, 1594. [Google Scholar] [CrossRef]
  9. Bochkovskiy, A.; Wang, C.Y.; Liao, H.Y.M. Yolov4: Optimal speed and accuracy of object detection. arXiv 2020, arXiv:2004.10934. [Google Scholar] [CrossRef]
  10. Fu, K.; Chang, Z.; Zhang, Y.; Xu, G.; Zhang, K.; Sun, X. Rotation-aware and multi-scale convolutional neural network for object detection in remote sensing images. ISPRS J. Photogramm. Remote Sens. 2020, 161, 294–308. [Google Scholar] [CrossRef]
  11. Yang, X.; Yang, J.; Yan, J.; Zhang, Y.; Zhang, T.; Guo, Z.; Xian, S.; Fu, K. SCRDet: Towards More Robust Detection for Small, Cluttered and Rotated Objects. In Proceedings of the IEEE/CVF International Conference on Computer Vision 2019, Seoul, Republic of Korea, 27 October–2 November 2019. [Google Scholar]
  12. Lu, Y.; Javidi, T.; Lazebnik, S. Adaptive Object Detection Using Adjacency and Zoom Prediction. arXiv 2015, arXiv:1512.07711. [Google Scholar]
  13. Deng, C.; Jing, D.; Han, Y.; Wang, S.; Wang, H. FAR-Net: Fast anchor refining for arbitrary-oriented object detection. IEEE Geosci. Remote Sens. Lett. 2022, 19, 6505805. [Google Scholar] [CrossRef]
  14. Yi, X.; Gu, S.; Wu, X.; Jing, D. AFEDet: A Symmetry-Aware Deep Learning Model for Multi-Scale Object Detection in Aerial Images. Symmetry 2025, 17, 488. [Google Scholar] [CrossRef]
  15. Deng, C.; Jing, D.; Han, Y.; Chanussot, J. Toward hierarchical adaptive alignment for aerial object detection in remote sensing images. IEEE Trans. Geosci. Remote Sens. 2023, 61, 5615515. [Google Scholar] [CrossRef]
  16. Zhu, H.; Jing, D. Optimizing slender target detection in remote sensing with adaptive boundary perception. Remote Sens. 2024, 16, 2643. [Google Scholar] [CrossRef]
  17. Zhu, X.; Hu, H.; Lin, S.; Dai, J. Deformable ConvNets V2: More Deformable, Better Results. In Proceedings of the 2019 IEEE/CVF Conference on Computer Vision and Pattern Recognition (CVPR), Long Beach, CA, USA, 15–20 June 2019. [Google Scholar]
  18. Chen, K.; Wang, J.; Pang, J.; Cao, Y.; Xiong, Y.; Li, X.; Sun, S.; Feng, W.; Liu, Z.; Xu, J.; et al. MMDetection: Open MMLab Detection Toolbox and Benchmark. arXiv 2019, arXiv:1906.07155. [Google Scholar] [CrossRef]
  19. Yang, Z.; Liu, S.; Hu, H.; Wang, L.; Lin, S. RepPoints: Point Set Representation for Object Detection. In Proceedings of the 2019 IEEE/CVF International Conference on Computer Vision (ICCV), Seoul, Republic of Korea, 27 October–2 November 2019. [Google Scholar] [CrossRef]
  20. Ding, J.; Xue, N.; Long, Y.; Xia, G.S.; Lu, Q. Learning RoI Transformer for Oriented Object Detection in Aerial Images. In Proceedings of the IEEE/CVF Conference on Computer Vision and Pattern Recognition 2019, Long Beach, CA, USA, 15–20 June 2019. [Google Scholar]
  21. Wang, X.; Yu, F.; Dou, Z.Y.; Darrell, T.; Gonzalez, J.E. Skipnet: Learning dynamic routing in convolutional networks. In Proceedings of the European Conference on Computer Vision (ECCV) 2018, Munich, Germany, 8–14 September 2018; pp. 409–424. [Google Scholar]
  22. Xia, G.S.; Bai, X.; Ding, J.; Zhu, Z.; Belongie, S.; Luo, J.; Datcu, M.; Pelillo, M.; Zhang, L. DOTA: A Large-Scale Dataset for Object Detection in Aerial Images. In Proceedings of the IEEE Conference on Computer Vision and Pattern Recognition 2018, Salt Lake City, UT, USA, 18–23 June 2018. [Google Scholar]
  23. Liu, Z.; Yuan, L.W.L.; Yang, Y. A high resolution optical satellite image dataset for ship recognition and some new baselines. In Proceedings of the International Conference on Pattern Recognition Applications and Methods, Porto, Portugal, 24–26 February 2017. [Google Scholar]
  24. Zhu, H.; Chen, X.; Dai, W.; Fu, K.; Ye, Q.; Jiao, J. Orientation robust object detection in aerial images using deep convolutional neural network. In Proceedings of the 2015 IEEE International Conference on Image Processing (ICIP), Quebec City, QC, Canada, 27–30 September 2015. [Google Scholar] [CrossRef]
  25. Xu, Y.; Fu, M.; Wang, Q.; Wang, Y.; Chen, K.; Xia, G.S.; Bai, X. Gliding Vertex on the Horizontal Bounding Box for Multi-Oriented Object Detection. IEEE Trans. Pattern Anal. Mach. Intell. 2021, 43, 1452–1459. [Google Scholar] [CrossRef] [PubMed]
  26. Ma, J.; Shao, W.; Ye, H.; Wang, L.; Wang, H.; Zheng, Y.; Xue, X. Arbitrary-oriented scene text detection via rotation proposals. IEEE Trans. Multimed. 2018, 20, 3111–3122. [Google Scholar] [CrossRef]
  27. Jiang, Y.; Zhu, X.; Wang, X.; Yang, S.; Li, W.; Wang, H.; Fu, P.; Luo, Z. R2CNN: Rotational Region CNN for Orientation Robust Scene Text Detection. arXiv 2017, arXiv:1706.09579. [Google Scholar] [CrossRef]
  28. Wang, J.; Ding, J.; Guo, H.; Cheng, W.; Pan, T.; Yang, W. Mask OBB: A Semantic Attention-Based Mask Oriented Bounding Box Representation for Multi-Category Object Detection in Aerial Images. Remote Sens. 2019, 11, 2930. [Google Scholar] [CrossRef]
  29. Yang, X.; Yan, J.; Feng, Z.; He, T. R3Det: Refined Single-Stage Detector with Feature Refinement for Rotating Object. arXiv 2019, arXiv:1908.05612. [Google Scholar] [CrossRef]
  30. Yang, X.; Yan, J.; Liao, W.; Yang, X.; Tang, J.; He, T. SCRDet++: Detecting Small, Cluttered and Rotated Objects via Instance-Level Feature Denoising and Rotation Loss Smoothing. IEEE Trans. Pattern Anal. Mach. Intell. 2022, 45, 2384–2399. [Google Scholar] [CrossRef]
  31. Yang, X.; Yan, J. On the Arbitrary-Oriented Object Detection: Classification based Approaches Revisited. arXiv 2020, arXiv:2003.05597. [Google Scholar]
  32. Qian, W.; Yang, X.; Peng, S.; Guo, Y.; Yan, J. Learning Modulated Loss for Rotated Object Detection. arXiv 2019, arXiv:1911.08299. [Google Scholar] [CrossRef]
  33. Lin, T.Y.; Goyal, P.; Girshick, R.; He, K.; Dollar, P. Focal Loss for Dense Object Detection. IEEE Trans. Pattern Anal. Mach. Intell. 2020, 42, 318–327. [Google Scholar] [CrossRef] [PubMed]
  34. Yi, J.; Wu, P.; Liu, B.; Huang, Q.; Qu, H.; Metaxas, D. Oriented object detection in aerial images with box boundary-aware vectors. In Proceedings of the IEEE/CVF Winter Conference on Applications of Computer Vision 2021, Virtual, 5–9 January 2021. [Google Scholar] [CrossRef]
  35. Huang, Z.; Li, W.; Xia, X.G.; Wu, X.; Cai, Z.; Tao, R. A Novel Nonlocal-Aware Pyramid and Multiscale Multitask Refinement Detector for Object Detection in Remote Sensing Images. IEEE Trans. Geosci. Remote Sens. 2022, 60, 5601920. [Google Scholar] [CrossRef]
  36. Ming, Q.; Miao, L.; Zhou, Z.; Yang, X.; Dong, Y. Optimization for Arbitrary-Oriented Object Detection via Representation Invariance Loss. IEEE Geosci. Remote Sens. Lett. 2022, 19, 8021505. [Google Scholar] [CrossRef]
  37. Han, J.; Ding, J.; Li, J.; Xia, G.S. Align Deep Features for Oriented Object Detection. IEEE Trans. Geosci. Remote Sens. 2021, 60, 5602511. [Google Scholar] [CrossRef]
  38. Yu, H.; Tian, Y.; Ye, Q.; Liu, Y. Spatial transform decoupling for oriented object detection. In Proceedings of the AAAI Conference on Artificial Intelligence 2024, Vancouver, BC, Canada, 20–28 February 2024; Volume 38, pp. 6782–6790. [Google Scholar]
  39. Yuan, X.; Zheng, Z.; Li, Y.; Liu, X.; Liu, L.; Li, X.; Hou, Q.; Cheng, M.M. Strip R-CNN: Large Strip Convolution for Remote Sensing Object Detection. arXiv 2025, arXiv:2501.03775. [Google Scholar] [CrossRef]
  40. Qian, W.; Yang, X.; Peng, S.; Yan, J.; Guo, Y. Learning Modulated Loss for Rotated Object Detection. In Proceedings of the National Conference on Artificial Intelligence, Virtually, 2–9 February 2021. [Google Scholar]
  41. Xie, X.; Cheng, G.; Wang, J.; Yao, X.; Han, J. Oriented R-CNN for Object Detection. In Proceedings of the IEEE/CVF International Conference on Computer Vision 2021, Montreal, BC, Canada, 11–17 October 2021. [Google Scholar]
  42. Ming, Q.; Miao, L.; Zhou, Z.; Song, J.; Yang, X. Sparse Label Assignment for Oriented Object Detection in Aerial Images. Remote Sens. 2021, 13, 2664. [Google Scholar] [CrossRef]
  43. Ming, Q.; Miao, L.; Zhou, Z.; Dong, Y. CFC-Net: A Critical Feature Capturing Network for Arbitrary-Oriented Object Detection in Remote-Sensing Images. IEEE Trans. Geosci. Remote Sens. 2022, 60, 5605814. [Google Scholar] [CrossRef]
  44. Ming, Q.; Miao, L.; Zhou, Z.; Song, J.; Dong, Y.; Yang, X. Task interleaving and orientation estimation for high-precision oriented object detection in aerial images. ISPRS J. Photogramm. Remote Sens. 2023, 196, 241–255. [Google Scholar] [CrossRef]
  45. Ming, Q.; Zhou, Z.; Miao, L.; Zhang, H.; Li, L. Dynamic Anchor Learning for Arbitrary-Oriented Object Detection. arXiv 2020, arXiv:2012.04150. [Google Scholar] [CrossRef]
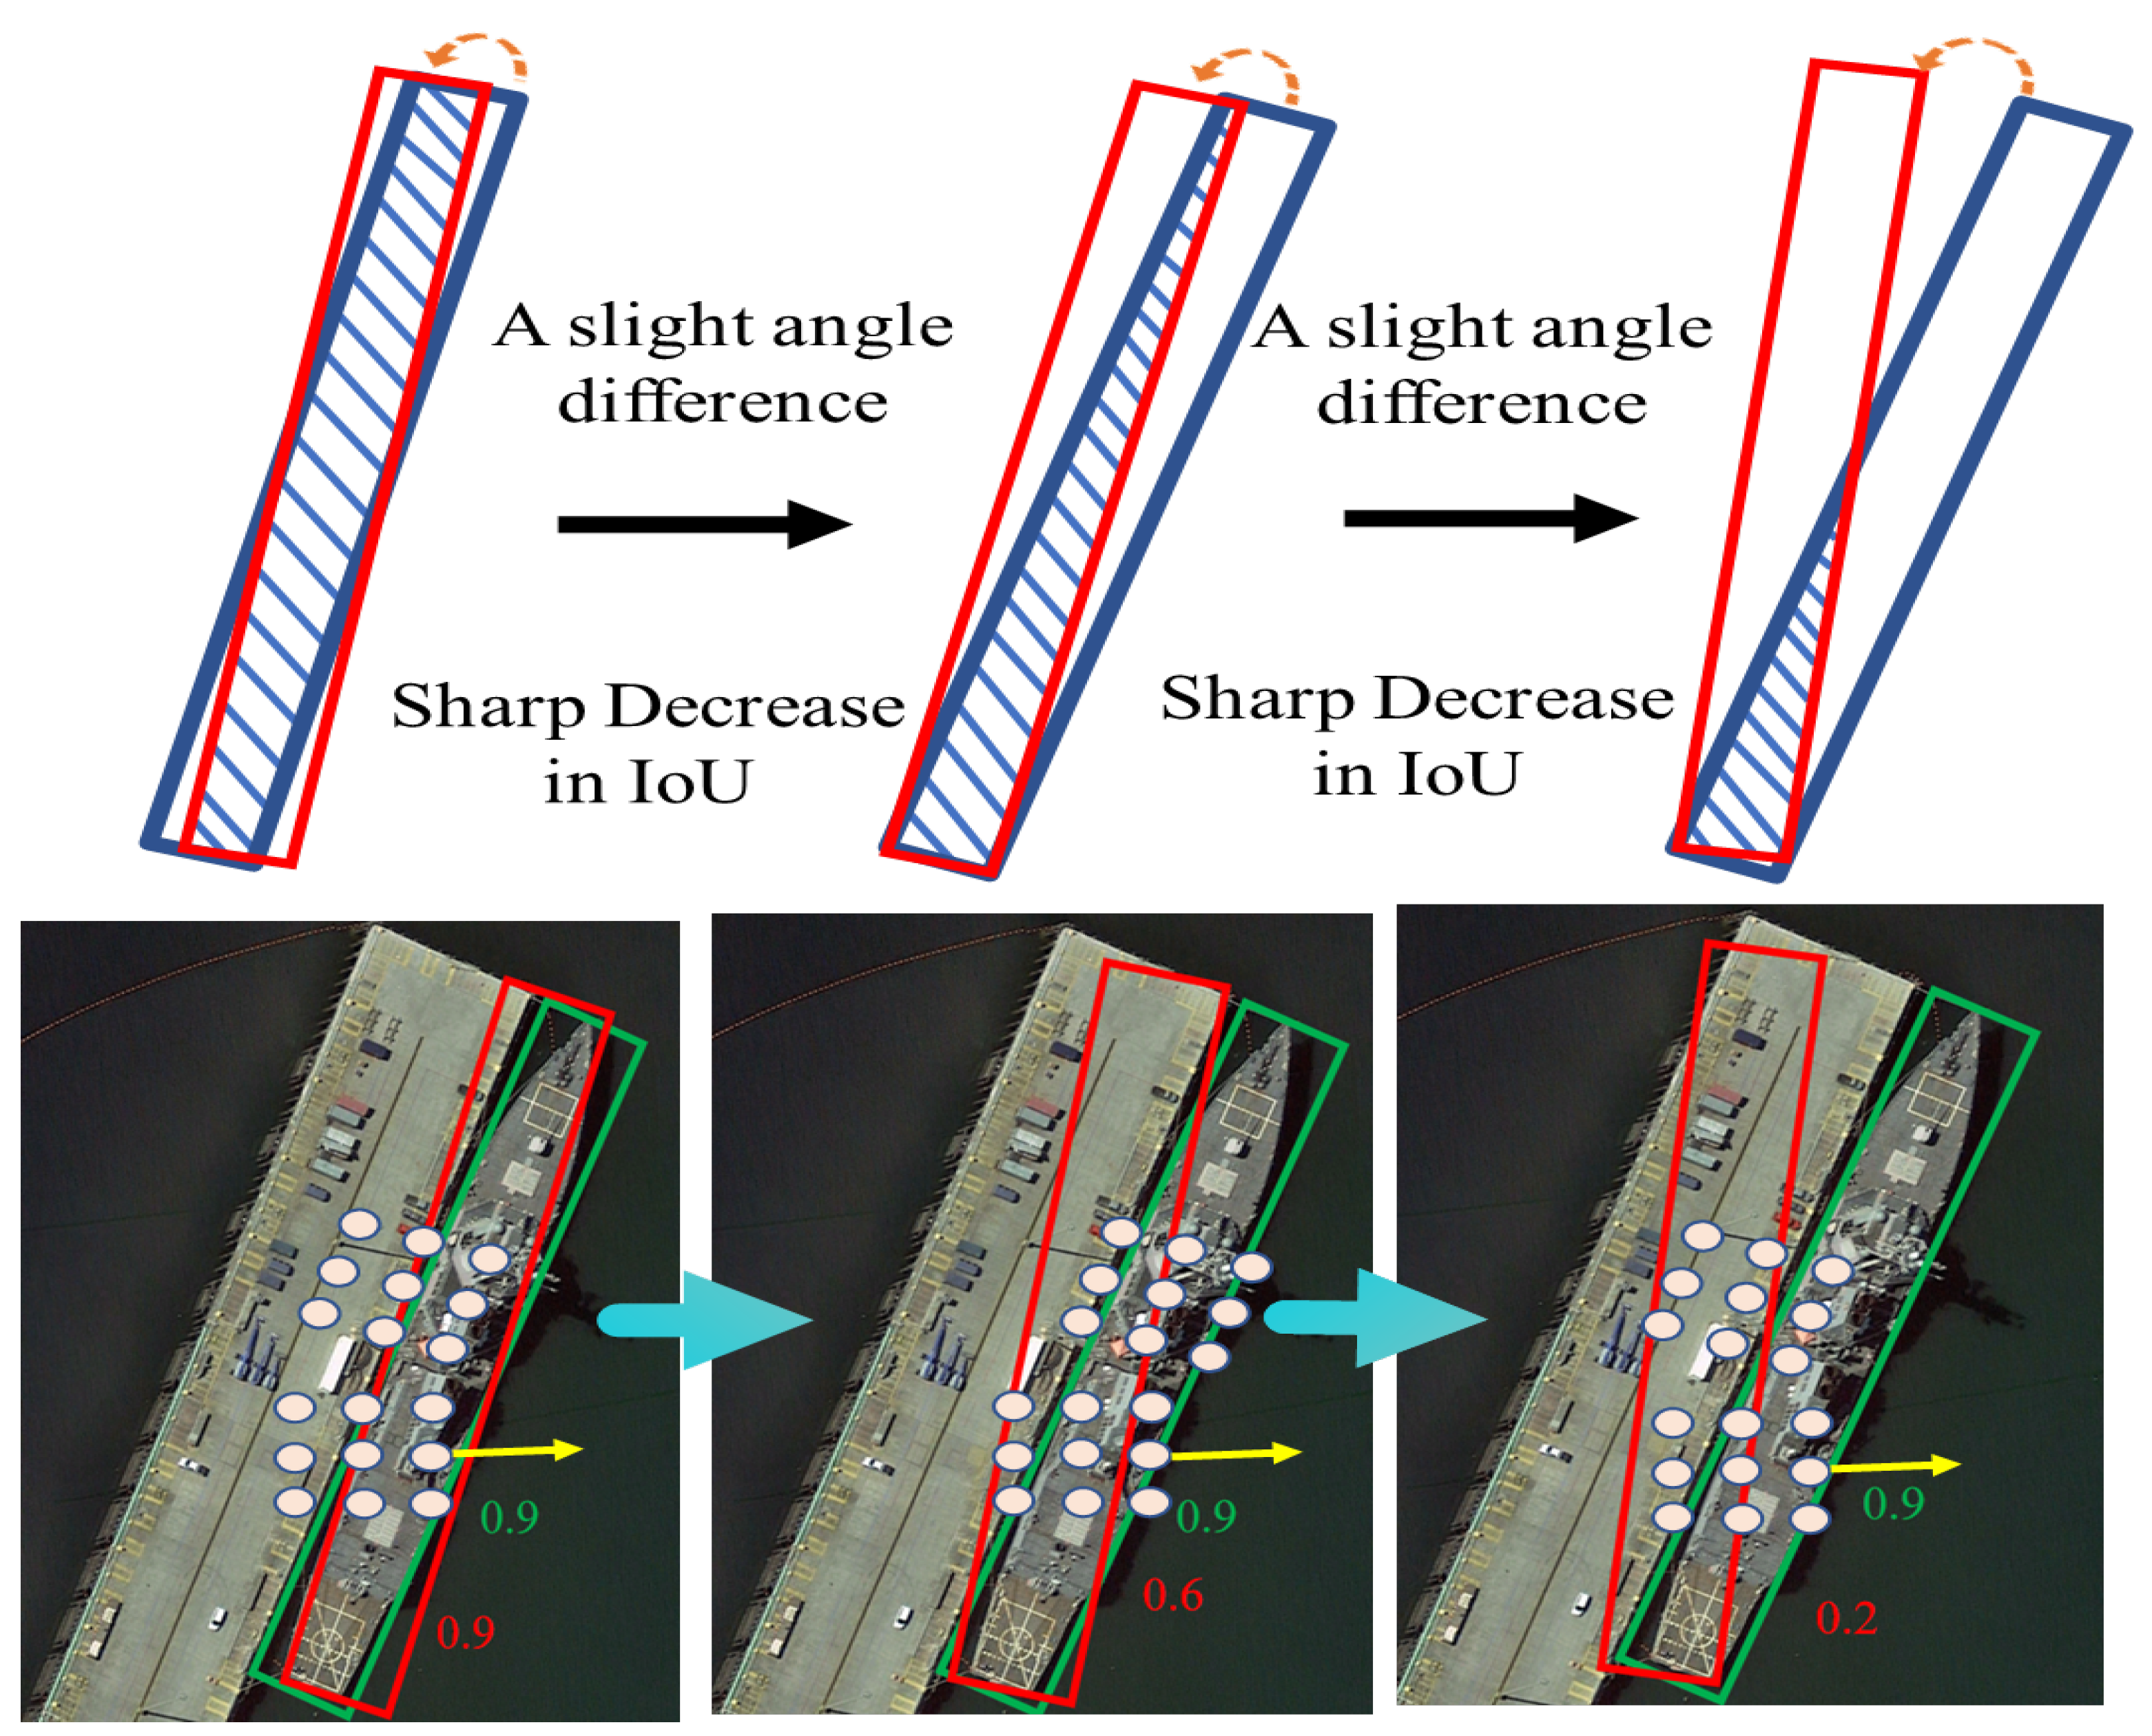
Figure 1. The anisotropy of feature distribution and slight deviations in angle lead to a sharp decrease in IoU from HRSC2016.
Symmetry 17 01491 g001
Figure 2. Architecture of FEHD-Net.
Symmetry 17 01491 g002
Figure 3. The architecture of PICM.
Symmetry 17 01491 g003
Figure 4. The curve of CFM-Loss. The blue line represents L1-Loss, and the red line represents CFM-Loss.
Symmetry 17 01491 g004
Figure 5. Visualization of results on DOTA dataset with FEHD-Net. Small vehicles and boats parked closely side by side are accurately detected.
Symmetry 17 01491 g005
Figure 6. Visualization of results on HRSC2016 with FEHD-Net.
Symmetry 17 01491 g006
Figure 7. Visualization of results on UCAS-AOD with FEHD-Net.
Symmetry 17 01491 g007
Figure 8. Intermediate feature visualization of targets such as aircraft and bridges.
Symmetry 17 01491 g008
Figure 9. Feature visualization of urban areas.
Symmetry 17 01491 g009
Table 1. Performance evaluation on the DOTA dataset.
MethodsBackbonePLBDBRGTFSVLVSHTCBCSTSBFRAHASPHCmAP (%)
Gliding Vertex [25]ResNet10189.6485.0052.2677.3473.0173.1486.8290.7479.0286.8159.5570.9172.9470.8657.3275.02
FR-O [7]ResNet10179.4277.1317.7064.0535.3038.0237.1689.4169.6459.2850.3052.9147.8947.4046.3054.13
RoI-Trans [20]ResNet10188.6478.5243.4475.9268.8173.6883.5990.7477.2781.4658.3953.5462.8358.9347.6769.56
A2RMNet [8]ResNet10189.8483.3960.0673.4679.2583.0787.8890.9087.0287.3560.7469.0579.8879.7465.1778.45
RRPN [26]ResNet10188.5271.2031.6659.3051.8556.1957.2590.8172.8467.3856.6952.8453.0851.9453.5861.01
R2CNN [27]ResNet10180.9465.6735.3467.4459.9250.9155.8190.6766.9272.3955.0652.2355.1453.3548.2260.67
MASK-OBB [28]ResNet10189.6987.0758.5172.0478.2171.4785.2089.5584.7186.7654.3870.2178.9877.4670.4076.98
SCRDet [29]ResNet10189.9880.6552.0968.3668.3660.3272.4190.8587.9486.8665.0266.6866.2568.2465.2172.61
SCRDet++ [30]ResNet10190.0182.3261.9468.6269.6281.1778.8390.8686.3285.1065.1061.1277.6980.6864.2576.24
 CSL [31]ResNet10190.2585.5354.6475.3170.4473.5177.6290.8486.1586.6969.6068.0473.8371.1068.9376.17
 RSDet [32]ResNet10189.8082.9048.6065.2069.5070.1070.2090.5085.6083.4062.5063.9065.6067.2068.0072.20
R3Det [29]ResNet10189.5481.9948.4662.5270.4874.2977.5490.8081.3983.5461.9759.8265.4467.4660.0571.69
 R-RetinaNet [33]ResNet10188.8281.7444.4465.7267.1155.8272.7790.5582.8376.3054.1963.6463.7169.7353.3768.72
 BBAVectors [34]ResNet10188.6384.0652.1369.5678.2680.4088.0690.8787.2386.3956.1165.6267.1072.0863.9675.36
 NPMMR-Det [35]ResNet10189.4483.1854.5066.1076.9384.0888.2590.8788.2986.3249.9568.1679.6179.5157.2676.16
 GGHL [5]ResNet10189.7485.6344.5077.4876.7280.4586.1690.8388.1886.2567.0769.4073.3868.4570.1476.95
 RIDet-O [36]ResNet10188.9478.4546.8772.6377.6380.6888.1890.5581.3383.6164.8563.7273.0973.1356.8774.70
S2A-Net [37]ResNet10189.2884.1156.9579.2180.1882.9389.2190.8684.6687.6171.6668.2378.5878.2065.5579.15
 STD [38]ResNet10188.5684.5362.0881.8081.0685.0688.4390.5986.8486.9572.1371.5484.3082.0578.9481.66
 Strip-RCNN [39]ResNet10189.1484.9061.7883.5081.5485.8788.6490.8988.0287.3171.5570.7478.6679.8178.1681.40
 FEHD-Net (ours)Transformer90.1284.3169.5282.1769.6087.2389.9390.8688.0271.8479.8576.0477.5374.4483.4281.73
Table 2. Comparison of detection results on the HRSC2016 dataset.
ModelBackbonemAP (%)
RoI-Transformer [20]ResNet10186.20
RSDet [40]ResNet5086.5
BBAVectors [34]ResNet10188.60
R3Det [29]ResNet10189.26
S2ANet [37]ResNet10190.17
ReDet [1]ResNet10190.46
Oriented R-CNN [41]ResNet10190.50
FEHD-Net (Ours)ResNet10192.73
Table 3. Comparison of detection results of various models on UCAS-AOD dataset.
ModelBackboneInput SizeCarAirplanemAP (%)
Faster RCNN [7]ResNet50800 × 80086.8789.8688.36
RoI Transformer [20]ResNet50800 × 80088.0290.0289.02
SLA [42]ResNet50800 × 80088.5790.3089.44
CFC-Net [43]ResNet50800 × 80089.2988.6989.49
TIOE-Det [44]ResNet50800 × 80088.8390.1589.49
RIDet-O [36]ResNet50800 × 80088.8890.3589.62
DAL [45]ResNet50800 × 80089.2590.4989.87
S2ANet [37]ResNet50800 × 80089.5690.4289.99
OursResNet50800 × 80090.2892.1991.67
Table 4. Comparison of module selection.
With PICMWith PDMWith CFM-LossmAP (%)
83.47
86.63
85.02
88.15
88.93
92.73
Table 5. Detection results of different association parameter regression branches.
Cascade NumberHRSC2016 (mAP) (%)UCAS-AOD (mAP) (%)
190.3189.83
291.0289.94
392.7391.67
489.2889.88
Table 6. The ablation of PICM.
3 × 35 × 1, 1 × 57 × 1, 1 × 79 × 1, 1 × 9mAP (%)↑ (%)
Square-ConvStrip-ConvStrip-ConvStrip-Conv--
88.93-
89.21+0.28
89.73+0.80
91.67+2.74
89.46+0.53
1 × 5, 5 × 11 × 7, 7 × 11 × 9, 9 × 190.57+1.64
5 × 57 × 79 × 989.75+0.82
1 × 5, 5 × 11 × 7, 7 × 11 × 9, 9 × 189.75+0.82
Disclaimer/Publisher’s Note: The statements, opinions and data contained in all publications are solely those of the individual author(s) and contributor(s) and not of MDPI and/or the editor(s). MDPI and/or the editor(s) disclaim responsibility for any injury to people or property resulting from any ideas, methods, instructions or products referred to in the content.