4.1. Datasets
The HRSC2016 (High-Resolution Ship Collection 2016) remote sensing ship detection dataset [
1] is a widely used benchmark for ODD. It comprises 1061 high-resolution RSI with image sizes ranging from
to 1500 × 900 and includes 2976 annotated object instances. All targets are labeled using OBBoxs and span 3 main categories and 27 fine-grained subcategories, including aircraft carriers, warships, and commercial vessels. The dataset is split into training (436 images), validation (181 images), and testing (444 images) subsets with a 4:2:4 ratio. Covering diverse port environments, it presents significant orientation diversity and complex backgrounds, making it well suited for evaluating performance under multi-directional and densely packed detection scenarios. Owing to its high-quality annotations and support for multi-level classification (1-class, 4-class, and 19-class tasks), HRSC2016 is frequently employed for robustness evaluation in ODD research.
The UCAS-AOD (UCAS Aerial Object Detection) dataset [
43] contains two object categories: airplanes and vehicles. It includes 2,420 images in total—comprising 1000 airplane images, 510 vehicle images, and 910 background-only images—with 14,596 annotated instances. The images are sourced from Google Earth, with resolutions of either 1280 × 659 or 1372 × 941. Original annotations are provided in HBBox format and can be converted into OBBoxs through post-processing to support orientation regression. The dataset is characterized by uniformly distributed orientations, dense small objects, and cluttered backgrounds, making it suitable for evaluating directional robustness in complex scenes. The standard data split follows a 5:2:3 ratio for training, validation, and testing.
DOTA (Dataset for Object Detection in Aerial Images) v1.0 [
44] is one of the most comprehensive large-scale benchmarks for object detection in RS. It is widely adopted to evaluate the generalization capability of algorithms under complex scenarios. DOTA v1.0 comprises 2806 aerial images with resolutions ranging from
to 4000 × 4000, collected from diverse sensors and geographic regions. It includes over 188,000 annotated instances across 15 categories, such as plane (PL), baseball diamond (BD), bridge (BR), ground track field (GTF), small vehicle (SV), large vehicle (LV), ship (SH), tennis court (TC), basketball court (BC), storage tank (ST), soccer ball field (SBF), roundabout (RA), harbor (HA), swimming pool (SP), and helicopter (HC). Each object is annotated using a four-point OBBox that accurately reflects its orientation, pose, and aspect ratio. DOTA is designed for large-scale, multi-class, and high-density detection tasks.
4.2. Implementation Details
A five-level feature pyramid structure (P3, P4, P5, P6, P7) was employed during detection to support multi-scale object modeling. Each spatial location on every feature level was assigned a single anchor, responsible for regressing the position and orientation of the nearest GT target. Label assignment followed an IoU-based matching strategy, with the positive sample threshold set to 0.5.
All experiments were implemented using the MMRotate (OpenMMLab Rotated Detection Toolbox) framework [
43] and conducted on a single NVIDIA RTX 2080Ti GPU with 22 GB of memory. During training, the batch size was set to 2. The optimizer was stochastic gradient descent (SGD) with an initial learning rate of
, a momentum of 0.9, and a weight decay of 0.0001.
The number of training epochs was set to 24 for UCAS-AOD, 72 for HRSC2016, and 24 for DOTA. For the HRSC2016 and UCAS-AOD datasets, input images were resized to . Due to the larger image dimensions in the DOTA dataset, a cropping and sliding window strategy was applied, dividing the original images into patches to match the input constraints of standard object detection models.
To ensure fairness and comparability across methods, only random rotation and random flipping were applied for data augmentation during training. The base detection framework was R-RetinaNet, which used ResNet-50 as the feature extraction backbone. Pretrained weights on ImageNet (ImageNet Large Scale Visual Recognition Challenge) were used for model initialization. Evaluation followed the mean Average Precision (mAP) definition from the PASCAL VOC 2007 challenge [
45].
All ablation studies were conducted on the HRSC2016 dataset, which contains ship targets with large aspect ratios and substantial scale variation. This makes it a representative benchmark for high-complexity RS detection tasks and provided a reliable setting for evaluating the detection accuracy and robustness of the proposed method under challenging conditions.
4.3. Ablation Studies
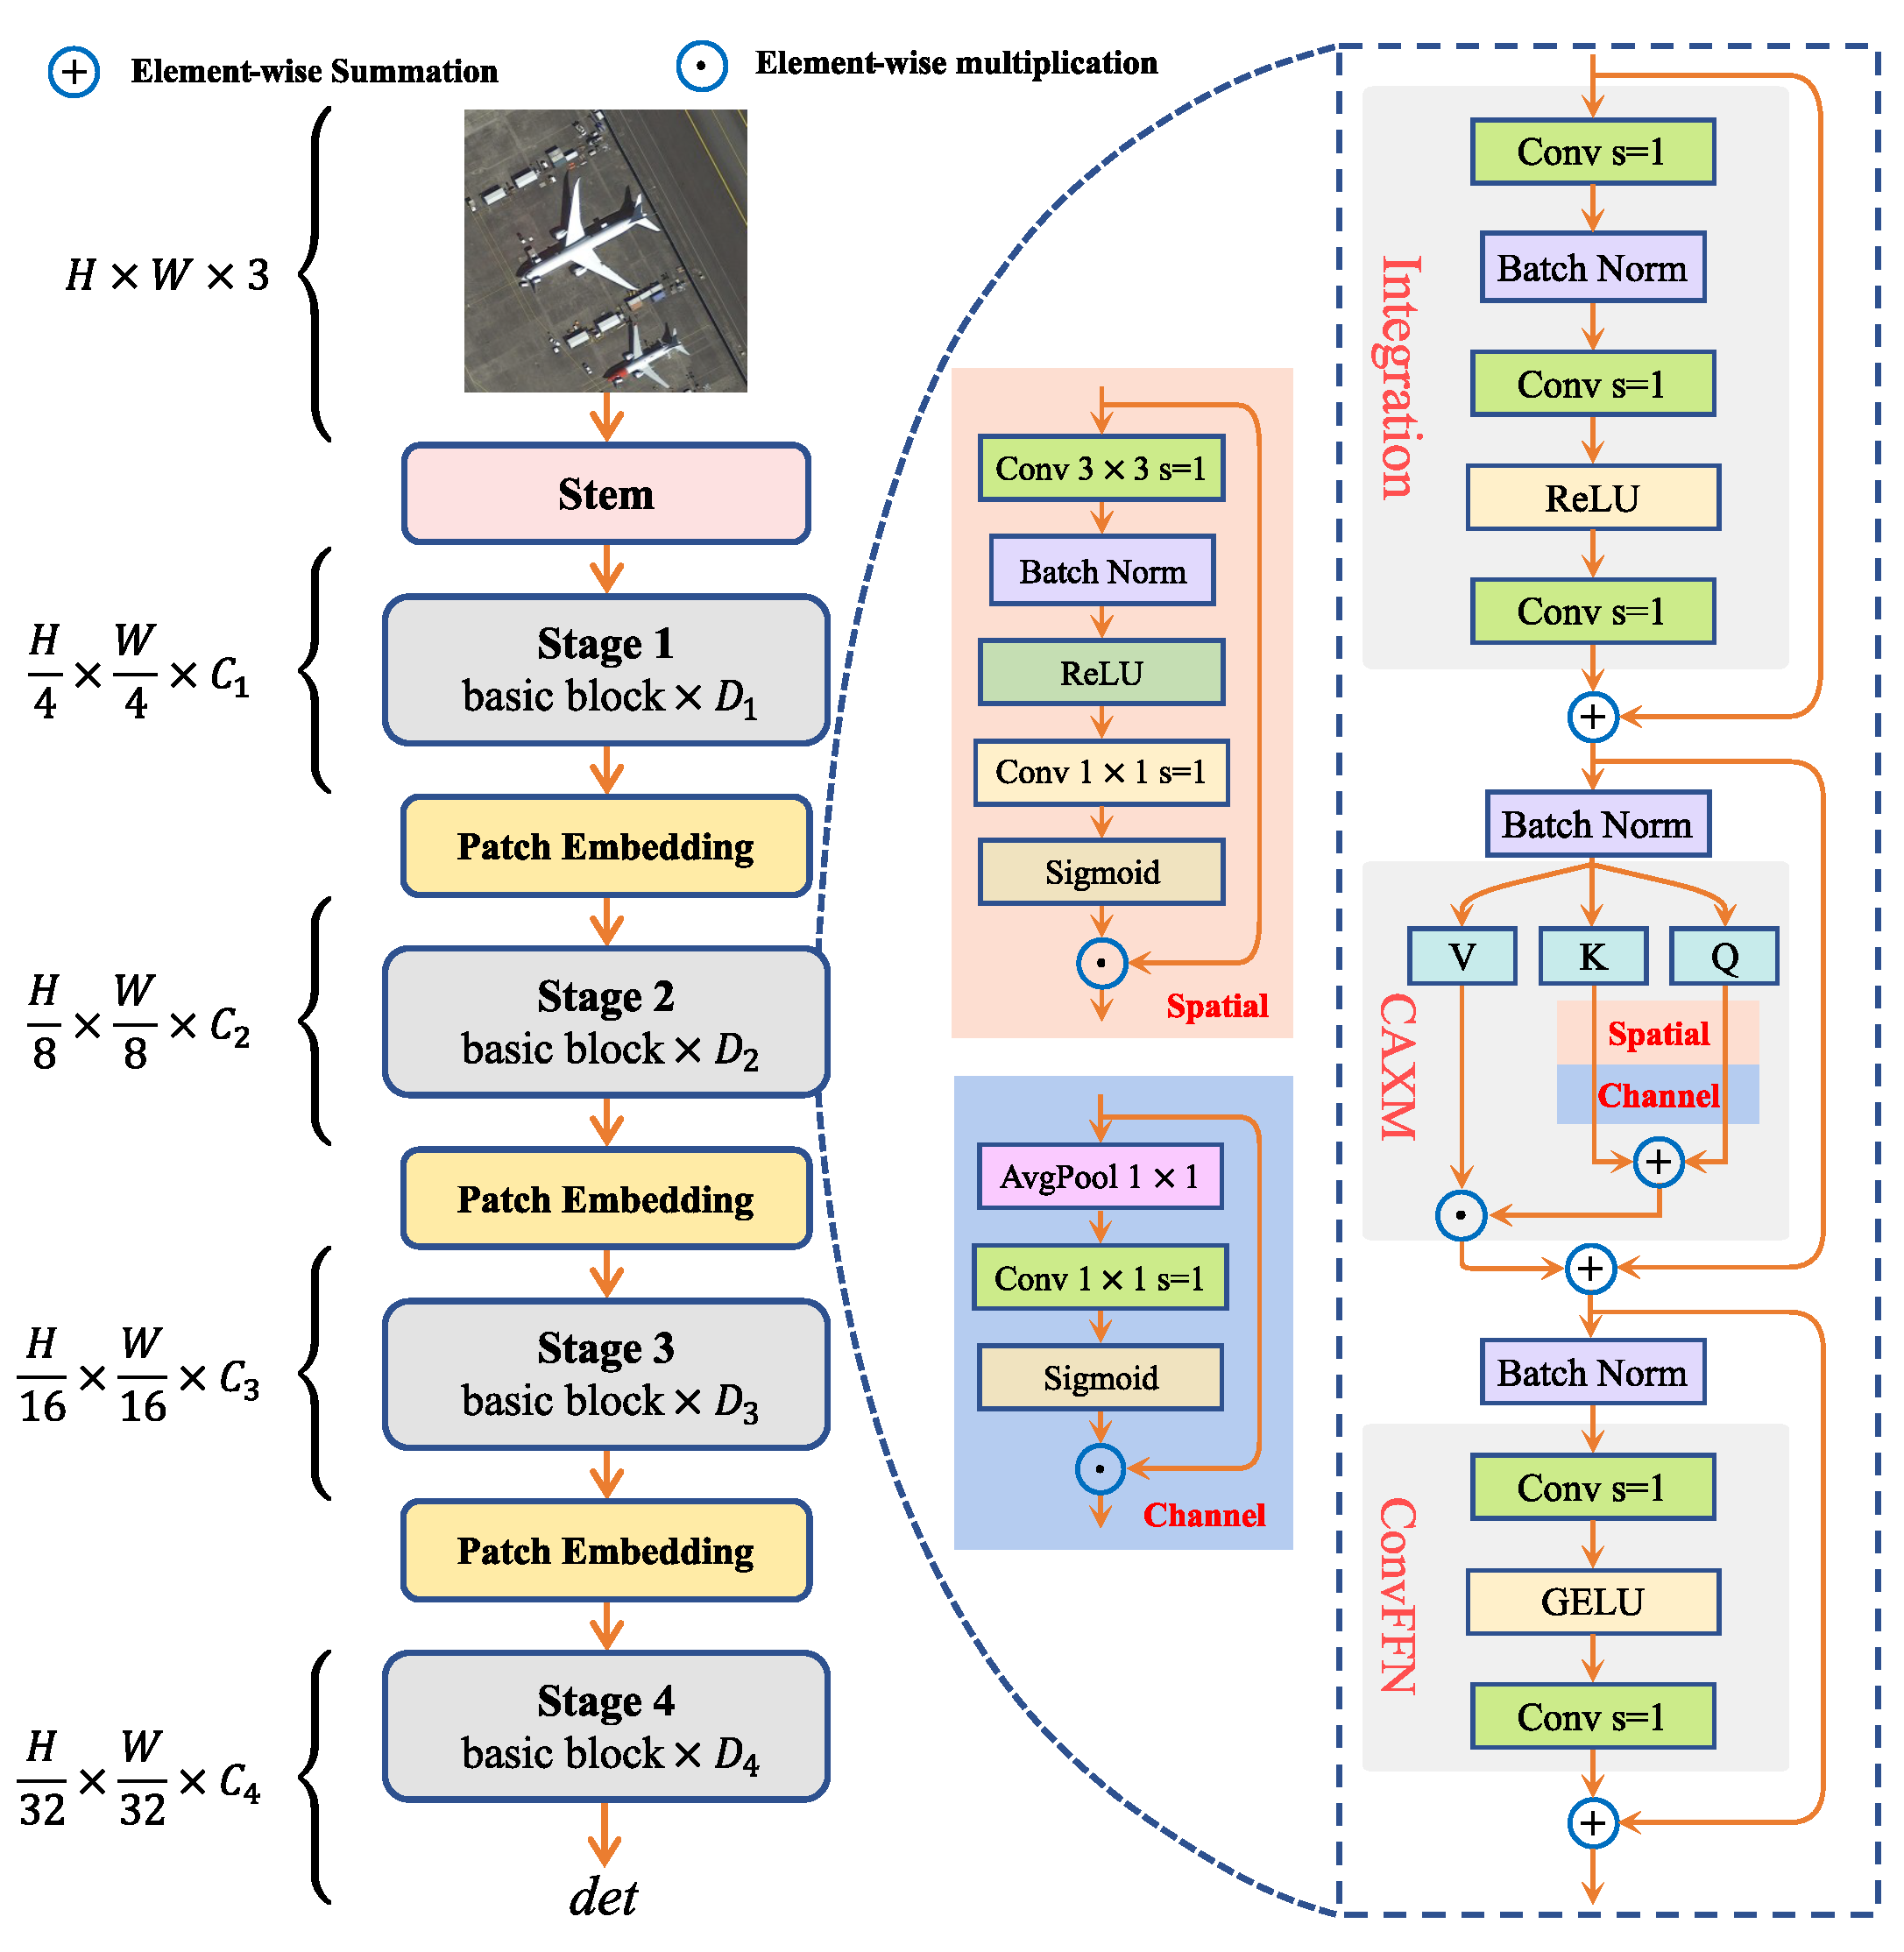
An ablation study was conducted to evaluate the impact of key components in GAANet on ODD performance. R-RetinaNet was adopted as the baseline detector, with ResNet-50 used as the backbone and as the regression loss function.
The Effectiveness of Individual GAANet Components. To verify the contribution of each module, controlled experiments were performed under consistent conditions. The detection framework remained fixed as R-RetinaNet with a ResNet-50 backbone. The loss was used in the baseline to establish reference performance.
The influence of each component is summarized in
Table 3. The baseline model (ResNet-50 +
) achieved a 88.53% mAP. Due to the absence of alignment mechanisms, it suffered from inconsistencies in both feature representation and OBBox regression. With the introduction of CAX-ViT, the mAP increased to 89.17%, demonstrating the benefits of additive attention via CAXM and hierarchical feature encoding for multi-scale object modeling.
Replacing the regression loss with GPIoU further improved the mAP to 89.66%. This gain stemmed from the Gaussian-based optimization strategy, which alleviated angular periodicity and enhanced training stability. When both CAX-ViT and GPIoU loss were applied, the mAP reached 90.58%, yielding a 2.05% improvement over the baseline. These results confirm the complementary effects of structural representation and geometric alignment in GAANet.
An Ablation Study on the Effectiveness of CAX-ViT-T and CAX-ViT-S Variants. To further examine the effect of backbone channel width on detection performance, two variants of the CAX-ViT architecture—CAX-ViT-T and CAX-ViT-S—were compared. The experimental results are presented in
Table 4.
CAX-ViT-S, which adopts a wider channel configuration and contains more parameters than CAX-ViT-T, achieved a 0.37% gain in the mAP. This suggests that increasing channel capacity enhanced the expressiveness of feature representations, thereby improving detection accuracy. In particular, the broader channel design in CAX-ViT-S facilitates the extraction of richer multi-scale structural information, improving robustness in small object detection and localization accuracy in cluttered environments.
Both variants utilize the Contextual Additive eXchange Block (CAX block) as their core structural unit. The architecture incorporates the CAXM mechanism for enhanced token interaction and employs a ConvFFN (Convolutional Feed-Forward Network) to strengthen semantic representation. The results indicate that the architecture maintained computational efficiency while benefiting from increased accuracy through channel expansion.
Although CAX-ViT-S incurred more FLOPs compared to CAX-ViT-T, it offered a favorable trade-off between accuracy and computational cost. As such, CAX-ViT-S was selected as the default backbone in subsequent experiments to better balance precision and resource efficiency.
An Ablation Study on the Effectiveness of the CAXM Component—Validated via Token Mixer Substitution. To assess the contribution of the CAXM (Convolutional Additive Exchange Mixer) module, a comparative experiment was conducted by substituting its token mixing mechanism.
Table 5 summarizes the results, highlighting the trade-off between computational complexity (FLOPs) and detection accuracy (mAP) across different token mixers.
CATM Pooling adopted a pooling-based interaction strategy and achieved the lowest computational complexity (1467 M FLOPs). However, the loss of spatial detail resulted in a reduced mAP of 89.47%. On the other hand, W-MSA introduced local window-based self-attention to enhance feature modeling, increasing the mAP to 90.24% at the expense of higher computational cost (2175 M FLOPs), which may hinder deployment in resource-limited environments.
In contrast, CAXM integrates convolutional operations with a Convolutional Additive Self-attention (CAS) mechanism. This design facilitates sufficient feature interaction while avoiding the high computational overhead associated with traditional self-attention. As a result, it maintained moderate complexity (1887 M FLOPs) and achieved the highest mAP of 90.58%, outperforming both alternatives.
In summary, CAXM demonstrates an optimal balance between modeling capability and computational efficiency, making it well suited for high-performance detection tasks on mobile and embedded platforms.
Effectiveness Analysis of the CAXM Component—Evaluating Interaction Strategies to Assess the Impact of Similarity Functions. To further assess the contribution of spatial- and channel-domain interactions within the CAXM component, a series of controlled experiments were conducted by varying the interaction configurations. The results, presented in
Table 6, evaluate how different interaction strategies affect feature modeling capability and detection performance.
In the baseline setting (Strategy #1), both spatial interaction and channel interaction were utilized. This configuration achieved the highest mAP (90.58%) with similar computational complexity, demonstrating that dual-domain interactions offer complementary benefits for global-context modeling.
When spatial interaction was removed (Strategy #2), the mAP dropped to 89.96% (−0.62%). When channel interaction was removed (Strategy #3), the mAP was 90.22%, indicating a smaller degradation (−0.36%). These results suggest that spatial interaction plays a more crucial role in capturing global dependencies, although channel interaction remains beneficial.
Strategies #4 and #5 further evaluated different combinations of interaction mechanisms applied to the Query and Key branches:
Strategy #4: This applied and separately to the Query and Key branches. The mAP dropped to 90.06%, suggesting that asymmetric interaction is insufficient for fully modeling feature relationships.
Strategy #5: This embedded dual-domain interactions in both branches using an interleaved spatial–channel configuration. This yielded an mAP of 90.51%, showing that interaction order has marginal impact on overall performance.
In summary, employing both spatial and channel interactions significantly enhanced feature modeling while maintaining similar computational cost (FLOPs ≈ 1.88 G). These findings validate the effectiveness and efficiency of dual-domain interaction in resource-constrained scenarios and support its role as a key design element within the CAXM architecture.
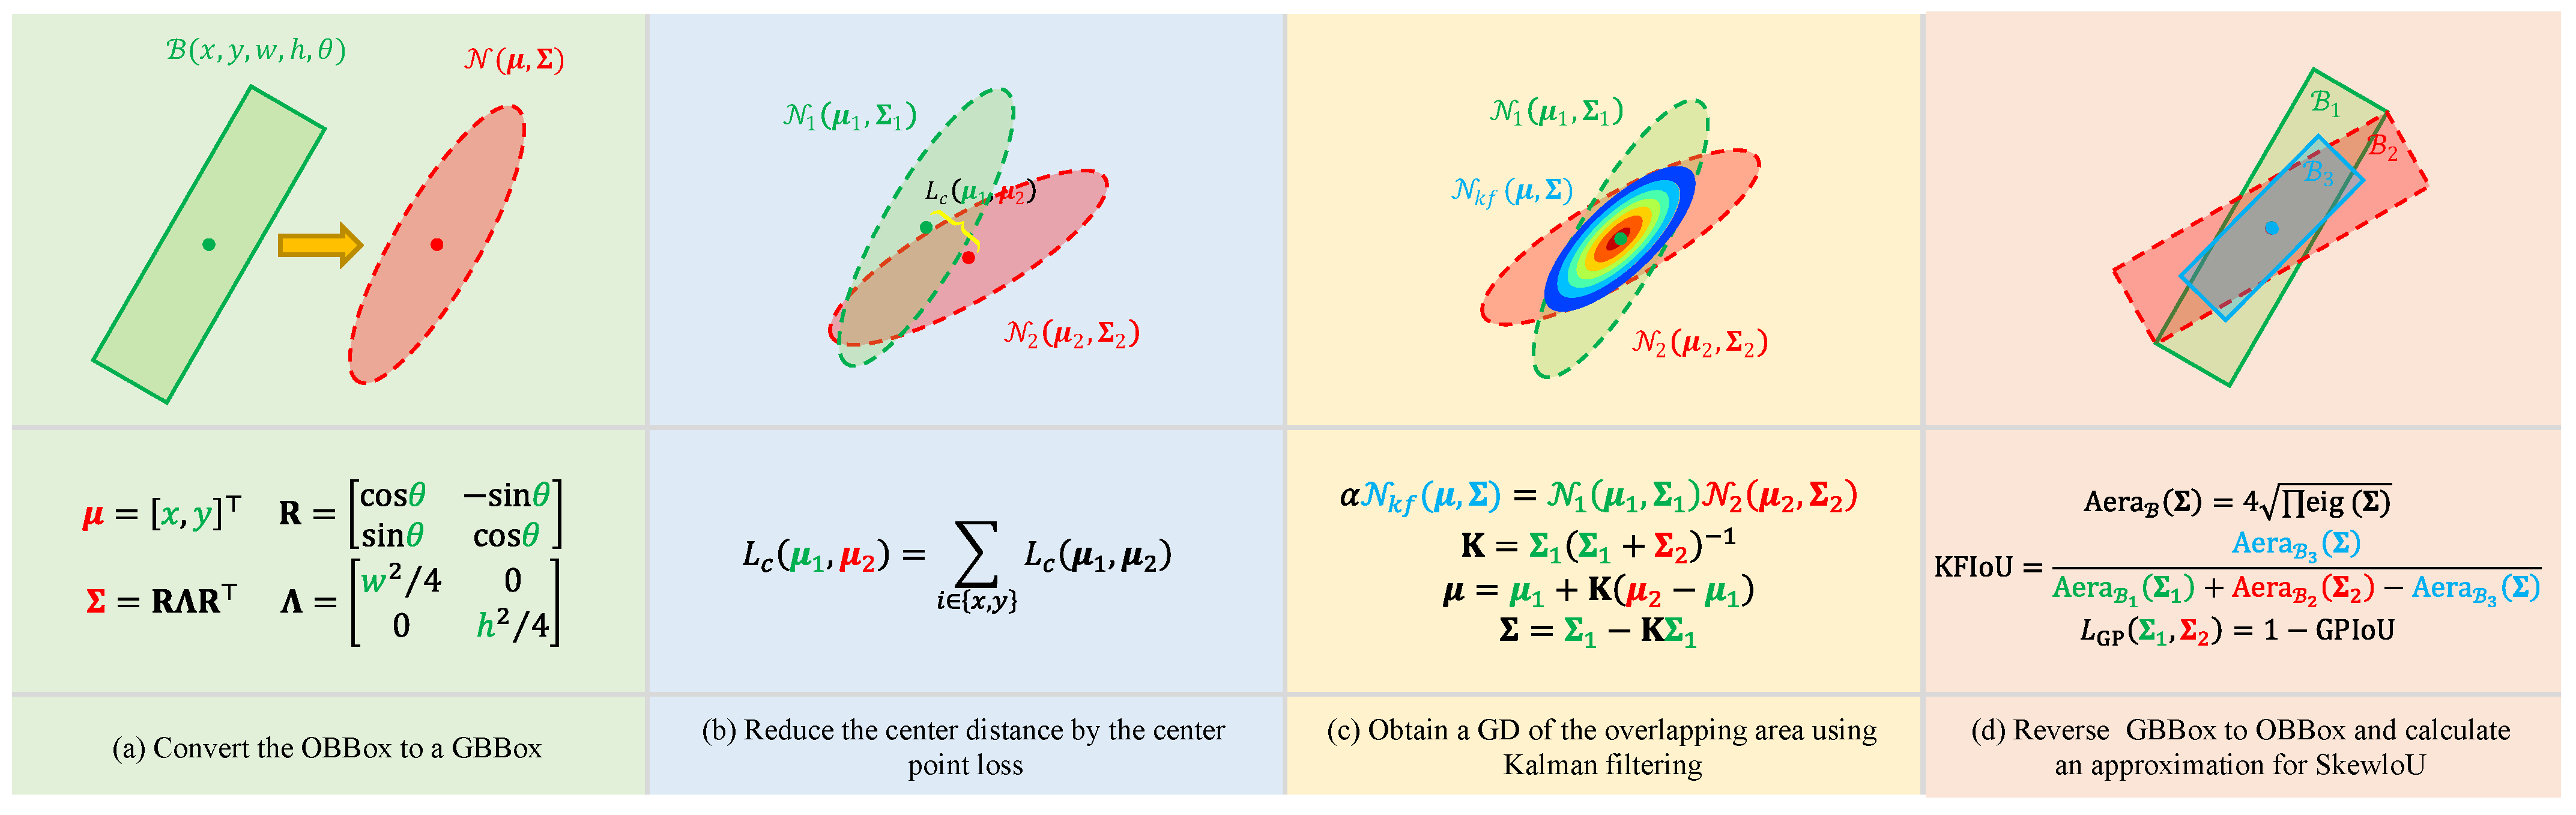
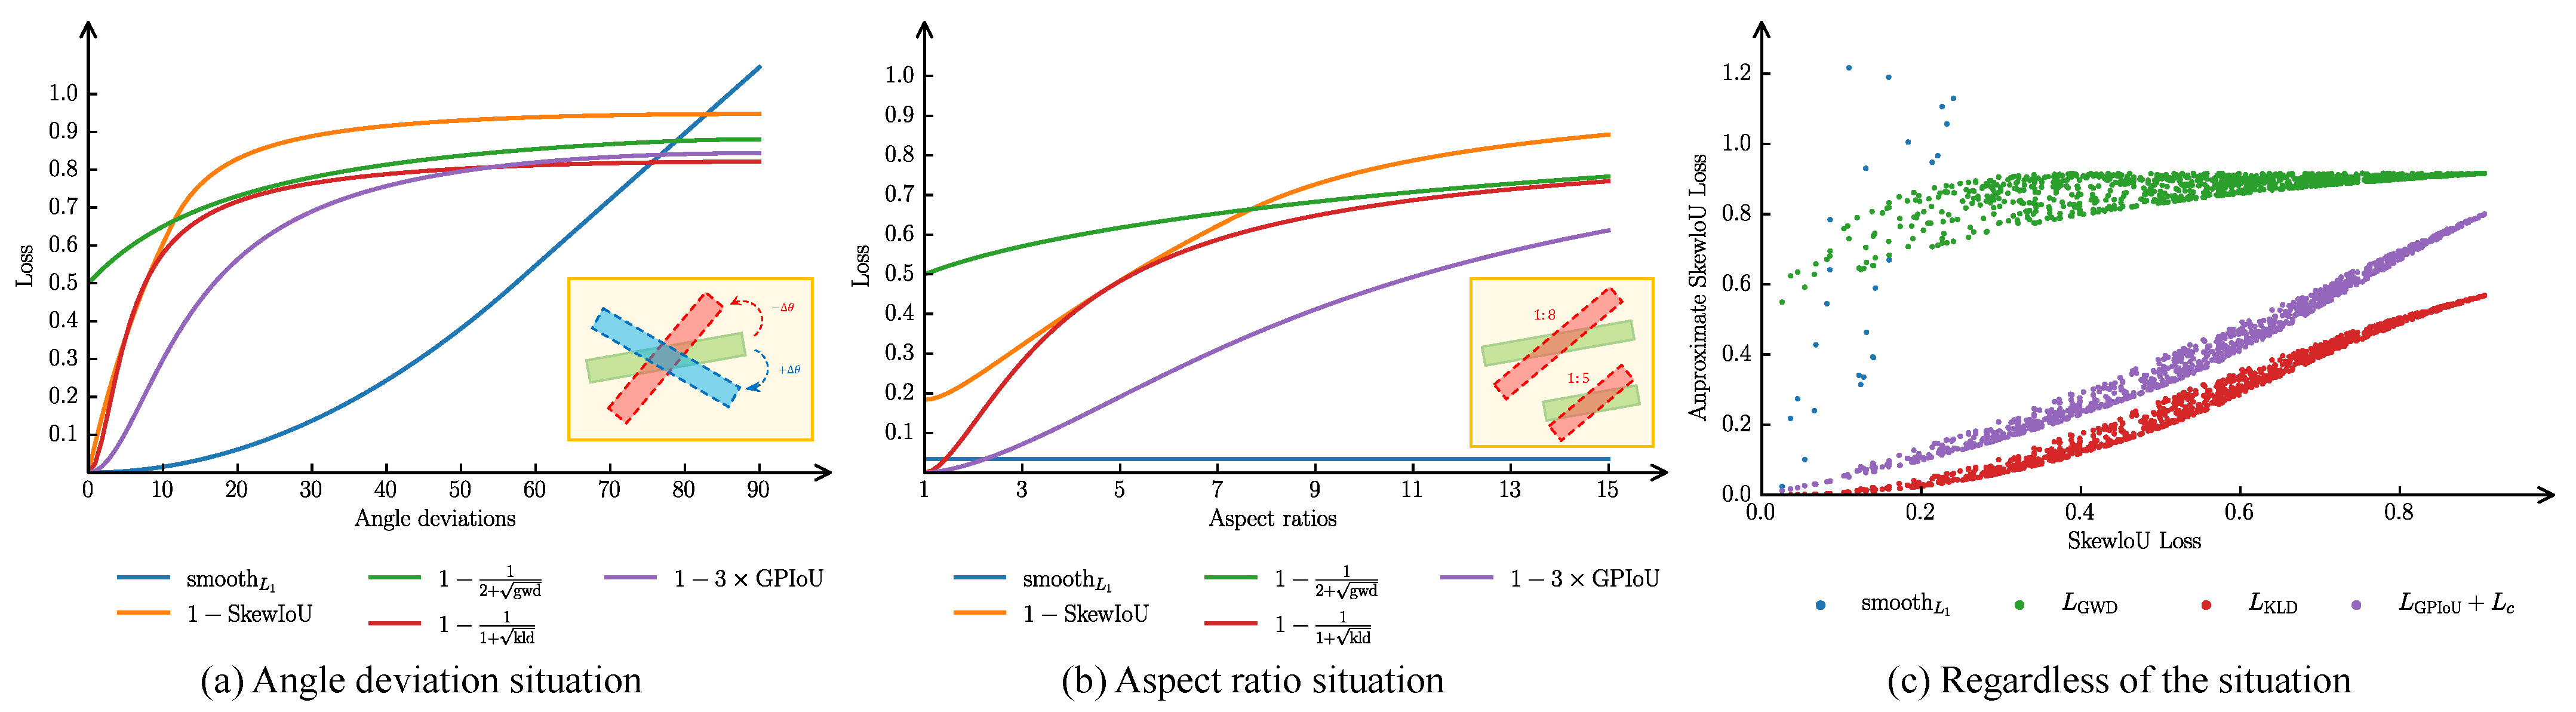
An Ablation Study on the Effectiveness of Different Regression Loss Functions. To evaluate the adaptability and effectiveness of various regression loss functions in ODD, a comparative experiment was conducted encompassing both traditional OBBox-based approaches and Gaussian-based modeling.
Figure 10 illustrates the optimization dynamics of the proposed GPIoU variants, highlighting the role of the centroid alignment term
in improving training stability. The corresponding results are summarized in
Table 7, where BC denotes boundary continuity, HP indicates sensitivity to hyperparameters, and Consistency refers to trend alignment with SkewIoU.
Loss functions based on conventional BBox representations exhibited several limitations. Although was simple to implement, it lacked direct alignment with IoU metrics and could not guarantee geometric consistency, resulting in an mAP of only 85.47%. The plain SkewIoU loss improved the mAP to 89.53% by directly optimizing OBBox overlap. However, its implementation complexity and reduced adaptability to scale variance limited its robustness.
In contrast, Gaussian-based regression losses (GWD, KLD, and GPIoU) demonstrated more stable optimization behavior:
KLD showed strong consistency with SkewIoU and achieved a 90.25% mAP, ranking the highest among the non-proposed methods;
GWD yielded slightly lower performance (89.98%) due to mild trend inconsistency;
GPIoU (Ours) achieved a 89.46% mAP with minimal implementation overhead and no hyperparameter tuning;
(Ours) introduced a KLD-based centroid alignment term, , resulting in improved convergence and a final mAP of 90.58%.
Key observations from training dynamics (
Figure 10):
- 1.
Faster Early Convergence: The inclusion of accelerated loss reduction within the first 20 epochs;
- 2.
Gradient Smoothing: The combined formulation mitigated instability during regression, particularly for elongated targets;
- 3.
Accuracy Gain: The geometric–centroid synergy yielded a 1.12% mAP improvement, confirming the importance of structure-aware loss design.
These results indicate that within Gaussian-based modeling frameworks, incorporating a center alignment mechanism enhances robustness and convergence. Overall, such losses demonstrate superior generalization under complex object morphology and non-uniform scale distribution. Due to its consistency with SkewIoU and lack of hyperparameter dependence, GPIoU proves to be a practical and effective regression loss for ODD.
An Ablation Study on Different Formulations of the GPIoU Loss. To investigate the impact of different mathematical formulations of GPIoU on detection performance, several variants based on linear, logarithmic, and exponential transformations were evaluated. The results are summarized in
Table 8.
The experiments show that all GPIoU variants significantly outperformed the traditional loss. Among them, nonlinear formulations (logarithmic and exponential) yielded the most prominent improvements. Specifically, the following were observed:
The exponential form enhanced the gradient response for low-IoU samples, thereby improving training on hard examples and achieving an mAP of 89.74%.
The linear form directly regressed IoU difference, resulting in an mAP of 90.15%.
The logarithmic form amplified the penalty for poor localization, leading to the highest mAP of 90.58%.
To ensure compatibility with the standard IoU value range, scaled versions of GPIoU loss (e.g., and ) were also evaluated. However, these scaled formulations led to performance degradation—e.g., the scaled logarithmic form yielded only a 86.71% mAP—likely due to gradient imbalance introduced by over-amplification.
As a result, the logarithmic formulation was adopted as the default regression loss in GAANet, offering a favorable trade-off between accuracy, convergence stability, and implementation simplicity.
4.4. Comparative Experiments
To comprehensively evaluate the effectiveness of GAANet in ODD tasks, a series of comparative experiments were conducted on the HRSC2016, UCAS-AOD, and DOTA v1.0 datasets. All experiments utilized CAX-ViT-T as the backbone to ensure both efficient and accurate feature extraction.
Comparison on the HRSC2016 Dataset. The quantitative results on the HRSC2016 dataset are summarized in
Table 9. GAANet achieved an mAP of 90.58%, surpassing all compared methods. In contrast to traditional anchor-based strategies, GAANet adopts a one-pixel-one-anchor approach, where each spatial location in the feature map is assigned only one horizontal anchor. This design reduces computational overhead and improves inference efficiency.
Most compared methods employ ResNet-50 or ResNet-101 as their backbones and often leverage multi-scale input settings. Despite using a lightweight Transformer-based backbone (CAX-ViT), GAANet demonstrates superior detection accuracy. These results indicate its robustness in handling high aspect ratio targets and its ability to maintain precision under complex background conditions.
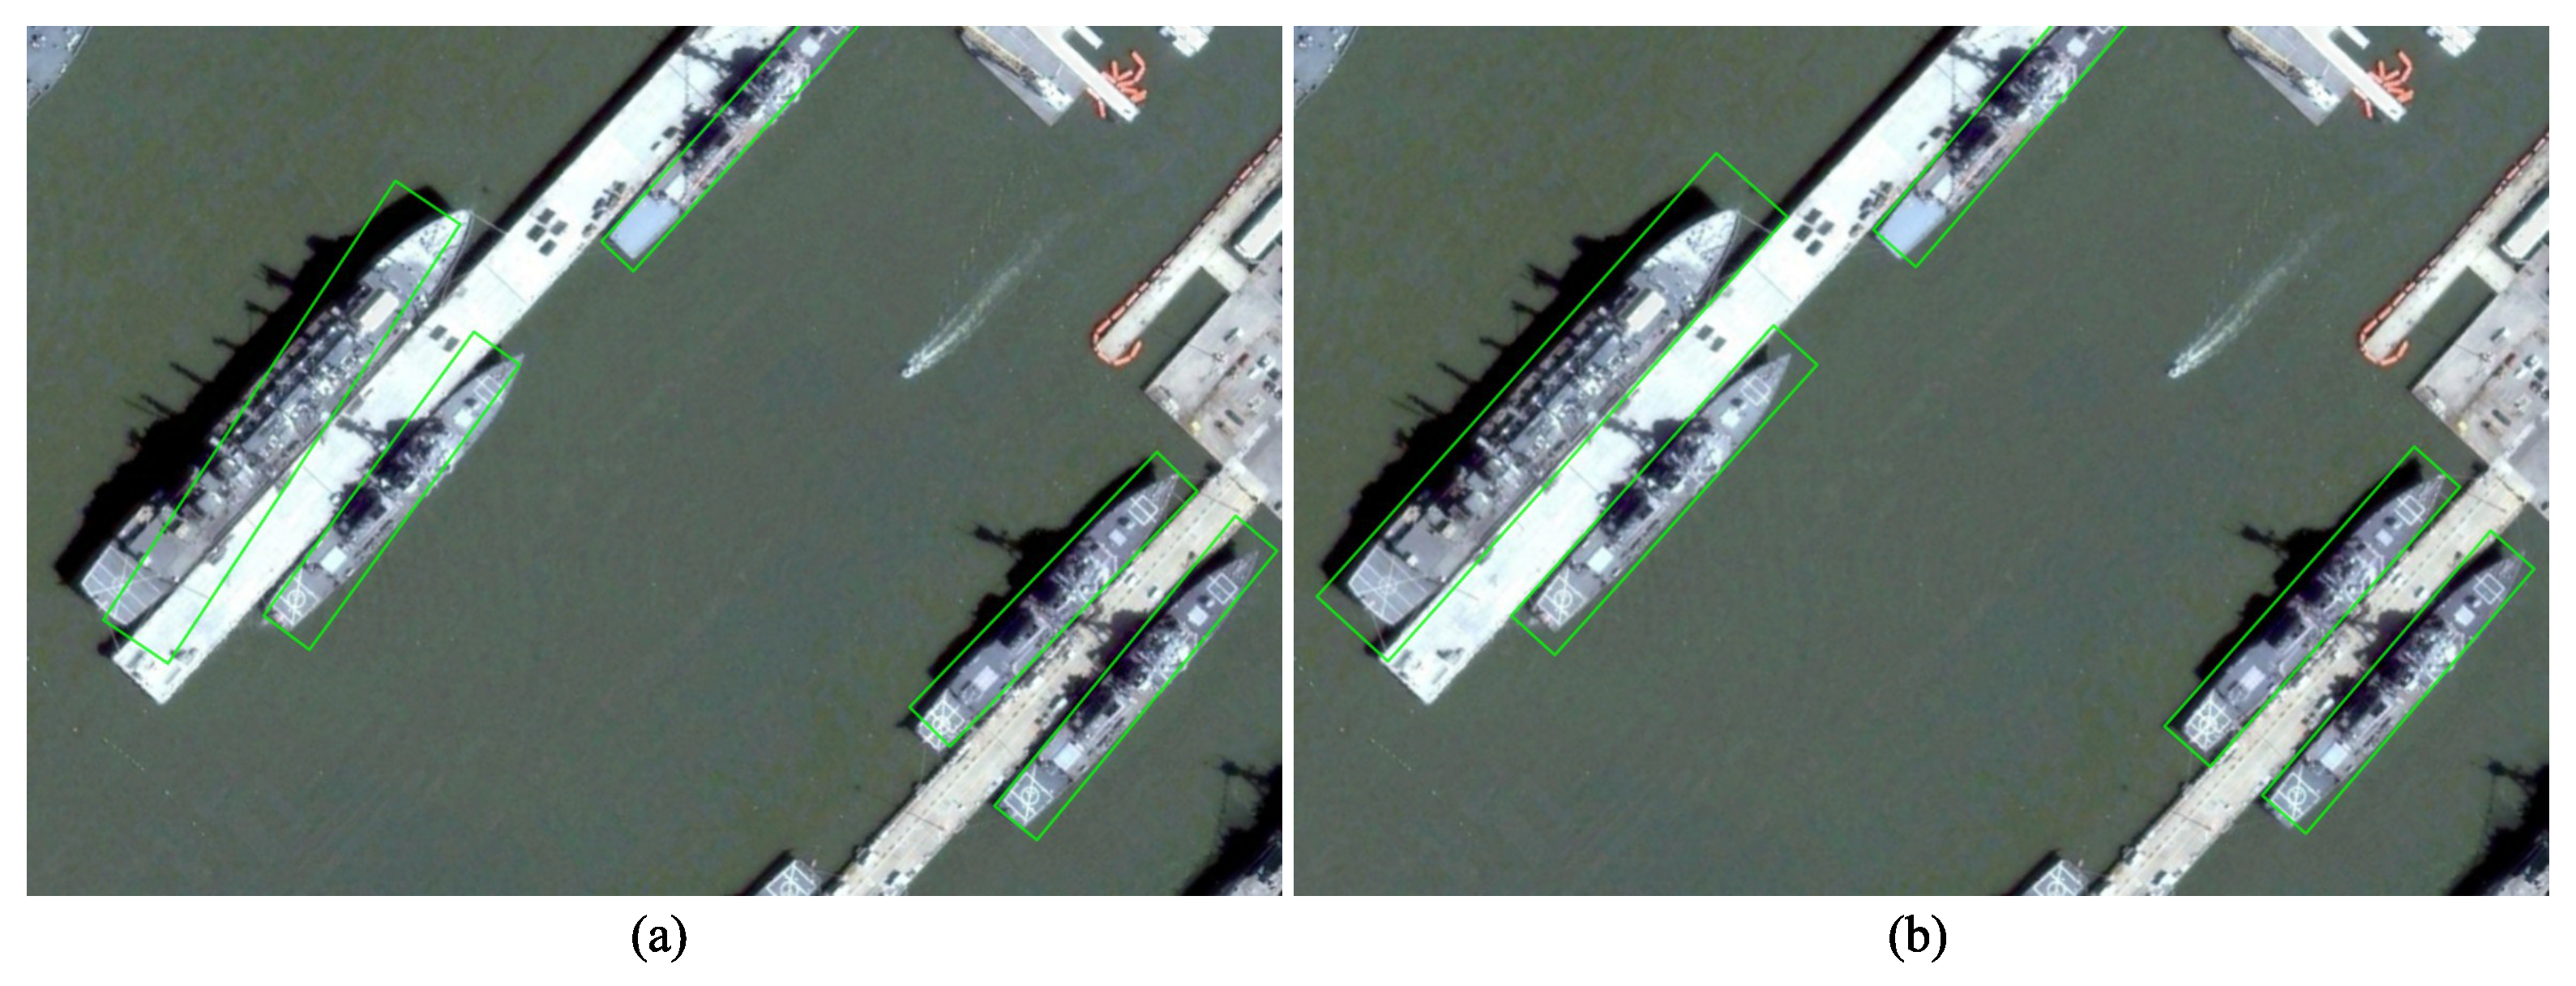
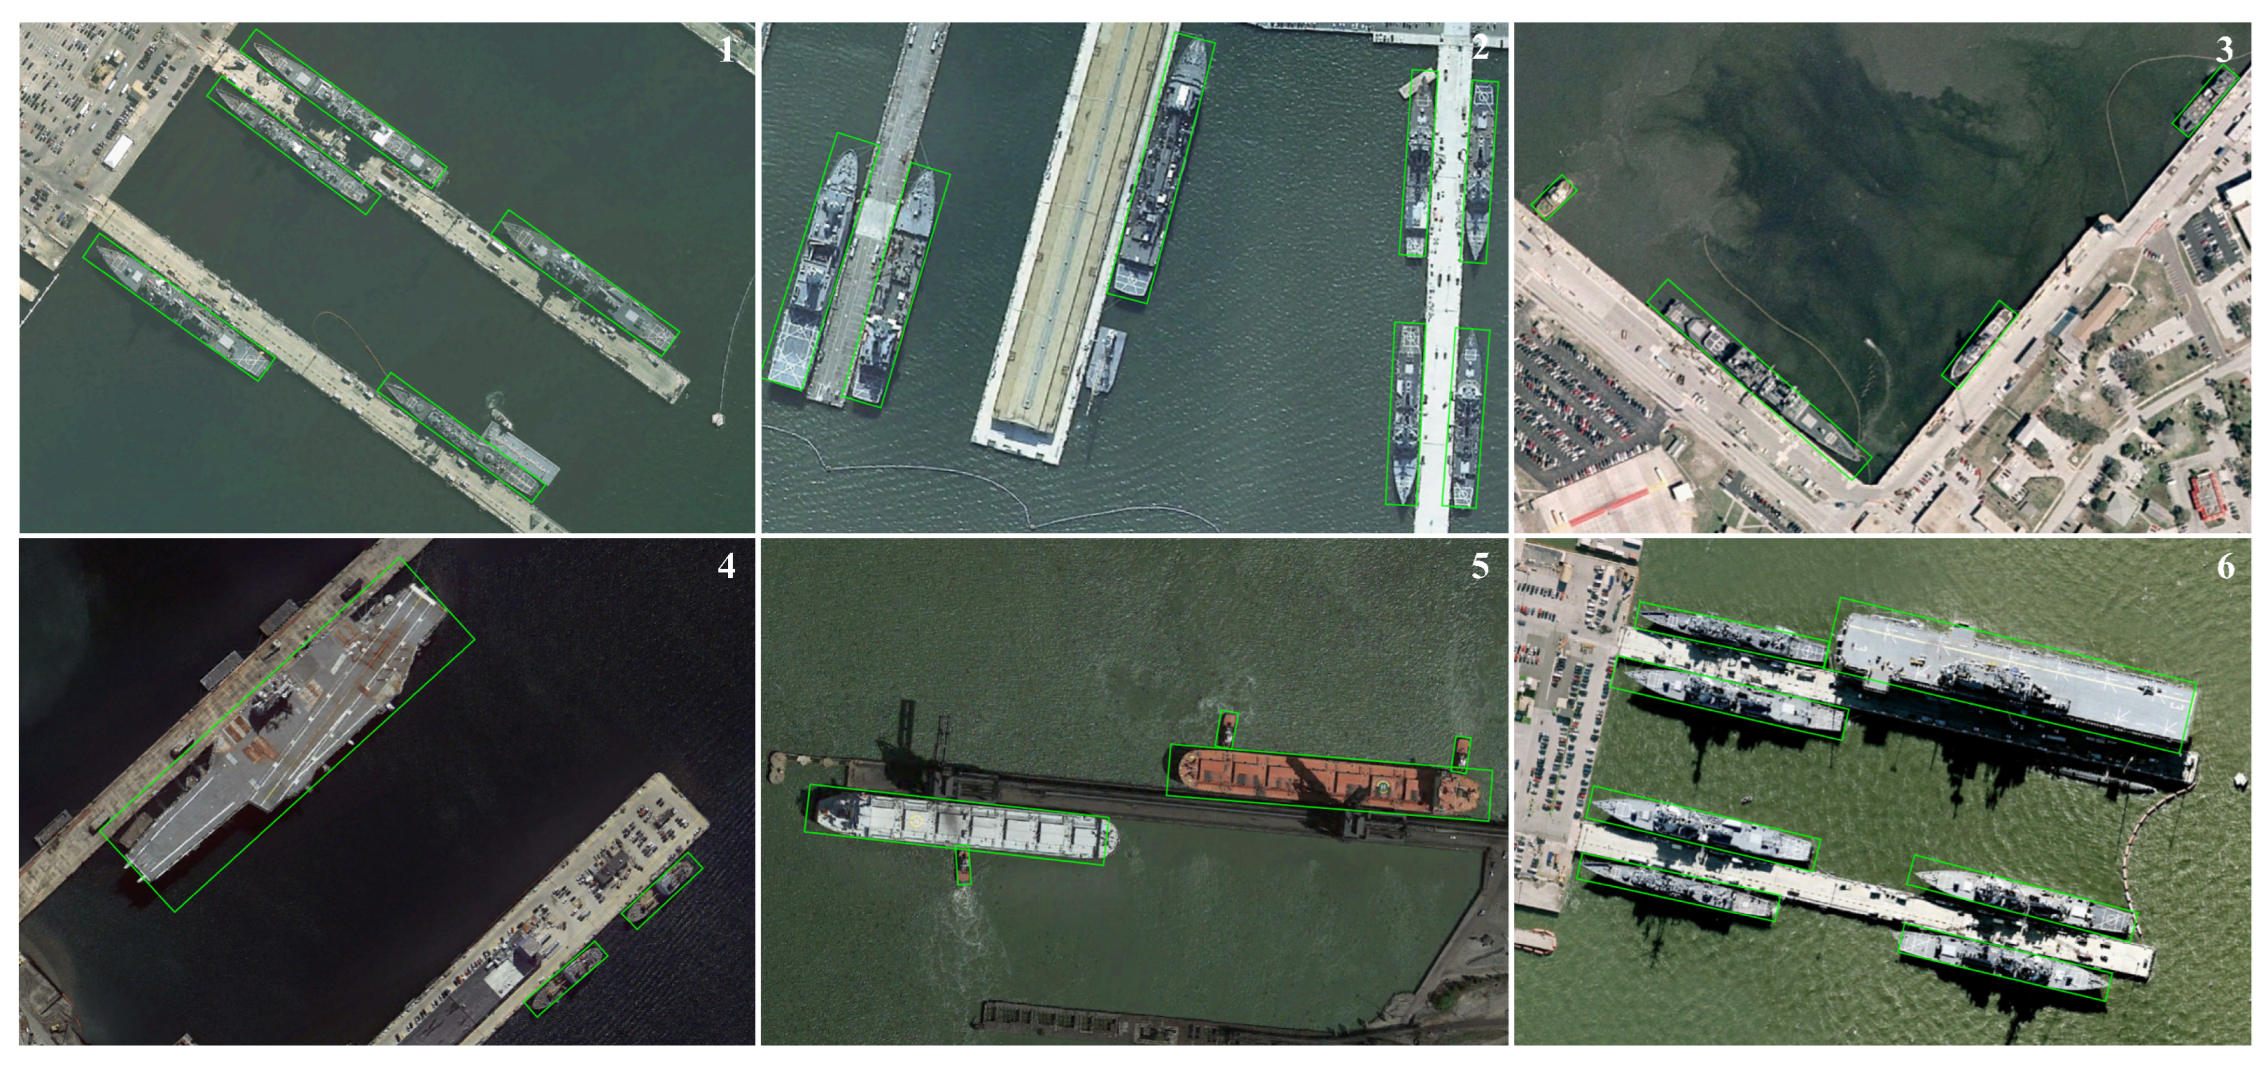
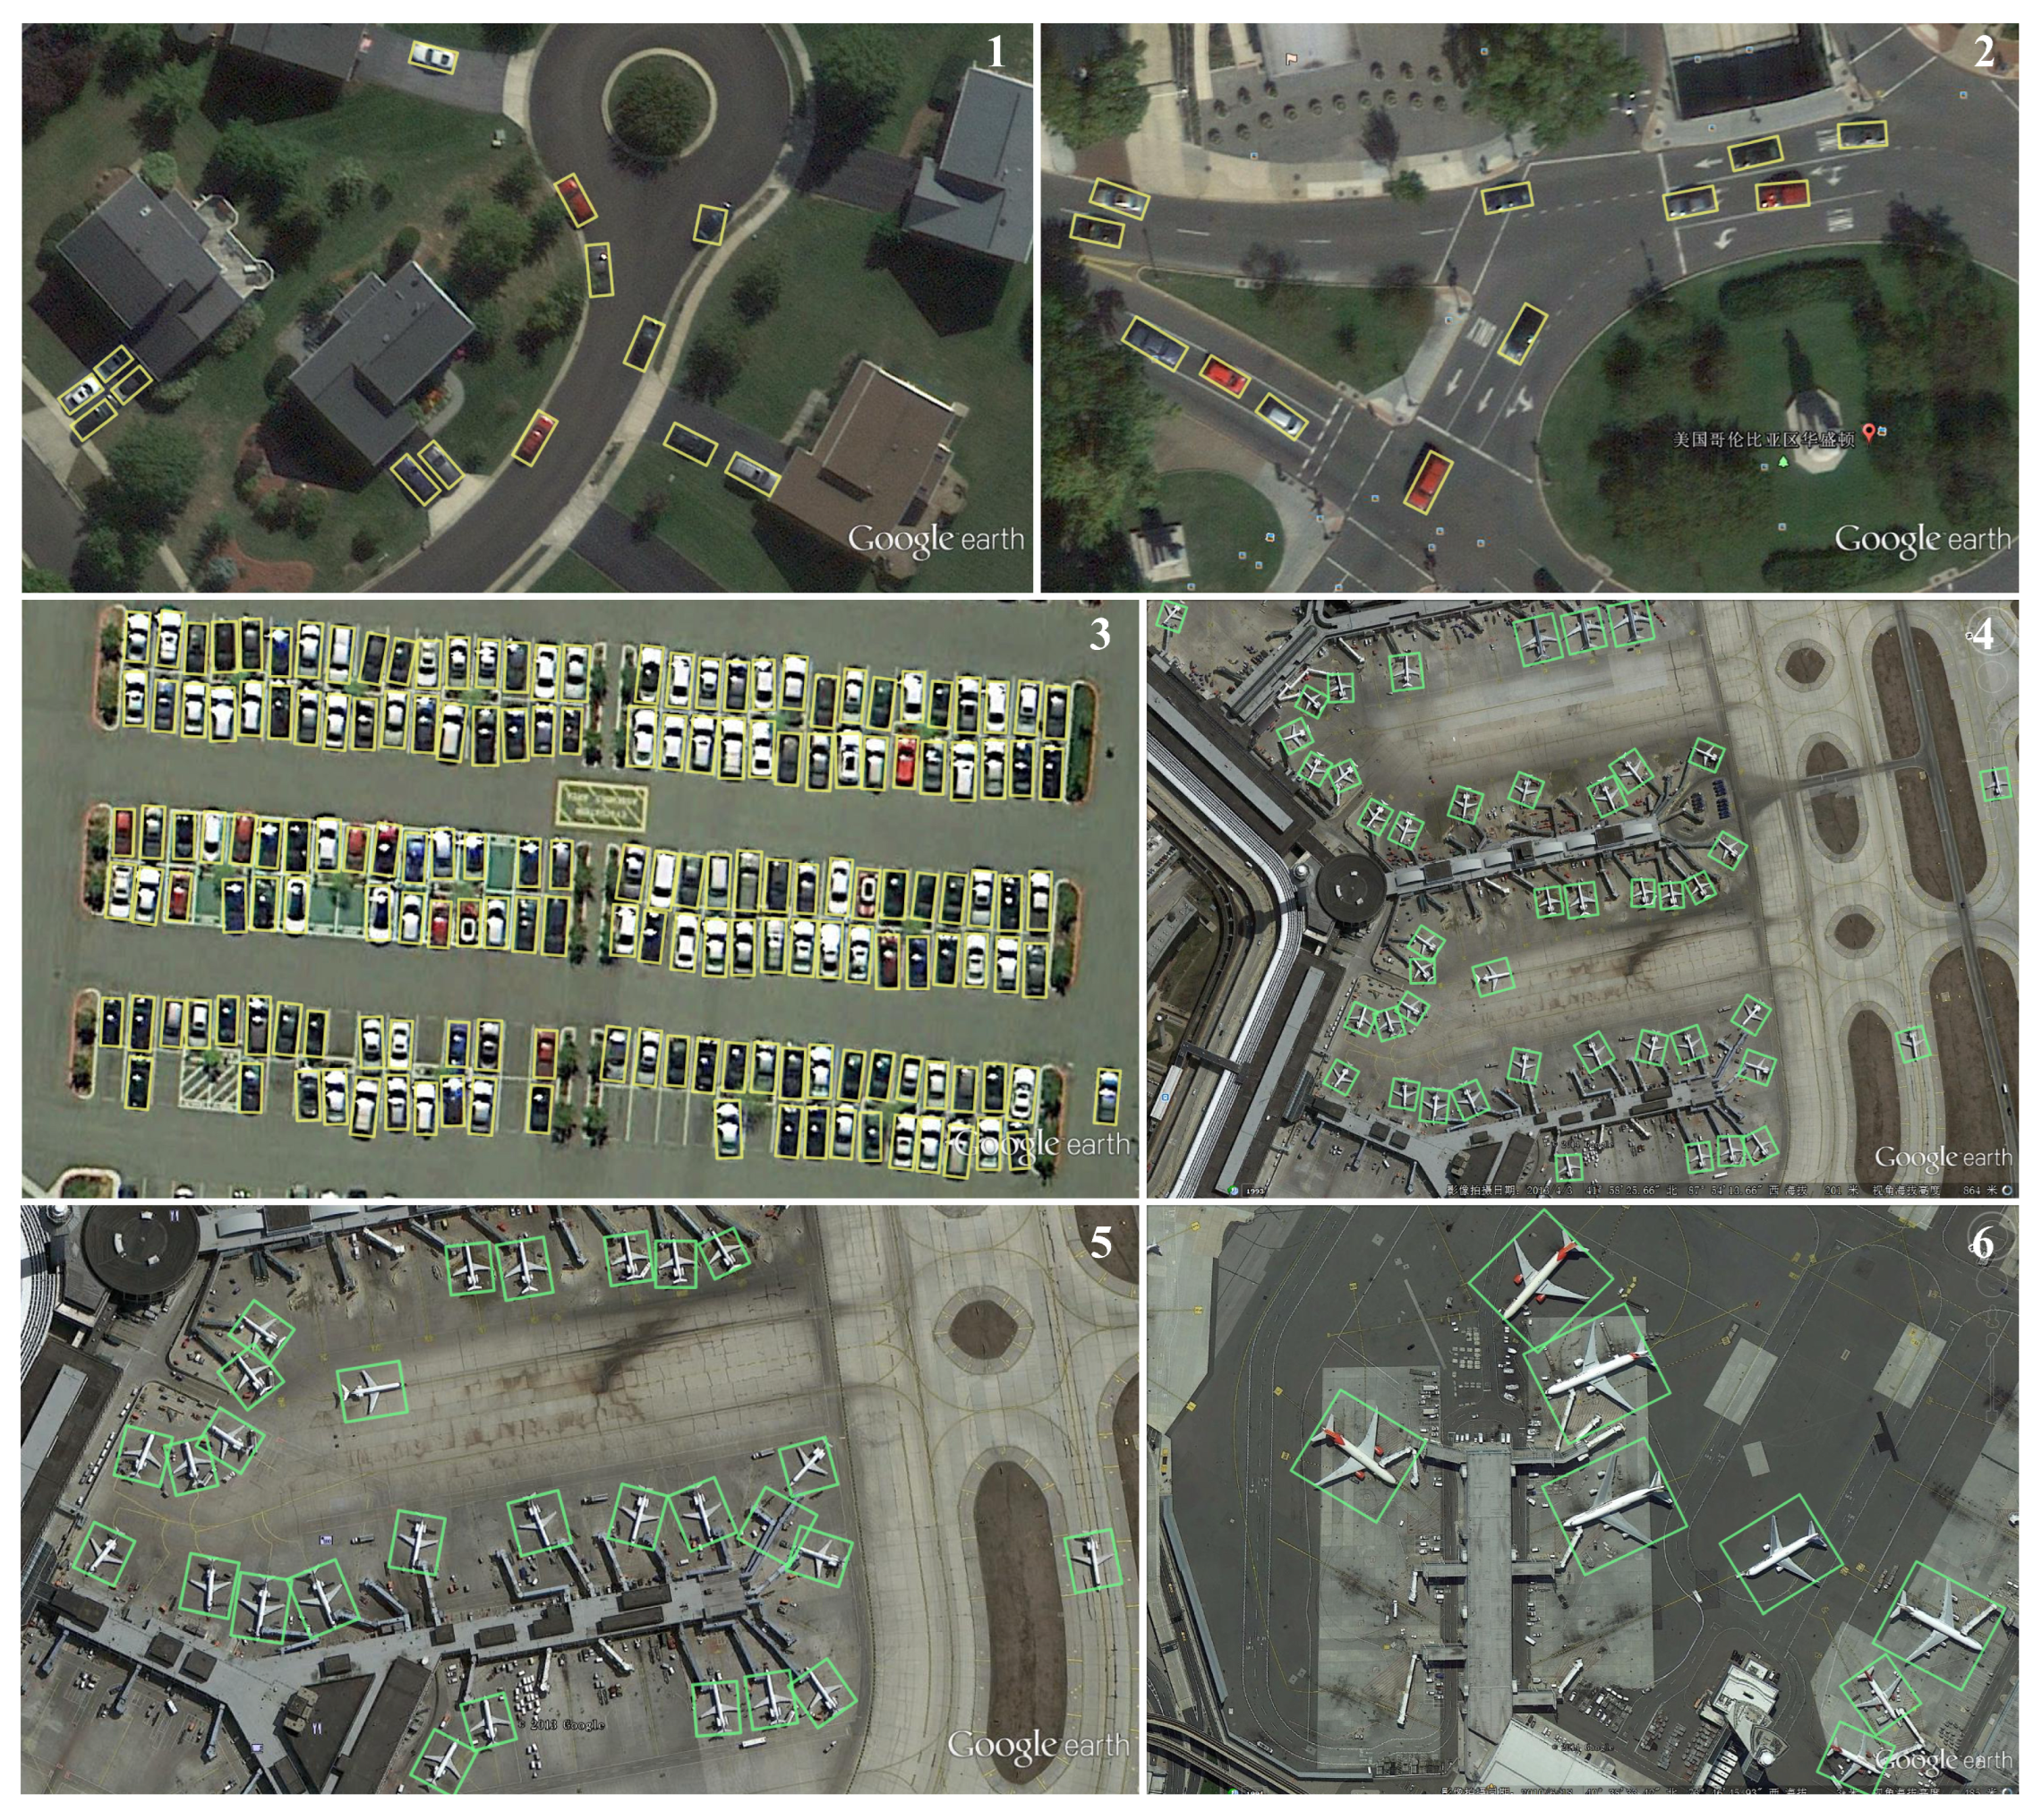
The detection visualizations in
Figure 11 further illustrate the practical performance of GAANet. The HRSC2016 dataset includes a variety of ship types with substantial variation in size and geometry, along with strong background clutter. The OBBoxs predicted by GAANet demonstrate precise alignment with object boundaries, showing minimal positional drift or angular deviation.
In the samples labeled 3, 4, and 5, ships of varying sizes are accurately detected with orientation-consistent BBoxs. These results confirm the optimization stability of the GPIoU loss and the multi-scale structural modeling capability of the CAX-ViT backbone. Collectively, they highlight the robustness and accuracy of GAANet under conditions involving high aspect ratio targets and complex backgrounds.
To further evaluate the orientation prediction capability of different methods, the angle MAE (Mean Absolute Error) was computed on the HRSC2016 test set. The results are presented in
Table 10. GAANet achieved the lowest angle MAE of 2.3(°), indicating superior accuracy in OBBox regression compared to several state-of-the-art approaches, including RoI Transformer (5.8(°)).
Overall analysis reveals three key advantages of GAANet in orientation angle regression:
- 1.
Superior prediction accuracy: GAANet attained the lowest angle MAE (2.3°), corresponding to an 11.5% improvement over the second-best method, A-Net (2.6°). This result was accompanied by the highest mAP (90.58%) among all compared methods. The improvement is attributed to the closed-loop modeling of feature interaction, representation, and optimization, which effectively mitigates the discontinuity and periodicity issues in angular regression.
- 2.
Theoretical modeling consistency: Gaussian-based methods, such as GWD and GAANet, generally showed lower angle errors, highlighting the robustness of covariance matrix representations for rotation modeling. Compared to GWD, GAANet introduced a product-based GPIoU loss and center alignment mechanism, yielding a 20.7% reduction in angle error and enhancing geometric consistency (see
Section 3.4).
- 3.
Adaptability under extreme aspect ratios: On samples with high aspect ratios (e.g., aspect ratio > 8:1), GAANet maintained a stable angle MAE of 2.5°, while methods such as RoI Transformer showed substantial degradation (e.g., 7.1°). This suggests that the additive attention mechanism in CAX-ViT (refer to
Figure 6) effectively models axis-symmetric structures and enhances orientation robustness.
In conclusion, GAANet demonstrates promising performance in high-precision rotated object regression tasks, validating the effectiveness of the proposed symmetry-preserving strategy and distribution-based modeling mechanism in orientation angle prediction.
Comparison on the UCAS-AOD Dataset. To further assess the detection performance of GAANet in multi-category scenarios, experiments were conducted on the UCAS-AOD dataset. The results are reported in
Table 11. CAX-ViT was used as the backbone, and the input resolution was set to
. GAANet achieved an overall mAP of 89.95%, yielding competitive results across both vehicle and airplane categories.
Specifically, GAANet obtained an mAP of 89.25% for the vehicle category and 90.65% for the airplane category, outperforming several representative methods, including SLA, RIDet-O, and TIOE-Det.
The visual results in
Figure 12 further illustrate the model’s orientation regression capabilities. In samples 1 and 2, vehicles with varying directional orientations on curved roads were accurately detected, with predicted OBBoxs aligning with contour boundaries. For the dense parking scene of sample 3, GAANet maintained reliable performance under occlusion and clutter. Samples 4–6 depict aircraft in various poses, for which GAANet preserved directional consistency and contour alignment, avoiding overlap-induced false positives.
Comparison on the DOTA v1.0 Dataset. On DOTA v1.0, GAANet achieved an mAP of 77.86%, surpassing several anchor-based methods (e.g., ReDet: 76.25%), anchor-free models (e.g., BBAVectors: 75.36%), and Transformer-based detectors (e.g., AO2-DETR: 77.75%). Notably, GAANet showed superior performance in the following categories:
Large Vehicle (79.63%): This benefited from Gaussian aspect ratio modeling;
Tennis Court (93.84%): This is attributed to multi-scale symmetric feature learning;
Ship (75.99%): This was improved via GPIoU loss-based geometric alignment;
Plane (92.22%) and Small Vehicle (81.19%): Competitive performance was maintained across scale levels.
A performance gap was observed in categories with complex geometric topologies (e.g., bridge: 54.74%), suggesting the limitations of unimodal Gaussian modeling in representing irregular contours. Future work may explore mixture modeling or structure-aware decomposition to improve robustness in such cases.
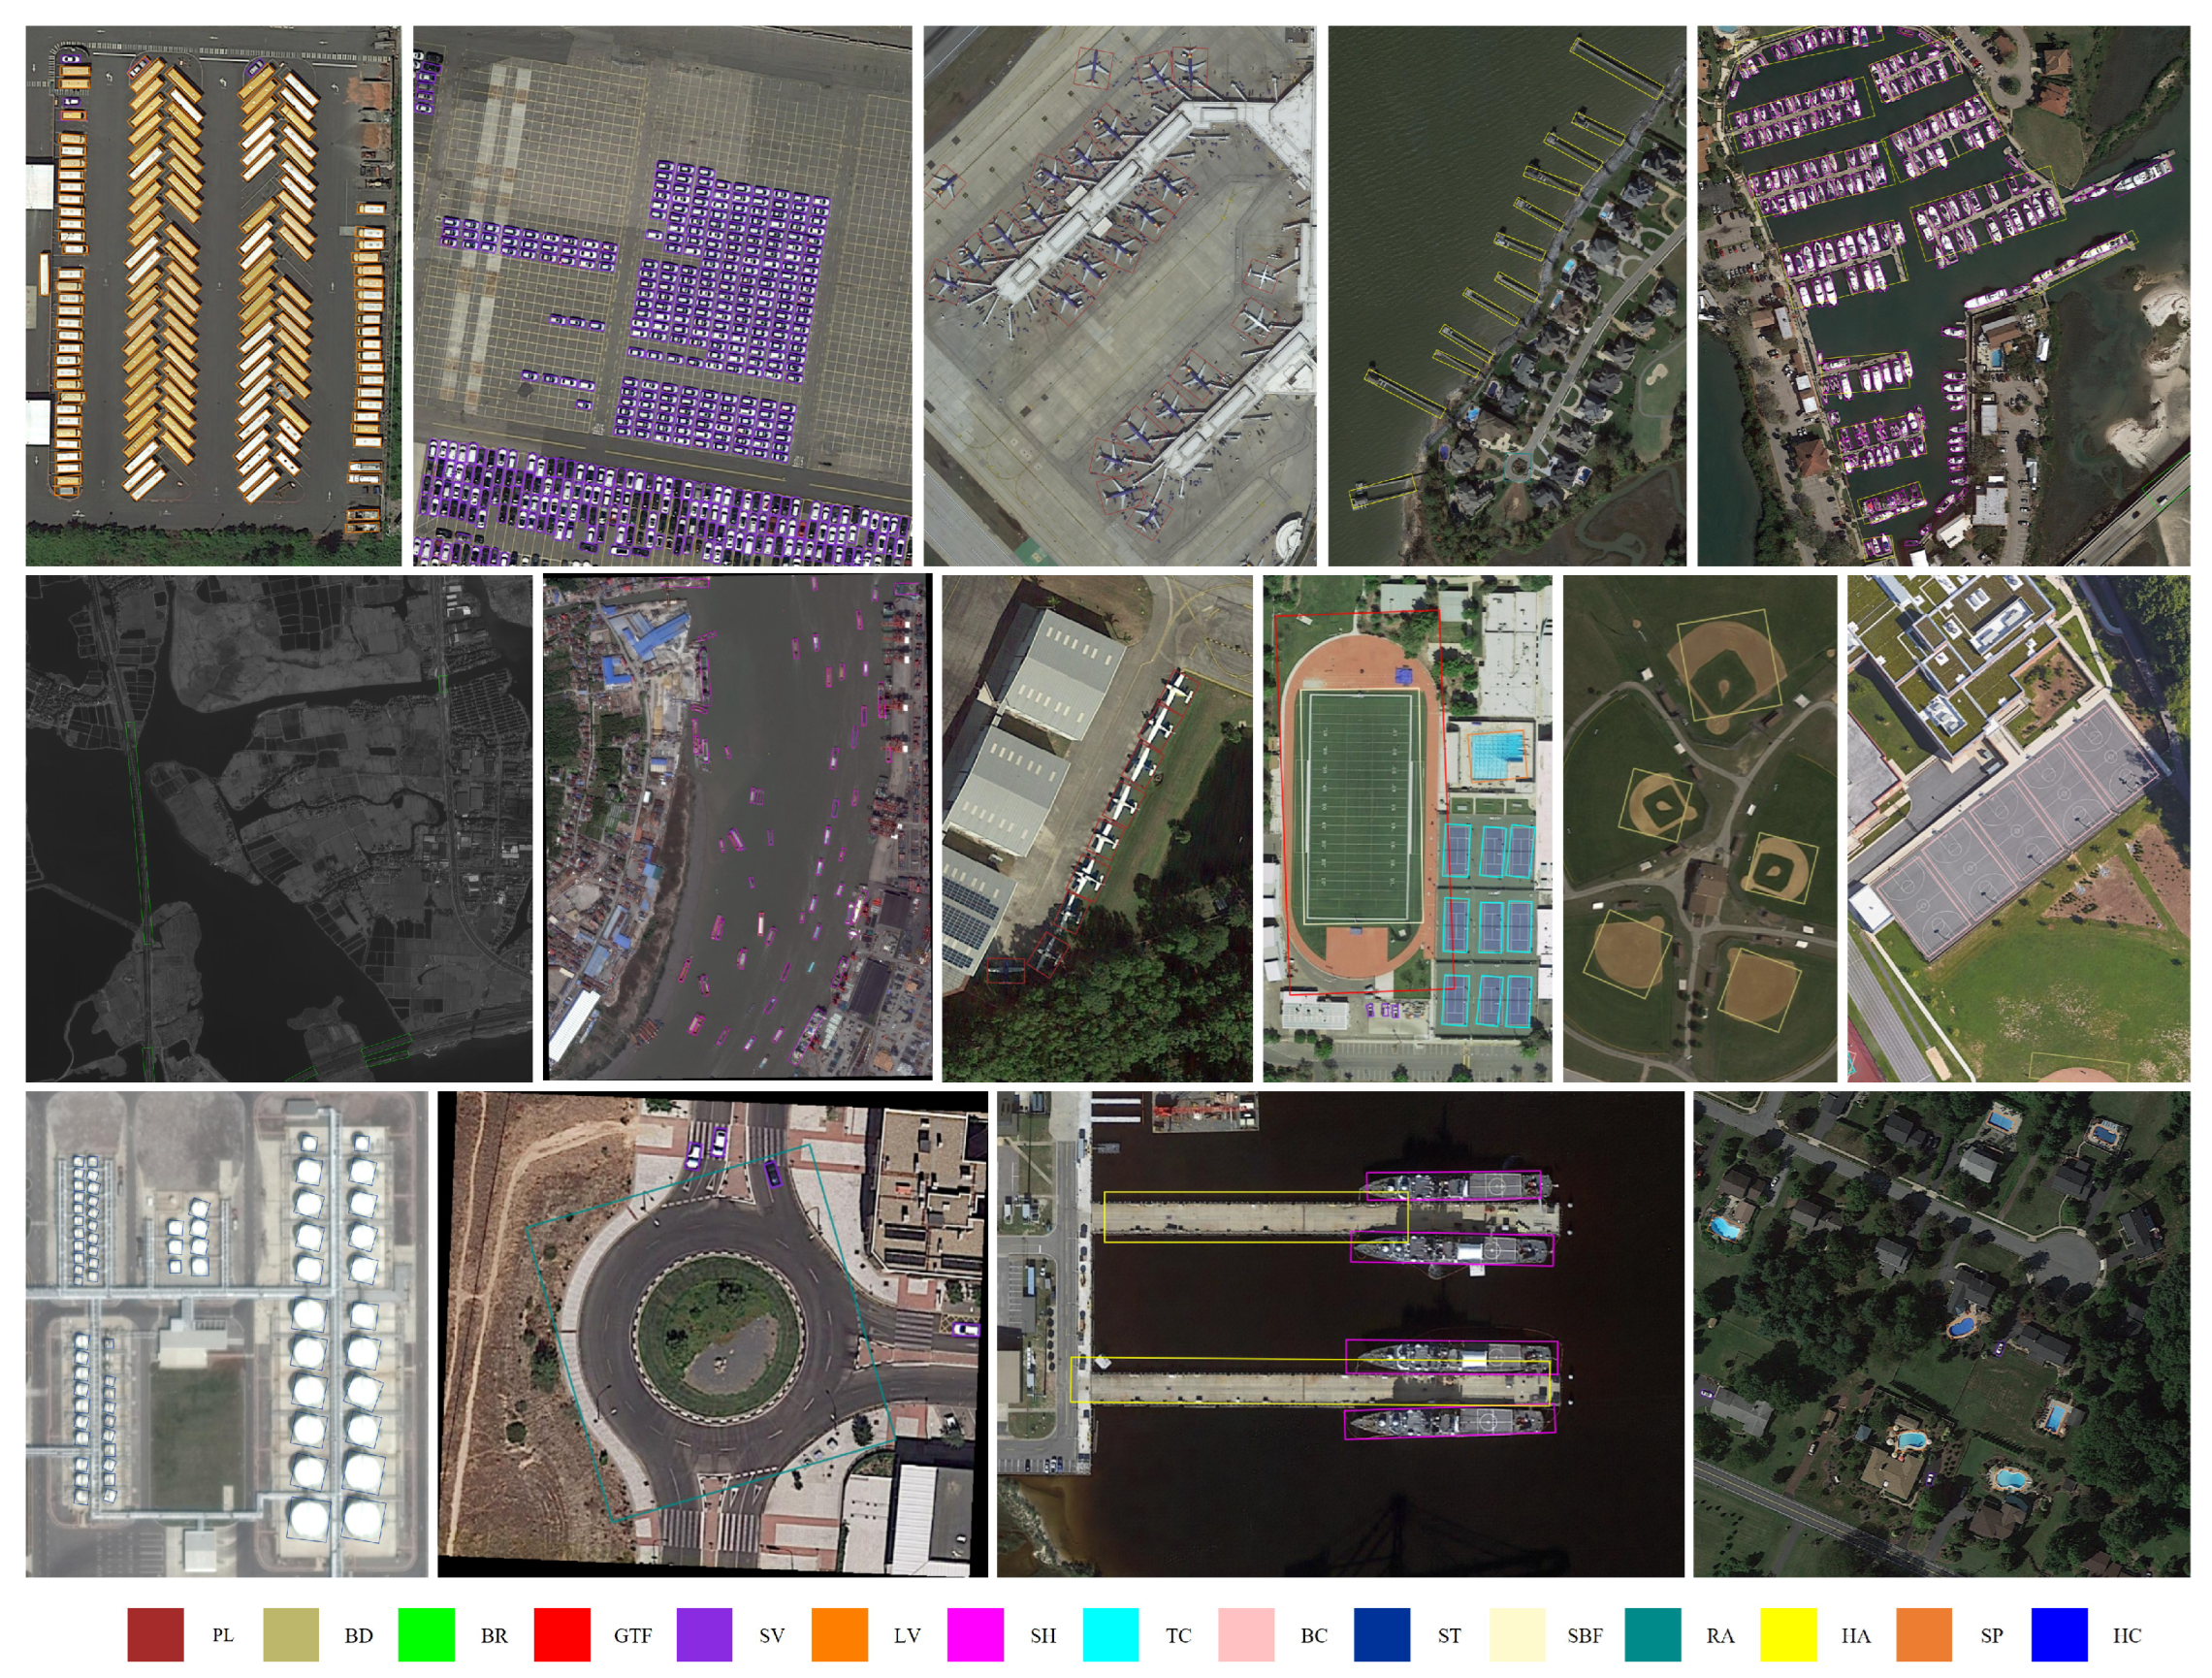
Comparison on the DOTA v1.0 Dataset. To comprehensively assess performance under complex, multi-class detection scenarios, GAANet was evaluated on the DOTA v1.0 benchmark. The per-category results are summarized in
Table 12, and visualizations are provided in
Figure 13. GAANet achieved an overall mAP of
77.86%, outperforming several anchor-based methods (e.g., ReDet: 76.25%), anchor-free methods (e.g., BBAVectors: 75.36%), and Transformer-based frameworks (e.g., AO2-DETR: 77.73%).
The visualizations in
Figure 13 demonstrate that GAANet maintained robust detection accuracy even in dense, small-object scenes, using a single anchor per feature location. In the first row, large and small vehicles, airplanes, and ships are accurately localized, with tight OBBox alignment. In the third row, second image, roundabouts, and small vehicles are detected across multiple scales, reflecting the adaptability of the CAX-ViT and FPN modules.
Performance Variability and Modeling Limitations in Multi-Class Scenarios. Despite the overall strong performance, certain categories remained challenging for unimodal Gaussian-based detectors due to their complex geometry:
BR: This frequently exhibits non-convex, elongated, or curved topologies (e.g., suspension or ramp bridges), which are difficult to approximate using ellipsoidal distributions.
HA: This often includes multiple docks and overlapping vessels, resulting in ambiguous boundaries and distributional confusion.
GTF: Objects are typically elliptical or circular and often partially occluded by vegetation or shadows, leading to reduced covariance accuracy and regression robustness.
As shown in
Figure 14 and
Table 13, GAANet exhibited a performance decline in categories characterized by extreme geometries. In the bridge (BR) category, the assumption of a unimodal Gaussian distribution failed to capture the multi-branch structural characteristics, resulting in a relatively high angle MAE of 8.2°, significantly exceeding the average value (2.3°). In the harbor (HA) category, high-density docking led to substantial distributional overlap, which lowered the recall to 62%. For the ground track field (GTF), partial occlusion and background interference introduced estimation bias in covariance modeling, contributing to mAP degradation.
These outcomes reveal the intrinsic limitations of the current geometric modeling strategy. Specifically, unimodal Gaussian assumptions are insufficient for highly non-convex or compound-shaped objects, and distributional overlap weakens gradient sharpness in GPIoU, thereby affecting regression stability.
Nevertheless, GAANet maintained robust performance (mAP > 89%) on symmetric and well-bounded categories such as airplanes and ships, indicating its effectiveness in standard detection scenarios.
Computational Cost and Inference Efficiency. In addition to accuracy, GAANet was evaluated for resource efficiency, as shown in
Table 14. The model demonstrated a favorable balance between detection performance and computational cost, supporting practical deployment in resource-constrained environments.
Compared with ResNet50-based detectors, GAANet demonstrated superior efficiency with the proposed CAX-ViT backbone:
Reduced FLOPs: At 110.97G, the model incurred 45.9% fewer FLOPs than Det (205.23G), reducing computational overhead significantly.
Parameter Economy: The parameter count was 31.76M, the lowest among the compared methods, and 42.4% and 22.8% lower than that for RoI Transformer and Gliding Vertex, respectively.
Inference Speed: GAANet achieved 15.56 FPS, outperforming RoI Transformer (12.30) and ANet (11.18), demonstrating better runtime efficiency.
In summary, GAANet achieves an effective balance between accuracy and efficiency, making it suitable for deployment in edge-computing or real-time RS applications requiring oriented object detection.


