Article

Two-Dimensional Skeleton Intersection Extraction-Based Method for Detecting Welded Joints on the Three-Dimensional Point Cloud of Sieve Nets

1
School of Mathematics and Computer, Yuzhang Normal University, Nanchang 330103, China
2
School of Software, Nanchang University, Nanchang 330047, China
*
Author to whom correspondence should be addressed.
Symmetry 2025, 17(9), 1484; https://doi.org/10.3390/sym17091484
Submission received: 31 December 2024 / Revised: 29 April 2025 / Accepted: 24 June 2025 / Published: 8 September 2025

Abstract

The concept of symmetry is a fundamental principle in various scientific and engineering fields, including welding technology. In the context of this paper, symmetry could play a role in optimizing the welding trajectory. Welding trajectory point detection relies on machine vision perception and intelligent algorithms to extract welding trajectory, which is crucial for the automatic welding of steel parts. However, in practice, sieve-net welding still relies on manual or semi-automatic operations, which have limitations, such as fixed positions and sizes, making it unsafe and inefficient. This paper proposes a 2D skeleton extraction algorithm for detecting weld joints in a sieve-net point cloud. First, the algorithm applies principal component analysis (PCA) to transform the point cloud and projects it into a 2D image with minimal information loss. Second, the expansion corrosion method is then employed to enhance the connectivity and refinement of the sieve-net mesh to serve the extraction of 2D skeleton. Third, the algorithm extracts the skeleton of the sieve-net grid and detects solder points. The average detection accuracy of the proposed algorithm is over 95%, which confirms its feasibility and practical application value in sieve-net welding.

1. Introduction

Strainers are woven from metal wire and are necessary materials for separating and filtering water, gas, oil and other media due to their excellent permeability, deformation, and temperature resistance and corrosion resistance [1]. With the progress of society and the development of science and technology, sieve nets, as critical components in industrial filtration and structural support [2,3], demand high-precision welding for functional reliability.
Automatic welding is widely used in many fields [4]. Traditional manual welding requires strict skills and high labor intensity, it is difficult to ensure uniform welding quality, and productivity is low [5]. In addition, with rising labor costs, welding automation is becoming more and more urgent [6]. At present, many researchers have carried out some automated welding research. For example, Villan et al. [7] proposed a laser vision tracking control system for industrial welding processes, which achieves good results when the gap shape of the weld joint changes significantly or is deformed, and the robustness of the algorithm is highly appreciated. Li and Xu et al. [8] proposed a system that can identify different types of welds, such as U, V, and T, and end joints and has good versatility, but the image processing of the system takes a lot of time, and it requires a lot of time for improvement in real time. Zheng and Xu et al. [9] proposed a laser-based seam-tracking image processing solution that reduces glare interference in the welding process while ensuring tracking accuracy. However, it is not applicable to extracting welds from the 3D point clouds of steel parts. Scansonic [10] proposed a visual seam-tracking system for various types of welding, such as arc welding, laser welding, and ion welding, while Meta’s Smart Laser Probe seam-tracking system can be mainly used for highly reflective materials. In recent years, technologies utilizing deep learning for automatic weld inspection have been developed [11,12,13,14]. Additionally, new research has also been conducted on the automatic extraction of weld points using visual sensors [15,16]. In summary, despite the many advances in the automated welding of steel parts, the level of automation still needs to be further improved, mainly because (1) most methods rely on manual pre-processing, such as the need to fix them in the tire-loading frame when carrying out the automated welding process. (2) The steel parts are diverse and complex, and developing a general-purpose algorithm is a big challenge. Unfortunately, welding steel parts for sieve nets as a kind of welding workpiece is currently manual and still unavoidable. In addition to this, the manufacture of precision sieve nets is governed by stringent industrial standards, including ISO 2768-mK geometric tolerances for weld joint positioning and ASTM E2901-15 specifications for automated inspection repeatability. Existing methods fail to simultaneously meet the dual requirements of real-time processing and sub-millimeter accuracy on irregularly curved surfaces, which are critical for aerospace and microfluidic applications. This study addresses these industrial imperatives through a novel framework that aligns computational efficiency with precision engineering standards.
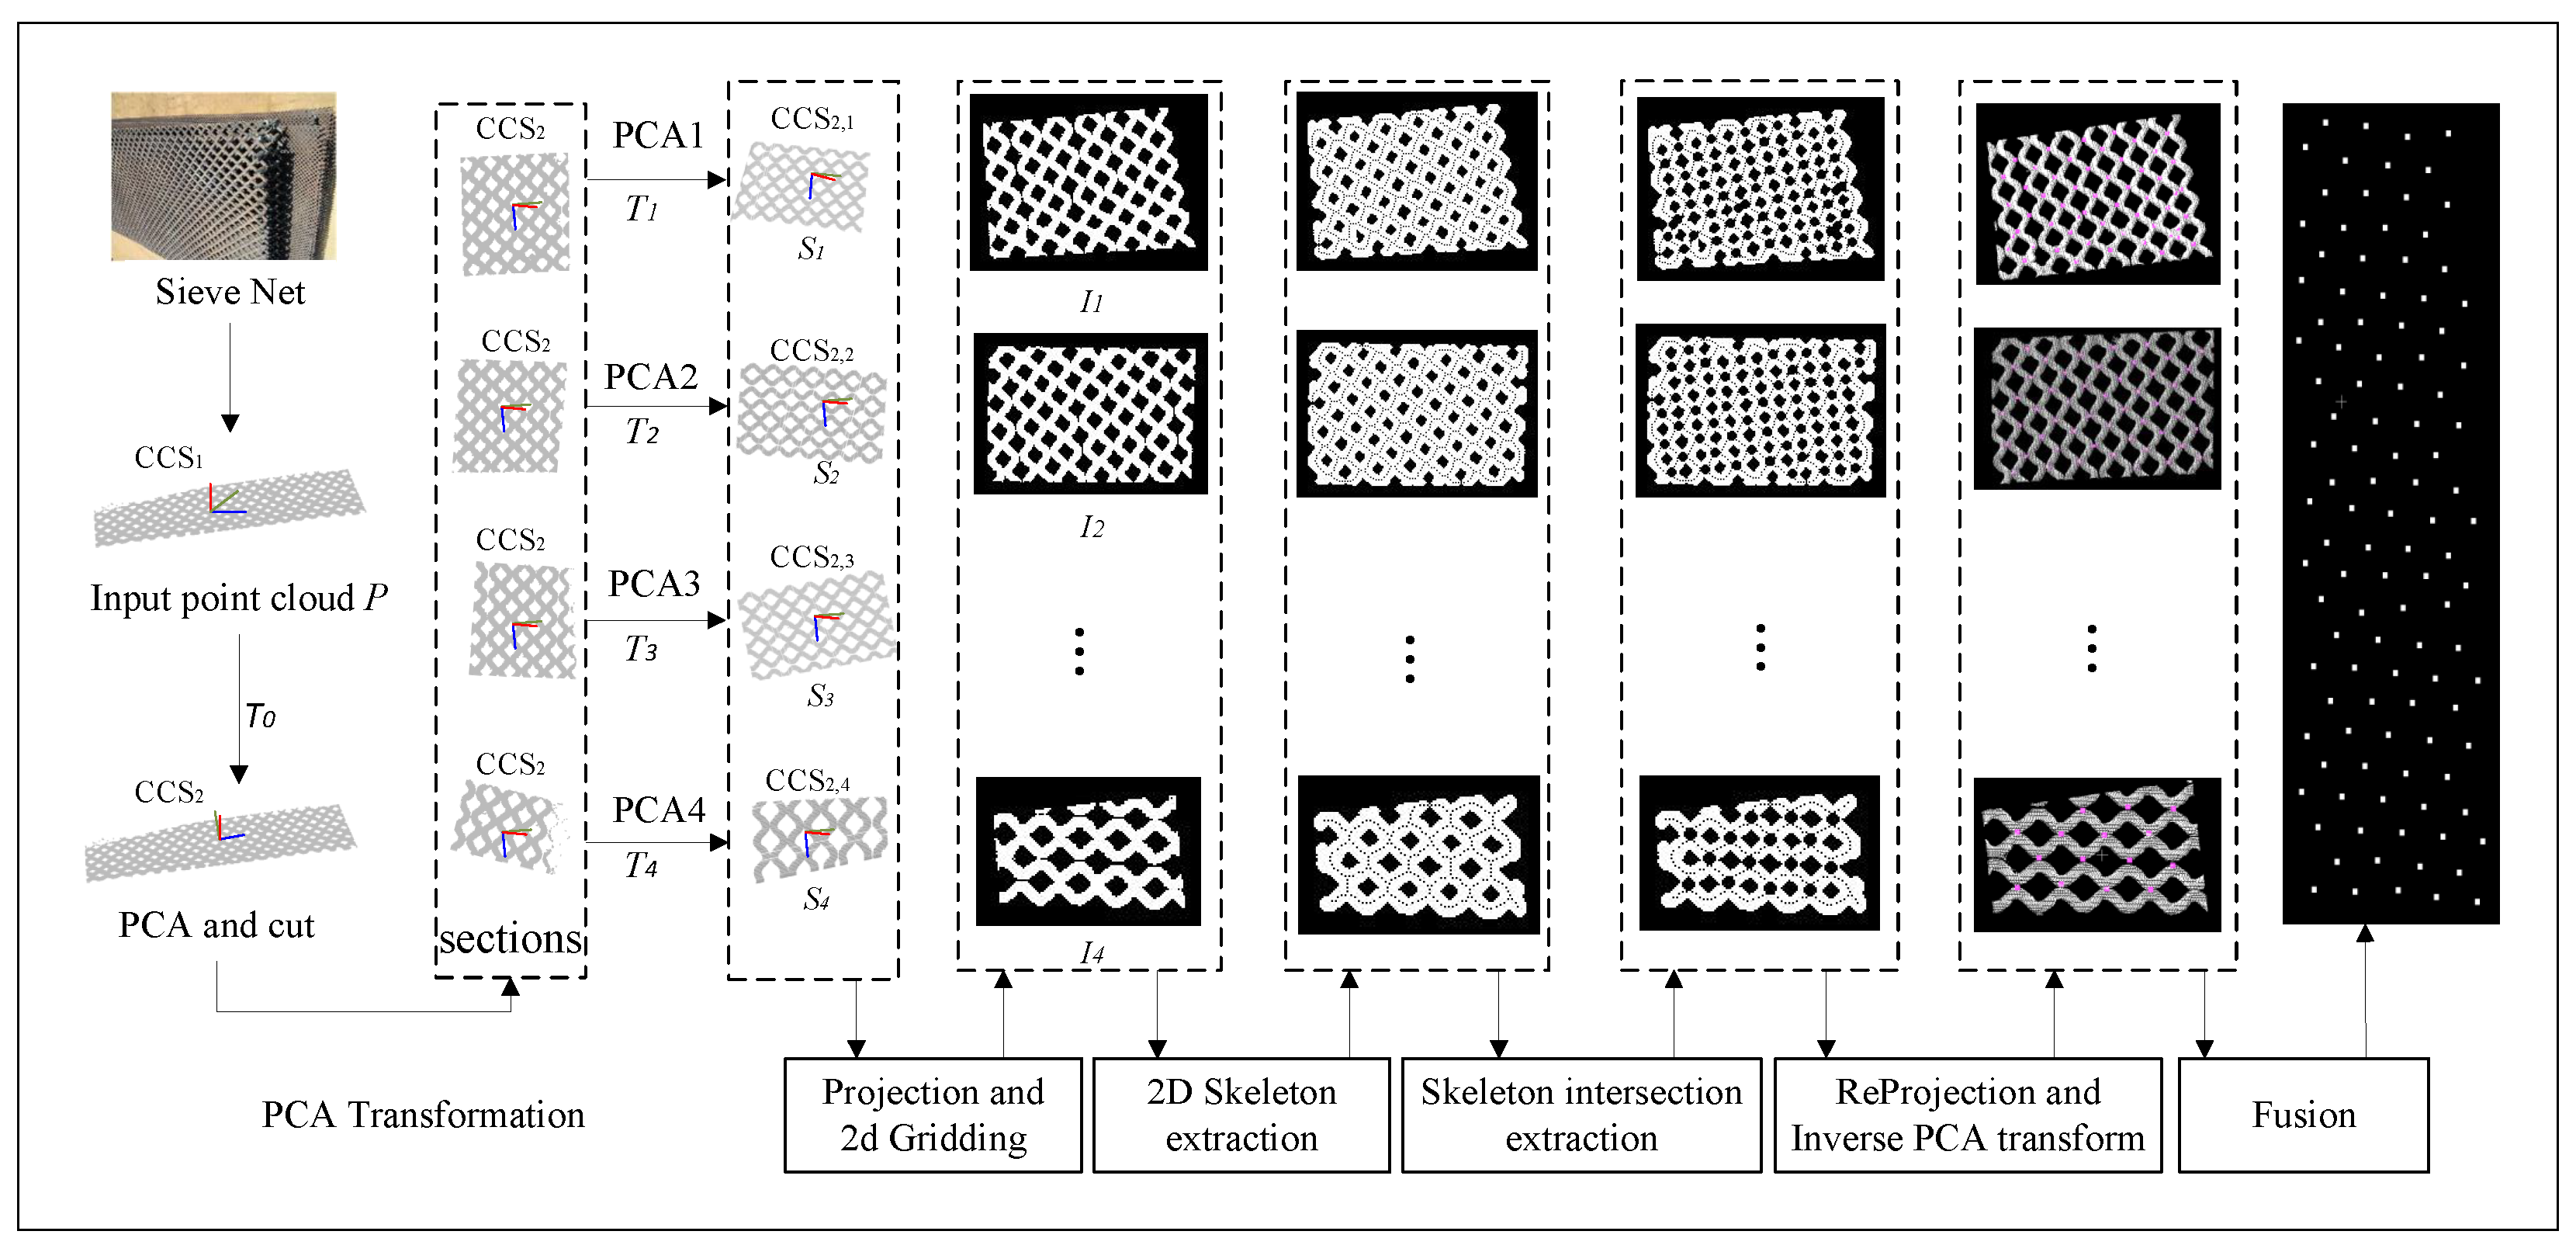
The automated inspection of welded joints is a key technology in the automation of sieve-net welding [17]. In order to realize the automatic detection of sieve-net fabric weld points, this paper proposes the automatic detection of weld joints regardless of sieve-net placement based on 2D skeleton intersection extraction. The framework of the algorithm is shown schematically in Figure 1. First, the point cloud data obtained by scanning the sieve net with a 3D laser scanner is subjected to principal component analysis (PCA), and a new coordinate system is created based on three principal components. Second, the sieve-net point cloud is segmented based on the transformed coordinate system and divided into multiple partitions, and PCA is performed again. Third, the projection is scaled and meshed and a binarized image is obtained. Fourth, image erosion and expansion creates the binarized image of a sieve that forms a connected skeletal region. Fifth, a 2D skeletal algorithm is constructed to capture the 2D skeleton of the sieve net. At the same time, the intersection set of the skeleton is treated as a set of 2D weld points and projected into the 3D space to capture the corresponding 3D weld points. Unlike conventional approaches that assume planar or fixed-position sieve nets, the dual-stage PCA transformation (global and partitioned) employed in this paper dynamically adapts to irregular surfaces, minimizing projection distortion caused by curvature or arbitrary placement. To address the issue of false positives arising from dense grids or noise, redundant skeleton intersections within a mesh-diameter neighborhood are fused, ensuring the precise localization of true weld joints. The main contributions of this work can be summarized as follows:
(1) We construct a projection meshing and reverse-projection method based on the PCA transform of the point cloud, which enables weld joint detection without sieve-net placement restrictions.
(2) We propose a skeleton intersection method for weld joint detection, which achieves fast and high-precision weld joint extraction.
(3) The proposed method achieves a detection rate of more than 95% and a test repeatability of less than 0.1 mm, which meets the requirements of industrial-grade applications.
Having established the industrial significance of automated weld detection and the limitations of existing methods, Section 2 will review related work in computer vision and welding automation, focusing on their applicability to sieve net inspection. 

2. Related Work

Since Marr’s groundbreaking work [18] on computer vision theory in 1977, visual sensing technology has evolved significantly, propelled by innovations in computer, optoelectronic, and image processing technologies. In recent years, researchers have increasingly focused on using computer vision and machine learning techniques to improve automation, efficiency, and quality control in the welding process. This section specifically discusses the application of computer vision to weld tracking.
Visual Weld Area Monitoring System: A visual weld area monitoring system uses enhanced object detection networks and image processing algorithms to precisely monitor weld holes with pre-existing gaps. This system is particularly suitable for thin-sheet tungsten inert gas welding processes and achieves high accuracy with fast predictions. In addition, machine learning techniques have been studied to identify molten metal during welding processes [19,20], which is crucial for improving manufacturing quality and automation in arc welding. Deep learning methods, with their deep structures and efficient learning capabilities, have higher accuracy and better generalization than traditional machine learning methods. However, these methods [21,22] are vulnerable to unpredictable interference and anomalies in the collected data, which can affect the training results of models and degrade the performance of detection algorithms [23].
Visual Welding Part Quality Control: Quality control is another important application area of computer vision in welding [24,25]. Previous research has proposed two visually based methods for the quality control of welded parts. One method uses improved segmentation techniques and adaptive GoogleNet models, while the other method combines GoogleNet convolutional neural networks with convolutional autoencoders. These methods were tested on over 105 images and achieved pixel-level prediction errors and high accuracy. However, the real-time performance of these methods [26,27] needs to be further improved, which limits their application in real scenarios to some extent.
Visual Weld Seam Inspection: In the field of welding, computer vision is also used to detect surface parameters of pressure vessel welds [28]. Visual perception techniques can be divided into passive viewing methods and active viewing methods. Passive vision methods [29] typically use natural light or arc light as the light source. Although they require a significant amount of information, they face significant challenges in subsequent image processing due to strong noise interference. Active vision methods use external auxiliary light sources to obtain feature information from welding areas. Laser structured light [30], which has directivity, monochromaticity, good coherence, and concentrated energy, is commonly used as an external auxiliary light source. Structured laser light projects specific structural patterns onto the welding surface [31], and the camera captures the information of the distorted patterns to perform welding inspection and parameter measurement. However, the 3D structured light method using near-infrared laser emitters [32] is costly and difficult to generalize.
Building on the reviewed challenges in real-time processing and adaptability, Section 3 introduces our 2D skeleton extraction framework, which integrates dual-stage PCA and dynamic parameter fusion to address these limitations.

3. Methods

3.1. Projection and 2D Gridding

To preserve structural details in 3D-to-2D projection by automatically aligning the sieve net to an optimal orientation, the point cloud acquired from arbitrarily angled scans is transformed into a fixed XYZ coordinate system via PCA transformation in the proposed method. The following is an analogical description of PCA transformation.
A piece of crumpled paper, when spread on a table, is automatically rotated by PCA so that its shadow covers the largest possible area, capturing most details.
The original point cloud is denoted as P = { p i } i = 1 n . The covariance matrix of data is computed by E = P P T and is decomposed by singular value decomposition (SVD).
U , S , V = S V D ( E ) ,
where U consists of three eigenvectors u 1 , u 2 , and u 3 arranged in the descending order with respect to their eigenvalues, representing the principal geometric directions of the point cloud. In the case where the sieve net can be approximated as a plane, u 1 and u 2 are dominant, corresponding to the in-plane extension directions, while u 3 is minor, corresponding to the plane’s normal direction. These eigenvectors are aligned with the three principal axes (x, y, and z) of the local coordinate system, thereby enabling dimensionality reduction and structural preservation during the two-dimensional projection process.
Thus, the point cloud of sieve net is decentered and rotationally transformed along the projection with minimal loss of information, and it is formulated as follows:
P = U T P C ,
where C is the center coordinate of sieve-net point cloud. The point cloud P is transformed into a new coordinate system and is denoted as P . In this paper, the new coordinate system has the same dimensions as the original one.
Real-world sieve nets are not ideally horizontal and may be uneven, the principal component projections selected in the PCA transformation is not sufficiently spread to support high-accuracy detection. Therefore, large deviations can occur when processed directly. The original point cloud can be segmented and divided into multiple partitions. A second PCA transformation can then be performed so that the subsequent identification of the solder joint can have greater accuracy. Partitioning the point cloud involves dividing the original point cloud into a plane parallel to the surfaces formed by the second and third principal components. Each partition should allow some degree of area overlap between them. This is to prevent the partition from causing the solder joints at the partition boundary to be severed, which can lead to incorrect detection in the subsequent solder joint identification. The principal component matrix is recorded for the subsequent conversion of the solder joint results into 3D space.
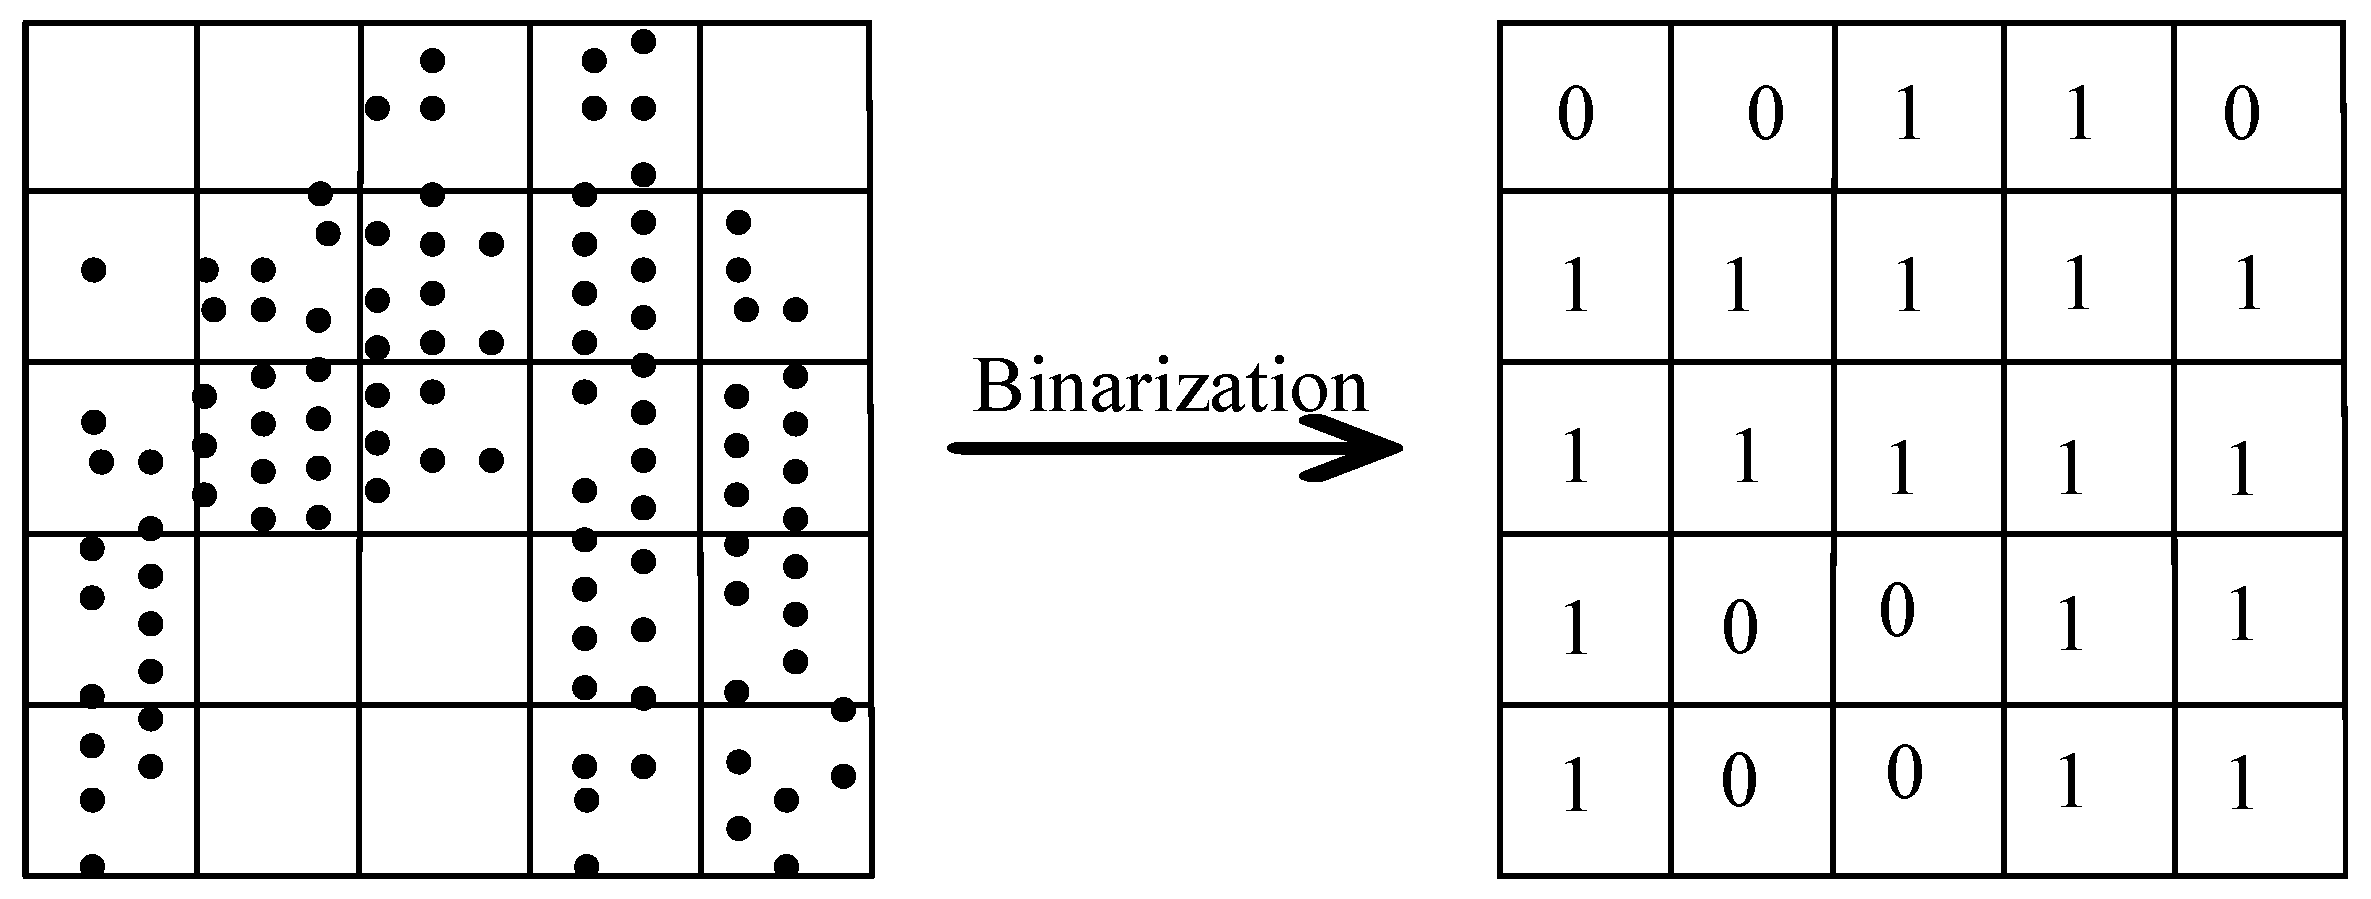
In order to stably extract the welded points of the sieve net, we consider extracting the weld trajectory points based on the characteristics of the 2D image of the sieve net. Firstly, the point cloud is projected to a 2D plane. Then, 2D gridding is achieved on the projected image to generate a 2D binarized image I. The 2D gridded processing is shown in Figure 2, the grid occupied by dots is marked as 1, which is the corresponding pixel value of the image; the others are marked as 0.

3.2. Two-Dimensional Skeleton and Intersection Extraction

After generating the 2D binarized image of sieve net, the weld points are generated by the intersection of skeletons. First of all, the 2D skeleton of sieve net needs to be extracted. In fact, the points where the sieve net needs to be welded are not connected, which means that the 2D image of the sieve net generated by the projection has some gaps. Therefore, in order to extract the welded points of the sieve net using the skeleton intersections, it is necessary to carry out swelling and corrosion operations on the sieve-net image. Thus, the gap can be connected in the skeleton intersections, which generates the coherent image I.
Inspired by the method of reference [33], we extract the 2D skeleton of sieve net. The key idea is that the deletion of pixels in the current iteration of the algorithm depends only on the result of the previous iteration. Each iteration marks the target pixels that meet the deletion conditions. After iterating through the whole image, all marked points are deleted until no pixel is marked in a given iteration. Then, the iteration is completed, and the image obtained after deleting the marked points is the refined skeleton image.
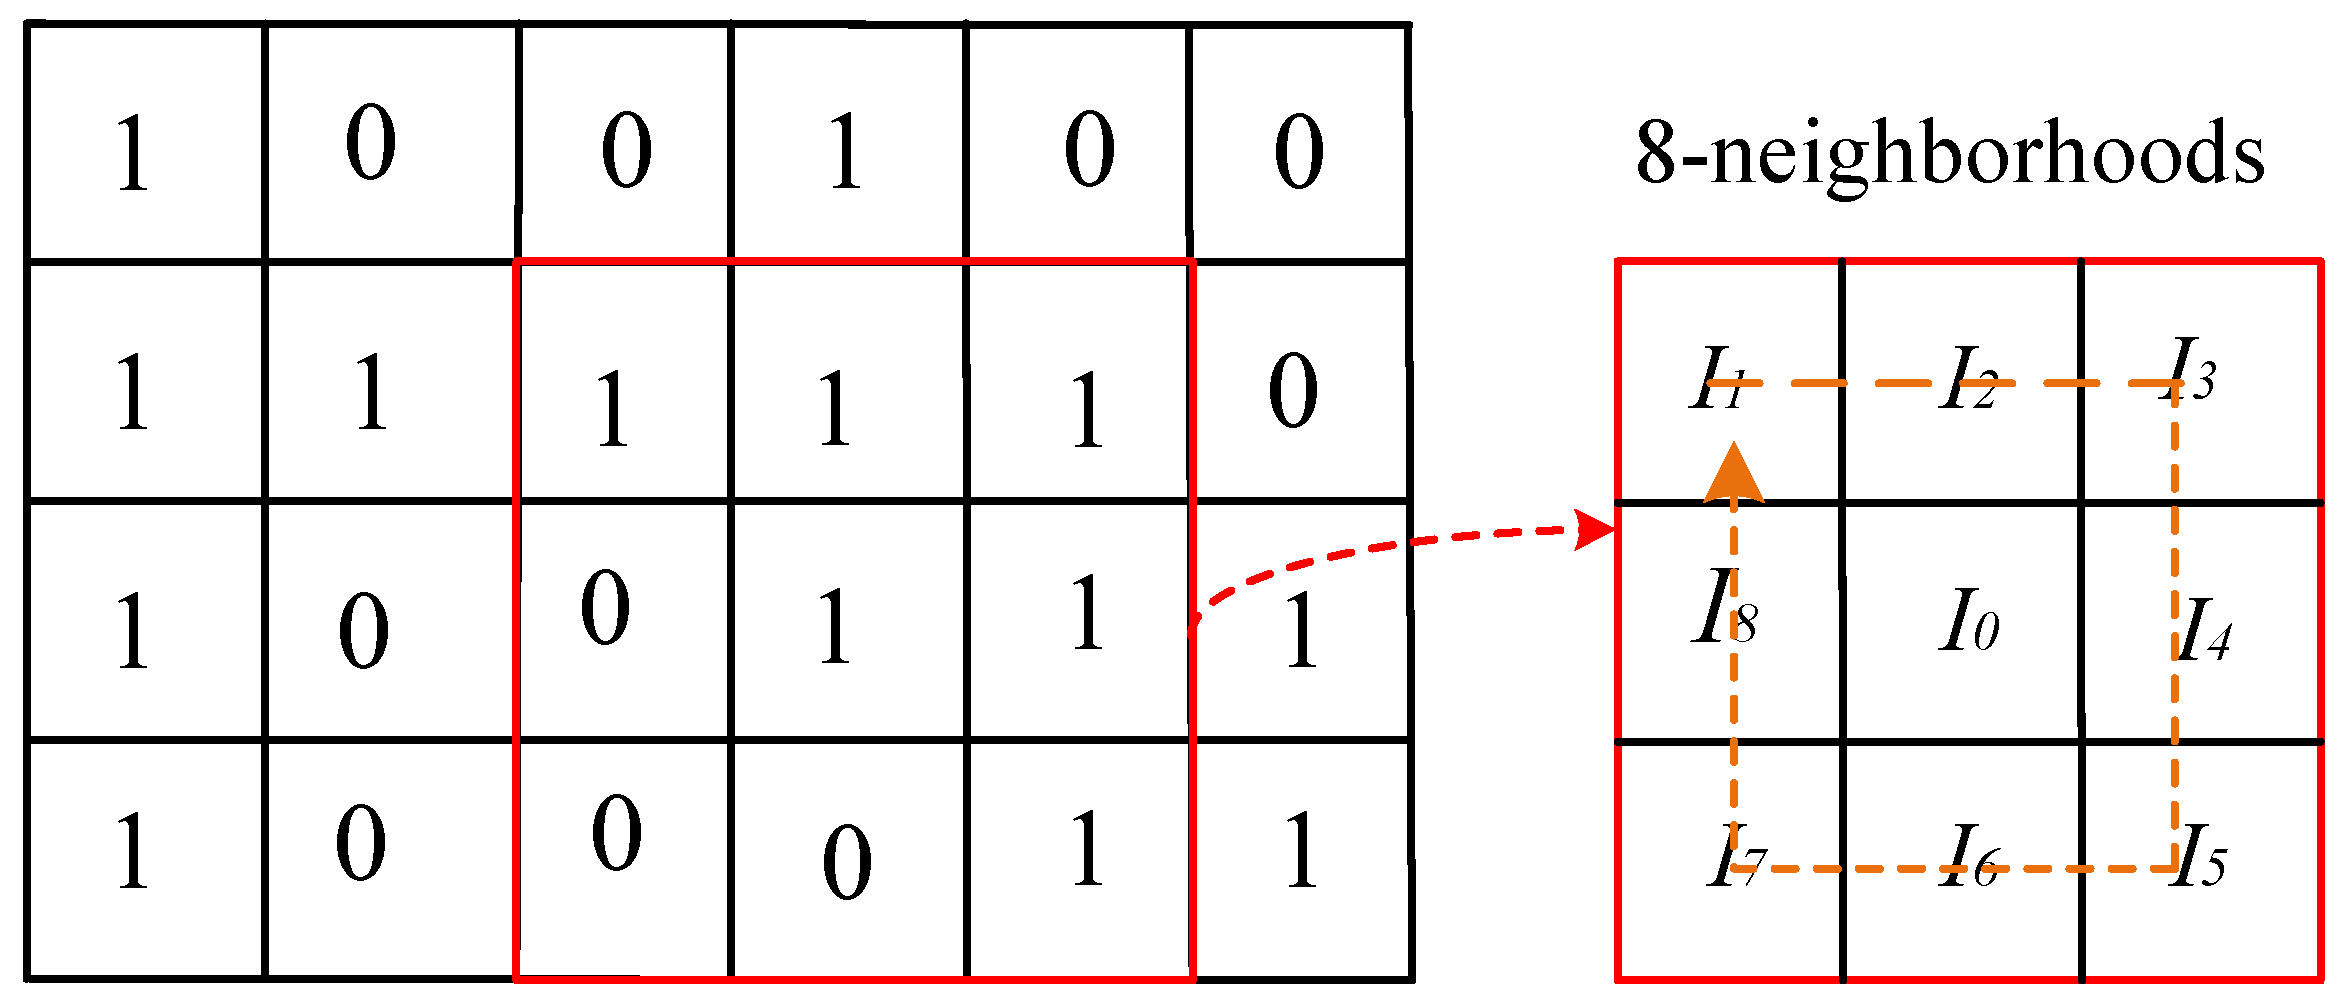
Here, the following basic concepts are first defined. As shown in Figure 3, given an image I 4 × 6 , each pixel I 0 with a value of 1 has 8 neighborhoods. Then, the pixels in the neighborhood are arranged clockwise around I 0 . The pixel points with value 1 in the binarized image correspond to target points, and pixel points with a pixel value of 0 correspond to background points.The target points in the 8 neighborhoods where at least one background point exists are treated as boundary points. The number of 1-to-0 conversions around the pixel I 0 in the image is denoted as f ( I 0 ) . The number of pixels with a value of 0 in the 8 neighborhoods of I 0 is denoted as g I 0 .
g ( I 0 ) = i = 1 8 I i ,
The refinement algorithm of the 2D skeleton is performed in two steps per iteration by continuously executing logical operations to remove non-skeleton points that meet the conditions. The two steps are described as follows.
In the first step, given a target point I 0 , when it is a boundary point, judge whether the point I 0 satisfies the following conditions in turn.
2 g ( I 0 ) 6 f ( I 0 ) = 1 I 1 + I 3 + I 5 1 I 3 + I 5 + I 7 1
In the first equation of Equation (4), when g( I 0 ) ≐ 0, there is no pixel equal to 1 around I 0 , and I 0 is an isolated point. When g( I 0 ) ≐ 1, there is one and only one pixel around I 0 equal to the gray value of 1, and I 0 is an endpoint. Neither isolated points nor endpoints can be deleted. g( I 0 )  2 can guarantee that it is neither an isolated point nor an endpoint, and g ( I 0 ) 6 guarantees that I 0 is a boundary point not an interior point. In the second equation of Equation (4), a connected graph is guaranteed after the current pixel is deleted. In the last two equations of Equation (4), ensure that I 1  ≐ 0 or I 7  ≐ 0 or both I 3 and I 5 are 0. That is, I 0 will be marked only if it is an east or south boundary point or a northwest corner point.
In the second step, similarly to the first two conditions of the first step, there are connected target points ensured in the 8 neighborhoods of the target point I 0 . And it is also ensured that the basis for skeletal formation still exists even after the target point I 0 is deleted. The last two equations of Equation (5) are the same as Equation (4), but a little difference exists in that I 0 is only marked if it is a western or northern boundary point or a southeast corner point.
2 g ( I 0 ) 6 f ( I 0 ) = 1 I 1 + I 5 + I 7 1 I 1 + I 3 + I 7 1
The refinement algorithm of the 2D skeleton undergoes the aforementioned two steps to continuously mark pixels that meet the specified conditions. Iteration ceases when no further pixels are marked within a given iteration. Subsequently, all marked pixels are deleted, leaving the remaining pixels to form the refined skeleton image.
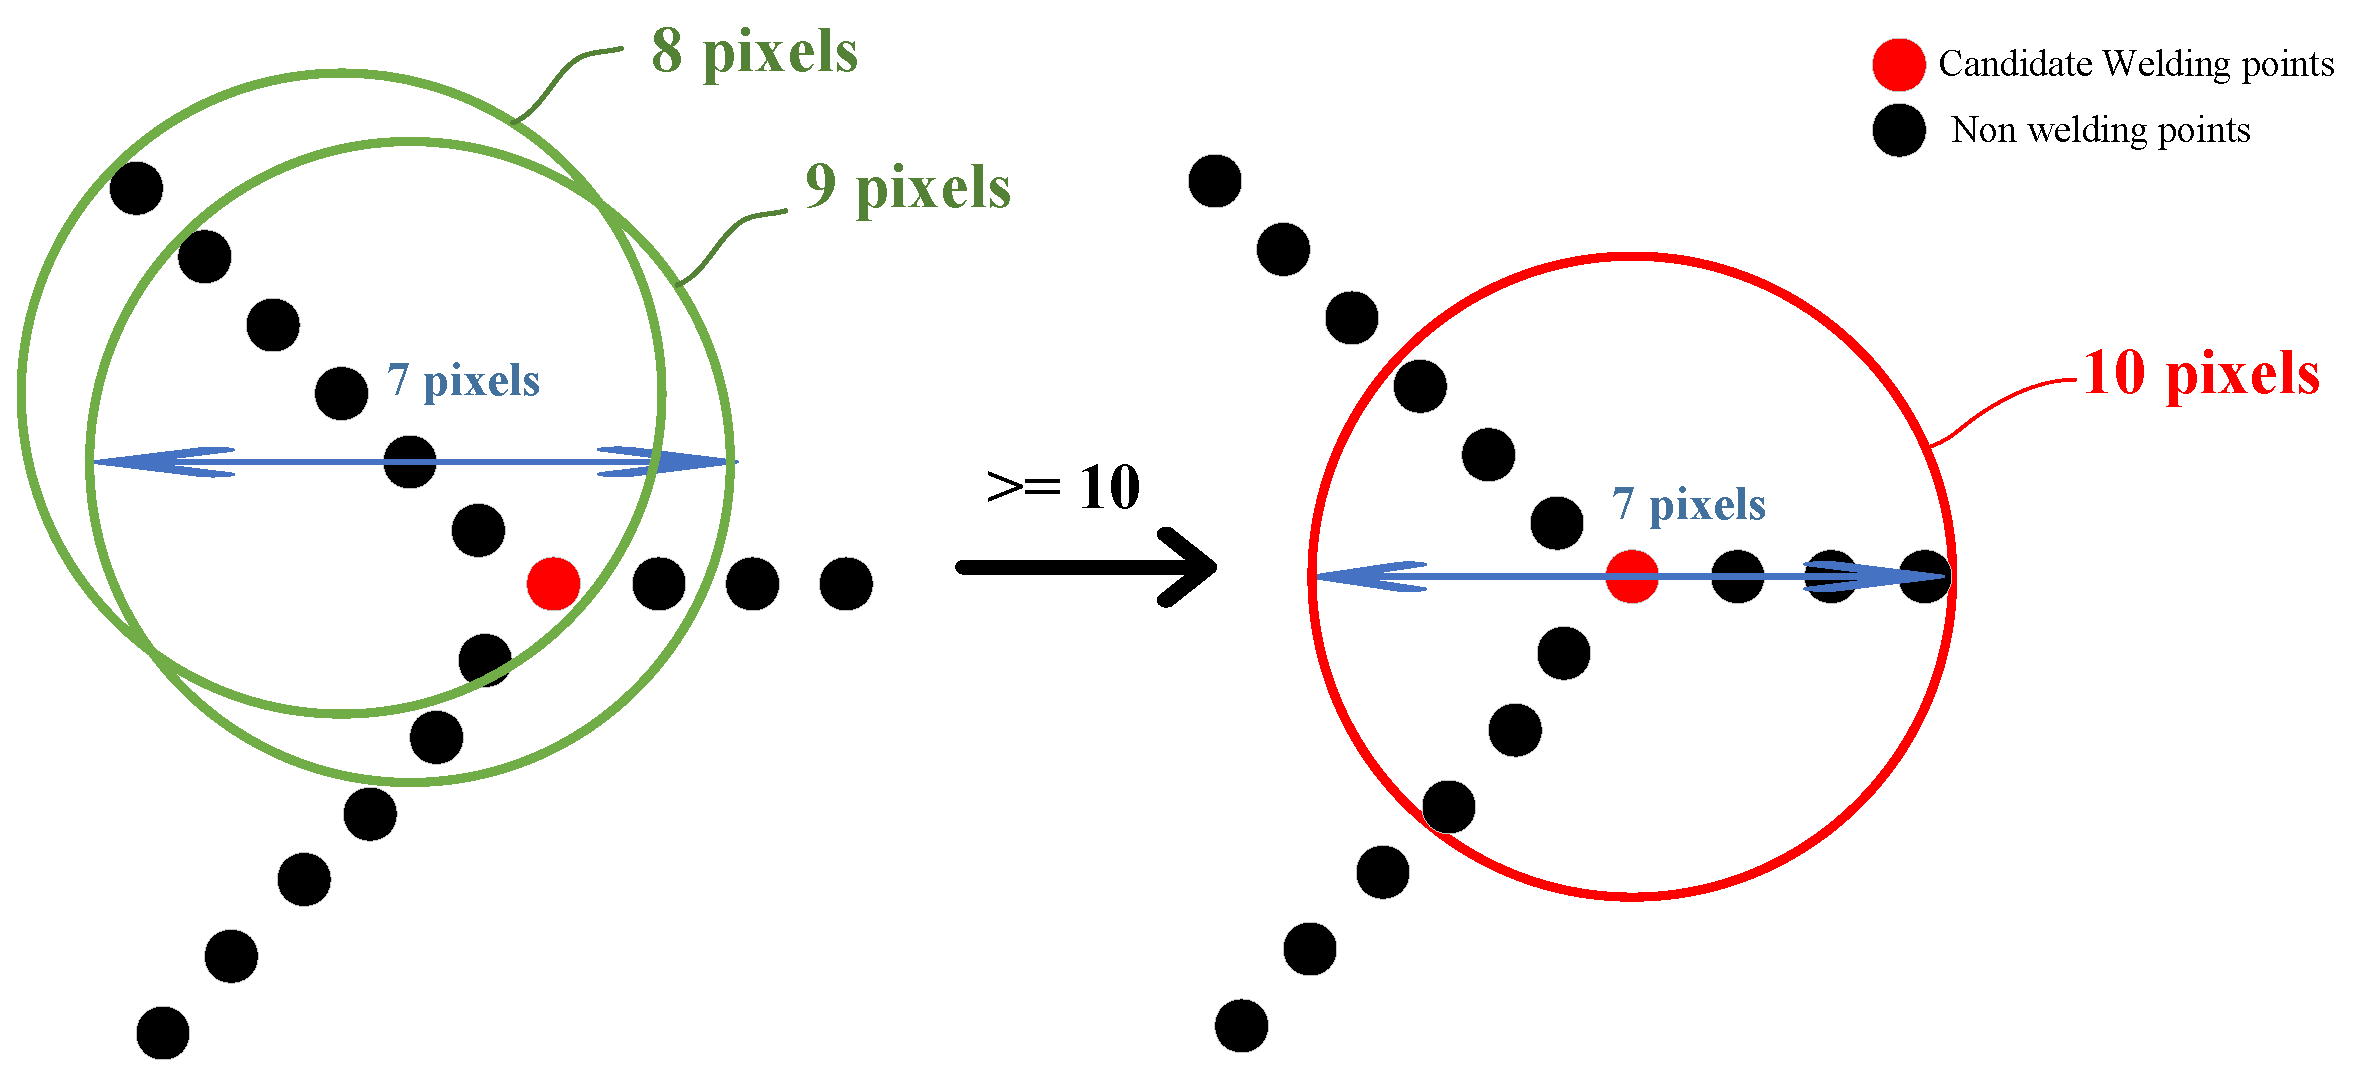
To pinpoint the exact positions of welded joints, skeleton intersections within the image must be extracted subsequent to the skeleton extraction. As illustrated in Figure 4, a circular neighborhood with a diameter of 7 pixels is employed, with the origin of this neighborhood traversing each pixel point sequentially. When the origin of the neighborhood coincides with a skeleton intersection, the neighborhood encompasses at least 10 pixel points. Conversely, if it does not align with a skeleton intersection, the number of pixel points within the neighborhood falls below 10. The neighborhood pixel count, denoted as N(I0), is calculated using brute force methods. Between two reinforcement columns, multiple skeleton intersections may be extracted along the edges. Ideally, the welding point should be centered within the gaps between reinforcements, necessitating the merging of skeleton intersections.
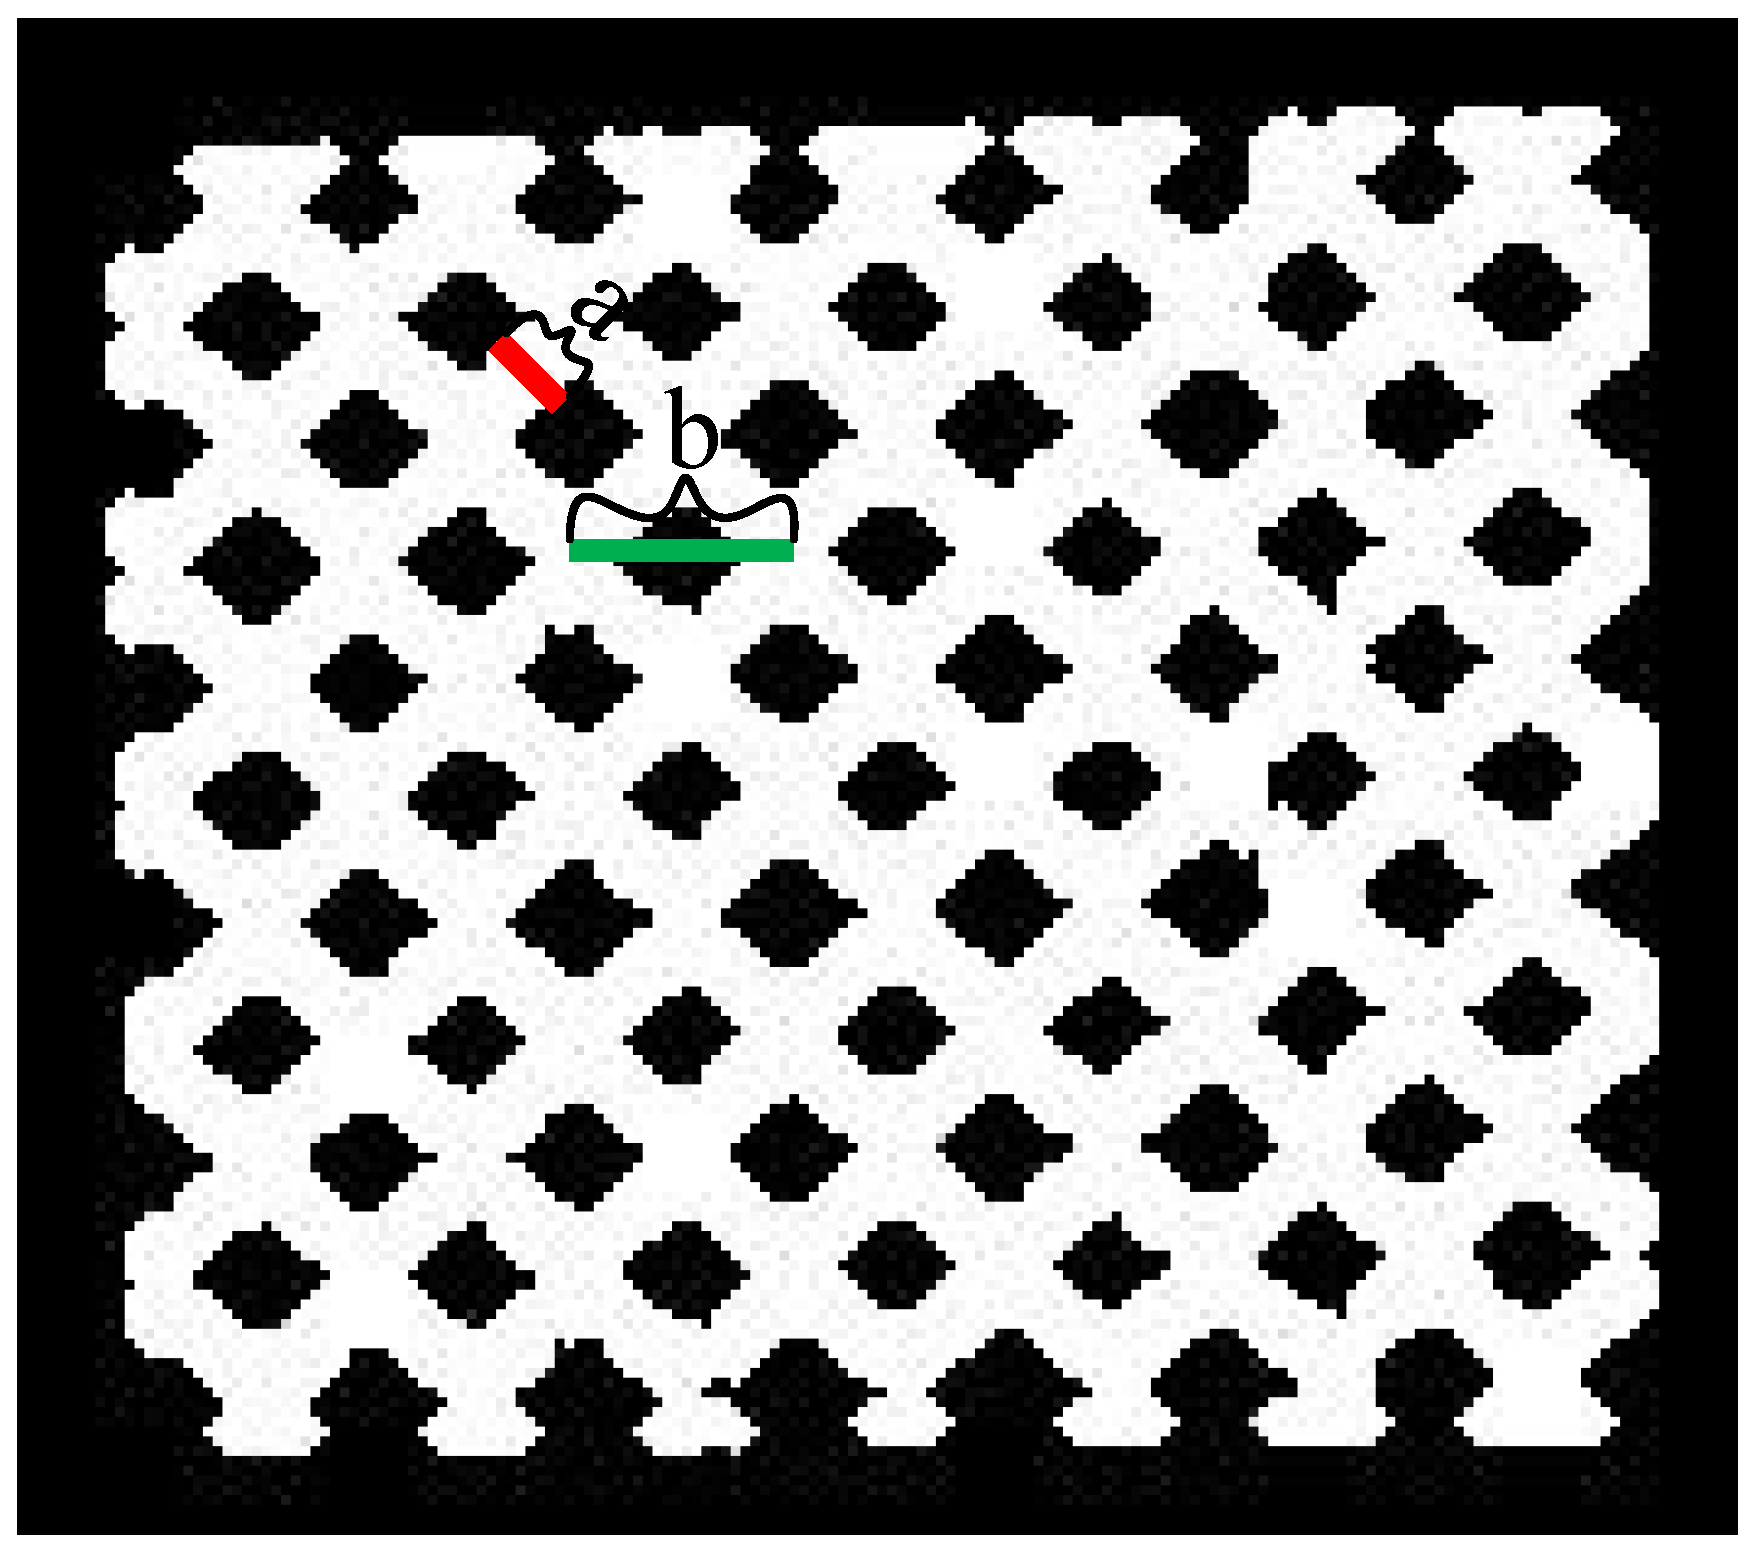
At the gap between every two bars, a circular neighborhood is selected based on the location of the extracted skeleton intersections, ensuring that it encompasses all intersections. The center of this circle is then designated as the final welding point, as depicted in Figure 5, which illustrates the diameters of the reinforcing steel and mesh.
The time complexity of Algorithm 1 is established as O ( n ) , where n denotes the total number of pixels in the input image. This linear complexity indicates that the algorithm’s performance is linearly proportional to the image size, thereby ensuring its efficiency and feasibility in processing large-scale datasets.
Algorithm 1 Two-dimensional skeleton intersection extraction
Require: Given a coherent image I , maximum number of iteration rounds m a x I t , sieve net diameter b.
Ensure: 2D skeleton intersection set W.
 //2D skeleton extraction.
while iteration rounds m a x I t  do
  for each pixel I i ∈ image I  do
   if  I i satisfies Equation (4) or Equation (5) then //[Extract a 2D skeleton point set of the mesh]
    mark I i .
   end if
  end for
  Delete all marked pixels.
end while
 //Weld joint extraction based on skeleton intersection method.
while any pixel I i in image I  do
  if  N ( I i ) 10  then
    W = W I i . //[Extract the intersection points of the skeleton]
  end if
end while
 return the set W.

3.3. Reprojection and Inverse PCA Transform

After the 2D skeleton intersection is merged, the 2D welded joints are obtained in a binarized image. Subsequently, inverse PCA transformation is applied to transform these 2D welded joints back into the original 3D point cloud data. Since the PCA transformation was initially performed in two stages, the inverse transformation process must also be executed in two corresponding stages: once for the inverse transformation of each partitioned chunk and once for the final inverse transformation of the entire assembled point cloud. This ensures that the welded joints, initially identified in 2D, are accurately mapped back to their respective 3D coordinates.
Because the sieve net is an irregular surface, it is not possible to determine the 3D coordinates of the weld joints. To further extract the weld points accurately, we will merge and fuse the skeleton intersections. Specifically, a skeleton intersection w i is selected and used as the center point to search the set of skeleton intersections N R ( w i ) in the field with the diameter of the screen mesh 2 R . Then, the center c i of N R ( w i ) is calculated and treated as the point for welding. Finally, proceeding similarly in sequence, traversing and merging are carried out on all sets of skeleton intersections to obtain a set of welded points with respect to the sieve net. Although the coordinates of the weld joints in the binarized image were recognized and the inverse PCA transformation of the sieve-net coordinates was implemented, the coordinates at this time are p i 2 D = ( x i , y i ) , i = 1 , 2 , 3 , , m , where m is the number of weld points in the binarized image. The welds at the original sieve-net coordinates are p k = ( x k , y k , z k ) , k = 1 , 2 , 3 , , n , where n is the number of sieve-net points. The corresponding welding point p i 3 D with the smallest value of Equation (6) is found, which is the 3D coordinate of the weld point.
p i 3 D = a r g m i n p k P ( x i x k ) 2 + ( y i y k ) 2
The extracted steps of 3D weld points are described in Algorithm 2, which provides a description of the 3D weld point extraction method.
Algorithm 2 Three-dimensional weld point extraction
  • Require: PCA-processed 3D pixels set P, 2D skeleton intersection set W, sieve-net diameter b, PCA-transformation matrices U and U .
  • Ensure: 3D welding point D .
  1:
//Merge and extract intersections.
  2:
Given two pixels sets C and V.
  3:
for each w i W do
  4:
     V = w i
  5:
    for each w j N R ( w i ) , i < j  do
  6:
         V = w j V
  7:
    end for
  8:
     c i = 1 / n i { v i } i = 1 n i , and c i C
  9:
end for
10:
//Converting 2D pixels to 3D.
11:
Extract 3D welding point D by the Equation (6).
12:
D k = U k 1 D k , U k U , and D = k = 1 K D k .
13:
D = U 1 D .
14:
return D .
The time complexity of Algorithm 2 is determined to be O ( W · P ) , where W denotes the size of the 2D skeleton intersection set, and P represents the size of the PCA-processed 3D pixel set. Although the intersection’s merging step may theoretically exhibit the worst-case complexity of O ( W 2 ) , practical efficiency is significantly improved due to the sparse distribution of intersections and the limited search radius.
With the algorithmic framework defined, Section 4 will validate its performance through experiments on seven datasets, emphasizing accuracy, robustness, and computational efficiency.
4. Experimental Results and Analysis

4.1. Datasets

As a fact, as shown in Figure 1, the screen mesh is composed of multiple S-shaped steel bars, resulting in mesh openings with similar shapes and sizes. To more stably extract the welding points of this type of screen mesh, this paper focuses on the research of methods for extracting the welding points of such screen meshes. The datasets used in this experiment were obtained by scanning fixed sieve nets. All data was pre-processed and aligned to a 2.0 mm pulp resolution, and the comparison data was manually selected from sample1. In this paper, seven different sets of sieve data with different numbers of points, dimensions, rebar diameters, and mesh diameters will be used. The dimension refers to the length of the smallest rectangle in the X, Y, and Z directions that can frame all points of the sieve net. The information about each data group is displayed in Table 1.
The datasets used in this experiment were obtained by scanning solid sieve nets. All data were pre-processed and aligned to a cloth resolution of 2.0 mm, and the comparison data were manually selected by hand based on the sample1.

4.2. Performance Testing of Neighborhood Diameter Variation

The diameter of the detection domain is quantified for all data in Section 4.1 to explore whether there exists a neighborhood diameter that fits each dataset. For accurate statistical results, the following three concepts are defined:
False positive rate: The ratio of the number of detected coordinates that are not correct to the number of detected coordinates.
Recall rate: The ratio of the number of correct solder joint coordinates detected to the number of total solder joints.
Accuracy: The ratio of the number of correct solder joints detected to the number of coordinates detected.
As shown in Table 2, for the seven different datasets, the accuracy and recall of the results are 100%, and the false detection rate is 0% when the diameter of the neighborhood is taken as seven pixels. Since the number of pixels in the neighborhood must be greater than 10 to be identified as a weld point, when the neighborhood diameter decreases, the number of eligible point clouds decreases rapidly, resulting in a decrease in the number of detected weld points. The number of detected weld points is about 30% of the real weld points. Conversely, when the neighborhood diameter increases, some of the points near the weld points also meet the determination conditions, resulting in more points being detected than the real weld points. About 15% of the detected points are not the correct weld points.

4.3. Performance Testing of the Effect of Connected Processing

After the projection and binarization of the point cloud data, the images are not completely connected, and there are gaps between the rebar of some sieve nets. To carry out the later skeleton extraction-based sieve-net weld detection, the images need to be processed in some way. Firstly, the expansion process is carried out to increase the diameter of the rebar to achieve the connectivity process, and then, the image is corroded to ensure that the diameter of the rebar remains the same before and after the process. The percentage of connected bars in the images before and after the connected processing is then counted, as shown in Table 3. Figure 6 shows the changes in the images before and after the connectivity treatment for sample1.
As shown in Table 3, image connectivity reached 100% after successive expansion and corrosion treatments. As seen in Figure 6, the diameter of the rebar after the treatment has changed less compared to the diameter of the rebar before the treatment. The target effect of the treatment was achieved.

4.4. Quantitative Analysis of Parameters

The most important parameters used in the algorithm described in this paper are the diameter of the reinforcement and the diameter of the mesh. The parameters of sample1 and sample2 are different, so these two sets of data were chosen for this experiment to study the effect of parameter changes on the detection results. By continuously adding or subtracting fixed values from the correct parameters and then observing whether the position and number of welded joints obtained were correct, the experiment was stopped when the test results showed obvious errors. This was carried out to determine the effect of parameter changes on the test results of welded joints.
Table 4 shows the statistics of time, false detection rate, recall, and detection accuracy with respect to the variation in parameters in the first dataset. From the test results of sample1, it can be seen that the algorithm is more sensitive to changes in the diameter of the reinforcement. Parameter changes within plus or minus 0.5 will not have a significant impact on the test results. However, as the parameter changes more and more, the test results will show more missed welds and the inaccurate coordinates of welds. The algorithm is relatively insensitive to changes in the diameter of the mesh, which can be changed in a wide range. When the parameter is changed within plus or minus 10, there is no leakage or inaccuracy. Instead, there is a situation where multiple coordinates are detected at a single welded joint location. As the parameters change more and more, the detection results also show a phenomenon of missed detection, while the number of detected weld coordinates at a weld position increases. When the parameters are increased or decreased by 20, multiple weld coordinates are detected at almost every weld position, and the number of detected results reaches three times the number of correct weld joints. At the same time, it can be observed that the size of the parameters directly affects the running time of the algorithm. The larger the parameters, the longer the time required. The runtime is more sensitive to changes in the diameter of the reinforcement, where a 0.5 reduction in the diameter of the reinforcement results in an average time reduction of 20,000 ms. A reduction of 10 in the diameter of the mesh, on the other hand, results in an average time reduction of only 4000 ms.
As shown in Table 5, it can also be seen that the detection accuracy and time are more sensitive to changes in the diameter of the reinforcement, and the change law is the same as that observed in sample1. It can be seen that for data with different parameters, the variation in the diameter of the reinforcement between plus or minus 0.5 and the variation in the diameter of the mesh between plus or minus 10 do not have a significant effect on the test results. Figure 7 and Figure 8 show the detection of solder joints when the parameters of sample1 and sample2 are varied, respectively.

4.5. Accuracy Analysis

To verify that the algorithm described in this paper has high accuracy on different datasets, the third to seventh different samples were selected for this experiment, and their weld coordinates were detected using the algorithm described in this paper. The running time, false detection rate, recall rate, and detection accuracy (defined in Section 4.2) were counted for each set of data. As seen in Section 4.2, small changes in the parameters do not affect the detection results, so the parameters used in this experiment were obtained by rounding the parameters of the data itself.
As shown in Table 6, the data generation time is about 2 min. When the parameters are suitable, the false detection rate and detection accuracy of different datasets are 0% and 100%, respectively. Although the recall rate of some datasets does not reach 100%, the detected solder joints are all correct, and the undetected joints are located at the boundary. Since there are overlapping parts between each chunk, the solder joints on the boundary are not detected, but the impact of this on the whole detection process is not significant. The recall rate of all five groups of detection results is above 97%. This shows that the algorithm can be applied to most of the sieve-net data with high accuracy and high time efficiency. Figure 9 shows the detection results of the five datasets.

4.6. Importance of PCA Algorithm

The two principal component analyses (PCAs) play a crucial role in this experiment. Due to the PCA transformation, the solder joint detection algorithm described in this paper is robust to the orientation of the dataset. Changing the orientation of the dataset does not affect the solder joint detection results, and the correct coordinates of the solder joint can still be obtained. Therefore, this experiment uses CloudCompare to rotate sample1 five times at different angles, saves the rotated point cloud data and the rotation angle, and then uses the algorithm described in this paper to detect the five rotated point clouds in turn. The running time, false detection rate, recall rate, and detection accuracy of the algorithm are calculated.
The diameter of the reinforcement and the mesh diameter are 5.5 mm and 23 mm, respectively, and the definition of each index is the same as in Section 4.2.
As shown in Table 7, the first row of data is the original dataset, which is used as a control. The false detection rate, recall rate, and detection accuracy remain unchanged after rotating the dataset five times, and the algorithm’s running time only fluctuates within a small range. This shows that the algorithm is robust to the rotation of the point cloud data.
To further investigate the role of PCA in this algorithm, the PCA part of the algorithm was annotated. The algorithm was used to examine the original data of sample1; the result of the partitioning of the data by the algorithm was only one partition, and no solder joint could be detected. The reason for this is that the projection is carried out without the PCA transformation, and the folded area after the projection is small. Thus, there is only one partition, and the solder joints cannot be detected because the data are projected together.
From the above experimental results, it can be seen that the two PCA transformations are indispensable in this algorithm, which is a key step in the process of solder joint detection and improves the robustness of the algorithm. The position of the solder joint can be correctly detected even after the point cloud data is accidentally rotated.

4.7. Comparison Between Detection Results and Manually Selected Optimal Results

To verify the accuracy of the solder joint detection algorithm described in this paper, sample1 was selected, and its solder joint coordinates were detected using the algorithm described in this paper to form the experimental data. The experimental data were compared with the reference data in the same coordinate system, and then, the accuracy of the algorithm was quantitatively analyzed. The maximum and minimum errors (absolute value of the solder joint detection algorithm minus the reference data), the root mean square error (RMSE), and the proportion of RMSE in each value range to the total number of solder joints were calculated for both methods. The statistical results are shown in Table 8 and Table 9.
The RMSE from the midpoint to the edge of this group of sieve-net reinforcements is about 4.41 mm. As shown in Table 8, the maximum error between the algorithm’s detection results and the reference data on each axis is less than 2.8 mm. The maximum RMSE of the experimental data and the reference data is less than 4 mm. It can be seen from Table 9 that more than half of the RMSE values are less than 2 mm, 98.5% of the RMSE values are less than 3.5 mm, and only a small portion of the data have RMSE values greater than 3.5 mm. Therefore, the detection accuracy of this algorithm meets the needs of industrial applications.
As shown in Table 10, superior detection accuracy is achieved through manual weld inspection at the cost of significantly increased processing time. The proposed automated method is demonstrated to maintain satisfactory detection performance while substantially improving computational efficiency. Specifically, the processing time is reduced from 294 s to 66 s, representing a 77.6% improvement in throughput, with the detection accuracy being maintained at 92.8% when evaluated on the sample1 dataset featuring 3.5 mm diameter reinforcement bars. The marginal reduction in accuracy is considered acceptable given the dramatic enhancement in processing speed, particularly for industrial applications where rapid inspection is prioritized.

4.8. Discussion

The experimental results demonstrate that the proposed method achieves a detection accuracy of 95% with sub-millimeter repeatability, which is validated on seven diverse sieve-net datasets. The robustness of weld joint localization is confirmed under varying sieve-net orientations, where the dual-stage PCA alignment is shown to eliminate manual pre-processing requirements. However, several limitations are identified that warrant further investigation. The method exhibits reduced performance when processing sieve nets with significant geometric deformations, particularly those demonstrating pronounced curvature. Additionally, the current implementation requires prior knowledge of sieve-net parameters, such as wire diameter and mesh spacing, limiting its adaptability to unknown specimens. Furthermore, the method’s robustness against high-intensity noise has not been systematically evaluated, which may impact reliability in industrial environments with significant sensor interference or material imperfections. Future enhancements should focus on developing adaptive parameter estimation algorithms, incorporating curvature compensation mechanisms, and validating performance under controlled noise conditions to improve generalizability. These refinements would strengthen the method’s suitability for broader industrial applications while maintaining its demonstrated advantages in precision and efficiency.

5. Conclusions

In this paper, we propose a novel welded joint extraction algorithm for the sieve net, based on 2D skeleton extraction. Its effectiveness is validated through multi-level experiments. The experimental results show that the proposed algorithm achieves fast and high-precision weld joint extraction, which meets the requirements of industrial-grade applications. Specifically, the proposed algorithm has a certain degree of fault tolerance for input sieve-net parameters, such as the diameter of the screen mesh. In addition, the proposed algorithm enables the automatic detection of welded joints on sieve nets without initialized positional constraints.
Impact on Future Research: The algorithm proposed in this study, which achieves high detection accuracy and efficiency, paves the way for further advancements in automated welding inspection. Future research is expected to be inspired by the integration of machine learning techniques with computer vision for enhanced robustness and adaptability to various welding conditions. Additionally, as the method utilized in this paper is solely applicable to the detection of weld joints in the sieve nets of fixed specifications, employing adaptive methods for the detection of weld joints in the sieve nets of non-fixed specifications represents a promising research direction.
Industry Practices: The implementation of the proposed algorithm is anticipated to significantly improve the efficiency and safety of sieve-net welding processes. By enabling the automatic detection of welded joints without positional constraints, the algorithm can streamline production lines and reduce labor costs. Moreover, its high detection accuracy ensures the quality of welding, thereby contributing to the reliability and durability of sieve-net products across various industries. Manufacturers are encouraged to adopt such advanced techniques to stay competitive in an evolving market.
In summary, the research presented in this paper not only advances the state of the art in automated welding inspection but also holds promise for widespread industrial application, ultimately driving innovation and progress in the field.

Author Contributions

Conceptualization, W.J. and W.L.; Methodology, W.L.; Software, W.L. and L.Z.; Writing—original draft, H.Z., W.J. and Y.Y.; Writing—review and editing, H.Z., W.J. and Y.Y.; Funding acquisition, H.Z. All authors have read and agreed to the published version of the manuscript.

Funding

Hai-ping Zhong’s work was supported by Jiangxi Provincial Department of Education Science and Technology Research Project under grant number GJJ213110, Wei-gang Jian’s work was supported by Yuzhang Normal University of Science and Technology Research Project under grant number YZYB-24-19, Wei Li’s work was supported by the National Natural Science Foundation of China under Grant number 62361041 and the Natural Science Foundation of Jiangxi Province under Grant number 20242BAB25053.

Data Availability Statement

Data are contained within the article.

Conflicts of Interest

The authors declare no conflicts of interest.

References

  1. Wu, W. Production and Development of Stainless Steel Microwires and Sieves. Steel Wire Prod. 2001, 27, 17–19. (In Chinese) [Google Scholar]
  2. Guo, X.; Lin, F. Advantages of Using Argon Arc Welding to Weld Stainless Steel Slot Sieve Plates. Shaanxi Mach. 2003, 55–56. (In Chinese) [Google Scholar]
  3. Wang, Y.; Li, F. Production Process of Stainless Steel Screen Printing Plate. J. Yunnan Norm. Univ. Natural Sci. Ed. 1992, 12, 101–103. (In Chinese) [Google Scholar]
  4. Yan, Z.; Fei, Z. Application of new automatic welding equipment and welding technology in the future construction machinery field. IOP Conf. Ser. Mater. Sci. Eng. 2019, 637, 012011. [Google Scholar] [CrossRef]
  5. Sun, J.; Cao, G.; Huang, S.; Chen, K.; Yang, J. Welding Seam Detection and Feature Point Extraction for Robotic Arc Welding Using Laser-Vision. In Proceedings of the 2016 13th International Conference on Ubiquitous Robots and Ambient Intelligence (URAI), Xi’an, China, 19–22 August 2016; pp. 281–284. [Google Scholar]
  6. Chen, Y. Environmental regulation, local labor market, and skill heterogeneity. Reg. Sci. Urban Econ. 2023, 101, 103898. [Google Scholar] [CrossRef]
  7. Villan, A.; Acevedo, R.; Alvarez, E.; Lopez, A.; Garcia, D.; Fernandez, R.; Meana, M.; Sanchez, J. Low-Cost System for Weld Tracking Based on Artificial Vision. IEEE Trans. Ind. Appl. 2011, 47, 1159–1167. [Google Scholar] [CrossRef]
  8. Li, Y.; Xu, D.; Li, T.; Wang, L.; Tan, M. A laser structured light-based vision sensor for weld seam tracking. J. Sens. Technol. 2005. (In Chinese) [Google Scholar]
  9. Zheng, J.; Pan, J. Real-time weld seam tracking technology based on particle filtering for structured light. J. Shanghai Jiaotong Univ. 2008. (In Chinese) [Google Scholar]
  10. Wu, P. Research on Weld Seam Localization Algorithm in 3D Laser-Guided Robotic Welding. Master’s Thesis, Southeast University, Nanjing, China, 2019. (In Chinese). [Google Scholar]
  11. Liu, J.; Jiao, T.; Li, S.; Wu, Z.; Chen, Y.F. Automatic seam detection of welding robots using deep learning. Autom. Constr. 2022, 143, 104582. [Google Scholar] [CrossRef]
  12. Walther, D.; Schmidt, L.; Schricker, K.; Junger, C.; Bergmann, J.P.; Notni, G.; Mäder, P. Automatic detection and prediction of discontinuities in laser beam butt welding utilizing deep learning. J. Adv. Join. Processes 2022, 6, 100119. [Google Scholar] [CrossRef]
  13. Chen, S.; Yang, D.; Liu, J.; Tian, Q.; Zhou, F. Automatic weld type classification, tacked spot recognition and weld ROI determination for robotic welding based on modified YOLOv5. Robot. Comput. Integr. Manuf. 2023, 81, 102490. [Google Scholar] [CrossRef]
  14. Liu, Z.; Zhang, X.; Wang, W. The Maximum Margin Learning Machine Based on Magnetic Pole Effect and Data Distribution Characteristics. J. Jiangxi Norm. Univ. Sci. Ed. 2023, 06, 645–651. (In Chinese) [Google Scholar]
  15. Xiao, R.; Xu, Y.; Hou, Z.; Chen, C.; Chen, S. An automatic calibration algorithm for laser vision sensor in robotic autonomous welding system. J. Intell. Manuf. 2022, 33, 1419–1432. [Google Scholar] [CrossRef]
  16. Lu, Z.; Fan, J.; Hou, Z.; Deng, S.; Zhou, C.; Jing, F. Automatic 3D Seam Extraction Method for Welding Robot Based on Monocular Structured Light. IEEE Sens. J. 2021, 21, 16359–16370. [Google Scholar] [CrossRef]
  17. Lévesque, D.; Asaumi, Y.; Lord, M.; Bescond, C.; Hatanaka, H.; Tagami, M.; Monchalin, J.P. Inspection of thick welded joints using laser-ultrasonic SAFT. Ultrasonics 2016, 69, 236–242. [Google Scholar] [CrossRef]
  18. David, M.; Ullman, S.; A, P.T. Vision: A Computational Investigation into the Human Representation and Processing of Visual Information; The MIT Press: Cambridge, MA, USA, 1982. [Google Scholar]
  19. Kah, P.; Shrestha, M.; Hiltunen, E.; Martikainen, J. Robotic arc welding sensors and programming in industrial applications. Int. J. Mech. Mater. Eng. 2015, 10, 1–16. [Google Scholar] [CrossRef]
  20. Feng, Z.; Chen, J.; Chen, Z. Monitoring weld pool surface and penetration using reversed electrode images. Weld. J. 2017, 96. [Google Scholar]
  21. Ye, Z.; Fang, G.; Chen, S.; Zou, J.J. Passive vision based seam tracking system for pulse-MAG welding. Int. J. Adv. Manuf. Technol. 2013, 67, 1987–1996. [Google Scholar] [CrossRef]
  22. Xia, C.; Pan, Z.; Fei, Z.; Zhang, S.; Li, H. Vision based defects detection for Keyhole TIG welding using deep learning with visual explanation. J. Manuf. Processes 2020, 56, 845–855. [Google Scholar] [CrossRef]
  23. Dai, W.; Li, D.; Zheng, Y.; Wang, D.; Tang, D.; Wang, H.; Peng, Y. Online quality inspection of resistance spot welding for automotive production lines. J. Manuf. Syst. 2022, 63, 354–369. [Google Scholar] [CrossRef]
  24. Nguyen, H.C.; Lee, B.R. Laser-vision-based quality inspection system for small-bead laser welding. Int. J. Precis. Eng. Manuf. 2014, 15, 415–423. [Google Scholar] [CrossRef]
  25. Chu, H.H.; Wang, Z.Y. A vision-based system for post-welding quality measurement and defect detection. Int. J. Adv. Manuf. Technol. 2016, 86, 3007–3014. [Google Scholar] [CrossRef]
  26. Pietrzak, K.; Packer, S. Vision-based weld pool width control. J. Eng. Ind. 1994, 116, 86–92. [Google Scholar] [CrossRef]
  27. Luo, M.; Shin, Y.C. Vision-based weld pool boundary extraction and width measurement during keyhole fiber laser welding. Opt. Lasers Eng. 2015, 64, 59–70. [Google Scholar] [CrossRef]
  28. Bračun, D.; Sluga, A. Stereo vision based measuring system for online welding path inspection. J. Mater. Process. Technol. 2015, 223, 328–336. [Google Scholar] [CrossRef]
  29. Mada, S.K.; Smith, M.L.; Smith, L.N.; Midha, P.S. Overview of passive and active vision techniques for hand-held 3D data acquisition. In Proceedings of the Opto-Ireland 2002: Optical Metrology, Imaging, and Machine Vision, Galway, Ireland, 5–6 September 2002; SPIE: Bellingham, WA, USA, 2003; Volume 4877, pp. 16–27. [Google Scholar]
  30. Zhang, K.; Yan, M.; Huang, T.; Zheng, J.; Li, Z. 3D reconstruction of complex spatial weld seam for autonomous welding by laser structured light scanning. J. Manuf. Processes 2019, 39, 200–207. [Google Scholar] [CrossRef]
  31. Chen, B.Q.; Hashemzadeh, M.; Guedes Soares, C. Numerical and experimental studies on temperature and distortion patterns in butt-welded plates. Int. J. Adv. Manuf. Technol. 2014, 72, 1121–1131. [Google Scholar] [CrossRef]
  32. Zhang, B.; Huang, W.; Wang, C.; Gong, L.; Zhao, C.; Liu, C.; Huang, D. Computer vision recognition of stem and calyx in apples using near-infrared linear-array structured light and 3D reconstruction. Biosyst. Eng. 2015, 139, 25–34. [Google Scholar] [CrossRef]
  33. Wu, Y.; Wang, J.; Wang, Y. Crop stalk identification and localization method based on skeleton extraction algorithm. Trans. Chin. Soc. Agric. Mach. 2022, 53, 334–340. [Google Scholar]
Figure 1. Flowchart of sieve-net weld point extraction based on skeleton intersections.
Symmetry 17 01484 g001
Figure 2. Grid division processing.
Symmetry 17 01484 g002
Figure 3. Concepts related to skeleton extraction.
Symmetry 17 01484 g003
Figure 4. Identification of skeleton intersections.
Symmetry 17 01484 g004
Figure 5. Diameter marking diagram. Note: Mark a is the rebar diameter, and mark b is the mesh diameter.
Symmetry 17 01484 g005
Figure 6. Comparison of images before and after connectivity processing.
Symmetry 17 01484 g006
Figure 7. Visualization of results tested in sample1. Note: The image on the right is a localized image magnified in the blue box. Undetected, inaccurate, and repeatedly detected solder joints are marked with red circles.
Symmetry 17 01484 g007
Figure 8. Visualization of results tested in sample2. Note: The image on the right is a localized image magnified in the blue box. Undetected, inaccurate, and repeatedly detected solder joints are marked with red circles.
Symmetry 17 01484 g008
Figure 9. Detection results of 5 different datasets.
Symmetry 17 01484 g009
Table 1. Experimentally tested point cloud data.
DataNumberDiRdMd
XYZ
sample1318,300513.20877.0159.815.3823.33
sample2565,213149.89469.0513.024.7845.79
sample3150,469118.75366.3334.045.1124.11
sample4150,469231.27177.06327.985.7221.68
sample5193,929465.66156.9423.815.5022.58
sample6696,110347.21131.4018.535.4821.19
sample7828,521237.23628.5764.656.0120.34
* Di: Dimension; Rd: reinforcement diameters; Md: mesh diameters.
Table 2. Comparative analysis of the accuracy of tests.
DataNd (px)FPRRecallAccuracy
sample160%47.79%100%
70%100%100%
817.47%100%82.53%
sample260%10.87%100%
70%100%100%
848.89%100%51.11%
sample360%23.85%100%
70%100%100%
823.24%100%76.76%
sample460%24.3%100%
70%100%100%
821.9%100%78.1%
sample560%31.29%100%
70%100%100%
812.5%100%87.5%
sample660%30.58%100%
70%100%100%
815.38%100%84.62%
sample760%30.47%100%
70%100%100%
817.67%100%82.33%
* Nd: Neighborhood diameter.
Table 3. Image connectivity ratio before and after connectivity processing.
DataCBTCAT
sample178.24%100%
sample284.33%100%
sample385.32%100%
sample485.98%100%
sample588.44%100%
sample676.19%100%
sample787.68%100%
Table 4. Variation of parameters tested in sample1.
Time (s)RdMdFPRRecallAccuracy
1175.5220%100%100%
1175220%100%100%
1164.5220%99.6%100%
774224.5%96.7%95.5%
663.5227.2%89.4%92.8%
5532212.8%74.7%87.2%
382.52213.3%9.5%86.7%
1356220%100%100%
1476.5220%100%100%
1677222.5%100%97.5%
1837.52210.6%95.6%89.4%
1135.5223.5%100%96.5%
1095.52270.4%94.9%29.6%
* Rd: Reinforcement diameters; Md: mesh diameters.
Table 5. Variation of parameters tested in sample2.
Time (s)RdMdFPRRecallAccuracy
6425400%100%100%
5434.5400%100%100%
4314400%98%100%
3513.54015.8%65.3%84.2%
27734017.1%59.2%82.9%
7645.5402.3%87.8%97.7%
8976402.3%87.5%97.7%
10416.5402.5%81.3%97.5%
12037407.7%73.5%92.3%
6325300%100%100%
6225200%95.9%100%
61051019.6%91.8%80.4%
* Rd: Reinforcement diameters; Md: mesh diameters.
Table 6. Results on the five samples.
Time (s)RdMdFPRRecallAccuracy
595.5200%100%100%
605.5220%97.3%100%
805.5230%97.4%100%
1075.5210%98.4%100%
1076200%100%100%
* Rd: Reinforcement diameters; Md: mesh diameters.
Table 7. Results for the same data in 5 different directions.
Time (s)Angle (deg)FPRRecallAccuracy
11600%100%100%
11721.010%100%100%
11750.390%100%100%
11794.400%100%100%
117132.690%100%100%
119178.190%100%100%
Table 8. Comparative analysis of solder joint extraction errors.
X AxisY AxisZ AxisRSME (mm)
MAX2.582.302.793.96
MIN0000
Table 9. RMSE distribution.
RMSE (mm)<1<2<3<3.5
Count110153256271
Proportion40%55.6%93.1%98.8%
Table 10. Comparative analysis of the proposed method and manual weld detection.
MethodTime (s)Accuracy
Manual294100%
Ours6692.8%
Disclaimer/Publisher’s Note: The statements, opinions and data contained in all publications are solely those of the individual author(s) and contributor(s) and not of MDPI and/or the editor(s). MDPI and/or the editor(s) disclaim responsibility for any injury to people or property resulting from any ideas, methods, instructions or products referred to in the content.