Abstract
Cloud imagery analysis from terrestrial observation points represents a fundamental capability within contemporary atmospheric monitoring infrastructure, serving essential functions in meteorological prediction, climatic surveillance, and hazard alert systems. However, traditional ground-based cloud image segmentation methods have fundamental limitations, particularly their inability to effectively model the graph structure and symmetry in cloud data. To address this, we propose G-CLIP, a ground-based cloud image segmentation method based on graph symmetry. G-CLIP synergistically integrates four innovative modules. First, the Prototype-Driven Asymmetric Attention (PDAA) module is designed to reduce complexity and enhance feature learning by leveraging permutation invariance and graph symmetry principles. Second, the Symmetry-Adaptive Graph Convolution Layer (SAGCL) is constructed, modeling pixels as graph nodes, using cosine similarity to build a sparse discriminative structure, and ensuring stability through symmetry and degree normalization. Third, the Multi-Scale Directional Edge Optimizer (MSDER) is developed to explicitly model complex symmetric relationships in cloud features from a graph theory perspective. Finally, the Uncertainty-Driven Loss Optimizer (UDLO) is proposed to dynamically adjust weights to address foreground–background imbalance and provide uncertainty quantification. Extensive experiments on four benchmark datasets demonstrate that our method achieves state-of-the-art performance across all evaluation metrics. Our work provides a novel theoretical framework and practical solution for applying graph neural networks (GNNs) to meteorology, particularly by integrating graph properties with uncertainty and leveraging symmetries from graph theory for complex spatial modeling.
1. Introduction
With the acceleration of worldwide climatic shifts and the notable rise in severe atmospheric phenomena occurrences, accurate weather forecasting and climate monitoring have become critical requirements for the sustainable development of human society. According to a report by the American Meteorological Society, the number of weather-related natural disasters increased from 1383 incidents between 1980 and 1985 to 4020 incidents between 2013 and 2018, indicating a sharp upward trend in extreme weather events [1]. Ground-based cloud imagery provides valuable supplementary data for local nowcasting and cloud physics research. While numerical weather prediction models and satellite data remain the primary tools for operational forecasting, ground-based observations offer unique high-resolution insights into local cloud dynamics and boundary layer processes that are particularly useful for short-term forecasting and research applications [2]. In this context, ground-based cloud image segmentation serves as a valuable supplementary technology in modern meteorological observation systems, providing high-resolution local details that complement broader-scale data sources such as satellites and radar [3]. However, segmenting ground-based cloud images presents distinct technical hurdles: the ambiguity arising from highly indistinct cloud edges, the difficulty of fusing visual cues due to clouds’ intricate topological layouts, and the segmentation skew caused by severe foreground–background imbalance [4]. In typical ground-based cloud image datasets, the foreground region often accounts for only 5–10% of the total pixels [5]. These challenges require segmentation methods to not only handle spatial features in traditional image analysis but also effectively integrate the rich graph structure information contained in cloud image data.
Traditional cloud image segmentation methods have revealed numerous limitations when addressing modern meteorological observation requirements. The inherent blurriness of cloud boundaries makes threshold-based and edge detection methods inadequate, while the highly irregular shapes and complex textures of cloud layers exceed the expressive capabilities of traditional feature extraction methods [6]. More critically, traditional methods lack the ability to effectively utilize the graph structural information in cloud image data, failing to fully exploit the spatial relationships and topological characteristics between cloud layers [7].
Building on the preceding analysis, we introduce a graph-symmetry-driven approach for ground-based cloud-image segmentation,, which systematically addresses the limitations of existing methods through the collaborative work of four innovative modules:
- Prototype-Driven Asymmetric Attention (PDAA). This module uses the K-means algorithm for the dynamic clustering of features and employs an exponential moving average strategy to update cluster centers, thereby better capturing the feature distribution of cloud image data. Additionally, a permutation-invariant intra-group attention mechanism is designed to reduce computational complexity while enhancing the model’s precision in focusing on cloud image features. This innovative design combines a combination clustering algorithm with graph symmetry principles to ensure graph node permutation invariance.
- Symmetry-Adaptive Graph Convolution Layer (SAGCL). This module models cloud image pixels as graph nodes, uses cosine similarity as a semantic distance metric, and constructs a sparse and discriminative graph structure. Symmetrization operations and degree normalization ensure the stability of the graph structure, enabling effective modeling of complex spatial relationships and topological characteristics between cloud layers. This module can further establish feature propagation and global contextual associations across cloud clusters based on the clustering attention mechanism.
- Multi-Scale Directional Edge Refiner (MSDER). Using multi-scale combined convolution decomposition technology, features are extracted and fused from multiple scales to more comprehensively capture cloud map information. Additionally, a gated feature fusion mechanism is designed to dynamically adjust the fusion process based on feature uncertainty, significantly improving the segmentation accuracy of thin fog boundaries and achieving the integration of graph attributes and uncertainty. This design models the complex symmetrical relationships of cloud map features from a graph theory symmetry perspective, enabling intelligent aggregation of multi-scale features and noise suppression.
- Uncertainty-Driven Loss Optimizer (UDLO). This optimizer uses CAM technology to generate activation maps highlighting foreground features, dynamically calculates hit rates for various categories, and uses an exponential decay function to adaptively adjust loss weights. This design enables the model to focus more on rare cloud types that are difficult to identify during training, significantly improving detection rates and enhancing the reliability of the entire network.
The synergistic design of these four modules not only addresses the key limitations of traditional methods and existing deep learning approaches but also provides a comprehensive solution for ground-based cloud map segmentation, with significant improvements in feature extraction, graph structure modeling, multi-scale fusion, and category balancing.
2. Related Work
This section provides a comprehensive review of existing approaches relevant to our proposed method, organized into three main areas: advances in graph neural networks for visual segmentation, symmetric graph theory applications, and U-Net-based segmentation methods. To facilitate understanding and comparison, we present both detailed discussions and summarized comparisons of key methods.
2.1. Advances in Graph Neural Networks for Visual Segmentation
Graph-based neural architectures have exhibited remarkable capabilities and substantial promise within visual parsing domains, offering new solutions to traditional convolutional neural network (CNN) methods. Traditional CNNs have limitations in exploring the structural relationships between image components. Researchers have proposed graph structure learning to enhance neural networks, utilizing the contextual information generated by CNNs as graph node features and constructing adjacency matrices through self-supervised graph generators [8]. Pan and colleagues introduced the HybridGNN architecture, which excels at processing intricate graph topologies through the combination of GATv2, GraphSAGE, and GIN components, enabling robust extraction of both localized nodal connections and overarching structural features [9]. It introduces a Jumping Knowledge (JK) mechanism to aggregate multi-layer network representations, enabling the utilization of both shallow and deep-level information. The methodology exhibits superior performance in processing hierarchically-organized visual information, utilizing mixed-precision computation alongside gradient accumulation strategies to enhance both memory efficiency and processing speed.
Currently, GNNs in visual segmentation are showing trends toward multimodal feature fusion and deepening self-supervised learning, effectively modeling complex spatial relationships and semantic dependencies among image pixels. They demonstrate significant advantages in segmentation tasks involving irregular shapes, blurry boundaries, and complex textures [10]. In the field of unsupervised image segmentation, methods combining pseudo-label generation and self-supervised learning have made significant progress, utilizing the inherent structure of graphs for unsupervised representation learning to reduce reliance on manually labeled data [11].
2.2. Symmetric Graph Theory and GNN Applications in Segmentation
Symmetry, as a core concept in graph theory, provides mathematical tools for handling complex network structures. Wang et al. systematically explored the symmetry properties of graphs, establishing a theoretical framework for g-good-neighbor connectivity and diagnosability, demonstrating that the symmetric structural characteristics of networks influence their fault tolerance and reliability, thereby providing a theoretical foundation for GNN applications in complex image data processing [12,13]. In the study of central k-ary n-cubes, it was proven that g-good-neighbor connectivity is 2n and g-extra connectivity is also 2n. These mathematical properties of symmetric structures provide insights for designing efficient graph neural network architectures [14]. Within both PMC and MM* frameworks, the diagnostic capability for g-good-neighbor configurations achieves a value of 2n + g, illustrating how exploiting symmetric characteristics in graphs can improve diagnostic precision and operational effectiveness in networks. Wang et al. proposed the Modified Comparison model (MC model), which integrates the advantages of classic algorithms to improve modern learning methods [15]. By embedding conventional graph-based algorithms as foundational knowledge within GNN learning procedures, this framework establishes a novel integration strategy that bridges classical computational approaches with contemporary neural network architectures.
The theoretical development of GNNs has undergone a significant shift from spectral graph convolutions to spatial graph convolutions, with the mathematical principles of graph attention mechanisms and graph pooling operations becoming increasingly refined. However, existing methods often neglect spatial symmetry information when processing image data with intrinsic geometric structures. Classic methods such as GraphSAGE are insufficient in preserving local geometric structures [16], while GAT, though achieving dynamic weight allocation, has high computational complexity and lacks symmetry guarantees. In computer vision applications, GNN methods incorporating symmetry constraints hold promise for significant roles in fields such as meteorological imagery. Key challenges include systematic studies of symmetry patterns in meteorological imagery, balancing graph structural representation capabilities with computational complexity and designing GNN architectures that balance symmetry and efficiency for small-scale datasets [17].
2.3. Segmentation Methods Based on U-Net and Its Variants
Models based on convolutional neural networks (CNNs) have made significant progress in semantic segmentation tasks. To bridge the semantic gap between the encoder and decoder, Ronneberger et al. [18] first proposed the skip-connection mechanism, which preserves more edge information and helps predict the detailed texture of the target region. Att-UNet [19] introduced a gating mechanism into skip connections, enabling the model to focus more efficiently on key regions.
Although CNNs excel at capturing local details and low-level features, their layer-wise extraction of local information limits their ability to model the global context, making it difficult to effectively handle remote semantic information connections. ViT [20] introduced the attention mechanism into computer vision, achieving breakthrough progress in tasks such as semantic segmentation through its global modeling capabilities. The deepest features of the visual transformer U-Net contain highly abstract high-level semantic information (such as cloud boundary shapes and positions), but traditional CNNs may lose global contextual information due to local convolution operations. Swin-UNet [21] introduces a hierarchical design and Shifted Window Attention, significantly improving global modeling efficiency and computational performance. Laplacian [22] designed a frequency attention mechanism with Gaussian kernels of different variances to enhance texture and edge detection capabilities. MA-SegCloud [23] introduced spatial attention and channel attention into cloud map segmentation to enhance strong feature extraction capabilities. CSWin-UNet [24] introduced Cross-Shaped Attention, where half the channels interact horizontally and half interact vertically, enhancing content-aware capabilities. Rolling-Unet [25] and UNeXt [26] capture long-range dependencies by rolling across the bottleneck layer, achieving the same computational efficiency as 3 × 3 convolutions without increasing computational overhead. A detailed comparative summary of existing methods and our proposed framework is provided in Supplementary Table S1.
3. Methods
3.1. Overall Framework
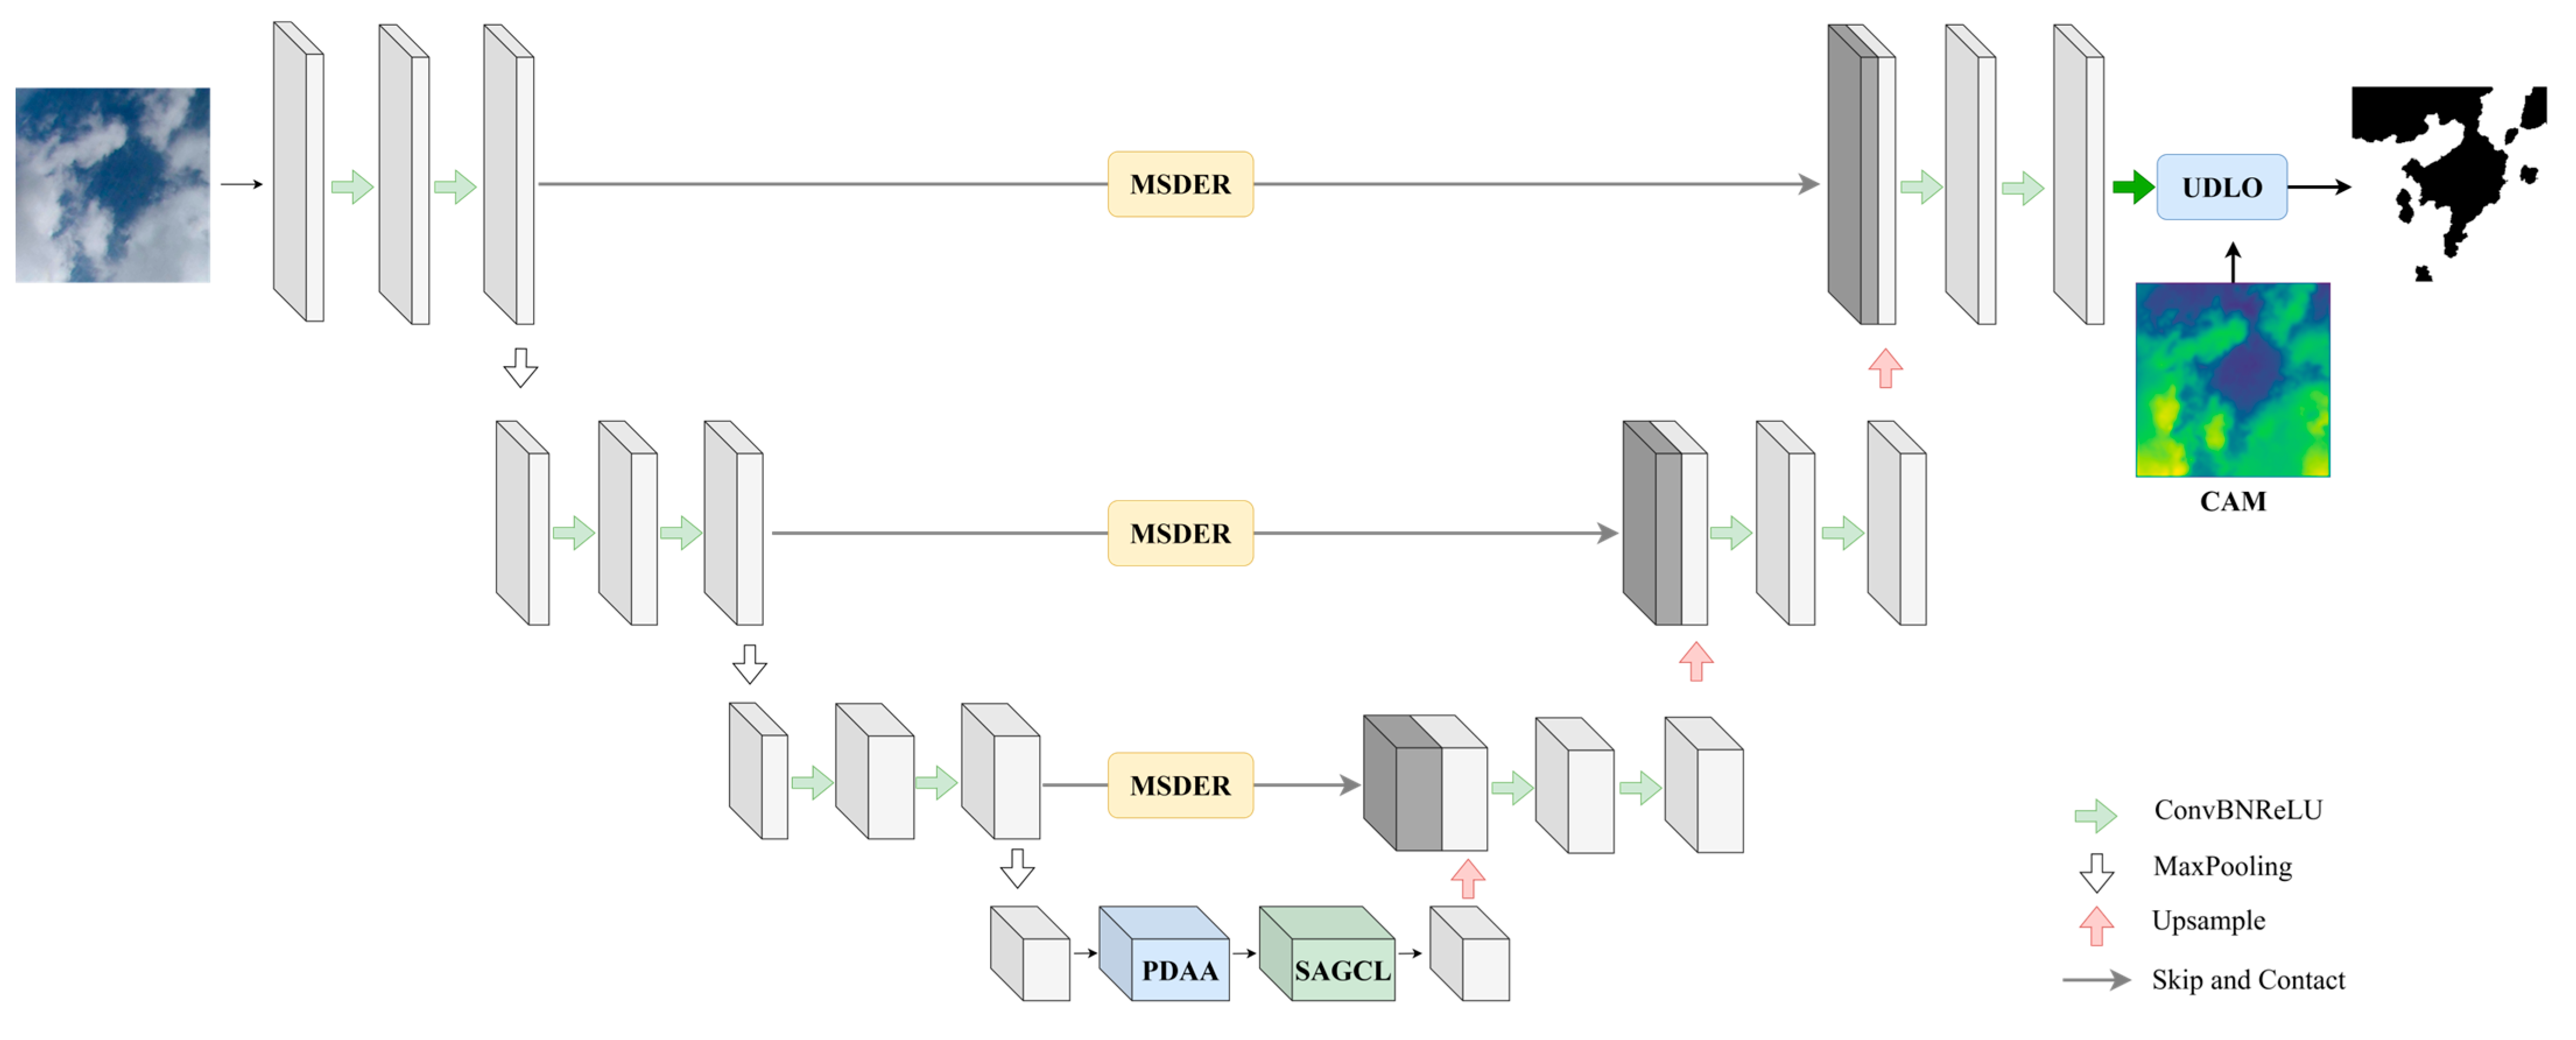
In our architecture design (shown in Figure 1), the U-Net bottleneck layer first performs preliminary semantic grouping and local attention enhancement of cloud image features through a clustering/grouping attention mechanism. This mechanism effectively identifies local cloud cluster structures in cloud images and groups pixels with similar features through clustering operations. However, the clustering attention mechanism primarily focuses on feature aggregation within local regions, and it still has limitations in modeling long-range semantic associations between cloud layers and global contextual information.
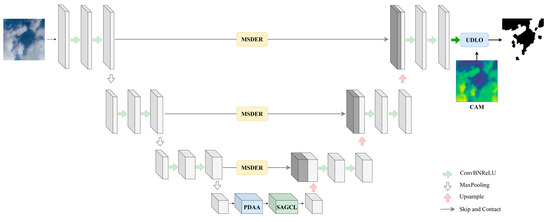
Figure 1.
G-CLIP architecture: graph symmetry-driven cloud segmentation with PDAA, SAGCL, MSDER, and UDLO modules.
Cloud morphological features often exhibit global properties, and the correct identification of individual cloud blocks requires comprehensive consideration of contextual information across the entire sky region. Especially under complex weather conditions, discrimination between different cloud types (such as cumulus, stratus, cirrus, etc.) not only relies on local features after clustering and grouping but also necessitates the establishment of semantic dependency relationships between distant pixels. To further enhance the output features of the clustering attention mechanism, we have concatenated an adaptive graph convolutional network module based on k-nearest neighbors. This aims to construct global graph topological relationships based on grouped cloud features, enabling feature propagation and semantic association modeling across cloud clusters, thereby improving the accuracy and robustness of cloud image segmentation.
Figure 1 shows the complete architecture of the Ground-based Cloud Image Partitioning (G-CLIP) method based on graph symmetry, which uses an improved U-Net as the backbone network. The encoder part retains the traditional U-Net encoder structure, gradually extracting multi-scale features of the cloud image through multiple layers of convolution and pooling operations, covering high-resolution detail features to low-resolution semantic features. At the bottleneck layer of the U-Net, two key innovative modules are integrated: the PDAA module uses the K-means clustering algorithm to dynamically group features, employing a permutation-invariant intra-group attention mechanism to achieve efficient feature clustering and attention calculation; the SAGCL module models cloud pixels as graph nodes, constructs a sparse graph structure using cosine similarity, and employs symmetric operations and degree normalization to ensure graph structure stability, thereby modeling long-range semantic associations between cloud layers. The MSDER component integrates into U-Net’s skip pathways, featuring both channel-wise adaptive mechanisms and multi-resolution directional edge enhancement modules. It employs 1 × 7- and 7 × 1-long kernel convolutions to capture horizontal and vertical boundary features, achieving intelligent multi-scale feature fusion. The decoder adopts the traditional U-Net upsampling and feature fusion structure but is equipped with the UDLO module, which dynamically adjusts loss weights using CAM technology to address the issue of extreme imbalance between foreground and background.
3.2. Prototype-Driven Asymmetric Attention (PDAA)
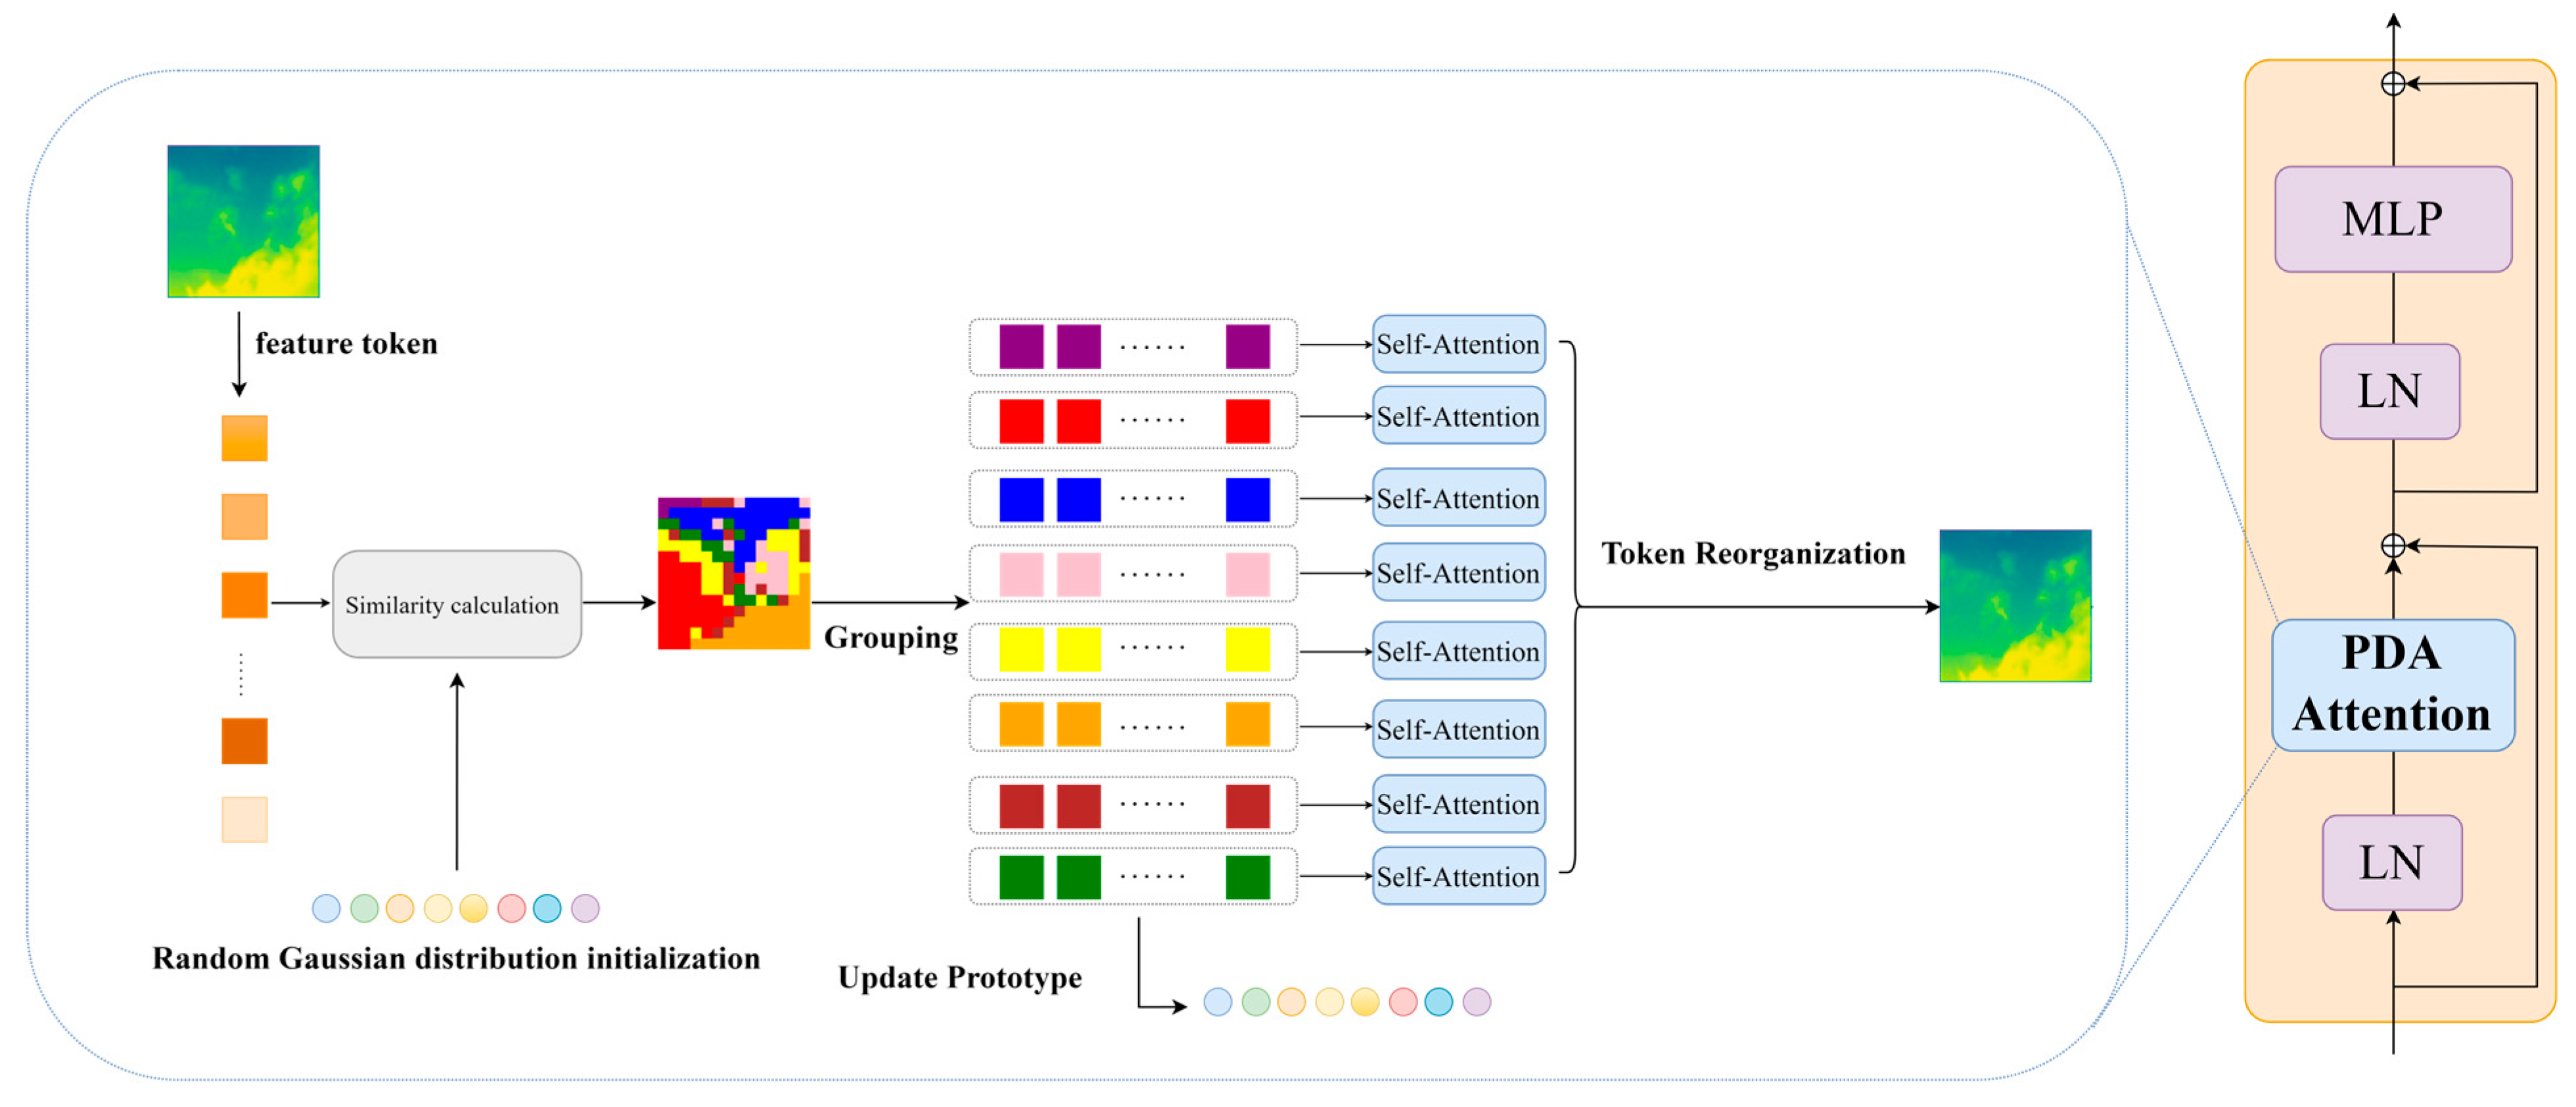
In the task of foundation cloud map segmentation, to overcome the issue of excessive computational complexity in traditional Transformer architectures when processing large-scale data and further enhance feature representation capabilities, this paper proposes an innovative clustering attention mechanism module (as shown in Figure 2) at the bottleneck layer of the U-Net-based algorithm. We aim to group similar features through a content-aware clustering process and perform efficient attention calculations within each group, thereby reducing computational complexity while enhancing the semantic consistency and discriminative power of features. PDAA employs the K-means algorithm for dynamic clustering of bottleneck layer features and designs group-internal attention that satisfies graph node permutation invariance, innovatively combining the combination clustering algorithm with graph symmetry principles.
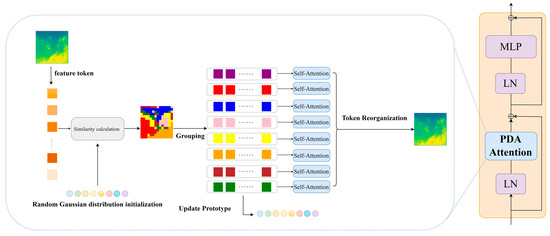
Figure 2.
PDAA module structure diagram.
To establish the mathematical foundation for our clustering approach, we begin by defining the cluster initialization strategy. First, define the set of cluster centers as , where represents the number of cluster centers. The initial cluster centers are defined as follows:
where represents the batch size and represents the number of groups for each image. The cluster centers are initialized based on the average values of the batches and groups to ensure that the initial distribution covers different regions of the feature space. This initialization method enables the initial distribution of the cluster centers to cover different regions of the feature space as much as possible, providing a reasonable starting point for the subsequent clustering iterations. The double averaging operation ensures the consistency of the initialization scale and avoids the instability of the values caused by changes in batch size or group number.
Building upon this initialization, we implement a dynamic updating mechanism to adapt to changing feature distributions during training. In order to enable the cluster centers to dynamically adapt to changes in the distribution of data features, we adopt the exponential moving average (EMA) strategy to update the cluster centers:
where represents the attenuation rate, which is used to control the weight of the historical clustering center and the estimated clustering center value obtained from the current batch calculation during the update process. When approaches 1, learning is slow but stable, and when is small, it can quickly adapt to data changes. The EMA mechanism inherently has a low-pass filtering characteristic, which can smooth the update process of the clustering center and avoid drastic oscillations, ensuring the convergence of the training process. In this way, the clustering center can gradually approach the essential structure of the data during the training process, enhancing the model’s adaptability to the distribution of different ground-based cloud image data.
With the cluster centers established, we proceed to define the similarity computation mechanism that enables effective feature grouping. To calculate the similarity between the feature vector and the clustering center, we first normalize the feature vector to prepare for the subsequent dot product similarity calculation, ensuring that the similarity mainly reflects the direction rather than the amplitude difference, thereby enhancing the stability of the similarity calculation:
Subsequently, the dot product similarity between the normalized feature vector and the normalized cluster center is calculated:
where represents the similarity between the feature vector and the cluster center. The dot product operation is more computationally efficient than the complex distance measures (such as Euclidean distance) and is suitable for linearly separable feature spaces. It is highly compatible with the linear projection operations of the Transformer architecture. Following the similarity computation, we implement the assignment strategy to group features based on their semantic relationships. Based on the magnitude of the similarity, each feature vector is assigned to the group corresponding to the cluster center that is most similar to it, as follows:
where represents the clustering index to which the feature vector belongs. In this way, we can group vectors with similar semantic or spatial features together, providing a more meaningful feature grouping structure for subsequent intra-group attention calculations. The hard assignment ensures that each feature vector belongs to only one cluster, avoiding information confusion caused by ambiguous attribution, which is advantageous in meteorological applications with high requirements for cloud boundary clarity.
Having established the grouping mechanism, we now detail the intra-group attention computation that leverages these semantic clusters. After the features are grouped, the intra-group attention calculation stage begins. We divide the sorted and reorganized query, key, and value features into multiple groups, with each group having a size of S (group_size). For the features within the group, the attention score is first calculated:
where represents the size of the attention head. This formula calculates the attention score by multiplying the query vector with the transposed key vector and then dividing by the square root of the attention head size. After performing a softmax operation on the attention score, the attention weight is obtained:
Based on the obtained attention weights, calculate the intra-group context features:
The context features here are obtained by multiplying the attention weights with the corresponding value vectors and then summing them up, which can reflect the correlation and importance of the features within the group. Compared to the complexity of global attention, the complexity of intra-group attention achieves a significant efficiency improvement. Finally, the context features calculated within the group are restored to their original order and projected through the output linear layer to obtain the final attention output. This step converts the intra-group context features into output features with the same dimension as the input features so that subsequent network layers can perform further processing.
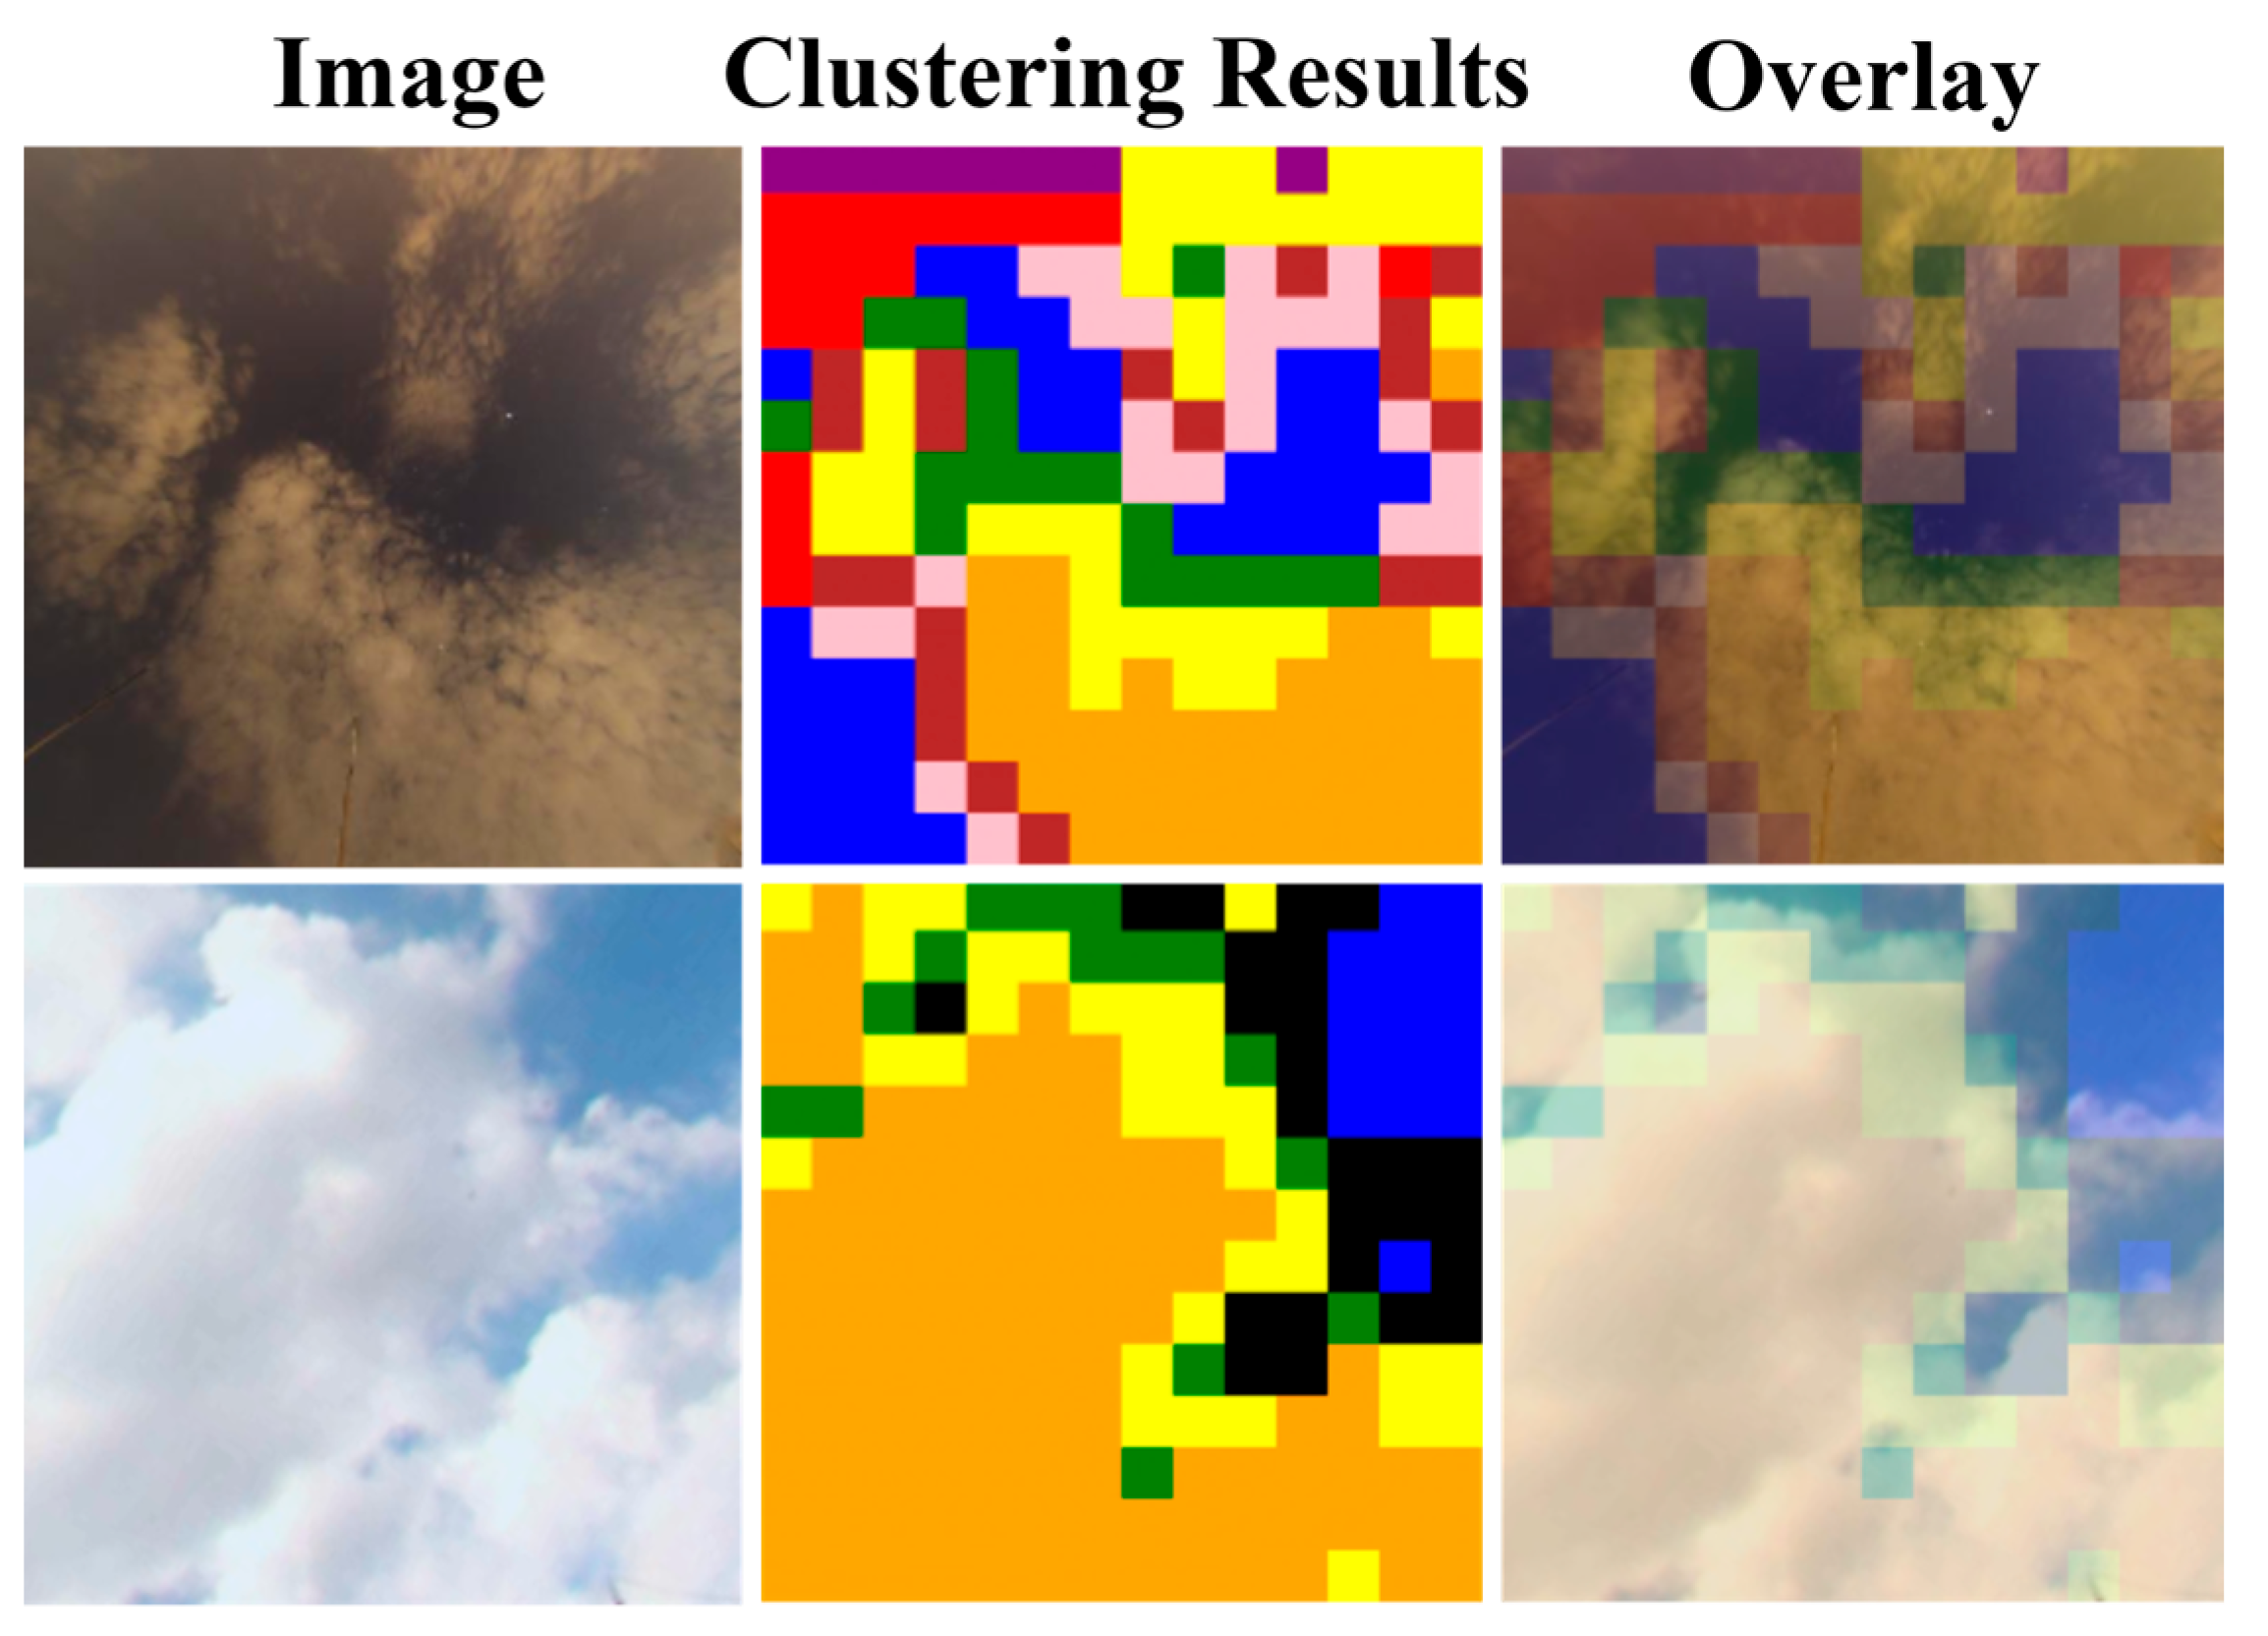
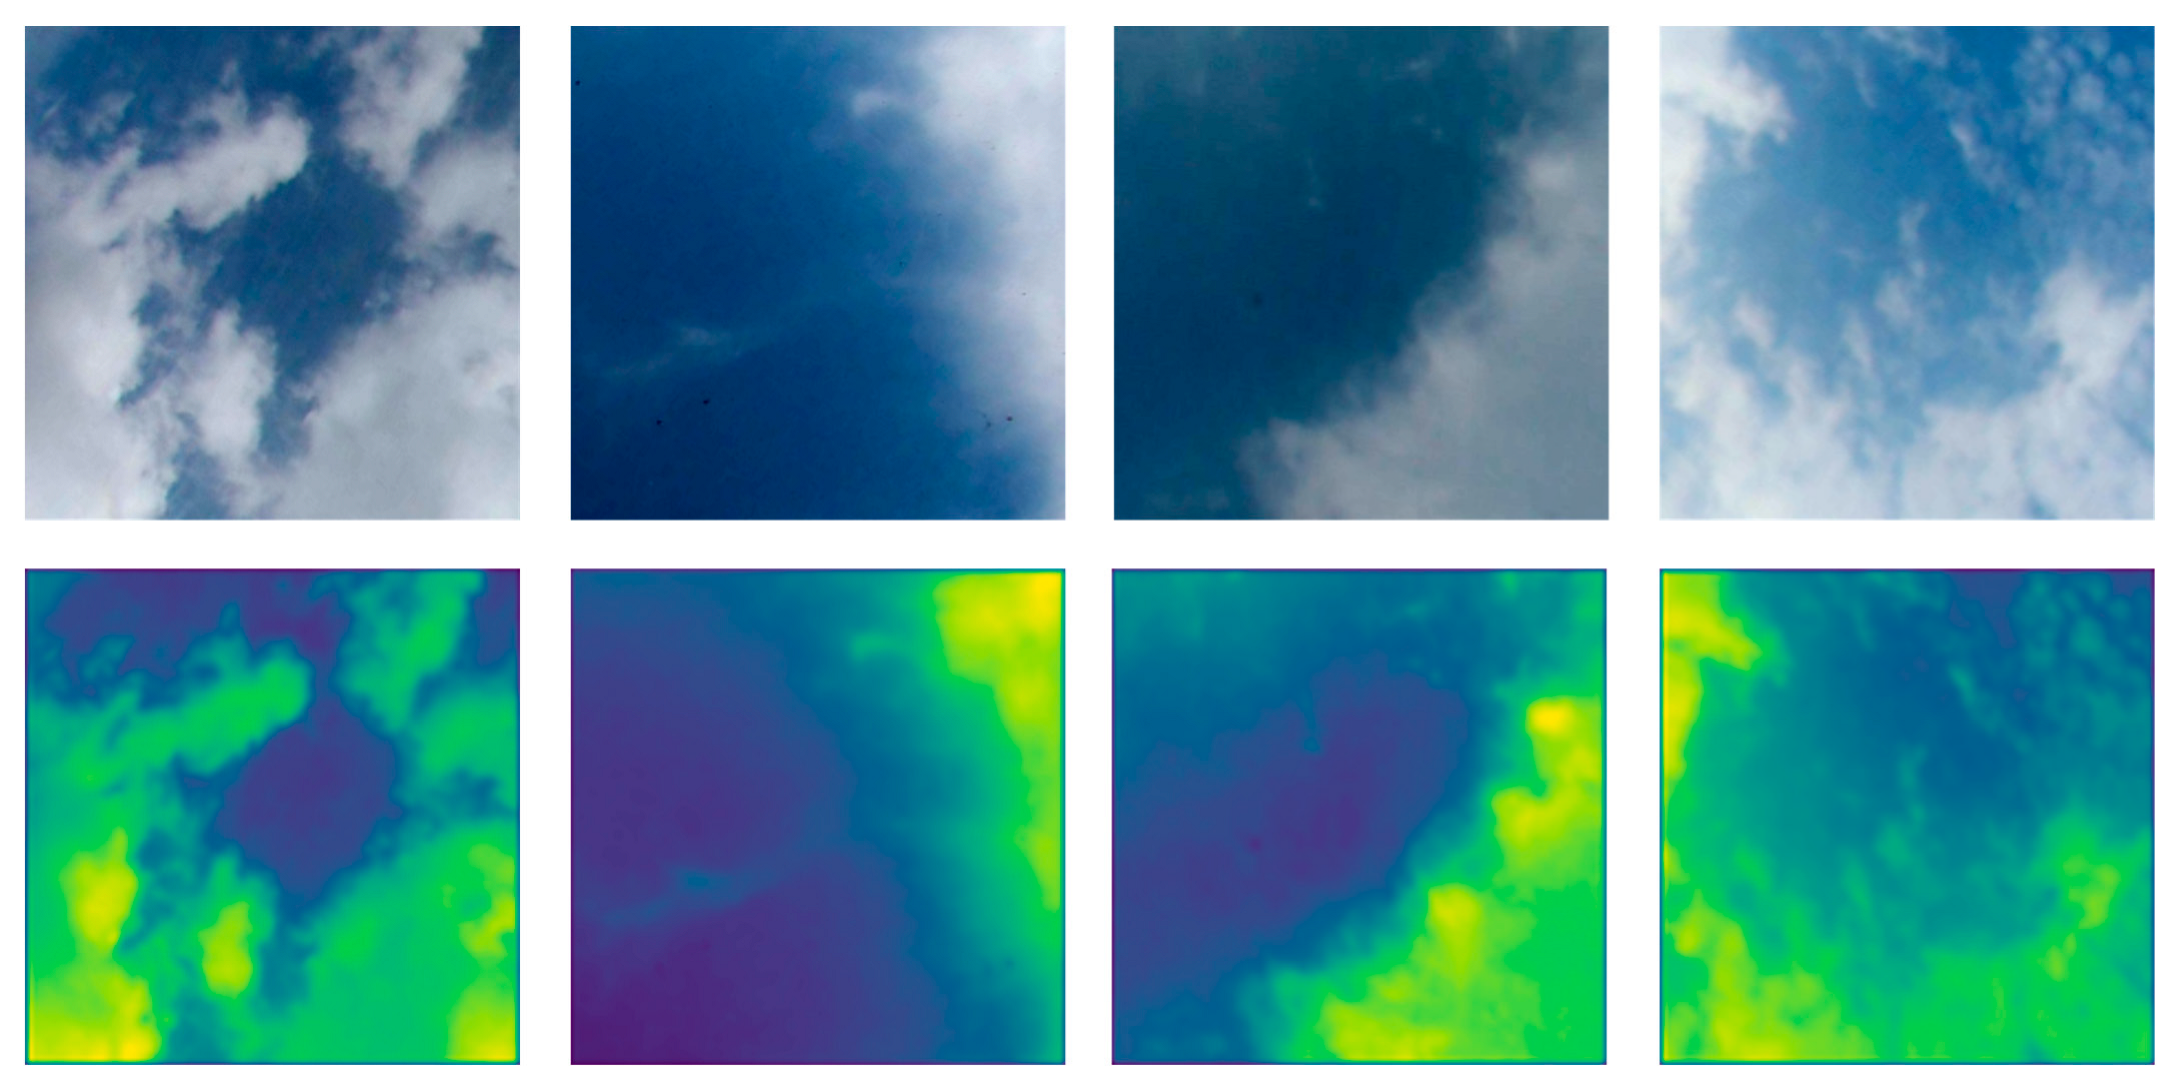
From the clustering results (Figure 3), it can be observed that cloud layer regions with similar texture features are classified into the same category, and even in the case of illumination changes, PDAA can accurately identify the essential features of the cloud layer. The clustering boundaries closely match the real cloud layer boundaries, which proves the superiority of PDAA in maintaining the integrity of the cloud layer. In the first row, the complex cloud layer structure is accurately segmented into different semantic regions, and each region maintains high consistency within itself; in the second row, the blue sky background and the cloud area are clearly separated, avoiding semantic confusion. The PDAA module successfully organizes the complex cloud map features into meaningful semantic regions. We not only effectively reduce the computational complexity but also improve the quality of feature representation, laying a solid foundation for the high performance of the entire segmentation system.
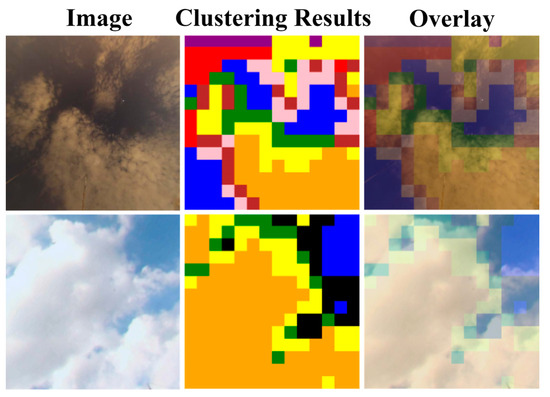
Figure 3.
PDAA module clustering results display.
3.3. Symmetry-Adaptive Graph Convolution Layer (SAGCL)
After passing through the bottleneck layer clustering/grouping attention mechanism, the cloud image features have acquired certain local semantic grouping characteristics. Similar cloud areas exhibit stronger aggregation in the feature space. However, this clustering-based grouping mainly focuses on local similarities and is still limited in modeling the long-distance semantic associations between cloud layers. The distribution of cloud layers in ground-based cloud images shows significant spatial non-uniformity. The boundaries of cloud blocks often present a gradual transition rather than a clear demarcation, and there may be complex interrelationships between different cloud clusters.
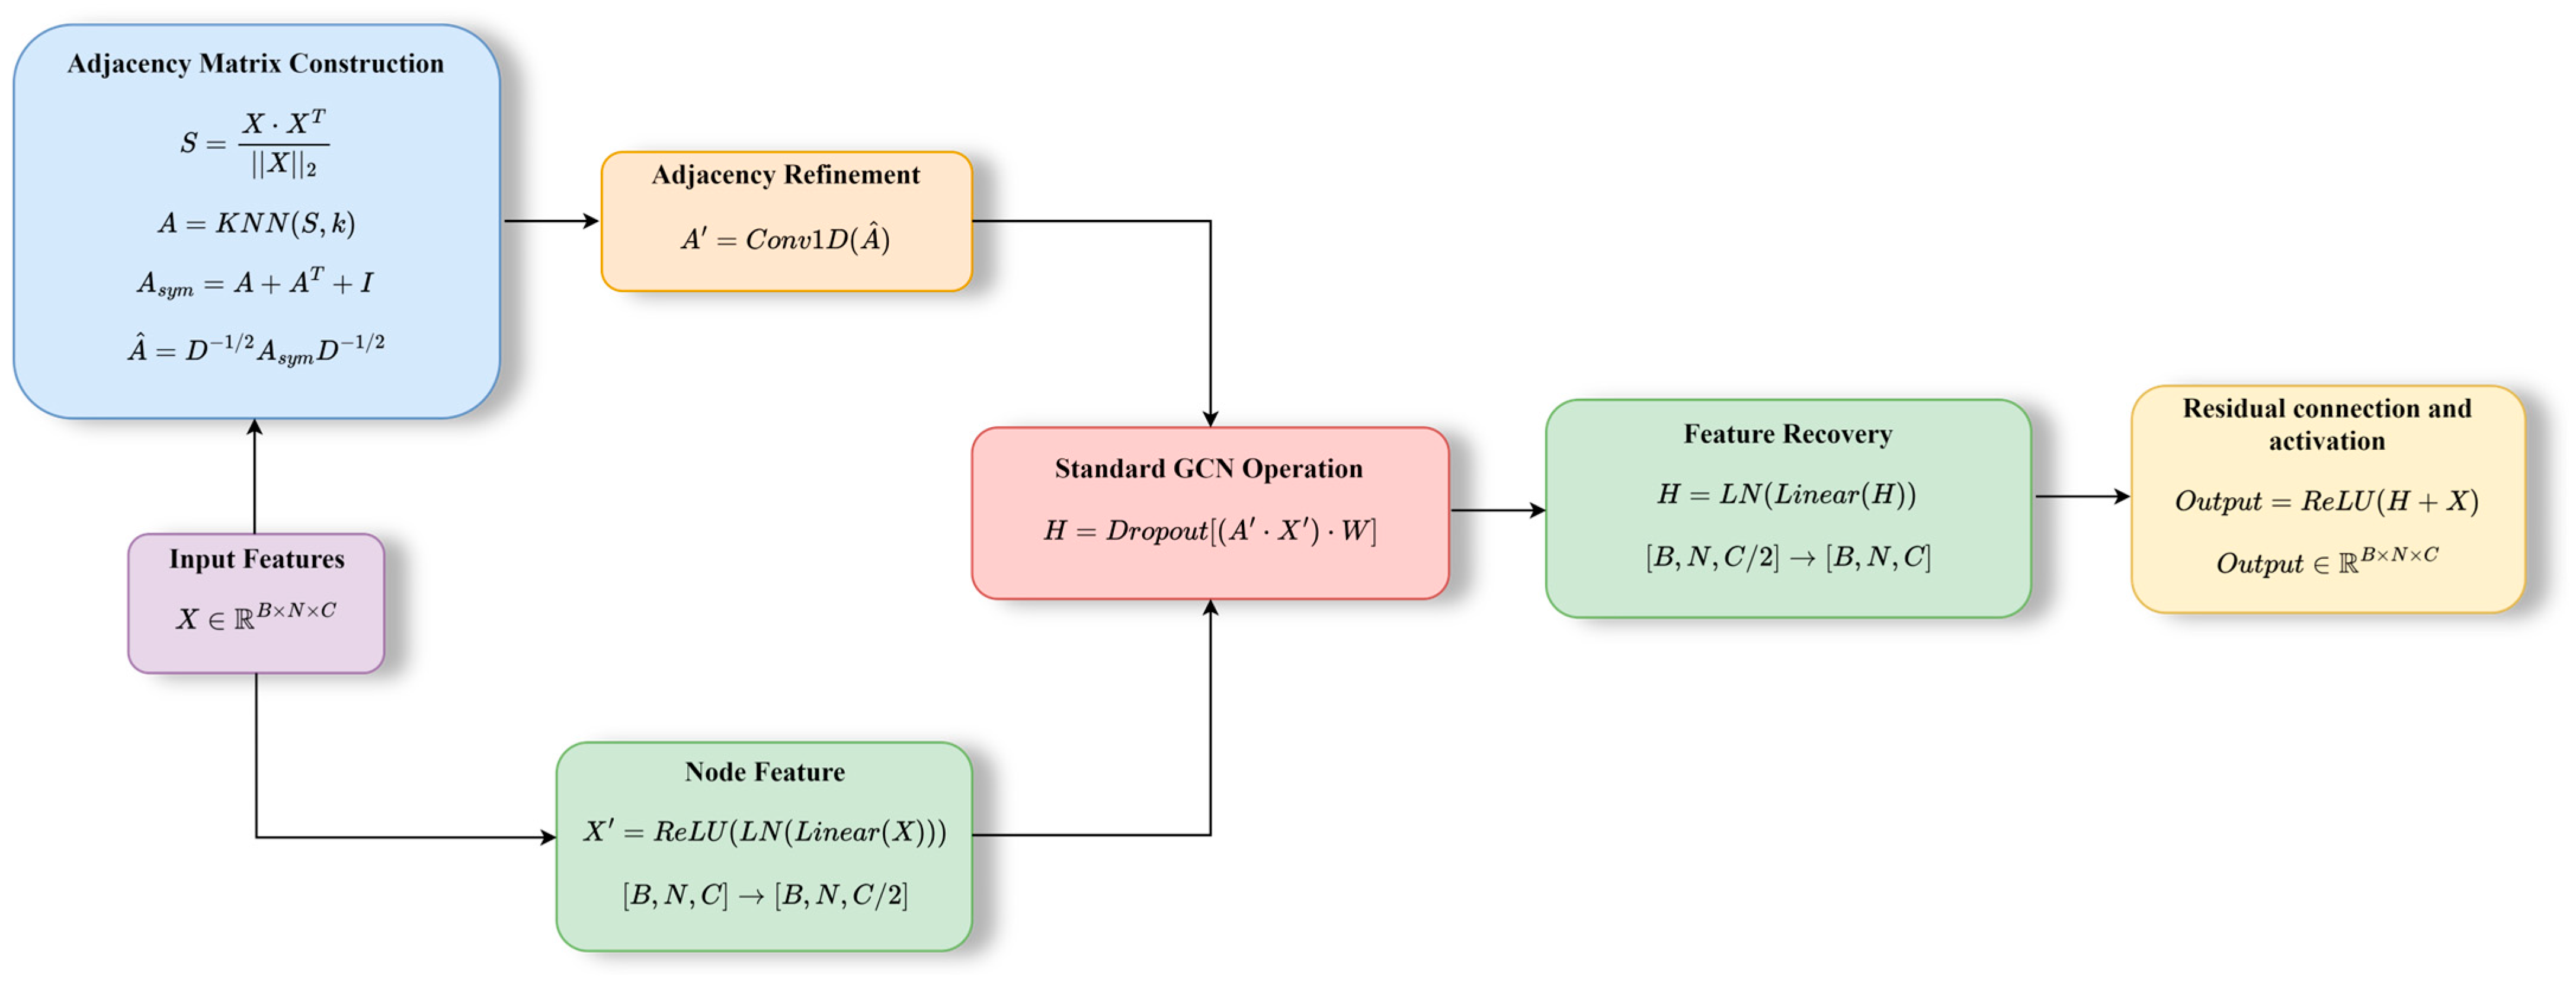
To address these limitations, we adopt a graph-based approach that models pixel relationships more comprehensively. Therefore, we treat cloud pixels as graph nodes and model the semantic relationships between pixels by constructing an adaptive graph structure. Traditional convolution operations have limitations in capturing long-range dependencies between pixels. Graph convolutional networks can effectively model non-local dependencies between pixels, but standard GCNs face high computational complexity when processing large-scale data and struggle to adaptively capture the graph structure characteristics of different datasets. To address this, we propose a KNN-based symmetric adaptive graph convolutional module (as shown in Figure 4), which adds self-loops and symmetrization to meet graph symmetry requirements. This aims to construct an efficient pixel-to-pixel relationship graph and achieve adaptive feature aggregation and transformation through a learnable weight matrix, thereby enhancing the performance of ground-based cloud image segmentation.
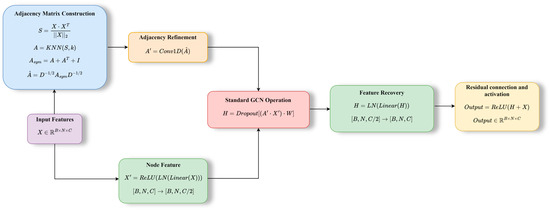
Figure 4.
SAGCL module structure diagram.
The foundation of our graph construction relies on an appropriate similarity metric tailored to cloud image characteristics. Considering that similar cloud types in cloud maps may be spatially distant, we adopt cosine similarity as the semantic distance metric between nodes to capture cloud texture and intensity features, adapting to the feature distribution of cloud maps:
where and represent the feature vectors of the and pixel positions, respectively. Compared to metrics such as Euclidean distance, cosine similarity is more computationally efficient in high-dimensional feature spaces and can effectively capture the semantic similarity of cloud layer features without being affected by the amplitude of the feature vectors. This is crucial for the identification of cloud patches with different brightness but the same texture in the cloud image. Through L2 norm normalization, this metric is robust to the scale changes of the feature vectors and avoids the interference of illumination changes on the similarity calculation.
Based on this similarity measure, we construct a sparse yet informative graph structure using the k-nearest neighbor approach. Given the significant differences in the size of cloud patches in the cloud image, we select k most similar neighbors for each pixel node to construct a sparse and discriminative graph structure:
This strategy enables pixels belonging to the same cloud block to establish strong connections while maintaining appropriate separation between different cloud types, effectively enhancing the ability to identify cloud boundaries. By selecting only the k most similar neighbors, it effectively filters out weakly correlated connections, reduces the interference of weather noise and illumination changes on the graph structure, and improves the stability of cloud image segmentation. The selection of the k value directly affects the connection density of the graph, and the k value is usually set as a small proportion of the total number of nodes (in this paper, it is set as ), which not only ensures effective information transmission but also controls the computational complexity.
To ensure robust graph properties that align with cloud morphological characteristics, we implement symmetrical operations and normalization. The morphology of clouds usually has certain symmetrical characteristics. We ensure the stability of the graph structure through symmetrical operations:
The addition of self-loops ensures that each pixel retains its own cloud feature information, which is crucial for the precise positioning of cloud boundaries. The symmetric matrix has excellent spectral properties, with all eigenvalues being real and the eigenvectors being orthogonal, providing numerical stability guarantees for subsequent graph convolution operations. To balance information propagation across regions with varying cloud density, we apply degree normalization. Considering the differences in cloud density in different regions of the cloud image, we use degree normalization to balance information propagation:
The degree matrix is defined as follows:
This normalization method ensures a balanced distribution of features in dense and sparse cloud regions, avoiding the biasing influence of cloud density on the segmentation results. At the same time, normalization limits the eigenvalues of the Laplacian matrix to the range of , preventing the problem of gradient explosion and improving training stability. To further optimize the adjacency relationship representation of the cloud map, we introduce one-dimensional convolution operations to refine the normalized adjacency matrix, smooth the connection relationships of cloud boundaries, reduce the interference of weather noise and illumination changes on the graph structure, and improve the stability of cloud map segmentation.
With the graph structure established, we implement the core graph convolution operations that enable global feature aggregation. To ensure the details of the cloud map while improving computational efficiency, we first reduce the dimension of the cloud features output by the U-Net encoder and then apply LayerNorm and ReLU activation functions to enhance the discriminative ability of the cloud features. The core graph convolution propagation strictly follows the GCN theory, achieving global aggregation of cloud features, and through graph convolution operations, each pixel can aggregate feature information from similar cloud regions, significantly improving the accuracy of cloud boundary recognition and cloud-type classification. Considering the complexity and variability of ground-based cloud maps, we introduce Dropout operations to prevent model overfitting and restore the dimension of the cloud features after graph convolution to be consistent with the output of the U-Net encoder. To maintain the hierarchical features of U-Net and integrate the global information of graph convolution, we adopt residual connections. The fused features are reshaped to the original spatial dimensions and continue to participate in the upsampling and segmentation process of the U-Net decoder.
3.4. Multi-Scale Directional Edge Refiner (MSDER)
In the U-Net-based ground-based cloud map segmentation architecture, skip connections play a crucial role in fusing multi-scale features from the encoder with upsampled features from the decoder. However, traditional direct feature concatenation methods have significant limitations when handling the complex features of cloud maps. Ground-based cloud maps exhibit high irregularity and scale variability, with features at different levels often containing noise information and redundant representations. Direct fusion may lead to feature contamination and reduced segmentation accuracy.
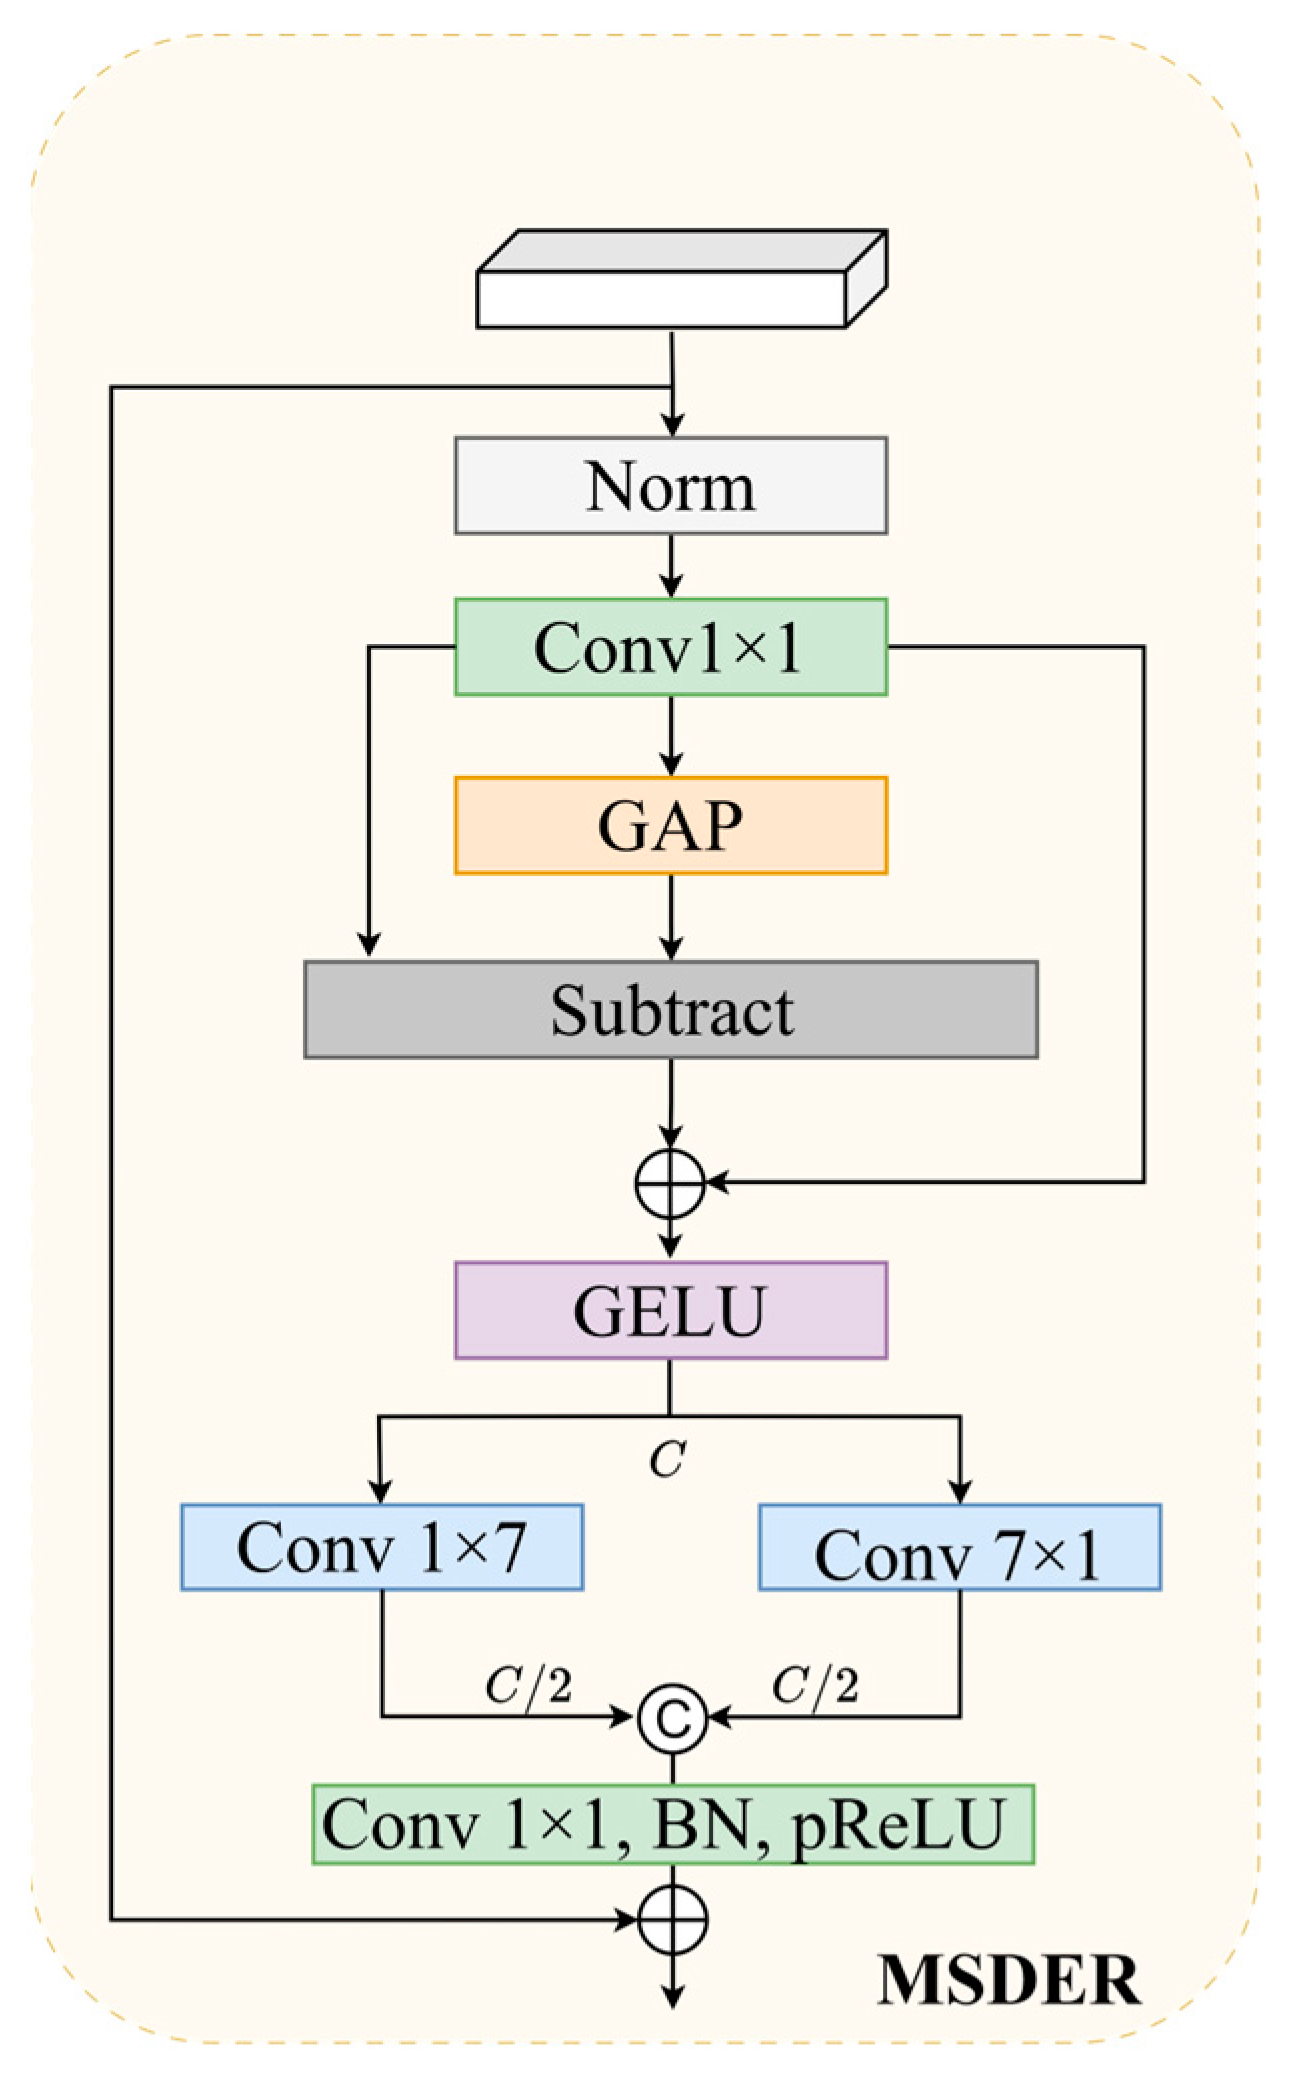
To address these challenges from a theoretical perspective, we analyze the symmetry properties inherent in cloud image features. From the perspective of graph theory symmetry, cloud map features exhibit complex symmetry and asymmetry patterns across different scales and spatial positions. The morphological distribution of cloud layers exhibits both locally symmetric texture structures and globally asymmetric spatial layouts. Therefore, we need to design a skip-connection mechanism that can adaptively model these complex symmetry relationships. Stemming from this analysis, we propose our Multi-Scale Directional Edge Refiner, which treats feature fusion as a graph-based information propagation process. Based on this, we propose the Multi-Scale Directional Edge Refiner (MSDER), which (as shown in Figure 5) models the feature fusion process in skip connections as the propagation of symmetry information between graph nodes using graph neural network ideas, thereby achieving intelligent aggregation and noise suppression of multi-scale features in cloud images.
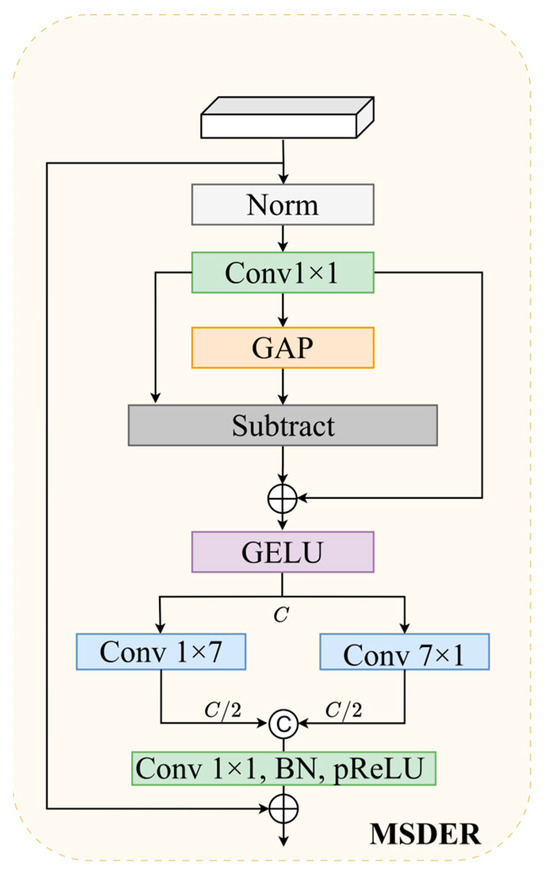
Figure 5.
MSDER module structure diagram.
The core innovation of MSDER lies in its specialized handling of cloud boundary characteristics through directional processing. The Multi-Scale Directional Edge Refiner optimizes for the challenges of blurred cloud boundaries and irregular shapes in cloud image segmentation by introducing residual edge enhancement and multi-scale directional convolution mechanisms into the U-Net skip connection—the primary component focuses on enhancing local edge information while suppressing background interference. This module first highlights local edge texture information through residual edge enhancement operations—global average pooling (GAP) extracts the global background context information of the feature map, and subtracting the original features from this global pooling result effectively removes background interference and highlights local detail differences. These results are then added to the original features to form residual connections, which maintain feature integrity while enhancing edge response. Following edge enhancement, we apply directional feature extraction to capture the complex boundary patterns characteristic of cloud formations. Subsequently, asymmetric convolution kernels of 1 × 7 and 7 × 1 are applied to capture edge features in different directions on the enhanced features. Since cloud boundaries often exhibit complex directional features and lack clear geometric shape constraints and traditional symmetric convolution kernels struggle to effectively capture these subtle edge changes, this module employs a cascaded processing approach of first performing edge enhancement followed by directional feature extraction, enabling more accurate identification and preservation of the blurred boundaries between clouds and the sky, thereby significantly improving segmentation accuracy. For segmentation tasks involving non-rigid structural targets like cloud images, specialized edge enhancement mechanisms are required to address their boundary blurring issues.
3.5. Uncertainty-Driven Loss Optimizer (UDLO)
In the task of ground-based cloud image segmentation, the number of foreground (cloud feature) pixels is significantly different from that of background pixels. Traditional loss functions do not consider the difference in category importance, which often leads the model to predict the majority background category and ignore key foreground features. The inherent challenge in binary cloud image segmentation stems from the distinct characteristics of different regions: cloud areas contain rich textural information, while sky regions are relatively homogeneous, causing models to disproportionately focus on cloud features. This natural bias leads to severe false-positive problems, where the model’s attention becomes heavily concentrated on textured cloud regions at the expense of accurate sky region identification.
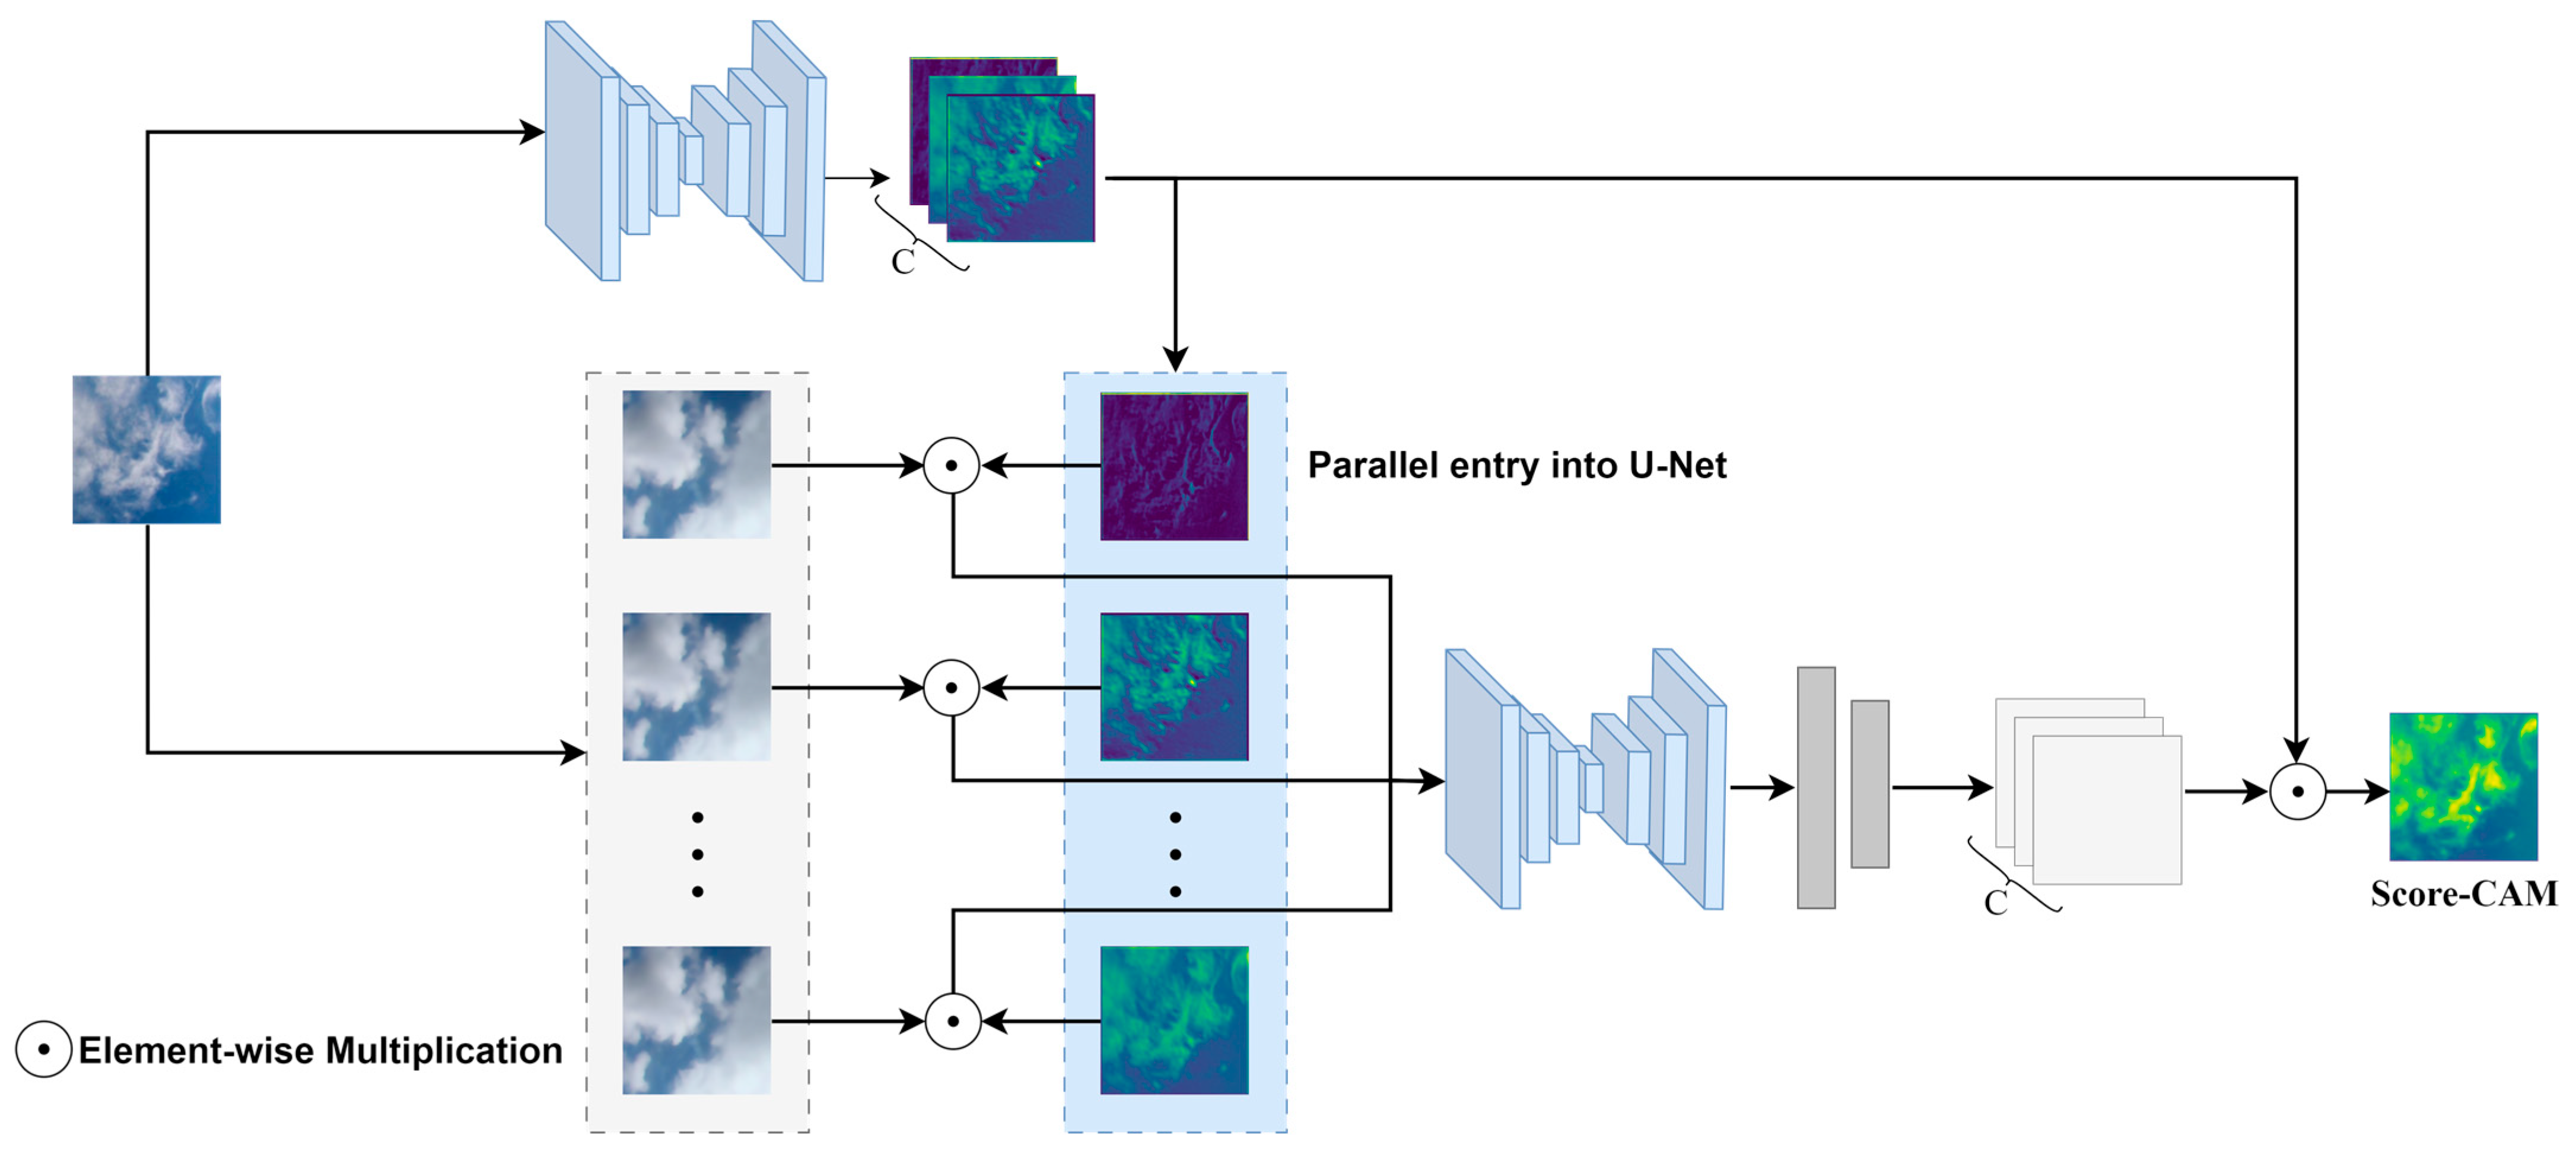
To systematically mitigate this class imbalance challenge, we develop a dynamic weighting mechanism based on real-time model performance assessment. To address this issue, we utilize Score-Weighted Visual Explanations for Convolutional Neural Networks (Score-CAM) [27] to generate activation maps that can highlight the foreground features. CAM visualizations (Figure 6) serve a dual purpose: they not only reveal the model’s current attention distribution but also provide clear evidence of the imbalanced classification scenario that necessitates dynamic intervention. These visualizations demonstrate how unweighted attention maps exhibit excessive focus on cloud regions while neglecting sky regions, thereby motivating our uncertainty-driven loss optimization approach.
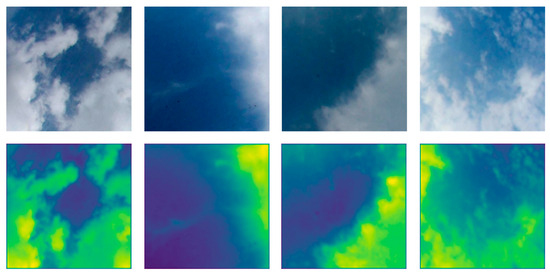
Figure 6.
CAM visualizations.
Based on this map, we calculate the hit rate of each category and then dynamically adjust the weights of the loss function, enabling the model to focus more on the foreground category during training and providing an uncertainty quantification tool for the reliability analysis of meteorological networks. Our uncertainty quantification mechanism operates through periodic assessment; we calculate CAM every 5 epochs during training to evaluate the model’s current attention distribution and confidence levels. These activation patterns inform the dynamic updating of uncertainty weights, transforming traditional static loss weighting into an adaptive, uncertainty-aware optimization strategy. This approach effectively counterbalances the model’s natural tendency to over-attend to textured regions, thereby reducing false-positive rates and improving overall segmentation performance.
Definition (Score-CAM) As illustrated in Figure 7, Score-CAM builds upon Grad-CAM’s foundation by employing score-based gradients instead of logit-derived ones, enhancing the accuracy of spatial localization [28]. The core formula for Score-CAM (the structure diagram is shown in Figure 2) is the following:
where denotes the Channel-wise Increase of Confidence (CIC) for activation map . CIC is defined as follows:
where
where is the normalization function that maps each element in the input matrix to [0, 1] and denotes the operation that upsamples into the input size; is the baseline, and is the input.
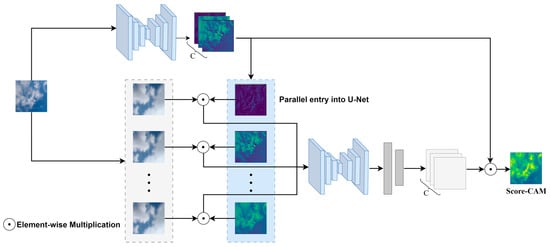
Figure 7.
Score-CAM structure diagram.
Score-CAM extracts the features in Stage 1. Subsequently, the system applies each mask to the source image iteratively, computing corresponding class-specific scores. This second phase executes N iterations matching the count of active feature maps. The final output emerges from weighted combinations of scores and their corresponding activation maps. Both initial and secondary phases utilize a shared CNN architecture for feature extraction. Hereafter, Score-CAM will be abbreviated as ‘CAM’.
The foundation of our approach is the quantitative measurement of model attention to different categories through hit-rate calculation. For each category , the hit rate is defined as follows:
where represents the set of pixels belonging to category c and is the activation value at the spatial position . The CAM value dynamically reflects the model’s sensitivity to different categories in the current training state, enabling the weight adjustment to respond in real time to the model’s learning progress. Utilizing this hit-rate measurement, we design an adaptive weight calculation mechanism that inversely correlates with model confidence. Based on the hit rate of each category, the adaptive weight for each category is calculated using an exponential decay function:
The negative exponent ensures that categories with higher hit rates receive lower weights, while those with lower hit rates receive higher weights, achieving the design goal of “paying attention to the weak categories”. The exponential function nonlinearly amplifies small differences, enabling even minor differences in hit rates to produce significant weight adjustment effects, enhancing the model’s sensitivity to class imbalance. The range of the number function avoids the extreme situation of zero weights, ensuring that all categories can receive certain training attention. For binary segmentation tasks, we implement a relative weighting scheme that maintains numerical stability. The relative weight ratio is the following:
To ensure numerical stability and prevent extreme weight values, we apply weight truncation:
Finally, we integrate these adaptive weights into the loss function to achieve end-to-end optimization. Applying the calculated weights to the BCE loss function, the updated loss function is as follows:
where represents the sample size and and represent the true label and the predicted probability, respectively. This weighted loss-function mechanism achieves a transformation from the “static category statistics” to the “dynamic attention distribution” weight adjustment paradigm. During the training process, it enables the model to pay more attention to the foreground category, thereby improving its segmentation performance for the key features of the cloud image.
This design achieves end-to-end optimization from the attention mechanism to the loss function, converting the internal attention distribution of the model into a guiding signal for the training process, providing theoretical support and practical solutions for the imbalance problem of foreground and background in cloud image segmentation. To create a robust training objective, we combine multiple loss components with complementary properties. We combine the binary cross-entropy (BCE) loss with Dice loss, which is calculated as follows:
where λ is a hyperparameter. The Dice loss is not affected by the size of the foreground, and the BCE loss can play a guiding role for the Dice loss in the network learning process.
4. Experiments
To validate the superiority of the Uncertainty-Quantified Geometric Paradigm via Hierarchical Graph Networks (G-CLIP) proposed in this paper, we compare it with representative semi-supervised segmentation methods—U-Net [18], Att-UNet [19], Swin-Unet [21], Laplacian [22], MA-SegCloud [23], CSWin-UNet [24], Rolling-Unet [25], and UNeXt [26]—for a comprehensive comparison.
4.1. Datasets
We conducted experiments on four datasets: SWINSEG/SWIMSEG [29], TCDD [30], and HRC_WHU [31].
The SWIMSEG and SWINSEG datasets were developed by Nanyang Technological University, Singapore, for sky/cloud image segmentation research. SWIMSEG contains 1013 sky/cloud images captured using the ground-based Wide-Angle High-Resolution Sky Imaging System (WAHRSIS), equipped with a Canon EOS Rebel T3i (EOS 600D) (manufactured by Canon Inc., in Tokyo, Japan) camera body and a Sigma 4.5 mm F2.8 EX DC HSM Circular Fish-eye Lens (manufactured by Sigma Corporation, headquartered in Kawasaki, Kanagawa, Japan.) with a 180-degree field of view. The captured images undergo comprehensive preprocessing, including vignetting correction, color calibration using an 18-patch color checkerboard reference, and geometric distortion correction. The final undistorted images have dimensions of 600 × 600 pixels, with a 68-degree viewing angle. SWINSEG comprises 115 carefully selected diverse images captured between January and December 2016, representing various weather conditions, cloud coverage patterns, and seasonal variations. These images are processed to 500 × 500-pixel dimensions using ray-tracing techniques for distortion correction. Ground-truth annotations for both datasets were performed in collaboration with experts from the Singapore Meteorological Service, ensuring professional accuracy in cloud/sky segmentation labeling.
The TCDD (Tianjin Cloud Detection Database), released in 2023, encompasses 2300 ground-based cloud images collected over a one-year period (2019–2020) from nine provinces across China. This geographical diversity ensures comprehensive coverage of various climate zones and weather patterns. The dataset is divided into 1874 training images (first nine months) and 426 test images (last three months), maintaining temporal separation to prevent data leakage. Images are captured by visual sensors and stored in PNG format at 512 × 512-pixel resolution, with corresponding binary cloud masks jointly annotated by meteorologists and cloud detection researchers.
The HRC_WHU dataset provides 150 high-resolution satellite and aerial images, with spatial resolutions ranging from 0.5 to 15 m, collected from Google Earth across diverse global regions. The dataset covers five major land-cover types—water bodies, vegetation, urban areas, snow/ice surfaces, and barren land—ensuring robust evaluation across different surface backgrounds. Each RGB image is accompanied by precisely delineated cloud masks created using Adobe Photoshop’s lasso and magic wand tools (tolerance: 5–30) by remote-sensing interpretation specialists. This dataset is particularly valuable for evaluating fine-grained segmentation capabilities and boundary preservation in high-resolution imagery, demonstrating the applications of multi-source optical data fusion.
4.2. Implementation Details
Experimental setup utilized Python version 3.10 with PyTorch 2.4.0 and CUDA 12.4. Model development and evaluation employed an NVIDIA RTX A6000 GPU with 48GB memory (Santa Clara, CA, USA). Training configurations for SWIMSEG, SWINSEG, TCDD, and HRC_WHU datasets included: starting learning rate of 5 × 10⁻⁴ with AdamW optimization, implementing cosine annealing to decrease the rate to 5 × 10⁻⁶ [M1] [xs2]; batch configuration of 4 samples across 100 epochs; input/output dimensions maintained at 224 × 224 pixels; stochastic Gaussian noise augmentation applied at 50% probability (Table 1). Binary cross-entropy served as the optimization criterion across all architectures. The framework automatically preserved optimal parameters whenever validation metrics showed improvement (Table 2).

Table 1.
Performance comparison of various models in processing four images of size 224 × 224, measuring FLOPs, parameters, and GPU inference time across different model architectures.

Table 2.
Hyperparameter settings of each model component and training configuration used in our experiments.
4.3. Evaluation Metrics
To comprehensively evaluate the performance of our proposed method, we employ four widely-adopted evaluation metrics: recall, F1-score, error rate, and mean Intersection over Union (mIoU). These metrics provide complementary perspectives on model performance across different aspects of the prediction task.
Recall measures the proportion of actual positive instances that are correctly identified by the model. It is particularly important in scenarios where missing positive cases have significant consequences. Error rate quantifies the proportion of incorrect predictions made by the model, providing a straightforward measure of classification accuracy. The F1-score provides a harmonic mean of precision and recall, offering a balanced assessment of model performance when both false positives and false negatives are equally important. Mean Intersection over Union (mIoU) is used to evaluate pixel-level prediction accuracy. The metrics are defined as follows:
where TP refers to the correctly identified foreground elements in the prediction output; TN corresponds to accurately recognized background elements; FP indicates regions mistakenly classified as foreground in the prediction but are actually background, as per the ground truth; conversely, FN denotes areas incorrectly labeled as background in the prediction, despite being foreground in the ground-truth annotation.
4.4. Comparison Experiments
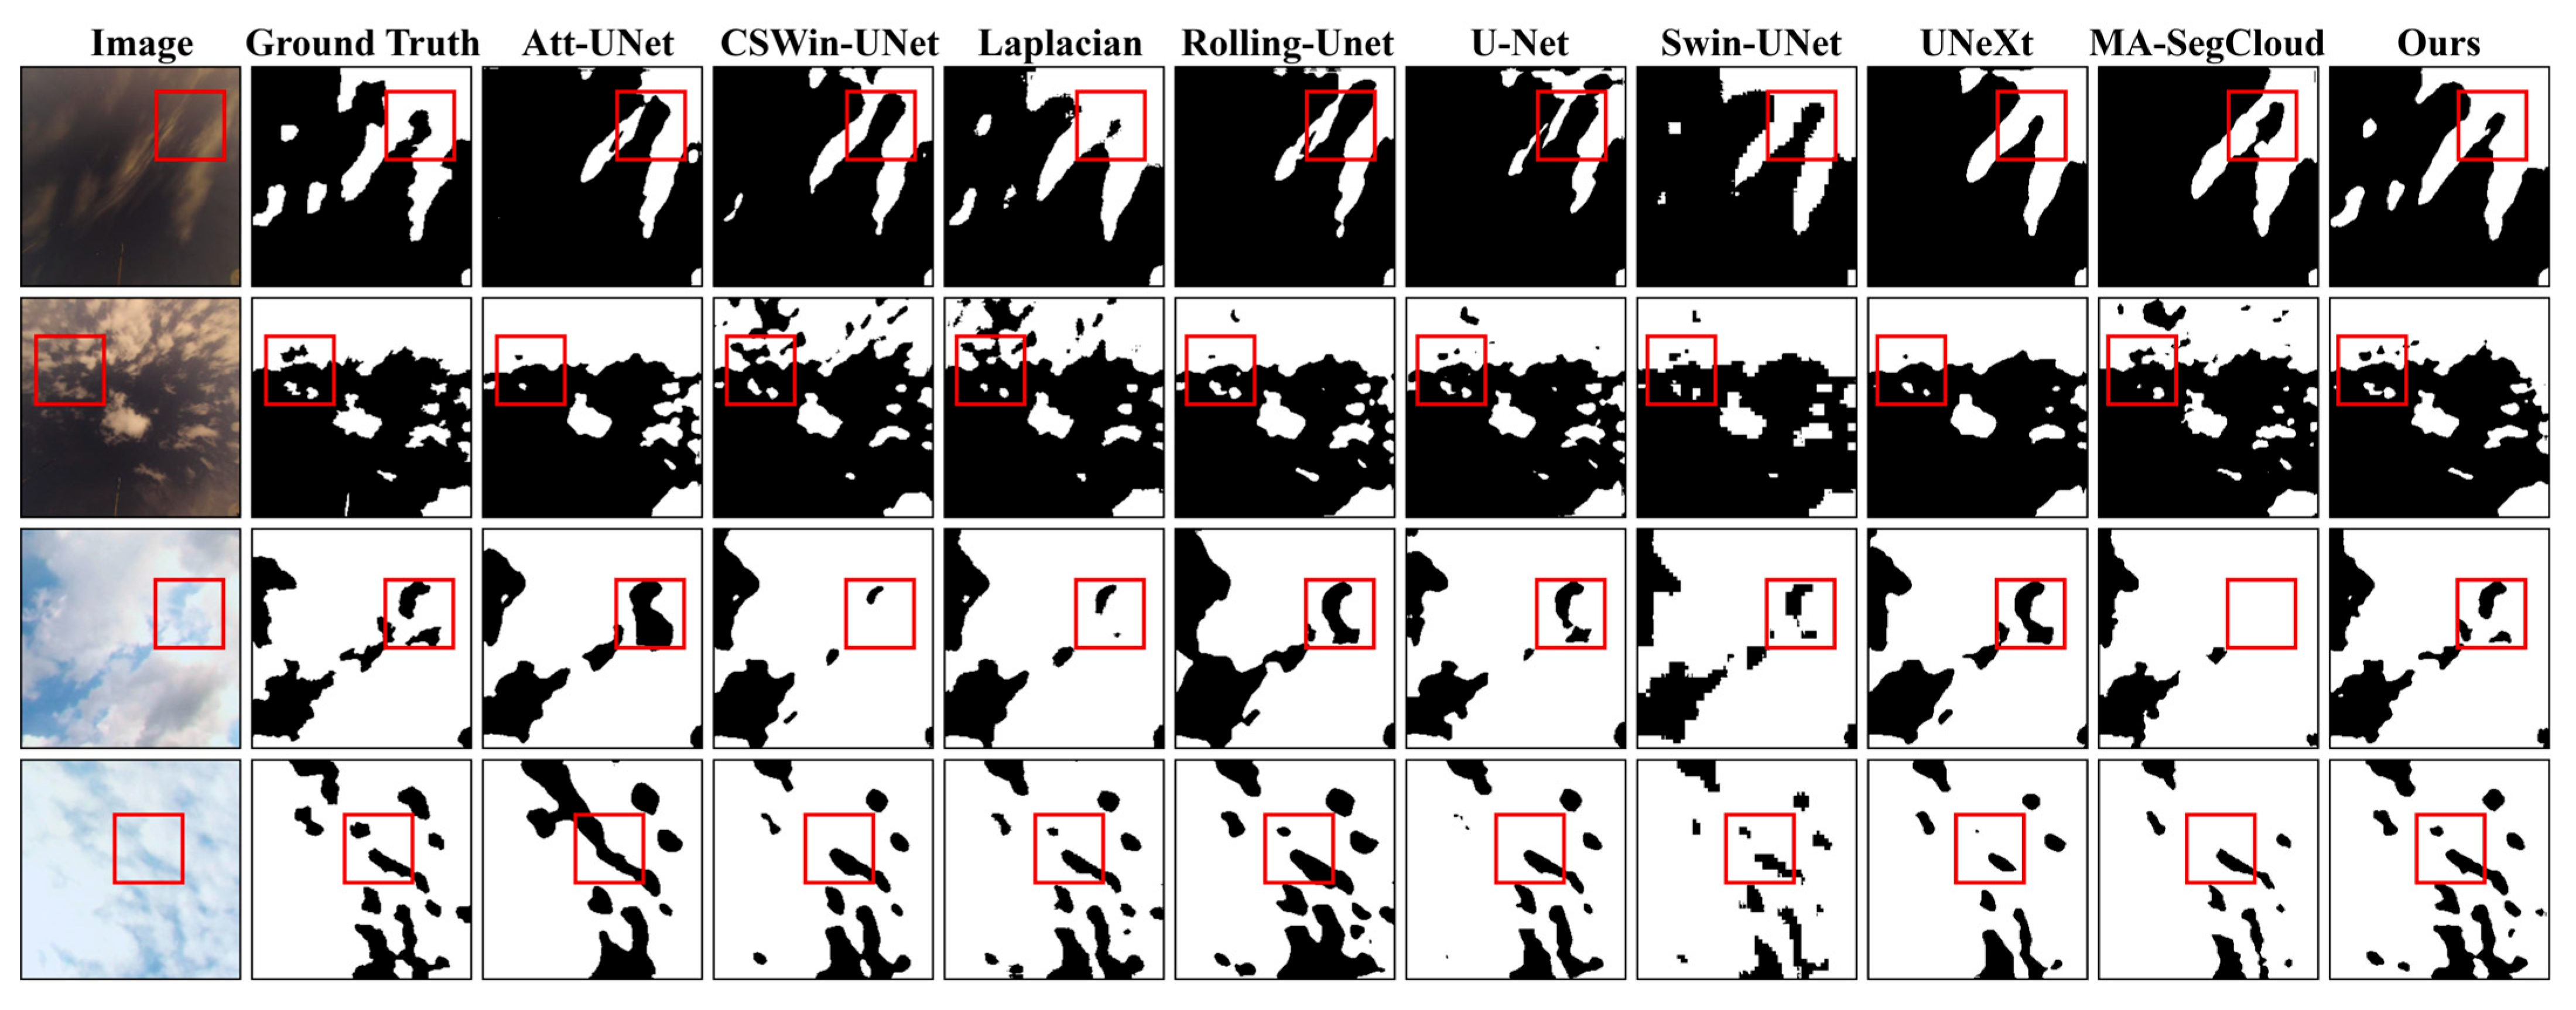
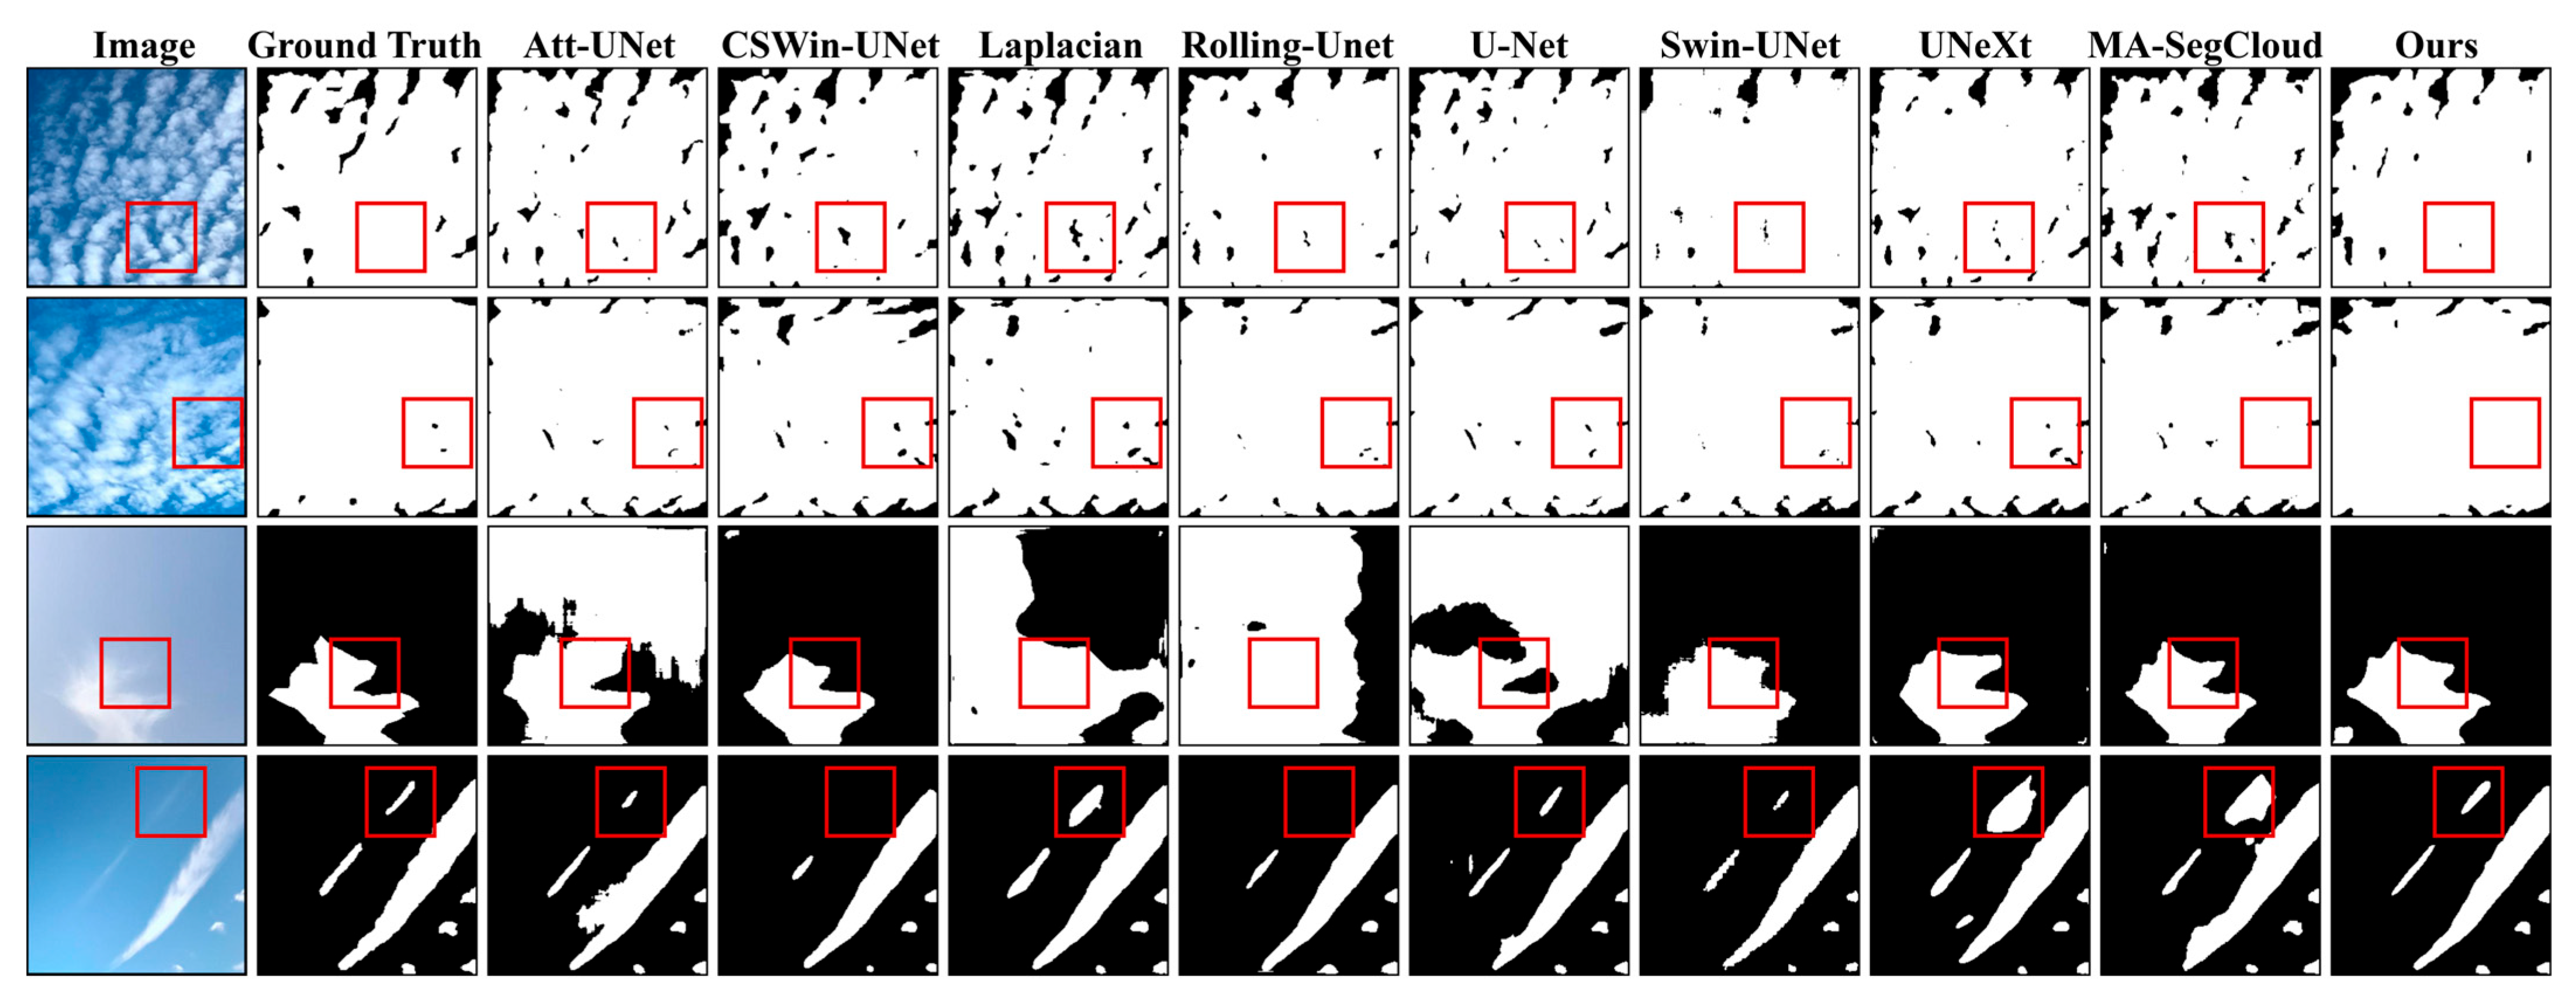
The segmentation results from the SWIMSEG and SWINSEG datasets (Figure 8) demonstrate the superior performance of the proposed method under different lighting conditions: in terms of cloud boundary accuracy, the proposed method can more accurately identify cloud boundaries than other methods, especially in the complex cloud structure in the first row, avoiding the common over-segmentation issue in traditional methods; in terms of shape preservation, in the different cloud types in rows 2–4, the proposed method better preserves the intact shape of cloud layers, reducing fragmented segmentation; in terms of foreground–background balance, thanks to the UDLO module, it can still accurately identify rare cirrus clouds in scenes with fewer foreground cloud regions, avoiding the tendency to predict the background. Specifically, in the red-boxed region analysis, in the red box of the first row (complex cloud layer boundaries), the PDAA clustering attention mechanism effectively identifies local cloud cluster structures, avoiding incorrect segmentation at complex boundaries by other methods. SAGCL constructs a graph structure using cosine similarity, accurately modeling semantic relationships between cloud layers to achieve precise boundary localization. In the second row of red boxes (dense cloud regions), the SAGCL module constructs a sparse graph structure using k-nearest neighbors to handle complex connection relationships in dense cloud regions. Graph convolutions better propagate cloud layer feature information than traditional convolutions, reducing segmentation discontinuities. In the red box on lines 3–4 (blurred boundary regions), the MSDER multi-scale directional boundary refinement unit uses and -long kernel convolutions to effectively capture weak boundary information in horizontal and vertical directions. The UDLO module dynamically adjusts loss weights to make the model focus more on difficult-to-identify boundary regions.
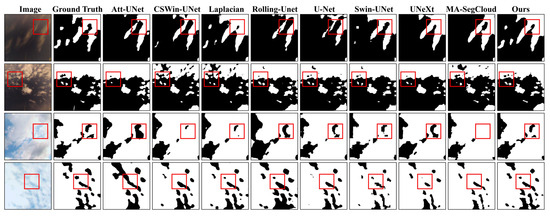
Figure 8.
Comparison test results of SWIMSEG and SWINSEG datasets.
The experimental results from the TCDD dataset (Figure 9) demonstrate that the proposed method exhibits significant advantages in complex scenarios across multiple geographical environments. In terms of graph structure modeling, the SAGCL module effectively adapts to changes in cloud layer morphology across different geographical environments by constructing graph structures, establishing semantic dependencies between distant pixels, which is crucial for identifying large-scale cloud systems. It accurately captures the irregular shape features of cumulus clouds within complex structures, overcoming the limitations of traditional convolutional methods. Simultaneously, the clustering and grouping attention mechanism identifies texture consistency within cumulus clouds, reducing internal segmentation discontinuity issues and maintaining high-precision boundaries of cumulus clouds. In terms of detail preservation, the proposed method maintains clear segmentation boundaries, even in cases of thin clouds or cirrus clouds with blurred boundaries. The multi-scale directional boundary refinement units of the MSDER module capture the horizontal extension boundary features of stratus clouds through long kernel convolutions. The gated feature fusion mechanism dynamically adjusts the fusion process to enhance the accuracy of blurred boundary identification. Additionally, the graph structure establishes long-distance semantic associations, connecting similar stratus cloud regions and avoiding discontinuities at gradient boundaries. In terms of noise suppression, compared to other methods, the proposed method demonstrates stronger noise resistance when handling complex backgrounds.
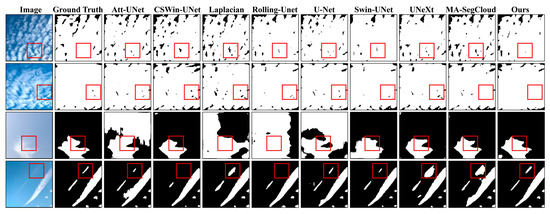
Figure 9.
Comparison test results of TCDD dataset.
Furthermore, analyzing the red-boxed regions from the first to the fourth rows further highlights the advantages of each module. In scenarios with dense cloud clusters, the sparse graph structure of the SAGCL module effectively models the spatial relationships between cloud clusters, enabling accurate separation. The PDAA module enhances the consistency of internal features within cloud clusters, maintaining their integrity while accurately identifying boundaries. For cirrus cloud filament structures, the MSDER module’s multi-directional long kernel convolution and channel-adaptive adjustment unit perform exceptionally well, making it suitable for processing the linear extension structures of cirrus clouds. It enhances the local difference features of filament boundaries, offering a natural advantage over traditional square convolution kernels. Meanwhile, the SAGCL module connects different parts of cirrus cloud filaments through graph structures to avoid fragmentation issues, and the UDLO module ensures the model adequately focuses on rare cirrus clouds. In contrast, methods such as Att-UNet and CSWin-UNet exhibit boundary blurring and shape distortion in cumulus red-box regions, while U-Net and Swin-UNet encounter boundary identification errors at the boundary between stratus clouds and the sky. Laplacian and Rolling-Unet produce segmentation fragmentation in densely clustered cloud regions, MA-SegCloud exhibits cloud cluster boundary confusion, and Transformer-based methods like UNeXt and CSWin-UNet perform poorly in handling cirrus cloud filament structures. Traditional U-Net series methods are limited by their receptive field and cannot effectively capture the long-distance continuity of cirrus clouds. Overall, whether in the dry northern environment or the humid southern conditions, the SAGCL module’s adaptability effectively captures local cloud layer features, and the PDAA module’s clustering/grouping mechanism adapts to differences in cloud layer feature distributions across various geographical environments. Additionally, the proposed method accurately identifies cumulus cloud block structures and clear boundaries, effectively handles the extensive coverage and gradual boundaries of stratus clouds, successfully separates dense cloud clusters while maintaining integrity, and accurately captures the filamentous structures and directional characteristics of cirrus clouds.
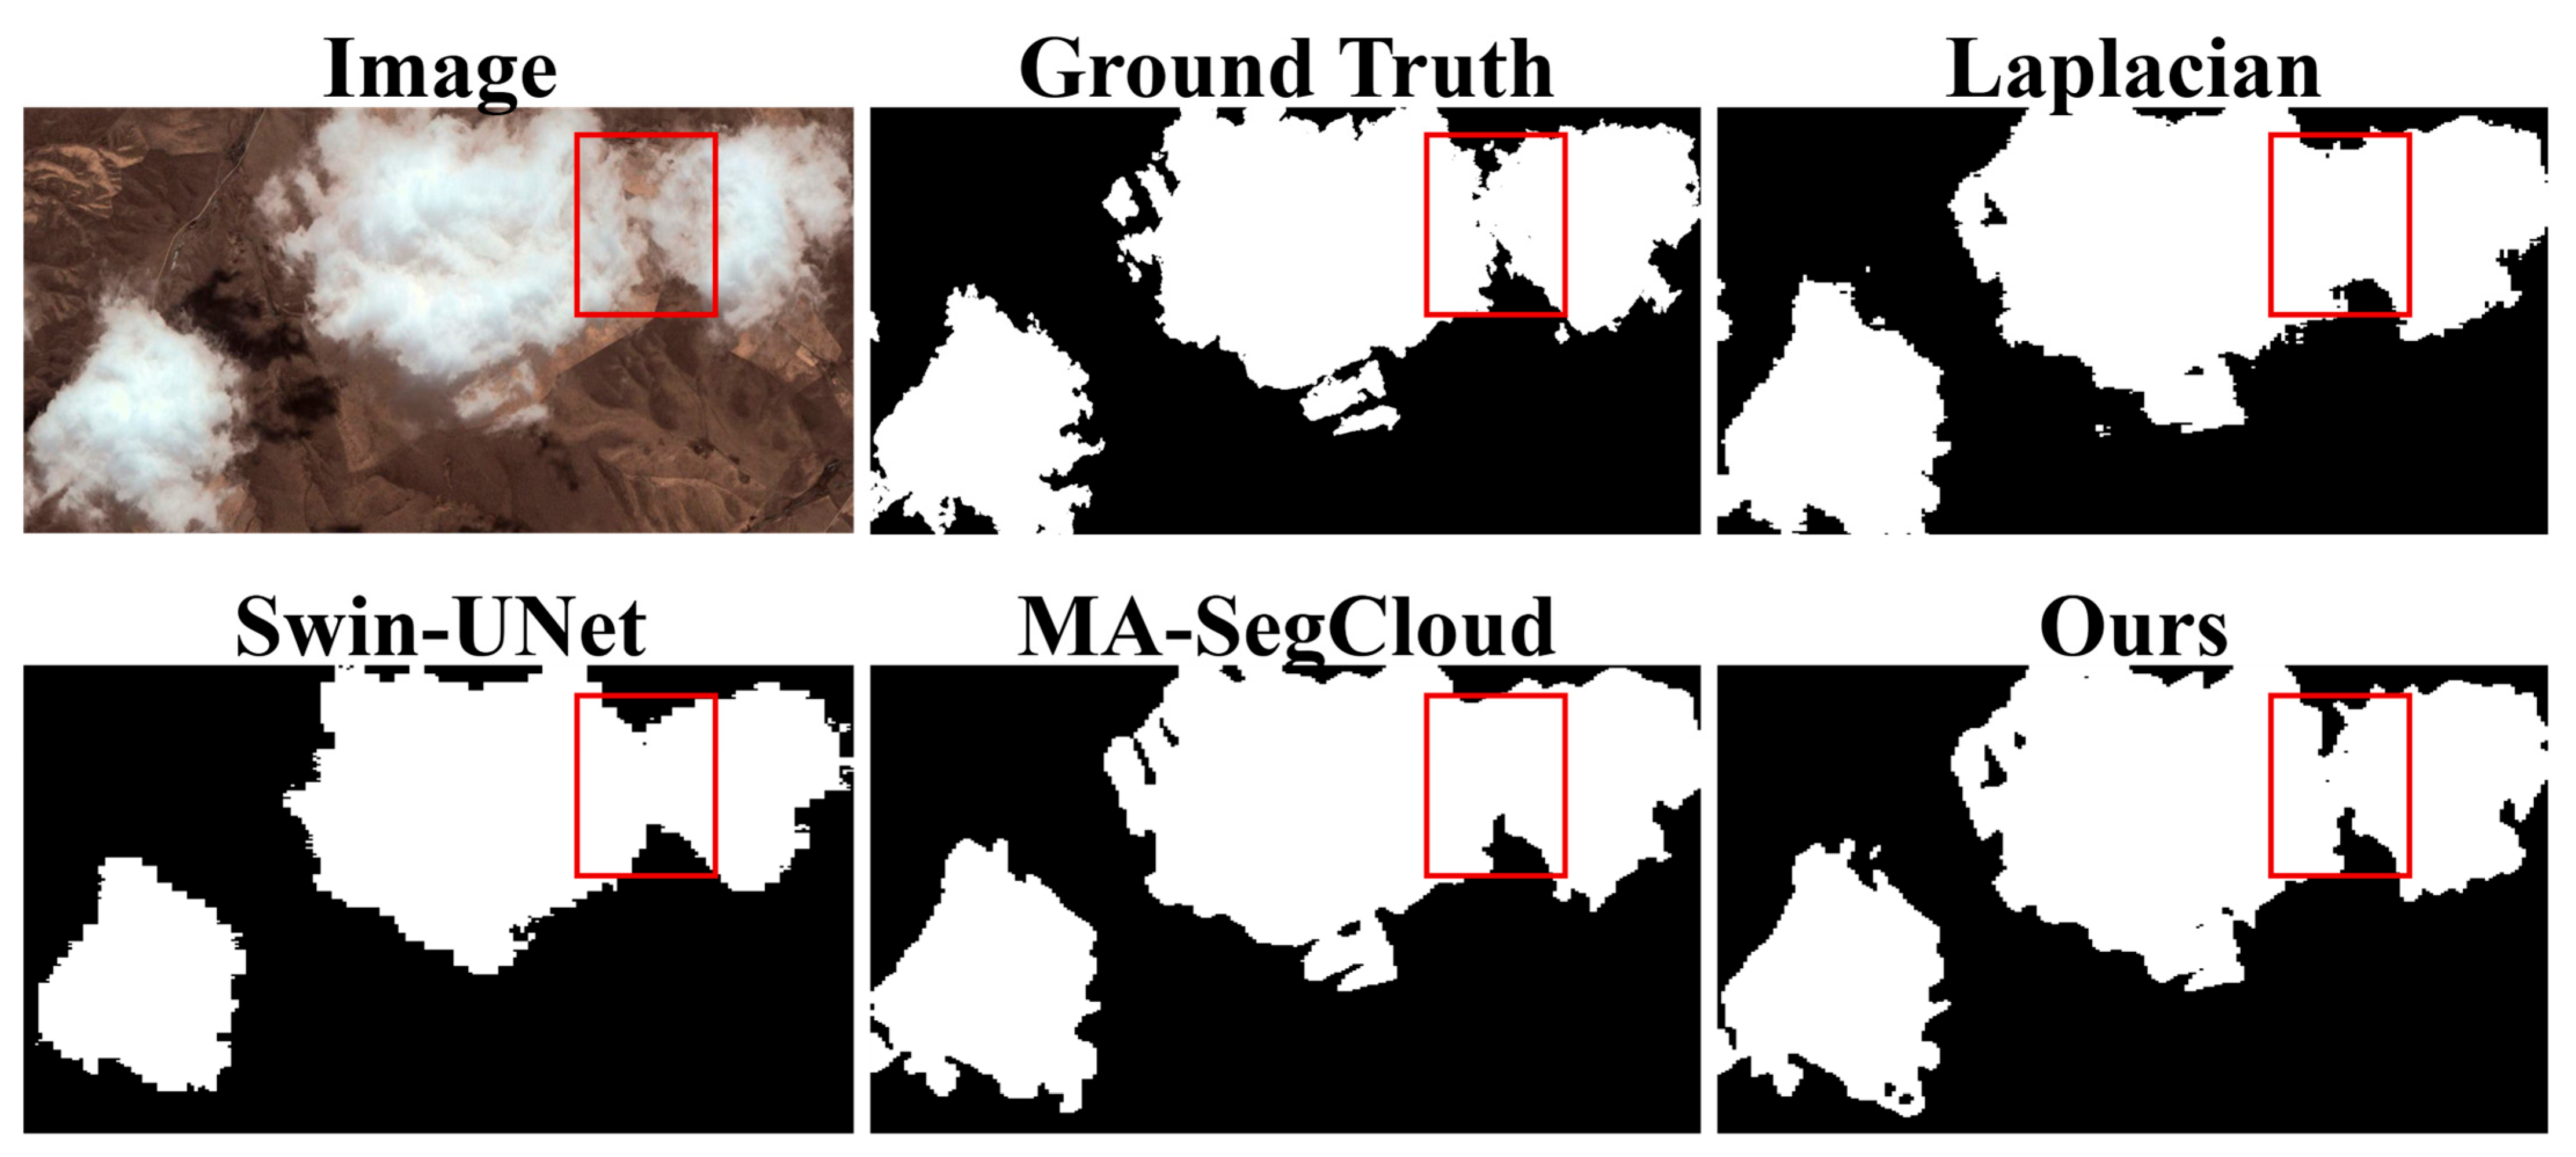
In the high-resolution scenes included in the HRC_WHU dataset (Figure 10), the MSDER module demonstrates significant multi-scale feature fusion capabilities in terms of fine boundary processing, effectively handling fine boundary information at resolutions ranging from 0.5 to 15 m. In terms of integrity preservation, the MSDER module achieves significantly superior performance in accurately locating cloud boundaries and maintaining integrity to the comparison methods. Analysis of the red-boxed regions shows that in high-resolution detail areas, the MSDER module’s channel-adaptive adjustment unit (CAAU) and multi-scale directional boundary refinement unit (MSDBR) work synergistically to effectively process fine features in high-resolution images. From a graph theory symmetry perspective, this module models the complex symmetrical relationships between cloud map features at different scales, achieving intelligent feature aggregation.
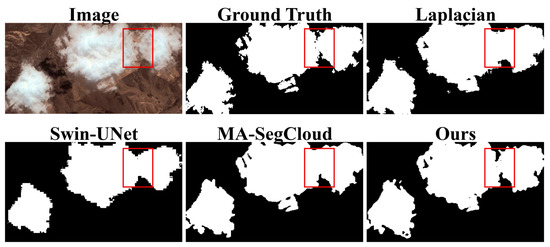
Figure 10.
Comparison test results of HRC_WHU dataset.
As shown in Table 3, under daytime conditions, our method achieved the best performance in all evaluation metrics. The recall rate reached 93.08%, which is 3.30 percentage points higher than the 89.78% achieved by the second-best method, UNeXt. the F1-score reached 92.56%, surpassing UNeXt’s 91.00% by approximately 1.56 percentage points; the error rate is reduced to 6.07%, a decrease of 1.24 percentage points compared to UNeXt’s 7.31%; MIoU reached 87.32%, an improvement of 2.52 percentage points over UNeXt’s 84.80%. This significant improvement is primarily attributed to the clustering and grouping attention mechanism of the PDAA module, which effectively identifies cloud cluster structures under daytime lighting conditions. Meanwhile, the SAGCL module accurately models the complex spatial relationships between cloud layers by constructing a graph structure based on cosine similarity.

Table 3.
Results of the comparison experiments on the SWINSEG and SWIMSEG dataset (best results are labeled in red, second in blue).
Nighttime scene segmentation tasks are more challenging, but our method still maintains a leading advantage. Recall reached 86.76%, an improvement of 0.89 percentage points over the best comparison method, Swin-UNet’s 85.87%; the F1-score is 88.02%, significantly surpassing Swin-UNet’s 85.80% by approximately 2.22 percentage points; the error rate is reduced to 10.01%, a decrease of 1.26 percentage points compared to Swin-UNet’s 11.27%; MIoU reached 79.62%, an improvement of 2.90 percentage points over Swin-UNet’s 76.72%. The performance improvement under nighttime conditions is primarily attributed to the multi-scale directional boundary refinement capability of the MSDER module, which effectively captures weak boundary information under low-light conditions at night through 1 × 7- and 7 × 1-long kernel convolutions.
On a mixed dataset of daytime and nighttime scenes, our method demonstrates strong generalization capabilities, achieving a recall of 92.41%, an F1-score of 92.08%, an error rate of only 6.49%, and an MIoU of 86.51%. Compared to the next-best method, UNeXt, we achieved a 3.48 percentage-point improvement in recall, a 1.72 percentage-point improvement in F1-score, a 1.32 percentage-point reduction in error rate, and a 2.67 percentage-point improvement in MIoU. This comprehensive performance enhancement validates the effectiveness of the UDLO module in addressing foreground–background imbalance issues.
Table 4 presents the experimental results from the TCDD dataset. This dataset covers multiple geographical environments across nine provinces in China, featuring higher scene complexity and geographical diversity. Our method achieves state-of-the-art performance on key metrics: MIoU reaches 78.77%, an improvement of 1.62 percentage points over the second-best method, Att-UNet, which achieves 77.15%; the error rate was reduced to 7.98%, a decrease of 0.50 percentage points compared to the best comparison method, CSWin-UNet, which achieved 8.48%, and it tied with Rolling-Unet for the best performance on the recall metric, achieving 87.41%.

Table 4.
Results of the comparison experiments on the TCDD dataset (best results are labeled in red, second in blue).
It is worth noting that on the TCDD dataset, the F1-score of the traditional U-Net method (83.22%) is higher than that of our method (82.47%), which may be related to the specific data distribution and annotation characteristics of this dataset. However, we still maintain a significant advantage in the more important MIoU metric, indicating that our method remains superior in overall segmentation quality. The SAGCL module plays a crucial role in handling the complex cloud layer topology across multiple geographical environments, effectively capturing the morphological characteristics of clouds under different geographical conditions through adaptive graph structure modeling.
Table 5 shows the experimental results from the high-resolution HRC_WHU dataset. This dataset features high resolution ranging from 0.5 to 15 m, imposing higher demands on the method’s ability to preserve details. Our method achieves the best performance across all evaluation metrics: recall reaches 92.12%, an improvement of 1.19 percentage points over the second-best method, Swin-UNet, which achieved 90.93%; the F1-score is 92.60%, surpassing the second-best method CSWin-UNet’s 92.23% by approximately 0.37 percentage points; the error rate is reduced to 5.25%, approaching CSWin-UNet’s 5.23%; and MIoU reaches 86.42%, an improvement of 0.54 percentage points over the second-best method CSWin-UNet’s 85.88%.

Table 5.
Results of the comparison experiments on the HRC_WHU dataset (best results are labeled in red, second in blue).
The outstanding performance on high-resolution datasets is primarily attributed to the multi-scale feature fusion capability of the MSDER module. This module effectively processes fine boundary information in high-resolution images through the synergistic action of the channel-adaptive adjustment unit (CAAU) and the multi-scale directional boundary refinement unit (MSDBR), ensuring the accurate localization and integrity of cloud boundaries.
Based on the experimental results from the three datasets, our method achieves the best performance in the key metric MIoU, with an average improvement of 2–3 percentage points, demonstrating the universality and effectiveness of the method. From daytime to nighttime, from simple to complex scenes, and from low to high resolution, our method shows good adaptability and robustness. Qualitative analysis reveals that our method excels in handling complex cloud boundaries, particularly in cases of thin clouds or cirrus clouds with blurred boundaries, maintaining clear and accurate segmentation boundaries. Additionally, the PDAA module effectively reduces computational complexity while maintaining segmentation accuracy through its clustering-based attention mechanism, providing practical feasibility for real-world applications.
4.5. Ablation Study
The ablation experiment results (Table 6) clearly demonstrate the effectiveness and synergistic effects of the four innovative modules proposed in this paper. Specifically, the SAGCL module shows the most significant effect. Compared with the baseline U-Net, adding SAGCL alone significantly improves recall from 84.86% to 93.81% (+8.95%) and MIoU from 80.87% to 84.12% (+3.25%). This demonstrates the superiority of the symmetry-adaptive graph convolutional layer in modeling long-range semantic associations between cloud layers. By modeling cloud pixels as graph nodes and constructing a graph structure based on cosine similarity, it effectively captures the complex topological characteristics of cloud layers. The PDAA module achieves a balance between computational efficiency and performance. Using PDAA alone improves the F1-score to 90.04% (+1.90%) and MIoU to 84.12% (+3.25%). The clustering attention mechanism, which combines K-means dynamic clustering and intra-group attention calculation, effectively enhances feature representation quality while reducing computational complexity. The MSDER module introduces relatively moderate improvements; adding MSDER alone only increases MIoU by 1.26% to 82.13%, but it lays the foundation for subsequent module combinations. The uncertainty-aware gate fusion module primarily optimizes the feature fusion process in skip connections, with its effects becoming more pronounced when combined with other modules.

Table 6.
Ablation study on the four datasets.
The SAGCL + PDAA combination demonstrates good synergy, with the two modules combined achieving an F1-score of 91.28% and an error rate of 7.26%, validating the design approach of “clustering and grouping followed by graph convolution”. Clustering and grouping provide a better local feature foundation for graph convolution, while graph convolution further establishes global associations across cloud clusters. After combining the three modules (SAGCL + PDAA + MSDER), the F1-score reached 91.76%, MIoU improved to 86.00%, and the error rate dropped to 6.85%. This indicates that the uncertainty-aware gated fusion module plays a crucial role in multi-scale feature integration, enhancing overall performance through intelligent aggregation and noise suppression. When all four modules are enabled, all metrics reach optimal levels: recall 92.41%, F1-score 92.08%, error rate 6.49%, and MIoU 86.51%. UDLO effectively addresses the foreground–background imbalance issue through CAM technology and adaptive weight adjustment, enabling the model to focus more on difficult-to-identify cloud-type features during training.
5. Conclusions
This work establishes a novel paradigm for graph symmetry-driven ground-based cloud image segmentation through the proposed G-CLIP framework, which systematically integrates four modules—PDAA, SAGCL, MSDER, and UDLO—to address core challenges in graph structure modeling, uncertainty quantification, and diagnostic reliability within meteorological imaging systems. The key theoretical advances are rooted in graph theory and symmetry principles, offering a cohesive architecture for handling complex cloud formations.
The SAGCL module achieves symmetry-adaptive graph modeling by incorporating graph symmetrization and degree normalization into a sparse graph built via cosine similarity, effectively capturing topological relationships among cloud structures and contributing to a significant gain of 8.95% in recall. Complementing this, the PDAA module leverages permutation invariance to reduce computational complexity from to through dynamic clustering and group-level attention, ensuring efficient and semantically consistent feature grouping. Further enhancing the framework, the MSDER and UDLO modules introduce multi-scale directional refinement and uncertainty-aware optimization. MSDER employs asymmetric convolutions to model directional symmetries in cloud boundaries, while UDLO utilizes CAM-driven loss reweighting to handle class imbalance and quantify prediction uncertainty.
The design of the four modules follows a principled hierarchical flow that combines local feature clustering, global graph reasoning, multi-scale feature fusion, and uncertainty propagation. Specifically, local groupings generated by PDAA provide structured inputs to SAGCL, which in turn establishes robust long-range dependencies through symmetric graph operations. MSDER then refines the multi-level features with emphasis on directional edges, and UDLO aggregates uncertainty signals across the network to adaptively guide the training process. This synergistic integration is empirically validated through comprehensive ablation studies, where the full model achieves a 92.08% F1-score, outperforming any partial combination of modules and underscoring the complementary roles of each component.
Extensive validation on multiple datasets—including TCDD, which spans nine Chinese provinces—confirms the robustness and state-of-the-art performance of G-CLIP across diverse geographic and climatic conditions. The model achieved a notable +1.62% improvement in mIoU on the TCDD dataset, consistent gains in recall and F1-score on SWINSEG and SWIMSEG under both daytime and nighttime conditions, and strong results on high-resolution HRC_WHU imagery, demonstrating effective generalization across scales and sensor types. Despite these advancements, several challenges remain open for future work. These include extending the symmetry-aware framework to spatio-temporal cloud evolution modeling, integrating cross-sensor data from ground-based, satellite, and radar sources, developing end-to-end uncertainty quantification across the full pipeline, optimizing graph computations for real-time application, and improving domain adaptation for varying climate regions.
In conclusion, G-CLIP provides a unified and scalable framework that bridges graph theory symmetry with practical meteorological applications. By integrating principles from graph neural networks, uncertainty quantification, and multi-scale feature learning, this research offers a robust foundation for next-generation cloud analysis systems and promotes cross-disciplinary advances in computational meteorology.
Supplementary Materials
The following supporting information can be downloaded at: https://www.mdpi.com/article/10.3390/sym17091477/s1, Table S1: Comparison of Existing Methods and the Proposed Framework.
Author Contributions
Conceptualization, Q.X. and Z.Z.; methodology, Z.Z.; software, Y.C.; validation, Q.X., Y.C. and Z.Z.; formal analysis, G.W.; investigation, Y.C.; resources, Z.Z.; data curation, Q.X.; writing—original draft preparation, Z.Z.; writing—review and editing, Y.C.; visualization, Z.Z.; supervision, Q.X.; project administration, Y.C.; funding acquisition, Q.X. All authors have read and agreed to the published version of the manuscript.
Funding
This research received no external funding.
Data Availability Statement
The raw data supporting the conclusions of this article will be made available by the authors on request.
Conflicts of Interest
The authors declare no conflicts of interest.
References
- Brunet, G.; Parsons, D.B.; Ivanov, D.; Lee, B.; Bauer, P.; Bernier, N.B.; Bouchet, V.; Brown, A.; Busalacchi, A.; Flatter, G.C.; et al. Advancing Weather and Climate Forecasting for Our Changing World. Bull. Amer. Meteor. Soc. 2023, 104, E909–E927. [Google Scholar] [CrossRef]
- Nie, B.; Lu, Z.; Han, J.; Chen, W.; Cai, C.; Pan, W. Investigation on Ground-Based Cloud Image Classification and Its Application in Photovoltaic Power Forecasting. IEEE Trans. Instrum. Meas. 2025, 74, 1–11. [Google Scholar] [CrossRef]
- Xu, Q.; Zhang, Z.; Wang, G.; Chen, Y. Physics-Guided Multi-Representation Learning with Quadruple Consistency Constraints for Robust Cloud Detection in Multi-Platform Remote Sensing. Remote Sens. 2025, 17, 2946. [Google Scholar] [CrossRef]
- Xu, Q.; Zhang, Z.; Wang, G.; Chen, Y. Explainable Multi-Scale CAM Attention for Interpretable Cloud Segmentation in Astro-Meteorological Applications. Appl. Sci. 2025, 15, 8555. [Google Scholar] [CrossRef]
- Li, K.; Ma, N.; Sun, L. Cloud detection of multi-type satellite images based on spectral assimilation and deep learning. Int. J. Remote Sens. 2023, 44, 3106–3121. [Google Scholar] [CrossRef]
- Mohamadzadeh, S.; Ghayedi, M.; Pasban, S.; Shafiei, A.K. Algorithm of Predicting Heart Attack with using Sparse Coder. Int. J. Eng. 2023, 36, 2190–2197. [Google Scholar] [CrossRef]
- Zhang, C.; Weng, L.; Ding, L.; Xia, M.; Lin, H. CRSNet: Cloud and Cloud Shadow Refinement Segmentation Networks for Remote Sensing Imagery. Remote Sens. 2023, 15, 1664. [Google Scholar] [CrossRef]
- Liu, J.; Zhang, Z. Graph Structure Learning Boosted Neural Network for Image Segmentation. In Proceedings of the 2022 18th IEEE International Conference on Advanced Video and Signal Based Surveillance (AVSS), Madrid, Spain, 29 November–2 December 2022; pp. 1–8. [Google Scholar] [CrossRef]
- Pan, C.-H.; Qu, Y.; Yao, Y.; Wang, M.-J.-S. HybridGNN: A Self-Supervised Graph Neural Network for Efficient Maximum Matching in Bipartite Graphs. Symmetry 2024, 16, 1631. [Google Scholar] [CrossRef]
- Kovvuri, S.; Reddy, G.; Saran, B.; Adityaja, A.M.; Shigwan, S.J.; Kumar, N. UnSegGNet: Unsupervised Image Segmentation using Graph Neural Networks. arXiv 2024. [Google Scholar] [CrossRef]
- Kovvuri, R.; Saran, B.; Adityaja, A.; Saurabh, S.; Nitin, K.; Snehasis, K. UnSeGArmaNet: Unsupervised Image Segmentation using Graph Neural Networks with Convolutional ARMA Filters. arXiv 2024. [Google Scholar] [CrossRef]
- Wang, S.; Wang, Y.; Wang, M. Connectivity and matching preclusion for leaf-sort graphs. J. Interconnect. Netw. 2019, 19, 1940007. [Google Scholar] [CrossRef]
- Wang, M.; Xiang, D.; Qu, Y.; Li, G. The diagnosability of interconnection networks. Discret. Appl. Math. 2024, 357, 413–428. [Google Scholar] [CrossRef]
- Wang, M.; Wang, S. Connectivity and diagnosability of center k-ary n-cubes. Discret. Appl. Math. 2021, 294, 98–107. [Google Scholar] [CrossRef]
- Wang, M.-J.; Xiang, D.; Hsieh, S.-Y. G-good-neighbor diagnosability under the modified comparison model for multiprocessor systems. Theor. Comput. Sci. 2025, 1028, 115027. [Google Scholar] [CrossRef]
- Hamilton, W.; Ying, Z.; Leskovec, J. Inductive Representation Learning on Large Graphs. Advances in Neural Information Processing Systems. arXiv 2017. [Google Scholar] [CrossRef]
- Veličković, P.; Cucurull, G.; Casanova, A.; Romero, A.; Lio, P.; Bengio, Y. Graph Attention Networks. In Proceedings of the International Conference on Learning Representations, Vancouver, BC, Canada, 30 April–3 May 2018. [Google Scholar] [CrossRef]
- Ronneberger, O.; Fischer, P.; Brox, T. U-Net: Convolutional Networks for Biomedical Image Segmentation. In Medical Image Computing and Computer-Assisted Intervention—MICCAI 2015. MICCAI 2015; Lecture Notes in Computer Science; Navab, N., Hornegger, J., Wells, W., Frangi, A., Eds.; Springer: Cham, Switzerland, 2015; Volume 9351. [Google Scholar] [CrossRef]
- Oktay, O.; Schlemper, J.; Folgoc, L.L.; Lee, M.J.; Heinrich, M.P.; Misawa, K.; Mori, K.; McDonagh, S.G.; Hammerla, N.Y.; Kainz, B.; et al. Attention U-Net: Learning Where to Look for the Pancreas. arXiv 2018, arXiv:1804.03999. [Google Scholar] [CrossRef]
- Dosovitskiy, A.; Beyer, L.; Kolesnikov, A.; Weissenborn, D.; Zhai, X.; Unterthiner, T.; Dehghani, M.; Minderer, M.; Heigold, G.; Gelly, S.; et al. An image is worth 16 × 16 words: Transformers for image recognition at scale. arXiv 2020, arXiv:2010.11929v2. [Google Scholar] [CrossRef]
- Cao, H.; Wang, Y.; Chen, J.; Jiang, D.; Zhang, X.; Tian, Q.; Wang, M. Swin-Unet: Unet-Like Pure Transformer for Medical Image Segmentation. In Computer Vision—ECCV 2022 Workshops, Proceedings of Part III, Tel Aviv, Israel, 23–27 October 2022; Springer: Berlin, Heidelberg, 2022; pp. 205–218. [Google Scholar] [CrossRef]
- Azad, R.; Kazerouni, A.; Azad, B.; Aghdam, E.K.; Velichko, Y.; Bagci, U.; Merhof, D. Laplacian-Former: Overcoming the Limitations of Vision Transformers in Local Texture Detection. Med. Image Comput. Comput. Assist. Interv. 2023, 14222, 736–746. [Google Scholar] [CrossRef] [PubMed]
- Zhang, L.; Wei, W.; Qiu, B.; Luo, A.; Zhang, M.; Li, X. A Novel Ground-Based Cloud Image Segmentation Method Based on a Multibranch Asymmetric Convolution Module and Attention Mechanism. Remote Sens. 2022, 14, 3970. [Google Scholar] [CrossRef]
- Liu, X.; Gao, P.; Yu, T.; Wang, F.; Yuan, R.-Y. CSWin-UNet: Transformer UNet with cross-shaped windows for medical image segmentation. Inf. Fusion 2025, 113, 102634. [Google Scholar] [CrossRef]
- Liu, Y.; Zhu, H.; Liu, M.; Yu, H.; Chen, Z.; Gao, J. Rolling-Unet: Revitalizing MLP’s Abil-ity to Efficiently Extract Long-Distance Dependencies for Medical Image Segmentation. In Proceedings of the AAAI Conference on Artificial Intelligence, Vancouver, BC, Canada, 20–27 February 2024; pp. 3819–3827. [Google Scholar] [CrossRef]
- Valanarasu, J.M.J.; Oza, P.; Hacihaliloglu, I.; Patel, V.M. Medical Transformer: Gated Axial-Attention for Medical Image Segmentation. In Medical Image Computing and Computer Assisted Intervention—MICCAI 2021; Lecture Notes in Computer Science; de Bruijne, M., Cattin, P.C., Cotin, S., Padoy, N., Speidel, S., Zheng, Y., Essert, C., Eds.; Springer: Cham, Switzerland, 2021; Volume 12901. [Google Scholar] [CrossRef]
- Wang, H.; Wang, Z.; Du, M.; Yang, F.; Zhang, Z.; Ding, S.; Mardziel, P.; Hu, X. Score-CAM: Score-Weighted Visual Explanations for Convolutional Neural Networks. In Proceedings of the IEEE/CVF Conference on Computer Vision and Pattern Recognition Workshops, Seattle, WA, USA, 14–19 June 2020; pp. 24–25. [Google Scholar]
- Selvaraju, R.R.; Cogswell, M.; Das, A.; Vedantam, R.; Parikh, D.; Batra, D. Grad-CAM: Visual Explanations from Deep Networks via Gradient-Based Localization. In Proceedings of the 2017 IEEE International Conference on Computer Vision (ICCV), Venice, Italy, 22–29 October 2017; pp. 618–626. [Google Scholar]
- Dev, S.; Nautiyal, A.; Lee, Y.H.; Winkler, S. CloudSegNet: A Deep Network for Nychthemeron Cloud Image Segmentation. IEEE Geosci. Remote Sens. Lett. 2019, 16, 1814–1818. [Google Scholar] [CrossRef]
- Zhang, Z.; Yang, S.; Liu, S.; Xiao, B.; Cao, X. Ground-Based Cloud Detection Using Multiscale Attention Convolutional Neural Network. IEEE Geosci. Remote Sens. Lett. 2022, 19, 1–5. [Google Scholar] [CrossRef]
- Li, Z.; Shen, H.; Cheng, Q.; Liu, Y.; You, S.; He, Z. Deep learning based cloud detection for medium and high resolution remote sensing images of different sensors. ISPRS J. Photogramm. Remote Sens. 2019, 150, 197–212. [Google Scholar] [CrossRef]
Disclaimer/Publisher’s Note: The statements, opinions and data contained in all publications are solely those of the individual author(s) and contributor(s) and not of MDPI and/or the editor(s). MDPI and/or the editor(s) disclaim responsibility for any injury to people or property resulting from any ideas, methods, instructions or products referred to in the content. |
© 2025 by the authors. Licensee MDPI, Basel, Switzerland. This article is an open access article distributed under the terms and conditions of the Creative Commons Attribution (CC BY) license (https://creativecommons.org/licenses/by/4.0/).

