Article

Dynamic State Equations and Distributed Blockchain Control: A Differential Game Model for Optimal Emission Trajectories in Shipping Networks

1
School of Economics and Management, Shanghai Maritime University, Shanghai 201306, China
2
School of Management, Hangzhou Dianzi University, Hangzhou 310018, China
3
School of Business and Management, Shanghai Urban Construction Vocational College, Shanghai 201415, China
*
Authors to whom correspondence should be addressed.
Symmetry 2025, 17(6), 817; https://doi.org/10.3390/sym17060817
Submission received: 7 April 2025 / Revised: 14 May 2025 / Accepted: 21 May 2025 / Published: 23 May 2025
(This article belongs to the Special Issue Symmetry and Asymmetry Study in Graph Theory)

Abstract

:
The shipping industry, a cornerstone of global trade, faces emissions reduction challenges amid tightening environmental policies. Blockchain technology, leveraging distributed symmetric architectures, enhances supply chain transparency by reducing information asymmetry, yet its dynamic interplay with emissions strategies remains underexplored. This study employs symmetry-driven differential game theory to model four blockchain scenarios in port-shipping networks: no blockchain (N), port-led (PB), shipping company-led (CB), and a joint platform (FB). By solving Hamilton–Jacobi–Bellman equations, we derive optimal emissions reduction efforts, green investments, and blockchain strategies under symmetric and asymmetric decision-making frameworks. Results show blockchain adoption improves emissions reduction and service quality under cost thresholds, with port-led systems maximizing low-cost profits and shipping firms gaining asymmetrically in high-freight contexts. Joint platforms achieve symmetry in profit distribution through fee-trust synergy, enabling win–win outcomes. Integrating graph-theoretic principles, we have designed dynamic state equations for emissions and service levels, segmenting shippers by low-carbon preferences. This work bridges dynamic emissions strategies with blockchain’s network symmetry, fostering economic–environmental synergies to advance sustainable maritime supply chains.

1. Introduction

1.1. Background and Motivation

As the backbone of global commerce, shipping dominates over 80% of worldwide freight, driving trade, economic expansion, and societal advancement [1,2]. The symmetrically interconnected network of ports (nodes) and shipping routes (edges) underpins global trade, yet its structural symmetry in connectivity contrasts sharply with operational asymmetries in environmental impact. Ship operations emit pollutants and greenhouse gases disproportionately, creating ecological imbalances [3]. The International Maritime Organization (IMO) reports annual CO2 emissions exceeding one billion metric tons (3% of global CO2 output), which are projected to rise to 5% by 2050 [4]. The EU’s 2024 Emissions Trading System mandates CO2 monitoring for vessels over 5000 tons, challenging the industry to reconcile network symmetry (efficient connectivity) with operational asymmetry (uneven emissions). However, the multi-actor nature of the shipping network leads to significant information asymmetry and a dilemma for emissions reduction strategies. Ports have difficulty in tracking real-time ship emissions data, shipping companies lack trust in port green infrastructure, and cargo owners are unable to verify carbon footprint declarations in the transportation chain. This information barrier not only creates the risk of “greenwashing” but also makes it difficult to implement a coordinated emissions reduction mechanism. In this context, there is an urgent need for a technical tool that can realize real-time data sharing, tamper-proof process, and accurate traceability of responsibility, in order to solve the trust and collaboration problems in the emissions reduction network.
Blockchain technology, with its distributed ledger and smart contract characteristics, provides a new path for building a cross-organizational and highly credible carbon emissions monitoring network. For example, the Hong Kong GSBN-COSCO initiative (launched in 2024) employs blockchain to issue traceable green certificates, enhancing transparency in a graph-like supply chain where nodes (ports) and edges (routes) must align for sustainability. This technology enables combinatorial optimization of emissions strategies, akin to fault diagnosis in interconnected networks [5], identifying critical nodes (e.g., high-emission ports) and optimizing edge-level coordination [6]. However, decarbonization costs [7] and interdependencies between ports and shipping firms introduce asymmetric incentives, necessitating symmetric collaboration to balance economic and environmental objectives [8].
In the context of the increasingly stringent environmental policies of the IMO, green investments by port and shipping enterprises have become critical to enhancing competitiveness [9]. Some scholars have analyzed shipping companies’ “on-chain” decisions by constructing a Stackelberg static equilibrium [10]; others have discussed introducing a carbon tax or a carbon trading mechanism [11] and considering consumers’ preferences for logistics services and information [12]. These studies further provide references for promoting blockchain technology investment in emissions reduction strategies. Existing research on blockchain applications primarily focuses on technological roles and implementation challenges [13], neglecting the topic of integration into dynamic symmetry–asymmetry trade-offs within port-shipping networks. Therefore, by exploring blockchain’s application in this context, we address a critical research gap. Our work not only leverages graph-theoretic symmetry to model emissions reduction trajectories but also introduces algorithmic complexity principles to optimize node-level (port) and edge-level (shipping route) decisions. This approach aligns with the restricted connectivity challenges of multiprocessor-like logistics systems, advancing the diagnosability of emission-critical nodes while harmonizing economic–environmental symmetry in maritime supply chains.

1.2. Research Questions and Innovations

Given the dual challenges of emissions reduction and digital transformation in the global shipping industry, we address the symmetry–asymmetry interplay in blockchain-driven supply chains through the following research questions:
Q1: How can symmetry-driven dynamic strategies enhance emissions reductions and blockchain investments, accounting for shippers’ asymmetric preferences (low-carbon vs. non-low-carbon) and their impact on node-edge interactions (ports as nodes, shipping routes as edges) in maritime networks?
Q2: How does blockchain’s distributed symmetric architecture reshape optimal emissions decisions, and what are the dynamic trajectories of emissions levels, service quality, demand, and profits under graph-theoretic equilibria (e.g., Stackelberg models with asymmetric leader–follower roles)?
Q3: What threshold conditions (e.g., cost symmetry, profit asymmetry) enable blockchain investments to achieve win–win outcomes for ports and shipping firms, and how do factors like restricted connectivity (e.g., port-shipping dependencies) and node-level diagnosability (e.g., emission-critical ports) influence these thresholds?
Q4: Which member (port or shipping firm) should lead blockchain investments to maximize network-wide symmetry in emissions reduction and service levels, considering their asymmetric roles as nodes (decision hubs) vs. edges (operational links) in the supply chain graph?
To address these questions, we developed a Stackelberg model within a shipping supply chain involving a port operator (leader) and a shipping firm (follower), framing their interactions as asymmetric node–edge dynamics in a graph-theoretic network (ports as nodes, shipping routes as edges). The port entity establishes green investment criteria, while shipping entities optimize emissions reduction initiatives under restricted connectivity constraints. We analyze four blockchain scenarios (N, PB, CB, FB) through sensitivity, comparative, and numerical analyses, incorporating blockchain green certification levels to assess how consumer trust symmetry influences emissions reductions.
The main innovations of this paper are threefold, as follows:
(1) Research Content: We pioneer the integration of blockchain investment levels with emissions strategies, segmenting cargo owners into asymmetric preference types (low/non-low-carbon) to model node-level heterogeneity in a graph-like supply chain. By unveiling the impact of shipping costs, cargo owner nature, and low-carbon coefficients, we demonstrate that port-led blockchain achieves profit symmetry under low operational costs, while shipping firms leverage asymmetric service sensitivity in high-freight environments. Joint platforms balance symmetry–asymmetry trade-offs through fee-trust synergy, akin to optimizing restricted connectivity in multiprocessor systems.
(2) Research Perspective: Transitioning from static to dynamic analysis, we design two symmetry-driven state equations for emissions reduction (node dynamics) and service quality (edge dynamics), revealing time-proportional convergence to symmetric steady states—mirroring graph neural networks (GNNs) in resolving algorithmic complexity for interconnected systems. This approach diagnoses critical nodes (e.g., high-emission ports) and optimizes edge-level coordination, advancing fault diagnosability in maritime networks.
(3) Research Methodology: We introduce optimal control theory to shipping supply chains, solving Hamilton–Jacobi–Bellman equations to derive emissions trajectories. This framework integrates combinatorial algorithms for node–edge optimization, addressing uncertainty in graph properties (e.g., fluctuating demand) and enhancing network reliability through dynamic symmetry–asymmetry equilibria.

1.3. Paper Organization and Structure

This paper is structured as follows. The literature is examined in Section 2. In Section 3 and Section 4, hypotheses are formulated and models are developed. Section 5 presents parametric sensitivity analysis and comparative analysis of model results. Section 6 introduces the shipper green trust coefficient, designs new shipper utility and demand functions, and reanalyzes blockchain scenarios’ impacts on shipping supply chain optimization under revised settings, expanding research boundaries to better align with real-world conditions. Section 7 employs MATLAB R2023a for numerical experiments, validating theoretical conclusions through empirical results to enhance research credibility. Section 8 summarizes this paper’ s contributions and discusses their implications. Note: All proofs are in Supplementary S1, and the critical points are in Supplementary S2.

2. Literature Review

The available research delves into the impact of blockchain tech on cutting emissions in the port and shipping supply chain. As such, we distill the pertinent literature by examining three main avenues: the use of blockchain, emissions mitigation tactics within the shipping sector, and type of shippers.

2.1. The Application of Blockchain Technology

Academic research has expanded blockchain’s use in the shipping industry (Liu et al., [14]; Xu et al., [15]; Li et al., [16]). Alahmadi et al. [17] examined the integration of blockchain into the port and shipping industry to facilitate digital transformation, finding that blockchain can streamline financial and documentation workflows. Chen and Yang [18] analyzed collaborative decision-making among supply chain stakeholders before and after blockchain adoption, examining data-sharing patterns and consumer concerns about information accuracy. Lorenz-Meyer et al. [19] highlighted blockchain’s role in data sharing as a solution to challenges faced by maritime SMEs and the broader industry. Zhao et al. [20] revealed the role of blockchain services during port hours of operation, providing new ways to solve port congestion based on economic and environmental benefits, helping consumers to improve the service experience. Wang et al. [21] investigated shipping firms’ blockchain investment tactics within competitive frameworks and their influence on consumer gains and societal welfare in various contexts. In addition, recent advances in graph-theoretic connectivity and diagnosability (Wang et al., [22,23]) provide theoretical foundations for analyzing blockchain’s role in enhancing network reliability in shipping supply chains. For instance, studies on tightly super 3-extra connectivity in locally twisted cubes [22] and nature diagnosability in bubble-sort star graphs [23] align with blockchain’s capacity to address node-level inefficiencies (e.g., port congestion) and edge-level coordination challenges (e.g., route optimization).
Moreover, researchers have investigated blockchain’ s integration into various supply chain sectors. Babaei et al. [24] employed data-informed optimization techniques to evaluate the practicality of integrating blockchain technology into sustainable energy supply networks. Henrichs et al. [25] suggested an integrated model for utilizing blockchain in food and drug supply chain management, enhancing the prevention of low-quality product infiltration. Heydari [26] investigated the potential of blockchain to mitigate inefficiencies within construction supply chain coordination and teamwork. Meanwhile, Wang et al. [27] design a blockchain-based low-carbon incentive mechanism, enabling decentralized low-carbon management in building projects. Vu Nguyen Huynh Anh [28] employs organizational modeling techniques to develop blockchain smart contracts, demonstrating supply chain finance system processes and management principles. Furthermore, research on expanded k-ary n-cubes (Wang et al., [29]) highlights the importance of restricted connectivity in multiprocessor-like logistics systems, offering insights into blockchain’s potential to streamline port-shipping interdependencies through decentralized data symmetry. Established studies have systematically explored the application of blockchain in different industries, but its potential for dynamic collaborative emissions reduction has not been fully explored. This provides space for this study to analyze the symmetric collaboration and asymmetric decision-making of port and shipping companies in blockchain scenarios through differential games.

2.2. Operational Strategies for Emissions Reduction in the Shipping Supply Chain

Our study directly relates to emissions reduction, with shipping emissions playing a significant role in global air pollutants [30]. Since the signing of the United Nations Framework Convention on Climate Change in 1992, the shipping industry’ s emissions reduction strategies have garnered worldwide attention [31]. The goal of the Convention is to cut greenhouse gas emissions and drive carbon reduction efforts across all sectors, including shipping [32].
In the shipping supply chain, Pasha et al. [33] analyzed carbon emissions generated during ship operations, addressed major challenges to liner transportation strategies, and provided management insights. From a sustainable development perspective, emissions should be reduced through improved ship design and enhanced ocean governance policies [34,35]. Ji et al. [36] highlighted the dependency of emissions reduction strategies in fluctuating carbon quota markets on the performance of energy firms in cutting emissions. Wang and Mao [37] proposed a navigation optimization method to adjust marine engine power, reducing fuel consumption and air emissions while addressing three-dimensional route planning challenges. The connectivity and matching preclusion principles in leaf-sort graphs (Wang et al., [38]) resonate with optimizing emission-critical nodes (e.g., high-pollution ports) and edges (shipping routes), ensuring algorithmic reliability in dynamic emissions reduction models. These principles complement studies on navigation optimization [37] by addressing structural vulnerabilities in maritime networks. Zhu et al. [39] investigated optimal manufacturing approaches for both new and remanufactured goods within mixed-carbon regulatory frameworks, examining how production flexibility and certified emissions reduction (CER) mechanisms interact. Koohathongsumrit et al. [40] focused on the issue of routing in the intermodal supply chain and developed interactive freight planning and transportation policies. Their study analyzed key variables influencing operational decisions and overall carbon footprints under these hybrid environmental policies. Concurrently, Chen et al. [8] studied transport capacity deployment optimization, offering actionable insights for shipping companies to improve energy efficiency and emissions reduction. Additionally, Hoang et al. [4] pursued smart strategies leveraging renewable energy, clean fuels, smart grids, and energy-efficient measures to achieve emissions reduction targets.
In addition, scholars have explored dynamic and static decision-making in supply chains. In dynamic decision-making contexts, Zhang et al. [41] studied a two-tier supply chain involving a carbon-reducing manufacturer and a retailer, where emissions reduction factors exhibited dynamic changes. Ma and He [42] derived optimal green technology investments under three scenarios by constructing a Stackelberg game. Wu and Yang [43] incorporated consumer low-carbon preferences into a dynamic optimization model to analyze emissions reduction under decentralized and centralized decisions. Kang et al. [44] used differential game theory to analyze blockchain adoption and eco-friendly production in sustainable supply chains over time. Ma et al. [45] integrated cold chain logistics characteristics into a differential game model, studying preservation technology investments and emissions reduction behaviors dynamically. Regarding static decision-making, Yang et al. [46] developed Stackelberg and Nash game models to evaluate sustainable technology options within a port logistics network governed by cap-and-trade regulations. Yu et al. [47] investigated vertical and horizontal emissions reduction efforts alongside pricing strategies. Rashid et al. [48] employed a hybrid multi-decision approach and, through sensitivity analysis, pointed out the potential for future integration with fuzzy theory or extension to other decision-making scenarios. Concurrently, differential game models were utilized to assess government incentives’ impact on enhancing emissions reduction levels (Chen et al., [49]; Meng et al., [50]).
The existing literature proposes diversified emissions reduction schemes from both static decision-making and dynamic optimization perspectives, but it has generally ignored two key issues. First, the long-term effects of emissions reduction strategies are limited by the coordination efficiency of nodes (ports) and edges (shipping companies), while established dynamic models do not analyze the symmetry constraints of the network structure in conjunction with graph theory; and second, the threshold effect of blockchain technology on the cost of emissions reduction has not been quantified. This study incorporates the above gaps into the dynamic optimization framework by designing state equations containing blockchain green trust coefficients. Additionally, the collaborative role among sectors such as ships, ports, and shipping firms in the emissions reduction process remains underexplored.

2.3. Type of Shippers

The low-carbon preferences of consumers have emerged as a crucial factor shaping emissions reduction. Chen et al. [8] derived critical insights into blockchain applications in shipping supply chains based on consumer information preferences. Yang and Chen [51] conducted a study analyzing the impact of retailers’ profit-sharing and cost-splitting approaches on manufacturers’ green technology investments and bottom-line performance. Zhou and Li [52] analyzed carbon reduction factors for ports and ships under carbon tax policies and consumer green preferences. Their research factored in two key market forces: growing consumer eco-consciousness and government-imposed carbon pricing mechanisms. Zhou et al. [53] employed a dynamic differential game model to assess long-term supply chain emissions in relation to low-carbon consumer preferences. Cheng et al. [54] applied an improved projection algorithm to solve game models and conducted static analyses of consumer preferences through numerical simulations. Ghosh et al. [55] demonstrated that consumer low-carbon preferences strongly influence supply chain order volumes and profit distributions. Regarding other aspects, Cai et al. [56] explored blockchain’s dual effects on market demand and consumer privacy concerns through game-theoretic models. Yu et al. [57] discussed the coordination of pro-poor supply chains involving altruistic retailers, rural cooperatives, and blockchain adoption. Research has examined the impact of consumer eco-consciousness on pricing and manufacturing decisions in the electric vehicle supply chain [58,59].
Although scholars are aware of the role of low-carbon preference shippers in driving emissions reductions, existing categorizations are oversimplified: most studies default to shippers’ homogeneity and fail to consider the feedback effect of their green trust differences on blockchain adoption. This omission makes it difficult for the model to explain why the same blockchain investment produces vastly different abatement effects under different shipper structures. This study fills this theoretical gap by disaggregating low-carbon preference/non-low-carbon preference and introducing a trust coefficient.

2.4. Research Gap

In summary, research in the aforementioned areas has achieved significant progress. Nonetheless, an extensive survey of the available research highlights numerous areas requiring further investigation. Table 1 highlights the distinctions between our study and prior works. Specifically, our study diverges from prior research in four main ways. First, our paper is primarily oriented towards the shipping industry. Although some literature has considered other factors, it has not focused on the shipping industry. Second, regarding modeling dynamic emissions reduction operations, we construct two state equations (emissions reduction level and shipping service level), while existing works often consider only emissions reduction dynamics. Third, we incorporate blockchain investment as a decision variable and investigate how it affects shipping supply chain management. Finally, we classify consumers into low-carbon-preference and non-low-carbon-preference groups, explicitly quantifying blockchain’s direct impact on emissions reduction through a shipper green trust coefficient.

3. Description of the Problem and Assumptions

3.1. Description of the Problem

Green shipping is an unavoidable direction in the development of the international shipping industry, and governments, international organizations, ports, shipping companies, and relevant stakeholders are actively promoting this transformation. Currently, port companies mainly build green ports by investing in energy-saving and emission-reduction technologies such as ‘oil-to-electricity’ shore power and liquefied natural gas (LNG) terminals. To cut down on energy consumption and reduce their carbon footprint, shipping lines opt to harness shore power when docking, switch to low-sulfur fuels, or power their vessels with eco-friendly alternatives like methanol, or hydrogen.
As shown in Figure 1, this paper considers a green shipping supply chain system consisting of one green port (denoted by subscript P) and one shipping company (denoted by subscript S). There are two types of shippers in the shipping market; one type is low-carbon preference shippers with environmental awareness, and the other is non-low-carbon preference shippers without environmental awareness. To foster eco-friendly and sustainable growth within the shipping sector and boost the appeal of shippers who prioritize low-carbon choices, ports and shipping firms are incentivized to invest in green initiatives and undertake emission-cutting measures.
In addition, driven by digital transformation, blockchain technology is fundamentally changing the operational mode of the shipping industry through its decentralization, tamper-proof data, and transparent transactions, such as improving port clearance efficiency, enhancing shipping logistics transparency, and improving shipping service levels. To explore investment strategies involving blockchain technology in the context of green shipping, we consider four blockchain scenarios, as shown in Figure 2, including: (1) Scenario N, the traditional shipping supply chain without blockchain; (2) Scenario PB, where the port is responsible for investing and establishing blockchain technology, with the shipping company participating; (3) Scenario CB, where the shipping company is responsible for investing in and establishing blockchain technology, with the port participating; (4) Scenario FB, where the port and shipping companies jointly participate in a shipping logistics blockchain platform.
This paper characterizes the structural symmetry and decision-making asymmetry of the shipping network from the perspective of graph theory. As shown in Figure 2, the topology of the traditional shipping network (Structure A) contains two types of node-edge relationships. In the physical network, the nodes are ports and the edges are the routes operated by shipping companies. The structural symmetry is reflected in the connection efficiency between ports, but the decision-making asymmetry stems from the differences in emissions reduction targets and investment rights and responsibilities between ports and shipping companies. In the information network, the nodes are ports and shipping companies, and the edges are supply chain collaboration relationships. Their symmetry is limited by information transparency, while the introduction of blockchain technology will reconstruct the network topology. In Structure B, the shipping logistics blockchain platform, as a newly added super node, is embedded in the original network (Figure 2d). Through the consortium chain protocol, it establishes a two-way trust edge with all ports and shipping companies, forming a multi-center symmetric architecture. This topological transformation enables the traditional hierarchical channel strategy to evolve into a distributed collaborative decision-making model.
Under the framework of differential games, the graph theory characteristics of the network structure affect the equilibrium strategy in the following ways. Regarding node diagnosticality, the addition of blockchain platform nodes enhances the network’s ability to identify high-emission ports (key nodes), and optimizes the nodal emissions reduction input through the dynamic state equation. In terms of edge coordination, the information symmetry driven by blockchain reduces the coordination cost between ports (nodes) and shipping companies (edges), transforming the game equilibrium from a non-cooperative Nash equilibrium to a Pareto-effective symmetrical cooperative equilibrium. Connectivity constraints in the traditional structure (Figure 2a–c) include restricted edge connections leading to local optima, while structure B (Figure 2d) extends global connectivity through cross-organizational smart contracts, supporting the graph neural network optimization of multi-party collaborative emissions reduction paths. The dynamic evolution of this network topology reveals differences in channel strategies under different blockchain scenarios; port dominance enhances node centrality, shipping dominance optimizes edge-level responses, while the joint platform achieves network-level symmetrical coordination through supernodes.

3.2. Model Assumptions

This study examines decision-making on emissions mitigation and blockchain investment in ports and shipping firms across varied contexts. Table 2 presents the model symbols and corresponding descriptions for simplified reference and analysis.
Based on the above description, the main assumptions of this paper are as follows:
Assumption 1.
We consider that emissions reduction in the shipping supply chain is a variable process, and the emissions reduction per unit of output mainly depends on the green investment of the port and the emissions reduction effort of the shipping company. In practice, the Port of Rotterdam has verified such dynamic synergy effects through green infrastructure such as shore power facilities and LNG refueling stations, in coordination with Maersk’s fleet’s adoption of low-carbon fuels and speed optimization. Based on the classical Nerlove–Arrow model (Nerlove et al., [60]) and referencing the existing literature (Meng et al., [50]; Zhu et al., [61]), it is assumed that the emissions reduction level (ERL) E(t) of the shipping supply chain at time t satisfies the following equation of state:
d E ( t ) = u a ( t ) d t + θ g ( t ) d t σ E ( t ) d t ,   E ( 0 ) = E 0
where a(t) and g(t) respectively represent the emissions reduction efforts (ERE) of the shipping company and the green investment level (GIL) of the port; u and θ, respectively reflect the impact of port GRL and shipping company ERE on the ERL of the shipping supply chain; σ > 0 indicates the attenuation rate of ERL, which may be attributed to the lack of emissions reduction awareness among managers, natural wear, and tear of emissions reduction equipment, etc. Furthermore, we assume that the initial emissions reduction level at time 0 is E(0) = E0.
Assumption 2.
Previous studies have shown that blockchain technology can create blockchain electronic bills of lading with permanent data records between ports, shipping companies, and shippers. For example, the GSBN platform in Hong Kong has reduced customs clearance time through blockchain bills of lading. This electronic bill of lading not only improves the clearance efficiency of shippers at ports, but also enhances the transparency of shipping logistics information, overall enhancing the shipper’s shipping service experience (e.g., Xin et al., [15]; Wang et al., [21]; Li et al., [62]). Therefore, this paper assumes that the dynamic evolution of shipping service level (SSL) driven by blockchain technology is as follows:
d S ( t ) = φ b ( t ) d t τ S ( t ) d t ,   S ( 0 ) = S 0
In Equation (2), b(t) represents the blockchain investment level (BIL) in the shipping supply chain at time t, which has a positive impact on SSL due to the value of blockchain. The higher b(t), the higher the customs clearance efficiency of the port, the higher the transparency (service quality) of shipping logistics, and customers can have a better shipping service experience. τ represents the attenuation rate of SSL, which may be caused by the aging of blockchain technology equipment, data processing redundancy, and competition with peer services. In addition, we assume that the initial shipping service level at time 0 is S(0) = S0. It is worth noting that S0 also indicates the shipping service level before blockchain adoption (i.e.,: when there is no blockchain).
Assumption 3.
We assume that there are two types of shippers in the shipping market, including α proportion of low-carbon preference shippers (denoted by l) and 1-α proportion of non-low-carbon preference shippers due to poor environmental awareness (denoted by n). In reality, Hapag-Lloyd’s “Ship Green” service has been questioned as “greenwashing” due to the lack of verifiable emissions data, while Maersk’s blockchain carbon tracking system enhances shippers’ trust through on-chain deposits. Based on the scenario of blockchain and the type of shipper, we provide the utility function of the shipper in Table 3.
In Table 3, let p represent shipping service price and v represent the shipper’ s valuation of shipping services. Referring to the existing literature (e.g., Choi, [63]; Sui et al., [64]; Liu et al., [65]), we assume that the shippers have heterogeneous valuation v for the shipping service, in which v follows a uniform distribution from 0 to 1, with a probability density function (pdf) f(v) and a cumulative distribution function (CDF) F(v). In addition, β represents the sensitivity of shippers to shipping services, and γ represents the sensitivity of low-carbon-preference shippers to ERL in the shipping supply chain.
Furthermore, based on the utility function of shippers in Table 3, we can obtain the shipping demand without and under blockchain as follows:
D N ( t ) = α p β S 0 γ E ( t ) 1 f ( v ) d v + ( 1 α ) p β S 0 1 f ( v ) d v   = α [ 1 p + β S 0 + γ E ( t ) ] + ( 1 α ) [ 1 p + β S 0 ]
D B ( t ) = α p β S ( t ) γ E ( t ) 1 f ( v ) d v + ( 1 α ) p β S ( t ) 1 f ( v ) d v   = α [ 1 p + β S ( t ) + γ E ( t ) ] + ( 1 α ) [ 1 p + β S ( t ) ]
where DN(t) and DB(t) denote the shipping demand under the blockchain and without blockchain, respectively.
Assumption 4.
Following the existing literature (e.g., Meng et al., [50]; Xia et al., [66]; Cai et al., [67]), we assume that the green investment cost of the port at time t is k·g2(t)/2, the cost of emissions reduction efforts by the shipping company is h·a2(t)/2, and the blockchain investment cost is η·b2(t)/2, where k, h, and η are the corresponding cost coefficients. The context for this type of quadratic function aligns with the common convexity principle in economic theory and its underlying economic meaning is that the effects of emissions reduction and blockchain investment in the shipping supply chain are marginally diminishing. We referred to the research of Xin et al. [15], Jiang and Liu [68], and Wang et al. [21] regarding the assumption of investment costs in blockchain. These scholars believe that the investment cost of blockchain is related to its investment level and the marginal cost is increasing, which provides strong support for the research in this paper.
Additionally, we assume that the port service fee is r, and the unit operating costs for the port, shipping company, and shipping logistics blockchain platform are c0, c1, and c2, respectively. We also consider that the unit operating cost that blockchain investors need to bear is ω, and in the FB scenario, the unit blockchain usage fee charged by the shipping logistics blockchain platform to port and shipping companies is cb.

4. Models

In this section, for the four scenarios, dynamic emissions reduction and blockchain investment decision models for shipping supply chains in different scenarios are constructed using continuous dynamic optimal control theory based on the state changes of shipping emissions reduction level (ERL) and shipping service level (SSL), respectively. This study uses differential game theory to analyze the dynamic emissions reduction decisions of ports and shipping companies. Its core is to give the optimal emissions reduction decision and the level of blockchain investment of port and shipping enterprises by solving the Hamilton–Jacobi–Bellman (HJB) equation. The HJB equation describes how a participant‘s value function varies with state and control variables. Its general form is as follows:
ρ V = max u   [ π ( u ) + V f ( u ) ]
where V is the value function, ρ is the discount rate, π(u) is the instantaneous profit, and f(u) is the equation of state. Solving the HJB equation determines the optimal control strategy to maximize the long-term profit of the participants via backward induction.

4.1. Without Blockchain (Scenario N)

As a benchmark, scenario N refers to ports and shipping companies in the traditional shipping supply chain that are not considering investing in blockchain technology. This assumption reflects independent decision-making between ports and shipping companies with no information sharing. For example, the Shenzhen port and companies such as COSCO Shipping and Maersk, which are anchored to the port, have historically agreed on service fees through long-term contracts, and there is a lack of real-time synergy between the port and the shipping companies in decision-making on emissions reduction, leading to asymmetrical node–edge decision-making. Based on the outlined issues and premises in Section 3, the blockchain investment level b(t) at time t is 0, and the shipping service level S(t) is S0. Therefore, based on the state change of ERL, the differential game model of traditional shipping supply chain under scenario N is constructed as follows:
max g N ( t ) π P N = 0 + e ρ t [ ( r c 0 ) D N ( t ) 1 2 k g N 2 ( t ) ] d t   = 0 + e ρ t [ ( r c 0 ) ( α ( 1 p + β S 0 + γ E N ( t ) ) + ( 1 α ) ( 1 p + β S 0 ) )               1 2 k g N 2 ( t ) ] d t
max a N ( t ) π C N = 0 + e ρ t [ ( p r c 1 ) D N ( t ) 1 2 h a N 2 ( t ) ] d t   = 0 + e ρ t [ ( p r c 1 ) ( α ( 1 p + β S 0 + γ E N ( t ) ) +               ( 1 α ) ( 1 p + β S 0 ) ) 1 2 h a N 2 ( t ) ] d t
s . t .   d E N ( t ) = u a N ( t ) d t + θ g N ( t ) d t σ E N ( t ) d t E N ( 0 ) = E 0
where ρ represents the discount rate, and πPN and πCN denote the total expected profit of the port and the shipping company in the period [0, +∞) in scenario N, respectively.
Let VP N(EN) and VCN(EN) represent the optimal value functions of the port company and shipping company, respectively, which represent the total expected profits of the port company and shipping company during the operation period from time t to +∞. VPN’(EN) is the first derivative of the optimal value function with respect to VPN, and VCN’(EN) is the first derivative of the optimal value function with respect to VCN. They represent the marginal contribution of emissions reductions in the shipping supply chain to the expected total profits of the port company and shipping company. In accordance with optimal control theory, the respective optimal value functions for the port and shipping companies fulfill the HJB equations depicted below:
ρ V P N ( E N ) = max g N ( t ) [ ( r c 0 ) D N ( t ) 1 2 k g N 2 ( t ) ] + V P N ( E N ) [ u a N ( t ) d t + θ g N ( t ) d t σ E N ( t ) ]
ρ V C N ( E N ) = max a N ( t ) [ ( p r c 1 ) D N ( t ) 1 2 h a N 2 ( t ) ] + V C N ( E N ) [ u a N ( t ) d t + θ g N ( t ) d t σ E N ( t ) ]
By using optimal control theory to solve HJB Equations (8) and (9), we obtain Theorem 1.
Theorem 1.
In the Scenario N without blockchain, the optimal green investment level gN* of the port company and the optimal emissions reduction effort aN* of the shipping company in the shipping supply chain are as follows:
g N * = α γ θ ( r c 0 ) k ( ρ + σ )
a N * = α γ u ( p c 1 r ) h ( ρ + σ )
According to Theorem 1, Corollary 1 can further be obtained.
Corollary 1.
In the N Scenario without blockchain, the optimal dynamic trajectories of emissions reduction operational strategies for the shipping supply chain are as follows:
E N * ( t ) = ( E 0 α γ ( h θ 2 ( r c 0 ) + k u 2 ( p c 1 r ) ) h k σ ( ρ + σ ) ) e σ t   + α γ ( h θ 2 ( r c 0 ) + k u 2 ( p c 1 r ) ) h k σ ( ρ + σ )
D N * ( t ) = α ( γ ( ( E 0 α γ ( h θ 2 ( r c 0 ) + k u 2 ( p c 1 r ) ) h k σ ( ρ + σ ) ) e σ t   + 1 h k σ ( ρ + σ ) ( α γ ( h θ 2 ( r c 0 ) + k u 2 ( p c 1 r ) ) ) )   p + β S 0 + 1 ) + ( 1 α ) ( 1 p + β S 0 )
V C N * ( t ) = α γ p c 1 r ρ + σ ( ( E 0 α γ ( h θ 2 ( r c 0 ) + k u 2 ( p c 1 r ) ) h k σ ( ρ + σ ) ) e σ t +   α γ ( h θ 2 ( r c 0 ) + k u 2 ( p c 1 r ) ) h k σ ( ρ + σ ) ) + ( p c 1 r ) 2 ρ ( 2 ( 1 p + β S 0 )   + α 2 γ 2 ( 2 h θ 2 ( r c 0 ) + k u 2 ( p c 1 r ) ) h k ( ρ + σ ) 2 )
V P N * ( t ) = α γ ( r c 0 ) ρ + σ ( ( E 0 α γ ( h θ 2 ( r c 0 ) + k u 2 ( p c 1 r ) ) h k σ ( ρ + σ ) ) e σ t +   α γ ( h θ 2 ( r c 0 ) + k u 2 ( p c 1 r ) ) h k σ ( ρ + σ ) ) + ( r c 0 ) 2 ρ ( 2 ( 1 p + β S 0 )   + α 2 γ 2 ( h θ 2 ( r c 0 ) + 2 k u 2 ( p c 1 r ) ) h k ( ρ + σ ) 2 )

4.2. Blockchain Established by the Port (Scenario PB)

Unlike the N scenario without blockchain, in the PB scenario, the investment level of blockchain technology is decided by the port company, continuously improving the shipping service experience of shippers by enhancing the transparency and clearance efficiency of the shipping supply chain, reflecting the practice where ports dominate the technical standards (e.g., GSBN platform is driven by the Hong Kong Port Authority) and shipping companies are passively adaptive. Therefore, based on the state changes in ERL and SSL, a differential game model for blockchain-supported shipping supply chain in the PB scenario is established as follows:
max g P B ( t ) , b P B ( t ) π P P B = 0 + e ρ t [ ( r ω c 0 ) D P B ( t ) 1 2 k g P B 2 ( t ) 1 2 η b P B 2 ( t ) ] d t   = 0 + e ρ t [ ( r ω c 0 ) ( α ( 1 p + β S ( t ) + γ E ( t ) )               + ( 1 α ) ( 1 p + β S ( t ) ) ) 1 2 k g P B 2 ( t ) 1 2 η b P B 2 ( t ) ] d t
max a P B ( t ) π C P B = 0 + e ρ t [ ( p r c 1 ) D P B ( t ) 1 2 h a P B 2 ( t ) ] d t   = 0 + e ρ t [ ( p r c 1 ) ( α ( 1 p + β S ( t ) + γ E ( t ) )               + ( 1 α ) ( 1 p + β S ( t ) ) ) 1 2 h a P B 2 ( t ) ] d t
s . t .   d E P B ( t ) = u a P B ( t ) d t + θ g P B ( t ) d t σ E P B ( t ) d t d S P B ( t ) = φ b P B ( t ) d t τ S P B ( t ) d t E P B ( 0 ) = E 0 S P B ( 0 ) = S 0
Theorem 2.
In the PB Scenario where the blockchain technology established by the port company, we obtain the optimal blockchain technology investment level of port company in the shipping supply chain as follows:
b P B * = β φ ( r c 0 ω ) η ( ρ + τ )
The optimal green investment level gPB* of port company and the optimal emissions reduction effort aPB*of shipping company under PB blockchain technology are as follows:
g P B * = α γ θ ( r c 0 ω ) k ( ρ + σ )
a P B * = α γ u ( p c 1 r ) h ( ρ + σ )
Corollary 2.
In the PB Scenario where the blockchain technology established by the port company, the optimal dynamic trajectories of emissions reduction operational strategies for the shipping supply chain are as follows:
E P B * ( t ) = E 0 e σ t + α γ ( h θ 2 ( r c 0 ω ) + k u 2 ( p c 1 r ) ) h k σ ( ρ + σ ) ( 1 e σ t )  
S P B * ( t ) = S 0 e τ t + β φ 2 ( r c 0 ω ) η τ ( ρ + τ ) ( 1 e τ t )  
D P B * ( t ) = 1 p + α γ ( E 0 e σ t + α γ ( h θ 2 ( r c 0 ω ) + k u 2 ( p c 1 r ) ) h k σ ( ρ + σ )   ( 1 e σ t ) ) + β ( S 0 e τ t + β φ 2 ( r c 0 ω ) η τ ( ρ + τ ) ( 1 e τ t ) )
V C P B * ( t ) = α γ ( p c 1 r ) ρ + σ E P B * ( t ) + β ( p c 1 r ) ρ + τ S P B * ( t ) +   1 2 ρ ( 2 α γ ( p c 1 r ) ρ + σ ( u a P B * + θ g P B * ) h a P B * 2   + 2 φ β ( p c 1 r ) b P B * ρ + τ + 2 ( 1 p ) ( p r c 1 ) )
V P P B * ( t ) = α γ r c 0 ω ρ + σ E P B * ( t ) + β r c 0 ω ρ + τ S P B * ( t ) +   1 2 ρ ( 2 α γ r c 0 ω ρ + σ ( u a P B * + θ g P B * )   2 α γ r c 0 ω ( u a P B * + θ g P B * ) ρ + σ η a P B * 2   + 2 φ β r c 0 ω b P B * ρ + τ g P B * 2 k +   2 ( 1 p ) ( r c 0 ω ) )

4.3. Blockchain Established by the Shipping Company (Scenario CB)

In the CB scenario, shipping companies decide on the level of investment in blockchain technology. For example, Maersk TradeLens and COSCO Shipping’s blockchain platforms are led by shipping companies and aim to improve the operational efficiency of global routes. Therefore, based on the state changes in ERL and SSL, a differential game model for blockchain-supported shipping supply chain in CB scenario is established as follows:
max a C B ( t ) , b C B ( t ) π C C B = 0 + e ρ t [ ( p ω r c 1 ) D C B ( t )   1 2 h a C B 2 ( t ) 1 2 η b C B 2 ( t ) ] d t
max g C B ( t ) π P C B = 0 + e ρ t [ ( r c 0 ) D C B ( t ) 1 2 k g C B 2 ( t ) ] d t
s . t .   d E C B ( t ) = u a C B ( t ) d t + θ g C B ( t ) d t σ E C B ( t ) d t d S C B ( t ) = φ b C B ( t ) d t τ S C B ( t ) d t E C B ( 0 ) = E 0 S C B ( 0 ) = S 0
Theorem 3.
In the CB Scenario where the blockchain technology established by the shipping company, we obtain the optimal blockchain technology investment level of shipping company in the shipping supply chain as follows:
b C B * = β φ ( p r ω c 1 ) η ( ρ + τ )
The optimal green investment level gCB* of port company and the optimal emissions reduction effort aCB* of the shipping company under CB blockchain technology are as follows:
g C B * = α γ θ r c 0 k ρ + σ
a C B * = α γ u ( p r ω c 1 ) h ρ + σ
Corollary 3.
In the CB Scenario where the blockchain technology is established by the shipping company, the optimal dynamic trajectories of emissions reduction operational strategies for the shipping supply chain are as follows:
E C B * ( t ) = E 0 e σ t + α γ h θ 2 r c 0 + k u 2 ( p r ω c 1 ) h k σ ρ + σ ( 1 e σ t )
S C B * ( t ) = S 0 e τ t + β φ 2 p c 1 r ω η τ ρ + τ ( 1 e τ t )
D C B * ( t ) = 1 p + α γ E C B * ( t ) + β S C B * ( t )
V C C B * ( t ) = α γ p c 1 r ω ρ + σ E C B * ( t ) + β p c 1 r ω ρ + τ S C B * ( t )   + 1 2 ρ ( h a C B * 2 + 2 α γ p c 1 r ω ( u a C B * + θ g C B * ) ρ + σ   b C B * 2 η + 2 φ β p c 1 r ω b C B * ρ + τ + 2 c 1 p 1 +   2 p 1 p + r + ω 2 r 2 ω )
V P C B * ( t ) = α γ r c 0 ρ + σ E C B * ( t ) + β r c 0 ρ + τ S C B * ( t )   + 1 2 ρ ( 2 α γ ( r c 0 ) ( u a C B * + θ g C B * ) ρ + σ + 2 φ β r c 0 b C B * ρ + τ   + 2 ( 1 p ) ( r c 0 ) k g C B * 2 )

4.4. Join a Shipping Logistics Blockchain Platform (Scenario FB)

In Scenario FB, ports and shipping companies pay blockchain fees to the shipping logistics blockchain platform for technical support. In this case, we must consider the cost and profitability of the shipping logistics blockchain platform. Therefore, we assume that blockchain usage fee charged by shipping logistics blockchain platform cb and the unit operating cost of the shipping logistics blockchain platform c2. Therefore, based on the state changes in ERL and SSL, a differential game model for blockchain-supported shipping supply chain in FB scenario is established as follows:
max b F B ( t ) π F F B = 0 + e ρ t [ ( 2 c b c 2 ω ) D F B ( t ) 1 2 η b F B 2 ( t ) ] d t
max a F B ( t ) π C F B = 0 + e ρ t [ ( p r c 1 c b ) D F B ( t ) 1 2 h a F B 2 ( t ) ] d t
max g F B ( t ) π P F B = 0 + e ρ t [ ( r c b c 0 ) D F B ( t ) 1 2 k g F B 2 ( t ) ] d t
s . t .   d E F B ( t ) = u a F B ( t ) d t + θ g F B ( t ) d t σ E F B ( t ) d t d S F B ( t ) = φ b F B ( t ) d t τ S F B ( t ) d t E F B ( 0 ) = E 0 S F B ( 0 ) = S 0
Theorem 4.
In the FB Scenario where the port and shipping companies jointly participate in a shipping logistics blockchain platform, the optimal blockchain technology investment level of the platform in the shipping supply chain is as follows:
b F B * = β φ ( 1 + λ ) 2 c b c 2 ω η ρ + τ
The optimal green investment level gFB* of port company and the optimal emissions reduction effort aFB* of the shipping company under FB blockchain technology are as follows:
g F B * = α γ θ ( 1 + λ ) r c 0 c b k ρ + σ
a F B * = α γ u ( 1 + λ ) p c 1 c b r h ρ + σ
Corollary 4.
In the FB Scenario where the port and shipping companies jointly participate in a shipping logistics blockchain platform, the optimal dynamic trajectories of emissions reduction operational strategies for the shipping supply chain are as follows:
E F B * ( t ) = E 0 e σ t + α γ ( 1 + λ ) ( h θ 2 ( r c 0 c b ) k u 2 ( p r c 1 c b ) ) h k σ ρ + σ   ( 1 e σ t )
S F B * ( t ) = S 0 e τ t + β φ 2 ( 1 + λ ) 2 c b c 2 ω η τ ρ + τ ( 1 e τ t )
D F B * ( t ) = ( 1 + λ ) ( 1 p + α γ E F B * ( t ) + β S F B * ( t ) )
V C F B * ( t ) = α γ ( 1 + λ ) p r c 1 c b ρ + σ E F B * ( t )   + β ( 1 + λ ) p r c 1 c b ρ + τ S F B * ( t ) + ( 1 + λ ) ρ p r c b c 1   ( 1 p + α γ ( a F B * u + θ g F B * ) ρ + σ + φ β b F B * ρ + τ ) h a F B * 2 2 ρ
V P F B * ( t ) = r c 0 c b ( 1 + λ ) α γ ρ + σ E F B * ( t ) + r c 0 c b ( 1 + λ ) β ρ + τ S F B * ( t )   + 1 2 ρ ( g F B * 2 k + 2 ( r c 0 c b ) ( 1 + λ ) ( α γ ( g F B * θ + a F B * u ) ρ + σ   + ( 1 p ) + φ β b F B * ρ + τ ) )
V F F B * ( t ) = α γ ( 1 + λ ) 2 c b c 2 ω ρ + σ E F B * ( t ) + β ( 1 + λ ) 2 c b c 2 ω ρ + τ S F B * ( t )   + 1 2 ρ ( η b F B * 2 + 2 ( 1 + λ ) ( 2 c b c 2 ω )   ( 1 p + α γ ( u a F B * + θ g F B * ) ρ + σ + φ β b F B * ρ + τ ) )

5. Model Analysis

5.1. Dynamic Emissions Reduction Operational Strategy

This section investigates strategic recommendations for port and shipping businesses by analyzing the optimal dynamic changes in demand, emissions reduction level, and other relevant factors, thereby supporting the development of sustainable and technologically adaptive growth strategies for the shipping industry.
Proposition 1.
N Scenario:
(i) 
When t < tthN, we find that if E 0 E N   o r   p p t h N   o r   α α t h N o r   γ γ t h N   o r   u u t h N o r   θ θ t h N o r   k k t h N   o r   h h t h N o r   c 0 c 0th N   o r   c 1 c 1th N o r   [ ( h k u 2 θ 2 ) ( r r th N ) ]   o r   [ ( h k < u 2 θ 2 ) ( r < r th N ) ] , then
E N t > 0 , D N t > 0 , V C N t > 0 , V P N t > 0 ; otherwise E N t < 0 , D N t < 0 , V C N t < 0 , V P N t < 0 ; where tthN is the time node in (0, +∞);
(ii) 
When t ≥ tthN, we have  E N t = 0 , D N t = 0 , V C N t = 0 , V P N t = 0 ;
(iii) 
We confirm that the relevantimportant critical points in Scenario N can be found in Supplementary S2.
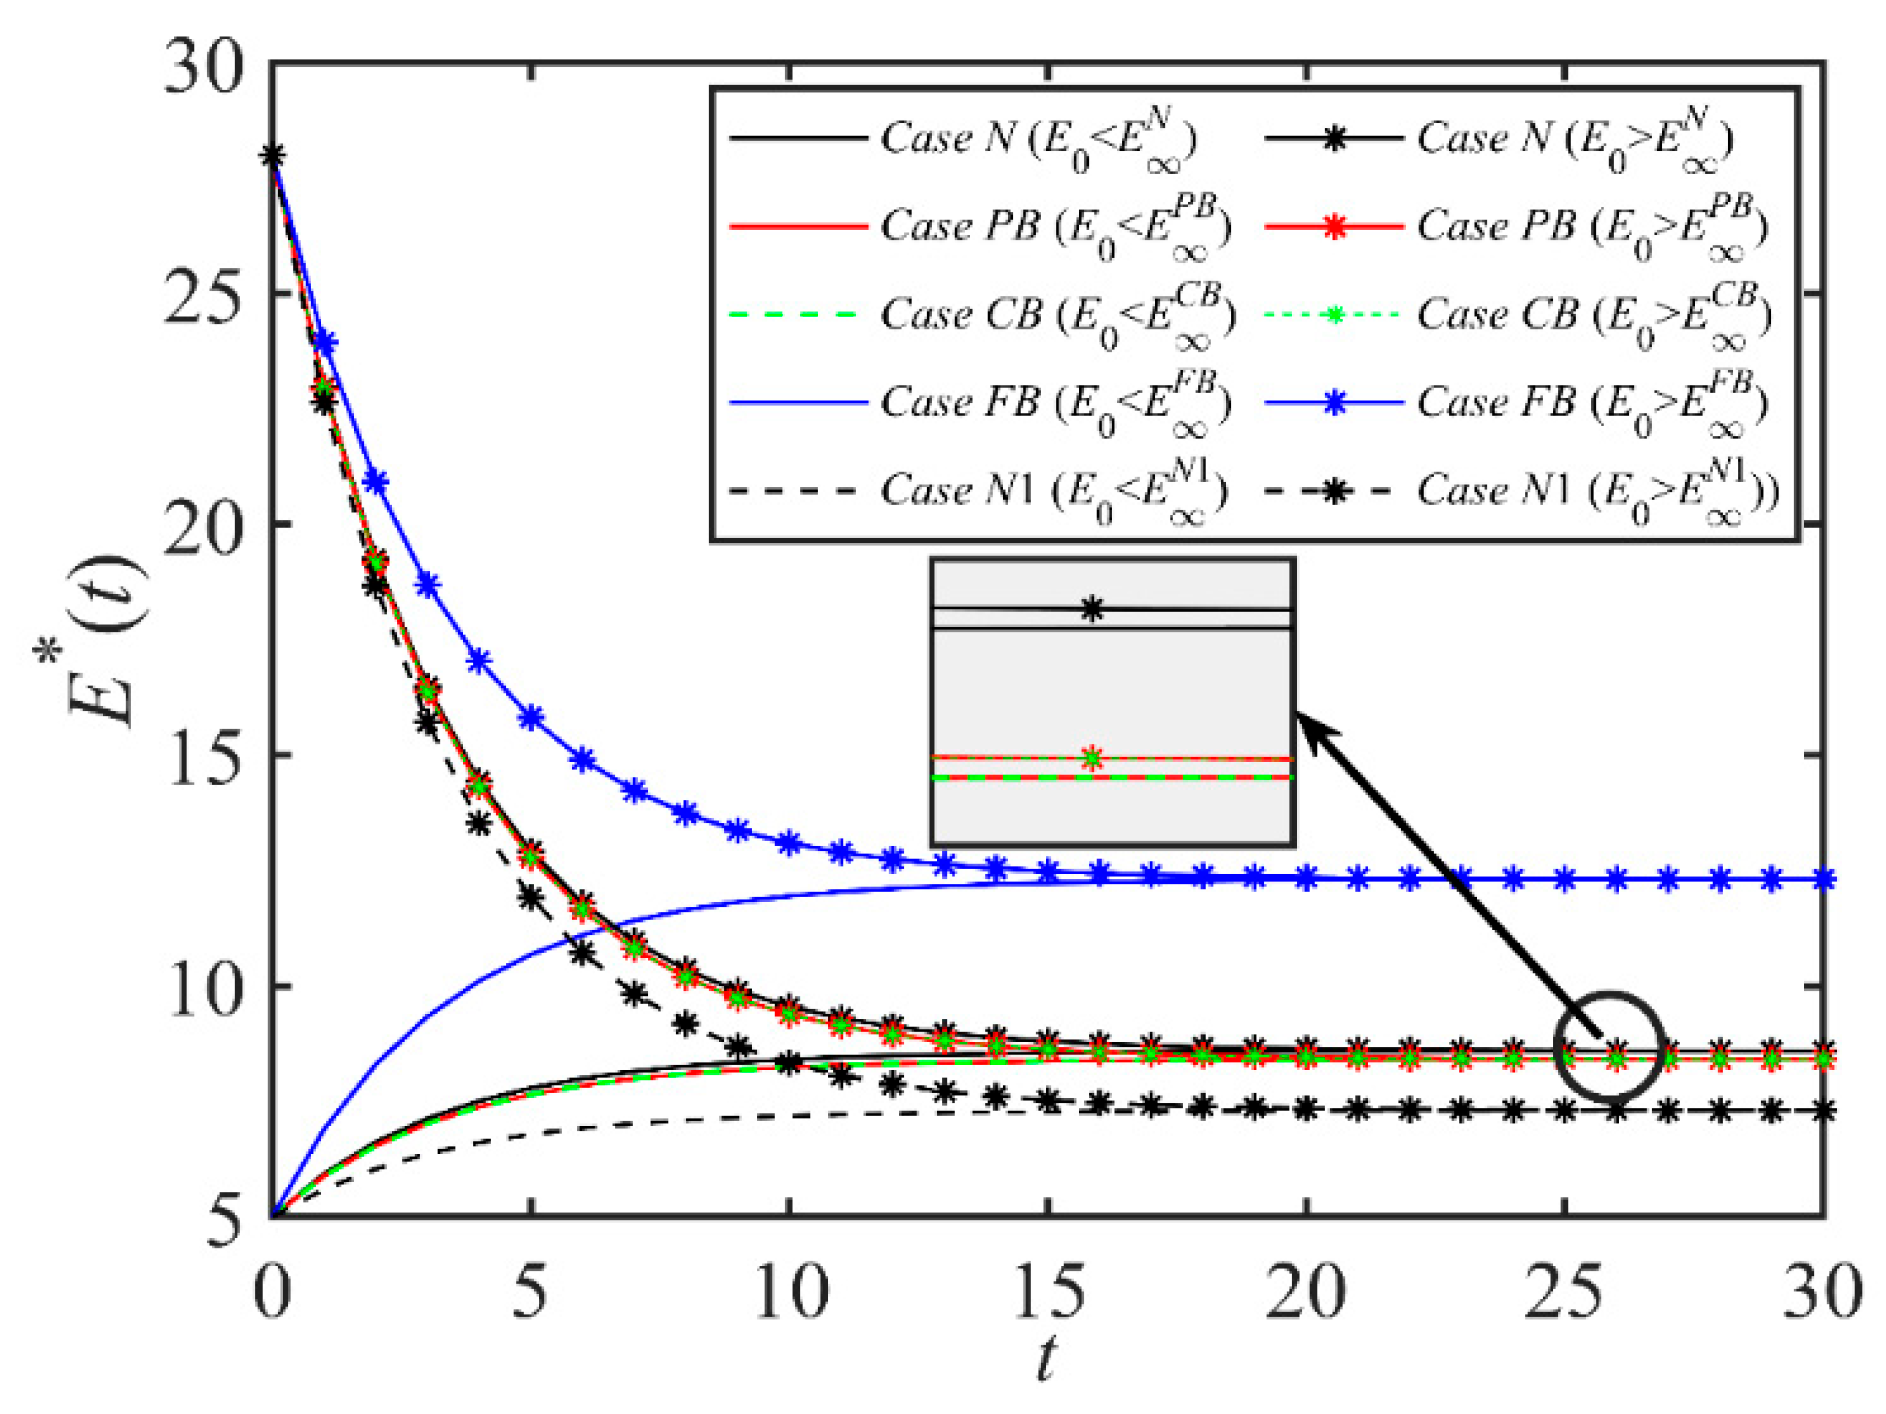
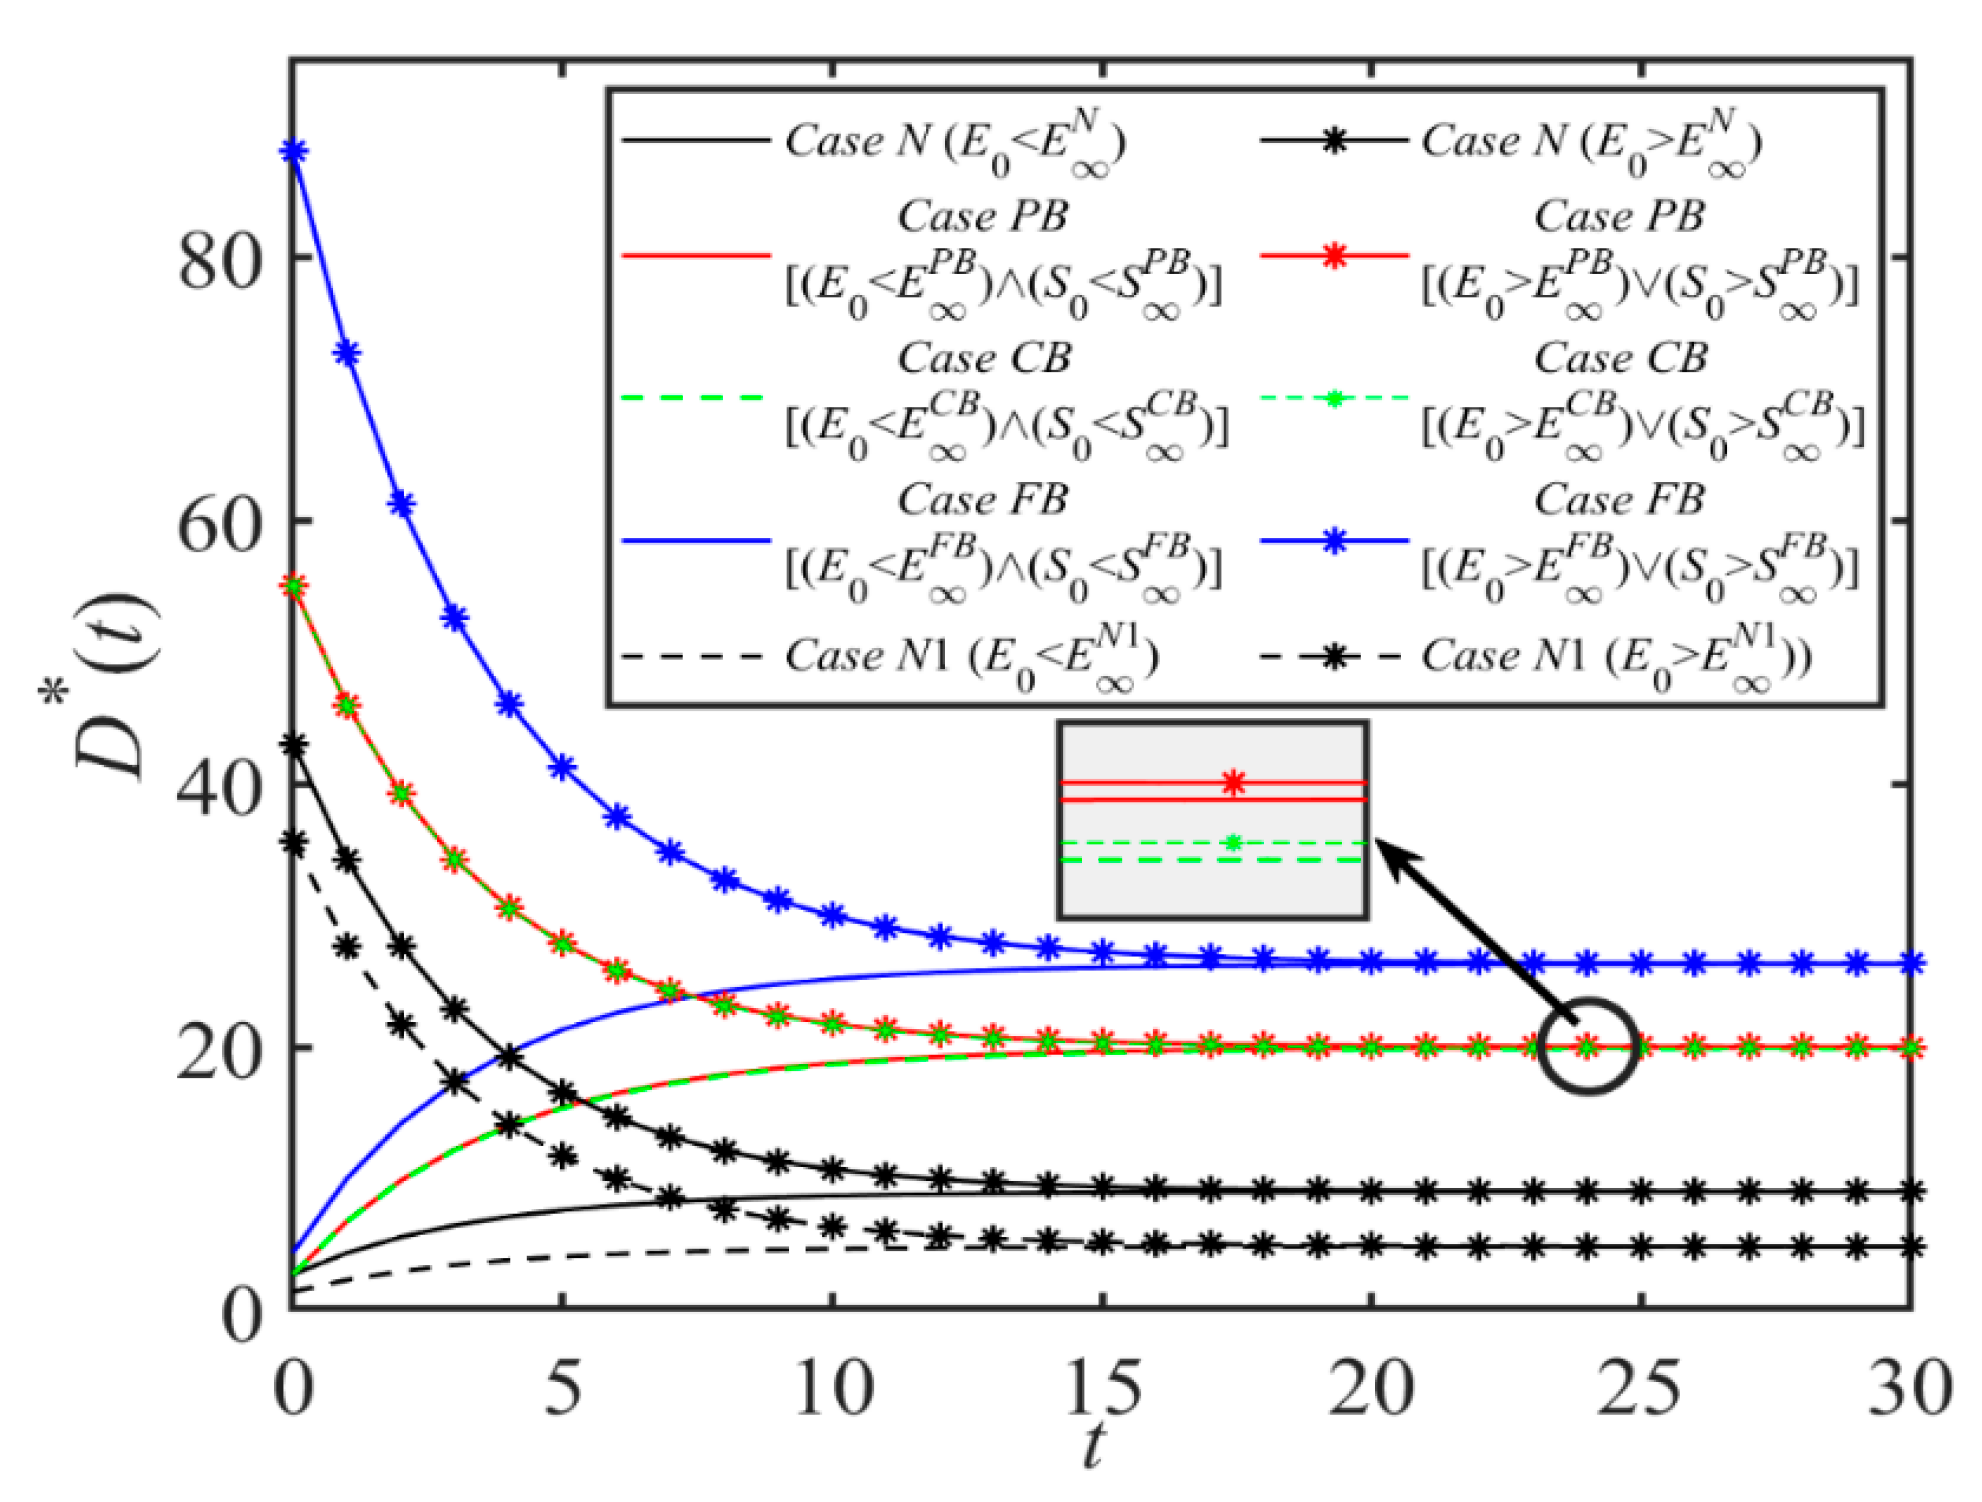
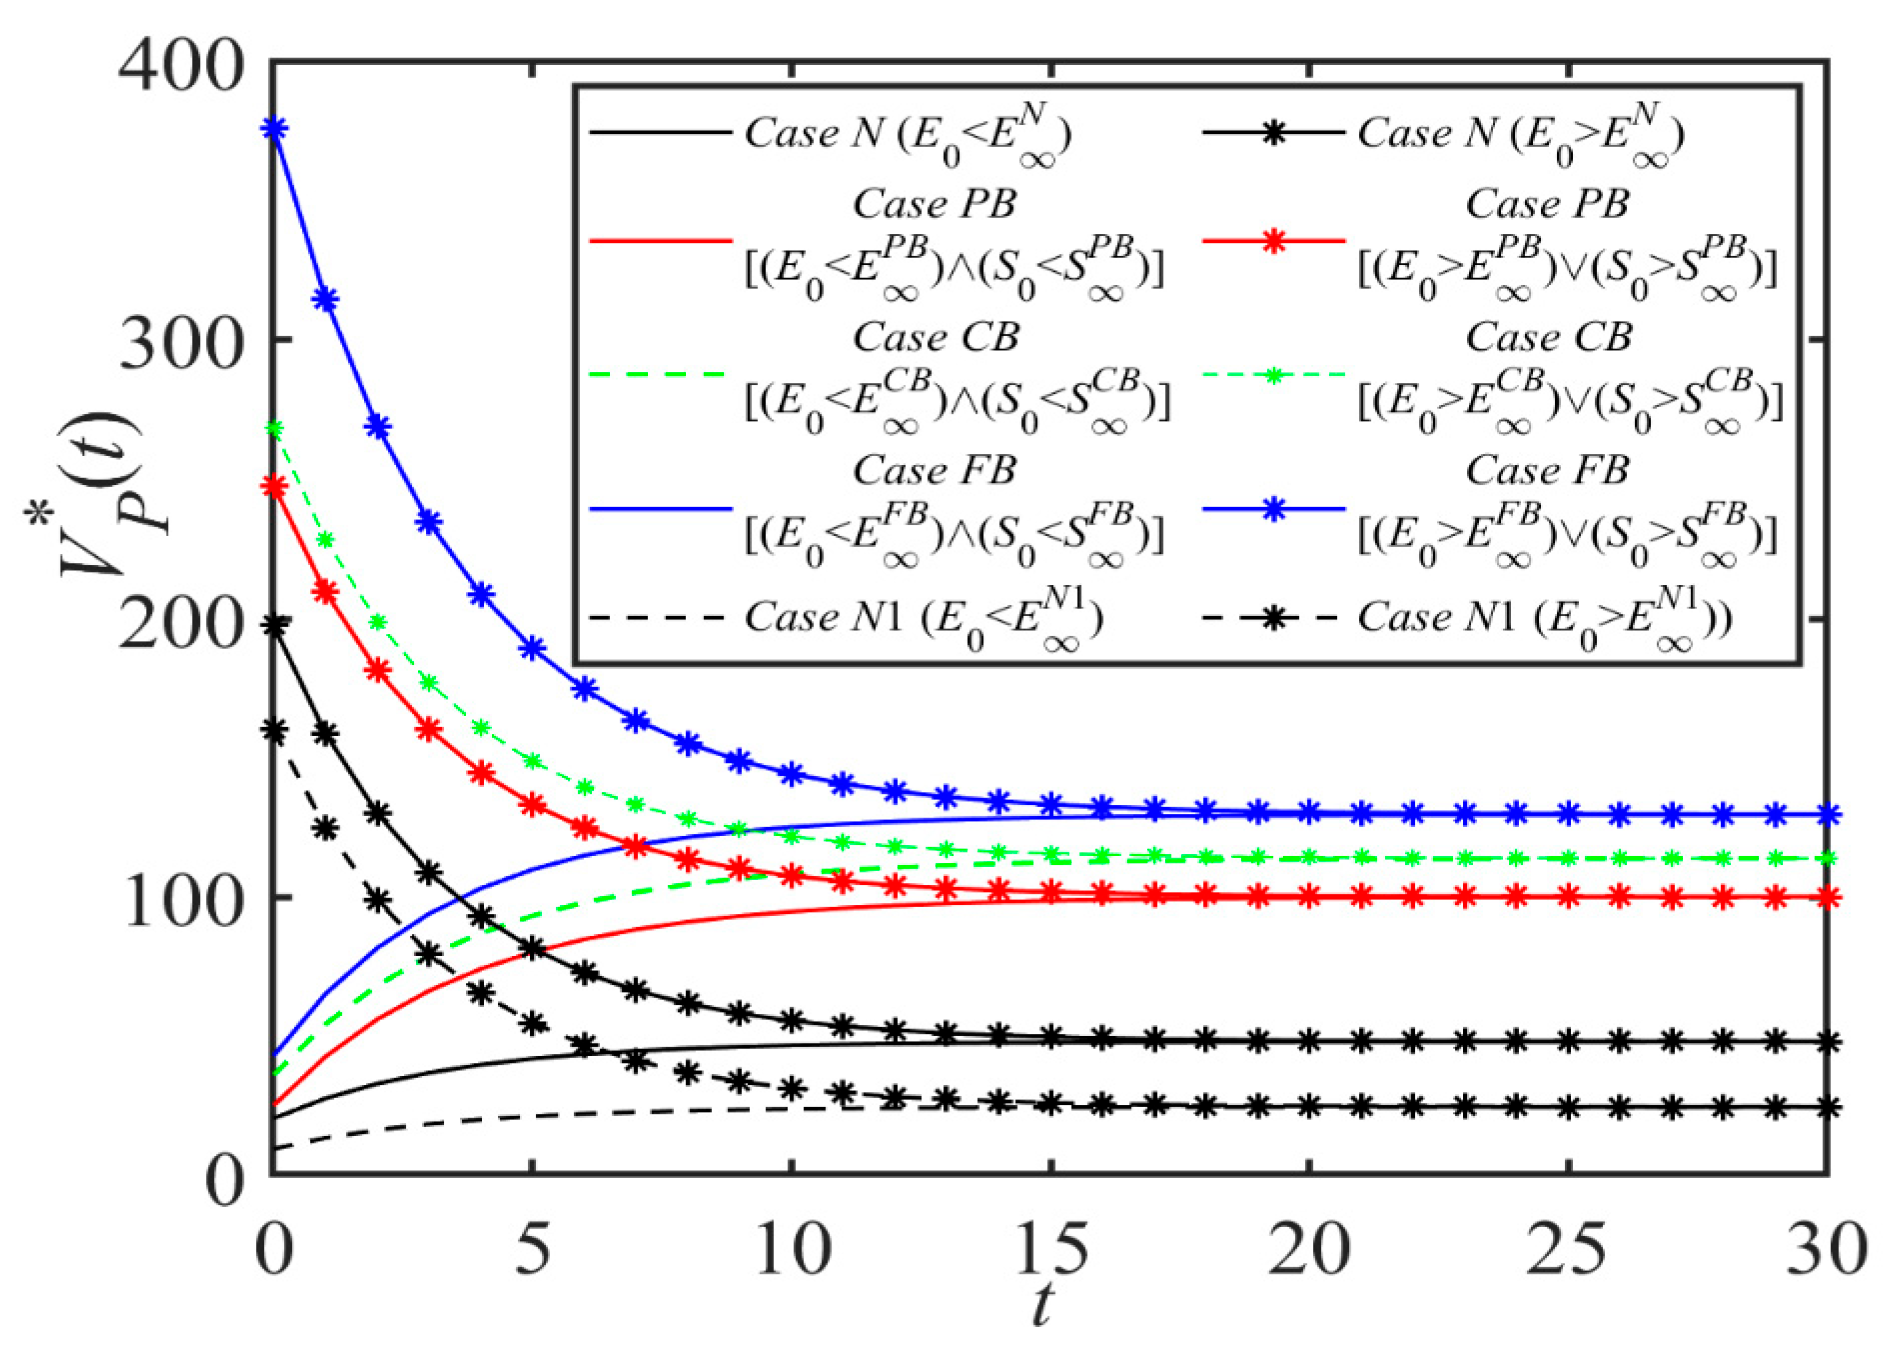
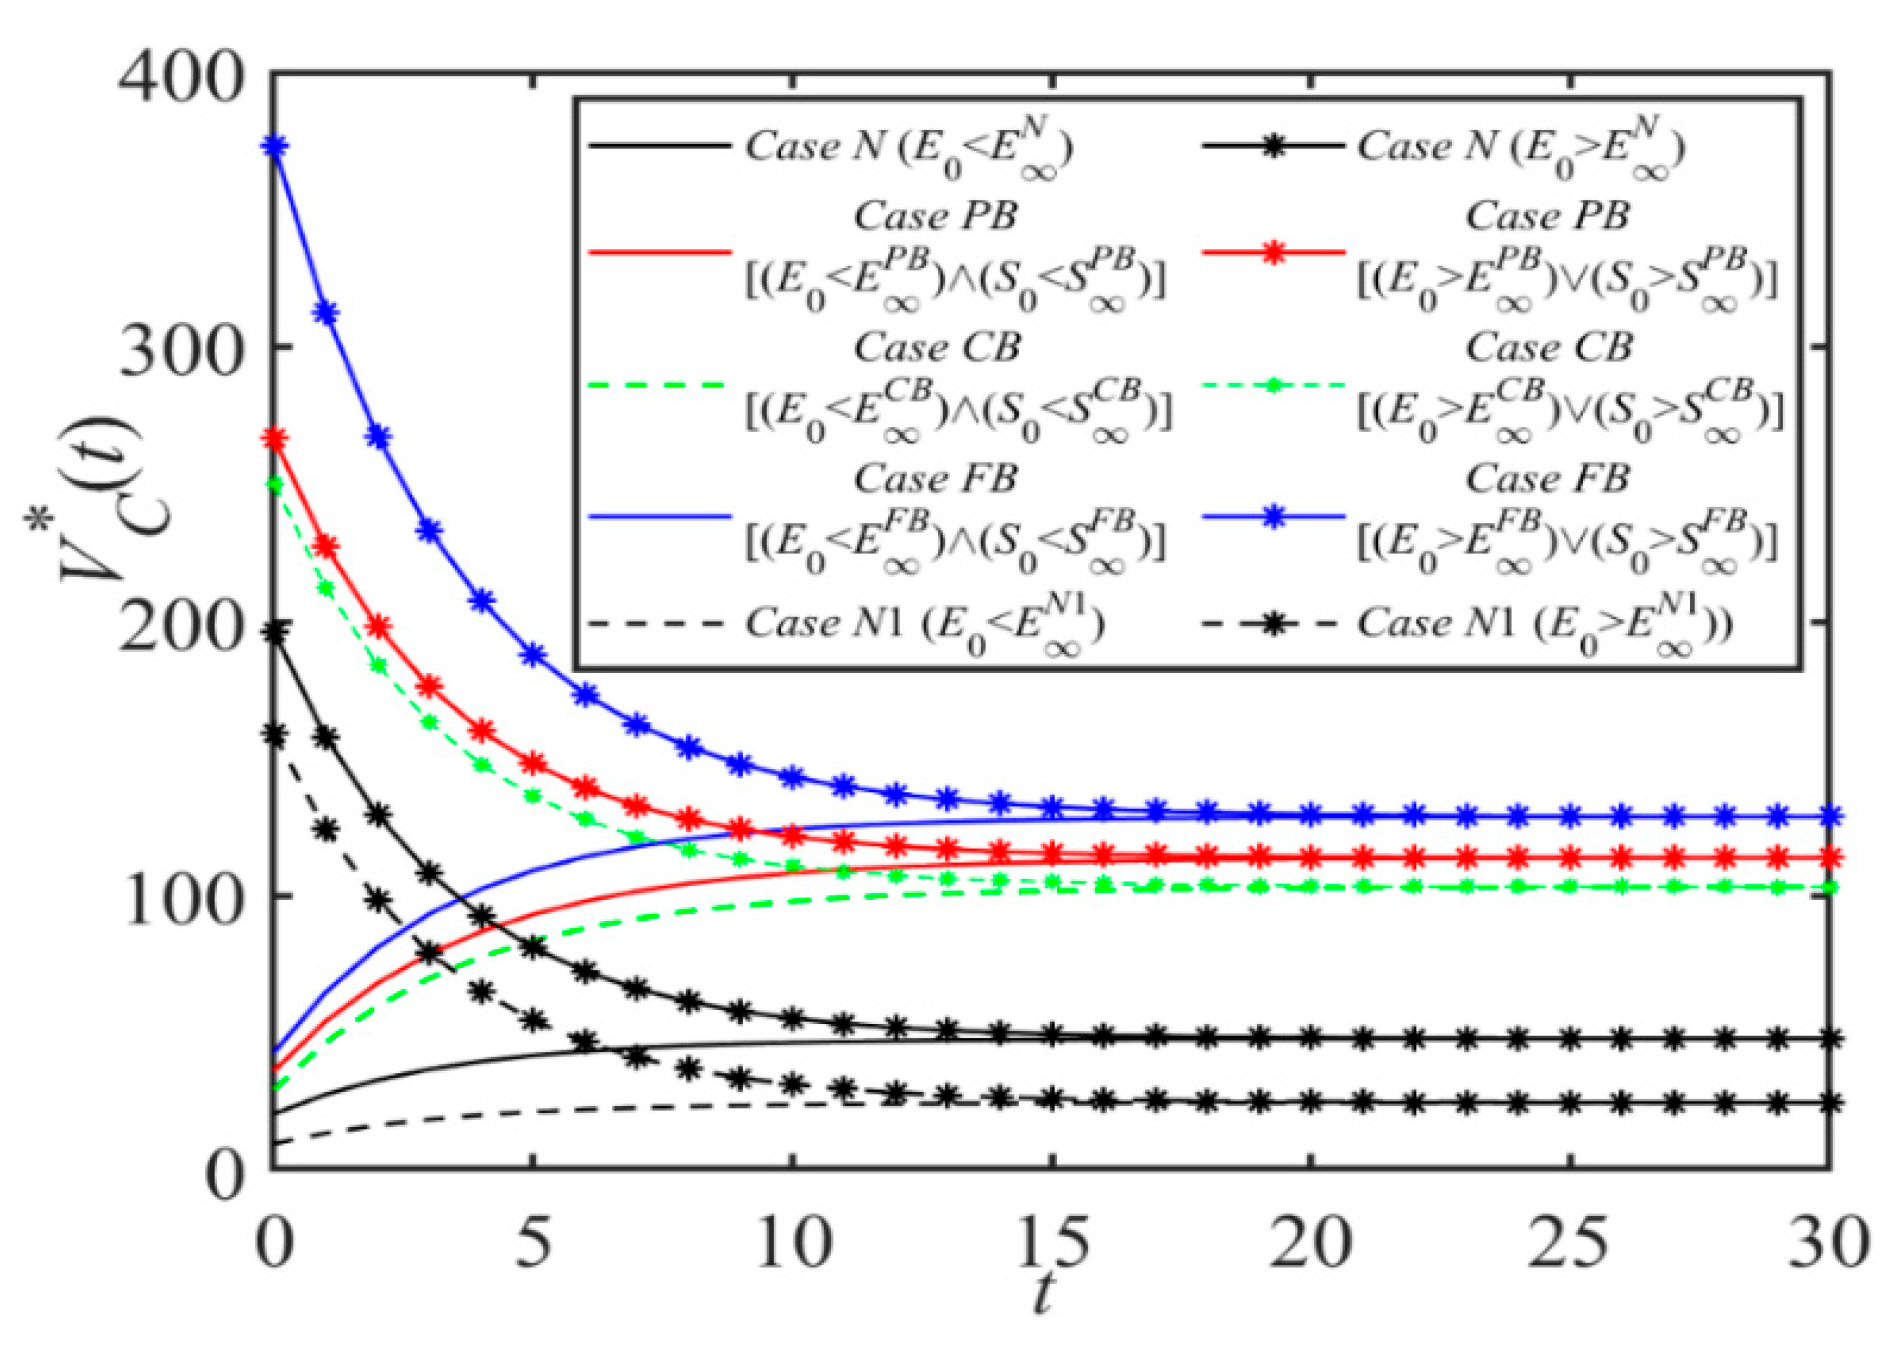
Proposition 1 shows the relationships between the emissions reduction level EN, shipping demand DN, expected discounted profit of shipping company VCN, expected discounted profit of port company VPN, and time t. We find that when time t is sufficiently small, EN, DN, VCN, VPN increase with t if the initial emissions reduction level E0, cost coefficient k, h, c of the shipping supply chain are small. This indicates a trend where companies aim to elevate emission cuts and boost demand, concurrently lowering costs, thereby enhancing profitability. It is also worth noting that the evolution of EN, DN, VCN, VPN with time t will eventually converge to a steady state, regardless of the changes in other parameters. This is because in the long run, companies will strive to increase their level of emissions reduction and increase their profits by reducing costs while increasing demand. In this process, companies constantly adjust their own decisions, such as emissions reduction efforts and green investment levels, to achieve a balance between costs and benefits. When a relatively stable state is reached, levels of emissions reductions, demand, and profits also tend to be stable.
Proposition 2.
PB Scenario:
(i) 
When t < tth0PB, we find that if E 0 E P B   o r   p p t h 0 P B   o r   α α t h 0 P B o r   γ γ t h 0 P B   o r   u u t h 0 P B   o r   θ θ t h 0 P B o r   k k t h 0 P B   o r   h h t h 0 P B   o r   ω ω t h 0 P B   o r   c 0 c 0 t h 0 P B   o r   c 1 c 1 t h 0 P B o r [ ( h k u 2 θ 2 ) ( r r t h 0 P B ) ]   o r   [ ( h k < u 2 θ 2 ) ( r < r t h 0 P B ) ] , then E P B t > 0 ; otherwise, E P B t < 0 ; When t ≥ tth0PB, we have E P B t = 0 ; where tth0PB is the time node in (0, +∞);
(ii) 
When t < tth1PB, we find that if S 0 S P B   o r   r r t h 1 P B   o r   β β t h 1 P B o r   φ φ t h 1 P B   o r   η η t h 1 P B   o r   ω ω t h 1 P B   o r   c 0 c 0 t h 1 P B , then S P B t > 0 ; otherwise, S P B t < 0 ; When t ≥ tth1PB, we have S P B t = 0 ; where tth1PB is the time node in (0, +∞);
(iii) 
When t <max{tth0PB, tth1PB}, we find that if   [ ( E 0 E P B ) ( S 0 S P B ) ] , then DPB(t), VCPB(t), and VPPB(t) will inevitably increase with time t; When t ≥ max{tth0PB, tth1PB}, we have ∂ DPB/∂ t = 0, ∂ VCPB/∂ t = 0, and ∂VPPB/∂ t = 0; Otherwise, DPB(t), VCPB(t), and VPPB(t) may increase or decrease with time t, depending on the rate of increase or decrease in the state equations EPB(t) and SPB(t);
(iv) 
We confirm that the relevant important critical points in Scenario PB can be found in Supplementary S2.
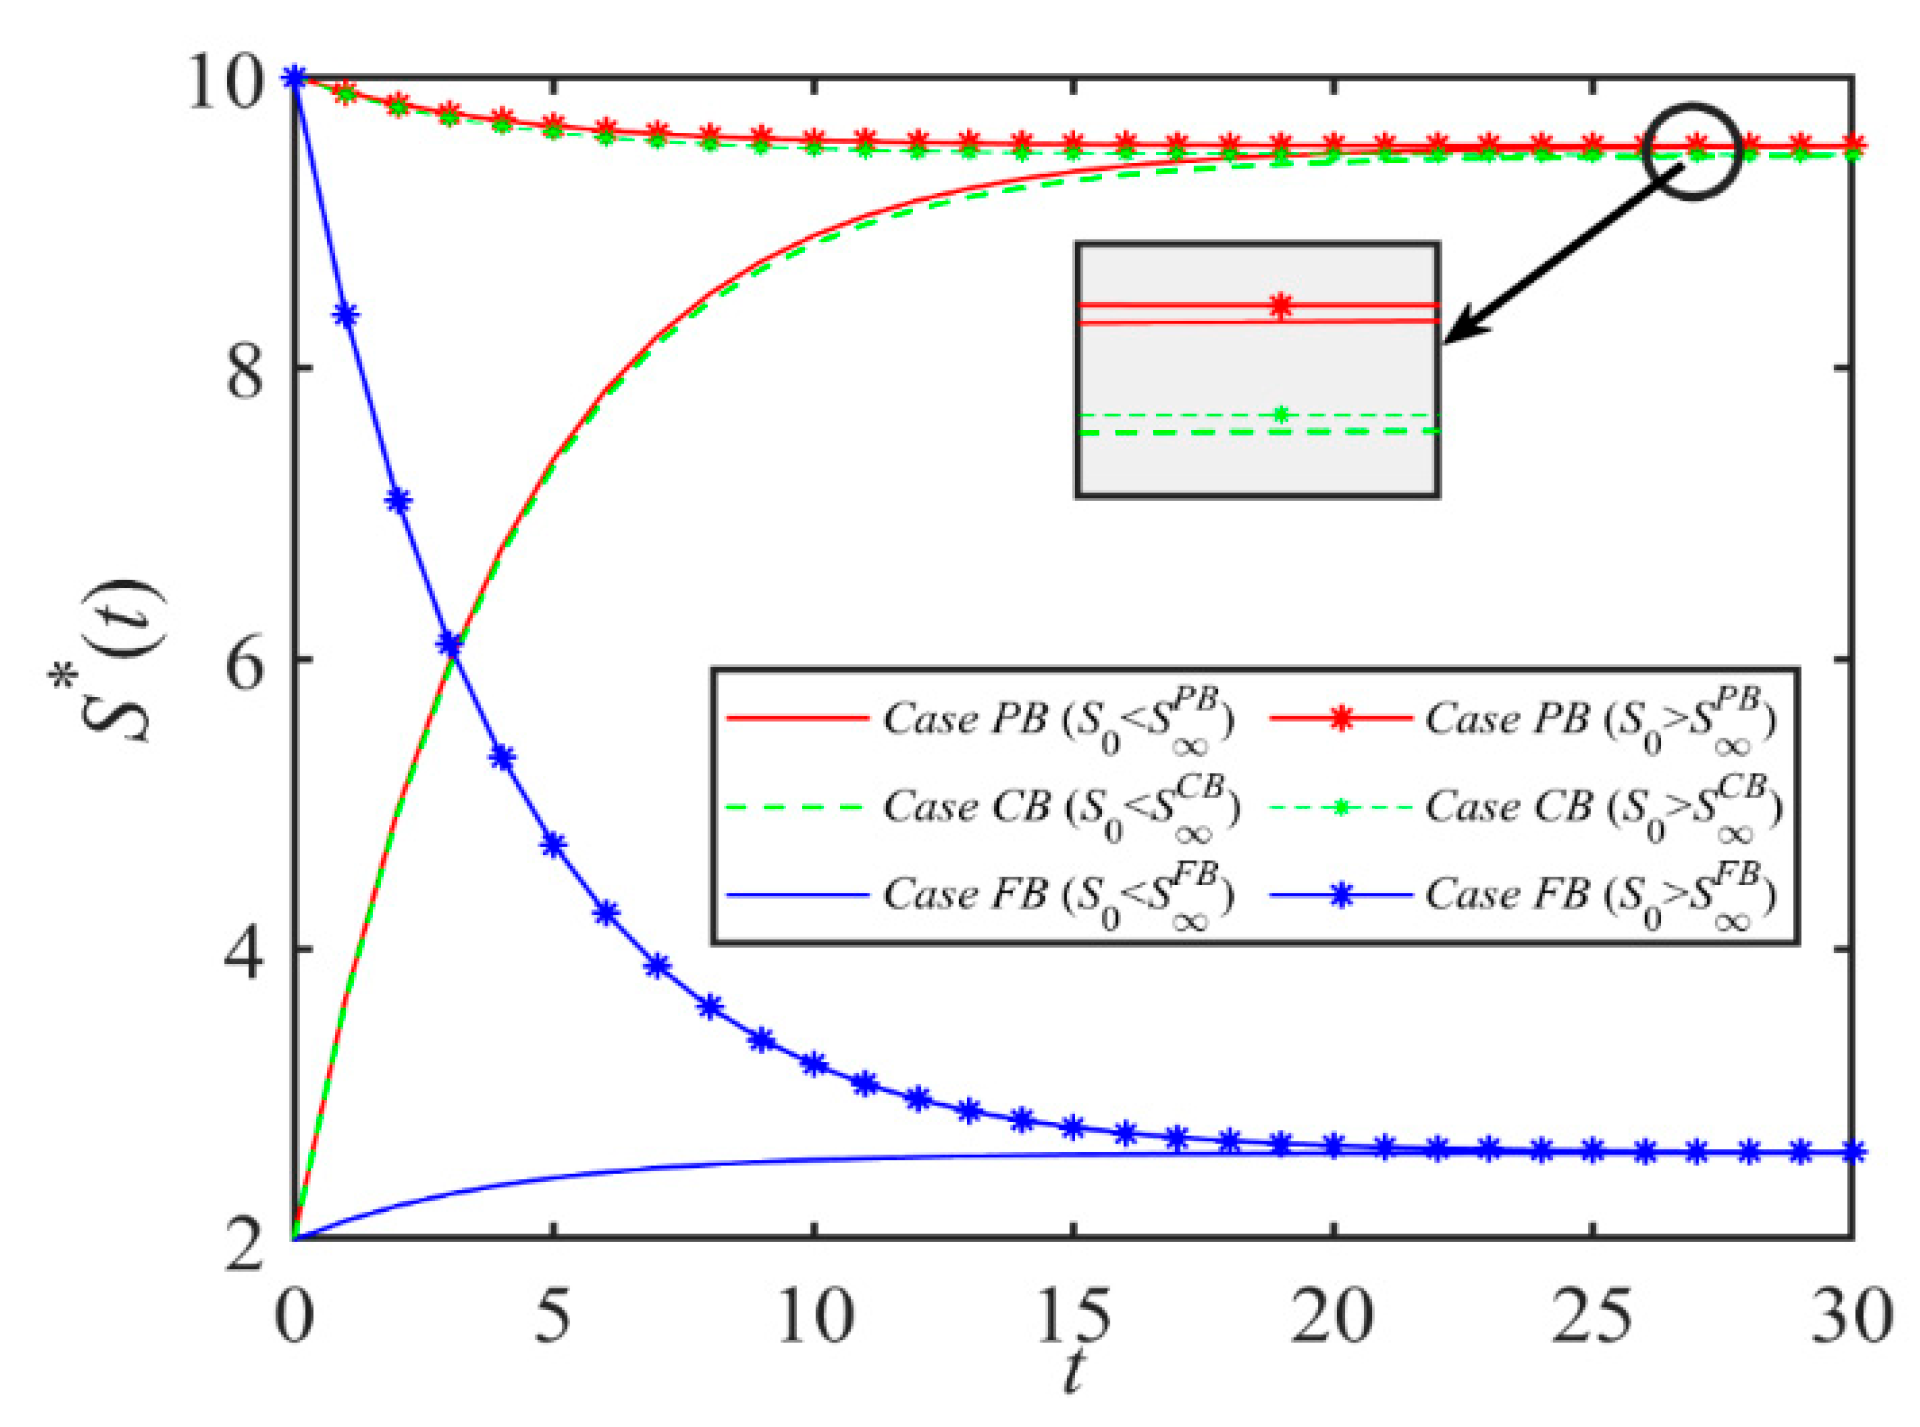
Proposition 2 states that in the PB scenario, the dynamic evolution process of emissions reduction level EPB, shipping service level SPB, demand DPB, and related profit function with time has obvious regularity. When time t is small enough, we find that the shipping service level SPB is proportional to t if the initial shipping service level S0, η, ω, c0 decrease, or if r, β, φ increase. This is because in this case, the benefits of ports investing in blockchain technology, such as improved efficiency in customs clearance and enhanced transparency in logistics, can notably improve shipping service quality due to alterations in initial conditions and variables, which in turn lead to a positive correlation between service levels and time. When t is less than the maximum value between two critical values, DPB(t), VCPB(t), and VPPB(t) increase with time t if the condition that both E0 and S0 decrease is satisfied. Moreover, when t is infinite, its dynamic evolution will eventually converge to the steady state. The port company achieves a greater degree of emissions reduction by introducing blockchain technology. At the same time, the application of these technologies also improves service levels, thereby increasing profits.
Proposition 3.
CB Scenario:
(i) 
When t < tth0CB, we find that if E 0 E C B   o r   p p t h 0 C B   o r   α α t h 0 C B o r   γ γ t h 0 C B   o r   u u t h 0 C B   o r   θ θ t h 0 C B o r   k k t h 0 C B   o r   h h t h 0 C B   o r   ω ω t h 0 C B   o r   c 0 c 0 t h 0 C B   o r   c 1 c 1 t h 0 C B   o r [ ( h k u 2 θ 2 ) ( r r t h 0 C B ) ]   o r   [ ( h k < u 2 θ 2 ) ( r < r t h 0 C B ) ] , then E C B t > 0 ; otherwise, E C B t < 0 ; When t ≥ tth0CB, we have E C B t = 0 ; where tth0PB is the time node in (0, +∞);
(ii) 
When t < tth1CB, we find that if S 0 S C B   o r   r r t h 1 C B   o r   β β t h 1 C B   o r   φ φ t h 1 C B   o r   η η t h 1 C B   o r   ω ω t h 1 C B   o r   c 1 c 1 t h 1 C B , then S C B t > 0 ; otherwise, S C B t < 0 ; When t ≥ tth1CB, we have S C B t = 0 ; where tth1CB is the time node in (0, +∞);
(iii) 
When t <max{tth0CB, tth1CB}, we find that if [ ( E 0 E C B ) ( S 0 S C B ) ] , then DCB(t), VCCB(t), and VPCB(t) will inevitably increase with time t; When t ≥ max{tth0CB, tth1CB}, we have ∂ DCB/∂ t = 0, ∂ VCCB/∂ t = 0, and ∂VPCB/∂ t = 0; Otherwise, DPB(t), VCCB(t), and VPCB(t) may increase or decrease with time t, depending on the rate of increase or decrease in the state equations ECB(t) and SCB(t);
(iv) 
We confirm that the relevant important critical points in Scenario CB can be found in Supplementary S2.
Proposition 3 is similar to Proposition 2. When t is sufficiently small and certain conditions are satisfied, ECB, SCB, DCB(t), VCCB(t), and VPCB(t) increase with t, with a vice versa decrease. All of these eventually converge to the steady state as time t evolves. Proposition 3 (iii) states that when t < max{tth0CB, tth1CB}, if the initial emissions reduction level and service level meet certain conditions, DCB(t), VCCB(t) and VPCB(t) are proportional to time t.
Although blockchain adoption by shipping companies increases investment costs, it enhances supply chain management efficacy. Through blockchain technology, companies gain real-time cargo tracking, optimize routes, and improve handling efficiency, thereby reducing operational costs. Simultaneously, blockchain improves transparency and operational efficiency, enabling shippers to monitor cargo status more accurately, which strengthens trust and supports emissions reduction initiatives. Furthermore, elevated service levels and customer satisfaction attract more clients, expand market share, and boost profits. These dynamics demonstrate the CB scenario’s positive impacts: blockchain investments create synergistic relationships across supply chain factors, offering critical insights for corporate decision-making.
Proposition 4.
FB Scenario:
(i) 
When t < tth0FB, we find that if E 0 E F B   o r   p p t h 0 F B   o r   α α t h 0 F B   o r   γ γ t h 0 F B   o r   u u t h 0 F B   o r   θ θ t h 0 F B o r   k k t h 0 F B   o r   h h t h 0 F B   o r   c b c b t h 0 F B   o r   c 0 c 0 t h 0 F B   o r   c 1 c 1 t h 0 F B   o r [ ( h k u 2 θ 2 ) ( r r t h 0 F B ) ]   o r   [ ( h k < u 2 θ 2 ) ( r < r t h 0 F B ) ] , then E F B t > 0 ; otherwise, E F B t < 0 ; When t ≥ tth0FB, we have E F B t = 0 ; where tth0FB is the time node in (0, +∞);
(ii) 
When t < tth1FB, we find that if S 0 S F B   o r   β β t h 1 F B   o r   φ φ t h 1 F B   o r   c b c b t h 1 F B o r   η η t h 1 F B   o r   ω ω t h 1 F B   o r   c 2 c 2 t h 1 F B , then S F B t > 0 ; otherwise, S F B t < 0 ; When t ≥ tth1FB, we have S F B t = 0 ; where tth1FB is the time node in (0, +∞);
(iii) 
When t <max{tth0FB, tth1FB}, we find that if  [ ( E 0 E F B ) ( S 0 S F B ) ] , then DFB(t), VCFB(t), VPFB(t), and VFFB(t) will inevitably increase with time t; When t ≥ max{tth0CB, tth1CB}, we have ∂ DFB/∂ t = 0, ∂ VCFB/∂ t = 0, ∂VPFB/∂ t = 0, and ∂VFFB/∂ t = 0; Otherwise, DFB(t), VCFB(t), VPFB(t), and VFFB(t) may increase or decrease with time t, depending on the rate of increase or decrease in the state equations EFB(t) and SFB(t);
(iv) 
We confirm that the relevant important critical points in Scenario FB can be found in Supplementary S2.
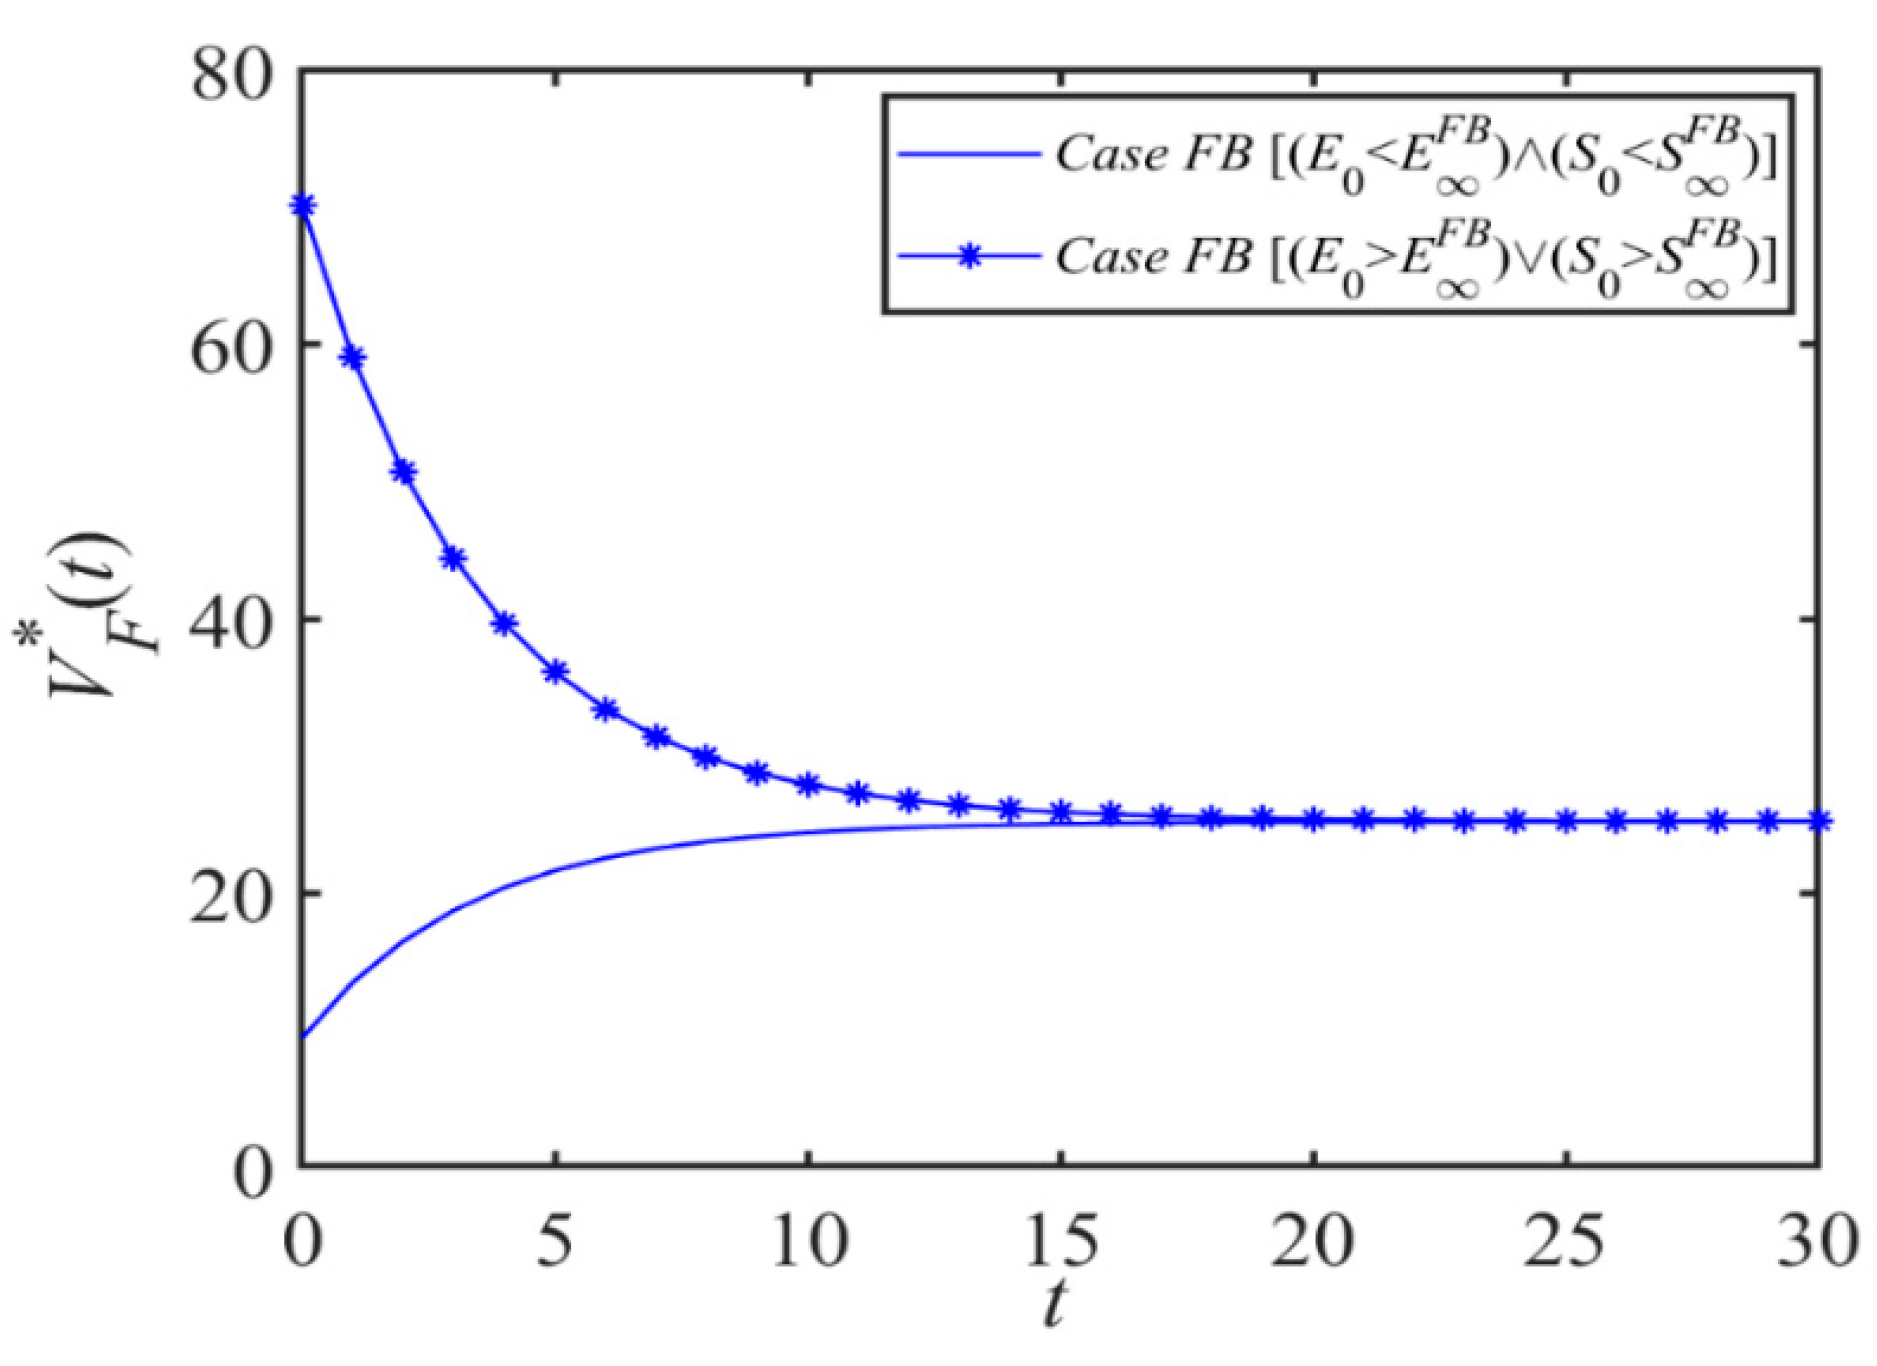
Proposition 4 indicates that EFB is proportional to t if E0, k, h, cb, c0, c1 are satisfied when t < tth0FB is sufficiently small. Unlike Proposition 3, Proposition 4 considers the blockchain usage fee charged by shipping logistics blockchain platform cb, and EFB is also proportional to t when cb < cbth0FB. The reverse is inversely proportional. When t < tth1FB, the shipping service level SFB is proportional to t if S0, cb, η, ω, c2 is smaller or β, φ is larger; otherwise, it is inversely proportional. In addition, when t is less than the maximum value between two critical values, DFB(t), VCFB(t), and VPFB(t) increase with time t if the condition that both E0 and S0 decrease is satisfied. When t is infinitely large, its dynamic evolution will eventually converge to the steady state.
This proposition demonstrates that blockchain technology provides a secure, transparent, efficient, and convenient shared-service network platform for port and shipping enterprises. Through blockchain platforms, diversified services and multi-tier functional frameworks can be implemented across controlled processes, enabling online-offline collaboration for cargo operations, dynamic logistics chain tracking, operational efficiency improvements, and overall cost reduction. For instance, the Shanghai Blockchain Paperless Order Exchange Platform has established a high-reliability alliance chain infrastructure, integrating all port and shipping logistics stakeholders as nodes. This system facilitates blockchain-based recording of user profiles, logistics data, and business interactions.

5.2. Parameter Analysis

As detailed in Section 5.1, the port’s vessel emission rates (VERs) stabilize across various scenarios, reaching equilibrium without further temporal fluctuations. Consequently, this section conducts a steady-state parametric analysis of port VERs, offering valuable insights into the enduring effects of government policies aimed at encouraging emissions reductions by port operators.
Proposition 5.
In different Scenarios, the impacts of shipping price p and port service fee r on the optimal decisions are analyzed as follows:
(i) 
a i * p > 0 a i * r < 0 ;
(ii) 
g i * p = 0 g i * r > 0 ;
(iii) 
b j * p = 0 ,   w h e n   j = P B , F B > 0 ,   w h e n   j = C B b j * r > 0 ,   w h e n   j = P B < 0 ,   w h e n   j = C B = 0 ,   w h e n   j = F B ;
(iv) 
E i * p > 0 i f     θ k u 2 h ,   t h e n   E i * r 0 i f     θ < k u 2 h ,   t h e n   E i * r < 0 ;
(v) 
S j * p = 0 ,   w h e n   j = P B , F B > 0 ,   w h e n   j = C B S j * r > 0 ,   w h e n   j = P B < 0 ,   w h e n   j = C B = 0 ,   w h e n   j = F B ;
(vi) 
i f     α α t h 1 i ,   t h e n   D i * p 0 i f     α < α t h 1 i ,   t h e n   D i * p < 0 i f     θ k u 2 h ,   t h e n   D N ,   P B ,   F B * r 0 a n d   φ φ t h 2 C B ,   t h e n   D C B * r 0 φ > φ t h 2 C B ,   t h e n   D C B * r < 0 i f     θ < k u 2 h ,   t h e n   D N ,   C B ,   F B * r < 0 a n d   φ φ t h 2 P B ,   t h e n   D P B * r 0 φ > φ t h 2 P B ,   t h e n   D P B * r > 0 ;
i = N, PB, CB, FB; j = PB, CB, FB.
See Supplementary S2 for relevant important critical points regarding Proposition 5.
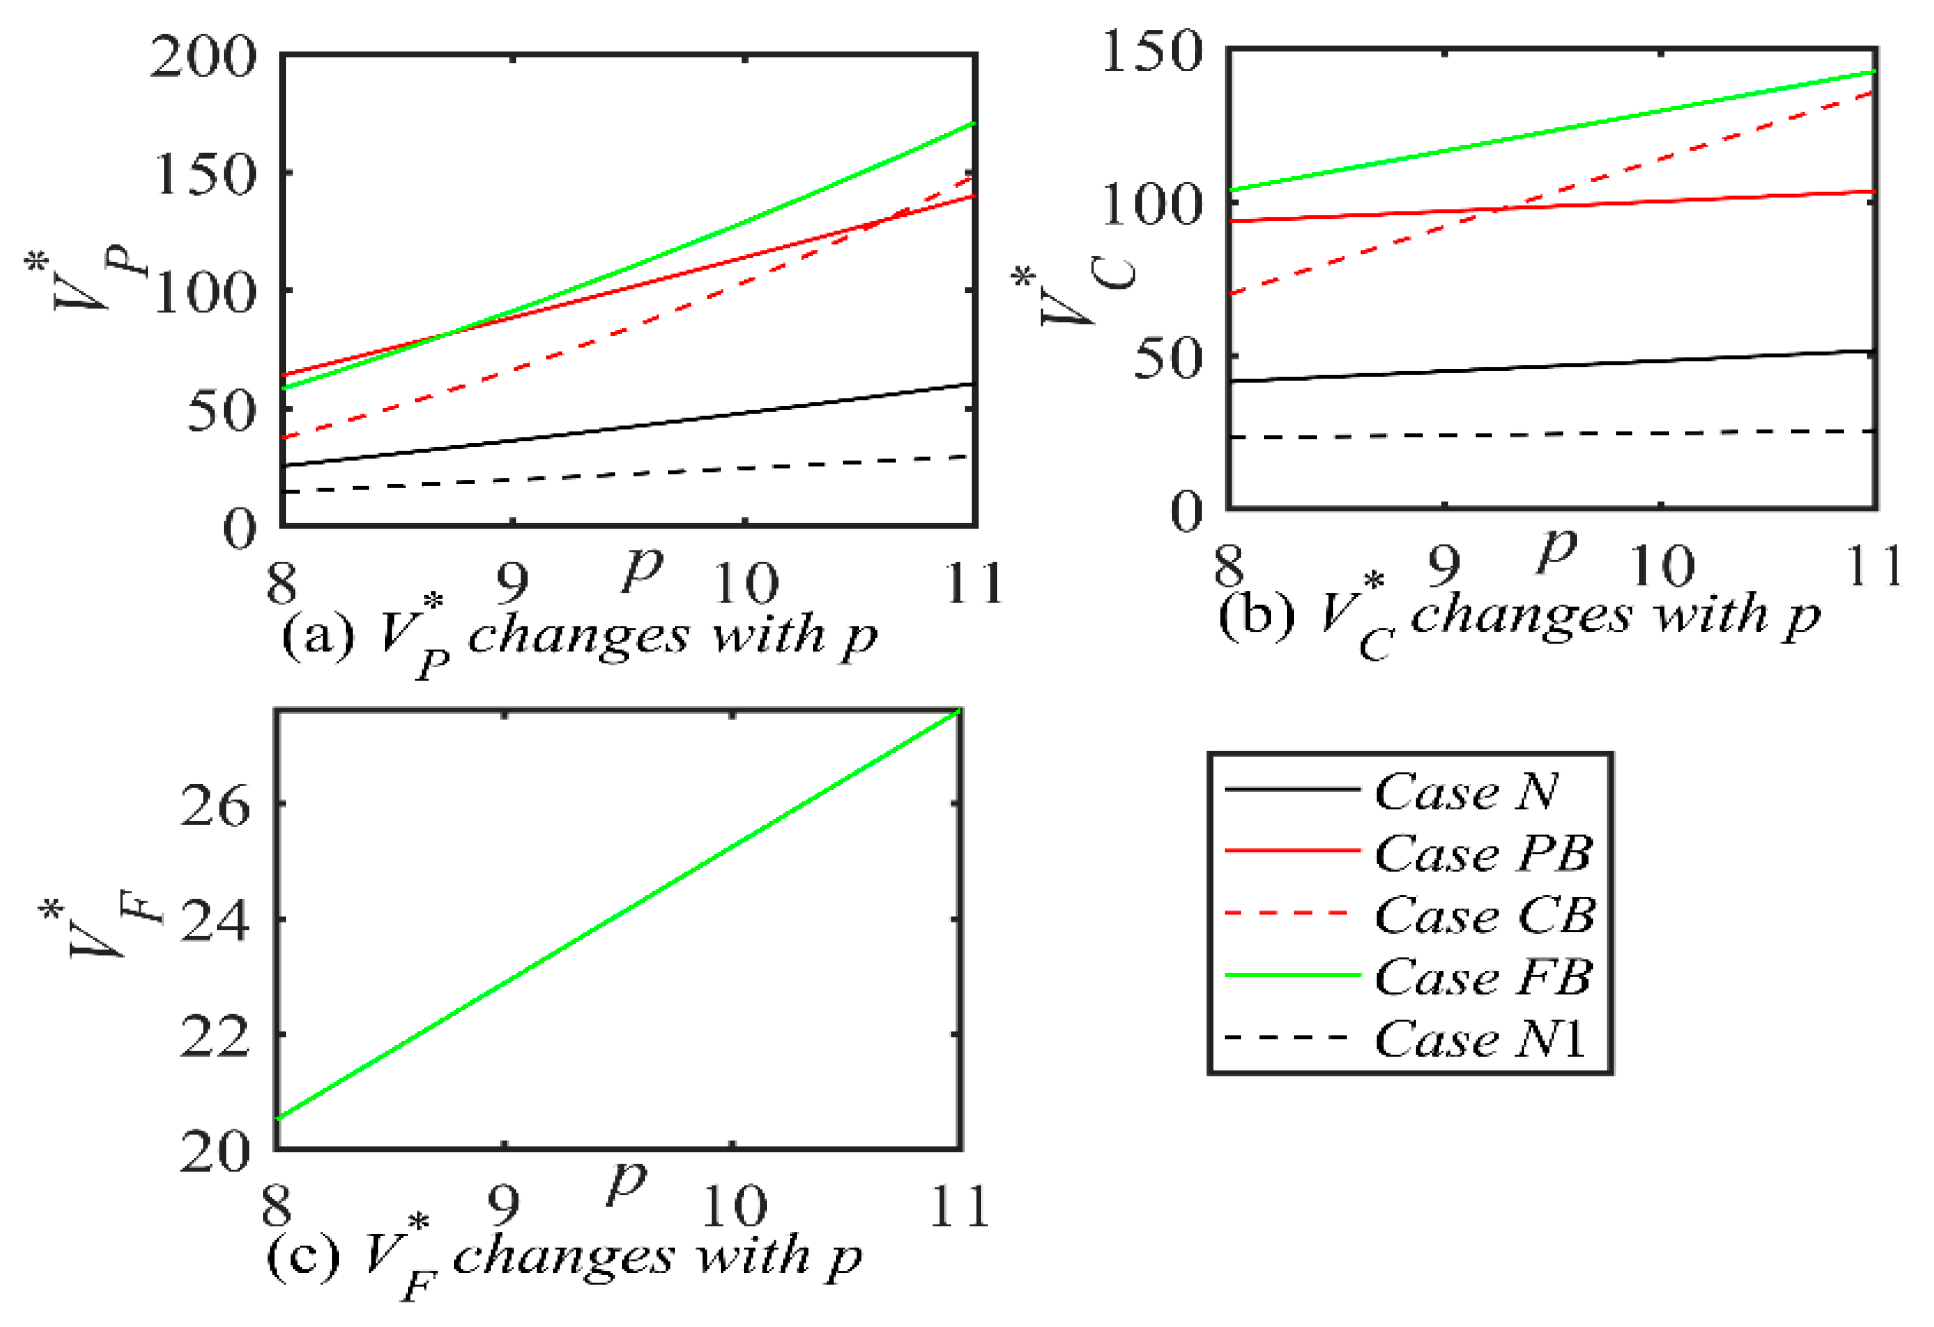
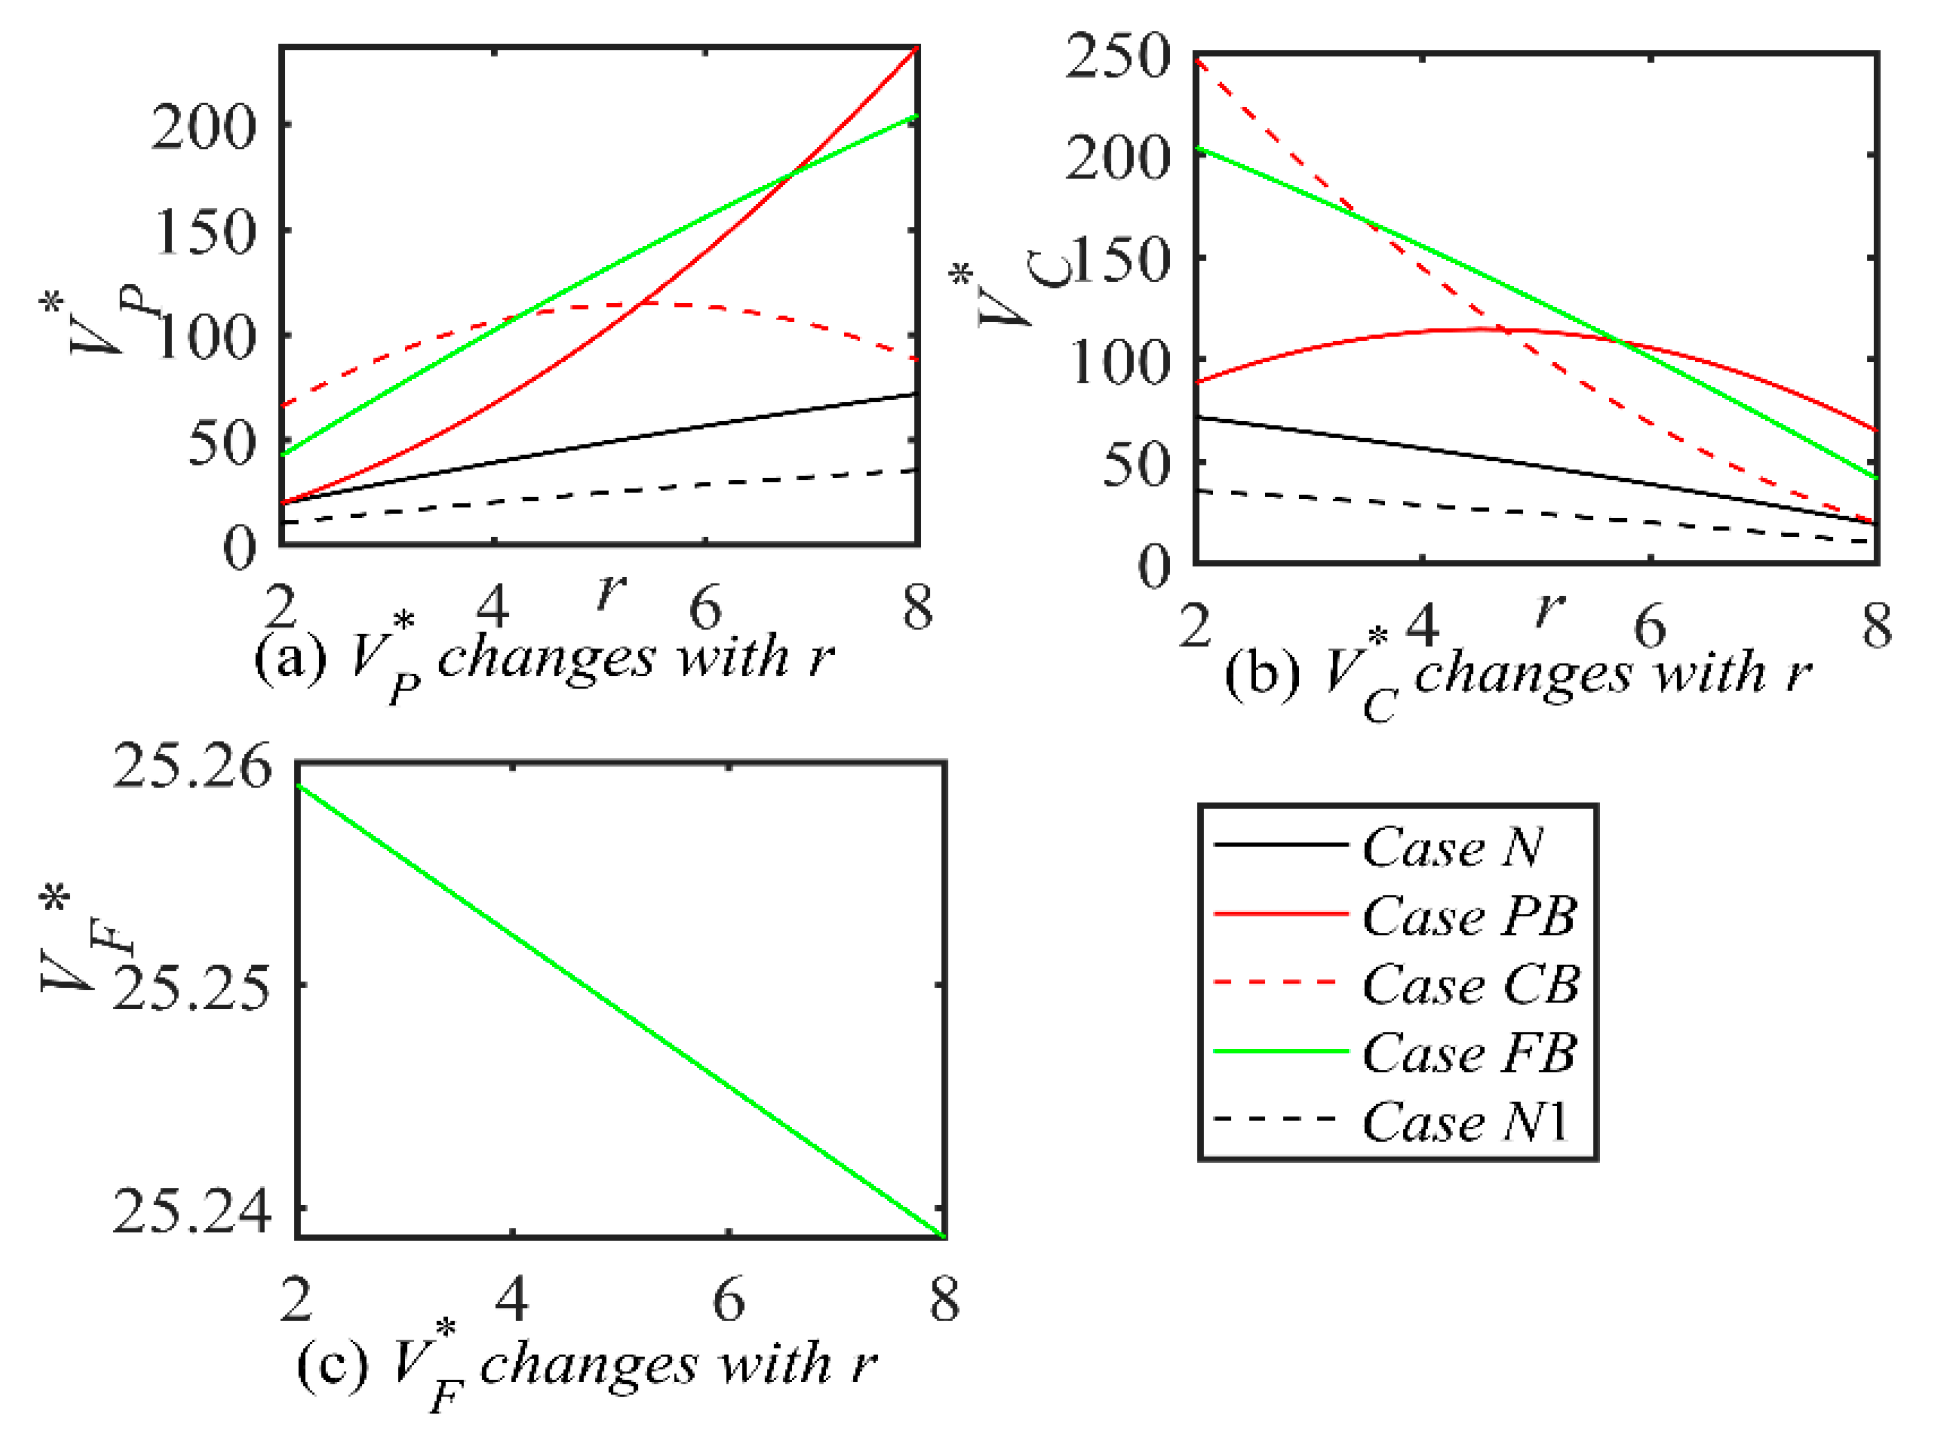
Proposition 5 shows that the shipping company’s emissions reduction efforts ai* are positively correlated with p and negatively correlated with r. This means that shipping companies will see their costs increase as they undertake emissions reduction efforts. In order to cover these additional costs, shipping companies may increase their shipping fees. Improving operational efficiency through emissions reduction measures reduces the cost of services provided by shipping companies at ports. The port’s green investment level gi* is not correlated with p but is positively correlated with r, which suggests that the port will increase the service fee to increase the level of green investment. In the PB and FB cases, blockchain investment level bj* is not correlated to p. In CB, bj* is positively correlated with p. So bj* has a different relationship with r in the three scenarios. Emissions reduction level Ei* is positively correlated with p. If θ is large enough, Ei* is positively related to r. The shipping service level Sj* is positively or negatively correlated or is uncorrelated with p and r under certain conditions. In addition, when α is large enough, shipping demand Di* is positively related to p. When θ is large enough, DN,PB,FB are positively correlated with r, and DCB is positively correlated with r when φ is small enough. This suggests that the relationship between shipping demand and p and r is also affected by relevant influencing factors, so shipping companies and ports need to better cope with the uncertainty of shipping demand, improve competitiveness, and maintain sustainable development in the changing market environment.
Proposition 6.
In different Scenarios, the impacts of parameters related to low-carbon-preference shippers (i.e., α, β, γ) on the optimal decisions are analyzed as follows:
(i) 
a i * α > 0 , a i * β = 0 , a i * γ > 0 ;
(ii) 
g i * α > 0 , g i * β = 0 , g i * γ > 0 ;
(iii) 
b j * α = 0 , b j * β > 0 , b j * γ = 0 ;
(iv) 
E i * α > 0 , E i * β = 0 , E i * γ > 0 ;
(v) 
S j * α = 0 , S j * β > 0 , S j * γ = 0 ;
(vi) 
D i * α > 0 , D i * β = 0 , D i * γ > 0 ;
where i = N, PB, CB, FB; j = PB, CB, FB.
Proposition 6 reveals that ai*, gi*, Ei*, Di* are positively correlated with α, γ and uncorrelated with β. There is a positive correlation between shipping companies’ emissions reduction efforts and ports’ green investments, indicating that ports’ green infrastructure and technology investments enhance shipping companies’ low-carbon transportation outcomes. If the proportion of low-carbon-priority shippers rises, this reflects growing demand for low-carbon transportation, steering the industry toward a greener trajectory. However, bj*, Sj* are uncorrelated with α, γ and positively correlated with β. This suggests that the proportion of low-carbon-preference shippers and their low-carbon preferences do not significantly affect blockchain investment levels or shipping service levels under blockchain systems. The positive correlation indicates that as the application level of blockchain technology in shipping services increases, shippers’ satisfaction with transportation services also rises. In other words, higher blockchain adoption levels lead to greater shipper sensitivity to service quality as expectations for high-quality service are met.
Proposition 7.
In different Scenarios, the impacts of parameters related to port and shipping emissions reduction and shipping service (i.e., u, θ, φ) on the optimal decisions are analyzed as follows:
(i) 
a i * u > 0 , a i * θ = 0 , a i * φ = 0 ;
(ii) 
g i * u = 0 , g i * θ > 0 , g i * φ = 0 ;
(iii) 
b j * u = 0 , b j * θ = 0 , b j * φ > 0 ;
(iv) 
E i * u > 0 , E i * θ > 0 , E i * φ = 0 ;
(v) 
S j * u = 0 , S j * θ = 0 , S j * φ > 0 ;
(vi) 
D i * u > 0 , D i * θ > 0 , D i * φ = 0 ,   w h e n     i = N > 0 ,   w h e n     i = P B , C B , F B ;
where i = N, PB, CB, FB; j = PB, CB, FB.
Proposition 7 shows that ai*, Ei*, Di* is positively correlated with u. Similarly, gi*, Ei*, Di* is positively correlated with θ. Furthermore, bj*, Sj* is positively correlated with φ. Where Di* is uncorrelated with φ in scenario N and positively correlated in the other scenarios. Proposition 7 (i)–(iii) illustrate that when ports, shipping companies, and blockchain technology have greater factors affecting the level of emissions reduction in the shipping supply chain, their respective investment levels are higher. The uncorrelation of Ei* and φ in Proposition 7 (iv) suggests that current blockchain investments are not being effectively used in emissions reduction efforts in the shipping supply chain, or that the application of blockchain technology is not yet mature enough to have a significant impact on emissions reductions. Proposition 7 (v) shows that the shipping service level Sj* is only related to the influence of the BIL on ERL φ. From the conclusions of Proposition 7 (iv) and Proposition 7 (v), (vi) can be introduced.
Proposition 8.
In different Scenarios, the impacts of cost-related parameters on the shipping supply chain (i.e., k, h, η, ω, c0, c1, c2, cb) on the optimal decisions are analyzed as follows:
(i) 
a i * k = 0 , a i * h < 0 , a i * η = 0 , a i * ω = 0 ,   w h e n     i = N , P B , F B < 0 ,   w h e n     i = C B , a i * c 0 = 0 , a i * c 1 < 0 , a F B * c 2 = 0 , a F B * c b < 0 ;
(ii) 
g i * k < 0 , g i * h = 0 , g i * η = 0 , g i * ω = 0 ,   w h e n     i = N , C B , F B < 0 ,   w h e n     i = P B , g i * c 0 < 0 , g i * c 1 = 0 , g F B * c 2 = 0 , g F B * c b < 0 ;
(iii) 
b j * k = 0 , b j * h = 0 , b j * η < 0 , b j * ω < 0 , b j * c 0 < 0 ,   w h e n     j = P B = 0 ,   w h e n     j = C B , F B , b j * c 1 = 0 ,   w h e n     j = P B , F B < 0 ,   w h e n     j = C B , b F B * c 2 < 0 , b F B * c b > 0 ;
(iv) 
E i * k < 0 , E i * h < 0 , E i * η = 0 , E i * ω = 0 ,   w h e n     i = N , F B < 0 ,   w h e n     i = P B , C B , E i * c 0 < 0 , E i * c 1 = 0 , E F B * c 2 = 0 , E F B * c b < 0 ;
(v) 
S j * k = 0 , S j * h = 0 , S j * η < 0 , S j * ω < 0 , S j * c 0 < 0 ,   w h e n     j = P B = 0 ,   w h e n     j = C B , F B , S j * c 1 = 0 ,   w h e n     j = P B , F B < 0 ,   w h e n     j = C B , S F B * c 2 < 0 , S F B * c b > 0 ;
(vi) 
D i * k < 0 , D i * h < 0 , D i * η = 0 ,   w h e n     i = N < 0 ,   w h e n     i = P B , C B , F B , D i * ω = 0 ,   w h e n     i = N < 0 ,   w h e n     i = P B , C B , F B ,
D i * c 0 < 0 , D i * c 1 = 0 , D F B * c 2 < 0 ,
i f     φ φ t h 2 F B ,   t h e n     D F B * p 0 i f     φ < φ t h 2 F B ,   t h e n     D F B * p < 0 ;
i = N, PB, CB, FB; j = PB, CB, FB.
See Supplementary S2 for relevant important critical points regarding Proposition 8.
Proposition 8 shows how cost factors influence optimal choices across scenarios. For example, in Proposition 8 (i), ai* is not correlated with k, η, c0, c2 and is uncorrelated with ω in each scenario. In Proposition 8 (ii), the port’s green investment level gi* is uncorrelated with h, η, c1, c2 and uncorrelated with ω in a given scenario. An increase in k results in a decrease in the port’s green investment level gi*, suggesting that an increase in the green cost factor will squeeze the budget for blockchain investments. Meanwhile, the tightening of regulatory policies can be indirectly manifested in the increase of port green investment cost coefficient k in the model, which explains why in reality, some ports prioritize meeting compliance requirements over adopting blockchain technologies. In Proposition 8 (iii), the blockchain investment level bj* is uncorrelated with k and correlated with h. Ei* in Proposition 8 (iv) is uncorrelated with k, h, c1, cb. Sj* in Proposition 8 (v) is uncorrelated with k, h uncorrelated with c0, c1 in each scenario, and positively correlated with cb. In addition, the shipping demand Di* in Proposition 8 (vi) is uncorrelated with η, ω, c1 in the given scenario. Normally, an increase in the cost coefficient leads to a decrease in the optimal decision because the larger the input cost parameter is, the greater the input cost becomes. However, through the above analysis, we find that cost coefficients may be uncorrelated or even positively correlated with the optimal decision under certain circumstances, which may be attributed to the dynamics of the cost-revenue trade-off. When the rate of revenue increase matches the rate of cost coefficient growth, the firm’s optimal decision may remain unchanged. Although the cost coefficient increases, it can attract more shippers who prioritize information technology and service quality. This is beneficial to the port’s sustainable development in the long run, resulting in a positive correlation between the cost coefficient and the optimal decision.

5.3. Effects of Blockchain Technology

Our analysis of port VER parameters in Section 5.2’s steady-state examination revealed multiple advantages for both ports and shipping firms engaging in emissions reduction initiatives. Building on these findings, this section contrasts various blockchain scenarios against non-blockchain approaches, demonstrating how such technological integration can significantly enhance emissions reduction efforts.
Proposition 9.
Effects of blockchain technology established by the port company on the optimal decisions of the shipping supply chain are as follows:
  • (i) a P B * = a N * ; (ii) g P B * < g N * ; (iii) E P B * < E N * ; (iv) i f   ω ω t h 2 ,   t h e n   S P B * S 0 i f   ω > ω t h 2 ,   t h e n   S P B * < S 0 ;
  • (v) i f   φ 2 η X t h 1 ,   t h e n   D P B * D N * i f   φ 2 η < X t h 1 ,   t h e n   D P B * < D N * ;
See Supplementary S2 for relevant important critical points regarding Proposition 9.
Proposition 9 analyzes changes in emissions reduction levels and service levels when ports invest in blockchain platforms compared with non-blockchain scenarios. Proposition 9 (i) demonstrates that neither blockchain investment nor non-investment affects shipping companies’ emissions reduction efforts. From Proposition 9 (ii) and (iii), it can be observed that ports’ investment in blockchain technology reduces both the green investment level and emissions reduction level in the shipping supply chain compared to non-blockchain scenarios. This finding is unexpected due to the fact that in the PB scenario, ports are responsible for blockchain investments while shipping companies adjust their strategies as followers. The port’s investment in the blockchain may have taken away resources that would have been used for green investment. The Cost Assumptions section mentions that both the cost of green investment and the cost of blockchain investment are quadratic functions, which implies increasing marginal costs. The port allocates its budget between the two. An increase in blockchain investment may lead to a decrease in green investment. Proposition 9 (iv) indicates that shipping service levels under blockchain technology become higher when ω is sufficiently small, i.e., when blockchain unit operating costs remain low. When the blockchain unit operating cost ω exceeds a critical value ωth2, the level of blockchain investment bj* by ports and shipping companies drops significantly, even if the technology has perfect functionality. This maps to the reality of IBM-Maersk TradeLens’ dilemma, where small and medium-sized shipping companies have low adoption rates due to excessive technology licensing fees. In other words, elevated ω in the model directly affects the quality of service S(t) and the demand D(t) through the decline in bj*. According to Proposition 9 (v), transportation demand under blockchain technology exceeds that of non-blockchain scenarios beyond a specific threshold. This is because technological advancements following blockchain implementation reduce operational costs, aligning increased market demand with market dynamics and consequently expanding market share.
Proposition 10.
Effects of blockchain technology established by the shipping company on the optimal decisions of the shipping supply chain are as follows:
  • (i) a C B * < a N * ; (ii) g C B * = g N * ; (iii) E C B * < E N * ; (iv) i f   ω ω t h 3 ,   t h e n   S C B * S 0 i f   ω > ω t h 3 ,   t h e n   S C B * < S 0 ;
  • (v) i f   φ 2 η X t h 2 ,   t h e n   D C B * D N * i f   φ 2 η < X t h 2 ,   t h e n   D C B * < D N * ;
See Supplementary S2 for relevant important critical points regarding Proposition 10.
Proposition 10 analyzes shipping companies’ investment in blockchain technology. Proposition 10 (ii) demonstrates that blockchain investment decisions (whether to invest or not) do not affect the port’ s green investment level. From Proposition 10 (i) and (iii), it can be observed that a shipping company’ s blockchain investment reduces both the port’ s emissions reduction efforts and emissions reduction levels compared to non-blockchain scenarios. At first glance, this outcome appears to run counter to blockchain technology’s fundamental purpose. However, when shipping firms invest in blockchain systems, they incur substantial expenses—from acquiring specialized equipment to training personnel and covering various ancillary costs. These additional financial pressures have forced enterprises to reduce their budgets for research and development of emissions reduction technologies and equipment upgrading in the short term, thus objectively weakening their investment in environmental protection, and leading to a stage-by-stage decline in the effectiveness of emissions reduction. From Proposition 10 (iv), the shipping service level under blockchain technology is higher if ω is smaller, i.e., the blockchain unit operating cost is lower. This is because the lower blockchain unit operating costs allow shipping companies to leverage the benefits of blockchain technology more fully. According to Proposition 10 (v), the demand under blockchain technology is greater than the no blockchain scenario for a certain threshold. This is because as technological advances following blockchain investments bring down costs, the increase in market demand is in line with the changing patterns of the market, thus increasing market share.
Proposition 11.
Effects of the shipping logistics blockchain platform on the optimal decisions of the shipping supply chain are as follows:
(i) 
i f   c b λ ( p c 1 r ) 1 + λ ,   t h e n   a F B * a N * i f   c b < λ ( p c 1 r ) 1 + λ ,   t h e n   a F B * > a N * ;
(ii) 
i f   c b λ ( r c 0 ) 1 + λ ,   t h e n   g F B * g N * i f   c b < λ ( r c 0 ) 1 + λ ,   t h e n   g F B * > g N * ;
(iii) 
i f   c b λ ( k u 2 ( p c 1 r ) + h θ 2 ( r c 0 ) ) ( 1 + λ ) ( k u 2 + h θ 2 ) ,   t h e n   E F B * E N * i f   c b < λ ( k u 2 ( p c 1 r ) + h θ 2 ( r c 0 ) ) ( 1 + λ ) ( k u 2 + h θ 2 ) ,   t h e n   E F B * > E N * ;
(iv) 
i f   ω ω t h 4 ,   t h e n   S F B * S 0 i f   ω > ω t h 4 ,   t h e n   S F B * < S 0 ;
(v) 
i f   φ 2 η X t h   3 ,   t h e n   D F B * D N * i f   φ 2 η < X t h   3 ,   t h e n   D F B * < D N * ;
See Supplementary S2 for relevant important critical points in Proposition 11.
Proposition 11 focuses on the impact of a shipping logistics blockchain platform on optimal decision-making in the shipping supply chain, comparing scenarios with and without blockchain technology. Proposition 11 (i)(iii) illustrate that when the blockchain usage fee charged by the shipping logistics blockchain platform is low, the shipping company’s emissions reduction efforts, the port’s green investment level, and emissions reduction levels in the shipping supply chain are generally higher than in non-blockchain scenarios. This is because the lower blockchain usage fee lowers the threshold for port and shipping enterprises to use the technology, making them more willing to increase the application of blockchain technology at a manageable cost. When port and shipping companies join the shipping logistics blockchain platform, they can exchange data in real time and work together to formulate emissions reduction plans to further promote emissions reductions. From Proposition 11 (iv), it can be observed that blockchain platform operating costs decrease when ω is sufficiently small, i.e., when blockchain unit operating costs remain low. This enables improved shipping service levels following substantial blockchain technology investments. Blockchain’ s cost-efficient operations allow the platform to run with minimal expenses, paving the way for widespread adoption by port and shipping companies. This economic advantage makes the technology a viable solution for large-scale implementation across the industry. According to Proposition 11 (v), the demand under blockchain technology is greater than the no-blockchain case for a certain threshold. The application of blockchain technology can optimize supply chain management, improve transportation efficiency, and reduce operating costs. These cost reductions can translate into price advantages, attracting more customers to choose the shipping company’s services.

5.4. Blockchain Investment Strategy

Section 5.3 reveals that blockchain technology investments can boost demand under specific circumstances. Building on these findings, this section examines how operational approaches evolve when various stakeholders adopt blockchain solutions.
Proposition 12.
The comparative analysis of the two blockchain scenarios PB and CB is as follows:
(i) a P B * > a C B * ; (ii) g P B * < g C B * ; (iii) i f   p 2 r c 0 + c 1 ,   t h e n   b P B * b C B * i f   p > 2 r c 0 + c 1 ,   t h e n   b P B * < b C B * ;
(iv) i f   k θ 2 h u 2 ,   t h e n   E P B * E C B * i f   k θ 2 < h u 2 ,   t h e n   E P B * < E C B * ;
(v) i f   r 1 2 ( p + c 0 c 1 ) ,   t h e n   S P B * S C B * i f   r < 1 2 ( p + c 0 c 1 ) ,   t h e n   S P B * < S C B * ;
(vi) i f     r > 1 2 ( p + c 0 c 1 ) ,   k θ 2 > h u 2 ,   t h e n     D P B * > D C B *   i f     r 1 2 ( p + c 0 c 1 ) ,   k θ 2 h u 2 ,   t h e n     D P B * D C B *   i f     φ 2 η X t h   4 ,   t h e n   D P B * D C B * φ 2 η > X t h   4 ,   t h e n   D P B * < D C B * ;
See Supplementary S2 for relevant important critical points regarding Proposition 12.
Proposition 12 compares the differences in operational strategies between PB and CB blockchain scenarios. Proposition 12 (i) and (ii) state that if a port invests in blockchain technology, shipping companies will take more aggressive emissions reduction measures than under the CB model, while the port’ s green investment will be correspondingly lower. In the CB scenario, shipping companies as “edges” grasp core data such as ship emission trajectories and route efficiency, and ports as “nodes” rely on their shared information to adjust service strategies. This information symmetry structure of “strong edges and weak nodes” leads to a lower synergy efficiency of shipping emissions reduction efforts than in the PB scenario. In the PB scenario, the port, as the leading party of blockchain investment, has a guiding effect on the entire supply chain. Ports have improved supply chain transparency and collaboration through blockchain technology, prompting shipping companies to increase their efforts to reduce emissions to adapt to the new environment and remain competitive. As ports have focused on investing in blockchain technology, this has resulted in relatively fewer resources for green investment, which in turn has reduced the level of green investment. When the port service fee is higher, ports have higher levels of blockchain investment, emissions reductions, demand, and shipping service levels than shipping companies. When the port service fee is higher, the port’s level of blockchain investment, level of emissions reductions, level of de-demanding and level of shipping services are higher than those of the shipping company. This inconsistency with the common intuition that port-led investments better integrate resources and reduce costs is due to the fact that ports need to incur more blockchain infrastructure construction costs in PB scenarios, which in turn raises the cost of service. The more the port invests, the lower price makes consumer demand increase, which in turn leads to an increase in the level of emissions reduction and the level of service.
Proposition 13.
The comparative analysis of the two blockchain scenarios PB and FB is as follows:
(i) i f   c b λ ( p c 1 r ) 1 + λ ,   t h e n   a P B * a F B * i f   c b < λ ( p c 1 r ) 1 + λ ,   t h e n   a P B * < a F B * ; (ii) i f   c b λ ( r c 0 ) + ω 1 + λ ,   t h e n   g P B * g F B * i f   c b < λ ( r c 0 ) + ω 1 + λ ,   t h e n   g P B * < g F B * ;
(iii) i f   c b 1 2 ( r c 0 ω 1 + λ + c 2 + ω ) ,   t h e n   b P B * b F B * i f   c b > 1 2 ( r c 0 ω 1 + λ + c 2 + ω ) ,   t h e n   b P B * < b F B * ;
(iv) i f   c b h θ 2 ω + λ ( k u 2 ( p c 1 r ) + h θ 2 ( r c 0 ) ) ( 1 + λ ) ( k u 2 + h θ 2 ) ,   t h e n   E P B * E F B * i f   c b > h θ 2 ω + λ ( k u 2 ( p c 1 r ) + h θ 2 ( r c 0 ) ) ( 1 + λ ) ( k u 2 + h θ 2 ) ,   t h e n   E P B * > E F B * ;
(v) i f   c b ( r c 0 + c 2 ( 1 + λ ) + λ ω ) 2 ( 1 + λ ) ,   t h e n   S P B * S F B * i f   c b > ( r c 0 + c 2 ( 1 + λ ) + λ ω ) 2 ( 1 + λ ) ,   t h e n   S P B * < S F B * ;
(vi) i f     φ 2 η > X t h   5 ,   a n d   c b c b t h   2 ,   t h e n   D P B * D F B * c b > c b   t h   2 ,   t h e n   D P B * < D F B * i f     φ 2 η < X t h   5 ,   a n d   c b c b   t h   2 ,   t h e n   D P B * D F B * c b < c b   t h   2 ,   t h e n   D P B * < D F B *   i f     φ 2 η = X t h   5 ,   a n d   c 2 c 2   t h   2 ,   t h e n   D P B * D F B * c 2 < c 2   t h   2 ,   t h e n   D P B * < D F B *   ;
See Supplementary S2 for relevant important critical points regarding Proposition 13.
Proposition 13 analyzes the blockchain usage fee charged by shipping logistics blockchain platforms. When royalty fees are set at higher levels, emissions reduction efforts by shipping companies and green investment levels by ports under the PB scenario exceed those under the FB scenario. This occurs because shipping companies and ports proactively intensify emissions reduction initiatives to achieve cost savings. In the PB scenario, where the port leads blockchain investments, elevated user fees incentivize ports to prioritize operational efficiency improvements and energy consumption reduction as compensatory measures. These strategic adjustments further motivate shipping companies to enhance their emissions reduction efforts in alignment with the port’ s overarching sustainability goals. Conversely, in the FB scenario, despite joint participation by ports and shipping enterprises in the blockchain platform, high operational costs create significant pressure on cost-sharing mechanisms among stakeholders. This financial burden may partially inhibit enthusiasm for green investments and emissions reduction initiatives. When the fee is low, the port still bears the main investment cost. This may limit the port’s ability to invest in other emissions reduction related areas, resulting in a relatively low level of emissions reduction. However, ports have absolute control over the application of technology and service enhancement resulting in higher service levels. The multi-party consensus mechanism in the FB scenario ensures that the green investment effect of the port is synchronized with the emissions reduction efforts of the shipping companies in real time, forming a positive feedback mechanism of “node emission reduction–edge response”. In the PB scenario, the port, as the single dominant party, may ignore the actual operational constraints of the shipping company, resulting in a decrease in symmetric collaboration efficiency.
Proposition 14.
The comparative analysis of the two blockchain scenarios CB and FB is as follows:
(i) 
i f   c b λ ( p r c 1 ) + ω 1 + λ ,   t h e n   a C B * a F B * i f   c b < λ ( p r c 1 ) + ω 1 + λ ,   t h e n   a C B * < a F B * ;
(ii) 
i f   c b λ ( r c 0 ) 1 + λ ,   t h e n   g C B * g F B * i f   c b < λ ( r c 0 ) 1 + λ ,   t h e n   g C B * < g F B * ;
(iii) 
i f   c b 1 2 ( p r c 1 ω 1 + λ + c 2 + ω ) ,   t h e n   b C B * b F B * i f   c b > 1 2 ( p r c 1 ω 1 + λ + c 2 + ω ) ,   t h e n   b C B * < b F B *
(iv) 
i f   c b h u 2 ω + λ ( k u 2 ( p c 1 r ) + h θ 2 ( r c 0 ) ) ( 1 + λ ) ( k u 2 + h θ 2 ) ,   t h e n   E C B * E F B * i f   c b > h u 2 ω + λ ( k u 2 ( p c 1 r ) + h θ 2 ( r c 0 ) ) ( 1 + λ ) ( k u 2 + h θ 2 ) ,   t h e n   E C B * > E F B * ;
(v) 
i f   c b ( p r c 1 + c 2 ( 1 + λ ) + λ ω ) 2 ( 1 + λ ) ,   t h e n   S C B * S F B * i f   c b > ( p r c 1 + c 2 ( 1 + λ ) + λ ω ) 2 ( 1 + λ ) ,   t h e n   S C B * < S F B * ;
(vi) 
i f     φ 2 η > X t h   5 ,   a n d   c b c b   t h   3 ,   t h e n   D C B * D F B * c b > c b   t h   3 ,   t h e n   D C B * < D F B * i f     φ 2 η < X t h   5 ,   a n d   c b c b   t h   3 ,   t h e n   D C B * D F B * c b < c b   t h   3 ,   t h e n   D C B * < D F B *   i f     φ 2 η = X t h   5 ,   a n d   c 2 c 2   t h   3 ,   t h e n   D C B * D F B * c 2 < c 2   t h   3 ,   t h e n   D C B * < D F B *   ;
See Supplementary S2 for relevant important critical points regarding Proposition 14.
Proposition 14 aligns with the conclusions derived from Proposition 13. The level of blockchain investment in the case of shipping companies investing in blockchain technology is higher than that in the case of port and shipping companies jointly participating in a shipping logistics blockchain platform when the fees charged are higher. Distinguished from the single-subject dominance of the PB or CB scenario, the FB scenario ensures complete symmetry of key parameters such as emissions reduction level E(t), service level S(t), and cost of blockchain usage cb through a multi-node consensus algorithm, eliminating “node–edge” or “edge–node” information privileges. In the CB scenario, as primary investors in blockchain infrastructure, shipping companies actively intensify their blockchain investments to offset high operational costs. Given the substantial capital commitment, these firms exhibit heightened expectations regarding investment returns. By increasing blockchain technology investments, they aim to achieve enhanced supply chain efficiency, thereby strengthening market competitiveness and securing greater profit margins. Conversely, in the FB scenario, despite collaborative participation by ports and shipping companies in the blockchain platform, the overall blockchain investment level remains comparatively subdued when confronted with high usage costs.

6. Extended Analysis

Earlier analyses overlooked how investing in blockchain technology directly affects carbon emissions in shipping transport. However, if we were to factor in the environmental credibility provided by blockchain-based green certification, how would this alter the outcome? In this section, the green trust coefficient of shippers m = 1 − m ¯ is introduced into the N case, indicating low-carbon preference shippers’ trust in the emissions reduction process in the shipping industry. Consequently, leveraging the inquiries, the differential game model of traditional shipping supply chain under scenario N1 is constructed as follows:
max a N 1 ( t ) π C N 1 = 0 + e ρ t [ ( p r c 1 ) D N 1 ( t ) 1 2 h a N 1 2 ( t ) ] d t
max g N 1 ( t ) π P N 1 = 0 + e ρ t [ ( r c 0 ) D N 1 ( t ) 1 2 k g N 1 2 ( t ) ] d t
s . t .   d E N 1 ( t ) = u a N 1 ( t ) d t + θ g N 1 ( t ) d t σ E N 1 ( t ) d t E N 1 ( 0 ) = E 0
The demand of shippers without blockchain is expressed as follows:
D N 1 ( t ) = α p β S 0 γ ( 1 m ¯ ) E ( t ) 1 f ( v ) d v + ( 1 α ) p β S 0 1 f ( v ) d v   = α [ 1 p + β S 0 + γ ( 1 m ¯ ) E ( t ) ] + ( 1 α ) [ 1 p + β S 0 ]
The demand of shippers with blockchain is expressed as follows:
D B ( t ) = α p β S ( t ) γ E ( t ) 1 f ( v ) d v + ( 1 α ) p β S ( t ) 1 f ( v ) d v   = α [ 1 p + β S ( t ) + γ E ( t ) ] + ( 1 α ) [ 1 p + β S ( t ) ]
Theorem 5.
In scenario N1 where there is no blockchain and considering low-carbon-preference shippers are distrustful of shipping industry emissions reductions, the optimal green investment level gN1* of port company and the optimal emissions reduction effort aN1 shipping company in the shipping supply chain are as follows:
g N 1 * = α γ ( 1 m ¯ ) θ ( r c 0 ) k ( ρ + σ )
a N 1 * = α γ u ( 1 m ¯ ) ( p c 1 r ) h ( ρ + σ )
Corollary 5.
In scenario N1 where there is no blockchain and considering low-carbon-preference shippers are distrustful of shipping industry emissions reductions, the optimal dynamic trajectories of emissions reduction operation strategies for the shipping supply chain are as follows:
E N 1 * ( t ) = ( E 0 α γ ( 1 m ¯ ) ( h θ 2 ( r c 0 ) + k u 2 ( p c 1 r ) ) h k σ ( ρ + σ ) ) e σ t +   α γ ( 1 m ¯ ) ( h θ 2 ( r c 0 ) + k u 2 ( p c 1 r ) ) h k σ ( ρ + σ )
D N 1 * ( t ) = α ( γ ( ( E 0 α γ ( 1 m ¯ ) ( h θ 2 ( r c 0 ) + k u 2 ( p c 1 r ) ) h k σ ( ρ + σ ) ) e σ t   + 1 h k σ ( ρ + σ ) ( α γ ( 1 m ¯ ) ( h θ 2 ( r c 0 ) + k u 2 ( p c 1 r ) ) ) )   p + β S 0 + 1 ) + ( 1 α ) ( 1 p + β S 0 )
V C N 1 * ( t ) = α γ ( 1 m ¯ ) p c 1 r ρ + σ ( ( E 0   α γ ( 1 m ¯ ) ( h θ 2 ( r c 0 ) + k u 2 ( p c 1 r ) ) h k σ ( ρ + σ ) ) e σ t   + α γ ( 1 m ¯ ) ( h θ 2 ( r c 0 ) + k u 2 ( p c 1 r ) ) h k σ ( ρ + σ ) )   + ( p c 1 r ) 2 ρ ( 2 ( 1 p + β S 0 )   + α 2 γ 2 ( 1 m ¯ ) 2 ( 2 h θ 2 ( r c 0 ) + k u 2 ( p c 1 r ) ) h k ( ρ + σ ) 2 )
V P N 1 * ( t ) = α γ ( 1 m ¯ ) ( r c 0 ) ρ + σ   ( ( E 0 α γ ( 1 m ¯ ) ( h θ 2 ( r c 0 ) + k u 2 ( p c 1 r ) ) h k σ ( ρ + σ ) ) e σ t   + α γ ( 1 m ¯ ) ( h θ 2 ( r c 0 ) + k u 2 ( p c 1 r ) ) h k σ ( ρ + σ ) )   + ( r c 0 ) 2 ρ ( 2 ( 1 p + β S 0 )   + α 2 γ 2 ( 1 m ¯ ) 2 ( h θ 2 ( r c 0 ) + 2 k u 2 ( p c 1 r ) ) h k ( ρ + σ ) 2 )
Under blockchain technology ( 1 m ¯ ) = 1, by comparing PB, CB, and FB with N1, it can be inferred that when blockchain technology is utilized for green certification during the emissions reduction process of the shipping supply chain to boost shippers’ green trust, the impact of the blockchain technology established by port companies on the optimization decision of the shipping supply chain is as follows:
Proposition 15.
When blockchain technology can be used for green certification in emissions reduction processes to enhance shippers’ green trust, the effects of blockchain technology established by the port company on the optimal decisions of the shipping supply chain are as follows:
(i) a P B * > a N 1 * ; (ii) i f   m ¯ ω 1 r c 0 ,   t h e n   g P B * g N 1 * i f   m ¯ ω < 1 r c 0 ,   t h e n   g P B * < g N 1 * ;
(iii) i f   m ¯ ω h θ 2 k ( p r c 1 ) u 2 + h ( r c 0 ) θ 2 ,   t h e n   E P B * E N 1 * i f   m ¯ ω < h θ 2 k ( p r c 1 ) u 2 + h ( r c 0 ) θ 2 ,   t h e n   E P B * < E N 1 * ;
(iv) i f   φ 2 η X t h   1 ,   t h e n   D P B * D N 1 * i f   φ 2 η < X t h   1 ,   t h e n   D P B * < D N 1 * ;
See Supplementary S2 for relevant important critical points regarding Proposition 15.
Proposition 15 (i) indicates that the emissions reduction efforts in the PB scenario are higher than those in the N1 scenario. In the PB scenario, after the port company invests in blockchain technology, the characteristics of blockchain make all aspects of the supply chain more transparent and traceable. Contrastingly, in the N1 scenario, the port’ s ability to oversee and handle the shipping firm is hamstrung by the absence of blockchain support. This shortfall diminishes the company’ s motivation to slash emissions, leaving efforts to reduce pollutants somewhat lackluster. Proposition 15 (ii), (iii) shows that when low-carbon-preference shippers have a higher level of distrust in the shipping industry’ s emissions reduction efforts, investing in blockchain can improve transparency and trust, thereby enhancing the level of emissions reduction. This suggests that even if initial trust is low, the transparency of the blockchain can significantly increase the effectiveness of mitigation, challenging the conventional wisdom that low trust is difficult to reverse. The shipping sector’ s faith in the efficacy of carbon-reduction measures among eco-conscious shippers significantly influences their selection of shipping options. In the N1 scenario, shippers’ lack of trust in the shipping industry’ s ability to reduce emissions could lead them to reduce their demand for shipping services or to opt for greener but more costly alternative modes of transport. Proposition 15 (iv) shows that when there are other factors influencing the scenario, investing in blockchain technology increases demand due to enhanced shipper trust.
Proposition 16.
When blockchain technology can be used for green certification in emissions reduction processes to enhance shippers’ green trust, the effects of blockchain technology established by the shipping company on the optimal decisions of the shipping supply chain are as follows:
(i) i f   m ¯ ω 1 p r c 1 ,   t h e n   a C B * a N 1 * i f   m ¯ ω < 1 p r c 1 ,   t h e n   a C B * < a N 1 * ; (ii) g C B * > g N 1 * ;
(iii) i f   m ¯ ω k u 2 k ( p r c 1 ) u 2 + h ( r c 0 ) θ 2 ,   t h e n   E C B * E N 1 * i f   m ¯ ω < k u 2 k ( p r c 1 ) u 2 + h ( r c 0 ) θ 2 ,   t h e n   E C B * < E N 1 * ;
(iv) i f   φ 2 η X t h   2 ,   t h e n   D C B * D N 1 * i f   φ 2 η < X t h   2 ,   t h e n   D C B * < D N 1 * ;
See Supplementary S2 for relevant important critical points regarding Proposition 16.
Proposition 16 (i), (iii) show that the emissions reduction efforts in the CB scenario are higher than those in the N1 scenario. In the CB scenario, shipping companies’ investment in blockchain technology enables them to monitor and manage carbon emissions from ship operations more accurately. Blockchain technology can record a ship’s fuel consumption, sailing routes, and other operational data in real time, providing shipping companies with precise carbon emission analytics. Leveraging this data, shipping companies can systematically enhance the level of emissions reduction. In contrast, in the N1 scenario, shippers’ distrust of emissions reduction claims makes them more cautious about their choice of shipping services, which negatively impacts the business volume of shipping companies. Proposition 16 (iv) demonstrates that when other factors are considered, the CB scenario increases demand by strengthening shippers’ trust. In this scenario, blockchain technology not only contributes to emissions reduction but also offers significant advantages in improving service quality and customer experience.
Taken together, Propositions 15 and 16 point to the same fundamental insight: when environmentally conscious shippers grow increasingly skeptical about the shipping sector’s commitment to cutting emissions, blockchain investments yield substantially greater returns. The findings reveal a direct correlation—the deeper this distrust runs among eco-minded shipping clients, the more value blockchain technology delivers.
Proposition 17.
When blockchain technology can be used for green certification in emissions reduction processes to enhance shippers’ green trust, the effects of the shipping logistics blockchain platform on the optimal decisions of the shipping supply chain are as follows:
(i) i f   m ¯ c b ( 1 + λ ) p r c 1 λ ,   t h e n   a F B * a N 1 * i f   m ¯ < c b ( 1 + λ ) p r c 1 λ ,   t h e n   a F B * < a N 1 * ; (ii) i f   m ¯ c b ( 1 + λ ) r c 0 λ ,   t h e n   g F B * g N 1 * i f   m ¯ < c b ( 1 + λ ) r c 0 λ ,   t h e n   g F B * < g N 1 * ;
(iii) i f   m ¯ < c b ( k u 2 + h θ 2 ) ( 1 + λ ) c 1 k u 2 k ( p r c 1 ) u 2 h ( r c 0 ) θ 2 λ ,   t h e n   E F B * E N 1 * i f   m ¯ c b ( k u 2 + h θ 2 ) ( 1 + λ ) c 1 k u 2 k ( p r c 1 ) u 2 h ( r c 0 ) θ 2 λ ,   t h e n   E F B * < E N 1 * ;
(iv) i f   φ 2 η X t h   3 ,   t h e n   D F B * D N 1 * i f   φ 2 η < X t h   3 ,   t h e n   D F B * < D N 1 *
See Supplementary S2 for relevant important critical points in Proposition 17.
Proposition 17 (i) and (ii) compare the emissions reduction efforts of shipping companies and the green investment levels of ports in the FB scenario versus the N1 scenario. When shippers’ distrust is higher, both the emissions reduction efforts of shipping companies and the green investment levels of ports in the FB scenario exceed those in the N1 scenario. In the FB scenario, ports and shipping companies jointly participate in the blockchain platform, and the abatement data jointly provided by multiple parties can strengthen customer selection and create a scale effect on the demand side. In the face of stringent emissions regulation, the FB scenario can meet compliance requirements more efficiently and avoid the cost of repeatedly interfacing with different regulatory systems due to the unified data format and multi-party consensus mechanism. However, in Proposition 17 (iii), the lower the degree of distrust that shippers have toward the shipping industry’ s emissions reduction efforts, the higher will be the levels of emissions reductions achieved through joint participation of ports and shipping enterprises in the shipping logistics blockchain platform. This is because shippers are more willing to provide incentives for low-carbon transportation services, such as reduced insurance rates and prioritized freight payments, thereby creating an effective mechanism to encourage ports and shipping companies to actively reduce emissions under the blockchain-enabled collaboration. In contrast, if the shippers do not trust these emissions reductions, ports and shipping companies may face market pressures, economic losses, and insufficient incentives to increase investments in emissions reduction. Additionally, in the FB scenario, blockchain technology’ s ability to enhance cargo owners’ trust can also lead to increased demand under specific conditions.

7. Experiment and Results

This section delves into the influence of investing in blockchain technology on the emissions reductions of port and shipping firms, considering the dynamic path of the optimal decision and the alteration of key parameters across diverse scenarios. This part discusses in depth the impact of investing in blockchain technology on emissions reductions in harbor and shipping enterprises and considers the dynamic path of optimal decision-making and changes in key parameters in different scenarios. In this context, this paper refers to the related literature (Meng et al., [50]) and constructs a parameter system that aligns with realistic scenarios through field research and public data collection. Specifically, the cost parameters are set with reference to the technology deployment cost of Shanghai Port’s “Blockchain Paperless Order Exchange Platform”; the green investment level is based on the measured data from Shenzhen Yantian Port’s “Oil-to-Electricity” project; and the proportion of low-carbon preference is derived from Maersk Group’s research on low-carbon customers, reflecting the current global shipping market. The low-carbon preference ratio, based on Maersk Group’s customer survey data, indicates that approximately 70% of cargo owners in the global shipping market currently have a clear demand for green certification services. These parameters were obtained through quantitative analysis of typical cases. Numerical simulations were performed using MATLA—MATLAB R2023a software, and the system parameters are set as follows: σ = 0.3; E0 = 5; μ = 0.58; θ = 0.55; S0 = 2; τ = 0.25; φ = 0.6; α = 0.7; p = 10; r = 5; β = 1.5; γ = 2.5; m = 0.85; ρ = 0.8; k = 1.8; h = 2; η = 1; ω = 0.2; c0 = 0.17; c1 = 0.2; c2 = 0.01; cb = 0.5; λ = 0.6.

7.1. Dynamic Trajectory of Shipping Supply Chain Operation Strategy

Figure 3, Figure 4 and Figure 5 show the trajectory plots of the emissions reductions levels in the shipping supply chain E, the shipping service level S, and the shipping demand D over time t under five scenarios. When E0 is less than E, the emissions reductions level increases with time; when E0 is greater than E, it decreases with time t. This phenomenon indicates that if the initial emissions reductions level is relatively low during the early stages of the shipping supply chain’s operation, the emissions reduction measures implemented by ports and shipping companies will gradually become effective as time progresses.
When S0 < S, the shipping service level increases with time. Blockchain enhances information transparency and customs clearance efficiency, resulting in a smoother cargo transportation process. Customers can access cargo information more promptly, thereby improving their service experience. Meanwhile, ports and shipping companies improve shipping service levels by optimizing transportation processes through maintenance and upgrades of transportation equipment. In contrast, when S0 > S, the shipping service level decreases with the increase of time. This may be because it is difficult to maintain a high service level at the initial stage for a long time. As business scales expand and market competition intensifies, failure to continuously innovate and optimize services can lead to a gradual decline in service levels until a steady state is reached.
When both E0 < E and S0 < S are satisfied, the shipping demand D increases over time; conversely, if either condition is violated, the demand decreases. In such cases, the enhancement of emissions reductions levels and the improvement in shipping service quality jointly elevate market competitiveness. This dual improvement aligns with consumers’ growing emphasis on environmental protection and service quality, while the progress in emissions reductions meets societal demands for green development, thereby attracting environmentally conscious customers. Among the cases, FB had the fastest growth rate and the optimal strategy tended to a steady state with the evolution of time t. In Case FB, ports and shipping companies achieve information sharing and resource integration through their joint participation in the blockchain platform, fully demonstrating the synergistic effects of collaborative blockchain adoption.
To summarize, Figure 3, Figure 4 and Figure 5 clearly demonstrate the changes in key indicators of the shipping supply chain across different scenarios, as well as blockchain technology’ s critical role in enhancing emissions reduction levels and stimulating demand. These findings are consistent with the conclusions derived from Propositions 1–4, thereby providing robust support for decision-making processes in port and shipping enterprises.
Figure 6, Figure 7 and Figure 8 show the trajectory of expected discounted profit of port company VP, expected discounted profit of shipping company VC, and expected discounted profit VF of a shipping logistics blockchain platform changing over time t under five different scenarios. When both E0 < E and S0 < S are satisfied, VP, VC, and VF are proportional to t; conversely, if either condition is violated, these profits decrease. From the port company’ s perspective, under low initial emissions reduction levels and low initial shipping service levels, ports can effectively enhance customs clearance efficiency through blockchain technology investments over time. This improvement attracts more cargo owners to utilize their services, thereby boosting profitability. For shipping companies, under the same conditions, blockchain technology investments increase logistics transparency, enabling shippers to monitor cargo transportation status in real time. This transparency fosters trust, attracts additional business, increases shipping volume and freight revenue, and ultimately drives the growth of the expected discounted profit VC. With joint participation in the shipping logistics blockchain platform, increased business volume elevates the platform’ s utility value and revenue. Consequently, the expected discounted profit VF rises proportionally as the platform’ s adoption and operational scale expand.
As time t increases, profits eventually stabilize toward a steady state. First, after an initial period of blockchain technology investment, the market gradually approaches saturation. The growth rate of business volume slows down, and profit growth for ports and shipping enterprises stabilizes. Second, although the early adoption of blockchain technology drives rapid profit growth, over time, the costs of technology investment, operations, and maintenance gradually rise. When cost growth rates align with revenue growth, profits stabilize. This dynamic aligns with the findings in Propositions 1–4, confirming that blockchain-enabled customer relationship management helps ports and shipping companies attract higher-quality clients, thereby demonstrating the long-term value of blockchain integration in the shipping supply chain.

7.2. The Influence of Key Parameters and the Comparison of Optimal Decision

In this section, the key parameters p, r, α, γ, β, φ, cb are analyzed for sensitivity and the results obtained are shown in Figure 9, Figure 10, Figure 11, Figure 12, Figure 13, Figure 14 and Figure 15.
Figure 9 represents the changes in VP, VC, VF as the parameter p increases. Figure 9a shows that VP increases with pp across all scenarios, with Case FB exhibiting the fastest growth rate and achieving the highest VP value at any given p. Figure 9b reveals that VC also increases with p; Case CB demonstrates the steepest upward trend. Shipping company-led scenarios are more adaptive when freight prices are high or fuel costs fluctuate dramatically. Shipping companies can optimize routes and adjust emissions reduction strategies in real time through the blockchain, amplifying service advantages in times of high returns and rapidly shrinking non-essential inputs in times of surging costs, reflecting the agile responsiveness of edge nodes to market changes. Figure 9c displays the relationship between VF and p. Here, only the green solid line (Case FB) is plotted, indicating a linear growth pattern where VF rises uniformly with p. This shows that the port obtains the fastest increase in profit when the port invests in blockchain, and the shipping company obtains the fastest profit when the shipping company invests in blockchain.
Figure 10 represents the variation in VP, VC, VF as the parameter r increases. Figure 10a shows that only in Case CB, VP first rises and then declines, peaking at approximately r = 5. Figure 10b indicates that in Case PB, VC similarly exhibits a rise-and-fall pattern, reaching its maximum at r = 4. Figure 10c depicts a single green solid line (Case FB), demonstrating a linear decrease in VF as r increases. This behavior reflects the strategic interaction between shipping companies and ports when blockchain technology is adopted by the former. Initially, as port service fees rise, shipping companies may tolerate the increase due to offsetting benefits from blockchain adoption (e.g., enhanced operational efficiency or market trust), allowing ports to capture higher profits. However, as fees continue to escalate, cost pressures on shipping companies intensify. Leveraging blockchain’ s transparency, these companies can identify and switch to more cost-effective port services, eroding the port’ s competitive advantage and ultimately reducing its discounted profit. The same is true when ports invest in blockchain. That is to say, the head port may consolidate its hub position through blockchain investment, squeezing the survival space of regional ports, needing an antitrust mechanism to prevent “winner-take-all”.
Figure 11, Figure 12 and Figure 13 represent the variation in VP, VC, VF as the parameters α, β, γ increase. In Figure 11a, Figure 12 and Figure 13c, VP, VC, and VF rise across all scenarios as α, β, and γ grow. This suggests that the profit growth potential of port companies, shipping companies, and shipping logistics blockchain platforms increases as the proportion of low-carbon preference shippers increases and the sensitivity of shippers to shipping services and the low-carbon preference of shippers strengthen. For port companies, addressing the needs of low-carbon-preference shippers may drive investments in green infrastructure, such as expanding shore power facilities to reduce carbon emissions during vessel port calls. Shipping companies, in turn, might adopt greener shipping technologies or optimize navigation routes to minimize emissions. Based on this, the government can provide blockchain investment tax credits for routes with a high percentage of low-carbon preferred shippers, avoiding the resource mismatch caused by “one-size-fits-all” subsidies. Concurrently, the shipping logistics blockchain platform enhances expected discounted profits for all stakeholders by documenting and transparently reporting emissions reduction efforts, thereby attracting environmentally conscious clients and fostering collaborative low-carbon initiatives.
Figure 14 represents the changes in VP, VC, VF as the parameter φ increases. Figure 14a,b show that in scenarios without blockchain investment, VP and VC remain constant regardless of φ, since φ quantifies blockchain’s direct impact on emissions reduction. In all other blockchain-enabled scenarios, VP and VC grow proportionally with φ. Figure 14c plots only the green solid line (Case FB), revealing a linear growth pattern where VF increases uniformly with φ. These results confirm that blockchain adoption not only elevates emissions reductions efforts but also drives profit growth for all stakeholders. The alignment of profit incentives with sustainability goals underscores the dual benefits of blockchain integration in shipping logistics.
Figure 15 represents the variation in VP, VC, VF with increasing parameter cb. Figure 15a,b show that both VP and VC initially rise but subsequently decline with increasing cb. Figure 15c demonstrates that VF increases linearly with cb. This suggests a significant short-term profit advantage for port-led scenarios when blockchain construction and operating costs are low. Ports can make up for technology investment by raising service fees while attracting customers who are not sensitive to low-carbon services, realizing a rapid cycle of “technology investment—efficiency improvement—profit growth”. Ports, as the core nodes of the supply chain, can undertake blockchain investments. These investments have a natural advantage in reducing duplicate certification costs and enhancing regulatory compliance by improving customs clearance efficiency and quickly reducing information asymmetry among multiple parties. As blockchain usage fees increase further, a turning point in the cost-benefit balance is reached. When blockchain usage fees become too high, the increased costs for ports and shipping companies begin to outweigh the benefits of blockchain technology, at which point profits gradually diminish. The platform’ s source of revenue is primarily the blockchain usage fees paid by port companies and shipping lines. All else being equal, higher fees mean that the platform can make more profit.

8. Conclusions

In this paper, we analyze four scenarios through a symmetry-aware dynamic model to investigate the impact of blockchain technology on shipping supply chain emissions reduction and operational strategies. Leveraging differential game theory and graph-theoretic principles, we frame ports as nodes and shipping firms as edges in a symmetrically interconnected network, constructing state equations for emissions reductions and service levels. By solving HJB equations, we derive optimal decisions under each scenario, revealing how structural symmetry (e.g., balanced port-shipping collaboration) and operational asymmetry (e.g., cost disparities) shape outcomes. Comparative and parametric analyses further demonstrate how blockchain’s distributed symmetric architecture enhances information symmetry, reduces node–edge coordination inefficiencies, and improves network diagnosability (e.g., identifying emission-critical ports).

8.1. Key Findings

This study derives the principal findings as follows. We find that under a symmetry-driven dynamic framework, emissions reduction efforts, service levels, demand, and profits exhibit trajectories akin to graph-theoretic equilibria increased rapidly before stabilizing (Propositions 1–4). In the NB scenario, low initial emissions levels prompt ports (nodes) and shipping firms (edges) to enhance performance through green investments, while blockchain’s distributed symmetric architecture optimizes node–edge collaboration by eliminating information asymmetry. Blockchain’s symmetric transparency reshapes emission decisions by enhancing shippers’ trust, indirectly improving performance through a low-carbon demand–investment–trust cycle (Propositions 5–8). Port- or shipping-led blockchain investments initially divert resources but long term, they enable node-level diagnosability (identifying emission-critical ports) and edge-level coordination. The port-led model is suitable for low-cost investment scenarios. When the blockchain operation cost is controlled within a reasonable range, the initial technology investment of the port will increase capital expenditure, but in the long run, it can realize profitability by improving customs clearance efficiency and attracting low-carbon cargo owners. Shipping company-led models are more valuable in high freight markets. A shipping company-owned blockchain platform could enhance customer trust by improving logistics transparency, allowing for service premiums and optimizing cost efficiency for abatement. Joint blockchain platforms achieve network-wide symmetry via multi-party data sharing, reducing regulatory costs through combinatorial optimization of emissions tracking. Threshold conditions for win–win outcomes depend on symmetry–asymmetry trade-offs between costs and benefits. Port-led investments thrive under cost symmetry (low blockchain operating costs), while shipping firms leverage asymmetric service premiums in high-freight environments (Propositions 9, 10 and 12). Joint platforms require synergistic symmetry between platform fees and trust, mirroring restricted connectivity optimization in multiprocessor systems (Propositions 11, 13, and 14). The core of the reason why blockchain platforms with joint participation can realize a “win–win” situation is that all parties have formed a stable cooperation mechanism of risk sharing and equal benefit sharing by reasonably sharing the cost of technological inputs and sharing the benefits of the data. In contrast, the stability of a single subject-led scenario (e.g., a port or shipping company building a blockchain alone) is highly dependent on whether the dominant party can control the cost of technological application within a reasonable range. If the cost borne by the dominant party is too high, it may lead to the withdrawal of the cooperating parties due to declining returns, destroying the balance of the system. Node–edge asymmetry dictates optimal blockchain leadership: ports (nodes) excel in cost control via customs efficiency and transparency, while shipping firms (edges) profit from demand-driven route optimization. Joint platforms, though constrained by multi-node costs, achieve resource symmetry through alliance chains (e.g., Shanghai Port’s paperless platform), balancing logistics costs and emissions efficiency via graph neural network-inspired coordination.
From the perspective of symmetry, the shipping supply chain, with the help of the distributed blockchain architecture, has achieved a deep transformation from information asymmetric game to system symmetrical collaboration. This transformation has fundamentally reshaped the decision-making logic and benefit distribution mechanism. Under the traditional model, port and shipping enterprises were trapped in the predicament of local optima due to information barriers. Emissions reductions investment and service improvement worked independently, making it difficult to form a synergy effect. Then, distributed book blockchain technology broke the data island, enabling the parties to operate based on real-time sharing of a transparent information strategy, promoting efforts and green investment to move from isolated decision-making to joint optimization of resource allocation efficiency. This symmetric reconstruction is not only an upgrade of technological application but also an innovation of the underlying collaboration mechanism in the supply chain. It enables port and shipping enterprises to strike a balance between emissions reductions targets and economic goals, drive decision-making coordination through information symmetry, and ultimately achieve a win–win situation of economic and environmental benefits for the entire system, providing a new paradigm with both theoretical value and practical significance for the sustainable transformation of the global shipping industry.
Furthermore, the unique contribution of this study lies in optimizing the two shipping supply chain network structures (Structure A and Structure B), supported by blockchain, through differential game theory, and deeply coupling the node–edge dynamics in graph theory with the game equilibrium strategy. By analyzing the reconstruction effect of blockchain platform nodes on the network topology, we reveal how the distributed symmetric architecture drives the traditional hierarchical channel strategy to evolve towards multi-party collaborative equilibrium through node diagnosability, edge coordination, and global connectivity optimization, providing a dynamic framework with both theoretical strictness and practical adaptability for intelligent decision-making in shipping emissions reduction.

8.2. Managerial Insights

From these key findings, the following managerial implications emerge:
First, the government should actively promote the standardized application of blockchain technology in the shipping industry, such as establishing a unified data-sharing interface and green certification system. Simultaneously, the government should take the lead in or subsidize the construction of a “Shipping Blockchain Public Service Platform” to provide basic services and lower the technical threshold for small and medium-sized enterprises. For example, regional alliance chains could be established relying on the “Yangtze River Economic Belt” and the “Guangdong–Hong Kong–Macao Greater Bay Area,” connecting hubs such as Shanghai Port and Ningbo–Zhoushan Port. These chains would enable real-time sharing and supervision of ship emission data, as well as blockchain-based processes for port charging, carbon trading, and other operations to enhance transparency.
Second, port enterprises should prioritize blockchain investment in low operating cost scenarios and attract low-carbon cargo owners by improving customs clearance efficiency (such as automatic customs declaration with smart contracts). Shipping companies should lead blockchain investment in scenarios with high sensitivity to market demand and improve service premium capabilities by optimizing route transparency (such as COSCO Shipping blockchain route tracking). At the same time, it should be noted that when ports or shipping companies build blockchain separately, they need to reserve sufficient cost buffer space in advance to cope with the increased cost of technical maintenance or service restoration caused by unexpected disruptions. If operating costs fluctuate greatly, shipping companies may consider building blockchain systems on their own in order to more flexibly adjust their transportation strategies in response to changes in costs, to maintain revenues by improving service transparency and efficiency during high-cost periods, and to expand their market share during low-cost periods. In addition, when investing in emissions reduction and blockchain technology, maritime companies must prioritize the equilibrium of cost containment and revenue management. By rationalizing shipping prices and port service charges, it ensures that the profitability of enterprises is maintained while the levels of emissions reductions and service are enhanced.
Third, shifting key parameters suggests an evolving port market landscape. In this case, port and shipping companies need to be keenly aware of these changes and optimize and adjust the cost of investing in blockchain technology in a timely way. Through continuous improvement, we can maximize the motivation of port enterprises to reduce emissions and enhance efficiency, so that they can maintain their competitiveness in the ever-changing market environment and achieve sustainable development.

8.3. Limitations and Future Research

This study has certain limitations. First, the model assumptions, although based on reality, are simplified and may not fully reflect the complexity of the shipping supply chain. For example, in reality, there are many participants with complex relationships, while the model only considers the case of one port and one shipping company. Second, this study only partially covers the factors that affect the decision to invest in and reduce emissions from blockchain technology. It ignores external factors such as macroeconomic fluctuations and policy instability, as well as internal factors such as management culture and the difficulty of technological integration within the enterprise. Third, the technical modeling of this study is based on the assumption of global interoperability of blockchain, but political and institutional constraints may significantly affect its applicability in reality. Future research needs to further internalize institutional variables such as multi-national data sovereignty rules and international carbon tariff games and construct a more politically flexible blockchain–emissions reduction collaborative model. In addition, the current work on blockchain-based shipping emissions reduction is still in the theoretical stage, with significant limitations, namely the lack of empirical-level validation. Future research needs to extend from theory to practice to promote blockchain technology to truly serve the realization of shipping emissions reduction goals, and fill the critical gap from theory to reality. Finally, this study examines how blockchain technology contributes to lowering carbon emissions, while also paving the way for future research into its broader applications across supply chain management systems.
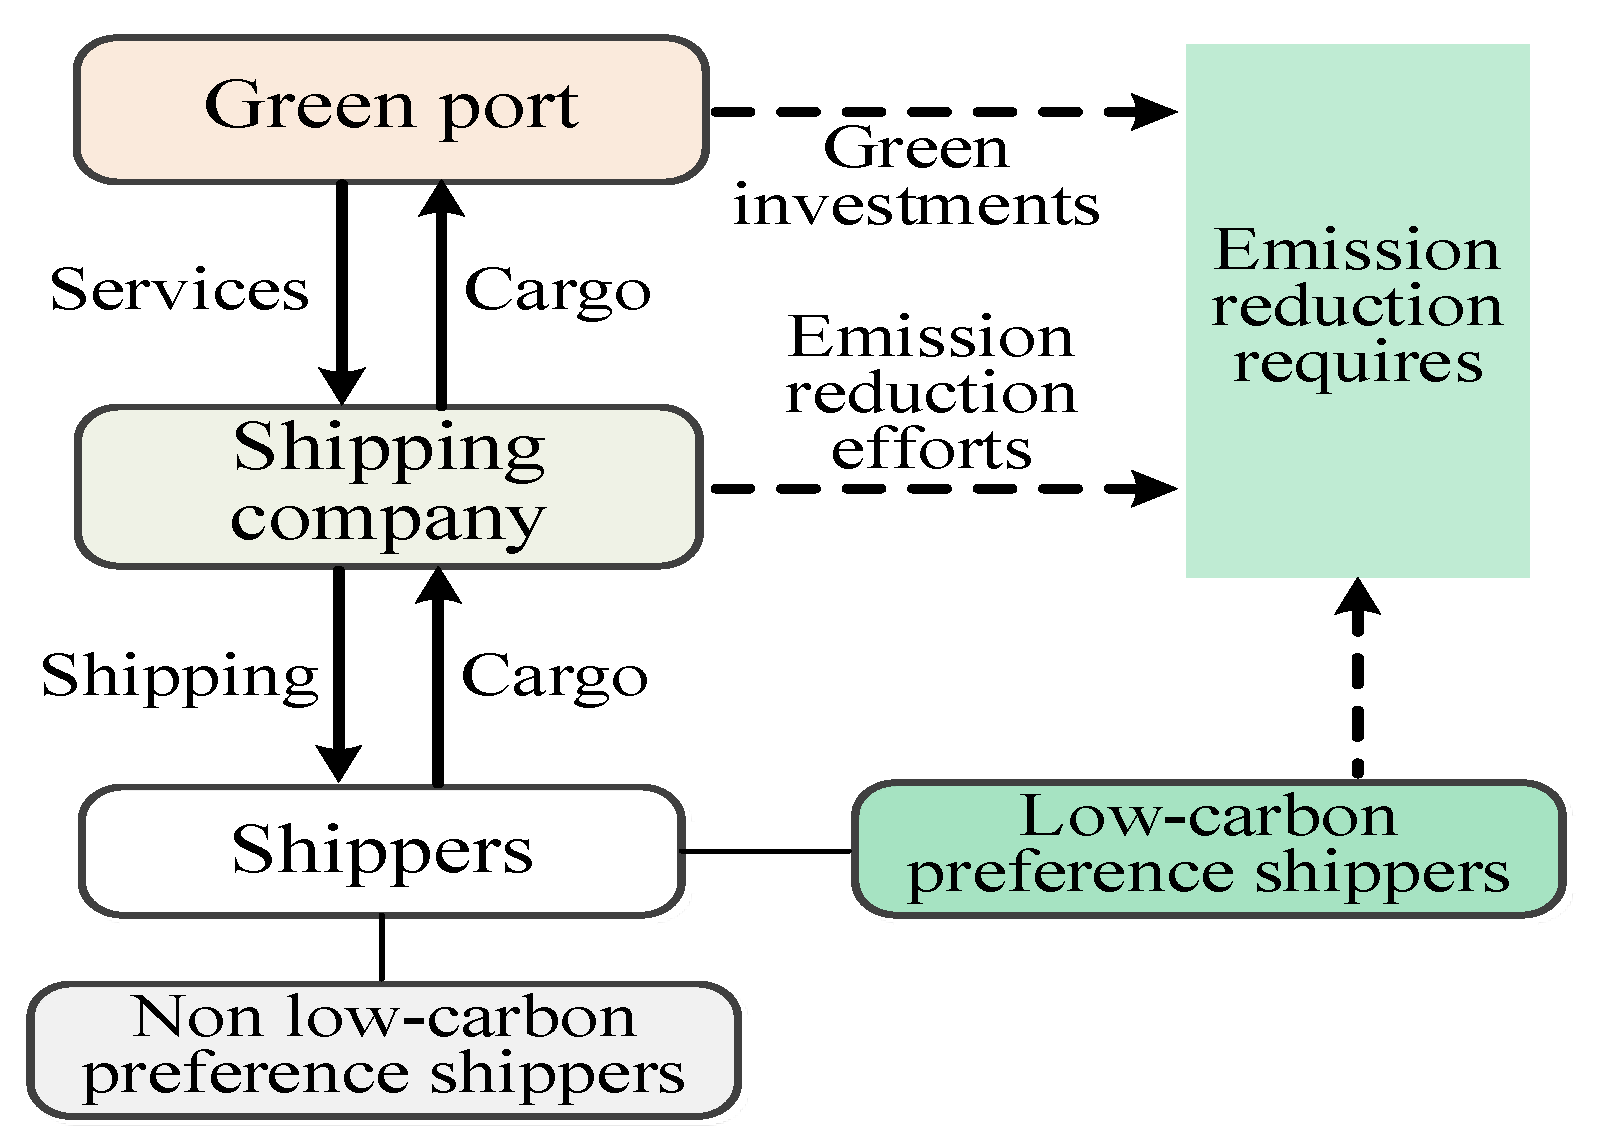
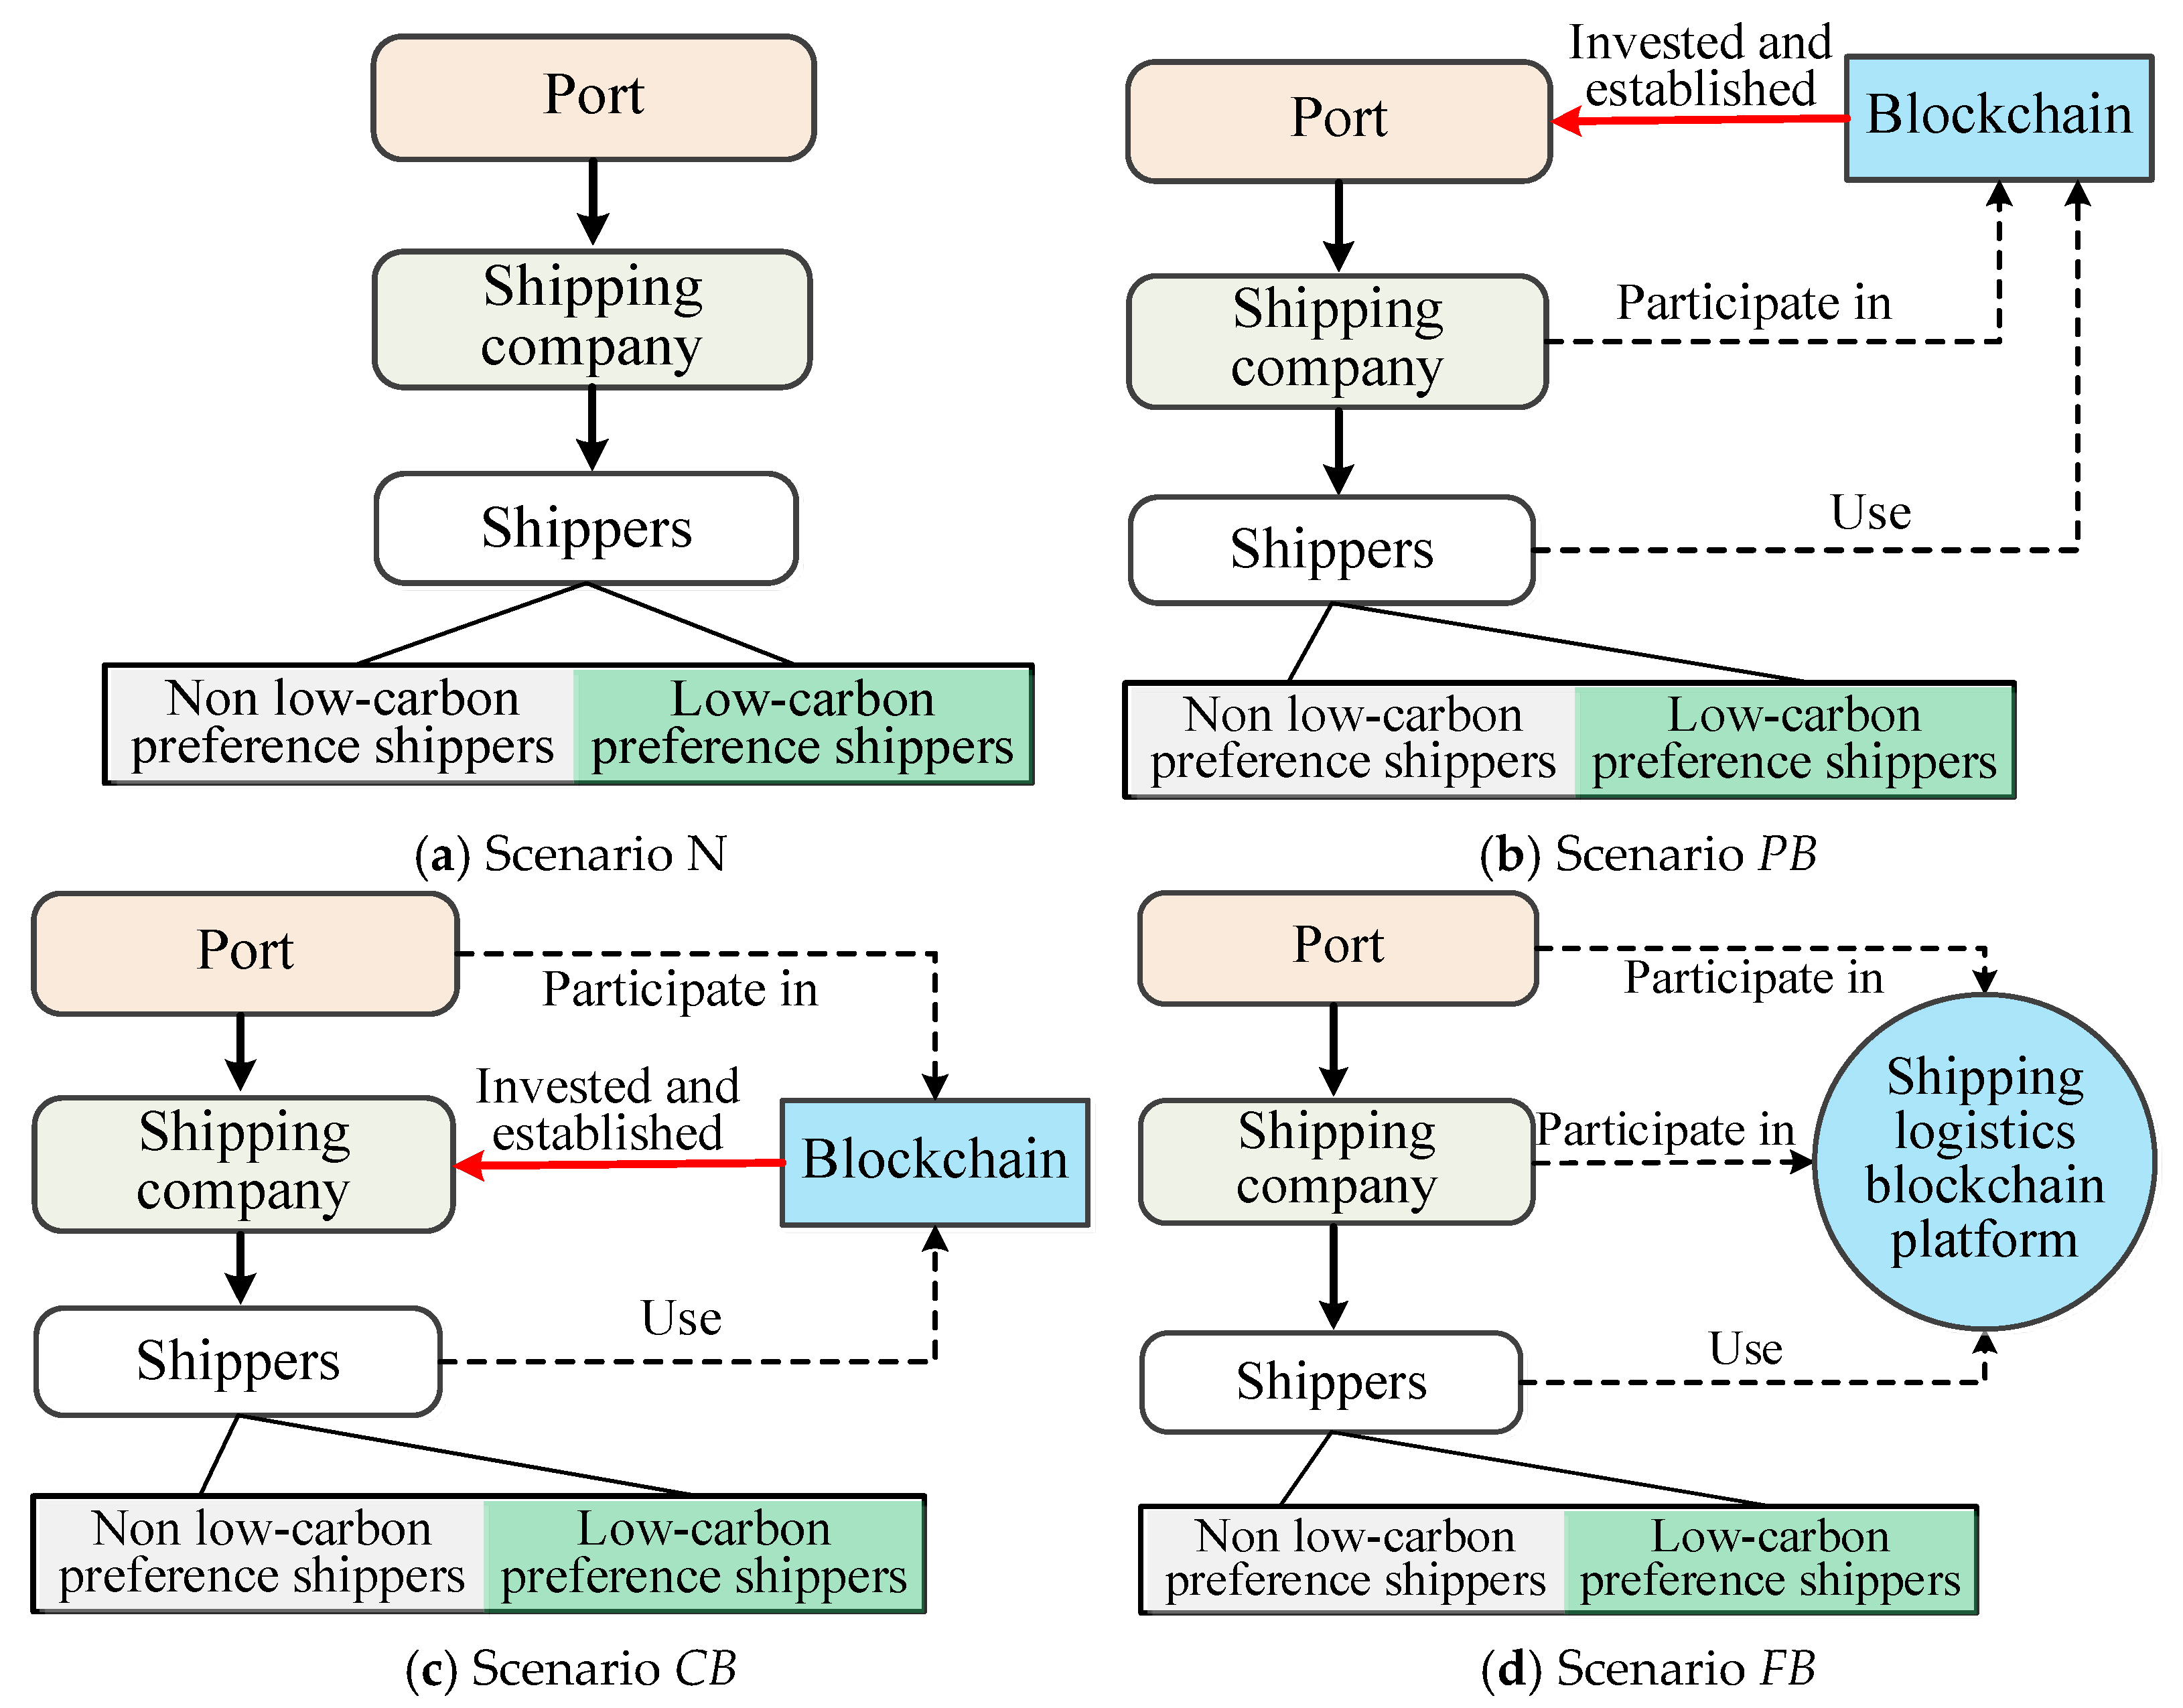
Supplementary Materials

The following supporting information can be downloaded at https://www.mdpi.com/article/10.3390/sym17060817/s1: Supplementary S1. Proofs; Supplementary S2. Critical points.

Author Contributions

Conceptualization, Z.S., Y.X., B.S. and J.L.; Methodology, Y.X., B.S. and J.L.; Software, J.L.; Formal analysis, Z.S., Y.X. and B.S.; Writing—original draft, Z.S. and Y.X.; Writing—review & editing, Z.S. and Y.X.; Visualization, B.S.; Supervision, Z.S. and J.L.; Funding acquisition, Z.S. All authors have read and agreed to the published version of the manuscript.

Funding

This work was supported by the Humanities and Social Sciences Research Youth Foundation of Ministry of Education of China (Grant No. 23YJC630157).

Data Availability Statement

The original contributions presented in this study are included in the article/Supplementary Material. Further inquiries can be directed to the corresponding authors.

Acknowledgments

The authors are grateful to the Editor and anonymous reviewers for their very valuable comments and suggestions.

Conflicts of Interest

The authors declare no conflict of interests regarding the publication of this article.

References

  1. Wang, X.T.; Liu, H.; Lv, Z.F.; Deng, F.Y.; Xu, H.L.; Qi, L.J.; Shi, M.S.; Zhao, J.C.; Zheng, S.X.; Man, H.Y.; et al. Trade-linked shipping CO2 emissions. Nat. Clim. Change 2021, 11, 945–951. [Google Scholar] [CrossRef]
  2. Ye, J.; Chen, J.H.; Shi, J.; Jiang, X.Y.; Zhou, S.R. Novel synergy mechanism for carbon emissions abatement in shipping decarbonization. Transp. Res. Part D Transp. Environ. 2024, 127, 104059. [Google Scholar] [CrossRef]
  3. Huang, X.Y.; Liu, G.Y.; Zheng, P.J. Dynamic analysis of a low-carbon maritime supply chain considering government policies and social preferences. Ocean Coast. Manag. 2023, 239, 106564. [Google Scholar] [CrossRef]
  4. Hoang, A.T.; Foley, A.M.; Nižetić, S.; Huang, Z.H.; Ong, H.C.; Ölçer, A.I.; Pham, V.V.; Nguyen, X.P. Energy-related approach for reduction of CO2 emissions: A critical strategy on the port-to-ship pathway. J. Clean. Prod. 2022, 355, 131772. [Google Scholar] [CrossRef]
  5. Chen, Y.T.; Li, D.F. Strategic Analysis of the Cooperation and Competition between the Shipping Logistics Blockchain Platform and Shipping Companies Considering Shippers’ Information Preferences. Chin. J. Manag. Sci. 2024, 41, 1–12. [Google Scholar]
  6. Yang, C.S. Maritime shipping digitalization: Blockchain-based technology applications, future improvements, and intention to use. Transp. Res. Part E Logist. Transp. Rev. 2019, 131, 108–117. [Google Scholar] [CrossRef]
  7. Meng, L.P.; Liu, K.M.; He, J.L.; Han, C.F.; Liu, P.H. Carbon emission reduction behavior strategies in the shipping industry under government regulation: A tripartite evolutionary game analysis. J. Clean. Prod. 2022, 378, 134556. [Google Scholar] [CrossRef]
  8. Chen, J.H.; Xu, J.H.; Zhou, S.R.; Liu, A. Slot co-chartering and capacity deployment optimization of liner alliances in containerized maritime logistics industry. Adv. Eng. Inform. 2023, 56, 101986. [Google Scholar] [CrossRef]
  9. Liu, J.G.; Zhao, H.D.; Li, J. Research on the Investment Strategy of the Port-Shipping Supply Chain Based on Green Investment Efficiency. Chin. J. Manag. Sci. 2021, 11, 33–44. [Google Scholar] [CrossRef]
  10. Liu, J.G.; Kong, Y.D.; Zhen, L. Research on Sustainable Investment in the Port-Shipping Supply Chain Considering Double Equilibrium. Chin. J. Manag. Sci. 2022, 3, 142–153. [Google Scholar]
  11. Liang, J.; Zhang, L.; Liu, Y.X. Research on Emission Reduction Strategies of Port and Shipping Enterprises Considering Carbon Emission Policies. J. Transp. Syst. Eng. Inf. Technol. 2023, 1, 39–47. [Google Scholar]
  12. Chen, Y.T.; Li, D.F. The Influence of Consumers’ Information Preferences on Shipping Companies’ Decision-making to Participate in Shipping Logistics Blockchain Platforms. Control Decis. 2024, 8, 2791–2800. [Google Scholar]
  13. Zhang, Y.G.; Kuang, H.B.; Yu, F.P.; Wan, M.; Li, J.C. Research on Investment and Subsidy Decision-making of Port and Shipping Blockchain Electronic Delivery Platform. Syst. Eng. Theory Pract. 2024, 44, 1–20. [Google Scholar]
  14. Liu, M.; Xin, X.; Wang, X.; Zhang, T.; Chen, K. Dual-channel slot sales strategy for container liner shipping companies with blockchain technology adoption. Transp. Policy 2025, 162, 200–220. [Google Scholar] [CrossRef]
  15. Xu, X.; Liu, M.H.; Wang, X.L.; Chen, H.C.; Chen, K. Investment strategy for blockchain technology in a shipping supply chain. Ocean Coast. Manag. 2022, 226, 106263. [Google Scholar]
  16. Li, H.J.; Gao, J.W.; Li, X. Blockchain adoption strategy of two-sided shipping platforms connecting forwarder and liner company. Ocean Coast. Manag. 2024, 247, 106932. [Google Scholar] [CrossRef]
  17. Alahmadi, D.; Baothman, F.; Alrajhi, M.; Alshahrani, F.; Albalawi, H. Comparative analysis of blockchain technology to support digital transformation in ports and shipping. J. Intell. Syst. 2022, 31, 55–69. [Google Scholar] [CrossRef]
  18. Chen, Y.; Yang, B. Cooperative Decision Making of Supply Chain Members of Shipping Logistics Services Under the Background of Blockchain. Asia-Pac. J. Oper. Res. 2021, 39, 2140018. [Google Scholar] [CrossRef]
  19. Lorenz-Meyer, F.; Santos, V. Blockchain in the shipping industry: A proposal for the use of blockchain for SMEs in the maritime industry. Procedia Comput. Sci. 2023, 219, 807–814. [Google Scholar] [CrossRef]
  20. Zhao, H.; Liu, J.; Hu, X. Servitization with blockchain in the maritime supply chain. Ocean Coast. Manag. 2022, 225, 106195. [Google Scholar] [CrossRef]
  21. Wang, H.; Wang, C.C.; Li, M.; Xie, Y.L. Blockchain technology investment strategy for shipping companies under competition. Ocean Coast. Manag. 2023, 243, 106696. [Google Scholar] [CrossRef]
  22. Wang, M.; Ren, Y.; Lin, Y.; Wang, S. The tightly super 3-extra connectivity and diagnosability of locally twisted cubes. Am. J. Comput. Math. 2017, 7, 127–144. [Google Scholar] [CrossRef]
  23. Wang, M.; Lin, Y.; Wang, S. The nature diagnosability of bubble-sort star graphs under the PMC model and MM∗ model. Int. J. Eng. Appl. Sci. 2017, 4, 2394–3661. [Google Scholar]
  24. Babaei, A.; Babaee Tirkolaee, E.; Ali, S.S. Assessing the viability of blockchain technology in renewable energy supply chains: A consolidation framework. Renew. Sustain. Energy Rev. 2025, 212, 115444. [Google Scholar] [CrossRef]
  25. Henrichs, E.; Boller, M.L.; Stolz, J.; Krupitzer, C. Quantum of Trust: Overview of Blockchain Technology for Product Authentication in Food and Pharmaceutical Supply Chains. Trends Food Sci. Technol. 2025, 157, 104892. [Google Scholar] [CrossRef]
  26. Heydari, M.; Shojaei, A. Blockchain applications in the construction supply chain. Autom. Constr. 2025, 171, 105998. [Google Scholar] [CrossRef]
  27. Wang, J.; Li, X.; Chen, C.; Zhu, W.T. Proof of carbon reduction: A novel incentive mechanism in blockchain for carbon emissions reduction in construction. Build. Environ. 2025, 272, 112684. [Google Scholar] [CrossRef]
  28. Vu, N.H.A. An Organizational Modeling for Developing Smart Contracts on Blockchain-based Supply Chain Finance Systems. Procedia Comput. Sci. 2024, 239, 3–10. [Google Scholar]
  29. Wang, M.; Lin, Y.; Wang, S. The connectivity and nature diagnosability of expanded k-ary n-cubes. RAIRO Theor. Inform. Appl. 2017, 51, 71–89. [Google Scholar] [CrossRef]
  30. Psaraftis, H.N.; Zis, T.; Lagouvardou, S. A comparative evaluation of market based measures for shipping decarbonization. Mar. Transp. Res. 2021, 2, 100019. [Google Scholar] [CrossRef]
  31. Gao, F.; Souza, G.C. Carbon Offsetting with Eco-Conscious Consumers. Manag. Sci. 2022, 68, 7879–7897. [Google Scholar] [CrossRef]
  32. Park, H.; Blanco, C.C.; Bendoly, E. Vessel sharing and its impact on maritime operations and carbon emissions. Prod. Oper. Manag. 2022, 31, 2925–2942. [Google Scholar] [CrossRef]
  33. Pasha, J.; Dulebenets, M.A.; Fathollahi-Fard, A.M.; Tian, G.; Lau, Y.Y.; Singh, P.; Liang, B. An integrated optimization method for tactical-level planning in liner shipping with heterogeneous ship fleet and environmental considerations. Adv. Eng. Inform. 2021, 48, 101299. [Google Scholar] [CrossRef]
  34. Chen, Y.; Ma, Y.; Wang, Y.; Sun, Z.; Han, Y. Impact of China’s marine governance policies on the marine ecological environment–A case study of the Bohai rim. Ocean Coast. Manag. 2023, 246, 106913. [Google Scholar] [CrossRef]
  35. Li, D.C.; Yang, H.L.; Xing, Y.W. Economic and emission assessment of LNG-fuelled ships for inland waterway transportation. Ocean Coast. Manag. 2023, 246, 106906. [Google Scholar] [CrossRef]
  36. Ji, C.Y.; Chen, B.J.; Zhao, W.; Wang, X.Y.; Qian, W.Y. Selection of emission reduction modes for energy-intensive enterprises under the dynamic carbon cap-and-trade regulation. Heliyon 2025, 11, e42424. [Google Scholar] [CrossRef]
  37. Wang, H.L.; Lang, X.; Mao, W.G. Voyage optimization combining genetic algorithm and dynamic programming for fuel/emissions reduction. Transp. Res. Part D Transp. Environ. 2021, 90, 102670. [Google Scholar] [CrossRef]
  38. Wang, S.; Wang, Y.; Wang, M. Connectivity and matching preclusion for leaf-sort graphs. J. Interconnect. Netw. 2019, 19, 1940007. [Google Scholar] [CrossRef]
  39. Zhu, C.; Ma, J.; Li, J. Dynamic production and carbon emission reduction adjustment strategies of the brand-new and the remanufactured product under hybrid carbon regulations. Comput. Ind. Eng. 2022, 172, 108517. [Google Scholar] [CrossRef]
  40. Koohathongsumrit, N.; Chankham, W. Route selection in multimodal supply chains: A fuzzy risk assessment model-BWM-MARCOS framework. Appl. Soft Comput. 2023, 137, 110167. [Google Scholar] [CrossRef]
  41. Zhang, L.L.; Ren, J.Q.; Zhang, G.Q. Optimal dynamic strategy for emission reduction and operation considering hybrid carbon policy with carbon tax and cap-and-trade. Comput. Ind. Eng. 2024, 187, 109820. [Google Scholar] [CrossRef]
  42. Ma, S.; He, Y. Investment of Green Technology in a Tourism Supply Chain Under Competition. IEEE Trans. Eng. Manag. 2023, 70, 1199–1214. [Google Scholar] [CrossRef]
  43. Wu, D.; Yang, Y. Study on the Differential Game Model for Supply Chain with Consumers’ Low Carbon Preference. Chin. J. Manag. Sci. 2021, 29, 126–137. [Google Scholar]
  44. Kang, Y.W.; Dong, P.W.; Ju, Y.B.; Zhang, T.Y. Differential game theoretic analysis of the blockchain technology investment and carbon reduction strategy in digital supply chain with government intervention. Comput. Ind. Eng. 2024, 189, 109953. [Google Scholar] [CrossRef]
  45. Ma, X.L.; Zhao, Y.; Luo, Q.; Bai, Q.G. Preservation technology investment and carbon abatement strategies in a supplier-retailer cold chain based on a differential game. Comput. Ind. Eng. 2022, 172, 108540. [Google Scholar] [CrossRef]
  46. Yang, L.; Cai, Y.; Wei, Y.; Huang, S. Choice of technology for emission control in port areas: A supply chain perspective. J. Clean. Prod. 2019, 240, 118105. [Google Scholar] [CrossRef]
  47. Yu, W.; Wang, Y.; Feng, W.R.; Bao, L.; Han, R.Z. Low carbon strategy analysis with two competing supply chains considering carbon taxation. Comput. Ind. Eng. 2022, 169, 108203. [Google Scholar] [CrossRef]
  48. Rashid, T.; Ali, A.; Chu, Y.-M. Hybrid BW-EDAS MCDM methodology for optimal industrial robot selection. PLoS ONE 2021, 16, e0246738. [Google Scholar] [CrossRef]
  49. Chen, Y.; Li, L. Differential game model of carbon emission reduction decisions with two types of government contracts: Green funding and green technology. J. Clean. Prod. 2023, 389, 135847. [Google Scholar] [CrossRef]
  50. Meng, L.; Wang, J.; Yan, W.; Han, C. A differential game model for emission reduction decisions between ports and shipping enterprises considering environmental regulations. Ocean Coast. Manag. 2022, 225, 106221. [Google Scholar] [CrossRef]
  51. Yang, H.X.; Chen, W.B. Retailer-Driven Carbon Emission Abatement with Consumer Environmental Awareness and Carbon Tax: Revenue-Sharing Versus Cost-Sharing. Omega 2018, 78, 179–191. [Google Scholar] [CrossRef]
  52. Zhou, H.Y.; Li, B.T. Analysis of Emission Reduction Decisions of Port and Shipping Enterprises under Carbon Tax and Customers’ Low-Carbon Preferences. Navig. China 2022, 3, 72–79. [Google Scholar]
  53. Zhou, H.N.; Liu, M.Q.; Tan, Y. Long-term emission reduction strategy in a three-echelon supply chain considering government intervention and consumers’ low-carbon preferences. Comput. Ind. Eng. 2023, 186, 109697. [Google Scholar] [CrossRef]
  54. Cheng, P.Y.; Ji, G.X.; Zhang, G.T.; Shi, Y.Y. A closed-loop supply chain network considering consumer’s low-carbon preference and carbon tax under the cap-and-trade regulation. Sustain. Prod. Consum. 2022, 29, 614–635. [Google Scholar] [CrossRef]
  55. Ghosh, S.K.; Seikh, M.R.; Chakrabortty, M. Analyzing a stochastic dual-channel supply chain under consumers’ low carbon preferences and cap-and-trade regulation. Comput. Ind. Eng. 2020, 149, 106765. [Google Scholar] [CrossRef]
  56. Cai, J.H.; Cao, Z.G.; Shang, J. Blockchain adoption in a green supply chain: Considering information asymmetry of consumers’ privacy concern. Int. J. Prod. Econ. 2025, 279, 109459. [Google Scholar] [CrossRef]
  57. Yu, T.Y.; Guan, Z.M.; Zhang, J.; Dong, J.Y. Blockchain adoption and contract coordination of poverty alleviation supply chain considering altruistic preference. Comput. Ind. Eng. 2024, 188, 109879. [Google Scholar] [CrossRef]
  58. Xiao, L.; Chen, Z.S.; Hou, R.; Mardani, A.; Skibniewski, M.J. Greenness-based subsidy and dual credit policy to promote new energy vehicles considering consumers’ low-carbon awareness. Comput. Ind. Eng. 2023, 185, 109620. [Google Scholar] [CrossRef]
  59. Shi, Z.Y.; Cheng, J.W. How do government subsidies and consumers’ low-carbon preference promote new energy vehicle diffusion? A tripartite evolutionary game based on energy vehicle manufacturers, the government and consumers. Heliyon 2023, 9, e14327. [Google Scholar] [CrossRef]
  60. Nerlove, M.; Arrow, K.J. Optimal Advertising Policy under Dynamic Conditions. Economica 1962, 29, 129–142. [Google Scholar] [CrossRef]
  61. Zhu, C.; Xi, X.; Goh, M. Differential game analysis of joint emission reduction decisions under mixed carbon policies and CEA. J. Environ. Manag. 2024, 358, 120913. [Google Scholar] [CrossRef] [PubMed]
  62. Li, Z.; Wang, L.; Wang, G.; Xin, X.; Chen, K.; Zhang, T. Investment and subsidy strategy for low-carbon port operation with blockchain adoption. Ocean Coast. Manag. 2024, 248, 106966. [Google Scholar] [CrossRef]
  63. Choi, T.M. Blockchain-technology-supported platforms for diamond authentication and certification in luxury supply chains. Transp. Res. Part E Logist. Transp. Rev. 2019, 128, 17–29. [Google Scholar] [CrossRef]
  64. Sui, R.; Liu, M.; Liu, Y.; Zha, X. Two-sided dynamic pricing and value-added service investment strategies of competitive platforms considering indirect network effects. Int. J. Prod. Econ. 2024, 272, 109262. [Google Scholar] [CrossRef]
  65. Liu, M.; Du, S.; Nie, T.; Zhu, Y. Pricing, channel design, and platform operations with buy-online-and-pick-up-in-store in online food delivery market. Int. J. Prod. Econ. 2024, 274, 109293. [Google Scholar] [CrossRef]
  66. Xia, L.; Li, K.; Wang, J.; Xia, Y.; Qin, J. Carbon emission reduction and precision marketing decisions of a platform supply chain. Int. J. Prod. Econ. 2024, 268, 109104. [Google Scholar] [CrossRef]
  67. Cai, J.; Jiang, F. Decision models of pricing and carbon emission reduction for low-carbon supply chain under cap-and-trade regulation. Int. J. Prod. Econ. 2023, 264, 108964. [Google Scholar] [CrossRef]
  68. Jiang, Y.; Liu, C. Research on carbon emission reduction and blockchain investment under different dual-channel supply chains. Environ. Sci. Pollut. Res. 2022, 29, 65304–65321. [Google Scholar] [CrossRef]
Figure 1. Structure of the green shipping supply chain.
Symmetry 17 00817 g001
Figure 2. Four typical blockchain scenarios.
Symmetry 17 00817 g002
Figure 3. Trajectory diagram of emissions reductions level changing with t under different cases.
Symmetry 17 00817 g003
Figure 4. Trajectory diagram of service level changing with t under different cases.
Symmetry 17 00817 g004
Figure 5. Trajectory diagram of shipping demand changing with t under different cases.
Symmetry 17 00817 g005
Figure 6. Trajectory diagram of port expected discounted profit changing with t.
Symmetry 17 00817 g006
Figure 7. Trajectory diagram of shipping expected discounted profit changing with t.
Symmetry 17 00817 g007
Figure 8. Trajectory diagram of blockchain platform expected discounted profit changing with t.
Symmetry 17 00817 g008
Figure 9. Trajectories of discounted profits under different models as a function of p.
Symmetry 17 00817 g009
Figure 10. Trajectories of discounted profits under different models as a function of r.
Symmetry 17 00817 g010
Figure 11. Trajectories of discounted profits under different models as a function of α.
Symmetry 17 00817 g011
Figure 12. Trajectories of discounted profits under different models as a function of γ.
Symmetry 17 00817 g012
Figure 13. Trajectories of discounted profits under different models as a function of β.
Symmetry 17 00817 g013
Figure 14. Trajectories of discounted profits under different models as a function of φ.
Symmetry 17 00817 g014
Figure 15. Trajectories of discounted profits under different models as a function of cb.
Symmetry 17 00817 g015
Table 1. Summary of some existing related literature.
AuthorsShipping Supply ChainDynamic OperationsBlockchain AdoptionType of ShippersDecision-Making
Non
Low-Carbon
Preference
Emission ReductionBlockchain InvestmentLow-Carbon Preference
Wang et al. [21]
Liu et al. [14]
Ji et al. [36]
Zhu et al. [39]
Wu and Yang [43]
Kang et al. [44]
Yang et al. [46]
Chen et al. [49]
Yang ang chen [51]
Zhou and Li [52]
Zhou et al. [53]
Cai et al. [56]
This paper
Table 2. Model symbols and descriptions.
SymbolDescription
tTime, t ∈ [0, +∞)
b(t)Blockchain investment level (BIL) at time t
a(t)The shipping company’s emissions reduction efforts (ERE) at time t
g(t)The port’s green investment level (GIL) at time t
E(t)Emissions reduction level (ERL) in the shipping supply chain at time t
σAttenuation rate of ERL
E0Initial emissions reductions level in the shipping supply chain, E(0) = E0
λChannel preference coefficient of shippers utilizing shipping logistics blockchain platform
uInfluence factor of the shipping company ERE on ERL
θInfluence factor of the port GIL on ERL
S(t)The shipping service level (SSL) under blockchain technology at time t
S0Initial (without blockchain) shipping service level, S(0) = S0
τAttenuation rate of SSL
φInfluence factor of the BIL on ERL
αProportion of low-carbon-preference shippers
vValuation of shipping services by shippers, v~U(0, 1)
pShipping service price
rPort service fee
βThe sensitivity of shippers to shipping services
γLow-carbon preference of shippers
mGreen trust coefficient of shippers on ERL
ρDiscount rate
D(t)Shipping demand at time t
k, h, ηCost coefficients of GIL, ERE and BIL in the shipping supply chian
ωUnit operating cost of blockchain
c0The unit operating cost of the port company
c1The unit operating cost of the shipping company
c2The unit operating cost of the shipping logistics blockchain platform
cbBlockchain usage fee charged by shipping logistics blockchain platform
πPTotal expected profit of port company
πCTotal expected profit of shipping company
πFTotal expected profit of shipping logistics blockchain platform
VPExpected discounted profit of port company
VCExpected discounted profit of shipping company
VFExpected discounted profit of shipping logistics blockchain platform
Table 3. Shippers’ utility function with and without blockchain.
Shipper TypesWithout BlockchainWith Blockchain
Low-carbon-preference shippersvp + β·S0 + γ·E(t)vp + β·S(t) + γ·E(t)
Non low-carbon-preference shippers vp + β·S0vp + β·S(t)
Disclaimer/Publisher’s Note: The statements, opinions and data contained in all publications are solely those of the individual author(s) and contributor(s) and not of MDPI and/or the editor(s). MDPI and/or the editor(s) disclaim responsibility for any injury to people or property resulting from any ideas, methods, instructions or products referred to in the content.