Article

Green and Cooperative Task-and-Route Optimization for Container Trucks with Heterogeneous Carriers Based on Task Sharing

by
Ruijia Zhao
1,
Lichang Han
1,
Yunting Song
2,* and
Zuoxian Gan
1
1
Integrated Transport Institute, Dalian Maritime University, Dalian 116026, China
2
School of Public Administration, Dongbei University of Finance and Economics, Dalian 116025, China
*
Author to whom correspondence should be addressed.
Symmetry 2025, 17(9), 1437; https://doi.org/10.3390/sym17091437
Submission received: 26 June 2025 / Revised: 14 August 2025 / Accepted: 18 August 2025 / Published: 3 September 2025
(This article belongs to the Section Computer)

Abstract

To address the issues of capacity resource waste and increased carbon emissions caused by the asymmetry between import and export container transportation tasks in port collection and dispatching, a green and cooperative task-and-route optimization method for container trucks with heterogeneous carriers based on task sharing is proposed from the perspective of system optimization. Based on the concept of a sharing economy, a sharing and cooperation mechanism with dual elasticity in capacity and information is designed, which integrates the container trucks’ resources and dissymmetric transportation tasks of heterogeneous carriers to expand the revenue potential for all participants. Based on task sharing and matching, a green and cooperative task-and-route optimization model for container trucks with heterogeneous carriers based on task sharing is formulated in order to optimize container trucks’ resources and transportation tasks comprehensively and reduce the system’s carbon emissions. A column generation algorithm embedded with a ring-increasing strategy is designed to solve the problem to improve computational efficiency. Through algorithm testing and a case analysis, the effectiveness of the model and algorithm is validated. The optimization results show that the overall carbon emissions are reduced by more than 28%, the number of used trucks decreases by 28%, and the profits of participants are increased by 24–65% compared with independent operations. Finally, several management insights are obtained regarding the number of shared trucks, the external market demand, task demand variability, the mixed fleet composition, subsidies, and bonus adjustments.

1. Introduction

Against the background of coordinated development in greening and digitalization, as important hubs of international trade, ports are facing the dual challenges of improving operational efficiency and achieving environmentally sustainable development. In a port collection and dispatching system, external container trucks play a significant role in transportation between ports and their hinterlands due to their distinct advantage of providing door-to-door services for medium- and short-distance transportation. However, several issues still hinder the further development of port collection and dispatching, such as high unloading rates, low scheduling efficiency, and resource waste. As an emerging economic mode, the sharing economy has a positive impact on the production and operational activities of enterprises through information sharing, resource sharing, and other effects [1]. Integrating the concept of the sharing economy into port collection and dispatching systems to realize the low-carbon and intelligent transformation of ports has become an urgent issue, where the methods of resource sharing, digital matching, and intelligent scheduling can be used to promote cooperation and resource sharing among carriers and enhance the utilization rate of port resources and their operation efficiency.
A sharing economy is a set of practices that allow consumers to share the same products or services with others. This concept has evolved in recent times in many research domains, such as car, taxi, and bike sharing [2,3]. Regarding the issue of container truck sharing, some surveys of carriers showed that carriers are typically small in scale and often lack convenient ways to cooperate in actual operations. Moreover, carriers are reluctant to transfer transportation tasks to other carriers due to the risk of customer loss, which results in low enthusiasm for cooperation among carriers [4]. The key challenge in container truck sharing lies in developing more effective cooperation mechanisms to foster long-term direct collaboration among carriers. In existing research, profit allocation and transportation task allocation have been considered to design cooperation mechanisms for carriers. However, the enthusiasm of heterogeneous carriers to cooperate has not been fully considered, and research on how the introduction of sharing and cooperation mechanisms affects the complexity of decision structures in the task-and-route optimization of container trucks remains insufficient. Therefore, it is urgent to explore a win–win cooperation mechanism from the perspective of the sharing economy mode. Additionally, a container truck scheduling optimization model based on information sharing should be designed to quantify profit spaces and reduce carbon emissions.
In existing research on external container truck scheduling, studies on the independent operations of carriers are typically based on a simple contractual relationship. In other words, carriers provide transportation services to customers and charge for the service. For example, there are studies focusing on minimizing the total cost or total time [5,6] as the objective by exploring route planning problems for container trucks. In multi-carrier cooperation, revenue allocation is a key factor affecting collaboration and sharing. Although many revenue allocation methods have been proposed, they often yield unsatisfactory results [7]. Some surveys based on qualitative interviews and quantitative questionnaires show that the lack of cooperative models capable of coordinating multiple carriers is a key factor limiting cooperation among container truck carriers [8]. Sharing of transportation task information among carriers helps small carriers to achieve economy-of-scale effects. However, large carriers are less enthusiastic to share their transportation tasks, and the attractiveness of participating in cooperation is relatively low [9]. Some studies have suggested that carriers can achieve cooperation and reduce overall transportation costs by exchanging transportation tasks. However, this approach makes it difficult to ensure that all participating carriers benefit equally from cooperation [10]. Introducing a profit compensation mechanism in carrier cooperation allows carriers to obtain compensation by sharing transportation tasks and earn profits by completing transportation tasks shared by other carriers [11]. However, this cooperation model lacks centralized management by a third party, making it difficult to ensure the quality of transportation task completion. In addition, carriers must disclose important information to other carriers during the process of exchanging and sharing transportation tasks. Therefore, the confidentiality of customer information is crucial, as it can affect the stability of cooperation and the sustainability of sharing [12]. Therefore, it has become an urgent issue to design effective cooperation mechanisms to tap into the enthusiasm of carriers to cooperate fully and establish a stable cooperation platform to improve the efficiency of collection and dispatching at ports.
Existing research on port container truck scheduling, while addressing multi-carrier cooperation, still lacks the deep integration of sharing economy concepts. The main shortcomings include the absence of efficient resource-sharing cooperation mechanisms, with existing collaborative models mostly being limited to simple transportation task exchanges, demonstrating poor systemic integration of core elements such as container trucks and transportation tasks, along with insufficient incentives for heterogeneous carriers. Research on the synergy between truck scheduling under carrier collaboration and low-carbon objectives remains inadequate, failing to harness the potential of the sharing economy in improving port drayage efficiency and facilitating a low-carbon transition.
This study introduces the concept of the sharing economy and conducts research from the perspective of system optimization. The main work and contributions are as follows. (1) A sharing and cooperation mechanism with dual elasticity in capacity and information is designed to enhance the enthusiasm of heterogeneous carriers to cooperate, integrate capacity resources and transportation tasks, and establish a green sharing platform (GSP). (2) A green and cooperative task-and-route optimization model for container trucks with heterogeneous carriers based on task sharing is formulated to minimize the carbon emissions of the system, considering the spatiotemporal matching of scattered transportation tasks and the coordination of the revenue situations among all participants in the GSP. (3) To address the increased computational complexity induced by carrier cooperation, a ring-increasing strategy is designed to refine the column generation algorithm to enhance the computational efficiency. Insights for management are presented from the perspectives of the capacity size shared by carriers, external market demand, task demand variability, mixed fleets, and profit allocation of the GSP. The optimization method presented in this study allows resources to be efficiently coordinated and enables transportation tasks to be matched better among heterogeneous carriers, providing valuable insights for promoting the green development of the port collection and dispatching system.
The remainder of this article is organized as follows. Section 2 presents the relevant literature. Section 3 presents the problem statement, proposes a cooperation mechanism, and develops the mathematical formulation. Section 4 elaborates upon the solution methodology. Section 5 discusses the algorithmic testing and case studies, offering managerial insights for sustainable operations of the GSP along with the research limitations. Section 6 concludes the study.

2. Literature Review

2.1. Green Vehicle Routing Problem

To address environmental issues and reduce carbon emissions, many studies have given significant attention to the green vehicle routing problem [13]. Vidović et al. [14] studied this problem by optimizing the matching of pickup and delivery requests through heuristic methods to reduce the total travel distance and, consequently, lower carbon emissions. Zhang et al. [15] were among the first scholars to focus on low-carbon objectives in inland container transportation problems, developing an MILP model to minimize total carbon emissions rather than traditional metrics such as travel time. He et al. [16] studied the inland container transportation problem in the separation mode, effectively solving it by introducing a mixed-integer programming model and using an improved ant colony algorithm to achieve reductions in fuel costs and carbon emissions. Ding et al. [17], aiming to reduce carbon emissions at container terminals, applied a two-stage integer optimization model and developed a genetic algorithm to optimize the container truck routing problem, validating the method’s effectiveness using the northern operation area of Yangshan Deep-Water Port as a case study. In summary, existing research in the field of low-carbon container transportation has primarily focused on single- or multi-objective vehicle routing optimization problems with carbon emission minimization as an objective. Therefore, introducing green objectives into vehicle routing problems has become a key focus of current research.

2.2. Task Allocation and Cooperative Transportation

The solution process for the vehicle routing problem (VRP) and its variants involves both task allocation to vehicles and vehicle routing planning, representing a classic NP-hard problem. Researchers commonly employ heuristic algorithms or exact methods to enhance the solving efficiency and scalability for large-scale scenarios. In terms of heuristic approaches, Park et al. [18] designed a genetic algorithm to solve the vehicle routing problem with simultaneous pickup and delivery, which was effectively validated in the context of logistics companies. Wang et al. [19] introduced the improved non-dominated sorting genetic algorithm-II to solve the constructed bi-objective routing optimization problem. Li et al. [20] developed a metaheuristic method incorporating an adaptive neighborhood selection mechanism for addressing the vehicle routing problem with simultaneous deliveries and pickups. However, while heuristic methods ensure computational efficiency, their solution quality and stability require improvement, exhibiting notable precision limitations; particularly in adapting to large-scale, complex scenarios. Consequently, some researchers have developed exact algorithms based on column generation frameworks to solve the VRP [21]. Wang et al. [22] investigated collaborative delivery systems using both trucks and drones by formulating a route-based model and designing a column generation algorithm. Li et al. [23] developed a heuristic algorithm to obtain initial solutions, which were subsequently refined using a branch-and-price-and-cut algorithm. These scholars typically formulate models with the objective of total cost minimization to facilitate exact solution approaches via column generation frameworks. This study addresses a VRP variant where profit allocation among multiple carriers substantially increases the computational complexity. Consequently, there is an urgent need to develop a high-performance algorithmic solution tailored for the VRP under multi-carrier cooperation frameworks.

2.3. Sharing Mechanisms in Logistics and Transportation

In logistics and transportation research, sharing mechanism studies have primarily focused on two dimensions. The first involves operational level, focusing on cooperation mechanisms for information and capacity sharing. Mrabti et al. [24] modeled a shared distribution center involving four suppliers, with the results demonstrating that cooperation significantly enhances logistical operational efficiency. Wang et al. [25] investigated collaborative alliances formed by logistics companies through vehicle sharing, subsequently designing an optimal coordination strategy for solving the collaborative logistics pickup and delivery problem. Fernández et al. [26] examined the shared customer collaboration vehicle routing problem, where clients may dynamically switch between multiple operators. Collaborative sharing not only improves vehicle utilization rates and reduces logistics costs, but also alleviates traffic congestion and mitigates environmental pollution [27]. Equitable allocation of collaboratively generated surplus profits among participants promotes sustainable partnership operation, constituting the second research dimension at the economical level, focusing on the benefit distributions and cost sharing. Stoop et al. [28] designed a cooperative mechanism where carriers select tasks from a shared pool, with each carrier’s allocated task volume being proportional to their shared quantity. Wu et al. [29] employed coalitional game theory to maximize benefits for all participants while maintaining fairness, achieving equitable profit distribution that reconciles individual and collective interests. Wang et al. [25] evaluated the efficacy of the following four profit allocation strategies in maintaining collaborative stability (i.e., logistics companies’ willingness to join and sustain cooperative alliances): an improved Shapley value model, cost gap allocation, game quadratic programming, and the equal-profit method. Under the premise of identical or similar carrier capacity scales and shared task quantities, Uddin et al. [30] designed a cooperative mechanism granting carriers perfectly equal status. To more accurately characterize practical realities, accounting for variations in transport capacity scales, cooperative mechanisms permitting capacity transfers between carriers can effectively address mismatches between transportation tasks and available resources [31]. Notably, more pronounced disparities in carrier capacity levels lead to greater collective profit improvements through such collaboration.
To summarize the above analysis, existing research is primarily focused on carriers that either share their clients or their fleets. Simultaneously sharing both clients and fleets introduces risks, such as privacy breaches and client attrition for carriers, yet existing studies have insufficiently investigated these issues. Further research is urgently needed to develop cooperative mechanisms under such sharing models, aiming to enhance carriers’ willingness to collaborate and ensure equitable profit distribution.
Through a systematic review of the three aforementioned research strands, this study extends the existing literature along two key dimensions: (1) At the cooperative mechanism design level, we develop a dual-flexibility sharing and cooperation mechanism that effectively facilitates collaboration among heterogeneous carriers. This mechanism enhances both transportation capability integration and transportation task consolidation while extending sharing economy applications in port logistics. This work substantially enriches the literature on the vehicle routing problem in the context of sharing. (2) At the algorithmic level, we address the increased computational complexity induced by profit allocation constraints in multi-carrier collaboration. The proposed column generation algorithm embedded with a ring-increasing strategy represents a novel advancement for solving container truck scheduling problems in the context of sharing.

3. Mathematical Model

3.1. Problem Statement

Many logistics companies conduct container drayage operations between a port and its hinterland regions, with each maintaining proprietary fleets of container trucks to procure and execute transportation tasks. These transportation tasks predominantly consist of two modalities: import and export operations, corresponding to outbound and inbound movements of full containers, with associated empty-container repositioning tasks. Conventional transportation processes for import containers involve a carrier obtaining a loaded container at the port terminal, conveying the container via truck to the consignee’s specified location, and subsequently returning empty to the port facility; export container transportation processes are conducted following the inverse sequence. This transportation paradigm inevitably involves substantial empty haul movements that do not generate revenue and elevated operational expenditures while concurrently exacerbating environmental issues. By optimally matching import and export transportation processes, a single truck can simultaneously complete both tasks with only one additional truck travel segment. The operational sequence involves the following: (1) a container is loaded at the port for outbound delivery to the customer; (2) the truck travels to another customer location; (3) an inbound container is transported back to the port. However, for most carriers, the acquired import and export container tasks exhibit significant temporal imbalances, making task matching particularly difficult for individual carriers. Consequently, reducing empty truck movements while maintaining cost efficiency poses substantial practical difficulties. The development of the sharing economy model provides a viable solution for individual carriers to overcome temporal imbalances in transportation tasks. Specifically, heterogeneous carriers with varying container truck fleet sizes and transportation task volumes can establish a green sharing platform through binding consortium agreements. Under these agreements, each participating carrier can elect to share either partial or entire fleets and transportation tasks, systemically rebalancing import–export flow asymmetries and achieving stable task matching equilibria. Compared with conventional import and export transportation processes, the sharing-economy-based operational model not only significantly reduces empty truck mileage but also combines one-way transportation processes, thereby enhancing both truck utilization efficiency and overall port collection and transport efficiency.
In summary, this study investigates the design of cooperation mechanisms among carriers from the perspective of a consortium of heterogeneous carriers based on the sharing economy paradigm. Focusing on the truck fleets and transportation tasks shared by participating carriers, it achieves effective matching of import–export transportation tasks and optimizes container truck routing, thereby ensuring that all carriers obtain economic benefits.
Considering the operational reality of container truck activities while maintaining generality, the following hypotheses are proposed: (1) Each transportation task for carriers consists of either one 40 ft container or two 20 ft containers [5]. In international container transportation, the cargo capacity of a 40 ft container is approximately 2.2 times that of a 20 ft container, while the freight rate is only 1.2–1.5 times higher [32]. Consequently, 40 ft containers dominate the market due to their significant economic advantage, and thus carriers typically configure their trucks for 40 ft container transportation. For the limited demand of 20 ft container transportation, carriers usually adopt a dual-container operation mode, simultaneously transporting two 20 ft containers to ensure the economic efficiency of transport via trucks. (2) After completing a task, trucks return to standby near the port, meaning that all tasks start from the port [33]. Container transportation exhibits a distinct “hub-and-spoke” structure: the trucks’ operational pattern involves shuttling containers back and forth between the port and task locations. Given that task locations are typically geographically dispersed while the port’s position remains fixed, the port in usually designated as both the origin and destination of all transportation tasks in the truck dispatching system to optimize dispatch efficiency. (3) All transportation tasks are completed within one day, with each truck being limited to handling either a single task or one set of matched tasks per day [34]. In terms of the transportation distance, trucks primarily handle short-to-medium-haul tasks, with one-way trip durations typically lasting several hours. Therefore, considering drivers’ working hour restrictions, container loading/unloading operations, and return trip requirements, each truck can normally only complete one set of transportation tasks per day. The parameters and variables are given in Table 1.

3.2. Design of a Dual-Flexibility Sharing and Cooperation Mechanism

An investigation of the current literature reveals that transportation of empty and full containers at ports is typically carried out collaboratively by multiple carriers. These carriers often exhibit significant disparities in capacity resources and the ability to attract transportation tasks due to funding constraints, operational scales, and other factors. In other words, there is heterogeneity in both the number of container trucks and transportation tasks among these carriers. Therefore, we call them heterogeneous carriers. The transportation tasks often exhibit uncertainty in terms of quantity, geographical distribution, and time requirements, and there is asymmetry between import and export container transportation tasks, resulting in an imbalance between the supply of container trucks and the demand for transportation tasks. On the one hand, it can lead to idle trucks or excessively high unloaded rates when the capacity resources exceed the demand for transportation tasks, leading to a waste of resources and sunk costs. On the other hand, carriers need to charter container trucks from the external market to fulfill their tasks when the capacity resources are insufficient to meet the demand for transportation tasks. This not only exposes them to the risk of losing transportation tasks due to the inability to secure capacity resources in time but also reduces customer satisfaction, as service quality cannot be guaranteed. Therefore, a more stable and flexible transportation service, through introducing the concept of the sharing economy to implement platform-based resource management and optimization, is an effective way to address the imbalance between the supply of container trucks and the demand for transportation tasks.
Existing research has shown that while the concept of the sharing economy provides a theoretical foundation for transportation task sharing and matching, the strong heterogeneity of carriers, low levels of information sharing, and lack of effective profit distribution methods limit carriers’ enthusiasm to cooperate [35]. To address this, a sharing and cooperation mechanism with dual elasticity in capacity and information among heterogeneous carriers is designed. In other words, carriers within the GSP can flexibly share both container trucks and transportation tasks to the GSP according to their own needs. This flexible sharing approach provides carriers with enough space for adjustment. The sharing and cooperation mechanism with dual elasticity is shown in Figure 1.
As shown in Figure 1, from the perspective of capacity resources, carriers can independently choose the number of container trucks to share on the GSP. The operating costs of the shared container trucks are covered by the GSP and, for revenues, the GSP provides subsidies for shared trucks to the carriers. Alternatively, carriers can independently operate a portion of their container trucks to complete the transportation tasks that are not shared, paying the operating costs themselves and obtaining the profit exclusively. From the perspective of information, carriers can also choose the number of transportation tasks to share with the GSP. The shared transportation tasks will be carried out by the GSP, and carriers are required to pay transportation fees for the shared transportation tasks to the GSP. In this case, carriers can earn a profit from the difference between the transportation fees charged by the GSP and the transportation fees charged to customers. On the other hand, carriers can retain the transportation tasks of important customers and independently carry them out to earn the full transportation fees from these customers for information protection.
To enhance carriers’ oversight of shared customer service quality, the GSP provides corresponding carriers with access permission, enabling real-time monitoring of transportation task execution status, including critical metrics such as progress, timeliness, and completion rates. Furthermore, the GSP implements a strict permission management system that prevents carriers from accessing other carriers’ business data. This design ensures both the confidentiality of customer information and the protection of carriers’ commercial interests, effectively mitigating carriers’ potential customer attrition risks.

3.3. Cost Accounting and Revenue Distribution Method Under the Dual-Flexibility Sharing and Cooperation Mechanism

This section initially formulates a cost accounting and revenue allocation method in the sharing and cooperation mechanism, aiming to maintain the GSP’s stability while enhancing carrier participation incentives.
(1)
Cost accounting method in the sharing and cooperation mechanism
From the perspective of the GSP, the following four types of costs exist.
a.
Fixed cost: This is incurred for maintaining the normal operation of the GSP.
b.
Operating cost: This is incurred when the GSP dispatches container trucks to carry out transportation tasks, including both unloaded and heavy-load costs for container trucks [36,37].
c.
Chartering expense: This is incurred when the GSP charters container trucks from the external market when its available container trucks are insufficient [38].
d.
Subsidy: This is incurred because the GSP should pay subsidies to carriers who share their container trucks. The number of container trucks that carriers share may be the benchmark for subsidies.
Therefore, the total cost of the GSP is expressed as follows [39].
C P = G + m n 𝒩 x m , n [ u E l m , n + u F ( l m i + l n e ) ] + m x m i ( u E + u F ) l m i + n 𝒩 x n e ( u E + u F ) l n e + φ max { T c 𝒞 Q c , 0 } + β c 𝒞 Q c
From the perspective of carriers, they should pay the operating costs of container trucks, as well as chartering expenses for obtaining additional container trucks from the external market in a shortage of trucks, when they operate some container trucks independently. In contrast, when carriers participate in the GSP and share their trucks and transportation tasks with the GSP, they need not pay operating costs. However, carriers should pay transportation fees to the GSP for these transportation tasks being carried out by the GSP. The transportation fees can be calculated using a linear function based on distances between the port and locations of transportation tasks [5]. Therefore, the cost of carriers when participating in the GSP can be calculated as follows.
C H c = f c ( m c l m i + n 𝒩 c l n e ) , c 𝒞
(2)
Revenue allocation method in the sharing and cooperation mechanism
From the perspective of the GSP, two types of revenues exist. The first is transportation fees that can be charged by the GSP from carriers, as the GSP dispatches container trucks to carry out transportation tasks, which are shared by carriers when participating in the GSP. The second is the revenue from renting surplus container trucks of the GSP out to the external market. Therefore, the revenue of the GSP can be calculated as follows.
R P = c 𝒞 C H c + φ [ T ( m n 𝒩 x m , n + m x m i + n 𝒩 x n e ) ]
From the perspective of carriers, transportation fees are their only revenue for providing transportation services to customers. In contrast, they would have two other types of revenues when participating in the GSP, corresponding to their shared capacity resources and information with the GSP, respectively. The first is subsidies obtained by sharing container trucks, and the second is the bonus allocated by the GSP based on the transportation tasks shared with the GSP. Therefore, the revenue of carriers when participating in the GSP can be calculated using Equation (4), where the bonus proportion of carrier c is determined using Equation (5).
R H k = f s ( m c l m i + n 𝒩 c l n e ) + β Q c + θ c α ( R P C P ) ,   c 𝒞
θ c = ( m c l m i + n 𝒩 c l n e ) / ( m l m i + n 𝒩 l n e ) ,   c 𝒞
Since the GSP needs to allocate some revenues as the above bonus, the actual profit obtained by the GSP equals ψ P = ( 1 α ) ( R P C P ) .

3.4. Green Cooperative Task-and-Route Optimization Model for Container Trucks

Carbon emissions predominantly come from fuel combustion during container truck driving. Higher fuel combustion results in more carbon emissions, and the fuel consumption is related to the driving distance of container trucks and load status [40]. Therefore, under the scheduling of the GSP, the total carbon emissions generated by completing transportation tasks can be calculated using Equation (6).
E P = λ { m n 𝒩 x m , n [ E l m , n + F ( l m i + l n e ) ] + m x m i ( E + F ) l m i + n 𝒩 x n e ( E + F ) l n e }
Under the sharing and cooperation mechanism with dual elasticity, the GSP integrates the capacity resources and transportation tasks of heterogeneous carriers. Through the coordinated allocation of resources, the GSP aims to reduce carbon emissions and promote the healthy development of the sharing economy. Therefore, a green and cooperative task-and-route optimization model for container trucks with heterogeneous carriers based on task sharing is formulated, with the combination of import and export container transportation tasks and the routes of container trucks as the decision variables. The model is referred to as M1, and its objective function is the minimization of system carbon emissions under the unified scheduling of the GSP [41], as shown in Equation (7).
[ M 1 ]   min E P
M1 achieves the minimization of system carbon emissions while simultaneously ensuring that all parties participating in the GSP benefit. It guarantees the GSP’s profitability by maintaining positive residual profits after bonus distribution, as formalized in Equation (8).
ψ P = ( 1 α ) ( R P C P ) 0
M1 ensures carriers receive benefits by maintaining a positive difference between their total income and total expenditure, as specified in Equation (9).
R H c C H c ψ P c ,   c 𝒞
To ensure customer satisfaction, the completion of all transportation tasks, which comprise both import and export transportation tasks, must be guaranteed in the GSP [38]. The constraints are specified in detail in Equations (10)–(12).
2 m n 𝒩 x m , n + m x m i + n 𝒩 x n e = + 𝒩
n 𝒩 x m , n + x m i = 1 , m
m x m , n + x n e = 1 , n 𝒩
The GSP does not have unlimited available container trucks. The number of trucks used to complete all transportation tasks must not exceed the GSP’s callable trucks, as formalized in Equation (13).
m n 𝒩 x m , n + m x m i + n 𝒩 x n e T
Each container truck corresponds to one route. Under each route, the truck may complete either a single transportation task or a combination of tasks. Consequently, there is a relationship between the route of a container truck and the task combination, as specified in Equation (14).
k 𝒦 r m , n , k = x m , n , m , n 𝒩
When executing import transportation tasks, container trucks must depart from the port; when handling export transportation tasks, they must return to the port [42]. Consequently, each transportation task can only be assigned to one route, as formalized in Equations (15) and (16).
k 𝒦 r o , m , k = 1 , m
k 𝒦 r n , d , k = 1 , n 𝒩
For each route, flow balance must be maintained at all visited locations. These nodes are categorized into two types: locations n and locations m, as formalized in Equations (17) and (18).
k 𝒦 r o , m , k = n 𝒩 { d } k 𝒦 r m , n , k , m
k 𝒦 r n , d , k = m { o } k 𝒦 r m , n , k , n 𝒩
To address the time sensitivity of real-world operations, the latest acceptable service times for import and export containers are incorporated into truck route constraints. Specifically, in this study, deadlines are imposed for both container delivery and pickup completion. This approach balances carrier interests with carrier scheduling flexibility, as formalized in Equation (19).
k 𝒦 r m , n , k max   { 0 ,   M ( t n e t m t m i l m , n / v ) + 1 } ,   m , n 𝒩
The binary constraints of the decision variables are specified in Equations (20) and (21).
x m , n , x m i , x n e { 0 , 1 } , m , n 𝒩
r m , n , k { 0 , 1 } , m { o } , n 𝒩 { d } , k 𝒦
Detailed descriptions of the constraints are provided in Table 2.

4. Design of a Column Generation Algorithm Embedded with a Ring-Increasing Strategy

Regarding the problem complexity, we define a pair of import and export container transportation tasks that satisfy the time window constraints as a task combination { m , n } , m , n 𝒩 . Transportation tasks that do not meet the combination conditions and are carried out individually are also regarded as a task combination, which is { m , 0 } or { 0 , n } . Thus, it can be deduced that the import and export container transportation tasks can be matched into, at most 𝒩 + + 𝒩 different task combinations. To fulfill all transportation tasks from carriers, the GSP will select at least max { , 𝒩 } task combinations from all possible combinations to form the final scheduling scheme. Given the dependency relationships among task combinations { m , n } , { m , 0 } , and { 0 , n } , once { m , n } are determined, { m , 0 } and { 0 , n } are also determined. Consequently, combinatorial analysis demonstrates that the number of feasible solutions equals X = 1 min | | , | 𝒩 | C | | | 𝒩 | X , where X denotes the number of task combinations { m , n } , i.e., X = m n 𝒩 x m , n . The problem is transformed into identifying the optimal combination among all feasible solutions that accomplishes all transportation tasks while minimizing the GSP’s carbon emissions. Furthermore, due to the complex structure introduced by profit distribution among carriers, the computational complexity of the problem grows exponentially with task volume. To address these challenges, we employ a column generation approach as the core algorithm. Through Dantzig–Wolfe decomposition, the model is divided into a route-based master problem and subproblems [43]. To enhance the interaction efficiency between the master problem and subproblems, a ring-increasing strategy is designed based on the spatial coupling characteristics of transportation task locations. This strategy accelerates subproblem optimization, enabling higher-accuracy solutions, or potentially even exact solutions, to be obtained within shorter computation times. The notation used in the algorithm and their descriptions are presented in Table 3.

4.1. Algorithm Procedure

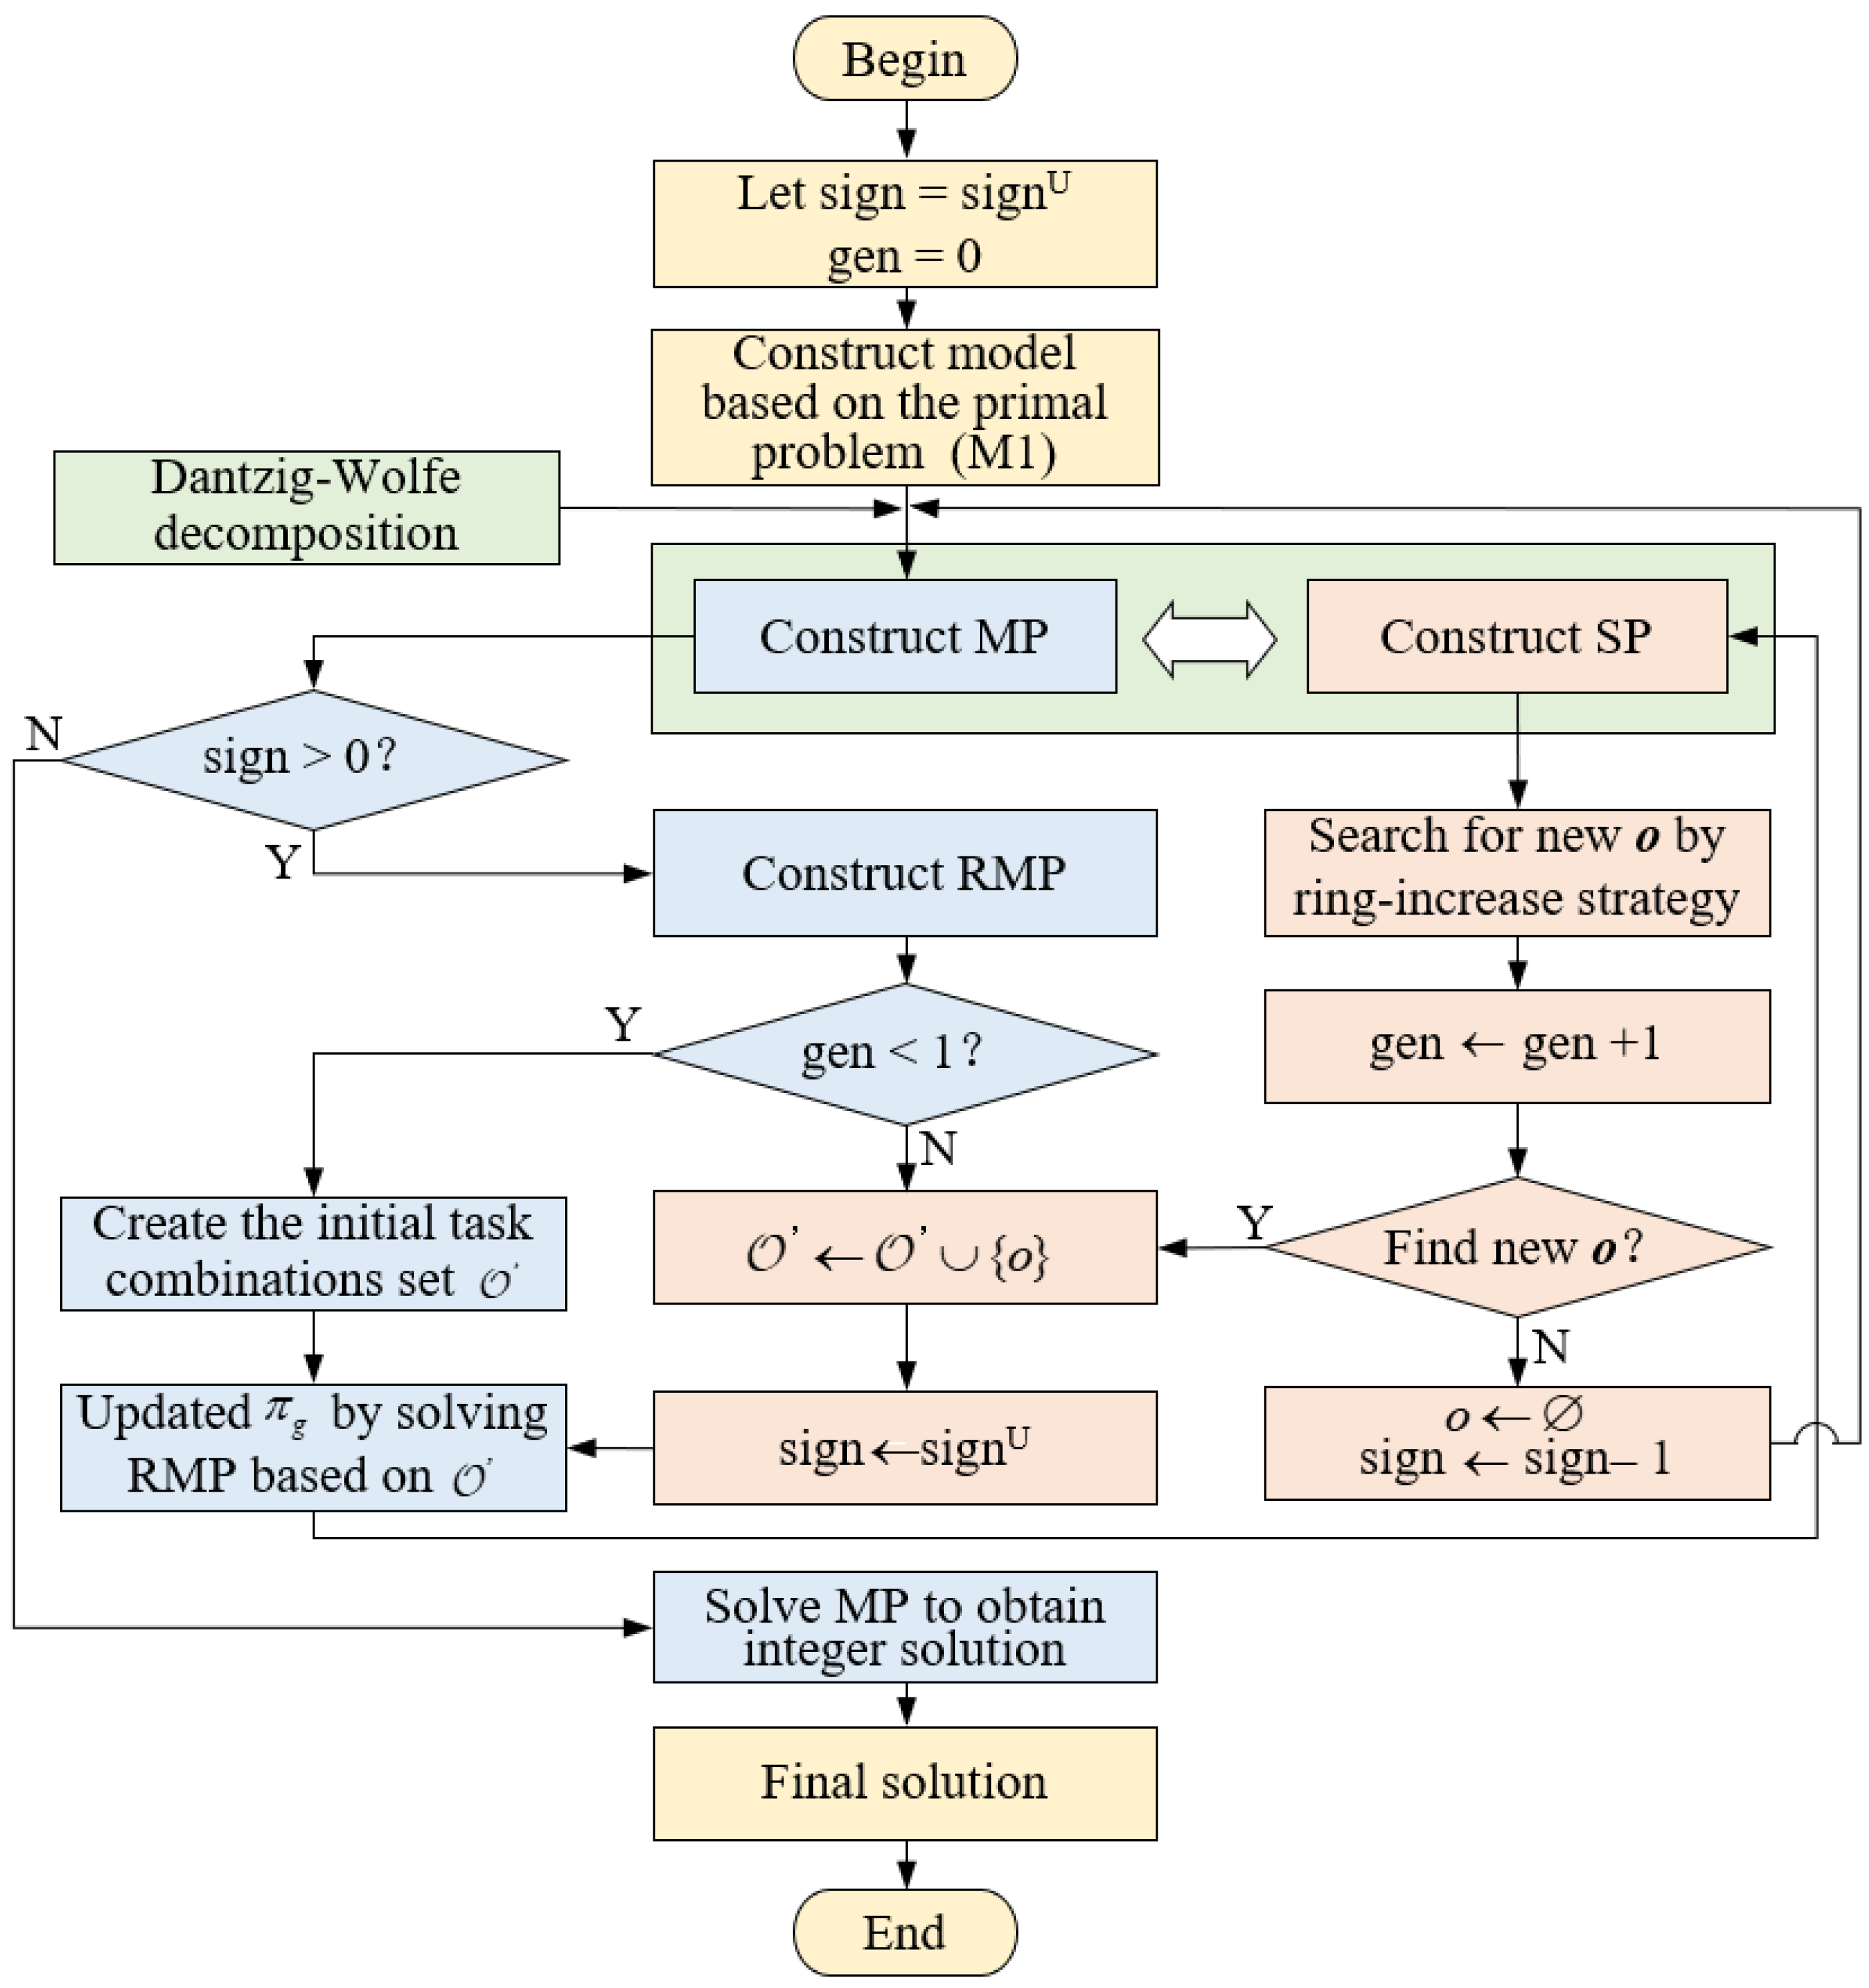
The procedure of the column generation algorithm based on the ring-increasing strategy (RCG) is as follows:
Step 1: Data initialization is conducted by inputting the transportation task sets and 𝒩 , along with fundamental parameters, including the GSP’s subsidy β and transportation fees f c and f s .
Step 2: Using the Dantzig–Wolfe decomposition method, the original problem M1 is partitioned into a master problem (MP) and subproblems (SPs). The profit and transportation task constraints in the MP are relaxed, thereby transforming it into a restricted master problem (RMP).
Step 3: Based on the scenario where all transportation tasks are carried out individually, the initial task combination set 𝒪 for the RMP is constructed, and we let sign sign U .
Step 4: Under the current task combination set 𝒪 , the RMP is solved using CPLEX to obtain the minimal carbon emissions E P R and updated dual information π g . Then, the algorithm evaluates whether E P R has decreased. If true, let sign sign U ; otherwise, let sign sign 1 .
Step 5: If sign > 0 , we perform Step 6; otherwise, we perform Step 7.
Step 6: By incorporating the dual information π g , the ring-increasing strategy from Section 4.3 is employed to search for a new task combination o, and we let ξ o ς o g 𝒩 ε o , g π g . If o satisfies ξ o < 0 , the set 𝒪 will be updated, and we let 𝒪 𝒪 { o } ; otherwise, we let 𝒪 𝒪 and perform Step 7.
Step 7: The updated task combination set 𝒪 is propagated to the MP, which is then solved to optimality using CPLEX. Then, we obtain the minimal carbon emissions, the corresponding container truck scheduling scheme, and the total profit allocation across all carriers, and end the process.
The procedure of the RCG is as Figure 2.

4.2. Model Decomposition

Through the decomposition of the model, the master problem is transformed into a problem of finding a set of task combinations that can cover all transportation tasks while minimizing the carbon emissions of the system under the GSP, given all feasible task combinations. The subproblem is that of finding the task combinations that satisfy the time constraints of the primary problem, and the reduced carbon emissions are negative.

4.2.1. Master Problem and Restricted Master Problem

Let the set of feasible task combinations o for the primary problem be denoted as 𝒪 . The primary problem can then be transformed into a problem that involves finding a subset within 𝒪 that minimizes carbon emissions while ensuring that the transportation tasks from all carriers are completed. The mathematical model of the master problem (MP) is as follows:
[ MP ]   min E P M = o 𝒪 ς o ϑ o
s . t . o 𝒪 ε o , g ϑ o = 1 , g 𝒩
o 𝒪 ϑ o T
ϑ o 0 , 1 , o 𝒪
where Equation (22) is the objective function for minimizing the total carbon emissions under the unified scheduling of the GSP. Equation (23) places the restriction that all transportation tasks should be completed. Equation (24) represents the constraint that the number of container trucks used by the GSP must not exceed the total trucks available. Equation (25) is the binary constraint of the decision variables.
There will be a vast number of elements within 𝒪 when the problem scale is large, making the master problem difficult to solve. The solution is initiated from a simple initial task combination set 𝒪 by continuously adding feasible task combinations to 𝒪 . This approach avoids the direct resolution of the master problem with set 𝒪 . By relaxing Equations (8), (9), (23) and (25) in the MP, it is transformed into a linear programming problem to which the duality theory can be applied. The relaxed MP is referred to as the RMP, and its mathematical model is as follows:
[ RMP ]   min E P R = o 𝒪 ς o ϑ o
s . t . o 𝒪 ε o , g ϑ o 1 , g 𝒩
o 𝒪 ϑ o T
ϑ o [ 0 , 1 ] , o 𝒪

4.2.2. Subproblem

To enrich the task combinations within 𝒪 and enhance the quality of 𝒪 , the subproblem is primarily used to search for task combinations that satisfy the condition of negative reduced carbon emissions. The model of the SP is as follows:
[ SP ]   min ξ o = ς o g 𝒩 ε o , g π g
s . t .   Equations (14)–(19) and (21)
where ξ o represents the reduced carbon emissions of task combination o. Task combination o is considered a valid task combination when ξ o is negative. π g is the dual variable of Equation (27) in the RMP, which may lead to a lower bound of the RMP, and its economic significance is the carbon emissions generated to fulfill transportation task g. Assuming that transportation task g is in task combination o, ς o can be calculated according to Equation (31) when task combination o contains only the transportation task g.
ς o = λ ( E + F ) l g i x g i | g λ ( E + F ) l g e x g e | g 𝒩
When the task combination o consists of two transportation tasks, one of which is transportation task g, ς o can be calculated according to Equation (32).
ς o = λ [ E l g , n + F ( l g i + l n e ) ] x g , n , n 𝒩 | g λ [ E l m , g + F ( l m i + l g e ) ] x m , g , m | g 𝒩
Through continuous iterative optimization between the RMP and SP, it is considered that the RMP and MP have the same lower bound when no route with a negative ξ o can be found, and the column generation process is terminated. At this point, the best integer solution of the RMP is the final solution.

4.3. Ring-Increasing Strategy

It should be noted that φ is constant in Equation (30), which is for calculating the reduced carbon emissions of ξ o . In addition, ς o is influenced by u E l m , n according to Equation (32). Therefore, the likelihood of ξ o being negative is higher when the travel distance of the container truck from location m to location n in task combination o is relatively short, which means that the value of l m , n is small. Based on this, the ring-increasing strategy is designed to find the minimum task combination set 𝒪 . The pseudocode of the algorithm is as Algorithm 1.
Algorithm 1 Ring-increasing strategy
Symmetry 17 01437 i001
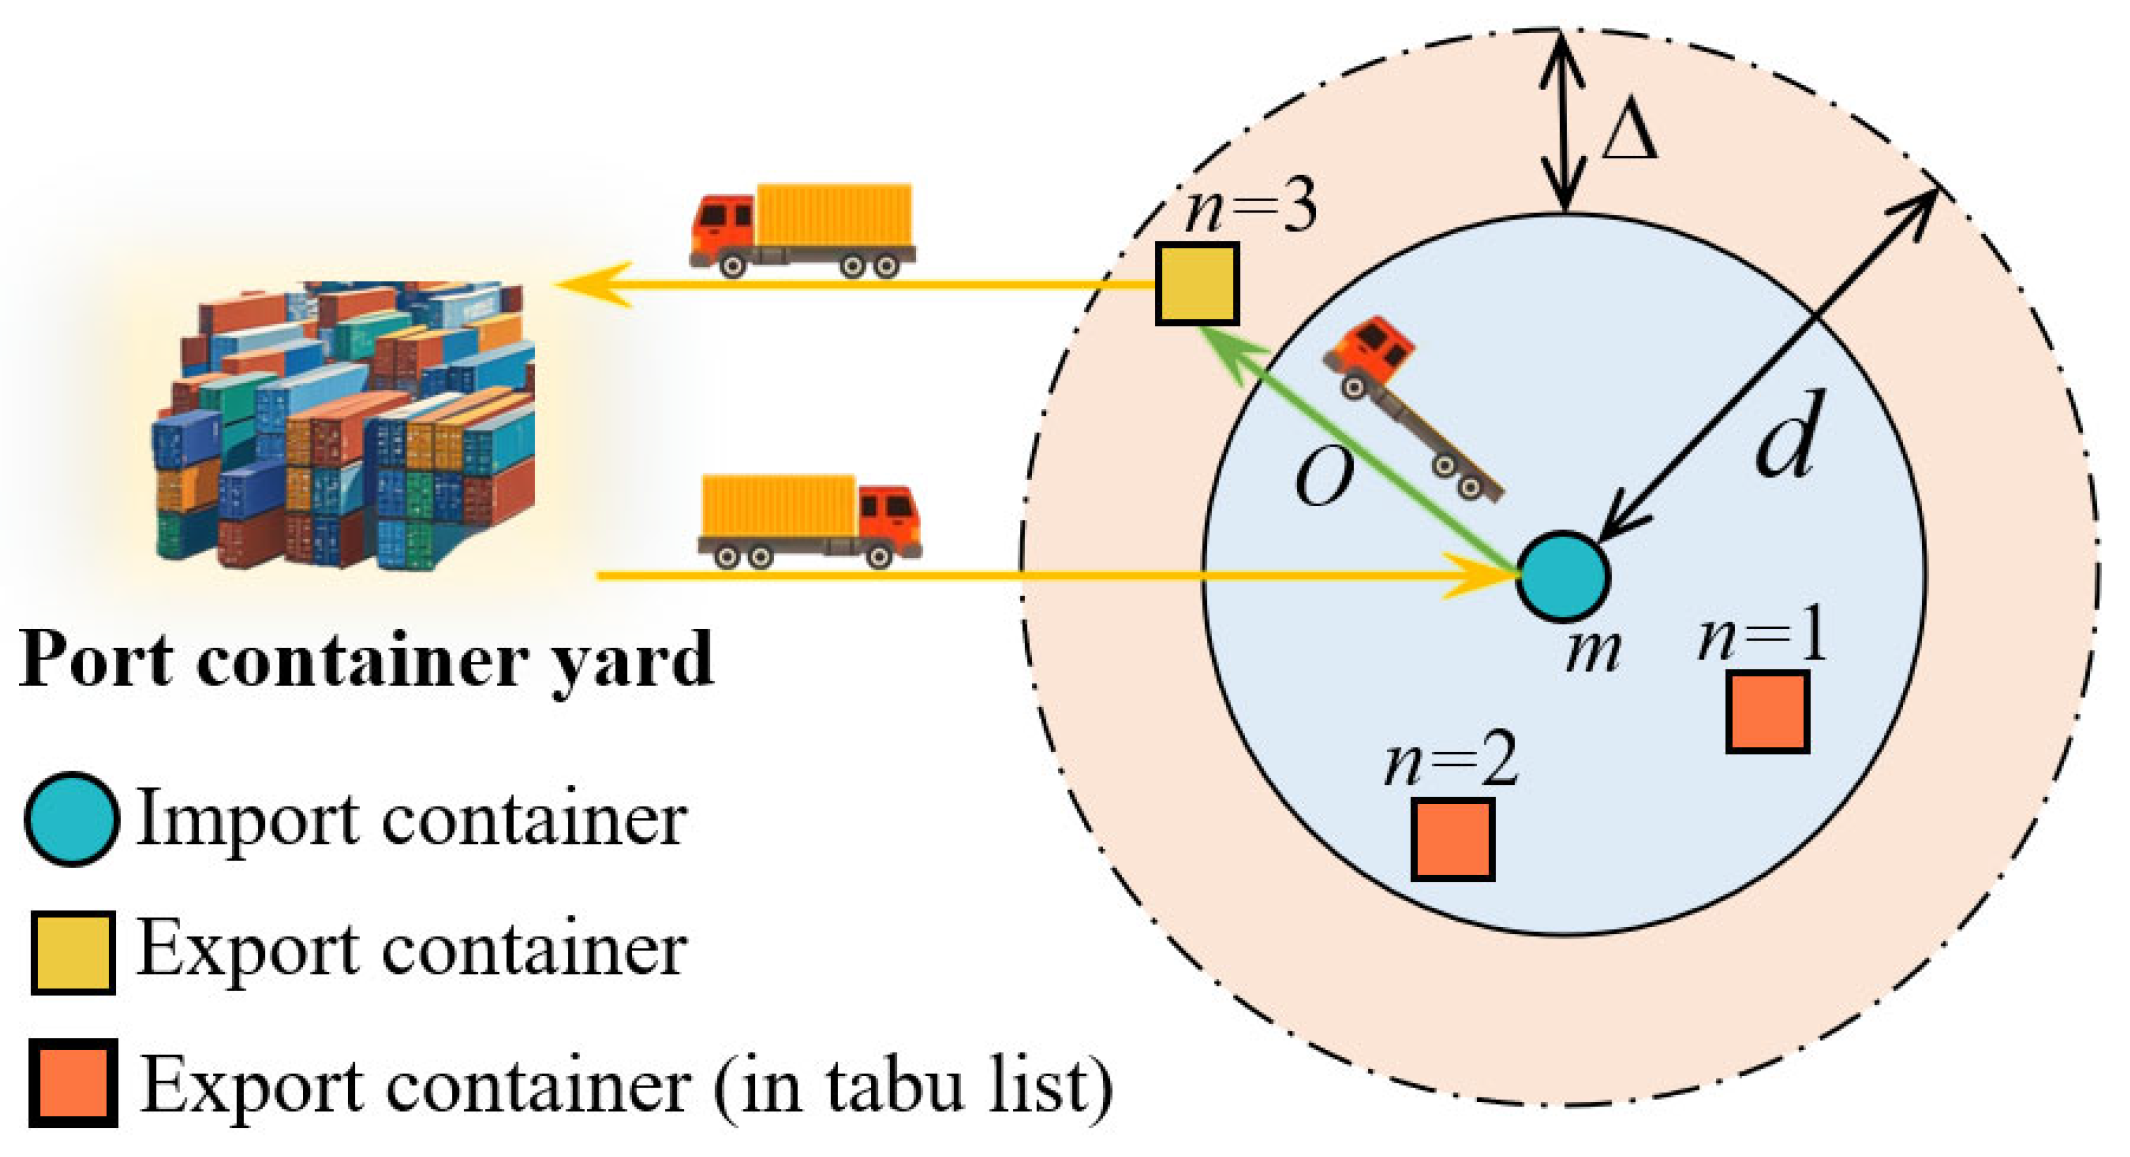
To address the phenomenon of degeneracy in the column generation algorithm, the ring-increasing strategy introduces parameters sign and sign U for early termination. When the algorithm fails to improve the incumbent optimal solution for sign U consecutive iterations, it terminates prematurely. This effectively mitigates the tailing-off effect and enhances the algorithm’s computational efficiency. Taking transportation task m as an example, the pseudocode searches for transportation tasks of the export container within the radius range d centered on m and forms a task combination with transportation task m, as illustrated in Figure 3.

5. Algorithm Testing and Case Study

5.1. Algorithm Testing

To explore the role of the ring-increasing strategy in the RCG, the process of solving the RCG subproblem is modified to randomly select a feasible task combination, and the task is added to 𝒪 when the reduced carbon emissions are negative (CG). Since increasing both the number of carriers and their transportation tasks has similar effects on the GSP, both will lead to an increase in the total number of transportation tasks in the GSP. Therefore, to set different scale instances, the number of import and export transportation tasks in the GSP and the total number of trucks shared by the carrier are adjusted equally. In each group of instances, the numbers of transportation tasks for import and export containers are equal. In RCG and CG, the elements of the initial task combination set 𝒪 are task combinations where all transportation tasks of import and export containers are carried out individually by one container truck. In short, the initial 𝒪 = m { m , 0 } n 𝒩 { 0 , n } . Additionally, we designed a variable neighborhood search (VNS) algorithm (a widely used metaheuristic in the VRP) as a benchmark for performance comparison. The algorithm was configured with 1000 iterations per run [44]. Each instance was solved 10 times with CPLEX and the three algorithms (RCG, CG, VNS) on an Intel Core i7-13700 CPU @2.10 GHz with 8 GB of RAM. CPLEX was configured with the default settings, including zero optimality tolerance and no time limit. The average CPU time and objective value comparison are shown in Table 4, where Gap measures the performance difference between RCG and CG, calculated relative to CG’s achieved objective value and computation time as the baseline.
As evidenced in Table 4, the RCG algorithm demonstrates significant advantages in both computational efficiency and solution quality as the transportation task volume increases. Regarding computation time, RCG consistently maintains the fastest solving speed. At a number of 500 transportation tasks, RCG requires only 9.0% of CG’s computation time and 5.6% of VNS’s time, with this efficiency advantage becoming more pronounced as the problem scale expands. In terms of solution quality, both RCG and CG achieve identical objective values within the allotted time, while VNS shows noticeable gaps in solution quality compared with RCG and CG. RCG saves 75.34% to 94.40% of the time compared with CG. This is because using the ring-increasing strategy in the RCG enables it to achieve a higher column generation efficiency compared to conventional CG. The processes of column addition for both RCG and CG are shown in Appendix A. During each iteration, RCG can add more valid task groups to set 𝒪 , accelerating its update speed. This reduces the number of algorithm iterations, thereby decreasing the frequency of solving the restricted master problem and ultimately shortening the total solution time.

5.2. Case Study

5.2.1. Optimal Results and Discussion

In this case study, we examine three logistics companies in Yingkou, China, setting them to cooperate and establish a GSP. Designated as Carrier A, Carrier B, and Carrier C, these companies transport import and export containers between Yingkou Port and City I, City II, and City III, respectively. The transportation tasks undertaken by the three carriers, along with their container truck conditions, are shown in Table 5.
Based on the sharing and cooperation mechanism with dual elasticity proposed in this study, Carrier A, Carrier B, and Carrier C can participate in the construction of a GSP. The related parameters are shown in Table 6.
Before solving M1, it is necessary to determine the profit of each carrier under independent operations, that is, the parameter ψ P c ( c 𝒞 ) . Each carrier can be considered as a GSP that satisfies the conditions G = 0 , α = 0 , β = 0 , and f c = f s when it is under independent operation. M1 is transformed into a task-and-route optimization model for container trucks based on task sharing and matching under independent operations (M2), and it is composed of Equations (7) and (10)–(21). By solving M2 for each carrier under independent operations, ψ P can be obtained. Each ψ P is used as the value for the parameter ψ P c ( c 𝒞 ) . ψ P A = CNY 12.3 thousand, ψ P B = CNY 4.9 thousand, and ψ P C = CNY 8.6 thousand. Subsequently, let α = 0.6 and β = 300 CNY; M1 can be solved, and the minimum carbon emissions of the GSP are calculated to be 29.40 tons. Compared with carriers operating independently, this represents a reduction in carbon emissions of approximately 27.88%. The carbon emission reduction is achieved through the GSP’s coordinated dispatching of import and export transportation tasks across carriers, where 84% of tasks are consolidated into task combinations. Since each combination required only one truck, the travel distance per shipment decreased by 27.8–49.6%, while the truck empty-load rate dropped sharply from 50% to 15.5%. Consequently, the total fuel consumption was reduced by 19,964 L, thereby lowering carbon emissions. Detailed optimized routing data are provided in Appendix B.
To further investigate the emission-reduction effects of the GSP, we compare the scenario where carriers complete all transportation tasks independently and the scenario where the GSP completes all transportation tasks under the sharing and cooperation mechanism based on the instances described in Section 5.1. The optimized carbon emissions under varying transportation task numbers are presented in Figure 4.
As shown in Figure 4, for the same number of transportation tasks, the GSP can reduce carbon emissions by 28% to 35% compared with carriers operating independently. It can be seen that under the sharing and cooperation mechanism, the GSP shortens the unloaded driving distance of container trucks by matching transportation tasks. This directly lowers fuel consumption and carbon emissions. Furthermore, as the scale of instances increases, the ratio of carbon emission reduction achieved through the sharing and cooperation mechanism of the GSP gradually rises. This is because a larger number of transportation tasks can increase the possibility and adaptability of matching between transportation tasks under the mechanism, further shortening the unloaded driving distance of container trucks and enhancing the carbon emission reduction effect. In summary, the sharing and cooperation mechanism with dual elasticity designed in this study has a significant role in promoting carbon emission reduction in port collection and dispatching, and it demonstrates better effects in large-scale instances.

5.2.2. Analysis of Profit

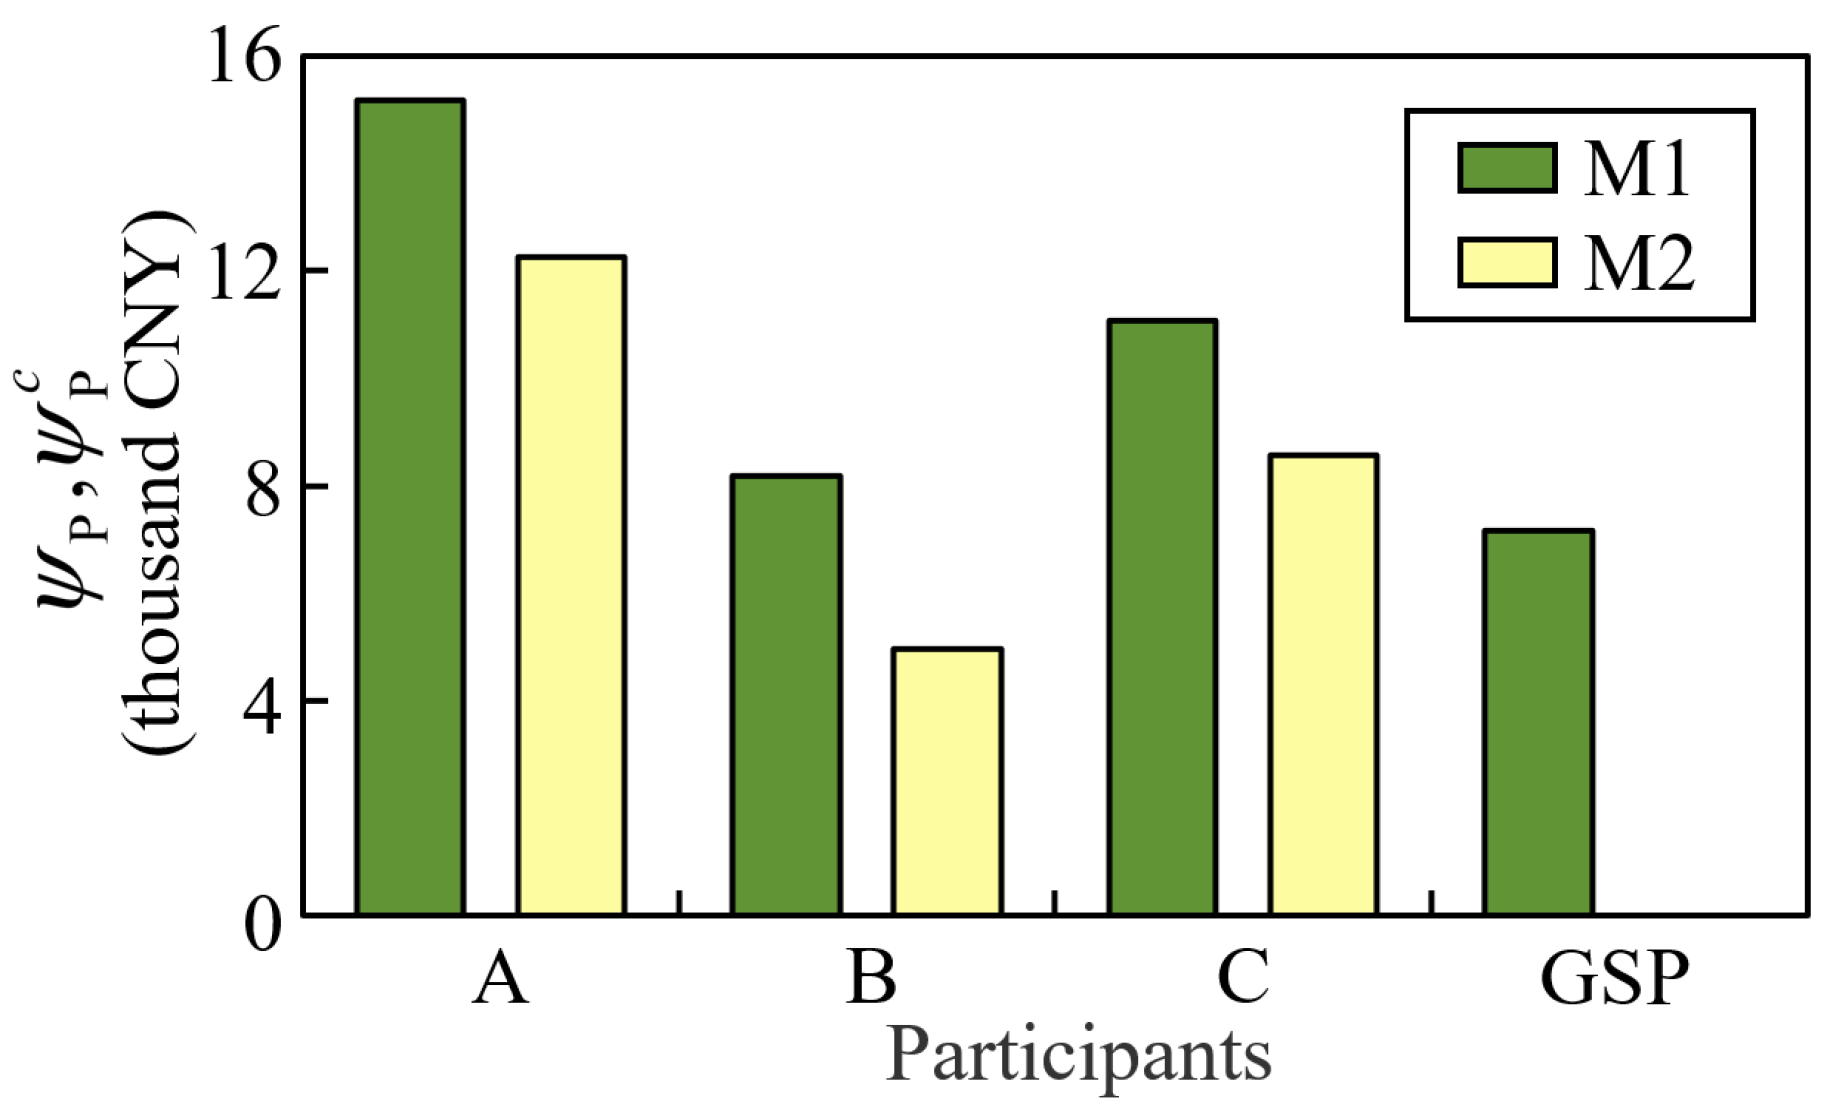
The profit situation of the GSP and each participant is a crucial factor affecting the stability of the GSP. To examine the profit levels of carriers participating in the GSP, taking the case in Section 5.2.1 as an example, a comparison is made between the profits of carriers under independent operations and their profits when participating in the GSP. The results are shown in Figure 5. The revenue and cost situations of the GSP and participants from the optimization results of solving M1 and M2 (referring to participating in the GSP and under independent operations, respectively) are presented in Table 7.
As shown in Figure 5, the profits of Carrier A, Carrier B, and Carrier C increased by 23.6%, 65.3%, and 29.1% after participating in the GSP, respectively. The primary reasons for this profit growth are as follows.
The first reason is the types of revenue and cost changes. From the perspective of carriers, the transportation fees charged to customers remain constant. Although the transportation fees incurred by carriers after participating in the GSP are higher than their operating costs under independent operations, they gain additional revenue from subsidies of trucks and bonuses. This additional revenue exceeds the increase in costs, thereby achieving profit growth. For example, Carrier A needs to pay the GSP a transportation fee that is CNY 6.9 thousand higher than its operating cost under independent operations. However, the combined revenue from subsidies of trucks and bonuses amounts to CNY 9.8 thousand, thus resulting in a net increase in the profit of Carrier A.
Secondly, the GSP reduces operating costs through unified allocation of resources, thereby increasing the bonuses for carriers. From the perspective of the GSP, it achieves transportation task combinations between import and export containers from different carriers by coordinating capacity resources and transportation tasks. To facilitate analysis, the concept of the matching rate η is introduced to describe the matching situation of transportation tasks, which can be calculated using Equation (33).
η = 2 m n 𝒩 x m , n / ( + 𝒩 )
As shown in Table 8, after participating in the GSP, the matching rate increases from 40% to 84%. This improvement reduces the driving distance of container trucks, leading to a 27.88% decrease in carbon emissions, and it lowers the total operating cost from CNY 116.5 thousand to CNY 96.7 thousand, as shown in Table 7. Additionally, the increase in the matching rate also results in a reduction in the number of container trucks used. Under independent operations, Carrier A, Carrier B, and Carrier C use 16, 12, and 12 trucks, respectively, totaling 40. After participating in the GSP, the number of trucks used decreases to 29, with the surplus trucks being rented out to generate a rental fee of CNY 11.0 thousand. Moreover, the reduction in the number of container trucks employed consequently decreases the frequency of truck entries and exits at the port, thereby alleviating traffic congestion in the port area.
In summary, participating in the GSP significantly enhances economic benefits. Under the cooperative allocation of the GSP, fewer container trucks are required to complete the same transportation tasks, reducing the number of container truck trips to and from the port. This reduction also plays a crucial role in alleviating traffic congestion at the port gates.
To evaluate the efficacy of our proposed profit allocation method, we conducted a comparative analysis with the Shapley value method [45]. As demonstrated in Table 7, our method yields a profit distribution ratio of 0.44:0.24:0.32 among Carriers A, B, and C, respectively. When calculated using the Shapley value method, the profit distribution ratio becomes 0.63:0.07:0.30. Comparative analysis reveals that the fundamental distinction between the two allocation methods lies primarily in the significant divergence of Carrier B’s profit share. This discrepancy arises because Carrier B’s participation in the GSP failed to substantially enhance the platform’s aggregate profits, yielding minimal marginal contributions. Although Carriers B and C completed identical quantities of shared transportation tasks, the Shapley value method risks triggering non-cooperative behavior from Carrier B due to perceived allocation inequities. Consequently, our profit allocation method proves more conducive to the GSP’s long-term stability. Essentially, whereas carriers’ marginal contributions fluctuate dynamically with daily shared-task volumes, our approach attenuates the consequent profit volatility, thereby stabilizing intra-platform profit distributions and reinforcing cooperative sustainability.
According to the theory of economies of scale, collaborative operations among multiple carriers yield significantly greater economic benefits compared with independent operations. The results demonstrate that the GSP enhances carriers’ cooperation by facilitating information sharing and centrally coordinating import and export transportation tasks. This optimization reduces truck empty-load mileage, lowering operational costs and ensuring mutual benefits for all participating carriers. In conclusion, the proposed dual-flexibility sharing and cooperation mechanism effectively incentivizes carrier participation, with optimization results fully aligning with theoretical expectations.

5.3. Management Insights

5.3.1. The Impact of the Number of Shared Trucks on the Profits of Participants

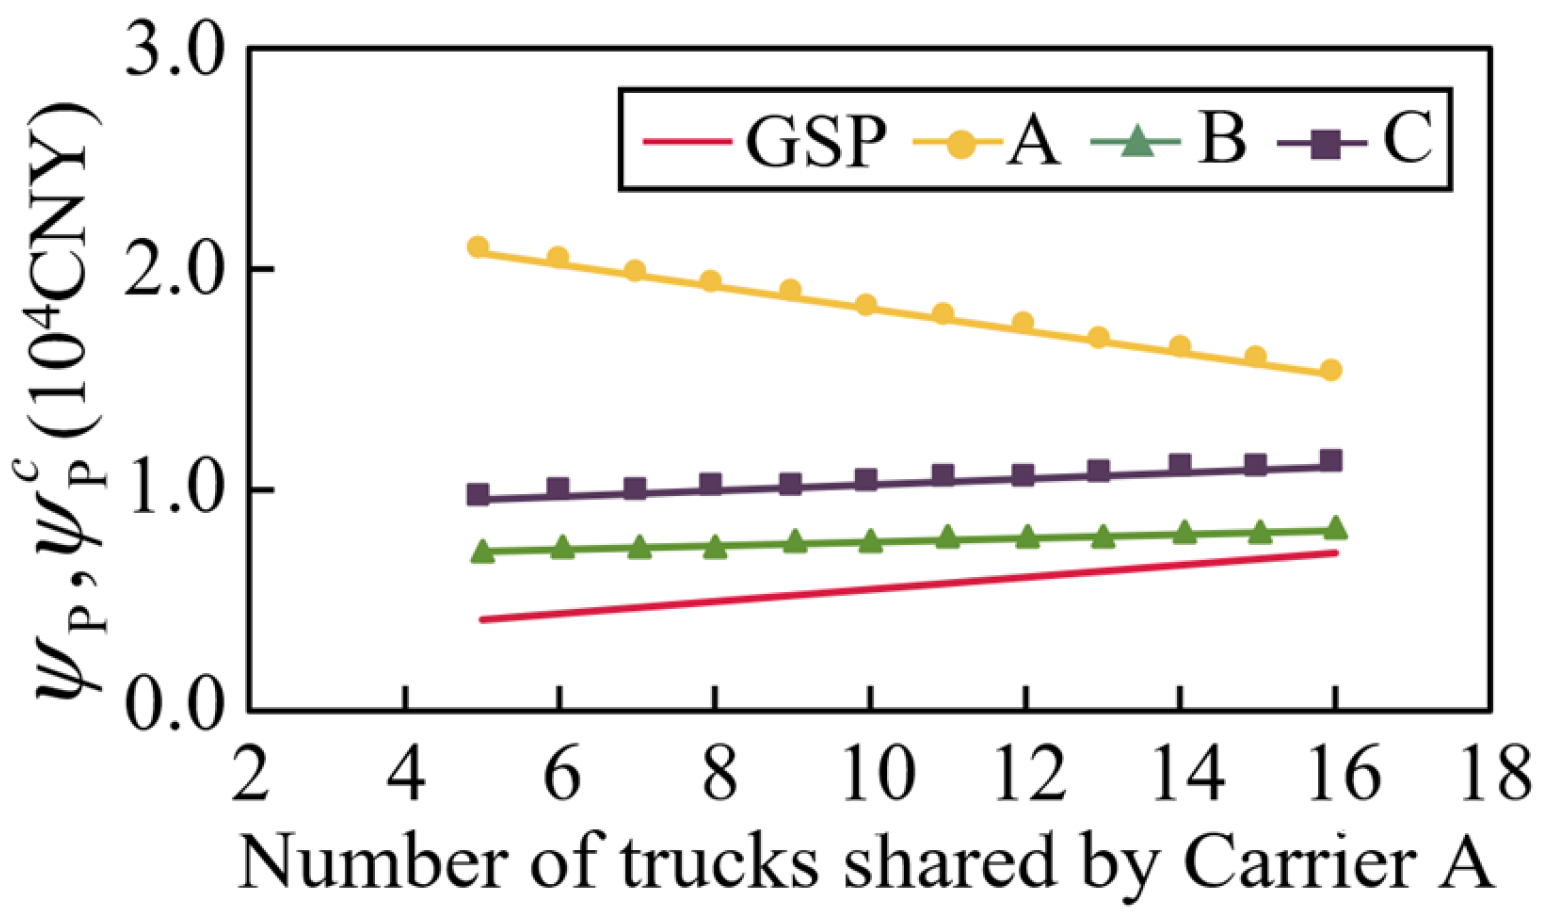
To explore the impact of the number of trucks shared on the profits of the GSP and other participants, we conducted a sensitivity analysis under the assumption that carrier A’s residual trucks could be fully leased externally to obtain rental income. The other parameters remain the same as those in Section 5.2. The resulting profit variations for both the GSP and participating members are illustrated in Figure 6.
As shown in Figure 6, the profits of the GSP and other carriers increase as the number of container trucks shared by Carrier A increases. However, the profit of Carrier A exhibits a continuous decline. Taking the case where Carrier A shares 16 trucks as a baseline in Table 7, Equation (4) demonstrates that Carrier A would incur a CNY 2472 loss in subsidies and bonuses when it reduces five trucks shared with the GSP. However, this loss is significantly lower than the CNY 5000 rental fee revenue earned from renting these trucks to the external market, leading to a net profit increase for Carrier A. This reveals an incentive for carriers to reduce the number of shared trucks when trucks are sufficiently available in the GSP, which has a negative impact on the GSP and other participants. The same pattern applies to Carrier B and Carrier C.
The analytical results hold practical value in two key aspects. First, from the GSP’s perspective, to ensure stable platform operations and safeguard all parties’ interests, the GSP managers should establish truck-sharing agreements with carriers. The analysis provides optimal minimum thresholds for carriers’ truck commitments, enabling the platform to impose penalties on under-contributing carriers and, thereby, maintain sufficient truck supply. Second, from the carriers’ perspective, carriers can determine their optimal truck commitment level to the GSP by evaluating both the profit potential from the GSP and their external truck-leasing capacity.

5.3.2. The Impact of External Market Demand for Trucks on the Profits of Participants

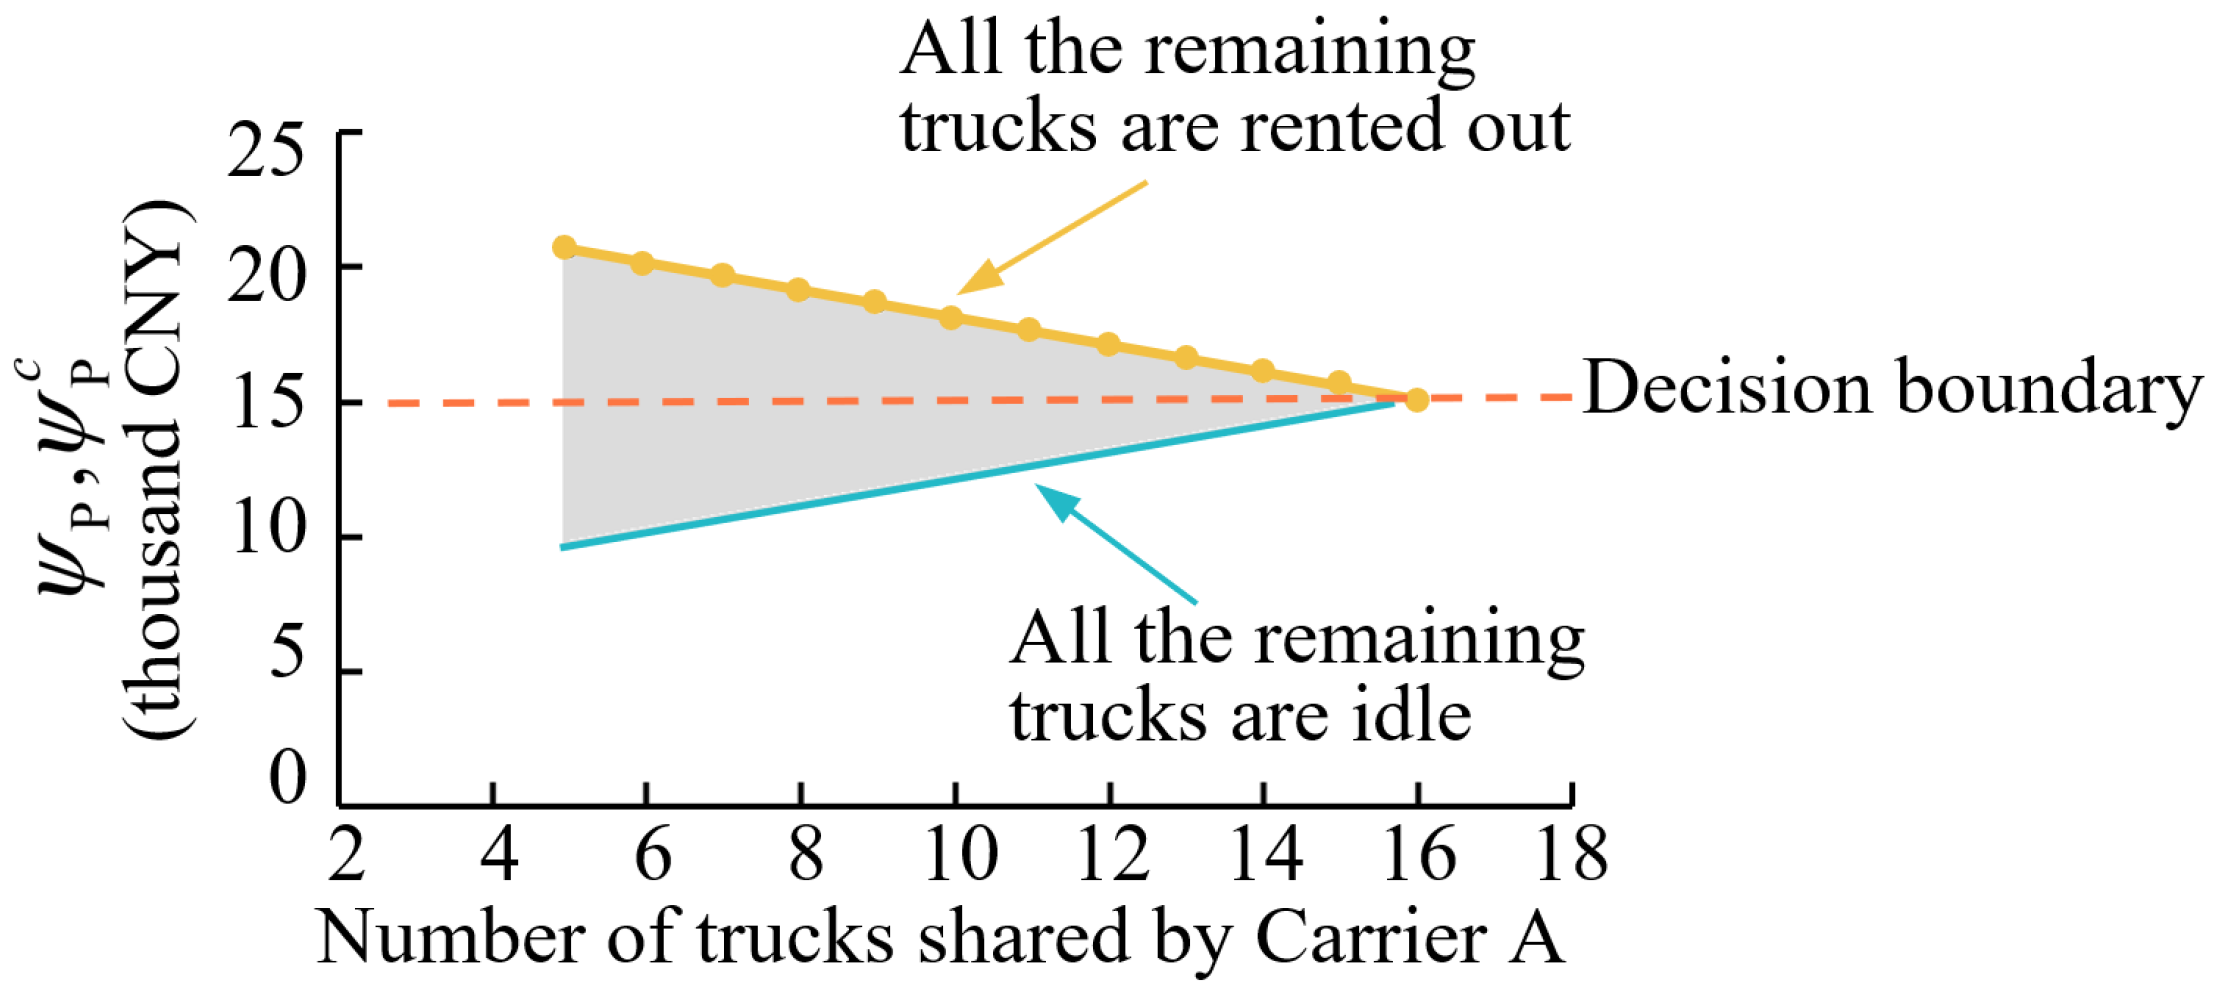
It should be noted that Section 5.3.1 is based on the assumption that the surplus container trucks of Carrier A, which are not shared with the GSP, can be fully rented out to the external market to generate rental fee revenues. However, due to fluctuations in external market demand, there is a possibility that the surplus trucks remain completely idle. In other words, the surplus trucks will not generate any revenue for the carriers. Therefore, the relationship between the number of trucks that Carrier A shares with the GSP and its profit is depicted in the gray area of Figure 7. The upper boundary of this area represents the scenario where all of the surplus trucks are rented out to the external market. The lower boundary represents the scenario where all trucks are completely idle and generate no rental fee revenue. The carrier is more inclined to reduce the number of shared trucks when external market demand for trucks is strong. In other words, renting out the surplus trucks enables the profit of the carrier to exceed the decision boundary. However, the carrier is more willing to share all trucks with the GSP to achieve more stable profits for renting out the surplus trucks, resulting in its profit falling below the decision boundary when the external market demand is weak.
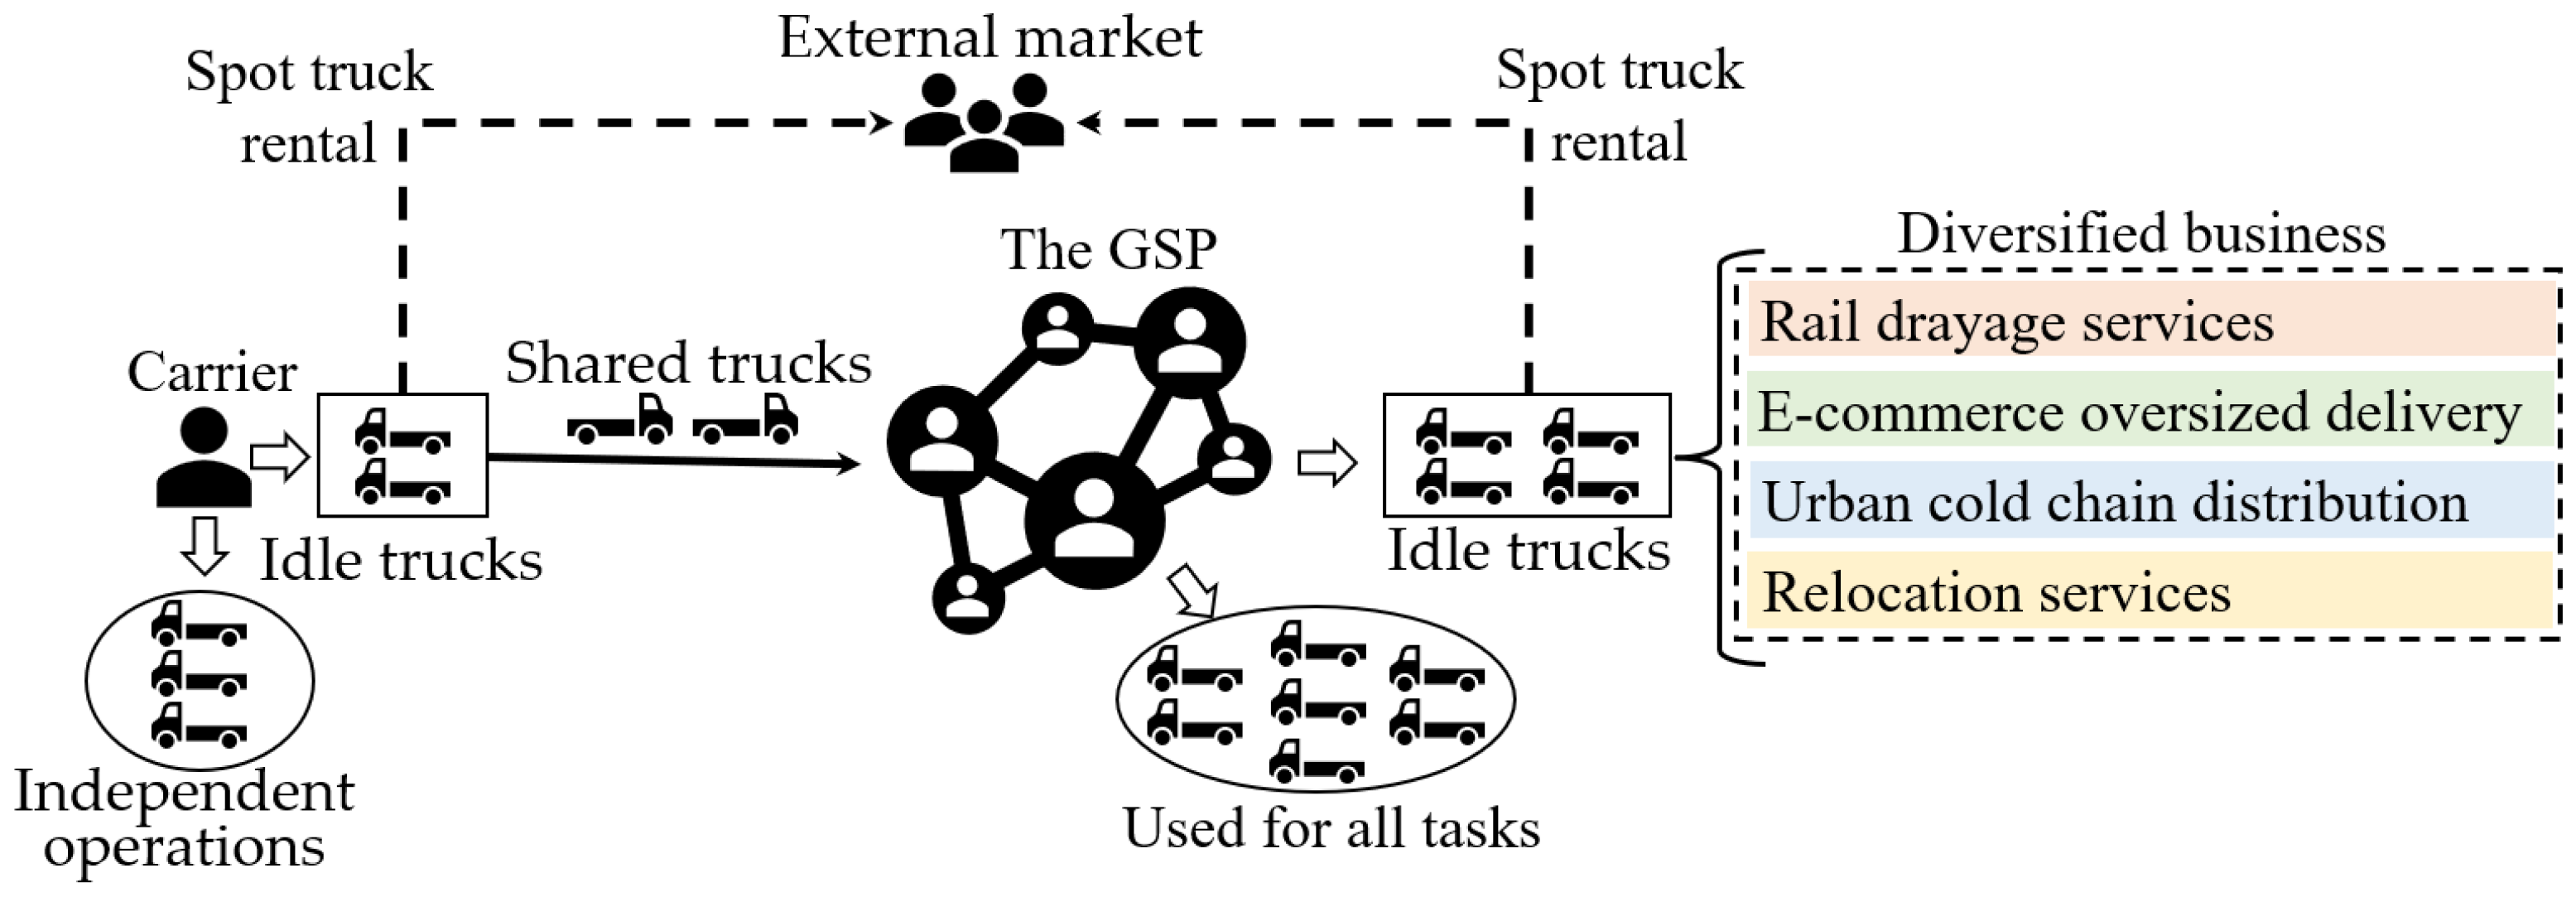
The analytical results hold practical value in two key aspects. First, from the carriers’ perspective, when external market demand is uncertain, conservative carriers will maximize truck sharing with the GSP to earn stable subsidies and reduce idle truck costs. Second, from the GSP’s perspective, truck subsidies must still be paid even when trucks are idle. Therefore, while ensuring sufficient trucks, the GSP must also account for high costs caused by large-scale idle trucks. To address this, the GSP should actively expand into additional diversified businesses, such as rail drayage services, oversized e-commerce deliveries, and urban cold chain distribution, alongside its core container shipping and container truck leasing operations, as shown in Figure 8. By transforming into a diversified company, the GSP can mitigate profit-loss risks arising from volatile container transportation demand and excessive idle trucks.

5.3.3. The Impact of Task Demand Variability on the Profits of Participants

In practice, task demand fluctuates with market conditions, which may cause significant deviations in the balance of daily transportation tasks in the GSP, or conversely, lead to an improved equilibrium. To better reflect real-world conditions, we investigate the impact of task demand variations on profits. The import and export container transportation tasks of Carrier A are adjusted based on the quantity proportion of the original transportation tasks from the GSP and Carrier A (1:3 and1:1). With an increase or decrease in four transportation tasks as the unit, the other parameters remain consistent with those in Section 5.2. The resulting changes in the profits of the GSP and participants are shown in Figure 9.
The profit of Carrier A increases continuously with the number of its transportation tasks when adjusting its ability to attract transportation tasks according to its proportion of original transportation tasks, as shown in Figure 9a. After an initial increase, the profits of the GSP and other participants exhibit a declining trend. As indicated by Equations (2) and (4), the difference between the transportation fees charged to customers by Carrier A and the transportation fees paid to the GSP increases as the number of transportation tasks of Carrier A increases. Similarly, as shown in Equation (3), the transportation fee revenue of the GSP also shows an increasing trend. However, the rate of operating cost growth exceeds that of the transportation fee revenue when the number of transportation tasks increases by more than 8, causing the profit of the GSP to initially rise and then decline. The rapid increase in operating costs is attributed to the widening gap between the number of import container transportation tasks and export container transportation tasks, which reduces the matching rate and leads to a sharp increase in the number of container trucks used. For Carrier B and Carrier C, the profit changes are only influenced by the bonus from the GSP, and thus, their profits show the same trend as that of the profit of the GSP. However, for Carrier A, since the reduction in bonuses accounts for only 7–9% of the increase in transportation fee difference revenue, which is significantly lower than the increase in transportation fee difference revenue, its profit demonstrates a continuous increase trend.
Both the profits of the GSP and Carrier A continue to rise when adjusting the ability of Carrier A to attract transportation tasks according to the proportion of original transportation tasks of the GSP (1:1), as shown in Figure 9b. Unlike in Figure 9a, as the number of transportation tasks of Carrier A increases, the gap in transportation tasks between import and export containers in Figure 9b remains unchanged. This helps maintain a high matching rate and effectively reduces the number of trucks used. As a result, the growth rate of the operating costs of the GSP is lower than that in Figure 9a, leading to a continuous increase in the profit of the GSP. This also causes the proportion ( θ A ) of the bonuses allocated to continuously increase, resulting in a rise in its bonuses and, subsequently, an upward profit trend, growing faster than in Figure 9a. It can be seen that carriers attract more transportation tasks and share them with the GSP to benefit their profits, which incentivizes them to enhance their ability to attract transportation tasks. For the GSP, its role in reducing operating costs and increasing profit levels becomes more pronounced when the number of import and export container transportation tasks is balanced.
The analytical results hold practical value in two key aspects. First, from the GSP’s perspective, to reduce transportation task category imbalances caused by uncertain conditions, the GSP can provide real-time feedback on the equilibrium status of task categories and strengthen supervision over the balance of shared task categories. While encouraging carriers to actively acquire and share transportation tasks, the GSP should guide them to prioritize acquiring and sharing task categories currently lacking in the GSP to improve the overall balance of task categories. Furthermore, as evidenced by comparing Figure 9a,b, adopting a more balanced approach between import and export transportation tasks enables the GSP to generate additional revenue of CNY 205 per added task. GSP managers may use this incremental income as an incentive to encourage carriers to share such balanced tasks, thereby avoiding situations of extreme task imbalance. Second, from the carriers’ perspective, they can align their shared tasks with the GSP’s directional demand (e.g., import or export preferences) to achieve higher profits.

5.3.4. The Sensitivity Analysis on Mixed Fleets

The container truck market currently encompasses multiple powertrain types, including diesel (denoted as F), liquefied natural gas (LNG, denoted as L), and electric (denoted as E) trucks. The participation of carriers sharing such heterogeneous trucks in the GSP presents a GSP with complex operational and managerial challenges related to mixed fleets. To analyze the total cost and carbon emission impact of mixed fleets, this study extends the homogeneous F-type truck scenario in Section 5.2 by introducing low-energy-consumption L-type and E-type trucks, maintaining equal numbers of each truck type while keeping other parameters consistent with those in Section 5.2. The analysis assumes fuel cost ratios of F: L: E = 1.0: 0.5: 0.1 for completing identical transportation tasks, with emission factors of 2.65 kg/L for F-type, 1.965 kg/L for L-type, and 0.583 kg/kWh for E-type trucks. Applying our proposed method, the figure below illustrates how the GSP’s total cost and carbon emissions vary with changing transportation task volumes, demonstrating the economic and environmental implications of operating mixed fleets on the GSP.
Figure 10a reveals that when all trucks in the GSP share identical fuel economy and operating costs (homogeneous fleets), the total cost increases approximately linearly with growing transportation tasks. However, when the GSP incorporates trucks with varying fuel efficiencies (mixed fleets), the GSP’s total cost still rises with increasing tasks but exhibits an accelerating growth pattern. This nonlinear escalation stems from the GSP’s strategic dispatching protocol; during low-demand periods when the truck supply exceeds the requirements, the GSP preferentially deploys the most fuel-efficient E-type trucks. As demand intensifies, the platform progressively activates less efficient L-type and, finally, F-type trucks to meet the service requirements. Consequently, the rate of fuel consumption growth accelerates as these higher-emission vehicles enter operation. Figure 10b demonstrates that carbon emissions follow an identical trend to the cost pattern observed in Figure 10a, confirming the direct correlation between economic and environmental performance metrics.
To investigate the impact of effects of aging diesel trucks (F-type) on carbon emissions, a sensitivity analysis was conducted on the carbon emission rates of these trucks within the mixed fleet. As truck age increases, the fuel consumption rate rises correspondingly, leading to higher carbon emission coefficients. Using the baseline fuel consumption rate of F-type trucks from Figure 10b as reference, we systematically increased the rate by 10%, 20%, …, up to 50%. This resulted in progressively higher carbon emission rates under heavy-load conditions: from 3.18 kg/km and 3.50 kg/km up to 4.77 kg/km. The corresponding changes in total carbon emissions for the GSP are shown in Figure 11.
The above figure demonstrates that carbon emissions increase proportionally with carbon emission rates. At 160 transportation tasks, when the emission rate grows to 1.5 times its original value, total emissions escalate from 48.8 t to 60.2 t, which adversely affects green corporate development. Concurrently, variations in fuel consumption rates induce corresponding changes in transportation costs. Under heavy-load conditions, the unit costs of trucks progressively increase from 10 CNY/km and 11 CNY/km up to 15 CNY/km. The resultant changes in the GSP’s total costs are illustrated in Figure 12.
As shown in Figure 12, the total cost increases with unit costs. When handling 160 transportation tasks, the unit costs grow to 1.5 times their original value, leading to total costs escalating from CNY 5.9 × 10⁴ to CNY 7.5 × 10⁴. This demonstrates that from the perspective of GSP managers, implementing proper maintenance programs for aging trucks is essential to maintain optimal technical conditions. Such measures can prevent an excessive growth in fuel consumption caused by truck aging, thereby simultaneously reducing both carbon emissions and overall costs.
The analytical results hold practical value in two key aspects. First, from the GSP’s perspective, the GSP prioritizes using trucks with better performance, higher energy efficiency, and lower emissions for transportation tasks during operations. This means that such trucks will be utilized more frequently, while less efficient trucks face higher idle probabilities. This creates unfairness for carriers who contribute high-performance trucks and may incentivize carriers to preferentially share older, more fuel-intensive trucks with the GSP. Therefore, the GSP must implement performance verification for all trucks shared by carriers, allowing only qualified trucks to be shared with the GSP. Second, from the carriers’ perspective, to sustainably benefit from the collaboration, carriers should also conduct preliminary screening of their shared trucks before contributing them to the GSP, thereby maintaining productive partnership relations.

5.3.5. The Sensitivity Analysis on Subsidies and Bonuses

To examine the impact of truck subsidies and bonuses on the profits of all participants, we conducted an analysis based on the case study in Section 5.2. For the truck subsidy rates, we established 11 subsidy scenarios with increments of CNY 100, ranging from CNY 0 to 1000 (i.e., β = CNY 0, 100, 200, …, 1000). For the bonus, we created 11 allocation scenarios with increments of 0.1, ranging from 0 to 1.0 (i.e., α = 0, 0.1, 0.2, …, 1.0), while keeping all other parameters consistent with those in Section 5.2. Using the method proposed in this study, we calculated the profit variations for Carriers A, B, and C, as well as the GSP, under these subsidy and bonus scenarios, as shown in Figure 11. Specifically, the results for Carriers A, B, and C are presented in Figure 13a–c, respectively, while the results for the GSP are shown in Figure 13d.
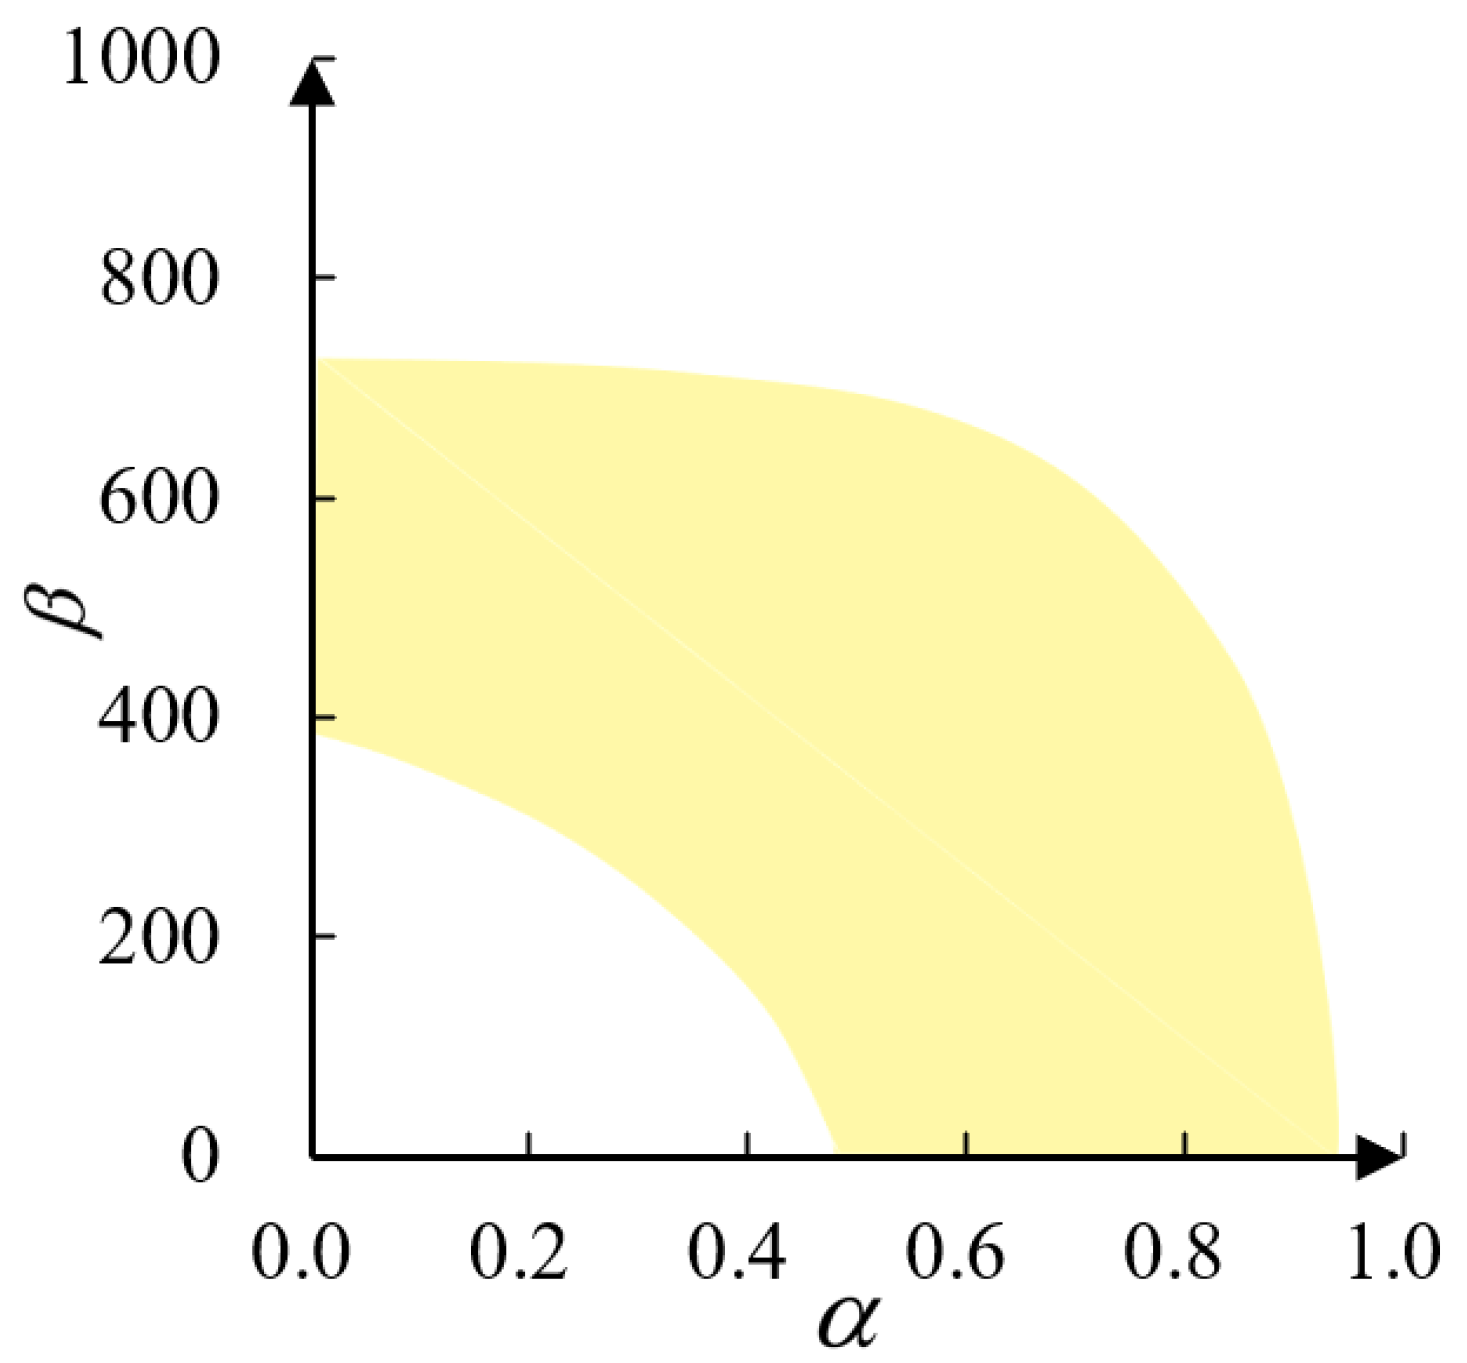
As shown in Figure 13, when the subsidy amount is relatively small (below CNY 700), the profit increments for Carriers A, B, and C gradually decrease as both the subsidy amount and proportion of the bonus decrease, while the profit of the GSP steadily increases. However, when the subsidy amount exceeds CNY 700, the profit increments for Carriers A, B, and C show a paradoxical increase as the proportion of the bonus decreases. In this high-subsidy regime, the GSP incurs losses due to excessive expenditures on truck subsidies, causing the total profit in Equation (4) to yield negative values for the R P C P term, which consequently inverts the normal relationship and leads to higher carrier profit increments with a lower proportion of the bonus. Further, the red lines in Figure 13a–d represent the breakeven boundaries, indicating that sustainable cooperation can only be achieved when both the subsidy amount and proportion of the bonus are set within a range that ensures positive profit increments for all carriers and the GSP simultaneously. This viable operational zone corresponds to the overlapping yellow region shown in Figure 14, where all stakeholders maintain profitability.
The practical value of these analytical results lies primarily in providing boundary conditions for the GSP to establish appropriate subsidy amounts and the proportion of the bonus. Specifically, the proposed method enables the GSP to increase its profits by CNY 14,760, elevating its profit margin from 0.2% to 15.5%. These findings quantitatively define the parametric boundaries for stable, long-term collaboration in the shared transportation ecosystem.

5.4. Study Limitations

This study proposes a systematic optimization framework for green collaborative dispatching, but certain limitations should be noted.
(1)
The model was constructed based on certain assumptions, such as usage frequency limits for trucks, which makes the model more idealized. Additionally, the model assumes that carriers make decisions on GSP participation solely based on profit increases; essentially, the model is constructed under perfect information conditions. This approach has limitations regarding incorporating carriers’ preference factors and protecting confidential information. In subsequent research, we will refine these limitations of the model to make it more realistic and further enhance the practical application value of the study.
(2)
This study utilizes historical statistical data as known information for optimization, which has limitations with regard to incorporating uncertain information. Furthermore, in actual operations, there is uncertainty in task demand, caused by market fluctuations, as well as uncertainty in operation time, arising from real-time variations in traffic conditions and loading/unloading efficiency. These mean that certain parameters are expressed in the form of probability distributions. In future research, we will adopt stochastic or robust optimization frameworks to enable more realistic modeling.
(3)
In terms of trucks, in the cooperation mechanism, it is assumed that carriers share trucks with similar performance and equal subsidy standards are applied. However, in reality, there are significant differences in truck performance among carriers, along with operational constraints such as driver shift schedules and contractual obligations. Regarding carriers, while the cooperation mechanism ensures transparency in profit distribution in order to improve fairness, the impact of differences in carriers’ business scales is neglected in the profit allocation process. Therefore, it is necessary to design a more equitable, differentiated subsidy mechanism for mixed fleets by comparing and integrating game theory and Shapley value methods. This mechanism should ensure that high-performance trucks receive correspondingly higher subsidies, while simultaneously considering the influence of carriers’ business scales on profit distribution, and effective incentive or penalty mechanisms should be established to protect disadvantaged carriers. This will be the focus of our future research.

6. Conclusions

For port collection and dispatching systems, existing research on vehicle routing problems under sharing has predominantly focused on simplistic task-exchange cooperation models. These approaches demonstrate limited systemic integration capabilities for core elements such as container trucks and transportation tasks, while cooperative mechanisms provide insufficient incentives for heterogeneous carriers. Therefore, this study proposed a dual-flexibility sharing and cooperation mechanism for heterogeneous carriers to enhance their participation willingness and collaboration stability in the GSP. Building upon this foundation, we established a green and cooperative task-and-route optimization model for container trucks with heterogeneous carriers based on task sharing, and designed a column generation algorithm embedded with a ring-increasing strategy to obtain an efficient solution for the asymmetric problem between import and export container transportation tasks. This integrated approach effectively harnesses the potential of the sharing economy to enhance port collection and distribution efficiency and accelerate low-carbon transitions in container logistics systems.
The methodology developed in this study extends the application of the sharing economy in port logistics, contributing to the enrichment of vehicle routing problems under sharing. Specifically, the proposed efficient algorithm addresses the increased computational complexity arising from profit allocation in multi-carrier collaboration, representing a novel approach for solving sharing-based vehicle scheduling problems. The case study yielded the following key quantitative findings. First, under identical transportation task volumes, the proposed optimization method reduced carbon emissions by 28–35% when compared with independent carrier operations, while simultaneously increasing profits for all cooperation participants by 23.6–65.3%. Second, adopting a more balanced approach to adjusting import and export transportation task volumes enabled the GSP to generate an additional CNY 205 in revenue per incremental task. The GSP managers can utilize this marginal gain as an incentive to encourage carriers to preferentially share their most suitable tasks, thereby creating a positive feedback loop that enhances overall system profitability. Third, the analysis examined the impacts of subsidy amounts and the proportion of the bonus on the profits of participants. The GSP can achieve a minimum 15% improvement in profit margins while ensuring that all participants benefit by optimizing these two parameters. The proposed method provides critical boundary conditions for designing cooperative mechanisms in the GSP.
In summary, the main contributions and work of this study include the following: the design of a dual-flexibility sharing and cooperation mechanism to enhance the willingness of heterogeneous carriers to collaborate and integrate trucks and transportation tasks; the establishment of a green and cooperative task-and-route optimization model for container trucks with heterogeneous carriers based on task sharing that considers the spatiotemporal matching of distributed transportation tasks and balances the profit levels of all participants; the development of a column generation algorithm embedded with a ring-increasing strategy to enhance computational efficiency by addressing the increased complexity caused by multi-carrier cooperation; through sensitivity analysis of key factors, the proposal of corresponding management insights that provide boundary conditions for GSP managers to maintain stable operations and profits while offering quantitative references for participating carriers regarding the effects of container trucks and task information sharing levels on profits.
Further research could be undertaken in the following directions. Firstly, the issue of information sharing within cooperation mechanisms is a critical consideration in research on the sharing economy, as it involves the protection of carriers’ sensitive data. Therefore, administrators of the GSP must maintain strict neutrality and treat all carriers equally to ensure its stable development. Further, the emergence of the GSP may raise monopoly concerns within governments. Thus, it is essential to establish proper relationships with governmental and regulatory bodies and formulate relevant agreements. Finally, stochastic and robust optimization frameworks demonstrate strong efficacy in handling uncertain information. These areas will constitute the primary focus of our future research.
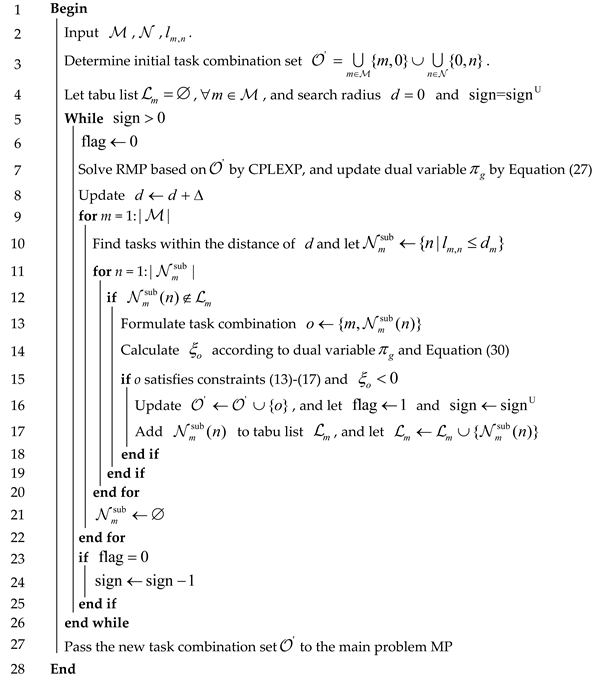
Author Contributions

Conceptualization, R.Z. and L.H.; methodology, R.Z. and L.H.; software, L.H.; validation, R.Z., Y.S. and Z.G.; formal analysis, Z.G.; investigation, L.H.; resources, R.Z.; data curation, Y.S.; writing—original draft preparation, L.H.; writing—review and editing, R.Z.; visualization, Z.G.; supervision, Y.S.; project administration, Y.S.; funding acquisition, R.Z., Y.S., Z.G. All authors have read and agreed to the published version of the manuscript.

Funding

This research was funded by the National Natural Science Foundation of China, grant numbers 72204035, 72404050, 52302387 and 72574035, and the Humanities and Social Science Fund of the Ministry of Education of China, grant number 24YJC630180.

Data Availability Statement

The datasets analyzed during the current study are available from the corresponding author on reasonable request.

Conflicts of Interest

The authors declare no conflict of interest.

Appendix A

Figure A1. The process of column addition in the RCG and CG.
Symmetry 17 01437 g0a1

Appendix B

Table A1. Representative routing solutions from the case study.
NumberRoute
1o~(heavy-load)(164.2 km)~1(in)~(unloaded)(4.9 km)~9(ex)~(heavy-load)(167.7 km)~d
2o~(heavy-load)(168.6 km)~2(in)~(unloaded)(2.8 km)~3(ex)~(heavy-load)(170.4 km)~d
3o~(heavy-load)(174.8 km)~5(in)~(unloaded)(7.8 km)~10(ex)~(heavy-load)(171.5 km)~d
4o~(heavy-load)(110.2 km)~6(in)~(unloaded)(7.4 km)~16(ex)~(heavy-load)(108.9 km)~d
5o~(heavy-load)(92.3 km)~7(in)~(unloaded)(6.3 km)~13(ex)~(heavy-load)(94.7 km)~d
6o~(heavy-load)(92.5 km)~10(in)~(unloaded)(24.6 km)~14(ex)~(heavy-load)(115.5 km)~d
7o~(heavy-load)(162.9 km)~11(in)~(unloaded)(72.8 km)~18(ex)~(heavy-load)(92.6 km)~d
8o~(heavy-load)(165.5 km)~12(in)~(unloaded)(6.1 km)~25(ex)~(heavy-load)(169.5 km)~d
9o~(heavy-load)(165.3 km)~13(in)~(unloaded)(147.2 km)~7(ex)~(heavy-load)(169.5 km)~d
10o~(heavy-load)(172.0 km)~14(in)~(unloaded)(60.4 km)~11(ex)~(heavy-load)(113.9 km)~d
11o~(heavy-load)(179.7 km)~15(in)~(unloaded)(137.9 km)~8(ex)~(heavy-load)(169.7 km)~d
12o~(heavy-load)(168.4 km)~16(in)~(unloaded)(54.2 km)~12(ex)~(heavy-load)(116.9 km)~d
13o~(heavy-load)(174.2 km)~17(in)~(unloaded)(154.4 km)~4(ex)~(heavy-load)(172.9 km)~d
14o~(heavy-load)(168.0 km)~18(in)~(unloaded)(46.3 km)~17(ex)~(heavy-load)(124.2 km)~d
15o~(heavy-load)(183.6 km)~19(in)~(unloaded)(10.5 km)~21(ex)~(heavy-load)(175.2 km)~d
16o~(heavy-load)(195.4 km)~20(in)~(unloaded)(164.4 km)~2(ex)~(heavy-load)(176.4 km)~d
17o~(heavy-load)(151.6 km)~21(in)~(unloaded)(140.2 km)~5(ex)~(heavy-load)(178.4 km)~d
18o~(heavy-load)(200.8 km)~22(in)~(unloaded)(13.3 km)~23(ex)~(heavy-load)(191.4 km)~d
19o~(heavy-load)(181.6 km)~23(in)~(unloaded)(64.0 km)~15(ex)~(heavy-load)(120.4 km)~d
20o~(heavy-load)(188.6 km)~24(in)~(unloaded)(70.1 km)~19(ex)~(heavy-load)(119.8 km)~d
21o~(heavy-load)(193.3 km)~25(in)~(unloaded)(8.9 km)~22(ex)~(heavy-load)(192.0 km)~d
22o~(heavy-load)(164.7 km)~3(in)~(unloaded)(164.7 km)~d
23o~(heavy-load)(176.5 km)~4(in)~(unloaded)(176.5 km)~d
24o~(heavy-load)(82.6 km)~8(in)~(unloaded)(82.6 km)~d
25o~(heavy-load)(96.5 km)~9(in)~(unloaded)(96.5 km)~d
26o~(heavy-load)(165.5 km)~1(ex)~(unloaded)(165.5 km)~d
27o~(heavy-load)(170.8 km)~6(ex)~(unloaded)(170.8 km)~d
28o~(heavy-load)(88.6 km)~20(ex)~(unloaded)(88.6 km)~d
29o~(heavy-load)(181.2 km)~24(ex)~(unloaded)(181.2 km)~d

References

  1. Belk, R. Sharing. J. Consum. Res. 2010, 36, 715–734. [Google Scholar] [CrossRef]
  2. Ma, Z.; Urbanek, M.; Pardo, M.A.; Chow, J.Y.; Lai, X. Spatial welfare effects of shared taxi operating policies for first mile airport access. Int. J. Transp. Sci. Technol. 2017, 6, 301–315. [Google Scholar] [CrossRef]
  3. Cheng, Y.H.; Lin, Y.C. Expanding the effect of metro station service coverage by incorporating a public bicycle sharing system. Int. J. Sustain. Transp. 2018, 12, 241–252. [Google Scholar] [CrossRef]
  4. Islam, S.; Uddin, M.J.; Shi, Y.; Sharif, T.; Ahmed, J.U.; Shi, P. Exploring shippers’ motivations to adopt collaborative truck-sharing initiatives. Int. J. Phys. Distrib. Logist. Manag. 2021, 51, 528–550. [Google Scholar] [CrossRef]
  5. Song, J.; Xu, C. Optimization for container truck routing in container terminal with multi quay cranes considering emissions policy. Sci. Rep. 2024, 14, 24000. [Google Scholar] [CrossRef] [PubMed]
  6. Nossack, J.; Pesch, E. A truck scheduling problem arising in intermodal container transportation. Eur. J. Oper. Res. 2013, 230, 666–680. [Google Scholar] [CrossRef]
  7. Guajardo, M.; Rönnqvist, M. A review on cost allocation methods in collaborative transportation. Int. Trans. Oper. Res. 2016, 23, 371–392. [Google Scholar] [CrossRef]
  8. Islam, S.; Shi, Y.; Ahmed, J.U.; Uddin, M.J. Minimization of empty container truck trips: Insights into truck-sharing constraints. Int. J. Logist. Manag. 2019, 30, 641–662. [Google Scholar] [CrossRef]
  9. Irannezhad, E.; Prato, C.G.; Hickman, M. An intelligent decision support system prototype for hinterland port logistics. Decis. Support Syst. 2020, 130, 113227. [Google Scholar] [CrossRef]
  10. Sterzik, S.; Kopfer, H.; Yun, W.Y. Reducing hinterland transportation costs through container sharing. Flex. Serv. Manuf. J. 2015, 27, 382–402. [Google Scholar] [CrossRef]
  11. Caballini, C.; Sacone, S.; Saeednia, M. Cooperation among truck carriers in seaport containerized transportation. Transp. Res. Part E Logist. Transp. Rev. 2016, 93, 38–56. [Google Scholar] [CrossRef]
  12. Gansterer, M.; Hartl, R.F. Shared resources in collaborative vehicle routing. Top 2020, 28, 1–20. [Google Scholar] [CrossRef]
  13. Liu, Y.; Yu, Y.; Baldacci, R.; Tang, J.; Sun, W. Optimizing carbon emissions in green logistics for time-dependent routing. Transp. Res. Part B Methodol. 2025, 192, 103155. [Google Scholar] [CrossRef]
  14. Vidović, M.; Radivojević, G.; Raković, B. Vehicle routing in containers pickup up and delivery processes. Procedia Soc. Behav. Sci. 2011, 20, 335–343. [Google Scholar] [CrossRef]
  15. Zhang, H.; Zhang, R.; Huang, M.; Shi, H. Modeling and analyses of container drayage transportation problem with the objective of low carbons. In Proceedings of the 27th Chinese Control and Decision Conference, Qingdao, China, 23–25 May 2015; pp. 4654–4658. [Google Scholar]
  16. He, W.; Jin, Z.; Huang, Y.; Xu, S. The inland container transportation problem with separation mode considering carbon dioxide emissions. Sustainability 2021, 13, 1573. [Google Scholar] [CrossRef]
  17. Ding, Y.; Chen, K.; Tang, M.; Yuan, X.; Heilig, L.; Song, J.; Fang, H.; Tian, Y. An efficient and eco-friendly operation mode for container transshipments through optimizing the inter-terminal truck routing problem. J. Clean. Prod. 2023, 430, 139644. [Google Scholar] [CrossRef]
  18. Park, H.; Son, D.; Koo, B.; Jeong, B. Waiting strategy for the vehicle routing problem with simultaneous pickup and delivery using genetic algorithm. Expert Syst. Appl. 2021, 165, 113959. [Google Scholar] [CrossRef]
  19. Wang, Y.; Assogba, K.; Liu, Y.; Ma, X.; Xu, M.; Wang, Y. Two-echelon location-routing optimization with time windows based on customer clustering. Expert Syst. Appl. 2018, 104, 244–260. [Google Scholar] [CrossRef]
  20. Li, J.; Pardalos, P.M.; Sun, H.; Pei, J.; Zhang, Y. Iterated local search embedded adaptive neighborhood selection approach for the multi-depot vehicle routing problem with simultaneous deliveries and pickups. Expert Syst. Appl. 2015, 42, 3551–3561. [Google Scholar] [CrossRef]
  21. Desaulniers, G.; Desrosiers, J.; Solomon, M.M. (Eds.) Column Generation; Springer: New York, NY, USA, 2005; pp. 1–376. [Google Scholar]
  22. Wang, Z.; Sheu, J.B. Vehicle routing problem with drones. Transp. Res. Part B Methodol. 2019, 122, 350–364. [Google Scholar] [CrossRef]
  23. Li, J.; Qin, H.; Baldacci, R.; Zhu, W. Branch-and-price-and-cut for the synchronized vehicle routing problem with split delivery, proportional service time and multiple time windows. Transp. Res. Part E Logist. Transp. Rev. 2020, 140, 101955. [Google Scholar] [CrossRef]
  24. Mrabti, N.; Hamani, N.; Delahoche, L. The pooling of sustainable freight transport. J. Oper. Res. Soc. 2021, 72, 2180–2195. [Google Scholar] [CrossRef]
  25. Wang, Y.; Peng, S.; Guan, X.; Fan, J.; Wang, Z.; Liu, Y.; Wang, H. Collaborative logistics pickup and delivery problem with eco-packages based on time-space network. Expert Syst. Appl. 2021, 170, 114561. [Google Scholar] [CrossRef]
  26. Fernández, E.; Roca-Riu, M.; Speranza, M.G. The shared customer collaboration vehicle routing problem. Eur. J. Oper. Res. 2018, 265, 1078–1093. [Google Scholar] [CrossRef]
  27. Matusiewicz, M.; Książkiewicz, D. Shared logistics-Literature review. Appl. Sci. 2023, 13, 2036. [Google Scholar] [CrossRef]
  28. Stoop, K.; Pickavet, M.; Colle, D.; Audenaert, P. Large scale simulation of a real-time collaborative system for container trucks in the Port of Antwerp. Int. J. Shipp. Transp. Logist. 2023, 17, 303–334. [Google Scholar] [CrossRef]
  29. Wu, Q.; Ren, H.; Gao, W.; Ren, J.; Lao, C. Profit allocation analysis among the distributed energy network participants based on Game-theory. Energy 2017, 118, 783–794. [Google Scholar] [CrossRef]
  30. Uddin, M.; Huynh, N. Model for collaboration among carriers to reduce empty container truck trips. Information 2020, 11, 377. [Google Scholar] [CrossRef]
  31. Ahari, S.A.; Bakir, I.; Roodbergen, K.J. A new perspective on carrier collaboration: Collaborative vehicle utilization. Transp. Res. Part C Emerg. Technol. 2024, 163, 104647. [Google Scholar] [CrossRef]
  32. Drewry. Container Market Annual Review and Forecast; Drewry Shipping Consultants Ltd.: London, UK, 2024. [Google Scholar]
  33. Song, Y.J.; Zhang, Y.T. Modeling and optimization of the inland container transportation problem considering multi-size containers, fuel consumption, and carbon emissions. Processes 2024, 12, 2231. [Google Scholar] [CrossRef]
  34. Irannezhad, E.; Prato, C.G.; Hickman, M. The effect of cooperation among shipping lines on transport costs and pollutant emissions. Transp. Res. Part D Transp. Environ. 2018, 65, 312–323. [Google Scholar] [CrossRef]
  35. Becker, H.; Balac, M.; Ciari, F.; Axhausen, K.W. Assessing the welfare impacts of Shared Mobility and Mobility as a Service (MaaS). Transp. Res. Part A Policy Pract. 2020, 131, 228–243. [Google Scholar] [CrossRef]
  36. Do, N.A.D.; Nielsen, I.E.; Chen, G.; Nielsen, P. A simulation-based genetic algorithm approach for reducing emissions from import container pick-up operation at container terminal. Ann. Oper. Res. 2016, 242, 285–301. [Google Scholar] [CrossRef]
  37. Agarwal, A.; Mthembu, L. FE design analysis and optimization of heavy-duty truck chassis using sparse grid initialization technique. Mater. Today Proc. 2022, 60, 2084–2092. [Google Scholar] [CrossRef]
  38. Carbajal, J.A.; Erera, A.; Savelsbergh, M. Balancing fleet size and repositioning costs in LTL trucking. Ann. Oper. Res. 2013, 203, 235–254. [Google Scholar] [CrossRef]
  39. Peng, W.X.; Xue, Z.J. Route planning and benefit assessment of container drayage platooning considering truck laden-or-empty state. Comput. Ind. Eng. 2023, 175, 108879. [Google Scholar] [CrossRef]
  40. Zhang, J.; Zhao, Y.; Xue, W.; Li, J. Vehicle routing problem with fuel consumption and carbon emission. Int. J. Prod. Econ. 2015, 170, 234–242. [Google Scholar] [CrossRef]
  41. Wang, T.; Gao, G.; Zhen, L.; Cheng, P.; Jiang, M. Column generation approach for the problem of integrated operations in a container terminal under carbon emission tax. Transp. Res. Part E Logist. Transp. Rev. 2025, 201, 104270. [Google Scholar] [CrossRef]
  42. Lai, M.; Crainic, T.G.; Di Francesco, M.; Zuddas, P. An heuristic search for the routing of heterogeneous trucks with single and double container loads. Transp. Res. Part E Logist. Transp. Rev. 2013, 56, 108–118. [Google Scholar] [CrossRef]
  43. Gao, Y.; Sun, Z. Tramp ship routing and speed optimization with tidal berth time windows. Transp. Res. Part E Logist. Transp. Rev. 2023, 178, 103268. [Google Scholar] [CrossRef]
  44. Kuo, Y.; Wang, C.C. A variable neighbourhood search for the multi-depot vehicle routing problem with loading cost. Expert Syst. Appl. 2012, 39, 6949–6954. [Google Scholar] [CrossRef]
  45. Shapley, L.S. A Value for n-Person Games. In Contributions to the Theory of Games, Volume II; Kuhn, H.W., Tucker, A.W., Eds.; Princeton University Press: Princeton, NJ, USA, 1953; pp. 307–317. [Google Scholar]
Figure 1. Dual-flexibility sharing and cooperation mechanism.
Symmetry 17 01437 g001
Figure 2. The procedure of the RCG.
Symmetry 17 01437 g002
Figure 3. Schematic diagram of the ring-increasing strategy.
Symmetry 17 01437 g003
Figure 4. The impact of the sharing and cooperation mechanism on carbon emission reduction.
Symmetry 17 01437 g004
Figure 5. The profit of each participant in different operating modes.
Symmetry 17 01437 g005
Figure 6. The impact of the number of trucks shared by Carrier A on profits.
Symmetry 17 01437 g006
Figure 7. The impact of the external market demand on profits.
Symmetry 17 01437 g007
Figure 8. Diversified business expansion for demand volatility mitigation.
Symmetry 17 01437 g008
Figure 9. The impact of the task demand variability on profits.
Symmetry 17 01437 g009
Figure 10. The impact of mixed fleets on total cost and carbon emissions.
Symmetry 17 01437 g010
Figure 11. Sensitivity analysis for carbon emission rate.
Symmetry 17 01437 g011
Figure 12. Sensitivity analysis for unit cost.
Symmetry 17 01437 g012
Figure 13. The impact of subsidies and bonuses on profits.
Symmetry 17 01437 g013
Figure 14. Necessary conditions for the sustainable development of the GSP.
Symmetry 17 01437 g014
Table 1. Notations and their descriptions.
TypeNotationDescription
Decision variables x m , n 0–1 variable, representing a matching between the transportation task m of import containers and the transportation task n of export containers. If they form a task combination, x m , n = 1 . Otherwise, x m , n = 0 .
x m i 0–1 variable that equals 1 if the transportation task m of import container is carried out independently and 0 otherwise.
x n e 0–1 variable that equals 1 if the transportation task n of export container is carried out independently and 0 otherwise.
r m , n , k 0–1 variable that equals 1 if container truck k travels from location m to location n and 0 otherwise.
Sets Set of transportation tasks m of the import container; it also represents the set of locations m where the transportation tasks m are finished. is the element number in the set.
𝒩 Set of transportation tasks n of the export container; it also represents the set of locations n where the transportation tasks n start. 𝒩 is the element number in the set.
c Set of import container transportation tasks of carrier c; c is the number of elements in the set.
𝒩 c Set of export container transportation tasks of carrier c; 𝒩 c is the number of elements in the set.
𝒦 Set of available container trucks k in the GSP.
𝒞 Set of carriers participating in the GSP.
o, dContainer truck parking areas near the port, with o and d representing the starting point and endpoint on a route, respectively.
Parameters C P c ,   R P c ,   ψ P c Cost, revenue, and profit of carrier c under independent operations.
C P ,   R P , ψ P Cost, revenue, and profit of the GSP.
GFixed cost of the GSP.
R H c ,   C H c Revenue and cost of carrier c after participating in the GSP.
θ c Proportion of the bonus allocated to carrier c by the GSP.
α Proportion of the bonus distributed to carriers relative to the total profit for the GSP.
φ Market rental of one container truck.
β Subsidy of one container truck provided by the GSP.
f c ,   f s Transportation fee per unit distance charged to the carrier by the GSP and charged to the customer by the carrier.
u F ,   u E Transportation cost per unit distance of container trucks under heavy-load and unloaded conditions.
l m i ,   l n e Travel distance of the container truck from the location m and the location n to port.
F ,   E Fuel consumption per unit distance of container trucks under heavy-load and unloaded conditions.
l m , n Travel distance of the container truck from the location m to the location n.
t m i ,   t n e Latest allowable time for the location m and location n to accept a visit from container trucks.
t m Container loading and unloading time, along with other times, for the container truck at the location m.
vTravel speed of container trucks.
Q c The number of container trucks that carrier c shares with the GSP.
TThe total number of container trucks that the GSP can dispatch.
λ The carbon emission factor.
Table 2. Equations and their descriptions.
EquationDescription
Equation (7)The objective function for minimizing the total carbon emissions under the unified scheduling of the GSP.
Equation (8)The GSP must still obtain a profit after allocating the bonus.
Equation (9)The profits of carriers after participating in the GSP should not be lower than their profits under independent operations.
Equation (10)All transportation tasks should be completed by the GSP.
Equation (11)Each import container transportation task can only be carried out by one container truck.
Equation (12)Each export container transportation task can also only be carried out by one container truck.
Equation (13)The number of container trucks used by the GSP must not exceed the total number of trucks available.
Equation (14)The relationship between the route of a container truck and the task combination.
Equation (15)Any import container transportation task must be carried out on one route
Equation (16)Any export container transportation task must be carried out on one route
Equation (17)The route must originate from location o before visiting import container locations.
Equation (18)The routes must terminate at location d after visiting export container locations.
Equation (19)The constraint on routes imposed by the latest allowable time for the transportation task location to accept a visit from a container truck. When an import container transportation task and an export container transportation task meet the time requirement of t n e t m t m i l m , n / v 0 ,   k 𝒦 r m , n , k can be 1 or 0, which means that the transportation tasks m and n can be carried out by the same container truck. When t n e t m t m   i l m , n / v < 0 , the container truck cannot arrive at the location n before the latest allowable time after completing transportation task m, and k 𝒦 r m , n , k can only be 0. In other words, the transportation tasks m and n cannot be carried out by the same container truck.
Equation (20)Binary constraints of the decision variables. When the transportation tasks m and n carried out by the same container truck, x m , n = 1 ; otherwise, x m , n = 0 ; when the transportation task m or n is carried out individually, x m i , x n e can only be 1; otherwise, x m i , x n e can only be 0.
Equation (21)Binary constraints of the decision variables. When the transportation tasks m and n carried out by the same container truck k, r m , n , k = 1 ; otherwise, r m , n , k = 0 .
Table 3. Notation used in the algorithm and their descriptions.
NotationDescription
sign The number of consecutive iterations without objective value improvement.
sign U The maximum allowable number of consecutive iterations without objective value improvement.
MPMaster problem.
RMPRestricted master problem.
SPSubproblems.
E P M The master problem’s objective function minimizes total carbon emissions.
E P R The restricted master problem‘s objective function minimizes total carbon emissions.
𝒪 The set of feasible task combinations o.
𝒪 A subset of the feasible task combination set 𝒪 .
ϑ o Binary variable indicating whether task g combination o is selected; if so, ϑ o = 1 ; otherwise, ϑ o = 0 .
ς o The carbon emissions of task combination o.
ε o , g Binary variable indicating whether task combination o is selected; if so, ε o , g = 1 ; otherwise, ε o , g = 0 .
ξ o The reduced carbon emissions of task combination o.
π g Dual variables.
m The tabu list set of transportation task m.
d The radius range of transportation task m.
𝒩 m sub The set of transportation tasks n located within d of transportation task m.
Table 4. Comparison of the results.
Number of Transportation TasksNumber of Container TrucksNumber of Variables/ConstraintsTime (s) E P (t)Gap (%)
RCGCGVNSRCGCGVNSTime E P
5040675/13901.827.381.9629.4029.4030.1475.34%0.00%
100702600/52652.4819.4830.2657.4957.4961.2087.29%0.00%
1501005775/11,6403.7149.54195.0084.8084.8090.4692.52%0.00%
20013010,200/20,5156.06105.41353.57113.57113.57122.2394.25%0.00%
25016015,875/31,89010.65190.30756.00139.11139.11150.4394.40%0.00%
30019022,800/45,76517.72274.781088.18163.52163.52179.6993.55%0.00%
35022030,975/62,14036.23464.871254.97180.29180.29199.0792.21%0.00%
40025040,400/81,01575.94984.831779.17205.20205.20230.1692.29%0.00%
45028051,075/102,390114.981631.012241.66226.15226.15253.1992.95%0.00%
50031063,000/126,265168.681877.203005.92251.27251.27284.1491.01%0.00%
Table 5. Case information.
Participant| c || 𝒩 c | Q c
Carrier A15516
Carrier B51012
Carrier C51012
Table 6. The related parameters.
ParameterValueParameterValue
β 300CNY φ 1000CNY
F 1.2L per km E 0.8L per km
u F 10CNY per km u E 8.5CNY per km
f c 17CNY per km f s 18.5CNY per km
v45km per hG15,000CNY
α 0.6 λ 2.65kg per L
Table 7. Detailed revenues and costs.
ModelTypesSecondary TypeParticipants (Thousand CNY)
Carrier ACarrier BCarrier CThe GSP
M1RevenuesTransportation fees65.929.047.4130.7
Usage subsidy of trucks4.83.63.6
Bonus5.02.23.6
Rental of trucks11.0
CostsTransportation fees60.526.743.5
Operating costs96.7
Profits 15.28.111.17.2
M2RevenuesTransportation fees65.929.047.4
CostsOperating costs53.624.138.8
Profits 12.34.98.6
Table 8. Usage of container trucks.
TypesM2M1
Carrier ACarrier BCarrier CThe GSP
Number of used trucks16121229
Number of rental trucks00011
η40%40%40%84%
Disclaimer/Publisher’s Note: The statements, opinions and data contained in all publications are solely those of the individual author(s) and contributor(s) and not of MDPI and/or the editor(s). MDPI and/or the editor(s) disclaim responsibility for any injury to people or property resulting from any ideas, methods, instructions or products referred to in the content.