Uniformity Testing and Estimation of Generalized Exponential Uncertainty in Human Health Analytics
Abstract
1. Introduction
Work Motivation
2. Generalized Exponential Entropy and Its Complementary Dual
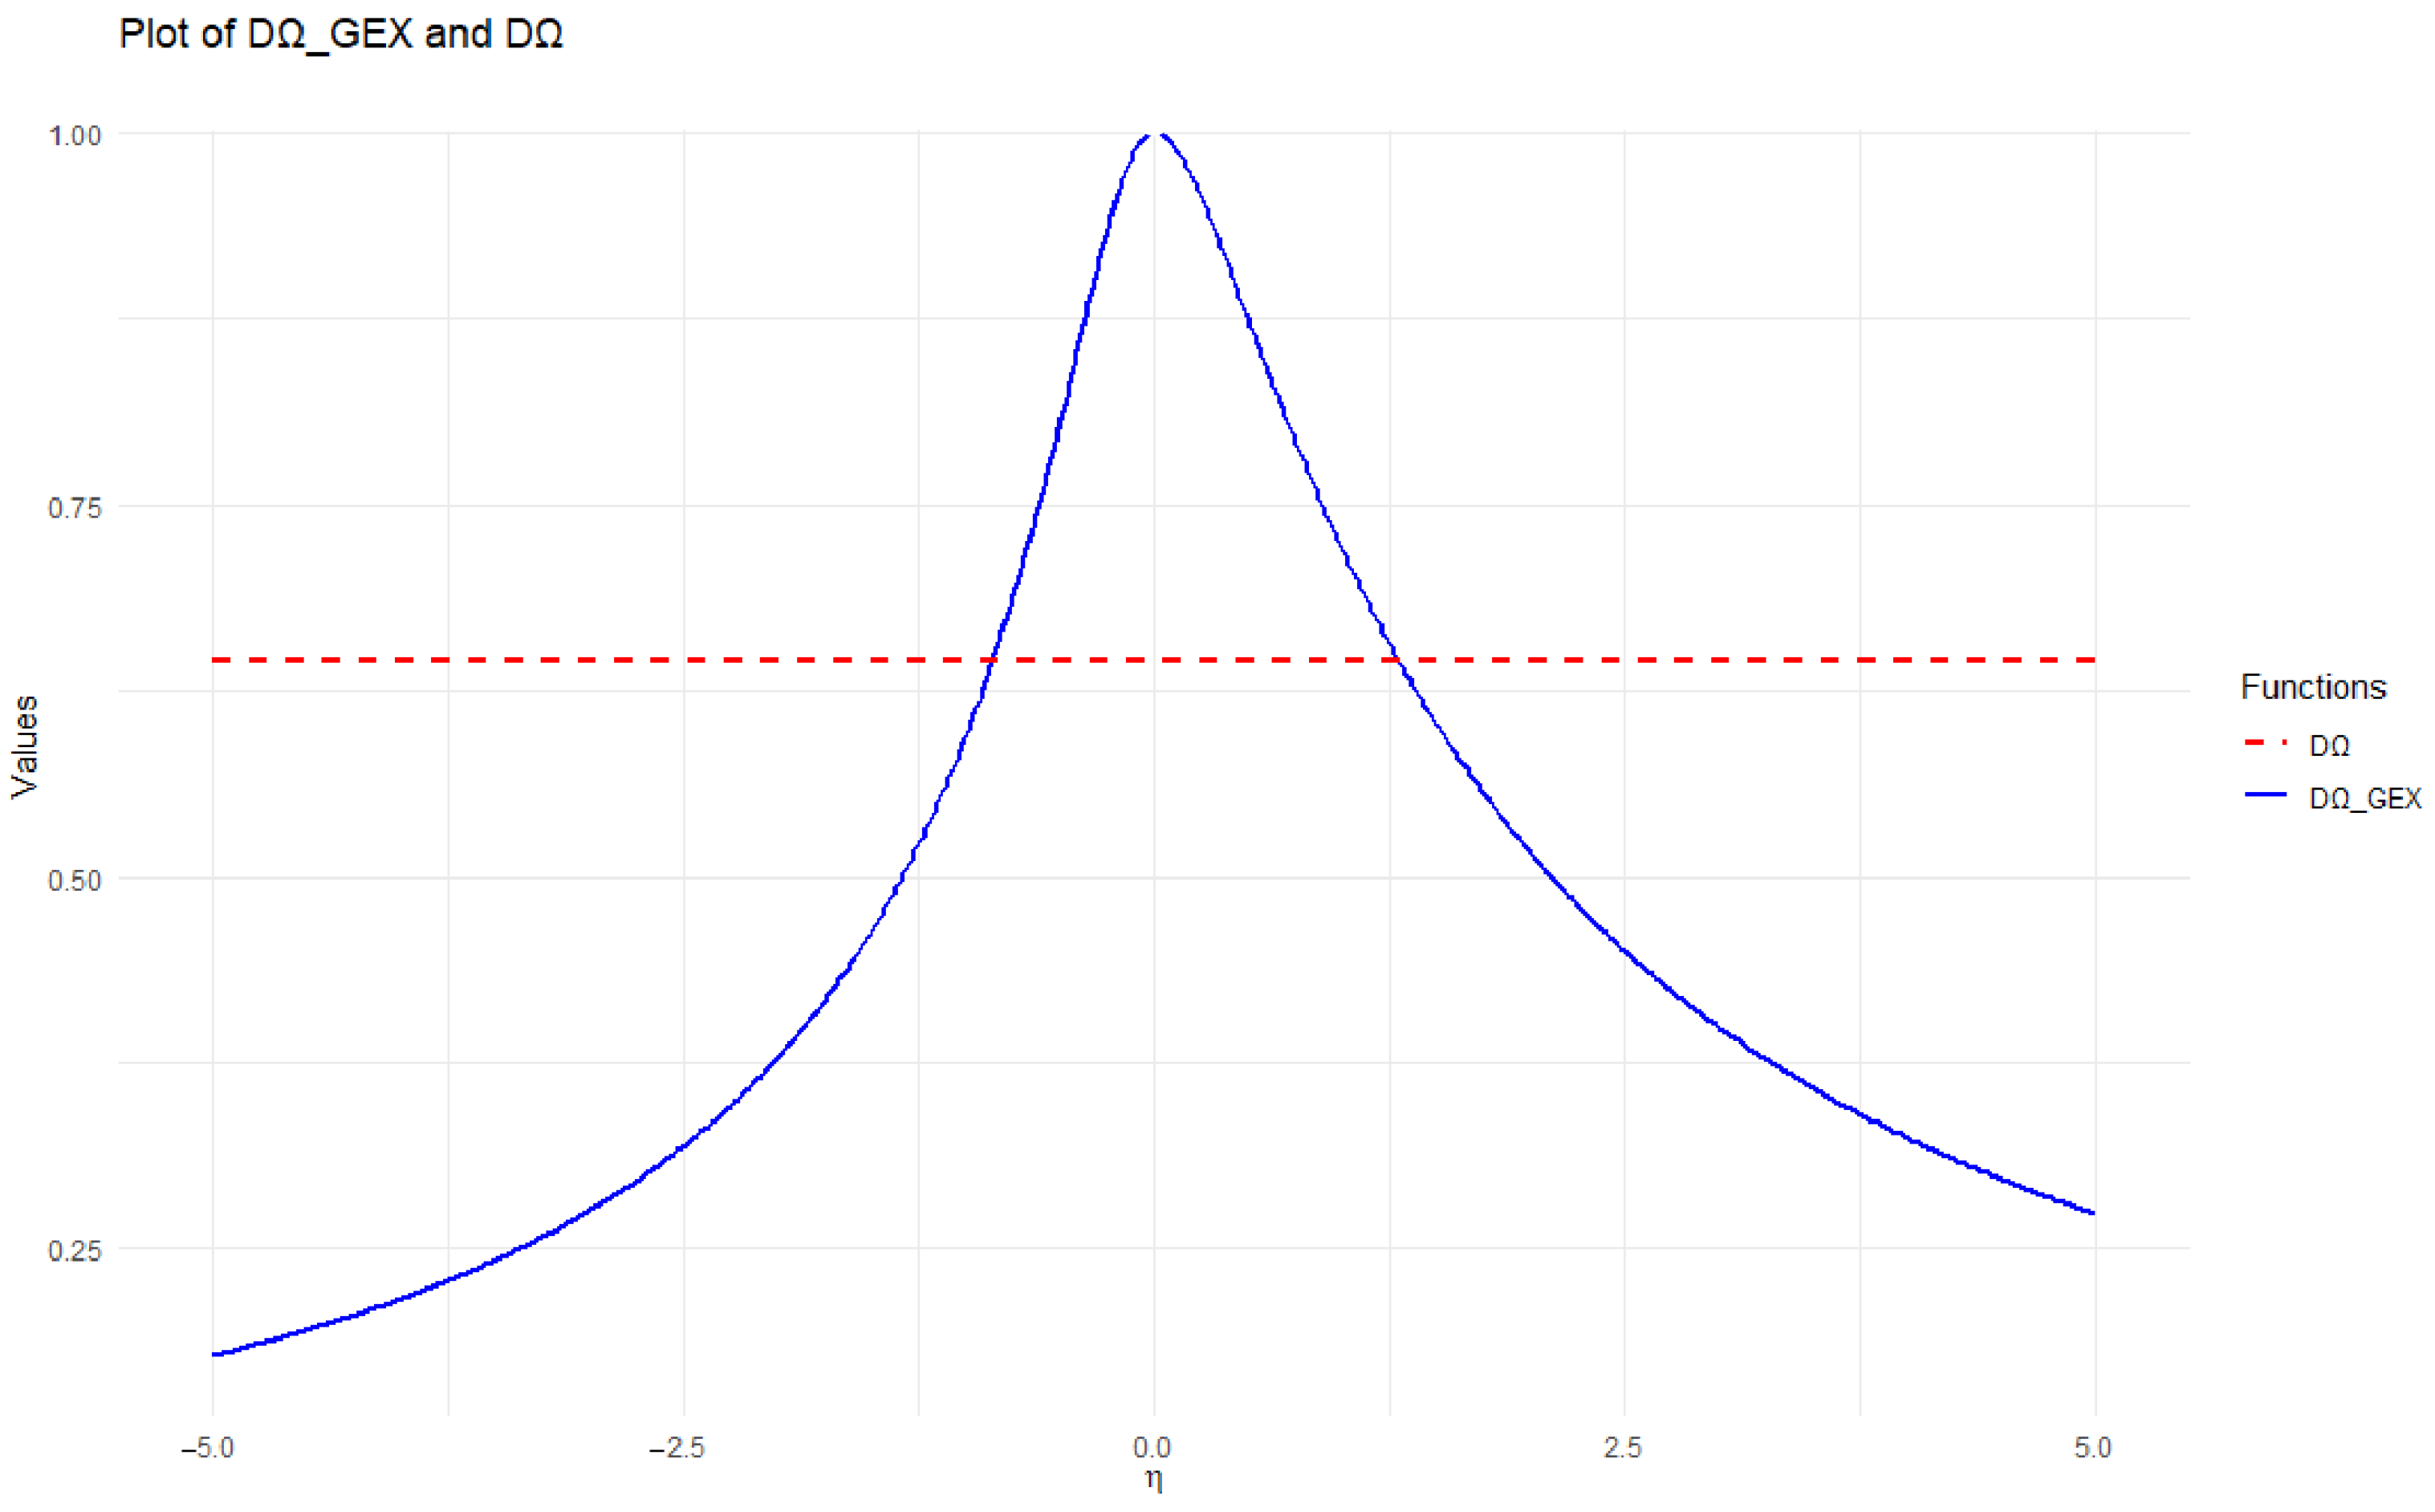
Complementary Dual of Generalized Exponential Entropy
3. Proposed Estimation Procedures
3.1. First Technique
3.2. Second Technique
3.3. Third Technique
3.4. Fourth Technique
4. Numerical Calculation
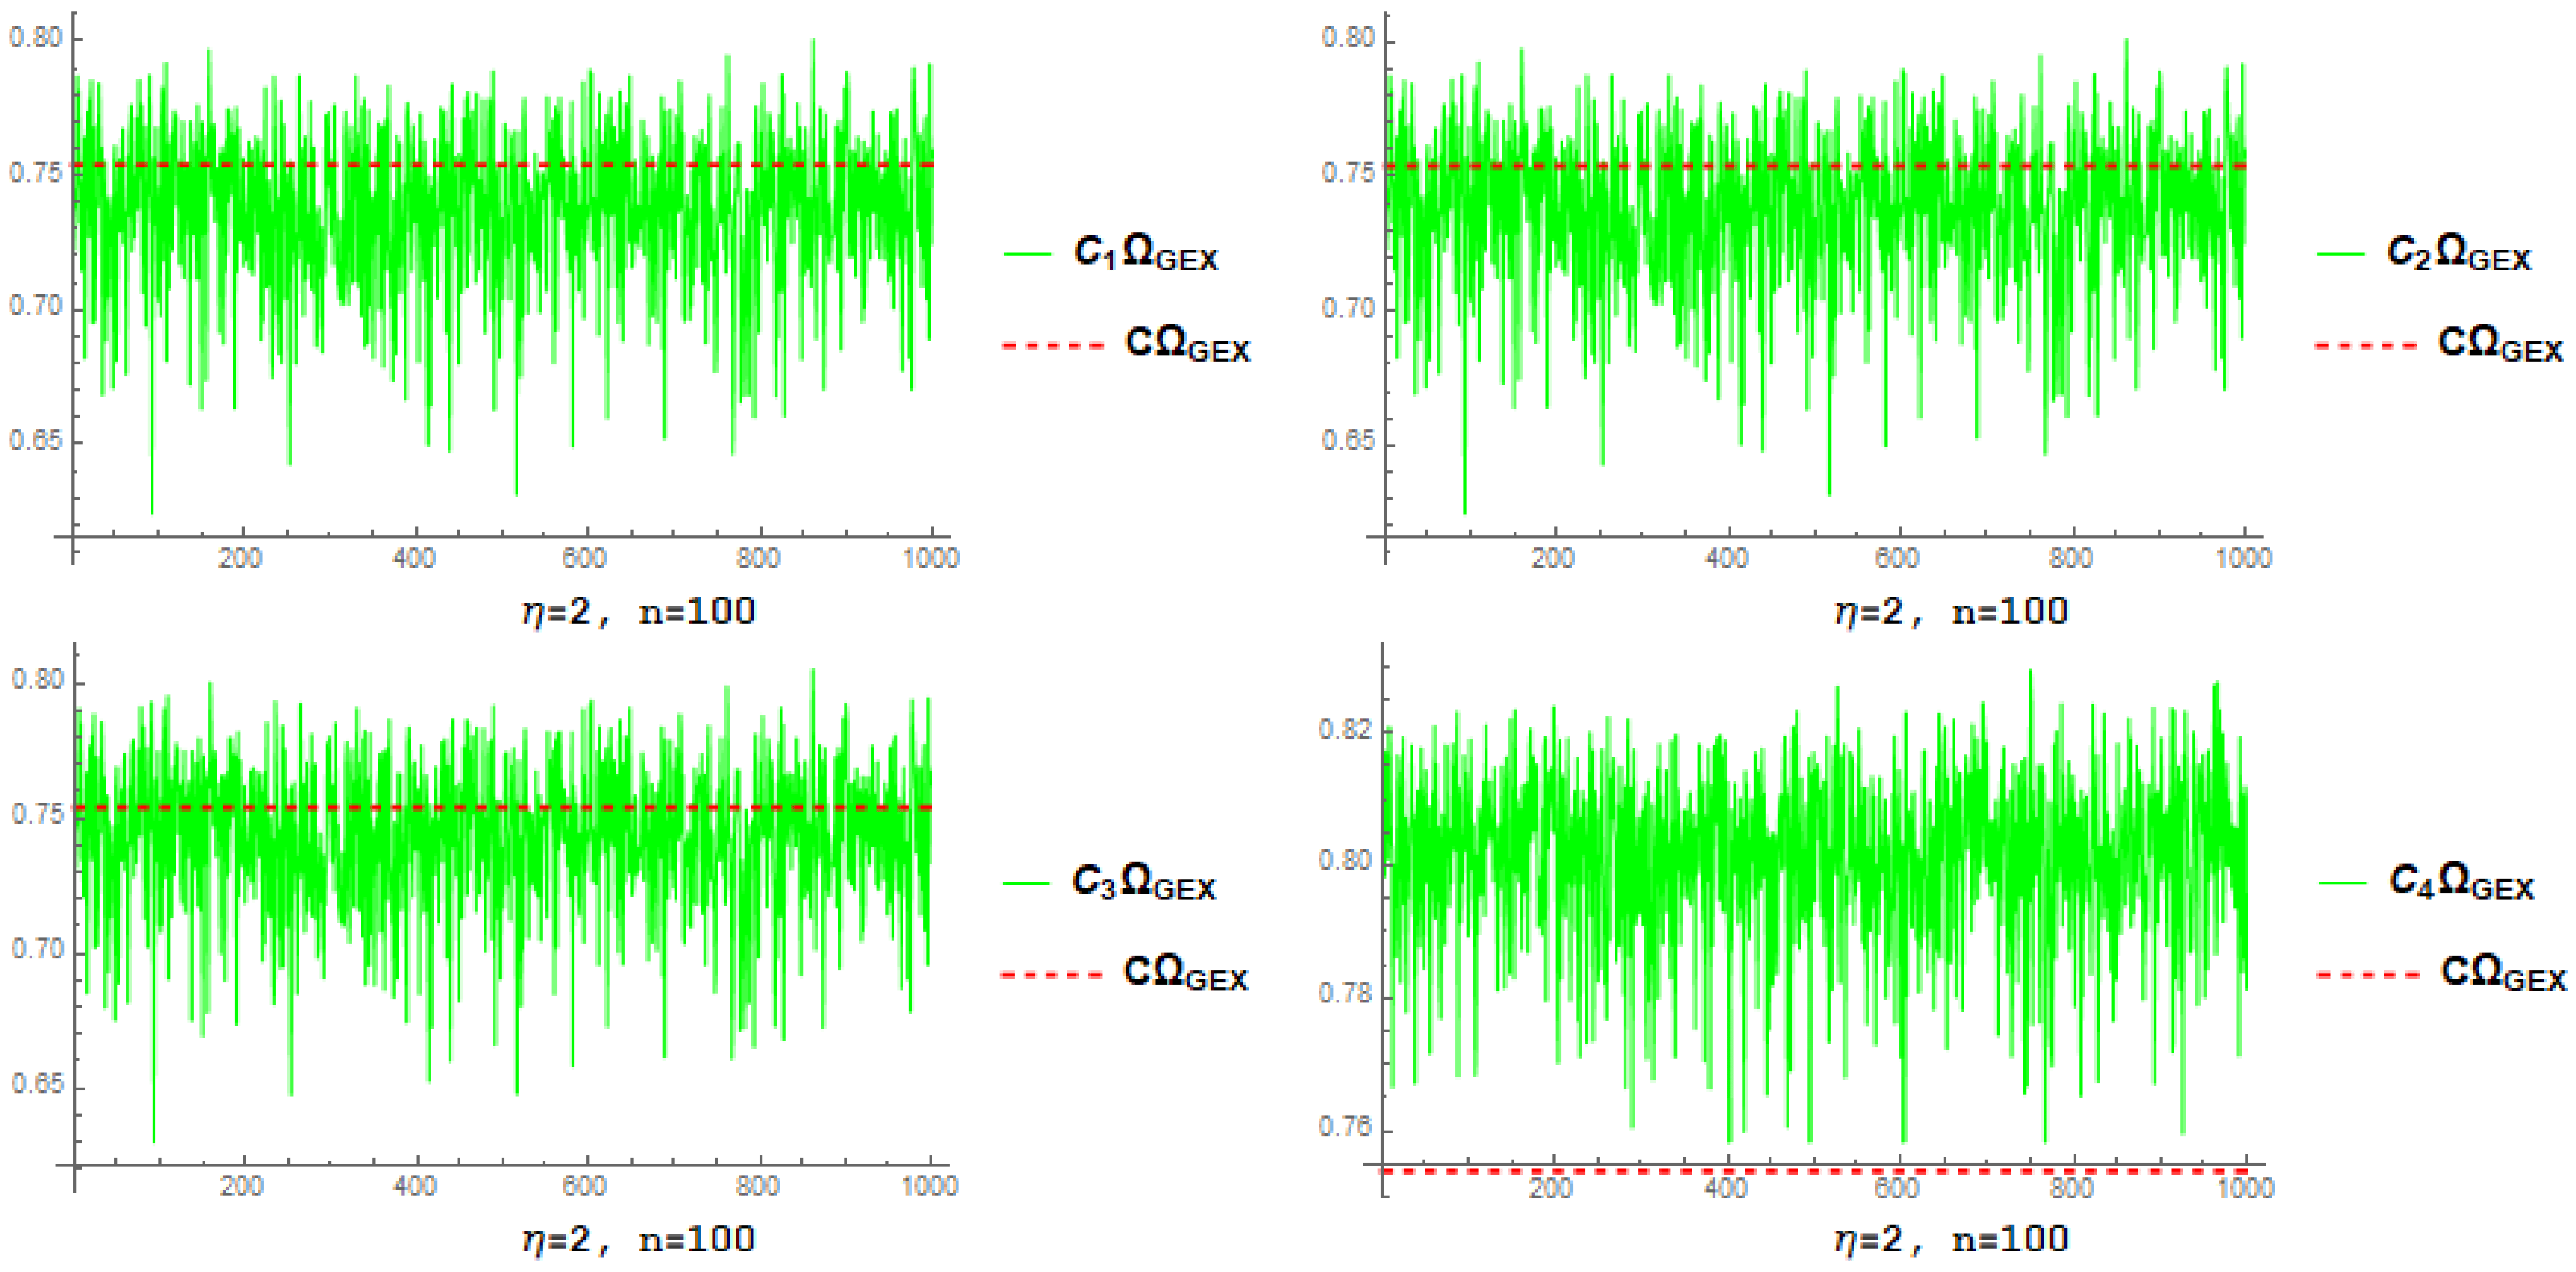
4.1. Simulation-Based Estimator Investigation
- By increasing n and fixed , the root mean square error and associated standard deviation decrease for each estimator.
- By increasing and fixed n, the root mean square error and associated standard deviation decrease for each estimator.
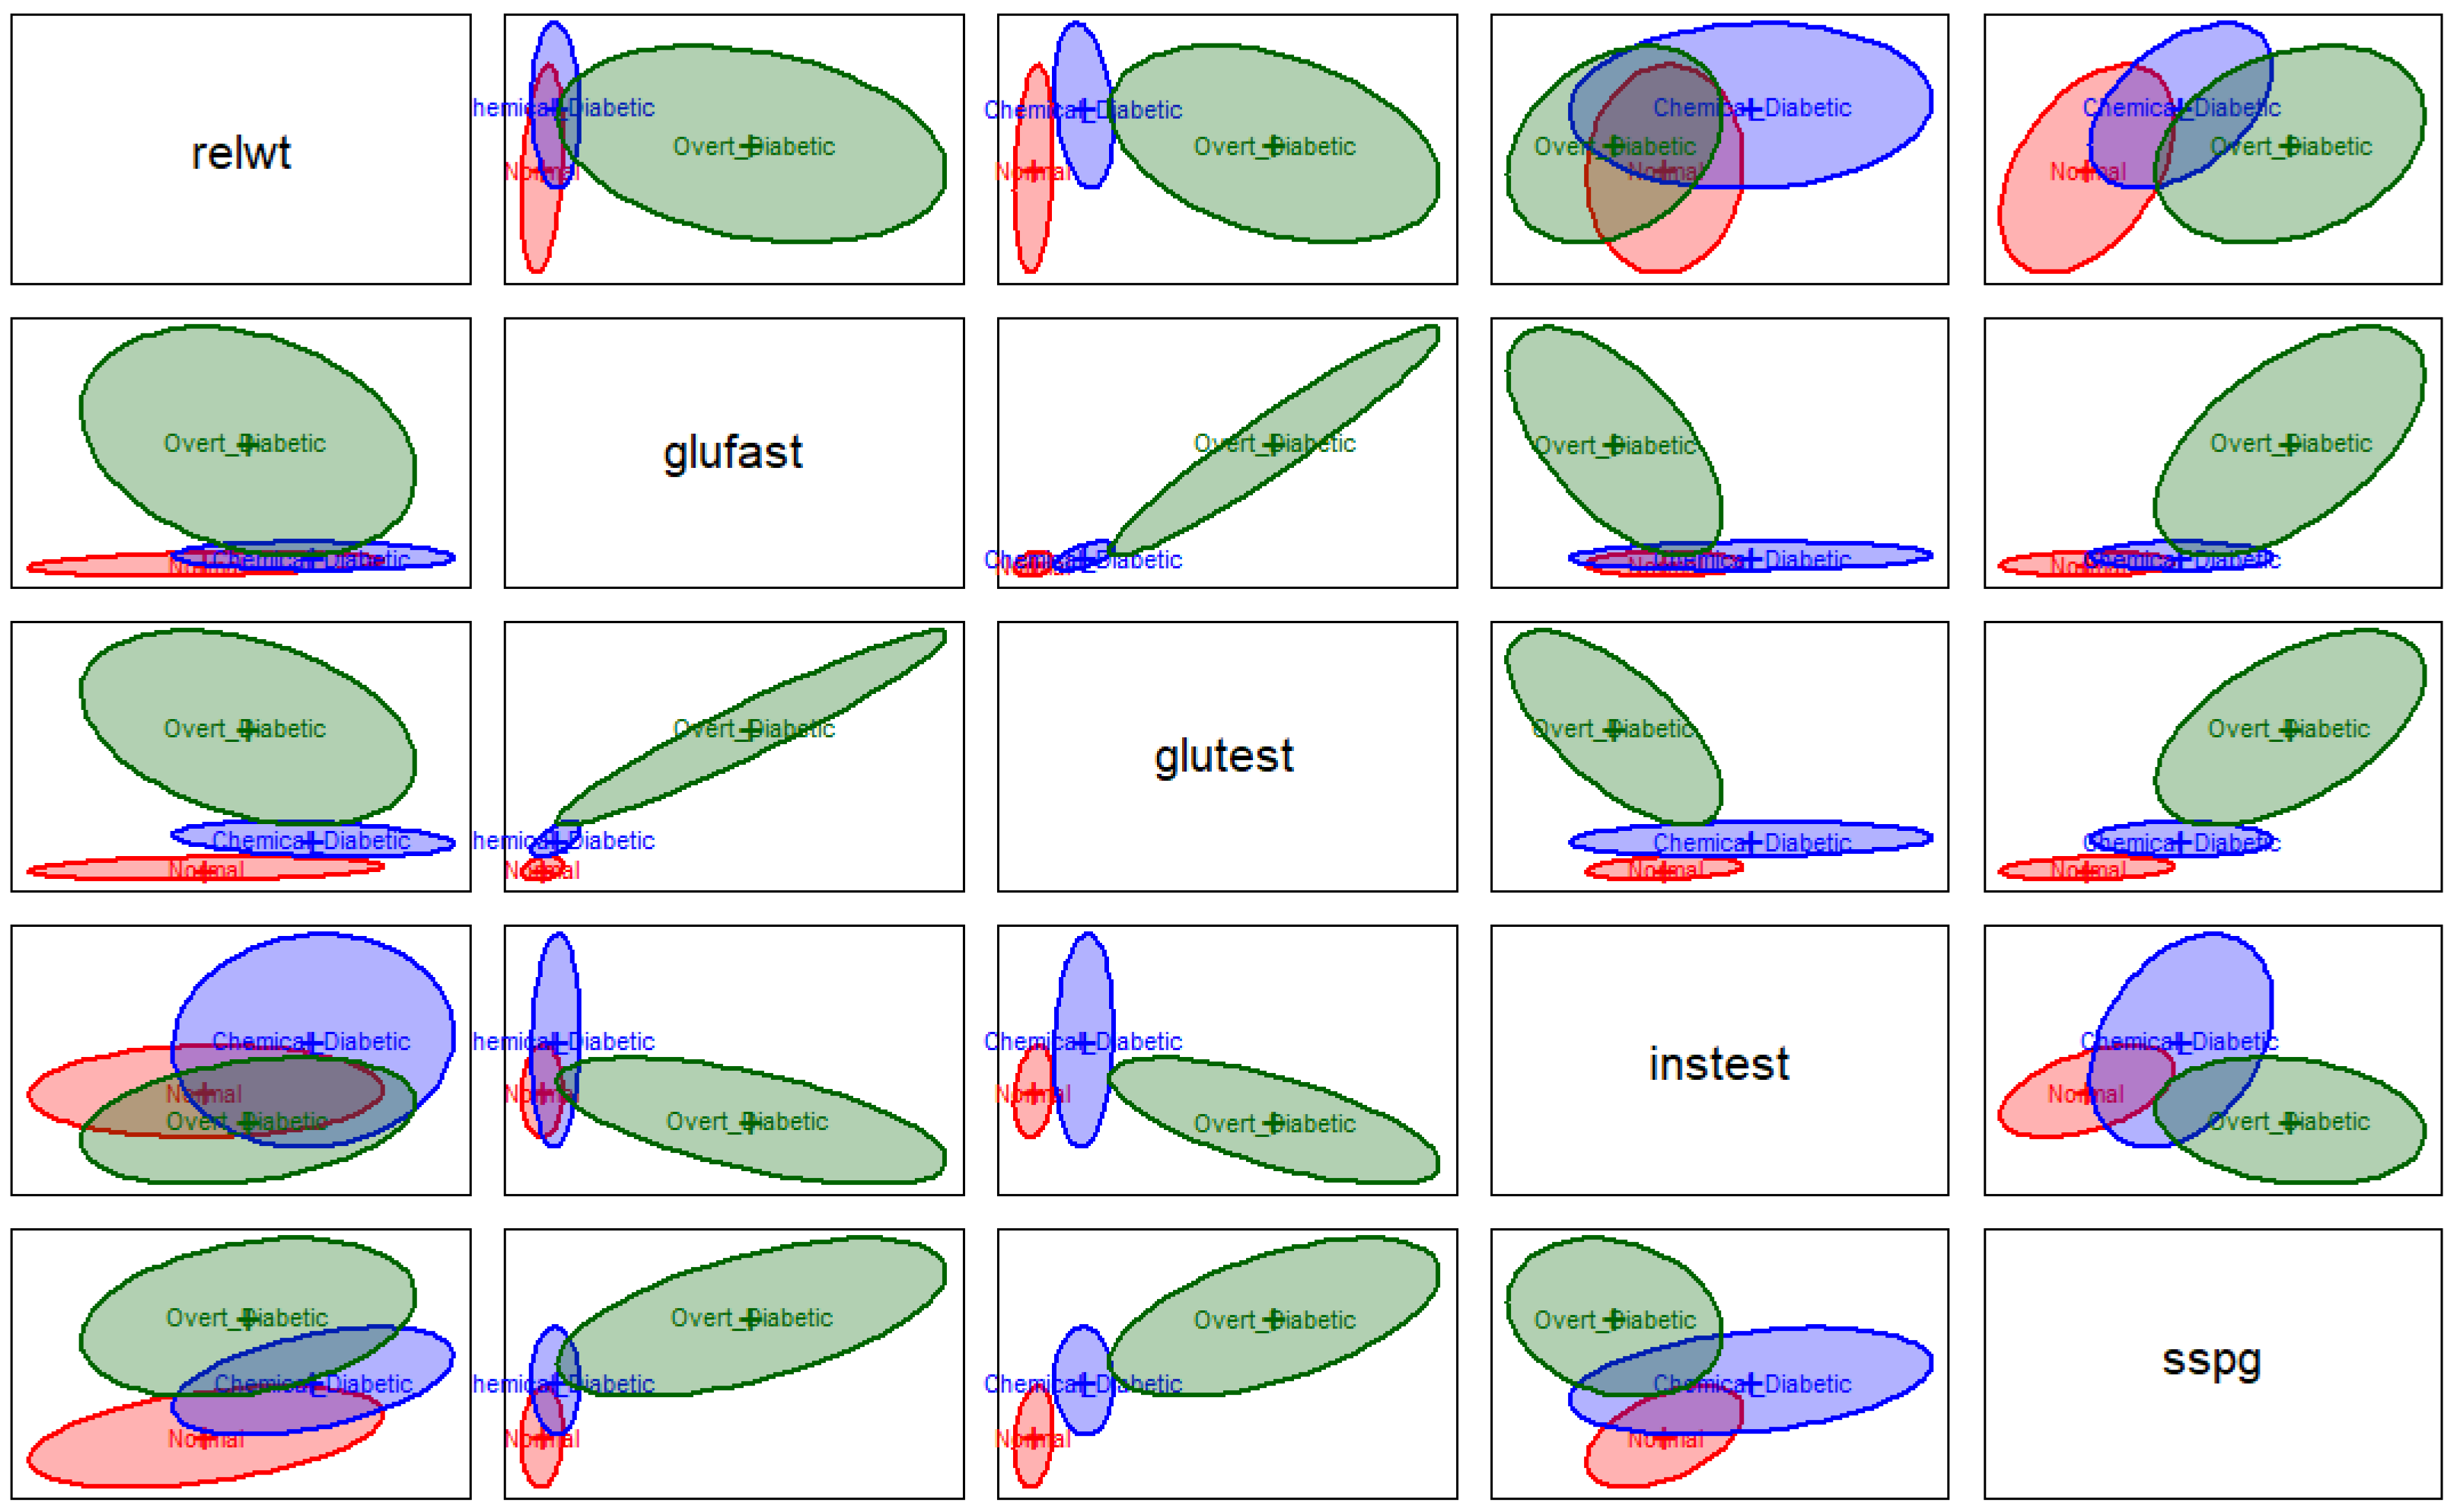
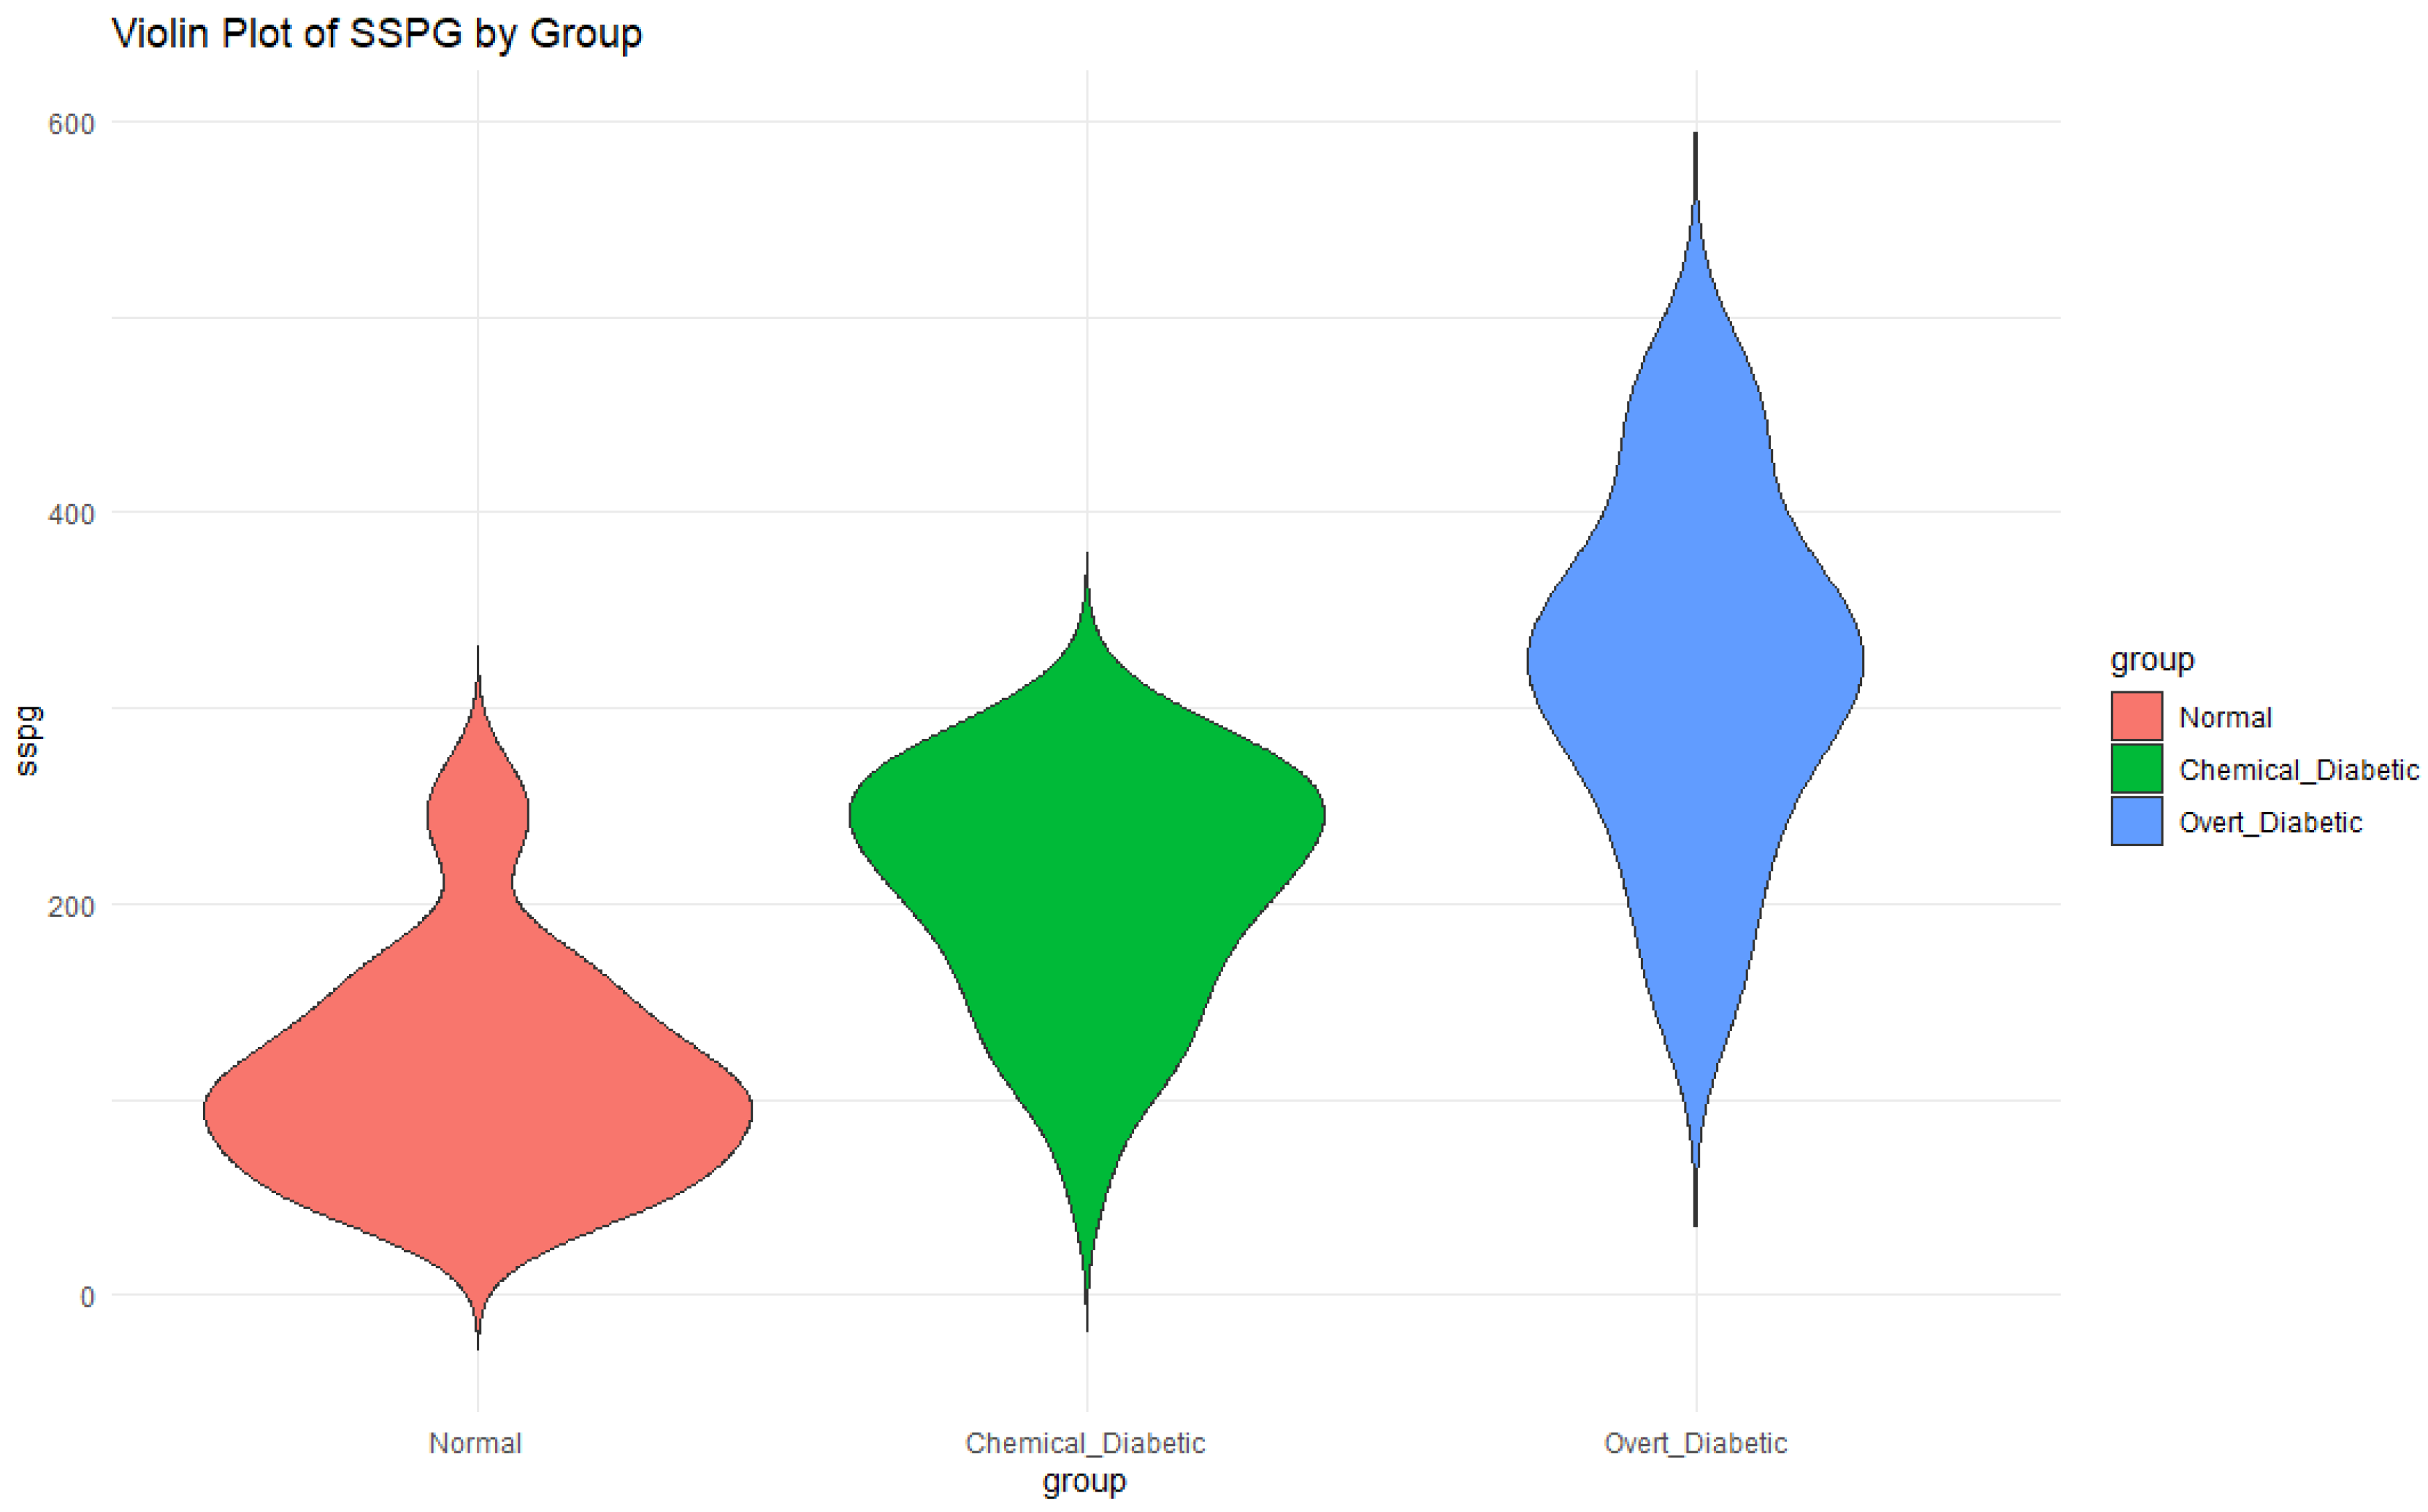
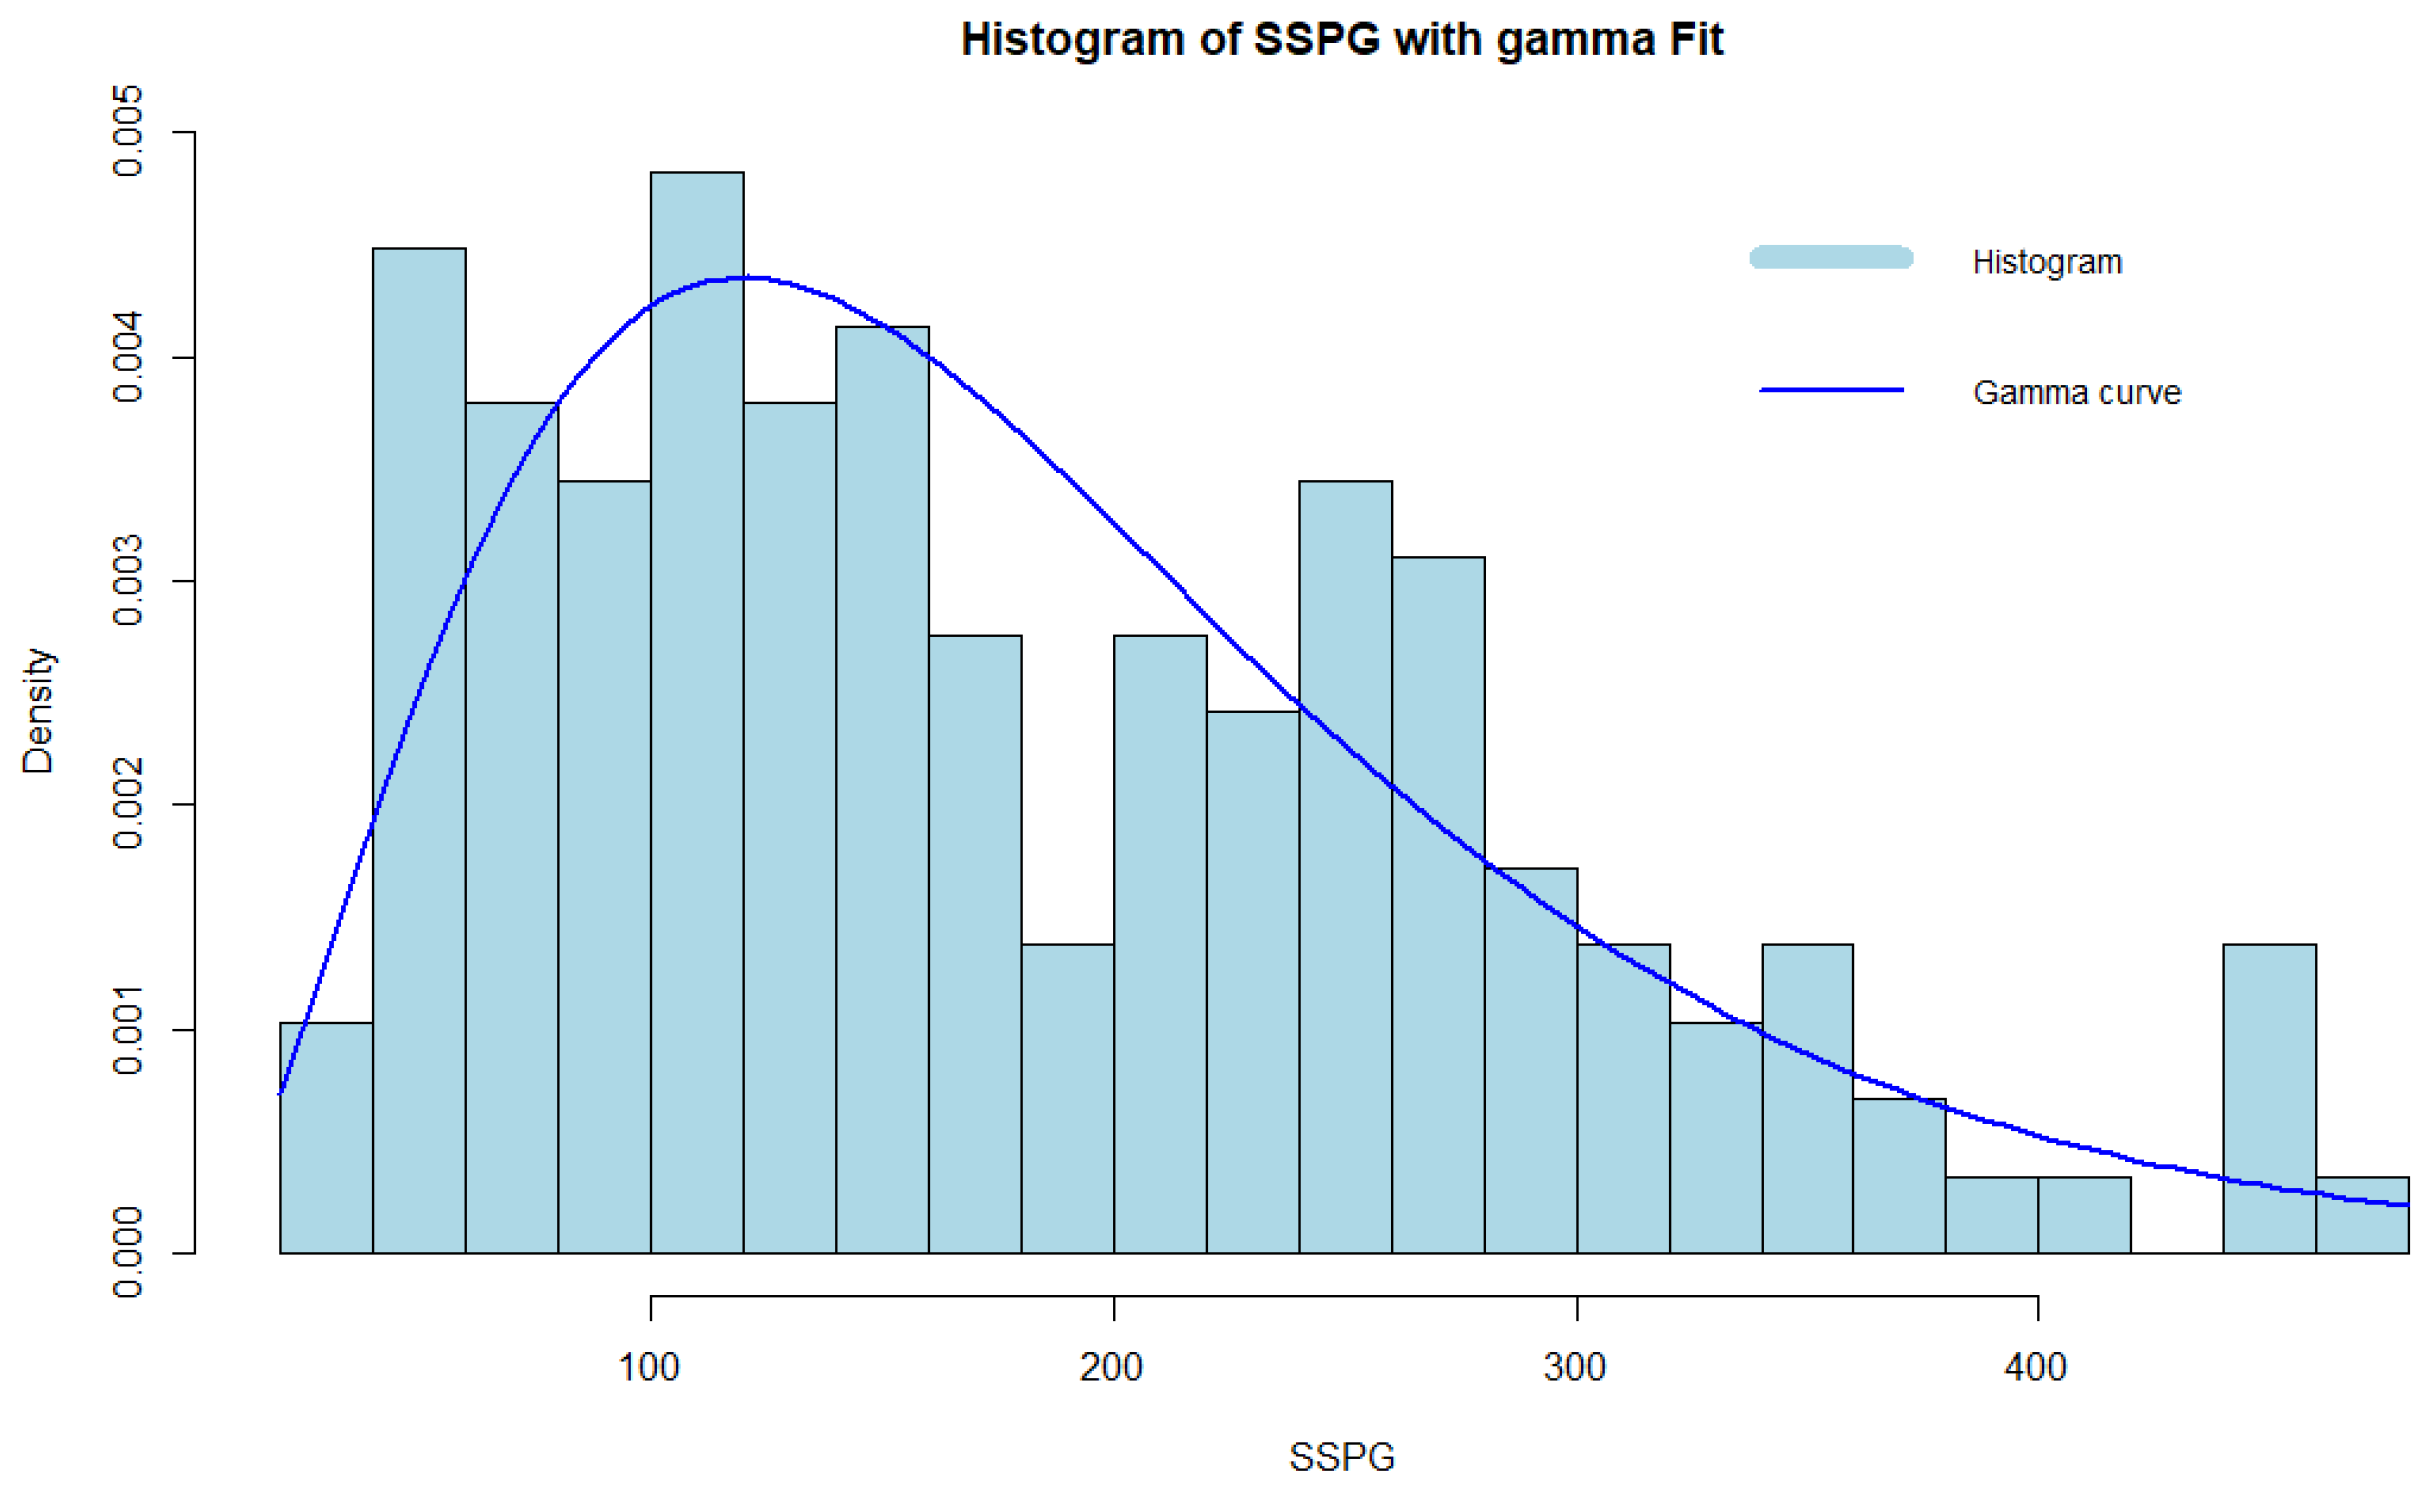
4.2. Real Data Study
5. Statistics for Evaluating the Uniformity Hypothesis Test
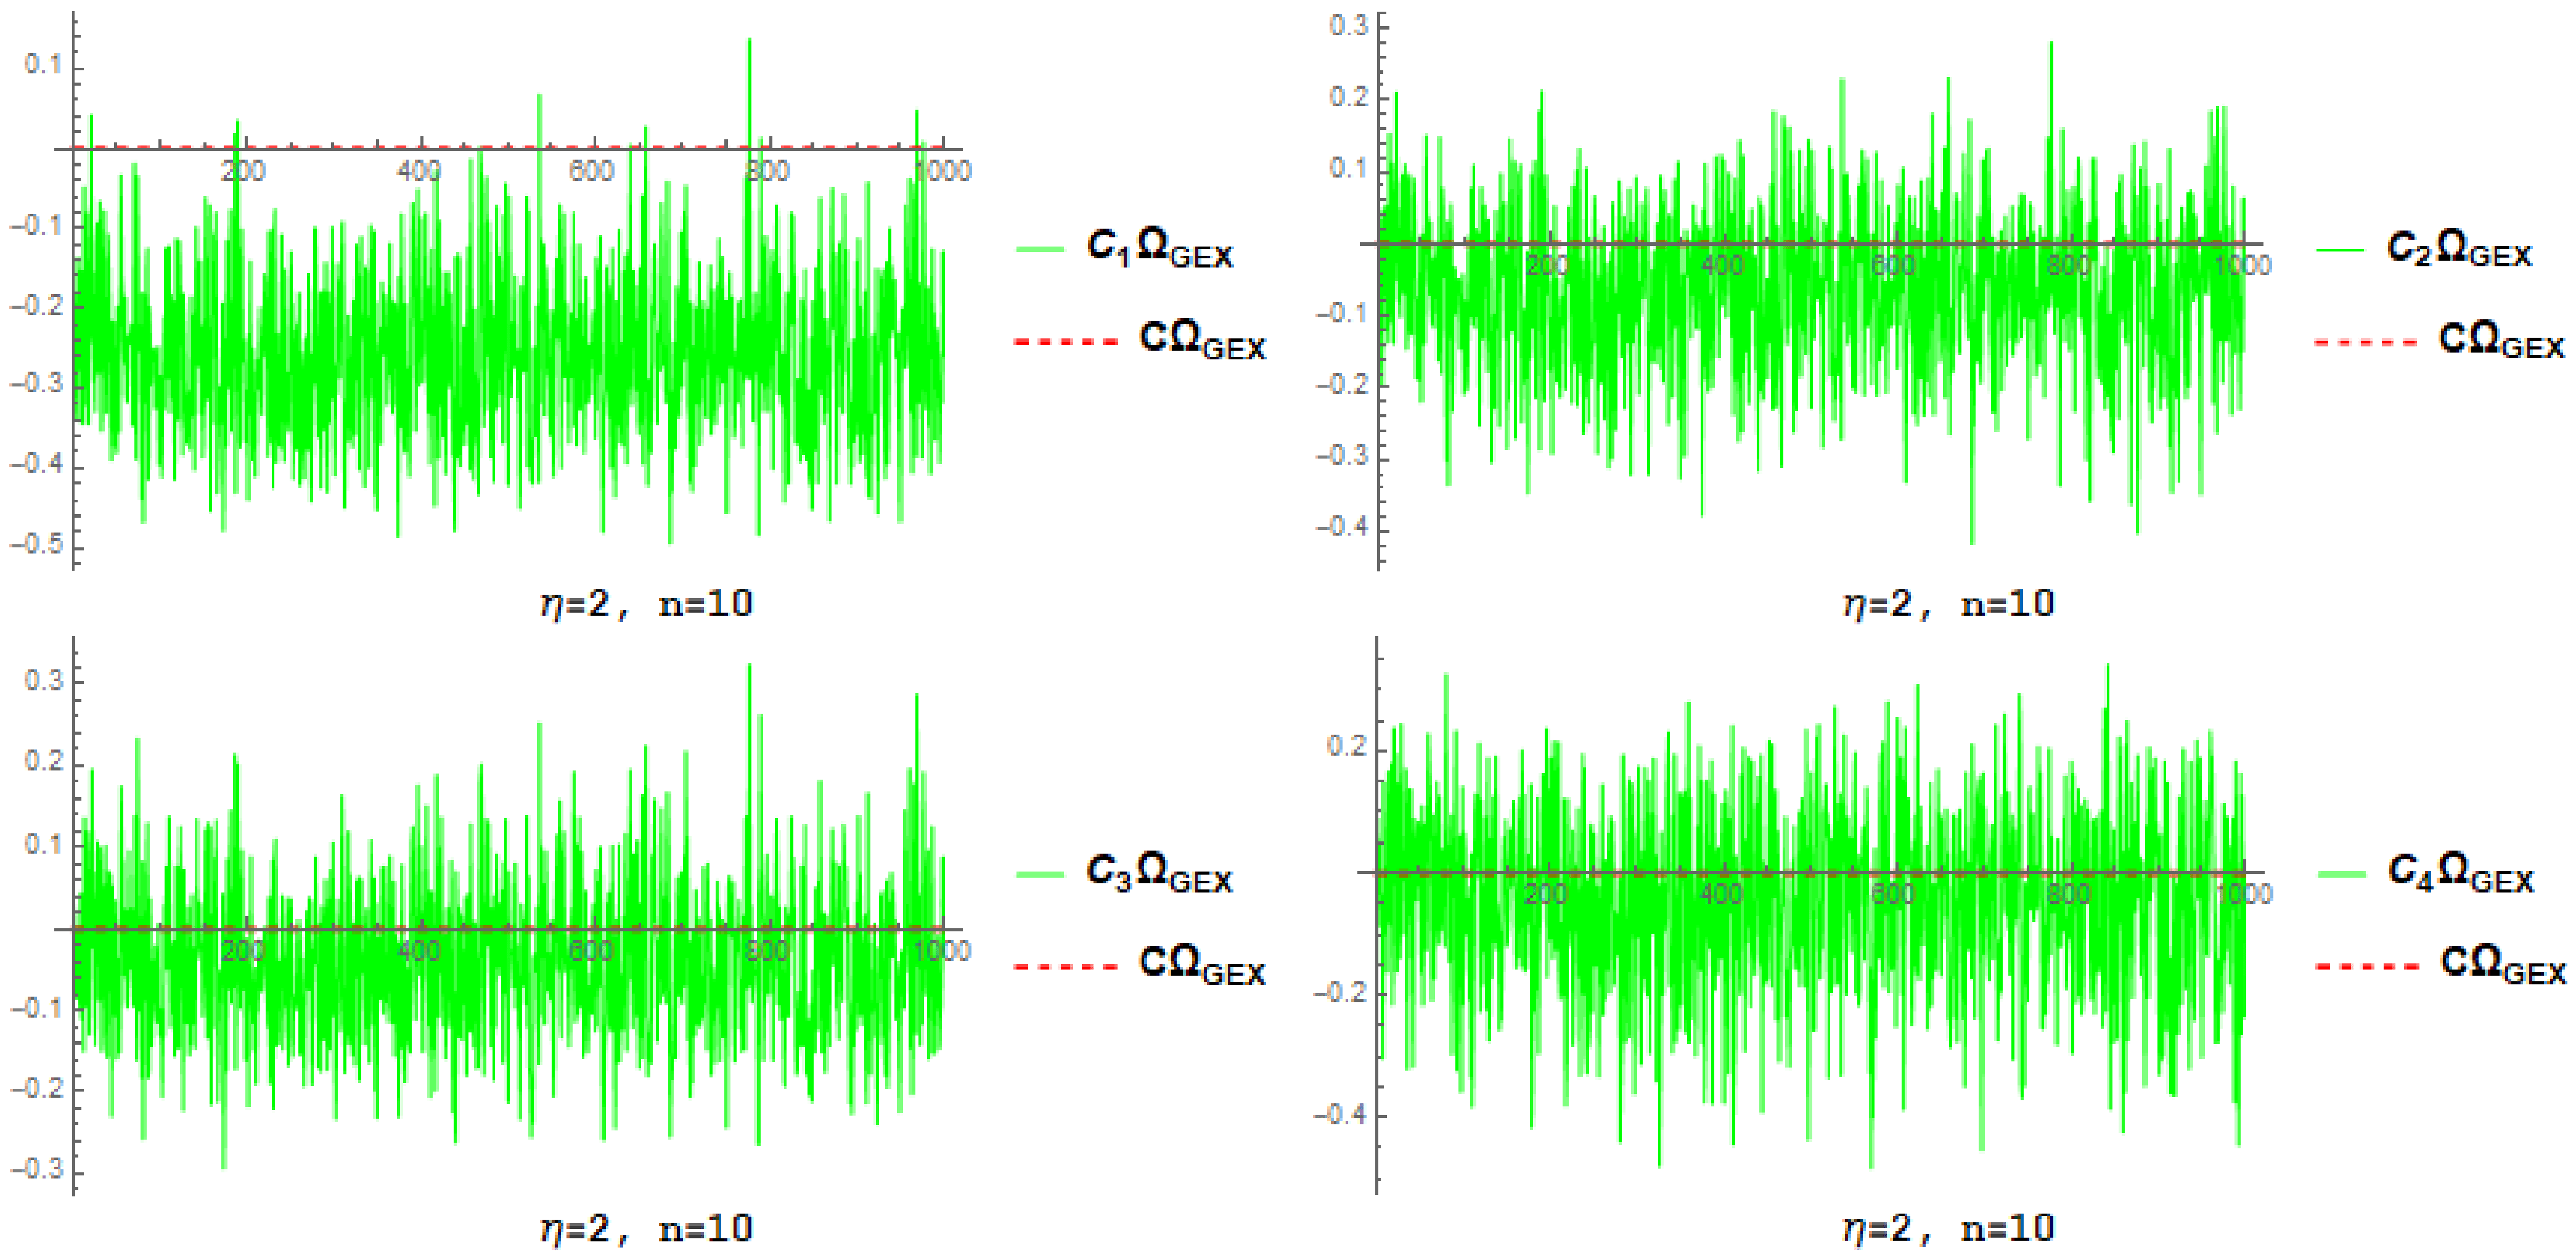
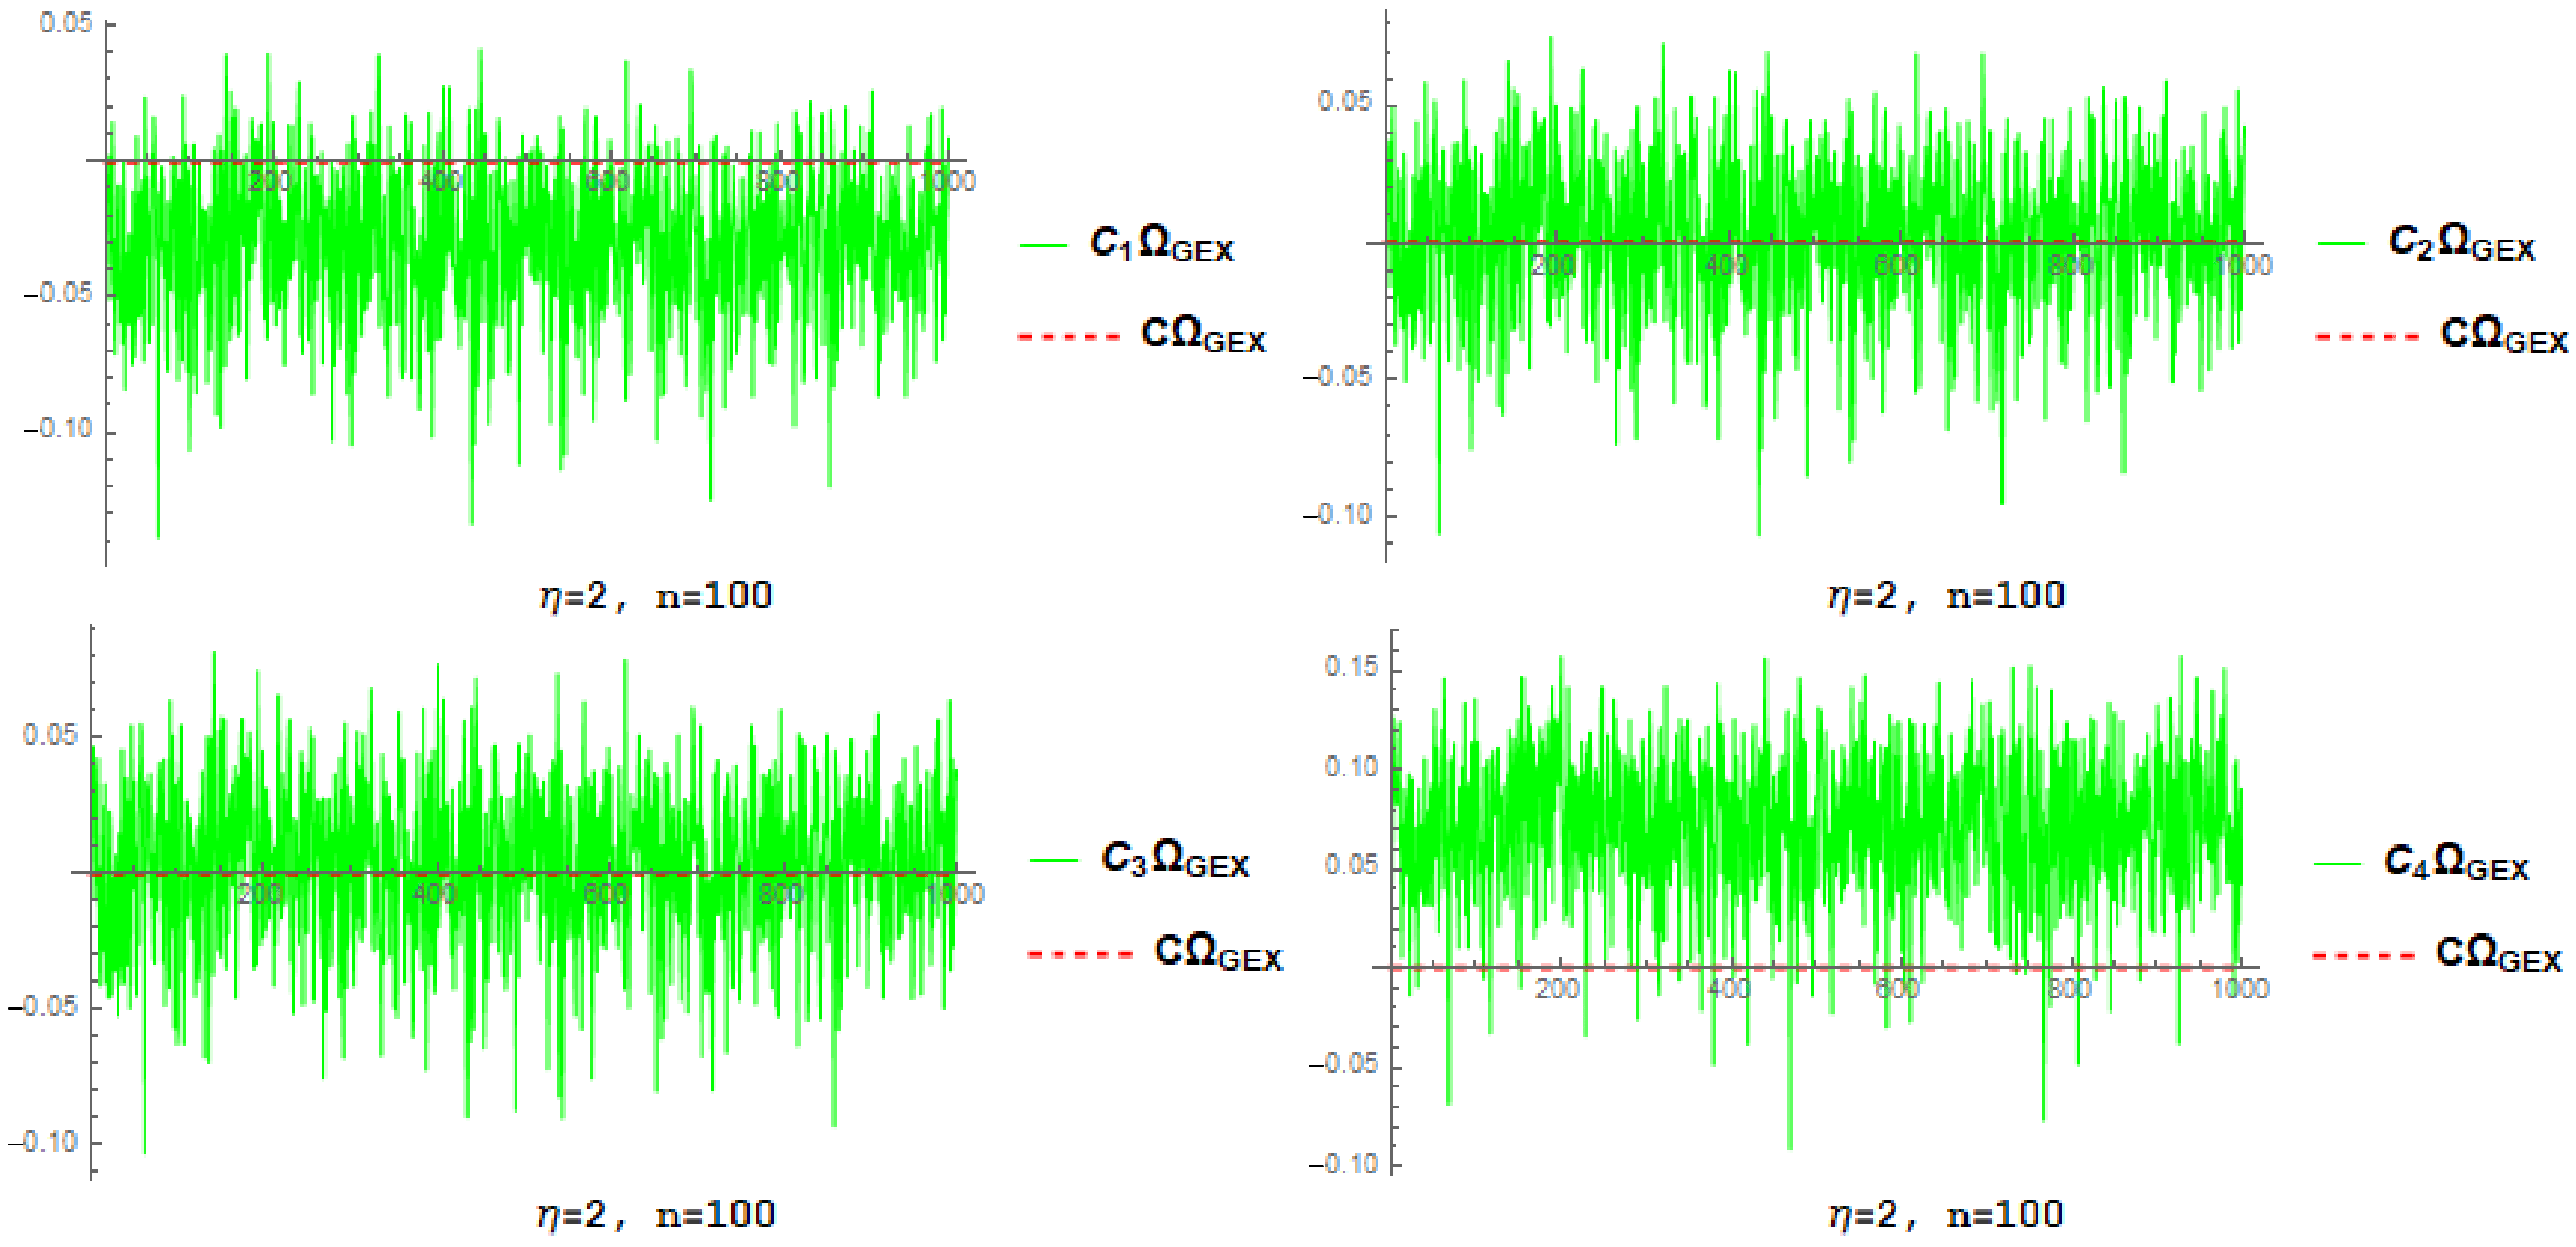
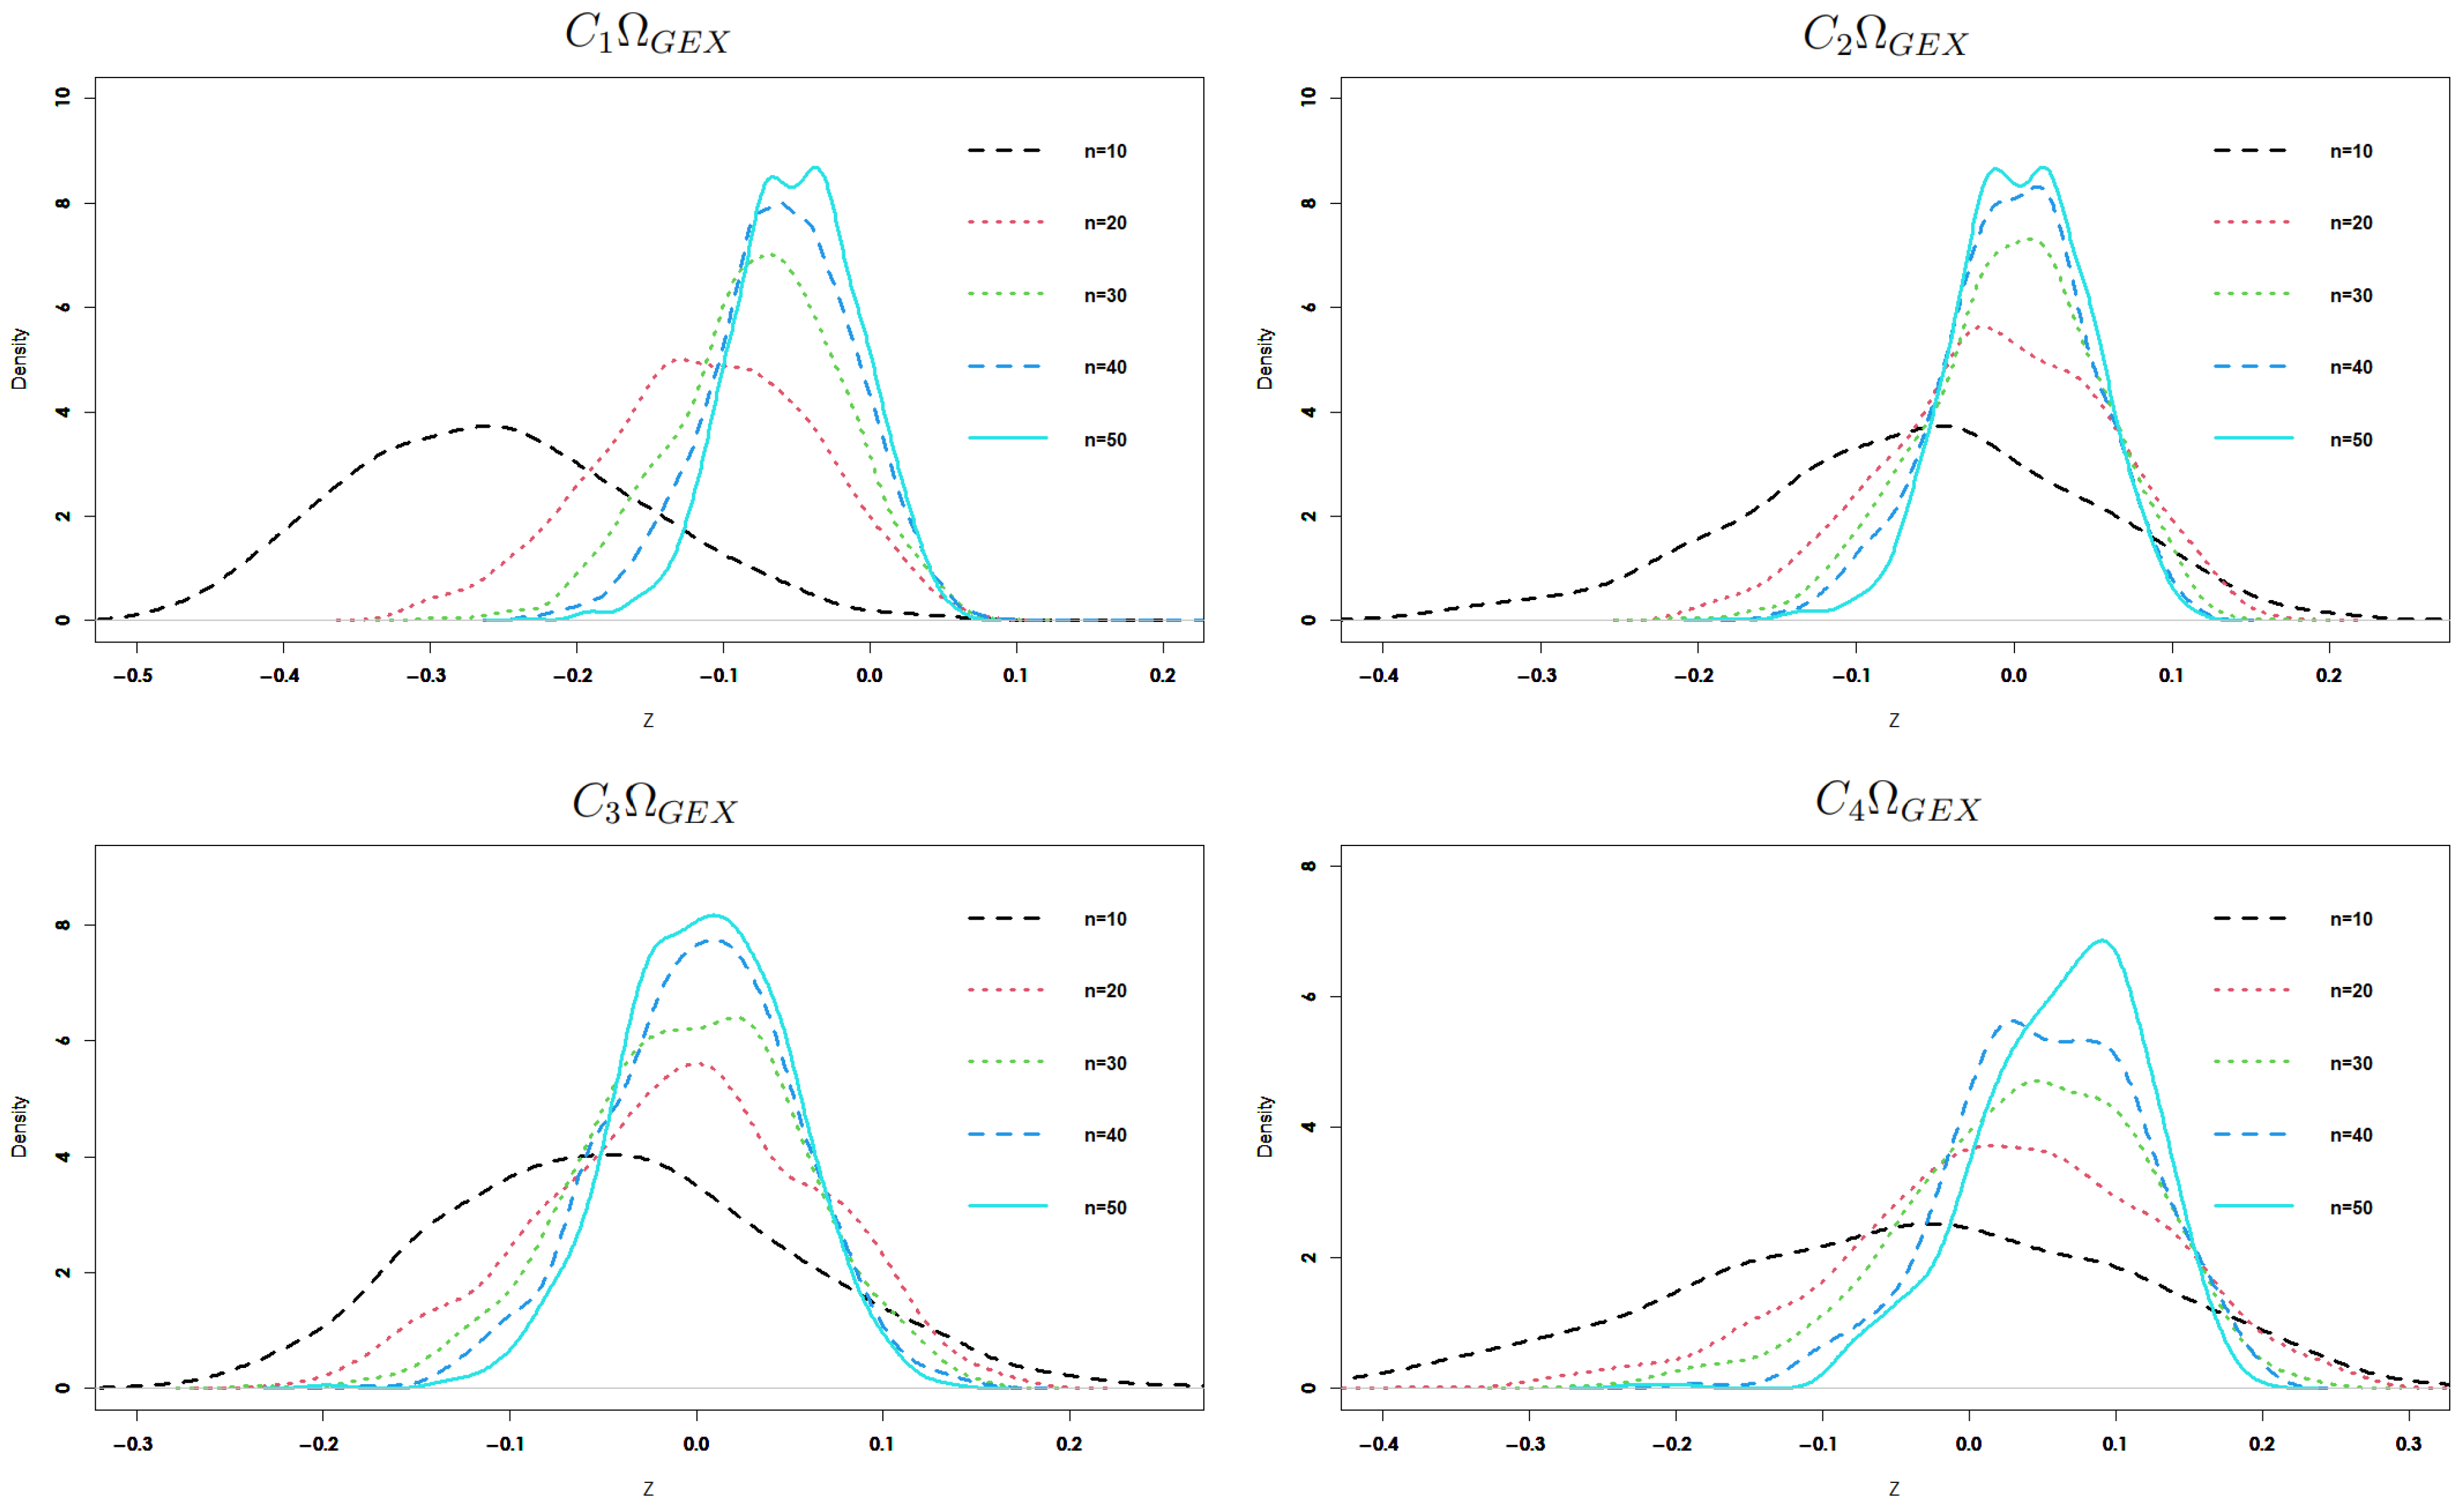
Critical Points of Percentage and Power Analysis Comparisons
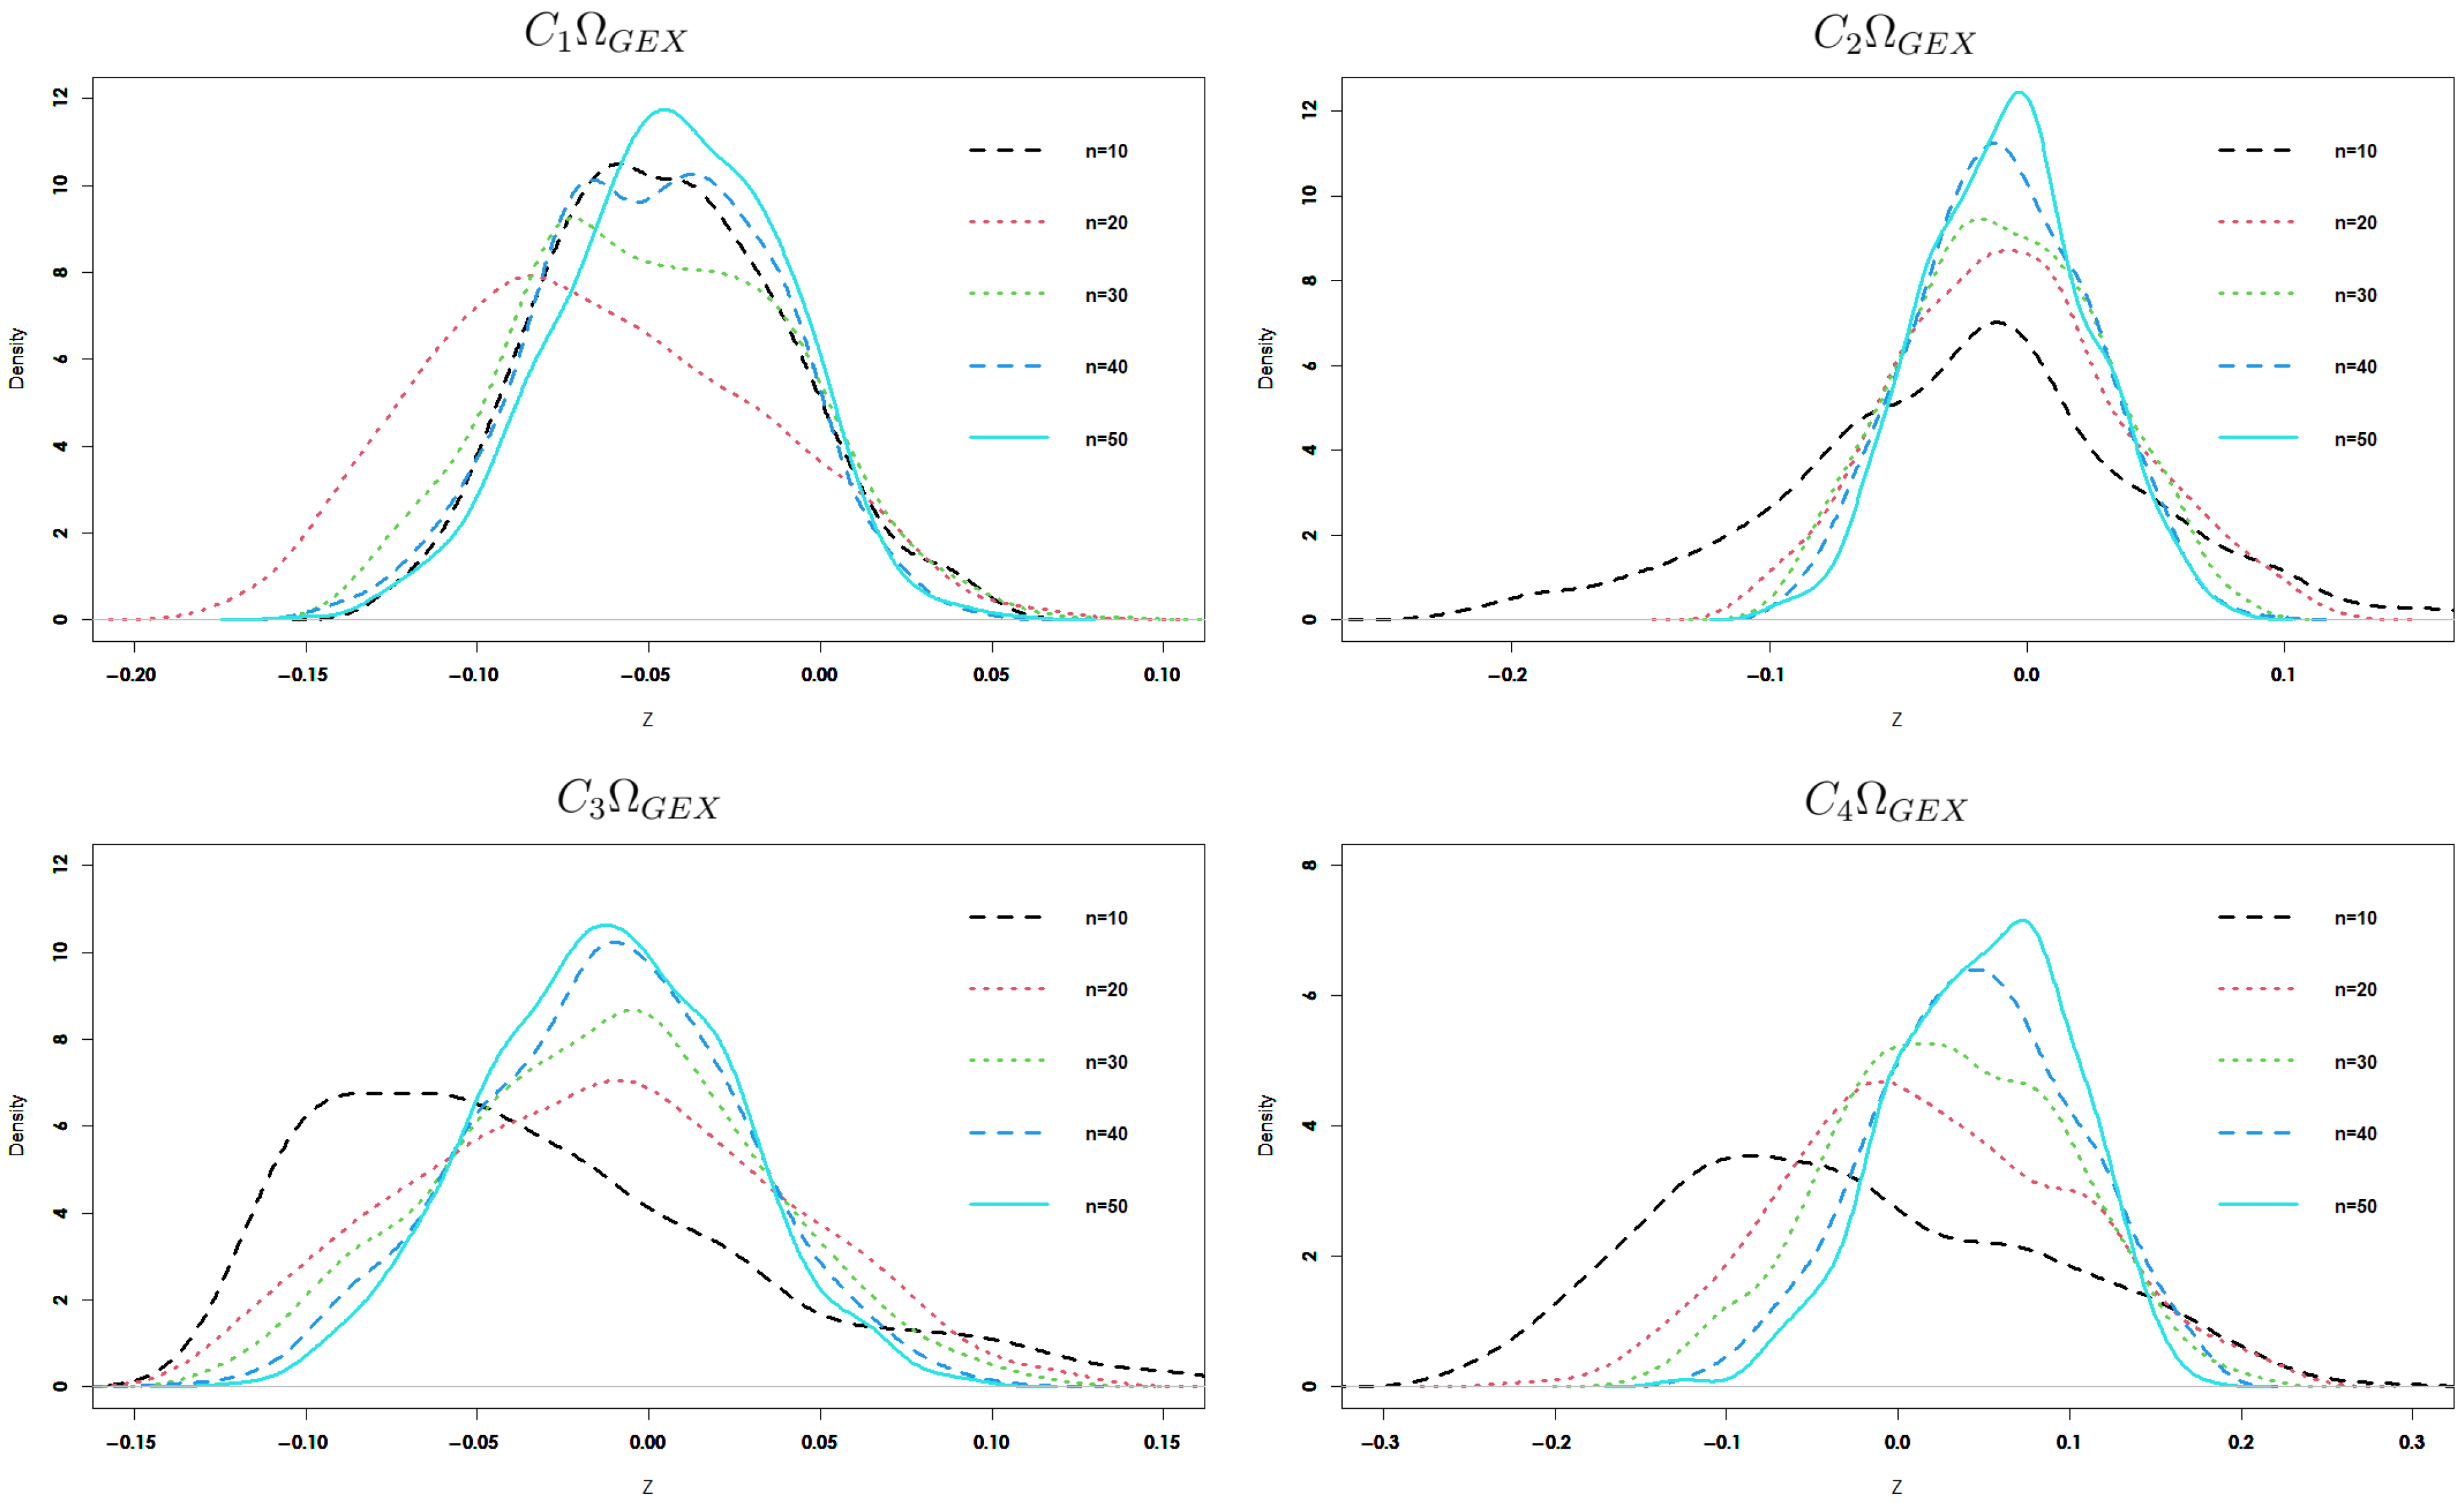
- By increasing the sample size n, the difference in percentage points decreases.
- For fixed n and increasing , the difference in percentage points decreases.
- Most of the four estimators yield percentage point intervals that include the true value (i.e., zero) of the generalized exponential entropy measure of the distribution across different values of n and , with few exceptions at small n.
- 1.
- Power analysis under small n is crucial: in practice, uniformity tests are often used in settings with limited data (e.g., simulation diagnostics, goodness-of-fit checks in applied sciences). Knowing how the test performs with small samples is highly valuable.
- 2.
- Since we are not using these sample sizes to justify theoretical properties like asymptotic normality, but instead focusing on finite-sample power, small n is appropriate.
- 3.
- It shows practical sensitivity: if your test has good power at , this highlights its sensitivity and usefulness in realistic, data-limited conditions.
- In contrast to the previous tests, the four generalized exponential entropy estimators behave well under different . Alternatives , , and were interpreted by Stephens [39] as suggesting a shift in the mean, a change towards a lower variance, and a shift towards a greater variance, respectively. As a result, when there is a movement towards a lower variance, our tests perform better than alternatives.
- By increasing the value of , our four proposed estimators increase in power.
- Across a range of n values, the fourth statistic, which is based on the kernel function, performs better than all other tests under alternatives and .
6. Conclusions
Author Contributions
Funding
Data Availability Statement
Acknowledgments
Conflicts of Interest
References
- Shannon, C. A mathematical theory of communication. Bell Syst. Tech. J. 1948, 27, 379–423. [Google Scholar] [CrossRef]
- Renyi, A. On measures of entropy and information. In Proceedings of the Fourth Berkeley Symposium on Mathematical Statistics and Probability, Berkeley, CA, USA, 20–30 July 1960; UC Press, Berkeley: Berkeley, CA, USA, 1961; pp. 547–561. [Google Scholar]
- Kapur, J.N. Generalized entropy of order α and type β. Math. Semin. 1967, 4, 78–82. [Google Scholar]
- Havrda, J.; Charvat, F. Qualification method of classification process: The concept of structural α-entropy. Kybernetika 1967, 3, 30–35. [Google Scholar]
- Tsallis, C. Possible generalization of Boltzmann-Gibbs statistics. J. Stat. Phys. 1988, 52, 479–487. [Google Scholar] [CrossRef]
- Pal, N.R.; Pal, S.K. Object background segmentation using new definitions of entropy. IEEE Proc. 1989, 136, 284–295. [Google Scholar] [CrossRef]
- Pal, N.R.; Pal, S.K. Entropy: A new definition and its applications. IEEE Trans. Syst. Man Cybern. 1991, 21, 1260–1270. [Google Scholar] [CrossRef]
- Campbell, L.L. Exponential entropy as a measure of extent of distribution. Z. Wahrscheinlichkeitstheorie Verwandte Geb. 1966, 5, 217–225. [Google Scholar] [CrossRef]
- Panjehkeh, S.M.; Borzadaran, G.R.M.; Amini, M. Results related to exponential entropy. Int. Inf. Coding Theory 2017, 4, 258–275. [Google Scholar] [CrossRef]
- Kvalseth, T.O. On exponential entropies. In Proceedings of the IEEE International Conference on Systems, Man And Cybernatics 2000, Nashville, TN, USA, 8–11 October 2000; Volume 4, pp. 2822–2826. [Google Scholar]
- Lad, F.; Sanfilippo, G.; Agro, G. Extropy: Complementary dual of entropy. Stat. Sci. 2015, 30, 40–58. [Google Scholar] [CrossRef]
- Vasicek, O. A Test for Normality based on Sample Entropy. J. R. Stat. Soc. Ser. B 1976, 38, 54–59. [Google Scholar] [CrossRef]
- Ebrahimi, N.; Pflughoeft, K.; Soofi, E.S. Two Measures of Sample Entropy. Stat. Probab. Lett. 1994, 20, 225–234. [Google Scholar] [CrossRef]
- Qiu, G.; Jia, K. Extropy Estimators with Applications in Testing Uniformity. J. Nonparametric Stat. 2018, 30, 182–196. [Google Scholar] [CrossRef]
- Noughabi, H.A.; Jarrahiferiz, J. Extropy of order statistics applied to testing symmetry. Commun. Stat.-Simul. 2020, 55, 3389–3399. [Google Scholar] [CrossRef]
- Wachowiak, M.P.; Smolikova, R.; Tourassi, G.D.; Elmaghraby, A.S. Estimation of generalized entropies with sample spacing. Pattern Anal. Appl. 2005, 8, 95–101. [Google Scholar] [CrossRef]
- Sakr, H.H.; Mohamed, M.S. Sharma-Taneja-Mittal Entropy and Its Application of Obesity in Saudi Arabia. Mathematics 2024, 12, 2639. [Google Scholar] [CrossRef]
- Sakr, H.H.; Mohamed, M.S. On residual cumulative generalized exponential entropy and its application in human health. Electron. Res. Arch. 2025, 33, 1633–1666. [Google Scholar] [CrossRef]
- Rosenblatt, M. A central limit theorem and a strong mixing condition. Proc. Natl. Acad. Sci. USA 1956, 42, 43–47. [Google Scholar] [CrossRef] [PubMed]
- Ibragimov, I.A. Some limit theorems for stochastic processes stationary in the strict sense. Dokl. Akad. Nauk. SSSR 1959, 125, 711–714. [Google Scholar]
- Kolmogorov, A.N.; Rozanov, Y.A. On strong mixing conditions for stationary Gaussian processes. Theory Probab. Appl. 1960, 5, 204–208. [Google Scholar] [CrossRef]
- Bradley, R.C. Central limit theorems under weak dependence. J. Multivar. Anal. 1981, 11, 1–16. [Google Scholar] [CrossRef]
- Masry, E. Recursive probability density estimation for weakly dependent stationary processes. IEEE Trans. Inf. Theory 1986, 32, 254–267. [Google Scholar] [CrossRef]
- Rajesh, G.; Abdul-Sathar, E.I.; Maya, R. Local linear estimation of residual entropy function of conditional distribution, Comput. Stat. Data Anal. 2015, 88, 1–14. [Google Scholar] [CrossRef]
- Irshad, M.R.; Maya, R.; Buono, F.; Longobardi, M. Kernel Estimation of Cumulative Residual Tsallis Entropy and Its Dynamic Version under ρ-Mixing Dependent Data. Entropy 2022, 24, 9. [Google Scholar] [CrossRef] [PubMed]
- Ye, J.; Cui, W. Exponential Entropy for Simplified Neutrosophic Sets and Its Application in Decision Making. Entropy 2018, 20, 357. [Google Scholar] [CrossRef]
- Wang, C.; Shi, G.; Sheng, Y.; Ahmadzade, H. Exponential entropy of uncertain sets and its applications to learning curve and portfolio optimization. J. Ind. Manag. 2025, 21, 1488–1502. [Google Scholar] [CrossRef]
- Wanke, P. The uniform distribution as a first practical approach to new product inventory management. Int. J. Prod. Econ. 2008, 114, 811–819. [Google Scholar] [CrossRef]
- Correa, J.C. A new Estimator of entropy. Commun. Stat. Theory Methods 1995, 24, 2439–2449. [Google Scholar] [CrossRef]
- Wegman, E.J.; Davies, H.I. Remarks on some recursive estimators of a probability density. Ann. Stat. 1979, 7, 316–327. [Google Scholar] [CrossRef]
- Parzen, E. On estimation of a probability density function and mode. Ann. Math. Stat. 1962, 33, 1065–1076. [Google Scholar] [CrossRef]
- Grzegorzewski, P.; Wieczorkowski, R. Entropy-based Goodness-of-fit Test for Exponentiality. Commun. Stat. Theory Methods 1999, 28, 1183–1202. [Google Scholar] [CrossRef]
- Reaven, G.M.; Miller, R.G. An attempt to define the nature of chemical diabetes using a multidimensional analysis. Diabetologia 1979, 16, 17–24. [Google Scholar] [CrossRef]
- Marhuenda, Y.; Morales, D.; Pardo, M.C. A Comparison of Uniformity Tests. Statistics 2005, 39, 315–327. [Google Scholar] [CrossRef]
- Zamanzade, E.; Arghami, N.R. Goodness-of-Fit Test based on Correcting Moments of Modified Entropy Estimator. J. Stat. Comput. Simul. 2011, 81, 2077–2093. [Google Scholar] [CrossRef]
- Cramér, H. On the Composition of Elementary Errors: II. Stat. Appl. Scand. Actuar. J. 1928, 1, 141–180. [Google Scholar] [CrossRef]
- Kolmogorov, A.N. Sulla Determinazione Empirica di una Legge di Distibuziane. G. Dell’Istitutaitaliano Attuari 1933, 4, 83–91. [Google Scholar]
- Anderson, W.T.; Darling, A.D. A Test of Goodness-of-Fit. J. Am. Stat. Assoc. 1954, 49, 765–769. [Google Scholar] [CrossRef]
- Stephens, M.A. EDF statistics for goodness of fit and some comparisons. J. Am. Stat. Assoc. 1974, 69, 730–737. [Google Scholar] [CrossRef]
- Mohamed, M.S.; Sakr, H.H. Generalizing Uncertainty Through Dynamic Development and Analysis of Residual Cumulative Generalized Fractional Extropy with Applications in Human Health. Fractal Fract. 2025, 9, 388. [Google Scholar] [CrossRef]



| ; | ||||
|---|---|---|---|---|
| n | ||||
| 10 | 0.166619 | 0.139548 | 0.131408 | 0.0676092 |
| (0.128746) | (0.118047) | (0.113455) | (0.0647867) | |
| 30 | 0.0721833 | 0.0693193 | 0.0614541 | 0.0509792 |
| (0.0595626) | (0.0589205) | (0.0556205) | (0.0261327) | |
| 50 | 0.0503906 | 0.0492573 | 0.0444755 | 0.0503707 |
| (0.0430887) | (0.0428833) | (0.0412355) | (0.0180801) | |
| 100 | 0.0322678 | 0.0319324 | 0.0290094 | 0.048996 |
| (0.0279918) | (0.0279467) | (0.0271723) | (0.0128205) | |
| ; | ||||
| 10 | 0.123315 | 0.0955782 | 0.090431 | 0.0288746 |
| (0.107512) | (0.0811191) | (0.0779946) | (0.0276784) | |
| 30 | 0.0455141 | 0.0441009 | 0.0389924 | 0.0185159 |
| (0.0374106) | (0.0368886) | (0.0341483) | (0.00760492) | |
| 50 | 0.0302498 | 0.029718 | 0.0268443 | 0.0184828 |
| (0.0253976) | (0.0251962) | (0.0238917) | (0.004876) | |
| 100 | 0.0180671 | 0.0179056 | 0.0163372 | 0.0181694 |
| (0.0151679) | (0.0151121) | (0.0145665) | (0.00331677) | |
| ; | ||||
|---|---|---|---|---|
| n | ||||
| 10 | 0.274905 | 0.126526 | 0.104323 | 0.158303 |
| (0.101703) | (0.11006) | (0.0963832) | (0.151793) | |
| 30 | 0.0956154 | 0.0553293 | 0.0598109 | 0.0902685 |
| (0.0578994) | (0.0553003) | (0.0598273) | (0.0799785) | |
| 50 | 0.0659172 | 0.0426288 | 0.0450114 | 0.0827768 |
| (0.0429443) | (0.0423997) | (0.0448721) | (0.0565385) | |
| 100 | 0.0416265 | 0.0287682 | 0.030048 | 0.0804643 |
| (0.0281866) | (0.0286104) | (0.0298927) | (0.0371721) | |
| ; | ||||
| 10 | 0.170787 | 0.0728147 | 0.0725207 | 0.111723 |
| (0.0648594) | (0.0687118) | (0.0652757) | (0.108251) | |
| 30 | 0.0647521 | 0.0392415 | 0.0481893 | 0.0745462 |
| (0.04087) | (0.0385893) | (0.0463916) | (0.0668339) | |
| 50 | 0.0535745 | 0.0328033 | 0.0383248 | 0.069018 |
| (0.0322633) | (0.0316971) | (0.0361227) | (0.0498909) | |
| 100 | 0.0431192 | 0.0264828 | 0.0280886 | 0.0675841 |
| (0.0225317) | (0.023074) | (0.0249522) | (0.0355629) | |
| Estimators | |||||
|---|---|---|---|---|---|
| 0.7 | 2.39022 | 2.39562 | 2.39602 | 2.39631 | 2.39382 |
| (0.00549344) | (0.00584758) | (0.00611249) | (0.00359942) | ||
| 0.9 | 1.89316 | 1.8946 | 1.89468 | 1.89479 | 1.89445 |
| (0.00144317) | (0.00152767) | (0.00163561) | (0.00129579) | ||
| 1 | 1.71011 | 1.71085 | 1.7109 | 1.71096 | 1.71087 |
| (0.000742883) | (0.000786553) | (0.000855934) | (0.000765248) | ||
| 1.5 | 1.1452 | 1.14523 | 1.14523 | 1.14524 | 1.14525 |
| (0.0000300966) | (0.000032158) | (0.0000380813) | (0.0000512178) | ||
| 2 | 0.859141 | 0.859128 | 0.859128 | 0.859128 | 0.85913 |
| (0.0000129779) | (0.0000129042) | (0.0000125223) | (0.000011189) | ||
| n; | ||||
|---|---|---|---|---|
| 10 | (−0.422986, −0.0150384) | (−0.284684, 0.177716) | (−0.177159, 0.189558) | (−0.22324, 0.210542) |
| 20 | (−0.248859, 0.0333156) | (−0.141655, 0.128236) | (−0.123249, 0.146506) | (−0.154934, 0.172644) |
| 30 | (−0.183537, 0.0377545) | (−0.104446, 0.105192) | (−0.105972, 0.119938) | (−0.0959191, 0.159991) |
| 50 | (−0.132261, 0.0346427) | (−0.0734596, 0.0868403) | (−0.0753921, 0.0944493) | (−0.0301963, 0.146967) |
| 70 | (−0.105717, 0.0274583) | (−0.0676648, 0.0664032) | (−0.0706697, 0.0746701) | (−0.0193603, 0.136071) |
| 100 | (−0.086409, 0.0198325) | (−0.0565094, 0.0536249) | (−0.056399, 0.0581039) | (−0.00358996, 0.126684) |
| n; | ||||
| 10 | (0.147299, 0.3406) | (0.0325989, 0.33247) | (−0.121961, 0.173553) | (−0.187423, 0.195208) |
| 20 | (−0.0827349, 0.0755373) | (−0.0731537, 0.118101) | (−0.115785, 0.120527) | (−0.136084, 0.161355) |
| 30 | (−0.105273, 0.0551253) | (−0.077303, 0.0866788) | (−0.103773, 0.0997682) | (−0.0913948, 0.149395) |
| 50 | (−0.0974539, 0.032796) | (−0.0648665, 0.0697503) | (−0.0795326, 0.0741954) | (−0.0335902, 0.136741) |
| 70 | (−0.0884423, 0.0204563) | (−0.0634696, 0.0511093) | (−0.0700712, 0.055357) | (−0.021843, 0.127675) |
| 100 | (−0.0837358, 0.0115276) | (−0.0597903, 0.0369845) | (−0.0654341, 0.0408905) | (−0.00320919, 0.119708) |
| n | Alt. | Statistics; | |||||||
| 10 | 0.114 | 0.075 | 0.23 | 0.421 | 0.152 | 0.166 | 0.168 | 0.129 | |
| 0.241 | 0.148 | 0.465 | 0.698 | 0.376 | 0.409 | 0.438 | 0.32 | ||
| 0.247 | 0.176 | 0.314 | 0.416 | 0.037 | 0.015 | 0.026 | 0.21 | ||
| 0.585 | 0.435 | 0.618 | 0.688 | 0.044 | 0.009 | 0.022 | 0.455 | ||
| 0.946 | 0.867 | 0.885 | 0.94 | 0.087 | 0.018 | 0.051 | 0.801 | ||
| 0.101 | 0.087 | 0.159 | 0.117 | 0.113 | 0.121 | 0.098 | 0.082 | ||
| 0.3 | 0.209 | 0.552 | 0.147 | 0.199 | 0.227 | 0.155 | 0.131 | ||
| 20 | 0.178 | 0.193 | 0.305 | 0.546 | 0.279 | 0.309 | 0.324 | 0.258 | |
| 0.47 | 0.495 | 0.644 | 0.868 | 0.699 | 0.756 | 0.771 | 0.665 | ||
| 0.443 | 0.411 | 0.51 | 0.607 | 0.059 | 0.032 | 0.042 | 0.399 | ||
| 0.878 | 0.862 | 0.881 | 0.912 | 0.125 | 0.092 | 0.100 | 0.808 | ||
| 1 | 1 | 0.994 | 1 | 0.410 | 0.537 | 0.513 | 0.991 | ||
| 0.147 | 0.09 | 0.128 | 0.062 | 0.150 | 0.156 | 0.119 | 0.155 | ||
| 0.412 | 0.188 | 0.522 | 0.085 | 0.315 | 0.371 | 0.250 | 0.363 | ||
| 30 | 0.281 | 0.319 | 0.336 | 0.723 | 0.520 | 0.592 | 0.594 | 0.529 | |
| 0.693 | 0.739 | 0.742 | 0.974 | 0.955 | 0.978 | 0.978 | 0.919 | ||
| 0.608 | 0.606 | 0.586 | 0.794 | 0.113 | 0.108 | 0.093 | 0.581 | ||
| 0.963 | 0.971 | 0.943 | 0.992 | 0.376 | 0.560 | 0.445 | 0.924 | ||
| 1 | 1 | 0.999 | 1 | 0.928 | 0.996 | 0.986 | 1 | ||
| 0.131 | 0.095 | 0.153 | 0.049 | 0.230 | 0.241 | 0.175 | 0.217 | ||
| 0.248 | 0.123 | 0.343 | 0.07 | 0.561 | 0.695 | 0.557 | 0.782 | ||
| n | Alt. | Statistics; | |||||||
| 10 | 0.129 | 0.107 | 0.259 | 0.447 | 0.152 | 0.166 | 0.168 | 0.129 | |
| 0.263 | 0.188 | 0.576 | 0.718 | 0.376 | 0.409 | 0.438 | 0.32 | ||
| 0.297 | 0.219 | 0.346 | 0.43 | 0.037 | 0.015 | 0.026 | 0.21 | ||
| 0.589 | 0.571 | 0.651 | 0.7 | 0.044 | 0.009 | 0.022 | 0.455 | ||
| 0.949 | 0.87 | 0.889 | 0.95 | 0.087 | 0.018 | 0.051 | 0.801 | ||
| 0.115 | 0.112 | 0.176 | 0.12 | 0.113 | 0.121 | 0.098 | 0.082 | ||
| 0.257 | 0.122 | 0.567 | 0.149 | 0.199 | 0.227 | 0.155 | 0.131 | ||
| 20 | 0.136 | 0.242 | 0.329 | 0.551 | 0.279 | 0.309 | 0.324 | 0.258 | |
| 0.499 | 0.531 | 0.684 | 0.876 | 0.699 | 0.756 | 0.771 | 0.665 | ||
| 0.447 | 0.599 | 0.616 | 0.612 | 0.059 | 0.032 | 0.042 | 0.399 | ||
| 0.813 | 0.739 | 0.873 | 0.917 | 0.125 | 0.092 | 0.100 | 0.808 | ||
| 1 | 1 | 1 | 1 | 0.410 | 0.537 | 0.513 | 0.991 | ||
| 0.156 | 0.11 | 0.163 | 0.062 | 0.150 | 0.156 | 0.119 | 0.155 | ||
| 0.417 | 0.282 | 0.653 | 0.091 | 0.315 | 0.371 | 0.250 | 0.363 | ||
| 30 | 0.302 | 0.343 | 0.351 | 0.748 | 0.520 | 0.592 | 0.594 | 0.529 | |
| 0.698 | 0.788 | 0.788 | 0.977 | 0.955 | 0.978 | 0.978 | 0.919 | ||
| 0.702 | 0.726 | 0.608 | 0.798 | 0.113 | 0.108 | 0.093 | 0.581 | ||
| 0.968 | 0.985 | 0.966 | 0.998 | 0.376 | 0.560 | 0.445 | 0.924 | ||
| 1 | 1 | 1 | 1 | 0.928 | 0.996 | 0.986 | 1 | ||
| 0.167 | 0.17 | 0.176 | 0.052 | 0.230 | 0.241 | 0.175 | 0.217 | ||
| 0.255 | 0.266 | 0.388 | 0.059 | 0.561 | 0.695 | 0.557 | 0.782 | ||
Disclaimer/Publisher’s Note: The statements, opinions and data contained in all publications are solely those of the individual author(s) and contributor(s) and not of MDPI and/or the editor(s). MDPI and/or the editor(s) disclaim responsibility for any injury to people or property resulting from any ideas, methods, instructions or products referred to in the content. |
© 2025 by the authors. Licensee MDPI, Basel, Switzerland. This article is an open access article distributed under the terms and conditions of the Creative Commons Attribution (CC BY) license (https://creativecommons.org/licenses/by/4.0/).
Share and Cite
Mohamed, M.S.; Sakr, H.H. Uniformity Testing and Estimation of Generalized Exponential Uncertainty in Human Health Analytics. Symmetry 2025, 17, 1403. https://doi.org/10.3390/sym17091403
Mohamed MS, Sakr HH. Uniformity Testing and Estimation of Generalized Exponential Uncertainty in Human Health Analytics. Symmetry. 2025; 17(9):1403. https://doi.org/10.3390/sym17091403
Chicago/Turabian StyleMohamed, Mohamed Said, and Hanan H. Sakr. 2025. "Uniformity Testing and Estimation of Generalized Exponential Uncertainty in Human Health Analytics" Symmetry 17, no. 9: 1403. https://doi.org/10.3390/sym17091403
APA StyleMohamed, M. S., & Sakr, H. H. (2025). Uniformity Testing and Estimation of Generalized Exponential Uncertainty in Human Health Analytics. Symmetry, 17(9), 1403. https://doi.org/10.3390/sym17091403


