Abstract
Parkinson’s disease (PD) is a progressive neurodegenerative disorder that severely impacts motor function, necessitating early detection for effective management. However, current diagnostic methods are expensive and resource-intensive, limiting their accessibility. This study proposes a non-invasive, gait-based screening approach for PD using time-series analysis of video-derived motion data. Gait patterns indicative of PD are analyzed using videos containing walking sequences of PD subjects. The video data are processed via computer vision and human pose estimation techniques to extract key body points. Classification is performed using K-Nearest Neighbors (KNN) and Long Short-Term Memory (LSTM) networks in conjunction with time-series techniques, including Dynamic Time Warping (DTW), Bag of Patterns (BoP), and Symbolic Aggregate Approximation (SAX). KNN classifies based on similarity measures derived from these methods, while LSTM captures complex temporal dependencies. Additionally, Shapelet-based Classification is independently explored for its ability to serve as a self-contained classifier by extracting discriminative motion patterns. On a self-collected dataset (43 instances: 8 PD and 35 healthy), DTW-based classification achieved 88.89% accuracy for both KNN and LSTM. On an external dataset (294 instances: 150 healthy and 144 PD with varying severity), KNN and LSTM achieved 71.19% and 57.63% accuracy, respectively. The proposed approach enhances PD detection through a cost-effective, non-invasive methodology, supporting early diagnosis and disease monitoring. By integrating machine learning with clinical insights, this study demonstrates the potential of AI-driven solutions in advancing PD screening and management.
1. Introduction
Parkinson’s disease (PD) is a progressive neurodegenerative disorder characterized by motor symptoms such as bradykinesia, rigidity, and tremor, which significantly degrade patients’ quality of life. The clinical diagnosis and monitoring of PD traditionally rely on semi-quantitative rating scales, like the Unified Parkinson’s Disease Rating Scale (UPDRS), which are based on visual assessment and are subject to inter-rater variability and subjectivity [1]. This subjectivity, combined with the gradual onset of symptoms, can lead to diagnostic error rates of around 20% and delays in intervention [2]. Consequently, there is a strong clinical and research consensus on the need for objective, quantitative biomarkers to support early diagnosis, monitor disease progression, and evaluate therapeutic interventions [3].
In response to this need, technology-driven approaches have gained prominence. Early efforts focused on wearable sensors (e.g., accelerometers and gyroscopes) to quantify movement patterns [4]. While these methods provide high-fidelity data, they can be costly, obtrusive, and require specialized hardware, limiting their scalability for widespread screening. More recently, advancements in computer vision and machine learning have enabled non-invasive, video-based analysis of motor symptoms using consumer-grade cameras, such as those in smartphones [3]. These vision-based systems offer a highly accessible and cost-effective alternative, with the potential to facilitate remote monitoring and bring objective assessment into non-specialized clinical settings [5].
Many recent vision-based approaches employ complex deep learning (DL) models, such as Convolutional Neural Networks (CNNs) and Recurrent Neural Networks (RNNs) [6], to automatically extract features and classify PD from video data. While powerful, these “black box” models often require vast amounts of training data and can lack the interpretability needed for clinical confidence and adoption [7]. This creates a compelling research gap: the exploration of more traditional, interpretable time-series analysis techniques applied to modern, video-derived kinematic data. Such methods could offer a balance between analytical rigor and practical feasibility, potentially providing a transparent and computationally efficient pathway for PD screening.
1.1. Research Gap and Objectives
This study aims to address this gap by proposing and evaluating a non-invasive, gait-based screening framework for PD that combines human pose estimation with classical time-series analysis methods. Our primary objectives are
- To extract time-series data of key body joint movements from videos of individuals walking.
- To apply and compare several well-established time-series analysis techniques—Dynamic Time Warping (DTW), Bag-of-Patterns (BoP), Symbolic Aggregate Approximation (SAX), and Shapelet-based Classification—for distinguishing between healthy and PD gait patterns.
- To evaluate the classification performance of these techniques using both a simple distance-based classifier (K-Nearest Neighbors) and a more complex temporal model (Long Short-Term Memory network), thereby assessing the trade-offs between model complexity and performance on this specific task.
By focusing on interpretable methods and accessible technology, this work investigates the feasibility of developing a low-cost, objective tool to support the early screening and monitoring of Parkinson’s disease.
1.2. Related Work
The automated analysis of Parkinsonian gait has evolved along two primary technological pathways: methods utilizing wearable sensors and those based on computer vision [8,9,10]. Recent systematic reviews highlight a surge in research, particularly leveraging deep learning, across both domains to provide objective, quantitative biomarkers for PD assessment. This section provides a thematic overview of these approaches, discussing key studies and the current state of the art.
1.2.1. Sensor-Based Approaches
Wearable sensors, such as accelerometers, gyroscopes, and vertical ground reaction force (VGRF) sensors, offer high-fidelity data for quantifying movement [11]. These devices can capture detailed spatiotemporal gait parameters, making them valuable for clinical research. For instance, Escamilla-Luna et al. (2022) used smartphone accelerometers (iPhone 5s) to extract 56 gait characteristics from accelerometer data obtained at each patient’s left and right ankle [12]. Balaji et al. (2021) utilized VGRF sensors with an LSTM network to capture spatiotemporal aspects of the gait cycle, achieving high accuracy in both binary (98.60%) and multi-class (96.60%) PD diagnosis [13]. Similarly, Hssayeni et al. (2018) developed an LSTM-based algorithm to assess medication states from wearable sensor data, achieving accuracies of 73–77% and highlighting the potential for neurologists to adjust medication based on objective data [14]. Prince & De Vos (2018) also used smartphone sensor data, extracting 91 features from tapping tests and accelerometers for classification [15]. However, a primary limitation of sensor-based methods is their reliance on specialized or body-worn hardware, which can be costly and obtrusive, potentially altering a user’s natural gait and limiting scalability for widespread remote screening [16].
Recent studies continue to refine these methods. A 2024 study by Panda and Bhuyan demonstrated the effectiveness of ensemble machine learning models on VGRF datasets for PD detection [17]. Another 2023 study by Abujrida et al. utilized data from smartphone accelerometers and gyroscopes from a large cohort of 456 subjects to predict medication adherence, showcasing the potential of ubiquitous sensors in daily life monitoring [18]. The trend is moving towards integrating multimodal sensor data to create more robust and comprehensive patient profiles [19].
1.2.2. Vision-Based Approaches
As a low-cost and non-invasive alternative, vision-based gait analysis has gained significant traction [20]. These methods typically use standard video cameras (including smartphones) and apply human pose estimation (HPE) algorithms like OpenPose or MediaPipe to extract skeletal key points, from which kinematic time-series data are derived [21]. Early work in this area demonstrated feasibility. Ajay et al. (2018) analyzed features like shuffling steps and gait asymmetry from YouTube videos using a binary decision tree [16]. Urcuqui et al. (2018) used a Kinect system to capture spatiotemporal variables, which were then used to differentiate between individuals with and without PD [22]. Li et al. (2018) employed an LSTM on 2D camera footage of the Timed Up and Go (TUG) test to automatically segment and analyze gait sub-tasks [23]. Other approaches have focused on different motor symptoms, such as the work by Liu et al. (2019), who analyzed hand movements by extracting features from sequences of hand joint locations [24].
More recent studies have explored a variety of techniques. Seo et al. (2022) utilized the Short-Time Auto Correlation Function (ST-ACF) to extract high-resolution movement features, pairing it with DTW to account for variations in gait speed [25]. Reyes et al. (2019) deployed a 1D CNN to automatically extract features from temporal signal data, achieving 83.1% accuracy with a Conv-LSTM model [26].
A major theme in recent literature is the trade-off between complex “black box” deep learning models and simpler, more interpretable methods. While many deep learning models, such as the Conv1D-LSTM hybrid used by Reyes et al. (2019) [26], show promise, they often require large datasets and can lack clinical transparency. In contrast, a landmark 2024 study from UCSF by Deng et al. developed an interpretable machine learning framework using short video clips from consumer-grade devices [19]. By focusing on a small set of clinically meaningful features, their models achieved robust performance while providing clear insights into which motor characteristics (e.g., arm swing and finger movement variability) were most predictive of PD severity, thereby enhancing clinical trust.
Concurrently, research into advanced deep learning architectures continues to push the boundaries of accuracy. A 2025 study by Wu et al. employed Spatio-Temporal Graph Convolutional Networks (ST-GCNs), which explicitly model the skeletal structure, achieving a classification accuracy of 93.48% [5]. This highlights that, while interpretable models offer immediate clinical relevance, more complex architectures may hold the key to higher performance, provided they can be validated on large, diverse datasets to ensure generalizability beyond controlled lab settings. A summary of the literature review is provided in Table 1.

Table 1.
Comparative table for literature reviews.
2. Materials and Methods
The processes for PD classification and prediction employed in this study are depicted in Figure 1. The workflow includes the following five main components: data collection, video enhancement, body key-point estimation, data processing using time-series analysis, and classification. The system records videos to obtain the required data. Body key points are then taken from the video that was captured. The data that have been preprocessed are used for time-series analysis. Finally, both methods are used in the classification step to differentiate between individuals with PD and healthy individuals.
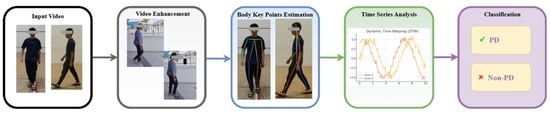
Figure 1.
Flow diagram of the proposed method.
2.1. Data Collection
This study utilized two distinct datasets to develop and evaluate the classification models: a self-collected clinical dataset and a publicly sourced online dataset. This dual-dataset approach allows for initial model training in a semi-controlled environment and subsequent testing on more variable data.
2.1.1. Self-Collected Dataset (MMU Parkinson Disease Dataset)
- Ethical Approval and Informed Consent: The data collection protocol received full ethical approval from the Multimedia University Research Ethics Committee (Approval Number: EA0422022). All participants, including healthy controls and patients with PD, provided written informed consent prior to their involvement. The research objectives, procedures, and voluntary nature of participation were thoroughly explained, and any questions were addressed before the recording session.
- Participant Recruitment and Demographics: A total of 43 video instances were collected. The cohort included 35 healthy individuals recruited at Multimedia University (MMU) and 8 patients with a formal clinical diagnosis of PD from the University of Malaya Medical Centre (UMMC). The participant pool was diverse, aged between 20 and 80 years, and included individuals from the primary ethnic groups in the region (Malay, Chinese, and Indian). The healthy group was further divided into a young group (n = 21) and an elderly group (n = 22) to account for age-related variations in gait.
- Data Collection Protocol: The data acquisition setting is depicted in Figure 2. All participants performed the Timed Up and Go (TUG) test [27], a standardized clinical assessment of mobility and fall risk. Participants were instructed to rise from a standard armchair, walk a distance of 3 m at a comfortable pace, turn around, walk back to the chair, and sit down (refer Figure 3). The entire sequence was recorded using a high-quality camera (1080p resolution and 30 frames per second) from both frontal and side perspectives to ensure a comprehensive capture of movement dynamics. Some example captures of the TUG test are illustrated in Figure 4.
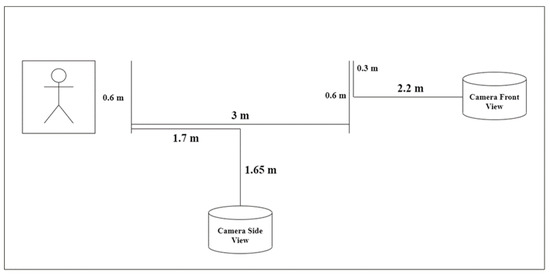 Figure 2. Data acquisition setting.
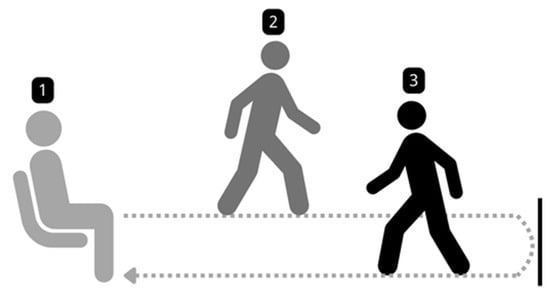 Figure 3. Walking setup for the TUG test.
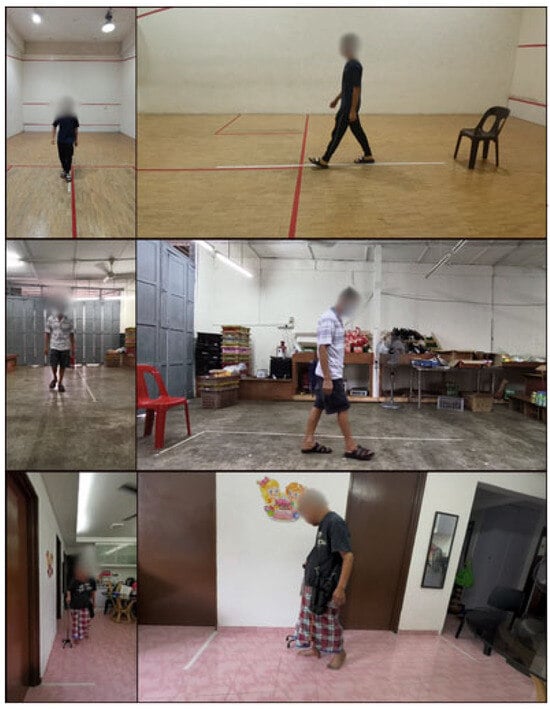 Figure 4. Sample capture from the TUG test.
 - Data Collection Challenges: Several challenges were encountered during data collection. Some healthy participants expressed hesitation due to shyness, while some families required reassurance regarding the study’s legitimacy. Among the elderly cohort, pre-existing health conditions were a common reason for non-participation. Additionally, logistical challenges such as space constraints in participants’ homes required cooperation from families to create a suitable environment for the TUG test.
2.1.2. Online Dataset Curation and Ethical Considerations
- Dataset Sourcing and Labeling: To test model robustness on highly variable data, an online dataset was compiled by sourcing 294 videos from YouTube using search terms such as “Parkinson’s walk,” “PD gait”, and “Parkinson’s patient walking.” The videos were labeled as ‘PD’ (n = 144, subdivided into mild, moderate, and severe where specified) or ‘healthy’ (n = 150) based on information explicitly provided by the original uploaders in the video title, description, or on-screen text. Some example captures of the online dataset are depicted in Figure 5.
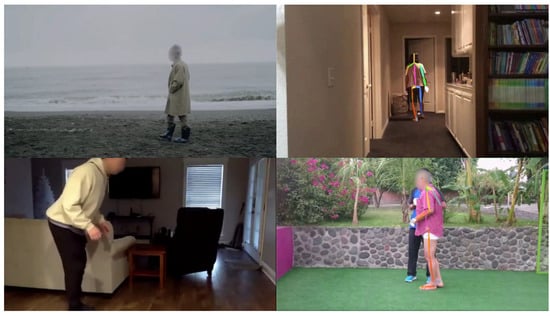 Figure 5. Sample capture of online dataset.
 - Screening and Preprocessing: From the initial 294 videos, a significant portion was excluded during a rigorous screening process. Exclusion criteria included
- Poor video quality (e.g., low resolution, excessive motion blur, or unstable camera).
- Presence of confounding factors that would interfere with gait analysis (e.g., subjects receiving physical assistance and use of walking aids like canes or walkers).
- Video segments being too short to capture a full gait cycle.
- Obscured views of the lower limbs. After this screening, 59 videos were deemed suitable for the automated analysis pipeline.
- Ethical Considerations: The use of publicly available data from platforms like YouTube for medical research requires careful ethical consideration [28]. While the data are public, individuals may not have explicitly consented to their videos being used for research purposes. In accordance with ethical guidelines, we have taken the following steps:
- No attempt was made to identify the individuals in the videos.
- All data were anonymized during analysis.
- We only report aggregated results to protect privacy.
- We acknowledge that this approach has significant limitations, including the lack of verified clinical diagnoses, unknown medication status, and an inherent self-selection bias in the data. These limitations are discussed further in Section 4.1. This portion of the study is intended as an exploratory analysis to test model robustness on highly variable data, rather than for drawing clinical conclusions.
2.2. Video Enhancement
As there is no constraint imposed on the background during the video capturing process, the video may contain noises that may disrupt the subsequent video processing steps. To mitigate this, background subtraction is performed using the PixelLib 1.0 library [29]. This method employs a deep learning-based segmentation model to distinguish the foreground from the background, effectively removing unnecessary elements. Additionally, a Gaussian blur is applied to the background while preserving the clarity of detected individuals in the frames. This approach minimizes background interference, enhancing the accuracy of feature extraction and analysis. The preprocessing time is approximately equal to the duration of the video itself (e.g., a 30 s video takes about 30 s to process). Figure 6 illustrates the improved video output where obstacles or noise on the floor highlighted by the red bounding box have been successfully removed.
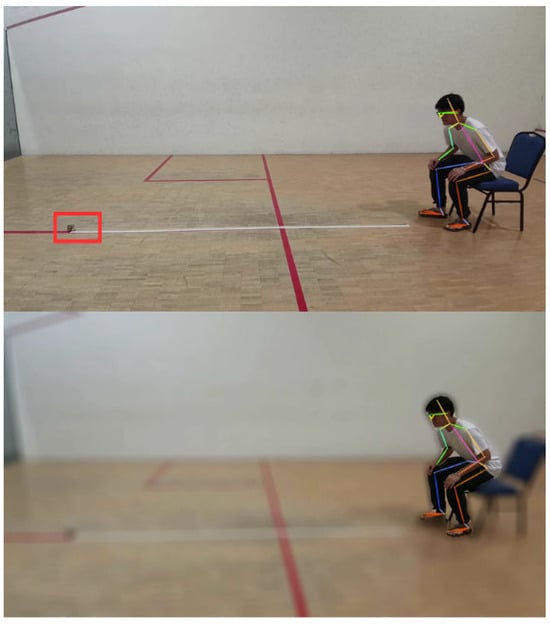
Figure 6.
Background noise affects AlphaPose Estimation.
2.3. Body Key Points Estimation
To estimate the participant’s body key point, AlphaPose [30] is applied in this study. AlphaPose is a sophisticated method for estimating and tracking whole-body poses in multi-person scenarios. It excels in real-time, local, and multi-person posture estimation tasks. It is an open-source solution that can produce high mean average precision (mAP) on benchmark datasets, such as COCO. The capabilities of AlphaPose extend to applications in computer vision, human–computer interaction, and other domains that require exact human pose information. This study utilizes the model ZOO trained on the Halpe Full-Body Human Key points and HOI-Det dataset [30] to extract 26 key points related to the body movements, including nose, left eye, right eye, left ear, right ear, left shoulder, right shoulder, left elbow, right elbow, left wrist, right wrist, left hip, right hip, left knee, right knee, left ankle, right ankle, head, neck, hip, left big toe, right big toe, left small toe, right small toe, left heel, and right heel. The application of this model provides more detailed information, particularly in the estimation of foot movements [30]. Figure 7 presents a sample for body key points estimated by AlphaPose.
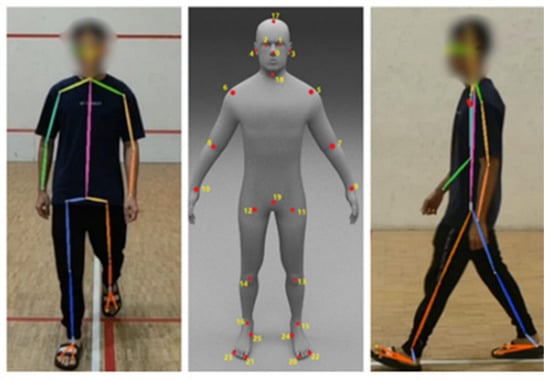
Figure 7.
Sample of AlphaPose Estimation.
While the model performed well in obtaining accurate key point information, it is crucial to highlight that several difficulties were experienced throughout its use. Specifically, there were instances where the model displayed errors, resulting in misalignment or misplacement of key points. This might result in a key point being misplaced in another position. Figure 8 illustrates some examples of misplaced key points.
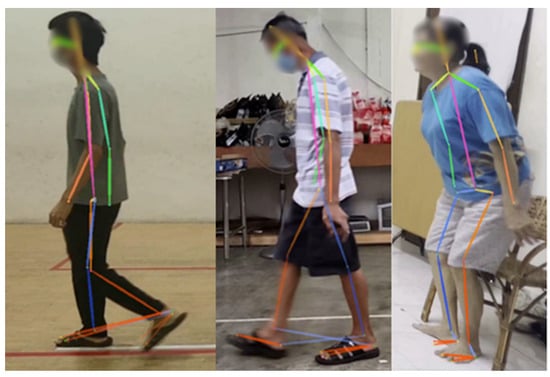
Figure 8.
Misplacement of key points.
2.4. Time-Series Data Preprocessing
Following the extraction of 2D coordinates for 26 body key points from each video frame, a preprocessing pipeline was implemented to convert this raw data into a format suitable for time-series analysis. The sequence of these scalar distance values, ordered chronologically by frame, formed a univariate time-series vector. Each vector represents the change in distance between a joint pair over the duration of the walking sequence. These vectors served as the direct input for the time-series analysis methods (DTW, BoP, SAX, and Shapelet) and the classification models.
2.4.1. Dynamic Time Warping (DTW)
DTW is a robust method for comparing time series that show variation in speed. For example, two time series may have similar overall patterns, but one may have a longer duration than the other. DTW can align the time-series data to obtain a similarity score. This method is especially useful for classification tasks that include challenging temporal alignment. Having this ability is essential in PD classification, as gait speed and rhythm can vary greatly among individuals. The sample graph in Figure 9 shows two time series that may have differences in timing but indicate similar patterns. DTW synchronizes these series in time to calculate a similarity score. DTW is defined by
where represents the distance between points from series A and from series B. The total is calculated by considering all points in the optimum alignment path.
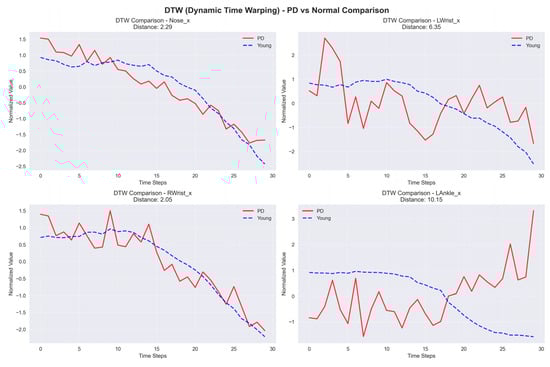
Figure 9.
Sample graph of Dynamic Time Warping (DTW).
2.4.2. Shapelet-Based Classification
Shapelet-based Classification is a method that detects sub-sequences, known as shapelets, in a time series that accurately indicates the membership of a particular class. This approach identifies the most optimal shapelets that closely fit a given time series to classify it. Within the context of PD, particular patterns or shapes found in gait data can serve as indicators of the disease. Therefore, Shapelet-based Classification is a useful technique for classifying between healthy instances and PD patient. The sample graph in Figure 10 shows a time series with a unique red region that represents a shapelet. The shapelets show membership in a specific class and are used to classify an entire time series. The distance between a shapelet s and time series T is computed as
where m represents the length of the shapelet and time series.
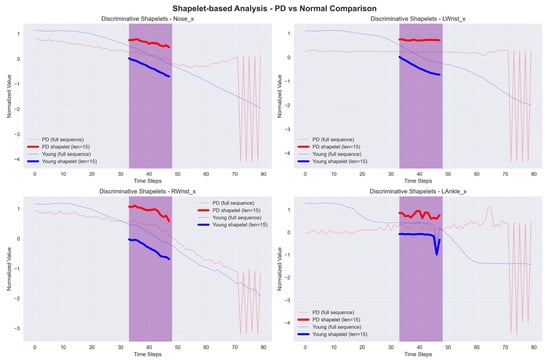
Figure 10.
Sample graph of Shapelet-based Classification example.
2.4.3. Bag-of-Patterns (BoP)
BoP models also involve the change in time-series data into symbolic representations, like SAX. However, BoP enhances this method by creating a “bag” of patterns that captures the frequency and distribution of these symbolic representations in the time series. This approach utilizes the abilities of conventional machine learning algorithms to classify time-series data by analyzing the distribution of patterns. As a result, it becomes a reliable tool to recognize PD. The bar chart in Figure 11 shows the frequency distribution of SAX symbols in a time series. The distribution is used by BoP to generate a ‘bag’ of patterns, which allows for classification based on the existence and organization of these symbols.
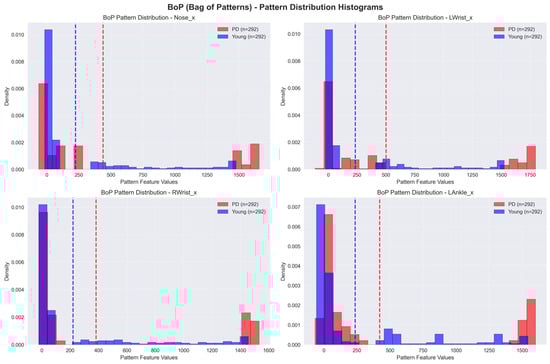
Figure 11.
Sample graph of Bag-of-Patterns (BoP). The dotted lines represent the mean of the feature values.
2.4.4. Symbolic Aggregate ApproXimation (SAX)
SAX transforms time-series data into symbolic representations, simplifying the application of traditional data mining and machine learning methods for classification. SAX simplifies the data by converting continuous data into discrete symbols, thus reducing complexity while maintaining important patterns. This approach enables fast and accurate classification, allowing for the detection of anomalies in walking patterns associated with PD. The sample graph in Figure 12 shows a time series, where the red dots reflect its SAX representation. SAX transforms the continuous time series into symbolic representations to make analysis easier.
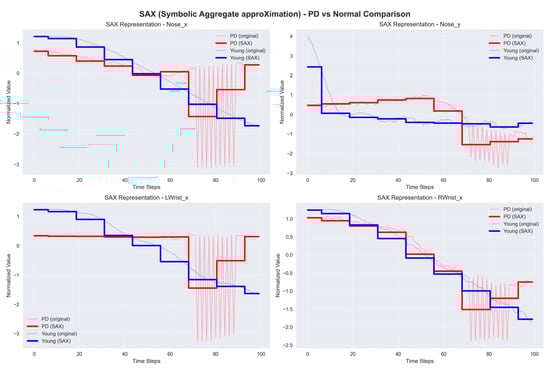
Figure 12.
Sample graph of Symbolic Aggregate approXimation (SAX).
- represent the symbolic representation of the series;
- represent the threshold;
- represents the corresponding symbol.
2.5. Classifier Implementation and Hyperparameter Tuning
The time-series data were used to train and evaluate two distinct classifiers: K-Nearest Neighbors (KNN) and a Long Short-Term Memory (LSTM) network. For all experiments, the datasets were split into an 80% training set and a 20% testing set. To identify the optimal configuration for each method, a hyperparameter tuning process was conducted. The best-performing parameters for each combination of method, classifier, and dataset were identified and are presented in Table 2. These optimal parameters were used for the final model training and evaluation reported in the Section 3.
Table 2.
Optimal hyperparameters identified through tuning.
Given the class imbalance in the self-collected dataset (35 healthy vs. 8 PD), we report the F1-score in addition to accuracy, as it provides a more robust measure of performance by balancing precision and recall. No explicit class balancing techniques, such as oversampling or undersampling, were applied in this study to establish baseline performance.
3. Results
This study evaluates the performance of K-Nearest Neighbors (KNN) and Long Short-Term Memory (LSTM) models for time series classification using various feature extraction methods on two distinct datasets: a self-collected dataset and an online dataset. The data in both sets was split into 80% for training and 20% for testing.
3.1. Performance on the Self-Collected Dataset
On the self-collected dataset, most models achieved a high accuracy of 88.89%. The performance metrics for all applied methods are summarized in Table 3. The models accuracy plot, performance metrics heatmap and confusion matrix comparisons are depicted in Figure 13, Figure 14, and Figure 15, respectively. While accuracy was consistently high, the precision (44.44%) and recall (50.00%) for the top-performing methods were modest, suggesting potential overfitting or noise in the data. Methods like Dynamic Time Warping (DTW) and Symbolic Aggregate approXimation (SAX) provided equal benefits to both KNN and LSTM classifiers. The Bag-of-Patterns (BoP) method was a notable exception, where KNN (85.71% accuracy) significantly outperformed LSTM (71.43% accuracy). The reduced performance of LSTM with BoP suggests this method may not preserve the temporal sequences that LSTM relies on.
Table 3.
Comparative model performance on self-collected dataset.
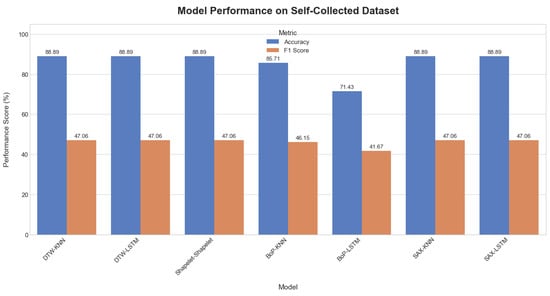
Figure 13.
Comparative plot of model accuracy and F1-scores on the self-collected dataset.
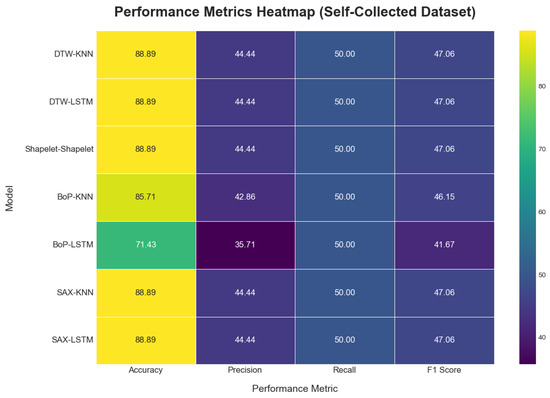
Figure 14.
Model performance metric heatmap on the self-collect dataset.
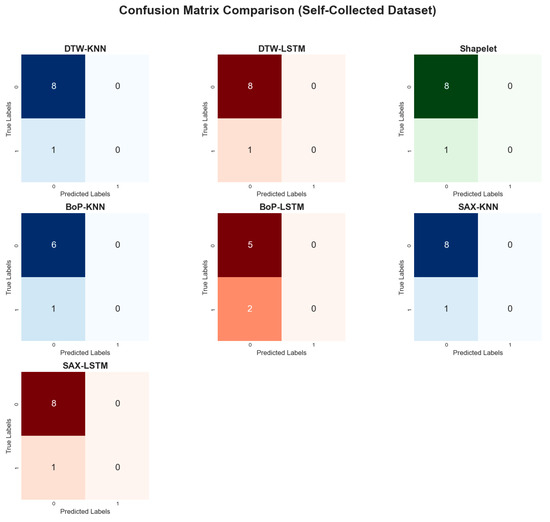
Figure 15.
Comparative confusion matrices on the self-collected dataset.
3.2. Online Dataset
When applied to the online dataset, model performance was generally lower and more varied, as shown in Table 4. The visual representations of the results are provided in Figure 16, Figure 17 and Figure 18. This is likely due to greater complexity, noise, and variability in this dataset compared to the self-collected one. The DTW method with KNN achieved the highest accuracy at 71.19%. In contrast, the Shapelet-based Classification and SAX methods performed poorly, with accuracies of only 42.37%. This suggests that patterns identified by these methods in the self-collected data did not generalize well to the more complex online dataset.
Table 4.
Comparative model performance on online dataset.
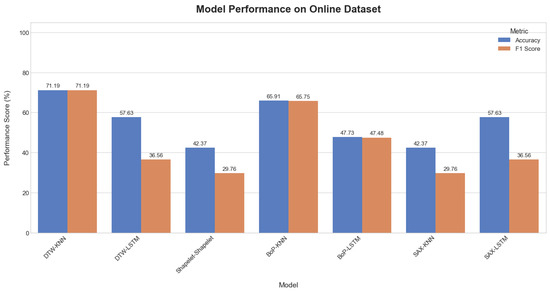
Figure 16.
Comparative plot of model accuracy and F1-scores on the online dataset.
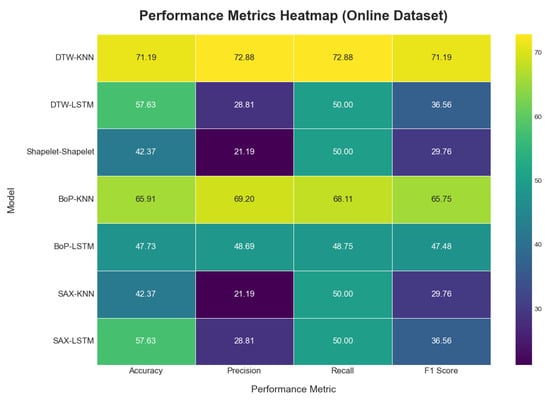
Figure 17.
Model performance metric heatmap on the online dataset.
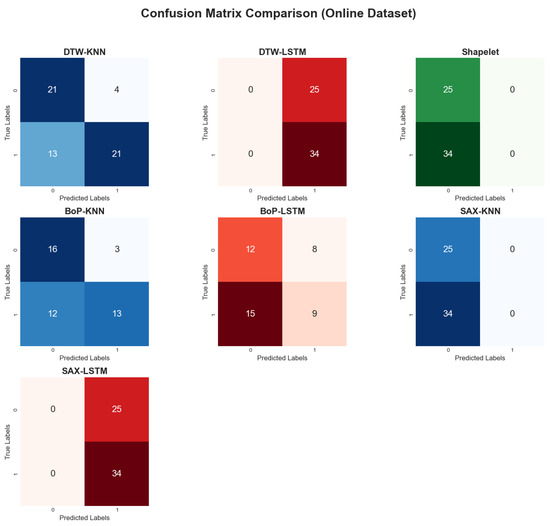
Figure 18.
Comparative confusion matrices on the online dataset.
Across most methods, the KNN classifier consistently outperformed the LSTM classifier. For instance, with the BoP method, KNN achieved an accuracy of 65.91% while LSTM only reached 47.73%. This trend suggests that the simpler KNN model was more robust to noise and less prone to overfitting on this challenging dataset.
3.3. Computational Performance
To evaluate the practical feasibility and computational demands of the proposed methods, we measured the average processing time per video instance. The analysis was conducted on a desktop computer equipped with an AMD Ryzen 5 8400F 6-Core Processor, 32 GB of RAM, and an NVIDIA RTX 5060 Ti GPU. The results, encompassing both feature extraction and classification stages for each pipeline, are summarized in Table 5.
Table 5.
Computational time analysis (in seconds).
The analysis reveals significant differences in computational efficiency. The combination of Bag-of-Patterns (BoP) with a KNN classifier is exceptionally fast, processing instances in under 5 milliseconds, making it highly suitable for real-time applications. In general, KNN-based classifiers consistently demonstrated faster inference times across all feature types compared to their LSTM counterparts.
Conversely, the Shapelet-based Classification method proved to be computationally prohibitive. The high processing time is dominated by the initial shapelet discovery phase, which took over 500 s for the self-collected dataset. While shapelets offer high interpretability, this extreme computational cost renders the method impractical for rapid screening purposes in its current form. These results highlight a critical trade-off between model complexity, interpretability, and computational speed.
4. Discussion
This study demonstrates the potential of using classical time-series analysis techniques on video-derived kinematic data for the non-invasive screening of Parkinson’s disease. Our findings indicate that methods like DTW and BoP, when paired with a simple KNN classifier, can achieve promising classification accuracy, particularly on a controlled, self-collected dataset (up to 88.89%). However, performance varied significantly across datasets and models, providing several key points for discussion.
- The Efficacy of Feature Engineering vs. End-to-End Learning: A central finding of this study is the superior performance of the KNN classifier over the LSTM network, especially on the more challenging online dataset (e.g., 71.19% accuracy for KNN-DTW vs. 57.63% for LSTM-DTW). This result is somewhat counterintuitive, as LSTMs are specifically designed to capture complex temporal dependencies. We hypothesize this discrepancy stems from two primary factors. First, the limited size and high noise level of our datasets were likely insufficient for the LSTM to learn robust, generalizable patterns, leading to overfitting. Second, methods like DTW and BoP perform an implicit and powerful form of feature engineering. DTW’s alignment process effectively normalizes temporal variations (e.g., walking speed), while BoP’s symbolic representation quantifies the frequency of characteristic sub-patterns. This preprocessed, feature-rich input appears to be more suitable for a simple distance-based classifier like KNN than the raw (or minimally processed) time series fed to the LSTM. This aligns with recent findings suggesting that, for smaller, noisy clinical datasets, models built on carefully engineered, interpretable features can outperform complex “black box” models.
- Performance Discrepancy, Overfitting, and False Positives: The marked drop in performance from the self-collected dataset to the online dataset highlights the critical challenge of model generalization and suggests significant overfitting on the training data. The high accuracy on the self-collected test set, coupled with low precision and recall, indicates that the models likely memorized patterns from the small and highly imbalanced training set (35 healthy vs. 8 PD). This led to a high number of false positives, as the models struggled to generalize to the wider variety of gaits present in the unseen healthy controls. The BoP-KNN combination was a notable exception on the online dataset, likely because the BoP method abstracts the time series into a simpler, noise-resistant histogram of patterns, which is less susceptible to overfitting than methods that analyze the full temporal sequence.
- Comparison with State of the Art: While our approach is not directly comparable to all studies due to different datasets and tasks, our best-performing models achieve accuracies that are in a similar range to some other non-deep-learning and early deep learning approaches reported in the literature. However, recent studies using more advanced deep learning architectures, such as Spatio-Temporal Graph Convolutional Networks (ST-GCNs), have reported accuracies exceeding 93% on gait classification tasks [5]. This suggests that, while our classical time-series approach is a feasible proof-of-concept, significant improvements in accuracy would likely require more sophisticated models that can better leverage the spatiotemporal structure of the human skeleton.
4.1. Limitations
Despite the promising results, this study has several important limitations.
- Dataset Size and Composition: The most significant limitation is the small size and imbalanced nature of our datasets. The self-collected dataset included only 8 PD patients, which severely limits the statistical power and generalizability of the findings. The online dataset, while larger initially, was reduced to 59 usable videos after screening, and suffered from a lack of clinical verification and demographic information.
- Validation Method: The use of a simple 80/20 train–test split, while acceptable for a preliminary study, is not as robust as methods like k-fold cross-validation, especially given the small sample size. This may have contributed to the observed overfitting.
- Ethical and Qualitative Constraints of Public Data: The use of uncontrolled YouTube data introduces significant ethical and qualitative issues, including the absence of informed consent and verified diagnoses. This dataset should be viewed as a tool for testing model robustness against noise, not for clinical validation.
- Pose Estimation Errors: While AlphaPose is a state-of-the-art tool, errors in key point estimation (e.g., misplacements and jitter) can occur, especially in videos with poor lighting, unusual camera angles, or occlusions. These errors introduce noise into the kinematic time series, which can negatively impact classification performance.
- Simplified Model Architectures: The classifiers used (KNN and a basic LSTM) are relatively simple. We did not explore more advanced architectures or optimization techniques that might yield higher performance.
4.2. Future Research
Based on these limitations, we propose several concrete directions for future research to build upon this work.
- Dataset Expansion and Robust Validation: The highest priority is the collection of a larger, more diverse, and well-annotated dataset through multi-site collaborations. Future analyses must also incorporate more robust validation techniques, such as k-fold cross-validation, to ensure the generalizability and statistical significance of the findings.
- Data Augmentation: We will explore data augmentation techniques to synthetically increase the size and variability of our training data. Simple yet effective methods for time-series augmentation include jittering (adding random noise), scaling (altering signal magnitude), and time warping (stretching or compressing the time axis) [31]. For greater biomechanical fidelity, future work could investigate advanced physics-based simulation frameworks like OpenSIM to generate realistic, novel gait sequences [32,33].
- Exploration of Advanced Models: Future work should evaluate more complex and domain-specific models. Spatio-Temporal Graph Convolutional Networks (ST-GCNs) are particularly promising, as they operate directly on skeletal graph data [5]. Additionally, benchmarking against state-of-the-art architectures like Vision Transformers (ViTs), which have shown excellent performance in pattern recognition, will be crucial [34].
- Multimodal Data Fusion: To create a more comprehensive diagnostic model, we plan to integrate our gait analysis with other data modalities. Combining video-based gait features with data from voice analysis, handwriting analysis, or wearable sensors could provide a more holistic and robust assessment of PD motor symptoms.
- Clinical Validation: Ultimately, any proposed model must be validated in a real-world clinical setting against neurologist ratings on a large, prospective patient cohort. This is the critical next step to translate this proof-of-concept research into a clinically meaningful tool.
4.3. Clinical Significance and Translational Potential
While the proposed methods are not yet ready for deployment as a clinical diagnostic tool, this study holds significant translational potential as a proof-of-concept for a low-cost, accessible pre-screening system. The primary clinical advantage of this approach is its minimal hardware requirement: a single consumer-grade camera. This stands in stark contrast to sensor-based systems that require specialized equipment or clinical-grade motion capture labs.
Such a tool could be particularly valuable in primary care or community settings where neurological specialists are not readily available. It could function as an objective warning system, identifying individuals with gait patterns suggestive of parkinsonism and prompting a referral for a full clinical evaluation. This aligns with the broader push in digital health to develop tools that can aid in the early detection of neurodegenerative diseases, potentially leading to earlier intervention and better patient management. Furthermore, the use of interpretable methods like DTW, whose distance scores can be visualized and understood, offers an advantage over opaque “black box” models, potentially increasing clinical trust and adoption. The goal of such a system is not to replace clinicians but to augment their capabilities, providing objective, quantitative data to support their decision-making process.
5. Conclusions
In conclusion, this study successfully demonstrates the feasibility of using classical time-series analysis techniques for the non-invasive, video-based screening of Parkinson’s disease. Our findings highlight that methods emphasizing feature engineering, such as Dynamic Time Warping (DTW) and Bag-of-Patterns (BoP), when paired with a computationally efficient K-Nearest Neighbors (KNN) classifier, can effectively differentiate between healthy and PD gait patterns. Notably, these simpler approaches proved more robust and accurate than a more complex Long Short-Term Memory (LSTM) network, particularly on a noisy, uncontrolled online dataset. This suggests that, for smaller clinical datasets, well-chosen feature extraction is critical. While the study faced limitations regarding dataset size, the results establish a strong proof-of-concept. Future work will focus on expanding the dataset, exploring advanced models like ST-GCNs, and pursuing clinical validation to translate this accessible screening methodology into a tangible tool for early PD detection and monitoring.
Author Contributions
Conceptualization, T.C. and M.K.O.G.; methodology, H.C. and N.I.S.; software, H.C.; validation, H.C., A.A.-K. and M.F.; formal analysis, H.C.; data curation, H.C., N.I.S. and V.W.S.T.; writing—original draft preparation, H.C.; writing—review and editing, T.C., V.W.S.T., M.K.O.G., N.I.S., A.A.-K. and M.F.; supervision, T.C. and N.I.S.; funding acquisition, T.C. and A.A.-K. All authors have read and agreed to the published version of the manuscript.
Funding
This research is supported by Multimedia University—Al-Zaytoonah University of Jordan Matching Grant (Project ID: MMUI/240092).
Data Availability Statement
The data used in this study can be downloaded from Kaggle MMU Parkinson’s Disease Dataset (DOI: https://doi.org/10.34740/kaggle/dsv/12473275).
Acknowledgments
This work was supported in part by research grants from Multimedia University—Al-Zaytoonah University of Jordan Matching Grant (MMUI/240092).
Conflicts of Interest
The authors declare no conflicts of interest.
References
- Goetz, C.G.; Tilley, B.C.; Shaftman, S.R.; Stebbins, G.T.; Fahn, S.; Martinez-Martin, P.; Poewe, W.; Sampaio, C.; Stern, M.B.; Dodel, R.; et al. Movement Disorder Society-sponsored Revision of the Unified Parkinson’s Disease Rating Scale (MDS-UPDRS): Scale Presentation and Clinimetric Testing Results. Mov. Disord. 2008, 23, 2129–2170. [Google Scholar] [CrossRef]
- Rizzo, G.; Copetti, M.; Arcuti, S.; Martino, D.; Fontana, A.; Logroscino, G. Accuracy of Clinical Diagnosis of Parkinson Disease. Neurology 2016, 86, 566–576. [Google Scholar] [CrossRef]
- Franco, A.; Russo, M.; Amboni, M.; Ponsiglione, A.M.; Di Filippo, F.; Romano, M.; Amato, F.; Ricciardi, C. The Role of Deep Learning and Gait Analysis in Parkinson’s Disease: A Systematic Review. Sensors 2024, 24, 5957. [Google Scholar] [CrossRef]
- Alarfaj, M.; Al Madini, A.; Alsafran, A.; Farag, M.; Chtourou, S.; Afifi, A.; Ahmad, A.; Al Rubayyi, O.; Al Harbi, A.; Al Thunaian, M. Wearable Sensors Based on Artificial Intelligence Models for Human Activity Recognition. Front. Artif. Intell. 2024, 7, 1424190. [Google Scholar] [CrossRef] [PubMed]
- Wu, J.; Su, N.; Li, X.; Yao, C.; Zhang, J.; Zhang, X.; Sun, W. Insights into Gait Performance in Parkinson’s Disease via Latent Features of Deep Graph Neural Networks. Front. Neurol. 2025, 16, 1567344. [Google Scholar] [CrossRef] [PubMed]
- Alzubaidi, L.; Zhang, J.; Humaidi, A.J.; Al-Dujaili, A.; Duan, Y.; Al-Shamma, O.; Santamaría, J.; Fadhel, M.A.; Al-Amidie, M.; Farhan, L. Review of Deep Learning: Concepts, CNN Architectures, Challenges, Applications, Future Directions. J. Big Data 2021, 8, 53. [Google Scholar] [CrossRef] [PubMed]
- Amann, J.; Vetter, D.; Blomberg, S.N.; Christensen, H.C.; Coffee, M.; Gerke, S.; Gilbert, T.K.; Hagendorff, T.; Holm, S.; Livne, M.; et al. To Explain or Not to Explain?—Artificial Intelligence Explainability in Clinical Decision Support Systems. PLOS Digit. Health 2022, 1, e0000016. [Google Scholar] [CrossRef]
- Iwana, B.K.; Uchida, S. An Empirical Survey of Data Augmentation for Time Series Classification with Neural Networks. PLoS ONE 2021, 16, e0254841. [Google Scholar] [CrossRef]
- Ashfaq, N.; Khan, M.H.; Nisar, M.A. Identification of Optimal Data Augmentation Techniques for Multimodal Time-Series Sensory Data: A Framework. Information 2024, 15, 343. [Google Scholar] [CrossRef]
- Di Biase, L.; Di Santo, A.; Caminiti, M.L.; De Liso, A.; Shah, S.A.; Ricci, L.; Di Lazzaro, V. Gait Analysis in Parkinson’s Disease: An Overview of the Most Accurate Markers for Diagnosis and Symptoms Monitoring. Sensors 2020, 20, 3529. [Google Scholar] [CrossRef]
- Tahir, A.M.; Chowdhury, M.E.H.; Khandakar, A.; Al-Hamouz, S.; Abdalla, M.; Awadallah, S.; Reaz, M.B.I.; Al-Emadi, N. A Systematic Approach to the Design and Characterization of a Smart Insole for Detecting Vertical Ground Reaction Force (vGRF) in Gait Analysis. Sensors 2020, 20, 957. [Google Scholar] [CrossRef]
- Escamilla-Luna, O.; Wister, M.A.; Hemandez-Torruco, J. Classification algorithms for analyzing parkinson’s disease patient. In Proceedings of the 2022 30th International Conference on Software, Telecommunications and Computer Networks SoftCOM, Split, Croatia, 22–24 September 2022. [Google Scholar] [CrossRef]
- Balaji, E.; Brindha, D.; Elumalai, V.K.; Vikrama, R. Automatic and Non-Invasive Parkinson’s Disease Diagnosis and Severity Rating Using LSTM Network. Appl. Soft Comput. 2021, 108, 107463. [Google Scholar] [CrossRef]
- Hssayeni, M.D.; Adams, J.L.; Ghoraani, B. Deep Learning for Medication Assessment of Individuals with Parkinson’s Disease Using Wearable Sensors. In Proceedings of the 2018 40th Annual International Conference of the IEEE Engineering in Medicine and Biology Society (EMBC), Honolulu, HI, USA, 18–21 July 2018; pp. 1–4. [Google Scholar] [CrossRef]
- Prince, J.; De Vos, M. A Deep Learning Framework for the Remote Detection of Parkinson’s Disease Using Smart-Phone Sensor Data. In Proceedings of the 2018 40th Annual International Conference of the IEEE Engineering in Medicine and Biology Society (EMBC), Honolulu, HI, USA, 18–21 July 2018; pp. 3144–3147. [Google Scholar] [CrossRef]
- Ajay, J.; Song, C.; Wang, A.; Langan, J.; Li, Z.; Xu, W. A Pervasive and Sensor-Free Deep Learning System for Parkinsonian Gait Analysis. In Proceedings of the 2018 IEEE EMBS International Conference on Biomedical & Health Informatics (BHI), Las Vegas, NV, USA, 4–7 March 2018; pp. 108–111. [Google Scholar] [CrossRef]
- Panda, A.; Bhuyan, P. Gait Data-Driven Analysis of Parkinson’s Disease Using Machine Learning. ResearchGate 2025, 10. [Google Scholar] [CrossRef]
- Abujrida, H.; Agu, E.; Pahlavan, K. DeepaMed: Deep Learning-Based Medication Adherence of Parkinson’s Disease Using Smartphone Gait Analysis. Smart Health 2023, 30, 100430. [Google Scholar] [CrossRef]
- Deng, D.; Ostrem, J.L.; Nguyen, V.; Cummins, D.D.; Sun, J.; Pathak, A.; Little, S.; Abbasi-Asl, R. Interpretable Video-Based Tracking and Quantification of Parkinsonism Clinical Motor States. NPJ Park. Dis. 2024, 10, 122. [Google Scholar] [CrossRef]
- Yu, H.; Park, J.; Kang, K.; Jeong, S. SMAGNet: Scaled Mask Attention Guided Network for Vision-Based Gait Analysis in Multi-Person Environments. IEIE Trans. Smart Process. Comput. 2024, 13, 23–32. [Google Scholar] [CrossRef]
- Dibenedetto, G.; Sotiropoulos, S.; Polignano, M.; Cavallo, G.; Lops, P. Comparing Human Pose Estimation through Deep Learning Approaches: An Overview. Comput. Vis. Image Underst. 2025, 252, 104297. [Google Scholar] [CrossRef]
- Urcuqui, C.; Castano, Y.; Delgado, J.; Navarro, A.; Diaz, J.; Munoz, B.; Orozco, J. Exploring Machine Learning to Analyze Parkinson’s Disease Patients. In Proceedings of the 2018 14th International Conference on Semantics, Knowledge and Grid (SKG), Guangzhou, China, 12–14 September 2018; pp. 160–166. [Google Scholar] [CrossRef]
- Li, T.; Chen, J.; Hu, C.; Ma, Y.; Wu, Z.; Wan, W.; Huang, Y.; Jia, F.; Gong, C.; Wan, S.; et al. Automatic Timed Up-and-Go Sub-Task Segmentation for Parkinson’s Disease Patients Using Video-Based Activity Classification. IEEE Trans. Neural Syst. Rehabil. Eng. 2018, 26, 2189–2199. [Google Scholar] [CrossRef]
- Liu, Y.; Chen, J.; Hu, C.; Ma, Y.; Ge, D.; Miao, S.; Xue, Y.; Li, L. Vision-Based Method for Automatic Quantification of Parkinsonian Bradykinesia. IEEE Trans. Neural Syst. Rehabil. Eng. 2019, 27, 1952–1961. [Google Scholar] [CrossRef]
- Seo, J.S.; Chen, Y.; Kwon, D.Y.; Wallraven, C. Single-View, Video-Based Diagnosis of Parkinson’s Disease Based on Arm and Leg Joint Tracking. In Proceedings of the 2022 International Conference on Mechanical, Automation and Electrical Engineering (CMAEE), Chengdu, China, 16–18 December 2022; pp. 172–176. [Google Scholar] [CrossRef]
- Reyes, J.F.; Steven Montealegre, J.; Castano, Y.J.; Urcuqui, C.; Navarro, A. LSTM and Convolution Networks Exploration for Parkinson’s Diagnosis. In Proceedings of the 2019 IEEE Colombian Conference on Communications and Computing (COLCOM), Barranquilla, Colombia, 5–7 June 2019. [Google Scholar] [CrossRef]
- Timed Up and Go Test (TUG). Available online: https://www.physio-pedia.com/Timed_Up_and_Go_Test_(TUG) (accessed on 6 August 2025).
- Howe, E.G., III; Elenberg, F. Ethical Challenges Posed by Big Data. Innov. Clin. Neurosci. 2020, 17, 24–30. [Google Scholar]
- Olafenwa, A. Simplifying Object Segmentation with PixelLib Library. Available online: https://vixra.org/pdf/2101.0122v1.pdf (accessed on 13 August 2025).
- Fang, H.S.; Li, J.; Tang, H.; Xu, C.; Zhu, H.; Xiu, Y.; Li, Y.L.; Lu, C. AlphaPose: Whole-Body Regional Multi-Person Pose Estimation and Tracking in Real-Time. IEEE Trans. Pattern Anal. Mach. Intell. 2023, 45, 7157–7173. [Google Scholar] [CrossRef]
- Iglesias, G.; Talavera, E.; González-Prieto, Á.; Mozo, A.; Gómez-Canaval, S. Data Augmentation Techniques in Time Series Domain: A Survey and Taxonomy. Neural Comput. Appl. 2023, 35, 10123–10145. [Google Scholar] [CrossRef]
- (PDF) Gait Data Augmentation Using Physics-Based Biomechanical Simulation. Available online: https://www.researchgate.net/publication/372416921_Gait_Data_Augmentation_using_Physics-Based_Biomechanical_Simulation (accessed on 4 August 2025).
- Seth, A.; Sherman, M.; Reinbolt, J.A.; Delp, S.L. OpenSim: A Musculoskeletal Modeling and Simulation Framework for in Silico Investigations and Exchange. Procedia IUTAM 2011, 2, 212–232. [Google Scholar] [CrossRef]
- Xu, Y.; Zhang, J.; Zhang, Q.; Tao, D. ViTPose: Simple Vision Transformer Baselines for Human Pose Estimation. arXiv 2022, arXiv:2204.12484. [Google Scholar] [CrossRef]
Disclaimer/Publisher’s Note: The statements, opinions and data contained in all publications are solely those of the individual author(s) and contributor(s) and not of MDPI and/or the editor(s). MDPI and/or the editor(s) disclaim responsibility for any injury to people or property resulting from any ideas, methods, instructions or products referred to in the content. |
© 2025 by the authors. Licensee MDPI, Basel, Switzerland. This article is an open access article distributed under the terms and conditions of the Creative Commons Attribution (CC BY) license (https://creativecommons.org/licenses/by/4.0/).