Article

Numerical Investigation on Thermally Induced Self-Excited Thermoacoustic Oscillations in the Pipelines of Cryogenic Storage Systems

1
Key Laboratory of Air-Driven Equipment Technology of Zhejiang Province, College of Mechanical Engineering, Quzhou University, Quzhou 324000, China
2
Zhejiang Santian A/C Compressor Co., Ltd., Longquan 323700, China
3
National Engineering Research Center of Power Generation Control and Safety, School of Energy and Environment, Southeast University, Nanjing 210096, China
*
Author to whom correspondence should be addressed.
Symmetry 2025, 17(8), 1361; https://doi.org/10.3390/sym17081361
Submission received: 12 June 2025 / Revised: 14 August 2025 / Accepted: 18 August 2025 / Published: 20 August 2025
(This article belongs to the Section Engineering and Materials)

Abstract

Spacecraft and satellites are equipped with cryogenic storage systems to maintain instruments and engines at optimal operating temperatures. However, in cryogenic storage tanks, the steep temperature gradient along the pipeline (arising from sections inside and outside the tank) may induce instability in stored gases such as helium or hydrogen, leading to large-amplitude, self-excited thermoacoustic oscillations, known as Taconis oscillations. Taconis oscillations not only cause structural damage to pipelines, jeopardizing the safety of the cryogenic storage system, but also produce significant heat leakage and boil-off losses of cryogens. This study employs computational fluid dynamics (CFD) to simulate Taconis oscillations within a U-shaped cryogenic helium pipeline. The flow dynamics and acoustic field characteristics of the cryogenic helium pipeline are first analyzed. Fast Fourier transform and wavelet transform are employed to characterize the Taconis oscillations. A subsequent parametric study investigates the influence of the location and magnitude of temperature gradients on the dynamic behavior of Taconis oscillations. Simulation results reveal that the onset temperature gradient is at a minimum when the temperature gradient is applied at one-quarter of the cryogenic pipeline. To prevent the occurrence of Taconis oscillations, the transition between the warm and cold sections should be away from one-quarter of the cryogenic helium pipe. Moreover, increasing the temperature gradient leads to the emergence of multiple oscillation modes and an upward shift in their natural frequencies. This research gives deeper insights into the dynamics of thermally induced thermoacoustic oscillations in cryogenic pipelines, providing guidelines for improving the efficiency and safety of cryogenic storage systems in aerospace engineering.

1. Introduction

The storage of cryogenic liquids is of paramount importance in aerospace engineering, as these cryogens, such as liquid helium and hydrogen, are essential for high-performance propulsion systems due to their high energy density and low molecular weight. Effective cryogenic storage systems must ensure thermal stability, minimize evaporative losses, and maintain the structural integrity and reliability of aerospace vehicles under extreme operating conditions. Nevertheless, the design and construction of cryogenic storage systems involve considerable challenges, such as maintaining cryogenic temperatures or high pressures, preventing leakage, and mitigating environmental impacts. A critical issue is the occurrence of thermoacoustic oscillations (also known as Taconis oscillations [1]), which result from steep temperature gradients in cryogenic pipelines whose sections are located inside and outside the tank. These oscillations cause significant mechanical vibrations that pose safety hazards to the cryogenic vessels [2,3,4]. Moreover, they accelerate the heat leakage by enhancing thermal transfer from the surrounding environment to the cryogenic liquids [5]. The heat leakage could be ten to a thousand times greater than the normal conductive heat leakage into the system [6]. Therefore, it is imperative to develop effective mitigation strategies to suppress Taconis oscillations, thereby improving the efficiency and safety of cryogenic storage systems [7].
Over the past decades, both domestic and international researchers have conducted extensive studies on Taconis oscillations in cryogenic systems, aiming to elucidate their thermoacoustic mechanisms, validate theoretical models through experiments, and explore their impact on the performance and stability of cryogenic devices [8,9,10]. Rott [11] predicted the stability limits for thermally driven acoustic oscillations in a helium-filled tube. In the calculations, a continuous temperature distribution with an S-shaped connection between two constant wall temperatures was used to represent the mean temperature distribution along the tube. In 1993, Yazaki [12] introduced nonlinear dynamics theory to explore multifrequency phenomena and chaotic states arising from spontaneous oscillations and external disturbances. His findings highlighted how spontaneous oscillations trigger competition among different frequency modes, leading to chaotic behavior. In 1995, Tominaga [13] analyzed Taconis oscillations in a single tube from a thermodynamic viewpoint. The stability limit for helium in a tube with a variable cross-section was established and experimentally confirmed. From 2008 to 2010, Japanese scholars Shimizu [14] and Sugimoto [15] conducted numerical simulations on nonlinear self-excited Taconis oscillations in cryogenic pipes. They established a simplified one-dimensional model for the cryogenic pipe and applied the boundary layer approximation. It was found that the velocity with the boundary layer was affected by both temperature gradient and viscosity.
Taconis oscillations in thermoacoustic systems can also be explored using computational fluid dynamics (CFD), which enables the detailed analysis of flow behavior, acoustic fields, and energy conversion mechanisms under various configurations and boundary conditions [16,17,18]. In 2016, Daming Sun [19] conducted the first CFD simulations of Taconis oscillations in a cryogenic hydrogen tube and investigated the velocity profiles in both axial and radial directions. The Rott theory was employed to quantitatively analyze the distributions of acoustic power and viscous/thermal-relaxation dissipations, thus offering a comprehensive insight into the oscillatory process. In 2020, Putselyk et al. [20] outlined various techniques for mitigating thermally induced oscillations in cryogenic storage vessels. These methods included incorporating buffer volumes with restrictive elements (e.g., capillaries, porous structures, valves, or orifices), extending the warm pipe length at 300 K, and inserting wires into the warm end of the tube. In 2021, Hu et al. [21] proposed an approach to suppress cryogenic fluid oscillations by employing an external acoustic source, which effectively diminished oscillation amplitudes in cryogenic pipelines. Their study examined the influence of driving parameters on the onset of Taconis oscillations, offering valuable insights into the design of practical cryogenic systems. More recently, Matveev et al. [22] performed CFD modelling of heat transport in stacks in standing- and traveling-wave thermoacoustic systems. Their findings reveal that ideal-gas theories notably underestimate hydrogen cryocooler performance at low temperatures, particularly in traveling-wave systems. CFD with real hydrogen properties is advised below 80 K, above which the ideal-gas assumptions are sufficiently accurate.
Although Taconis oscillations in cryogenic pipes have been observed in previous experimental studies, numerical investigations into these oscillations remain relatively limited. Additionally, the effects of key parameters such as the position and magnitude of temperature gradient on the behavior of Taconis oscillations have not been fully explored. Since these oscillations can lead to structural vibrations and increased heat leakage, a more comprehensive understanding of their dynamics is crucial for ensuring the stable and efficient operation of cryogenic systems. This study employs CFD methods to investigate the dynamic characteristics of Taconis oscillations in cryogenic helium pipelines. Through detailed numerical analysis, it aims to elucidate the underlying physical mechanisms governing these oscillations and to identify the critical factors influencing their amplitude and frequency. Furthermore, this work explores potential strategies for mitigating Taconis oscillations, offering insights that contribute to the optimization of cryogenic system design, operational stability, and overall reliability. The outline of this paper is as follows. The CFD methods used to simulate Taconis oscillations are briefly introduced in Section 2. Simulation results of the Taconis oscillations and a discussion on the impact of key parameters are presented in Section 3 and Section 4. Finally, the concluding remarks are drawn in Section 5.

2. CFD Methodology

2.1. Model Description

Cryogenic storage systems have played a pivotal role in aerospace engineering since the 1950s, emerging alongside the development of liquid-propellant rockets to safely contain and manage extremely low-temperature cryogens such as liquid helium and hydrogen. The importance of cryogenic storage systems lies in enabling efficient propulsion, maintaining thermal insulation, and ensuring the structural integrity and safety of aerospace systems operating in extreme environments.
Figure 1a illustrates a cryogenic storage tank/vessel developed by Linde [23], designed for the storage and transportation of large quantities of cryogens. During operation, the cryogens vaporized within the tank are transported through narrow connecting pipes. These pipes typically span regions both inside the cryogenic environment and exposed to ambient conditions, resulting in a significant temperature gradient along the pipeline. Due to the thermoacoustic effect [24], large-amplitude oscillations of the hydrogen or helium gas are induced within the connecting pipe. A simplified schematic is shown in Figure 1b, depicting a U-shaped pipe partially immersed in the cryogenic storage tank. Due to the pronounced temperature gradient at the pipe–tank interface, large-amplitude Taconis oscillations are triggered within the U-shaped pipe. These oscillations can lead to two major concerns: structural damage to the pipeline due to excessive vibrations and the degradation of thermal insulation, resulting in increased heat leakage and loss of stored cold energy. Hence, effective measures need to be taken to prevent the Taconis oscillations from happening.
Figure 2 illustrates the 2D model of the cryogenic helium pipe investigated in this study. The 2D model is adopted due to its reduced computational cost compared with 3D models, and it has been proven effective in simulating Taconis oscillations in cryogenic pipes in previous studies [25,26,27]. As shown in Figure 2a, the system comprises a cylindrical pipe with an inner diameter D of 2.8 mm and a total length L of 1.25 m. Both ends of the cryogenic pipe are sealed. This study models the temperature profile as symmetric to the center, with constant temperatures in the hot and cold sections and a linear transition between them. In industrial cryogenic tanks, the temperature profile deviates from linearity due to transfer and sensor lines passing through insulation segments with different thermal and geometric properties [7].
Here, for simplicity, a linear approximation is used, and the temperature gradient is expressed by
Γ = T h T c / Δ x ,
where Th and Tc are the warm- and cold-section temperatures and ∆x (= 0.02 m) is the length of the linear transition section. To characterize the temperature distribution along the helium pipe, the length ratio between the warm section (l) and the cold section (L − 2l) is defined, which is
ε =   2 l / L 2 l .
As shown in Table 1, to study the impact of Γ on Taconis oscillations in the cryogenic helium pipeline, this study sets Tc at 10 K while increasing Th from 150 K to 900 K in an increment of 50 K. In this case, Γ changes from 7000 K/m to 44,500 K/m with a baseline value of 14,500 K/m. In addition, to explore the effect of ε on Taconis oscillations, l is varied between 1/6L, 1/4L, and 1/3L. In this case, ε changes between 0.5, 1, and 2 with a baseline value of 1.
Following the establishment of the 2D geometric model, ICEM CFD is used to generate high-quality structured grids. QUAD meshing is employed due to its stability, accuracy, and adaptability in complex flow scenarios. As shown in Figure 2b, to ensure successful simulation of thermoacoustic oscillations, the mesh size near the wall is kept smaller than the viscosity and thermal penetration depths. In addition, a uniform mesh distribution is applied in the x direction, while a biexponential distribution is implemented in the y direction, as illustrated in the enlarged view in Figure 2b.

2.2. Simplifications and Assumptions

In the CFD simulations, the helium inside the cryogenic pipe is assumed as an ideal gas, starting at p0 = 101,325 Pa. Its pressure p, density ρ, and temperature T are related by the ideal-gas law p = ρRgT, where Rg is the gas constant (2077 JK−1kg−1). The gravity of helium gas is neglected, and no buoyancy-driven flows are considered. Matveev et al. [22] conclude that the ideal-gas assumption may become less accurate when the temperature is below 80 K and when the acoustic field is predominantly characterized by traveling waves. In the present study, the cold section of the helium pipeline operates at a lowest temperature of 10 K, at which real-gas effects become non-negligible. In an evaluation of the compressibility factor Z = p/(ρRgT) using the generalized compressibility factor graph in Ref. [28], helium at 10 K and 101,325 Pa has a Z of approximately 0.95, indicating a slight deviation from ideal-gas behavior. According to the definition of the speed of sound, c = Z k R T , where k is the adiabatic index and R is the specific gas constant, and this deviation in Z results in only a minor impact on the calculated speed of sound and, therefore, oscillation frequency. Given the complexity and computational cost associated with incorporating real-gas models into the solver and considering that the acoustic field within the helium pipeline is predominantly governed by standing waves, the built-in ideal-gas model in Fluent was adopted for simplicity and practicality.
In this study, the temperature distribution along the helium tube is defined using a piecewise linear profile, consisting of constant-temperature regions at both the hot and cold ends and a linear gradient in the transition zone between them. A user-defined function (UDF) was developed and implemented to specify the wall temperature boundary conditions in the CFD simulations. However, in practical applications, the actual temperature distribution often deviates from this idealized linear form due to various influencing factors such as the thermal properties of surrounding materials and the system’s thermal history. For instance, in conventional open–closed tubes placed in cryogenic tanks, the temperature profile tends to be smoother, featuring a sharper gradient near the center of the transition region and more gradual changes near the ends. In industrial cryogenic systems, temperature profiles can be even more complex, especially when sensor and transfer lines pass through insulation sections with varying thermal conductivities and geometries. Despite these real-world complexities, linear approximation is adopted here to reduce computational complexity while still capturing the essential thermal characteristics.

2.3. Solution of the Governing Equations

The unsteady Reynolds-Averaged Navier–Stokes (URANS) equations are used to simulate the oscillatory flow inside the cryogenic pipe. In the Reynolds-averaging approach, flow variables are decomposed into time-averaged (mean) and fluctuating components such that φ = φ ¯ + φ , where φ ¯ and φ are the mean and fluctuating components of a scalar variable. For compressible flows, a density-weighted averaging (Favre averaging) is applied, giving φ ˜ = ρ φ ¯ / ρ ¯ and φ = φ ˜ + φ , where φ ˜ and φ are the mean and fluctuating parts according to Favre decomposition. Substituting these decompositions into the conservation equations of mass, momentum, and energy yields [29]
ρ ¯ t + ρ ¯ u ˜ i x i = 0
ρ ¯ u ˜ i t + ρ ¯ u ˜ i u ˜ j x j = p ¯ x i + x j τ ˜ i j ρ ¯ u i u j ˜
t ρ ¯ e ˜ t + x i ρ ¯ u ˜ i h ˜ t = x i κ T ¯ x i ρ ¯ u i T ˜ + 2 τ ˜ i j u ˜ j ρ ¯ u i u j ˜ u ˜ j
Here, subscripts i and j denote spatial coordinates, μ is the dynamic viscosity, κ is the thermal conductivity, and cp is the specific heat at a constant pressure. The temperature dependencies of μ and κ are modeled using Sutherland’s law. The viscous stress tensor is defined as
τ i j = μ u i x j + u j x i 2 3 μ u j x j δ i j
where δij is the Kronecker delta. The total energy and total enthalpy per unit mass are denoted by e t = e + u i u i / 2 and h t = e t + p / ρ , with e being the internal energy.
The above system of equations is not closed due to the presence of the unknown Reynolds stress tensor u i u j ˜ in Equation (4) and the turbulent heat flux u i T ˜ in Equation (5). To close the system, the Boussinesq hypothesis is adopted, modeling the Reynolds stresses as
u i u j ˜ = μ t μ τ ˜ i j + 2 3 k δ i j
where μt is the turbulent viscosity and k is the turbulent kinetic energy. The turbulent heat flux is modeled using
u i T ˜ = μ t σ T T ¯ x i
where σT denotes the turbulent Prandtl number.
Equations (3)–(5) are solved using the CFD solver ANSYS Fluent 18.1, employing a pressure-based finite volume method. The PRESTO! scheme is used for pressure interpolation, the PISO algorithm is applied for pressure–velocity coupling, and second-order discretization is adopted for both the transport and turbulence equations to ensure higher numerical accuracy. In this study, the standard k-ε turbulence model is employed to simulate the Taconis oscillations. This model is widely recognized for its robustness and computational efficiency in capturing key turbulence characteristics through two transport equations, making it well-suited for complex engineering applications. Additionally, it has been extensively applied in prior research on thermoacoustic systems [30,31,32], demonstrating good agreement with linear thermoacoustic theory. Therefore, for the sake of simplicity and to ensure consistency with established literature, the k-ε model is selected in the present work.

2.4. Simulation Strategy and Boundary Conditions

As shown in Table 2, the simulation of Taconis oscillations generally consists of two steps.
Step 1: Steady calculation. The simulation begins with modeling steady-state flow through the pipe. The domain’s left boundary is defined as a pressure inlet with a total gauge pressure of 10 Pa, while the right boundary is set as a pressure outlet at a 0 Pa gauge pressure. The helium pipe walls are maintained as isothermal, with the hot-section temperature fixed at Th and the cold section at Tc of 10 K. In the transition region, the temperature decreases linearly from Th to Tc. Convergence is achieved when the residuals for continuity, velocity components (x and y), energy, turbulent kinetic energy k, and the turbulent dissipation rate ε are below 10−6. Typically, the steady state is reached after approximately 5000 iterations, indicated by stabilized temperature, pressure, and velocity gradients within the pipe.
Step 2: Transient calculation. In the transient simulation, the boundary conditions at both ends of the domain are altered from the pressure inlet and outlet to rigid walls, which initiates a pressure pulse within the helium pipe. This change creates a closed acoustic environment, allowing the development and propagation of pressure disturbances. The temporal evolution of pressure fluctuations is carefully monitored at multiple points along the pipe to capture the dynamic behavior throughout the simulation. A fine timestep of 10−5 seconds is employed to ensure numerical accuracy and temporal resolution. The simulation proceeds until the pressure signals at the monitored locations settle into stable limit cycles, indicating steady-state constant-amplitude periodic oscillations. This process typically requires more than 30,000 timesteps.

2.5. Sensitivity Studies

Prior to analyzing the performance of the cryogenic helium pipe, sensitivity studies on the grid size and timestep size were conducted. The grid independence test plays a critical role in enhancing the credibility of simulation results and reducing uncertainty. We investigated the oscillation frequency and computational cost (in CPUhs, 1 CPUh = 1 CPU × 1 h) across different grid densities. The test results indicate that when the total number of nodes increases from 91,563 to 241,520, the oscillation frequency decreases but the computational cost increases. When the number of nodes exceeds 142,531, the relative error ER (= |φ1φ2|/|φ1|, where φ1 and φ2 are the performance metrics) in the oscillation frequency is 1.5%, as shown in Table 3. Therefore, to balance the simulation accuracy and computational cost, the optimal number of nodes of the CFD model is chosen to be 142,531.
The timestep sensitivity test is also crucial in improving the credibility of simulation results by assessing how different timestep sizes affect the performance metrics. In the timestep independence test, we investigated the oscillation frequency and computation cost across different timestep sizes, ranging from 0.5 × 10⁻⁵ s to 2.0 × 10⁻⁵ s. It was found that a timestep size of 2.0 × 10⁻⁵ s did not achieve limit-cycle oscillations. When the timestep size decreases, the oscillation frequency and computation cost all increase. Specifically, when the timestep size is reduced to 1.0 × 10⁻⁵ s, the relative error in oscillation frequency is 2.1%, as shown in Table 3. Hence, to achieve a balance between simulation accuracy and computational efficiency, an optimal timestep of 1.0 × 10⁻⁵ s is selected.

2.6. Comparison with Existing Literature

To validate the CFD model developed in this study, experimental data reported by Shenton et al. [33,34,35] were utilized. Their experiments investigated Taconis oscillations in constant-diameter, U-shaped, closed-end tubes filled with helium. The key parameters, including mean pressure p0, tube length L, cold-section length L − 2l, transition section length Δx, inner diameter D, and hot-section temperature Th, are summarized in Table 4 and applied in the CFD model. In the experiments, the onset temperature Tc,onset and oscillation frequency fonset at a mean pressure of 161 kPa were measured as 26.5 K and 58 Hz, while the corresponding CFD predictions were 33.2 K and 61.8 Hz. When the mean pressure was increased to 299 kPa, the measured values were 21 K and 54 Hz, whereas the CFD results were 29 K and 58.4 Hz. Overall, the CFD model consistently predicts slightly higher onset temperatures and frequencies compared with the experimental measurements. These discrepancies are likely attributable to factors such as the adoption of a linear rather than nonlinear temperature distribution in the transition section, the use of the ideal-gas assumption instead of accounting for real-gas effects, the two-dimensional simplifications adopted in the CFD model, and the absence of external disturbance effects such as those introduced by the branch tube in the experimental apparatus. Despite these discrepancies, the close agreement between the CFD predictions and the experimental data provides a reasonable assessment of the model’s accuracy and supports its applicability for simulating Taconis oscillations.

3. Acoustic and Flow Characteristics of the Cryogenic Helium Pipe

3.1. Transient Growth of Self-Excited Thermoacoustic Oscillations

The acoustic characteristics of the benchmark cryogenic helium pipe are first examined. Figure 3a illustrates the time history of acoustic pressure at x = 0 with Γ = 14,500 K/m and ε = 1. Initially, the acoustic pressure remains relatively small during the first 0.4 s, followed by a rapid increase around 0.5 s, eventually reaching limit-cycle oscillations with an amplitude of 213 kPa after 0.6 s. A similar evolution pattern of pressure oscillations was also reported by Sun et al. [19], who conducted CFD investigations on the Taconis oscillations in a cryogenic hydrogen tube. Figure 3b presents the FFT spectrum, revealing the presence of distinct higher-order harmonics that arise from energy cascade from the fundamental mode. In the simulations, the first three modes are excited simultaneously: the fundamental mode, which dominates the pressure oscillations, has a natural frequency of 60 Hz. The second mode, exhibiting a natural frequency of 121.1 Hz (twice that of the fundamental mode), has a significantly lower amplitude. The third mode, oscillating at 181.1 Hz, has a negligible effect on the pressure waveform, with an amplitude only 0.04 times that of the fundamental mode.

3.2. Velocity and Temperature Profiles at Steady State

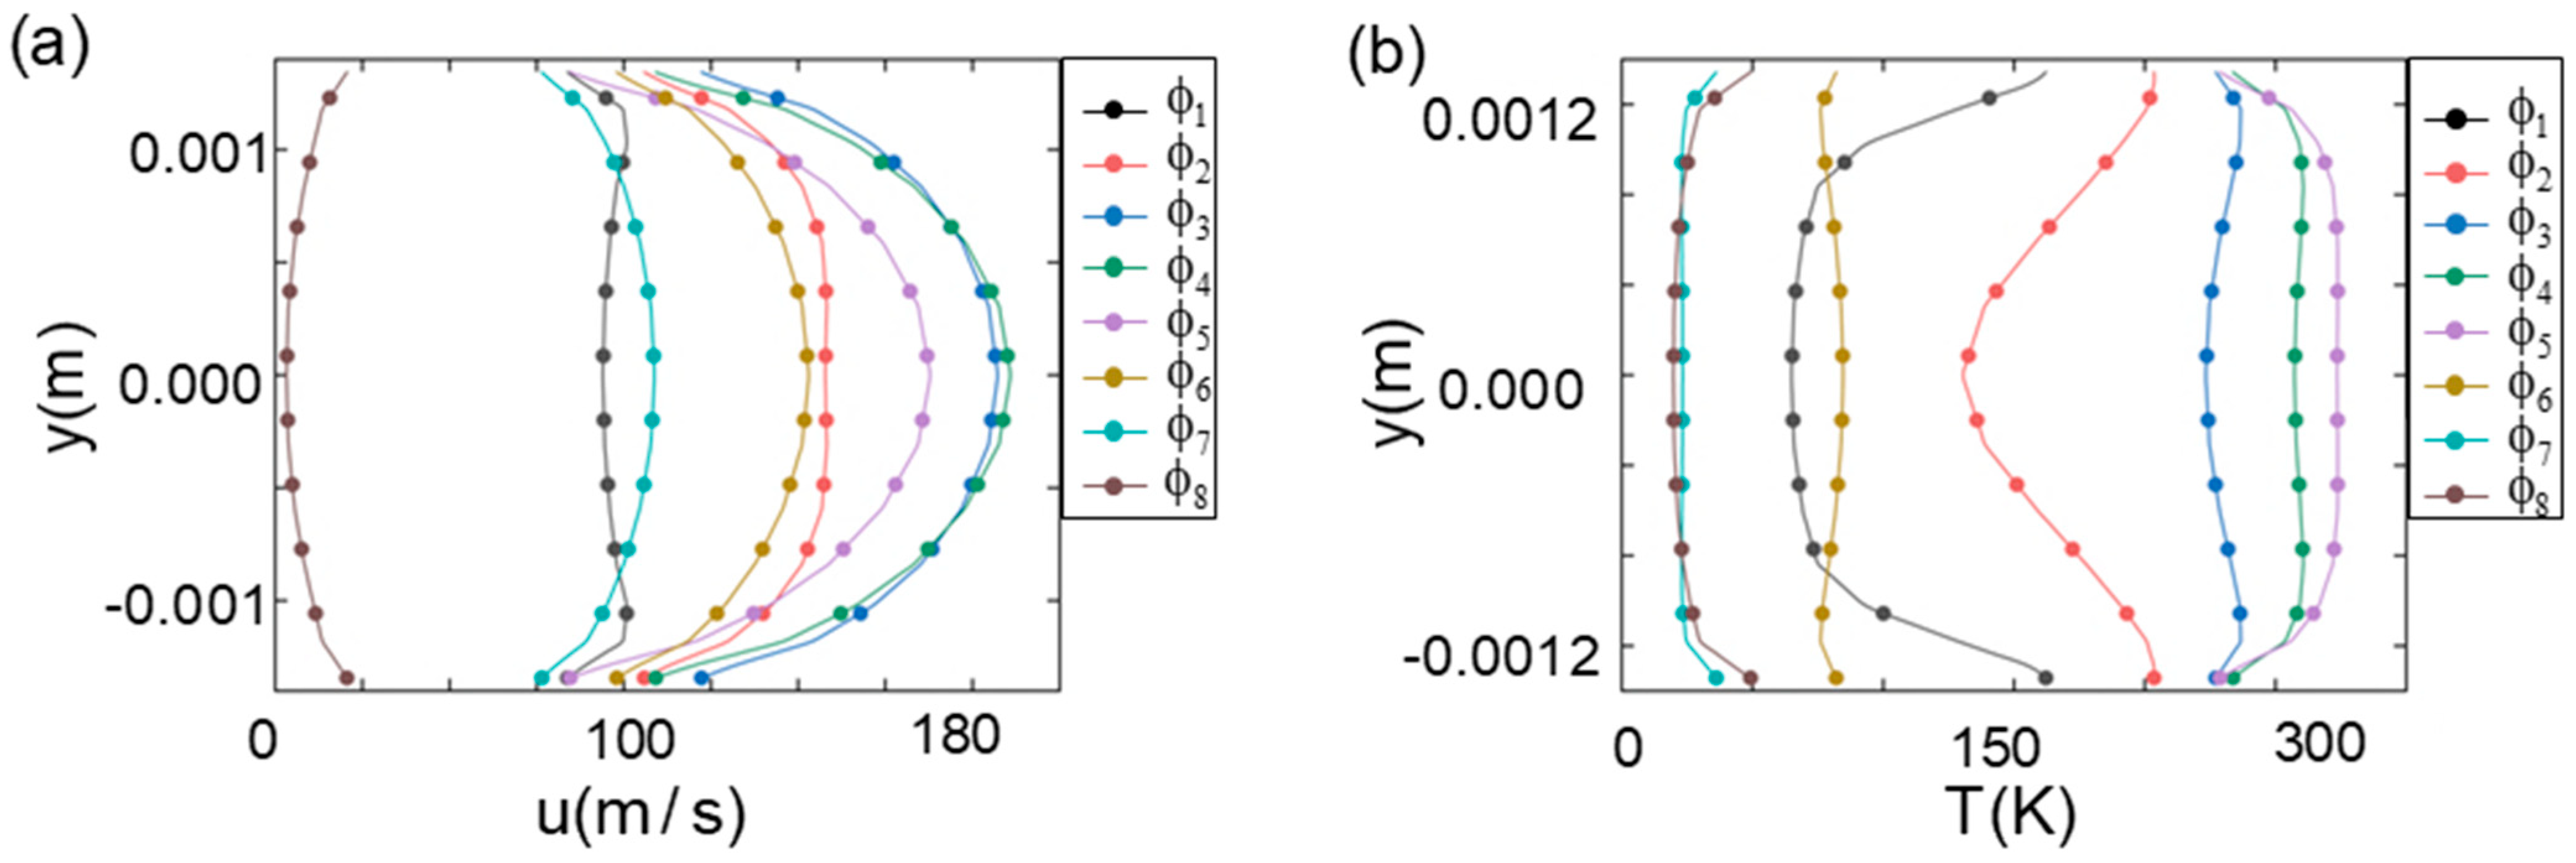
It is also of interest to examine the velocity and temperature fields within the cryogenic helium pipe. Since the helium inside the pipe is oscillating, eight instants (Φ1 to Φ8) with evenly spaced time intervals in an acoustic cycle are selected. Figure 4 shows the distributions of velocity and temperature in the y direction at x = 0.9275 m, which are located at the midpoint of the right linear temperature gradient. The velocity profile in Figure 4a follows a Poiseuille pattern, which is typical for small-diameter helium pipes. Such a Poiseuille velocity profile was also reported in our previous study on thermally induced oscillatory flow inside a thermoacoustic engine [36]. This behavior results from the strong influence of viscosity near the pipe walls, leading to significant variations in axial velocity. In contrast, the temperature profile in Figure 4b differs slightly from the velocity profile. Specifically, the temperature distribution is more uniform away from the walls. The difference between the wall temperature and helium temperature indicates substantial heat transfer between the oscillating helium and the solid pipe walls. The velocity and temperature profiles at other locations along the helium pipeline exhibit similar trends.

4. Impact on the Dynamic Behavior of Taconis Oscillations

4.1. Position of Temperature Gradient

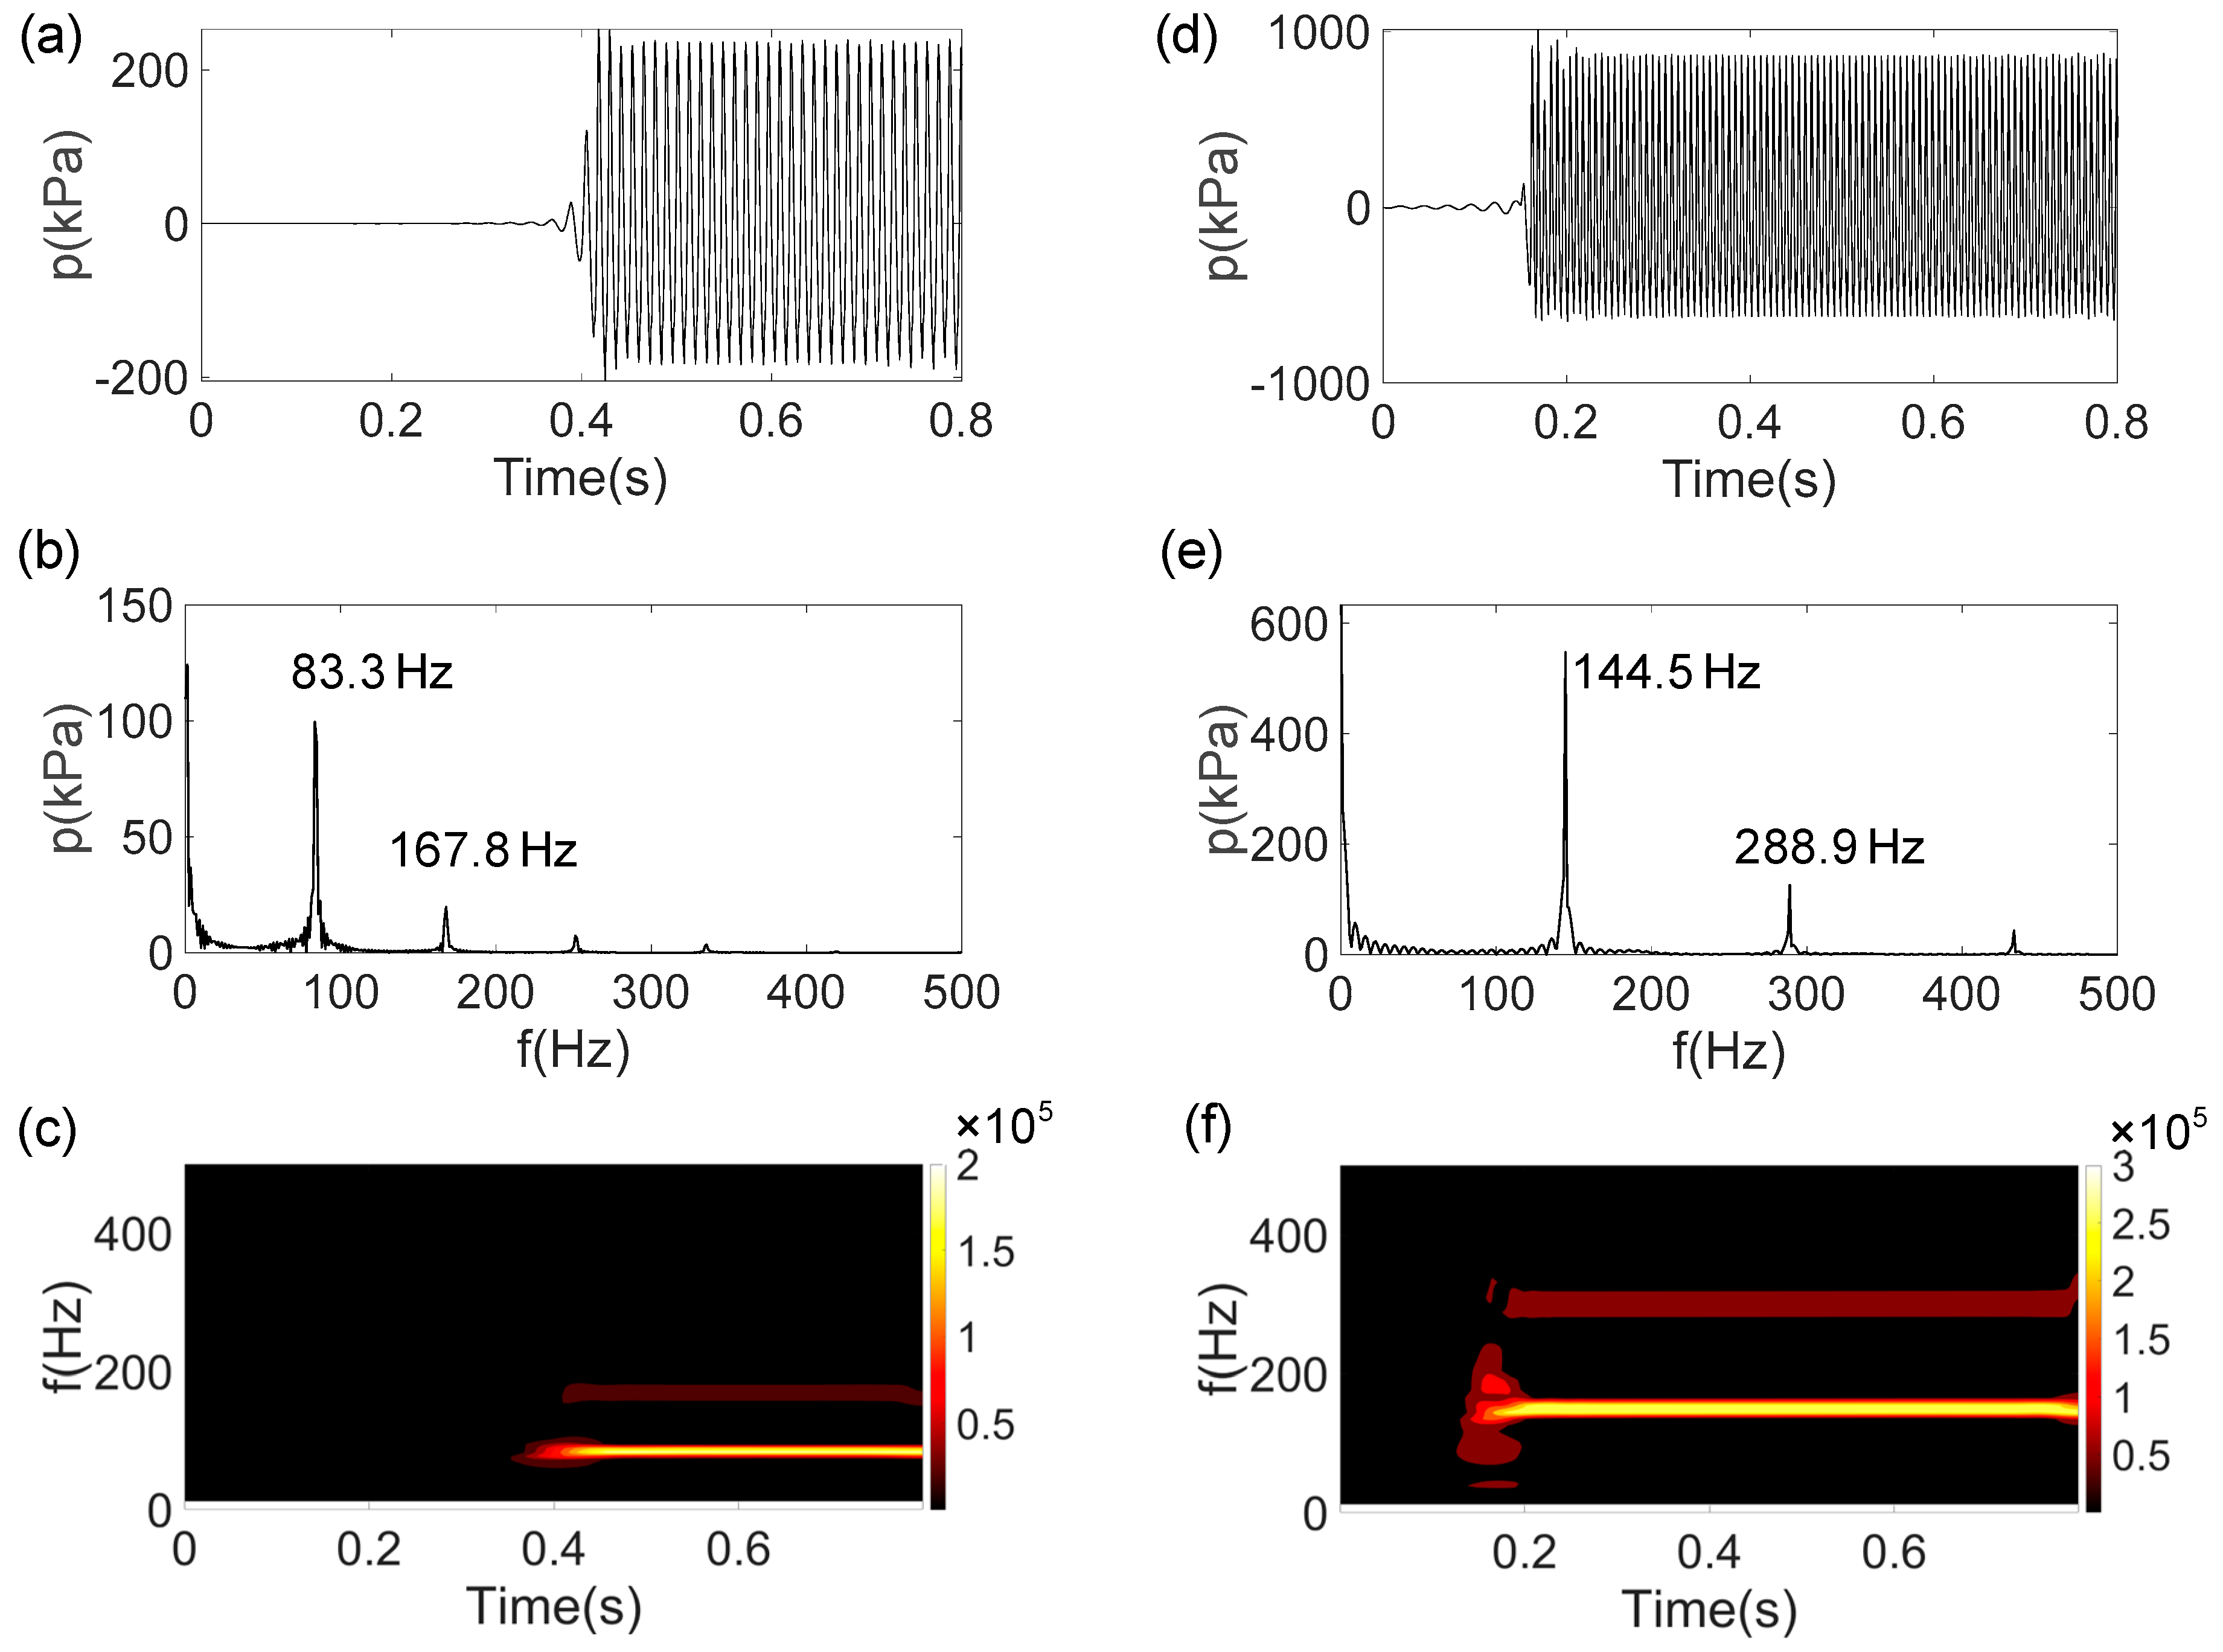
The dynamic behavior of Taconis oscillations within the helium pipeline varies as the position of the temperature gradient changes. To analyze the impact of the position of temperature gradients on Taconis oscillations, pressure fluctuations at the closed end of the helium pipe are examined. Figure 5a presents the time history, frequency spectrum, and time–frequency diagram of pressure fluctuations when Γ = 14,500 K/m and ε is 2. Self-excited large-amplitude Taconis oscillations occur at around 0.45 s and stabilize at around 200 kPa afterwards. An examination of the frequency spectrum in Figure 5b and time–frequency diagram in Figure 5c reveals the presence of two acoustic modes. The first mode exhibits higher energy than the second mode, with frequencies being 83.33 Hz and 167.8 Hz, respectively. When Γ increases to 44,500 K/m in Figure 5d, the pressure amplitude increases to around 900 kPa. The first- and second-mode frequencies increase to 144.5 Hz and 288.9 Hz, respectively, as a result of increased sound speed at a higher temperature gradient.
Figure 6a displays the time history, frequency spectrum, and time–frequency diagram of pressure fluctuations at Γ = 14,500 K/m and ε = 1. The frequency spectrum presented in Figure 6b reveals that the acoustic pressure consists of two distinct frequencies: the first-mode frequency at 60 Hz and the second-mode frequency at 121.1 Hz. In comparison to Figure 5b, it is observed that the natural frequencies are lower, which can be attributed to the reduced proportion of the hot section and consequently the decreased mean temperature of the working fluid. Similarly, when Γ = 44,500 K/m, the natural frequencies decrease to 100 Hz and 200 Hz, as illustrated in Figure 6e.
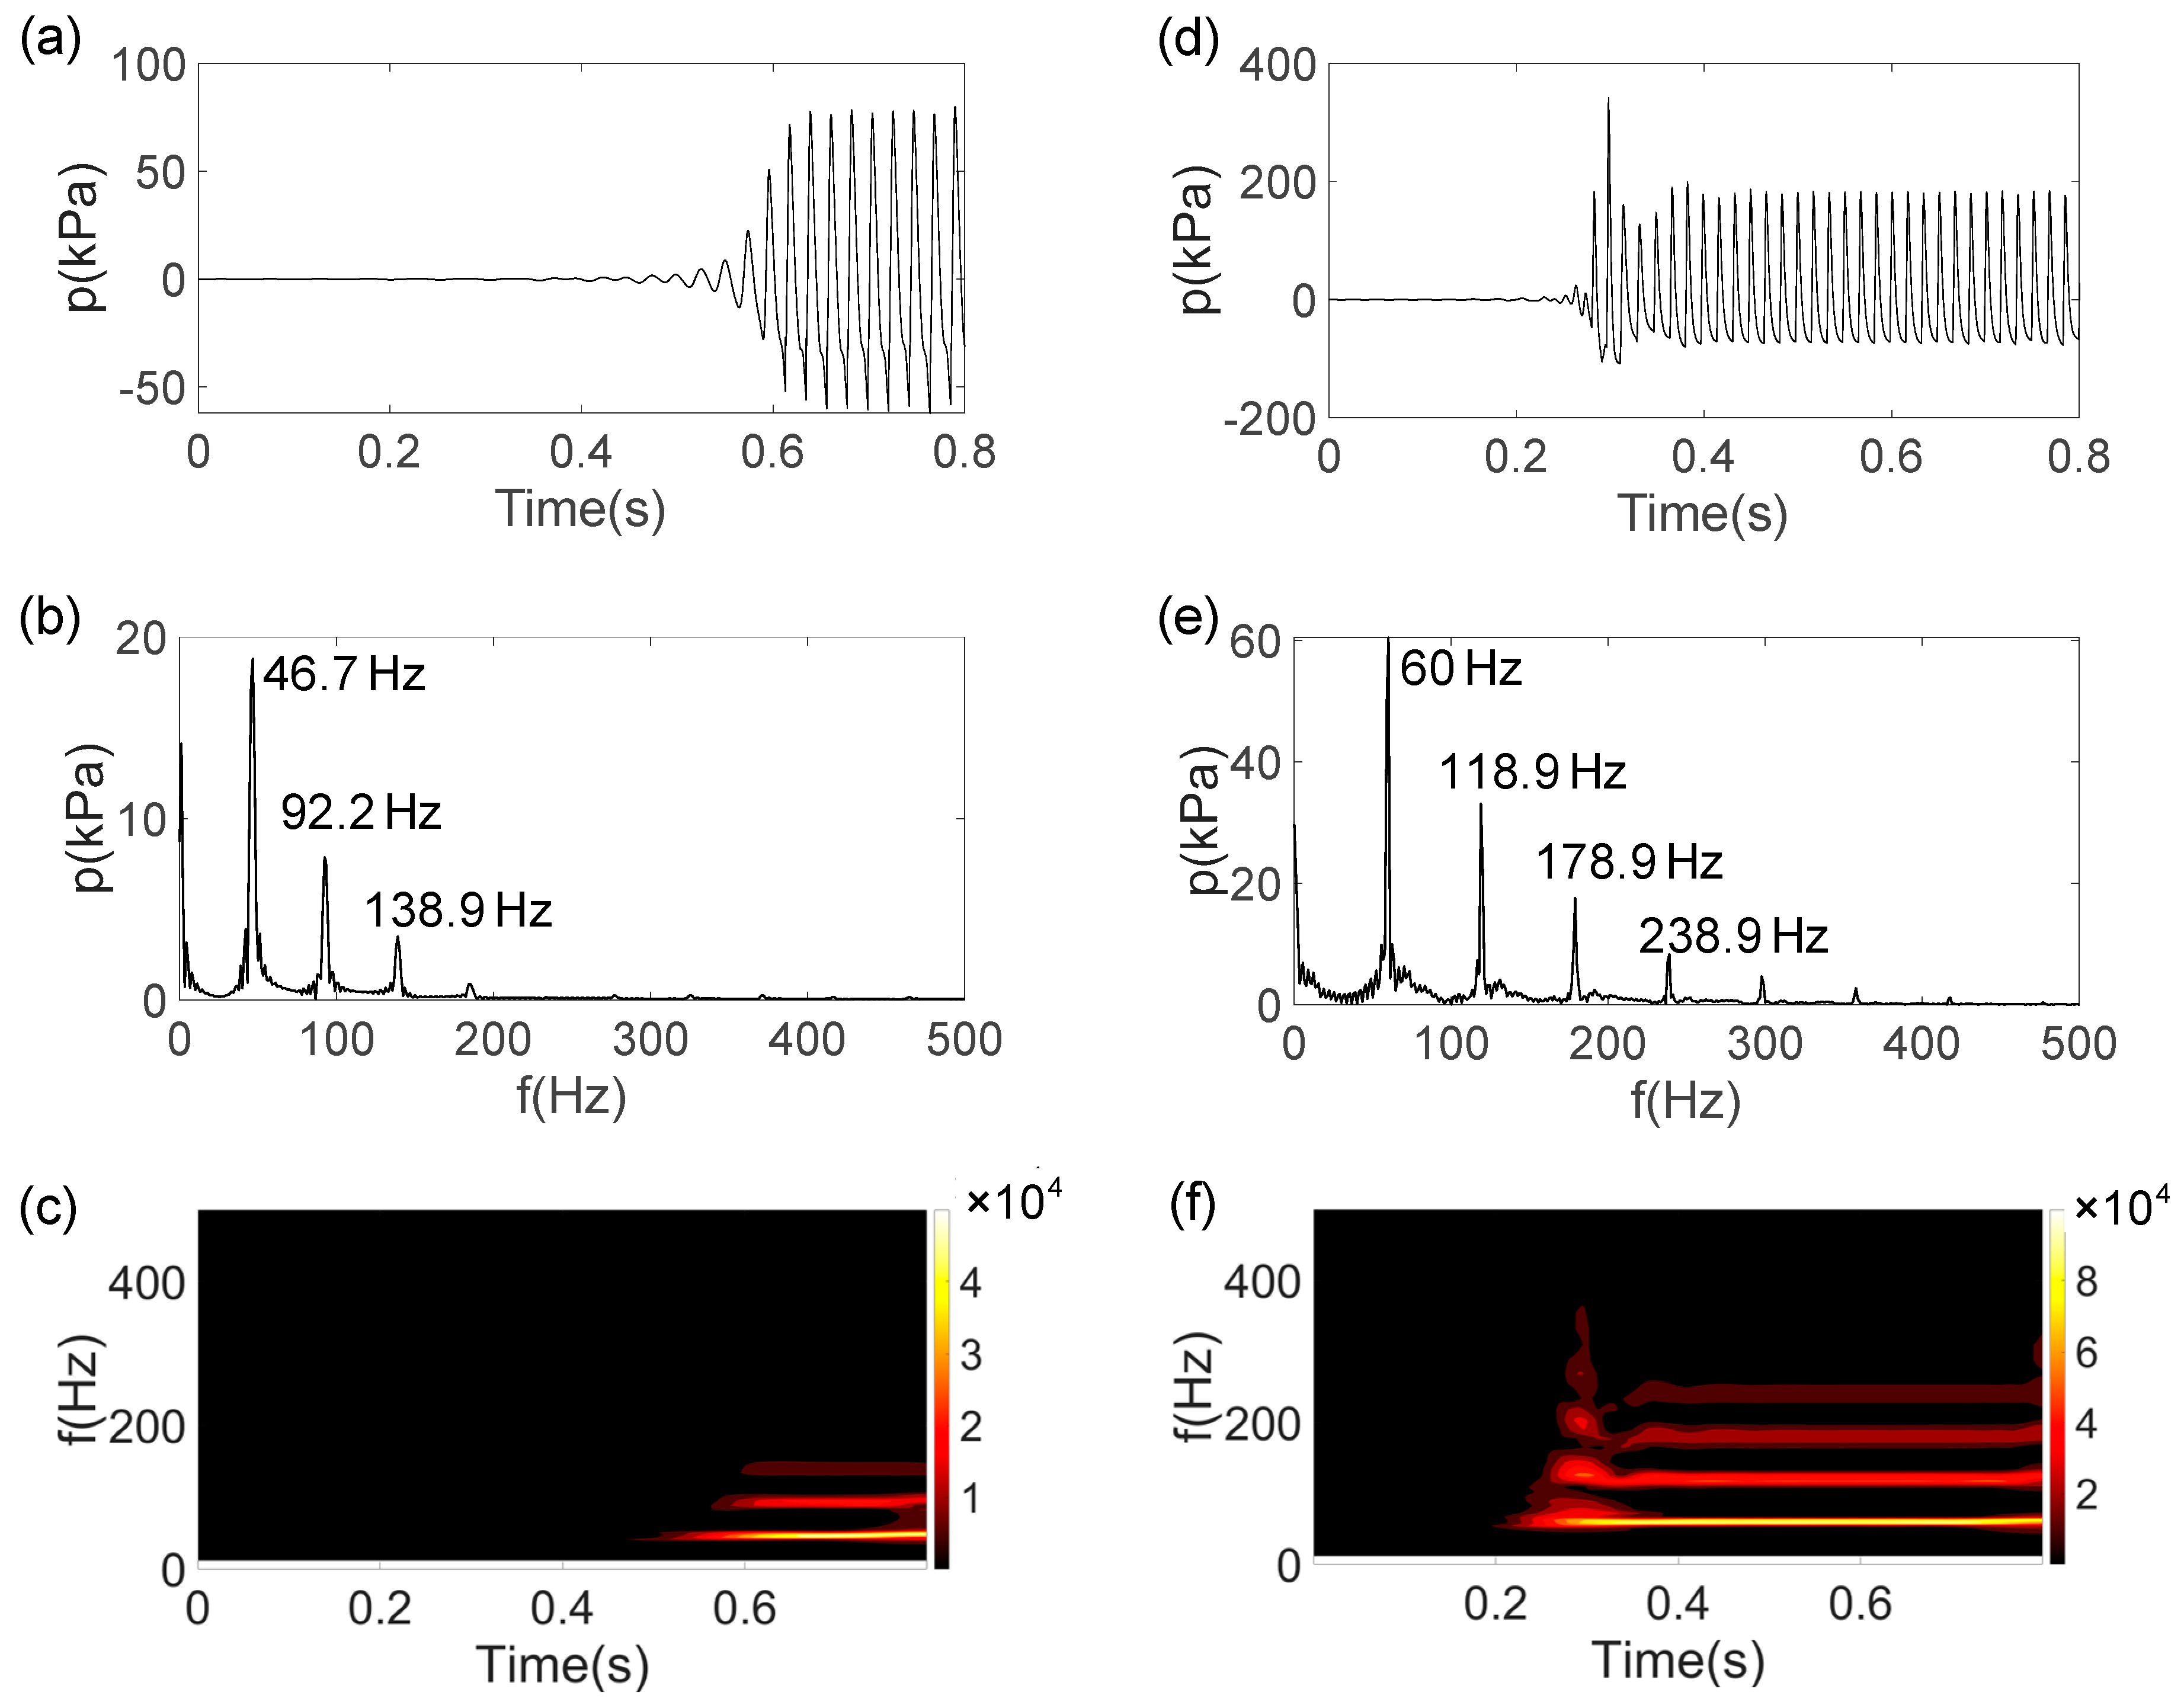
Figure 7a presents the time history, frequency spectrum, and time–frequency diagram of pressure fluctuations at Γ = 14,500 K/m and ε = 0.5. It is observed that the limit-cycle pressure oscillations have a magnitude of approximately 80 kPa, which is lower than the values observed for ε = 1 and 2. The frequency spectrum in Figure 7b reveals three distinct acoustic modes, with the first-mode frequency at 46.7 Hz, the second-mode frequency at 92.2 Hz, and the third-mode frequency at 138.9 Hz. As Γ increases to 44,500 K/m, as shown in Figure 7d, the pressure waveform becomes more complex, with the coexistence of multiple acoustic modes. This phenomenon is consistent with Yazaki’s experimental study [37], which demonstrated that in certain gas columns subjected to steep temperature gradients, spontaneous oscillations can occur, exhibiting complex, quasiperiodic, and even chaotic behavior.
Figure 8 presents a comparison of the natural frequencies at different values of ε. It is evident that, whether at Γ = 14,500 K/m or Γ = 44,500 K/m, the frequency of each mode is highest when the temperature gradient is positioned at ε = 2 and lowest when it is at ε = 0.5. According to the formula f = c/λ, where f is the natural frequency, λ is the wavelength, and c is the sound speed, f depends on the temperature distribution along the helium pipeline (defined by UDF). As the position of the temperature gradient shifts toward the closed end of the helium pipeline, the proportion of the hot section increases, thereby raising the mean temperature. As a result, both c and f increase.

4.2. Magnitude of Temperature Gradient

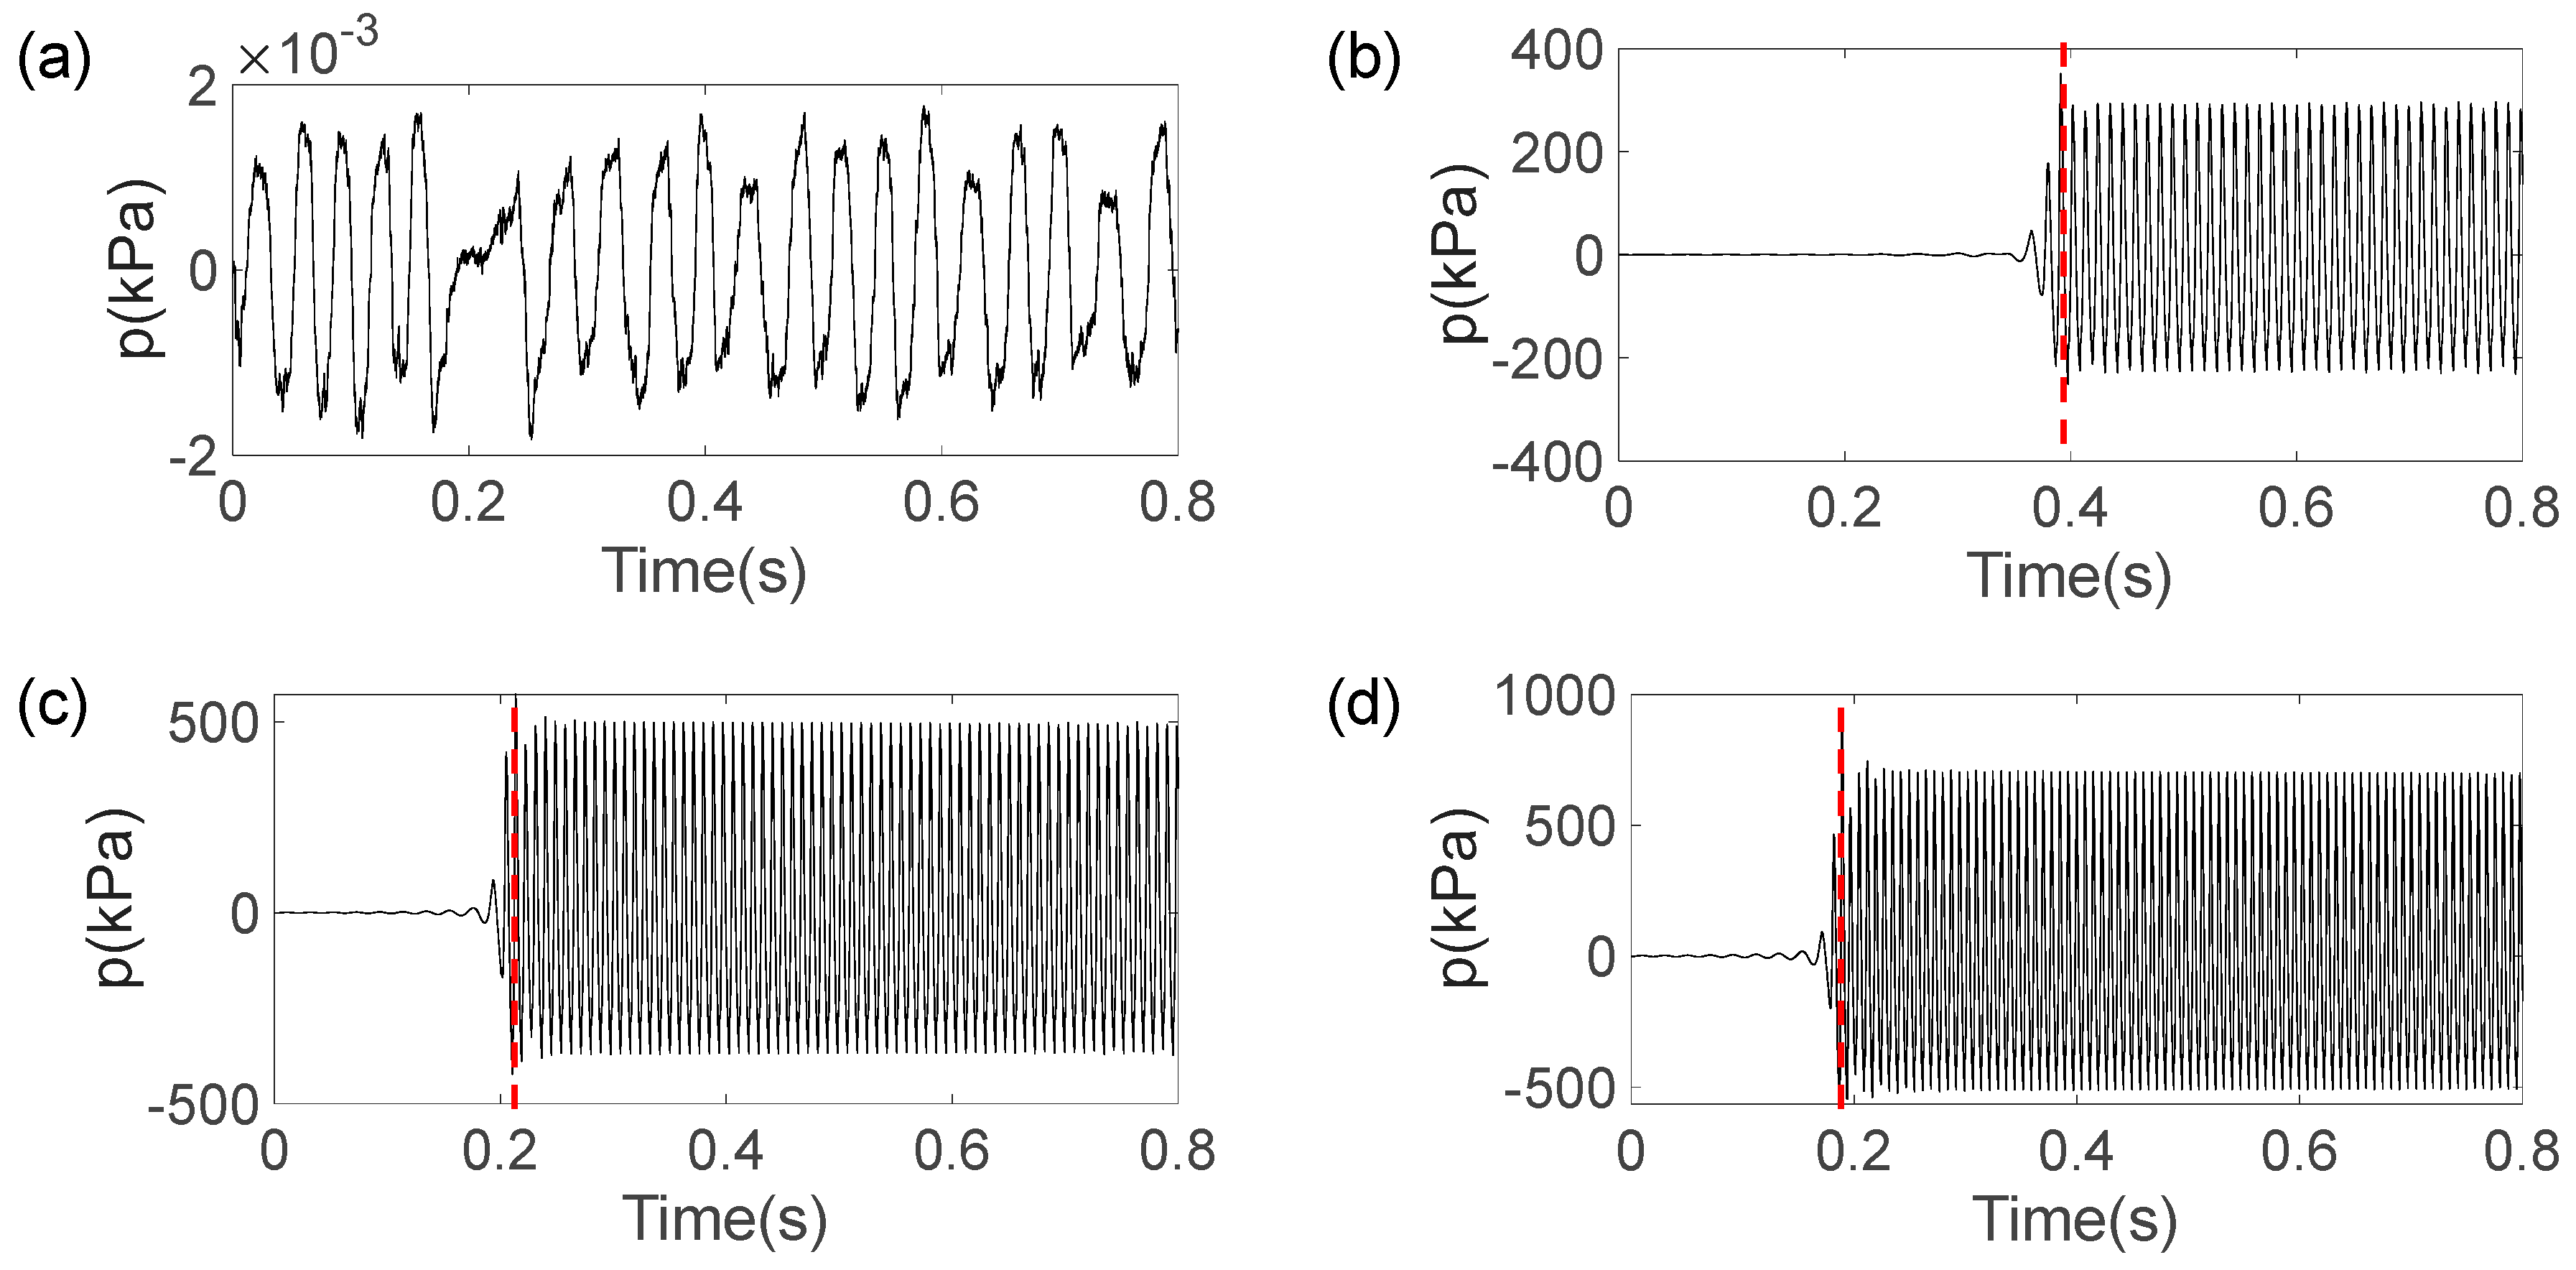
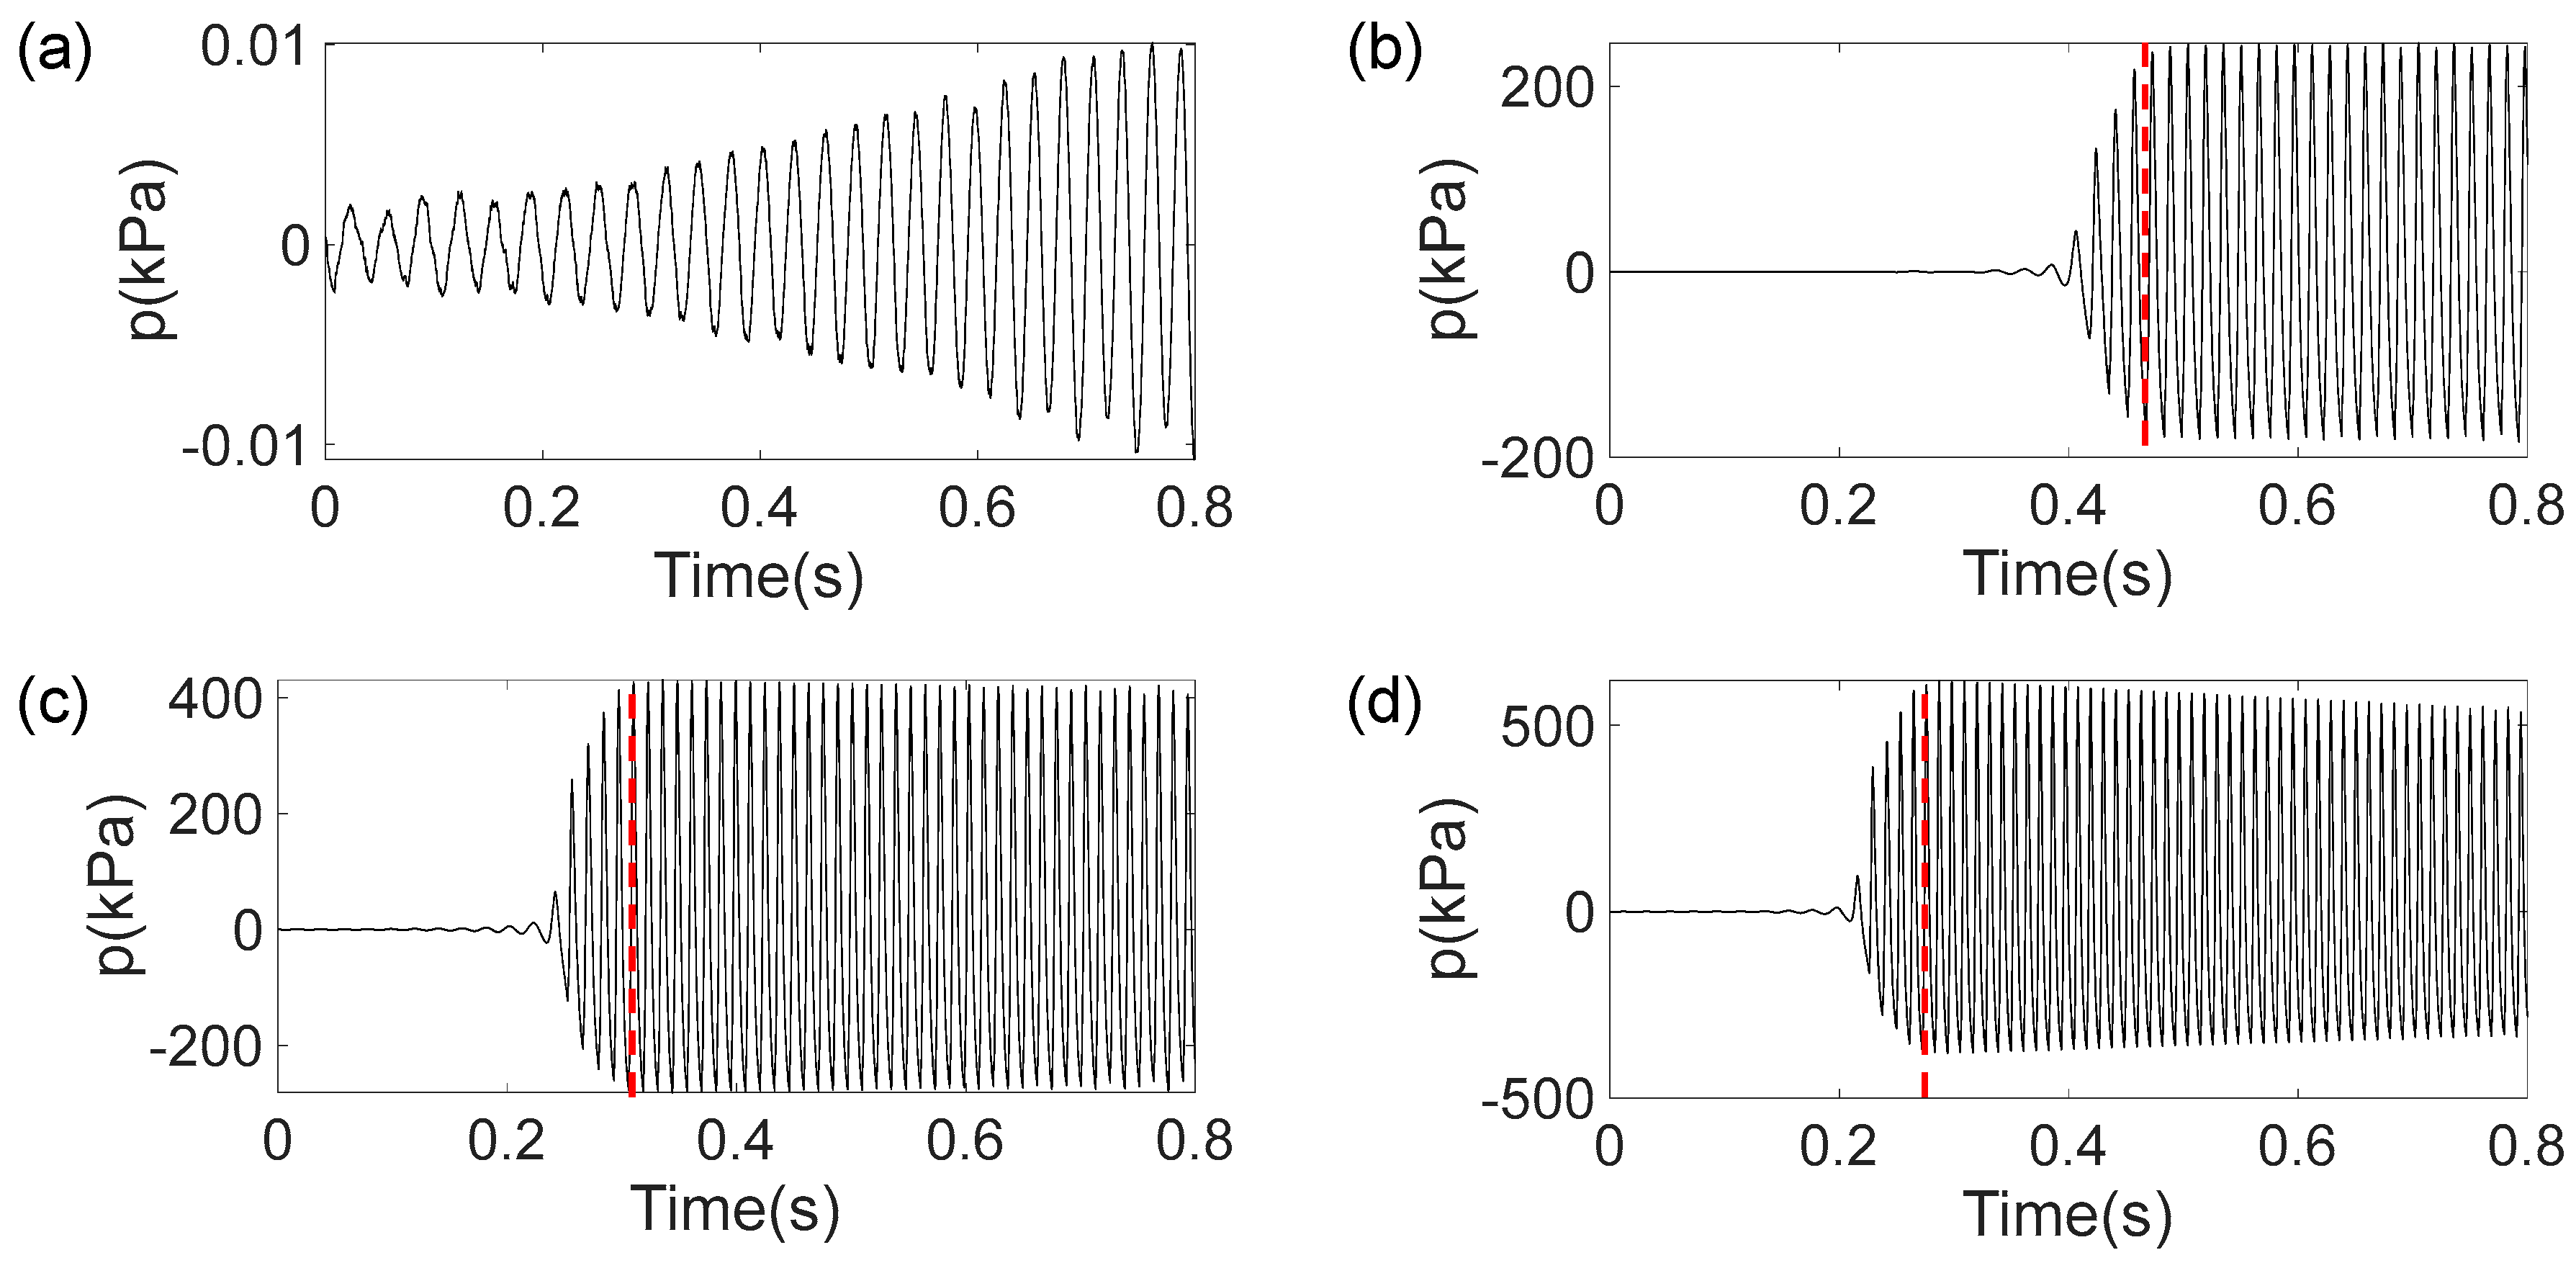
The dynamic behavior of Taconis oscillations within the helium pipeline also changes as the magnitude of the temperature gradient varies. Figure 9 illustrates the time history of pressure oscillations at the closed end of the helium pipeline at ε = 2. As shown in Figure 9a, no Taconis oscillations occur when Γ = 7000 K/m. However, when Γ is increased to 17,000 K/m, the helium within the cryogenic pipe becomes unstable, resulting in oscillations with a pressure amplitude of approximately 300 kPa. As Γ continues to increase, the pressure amplitude further rises. Notably, the time required to reach limit-cycle oscillations from the initial quiescent state decreases as Γ increases. This indicates that the cryogenic helium pipe becomes more susceptible to instability at higher temperature gradients.
Figure 10 and Figure 11 depict the time histories of pressure oscillations at the closed end of the helium pipeline for ε = 1 and ε = 0.5, respectively. When ε = 1, self-excited acoustic oscillations are successfully initiated at a temperature gradient of Γ = 7000 K/m, indicating favorable conditions for the onset of Taconis oscillations. However, under the same temperature gradient, acoustic oscillations fail to develop when ε = 0.5, demonstrating that a shorter hot section reduces the possibility of thermoacoustic instability. Although Taconis oscillations can still occur at other Γ values for ε = 0.5, their amplitudes are consistently lower than those observed for ε = 1. This finding indicates that reducing the proportion of the hot section can serve as an effective strategy for mitigating pressure oscillation amplitudes. Similar conclusions were reported by Hu et al. [26] and Zhang et al. [38] in their respective studies. Implementing such a design approach may facilitate the improved suppression of Taconis oscillations, thereby enhancing the safety and reliability of cryogenic storage systems.
Figure 12, Figure 13 and Figure 14 further illustrate the spectrum of acoustic oscillations as Γ varies from 7000 K/m to 37,000 K/m for ε values of 2, 1, and 0.5, respectively. As shown in Figure 12, when ε = 2, the fundamental frequency gradually increases as Γ rises. Taconis oscillations are initiated at Γ = 17,000 K/m. By examining the relationship between the fundamental frequency and temperature gradient from Γ = 7000 K/m to 42,000 K/m, we observe that the fundamental frequency increases rapidly before Γ = 12,000 K/m, followed by a slower rate of increase for Γ above 12,000 K/m.
Figure 13 shows that when ε = 1, the fundamental frequency increases with Γ, with the second mode excited above 12,000 K/m. The frequency grows rapidly up to Γ = 17,000 K/m, after which the rate of increase slows. Figure 14 reveals that when ε = 0.5, the number of excited modes increases from one to four as Γ rises, with all four modes fully excited at Γ = 37,000 K/m. The fundamental frequency exhibits the most significant growth between Γ = 12,000 K/m and 17,000 K/m, with a slower rate of increase beyond 17,000 K/m.

5. Conclusions

Cryogenic storage systems are widely used in aerospace engineering but are susceptible to Taconis oscillations, which can induce structural vibrations and increased heat leakage, underscoring the need for effective suppression measures. This study conducted CFD simulations on the dynamic characteristics of Taconis oscillations in a simplified U-shaped cryogenic helium pipe. The impact of the position and magnitude of the temperature gradient on the Taconis oscillations was investigated using analytical tools including FFT spectrums and wavelet transform diagrams. The key findings of this study are as follows:
(1)
CFD simulations on the benchmark cryogenic helium pipe indicate that when ε = 1 and Γ = 14,500 K/m, large-amplitude Taconis oscillations occur. These oscillations exhibit two distinct frequencies: a first-mode frequency of 60 Hz with an amplitude of 213 kPa and a second-mode frequency of 121 Hz with a significantly lower amplitude. The velocity profile in the y direction follows a Poiseuille pattern, whereas the helium temperature is more uniform away from the walls.
(2)
The position of the temperature gradient significantly affects the stability of the cryogenic helium pipe. When ε = 1, the onset temperature gradient for Taconis oscillations is relatively low, approximately 7000 K/m. This suggests that, to prevent the occurrence of Taconis oscillations, the transition between the warm and cold sections should be away from one-quarter of the cryogenic pipe. When ε = 0.5, although the pressure amplitude is lower, higher-order acoustic modes are more easily excited within the helium pipeline, leading to the coexistence of multiple acoustic modes. The natural frequencies of acoustic modes increase as ε increases due to increased average temperature as a result of a larger proportion the hot section.
(3)
The magnitude of the temperature gradient also has a significant impact on the dynamic behavior of Taconis oscillations. As Γ increases, the cryogenic helium tube becomes more susceptible to instability and easier to excite, resulting in a shorter time to reach steady-state periodic oscillations. In addition, the oscillation frequency of the cryogenic helium pipe rises with increasing Γ due to the increased sound speed at higher temperatures.
This study demonstrates the effectiveness of computational fluid dynamics (CFD) in investigating thermally induced, self-excited thermoacoustic oscillations within the pipelines of cryogenic storage systems. Future research will shift from the conventional focus on suppressing Taconis oscillations to exploring their potential as a novel mechanism for cold energy recovery in cryogenic systems.

Author Contributions

Conceptualization, L.L. and G.C.; Methodology, G.C.; Software, L.L.; Validation, L.L.; Formal analysis, L.L.; Investigation, L.L.; Writing—original draft, L.L.; Writing—review & editing, C.Z., Y.L. and G.C.; Supervision, G.C.; Funding acquisition, L.L. and G.C. All authors have read and agreed to the published version of the manuscript.

Funding

This research was funded by the Natural Science Foundation of Zhejiang Province: China (Grant No. LZY24E060002), the Quzhou Municipal Science and Technology Bureau (2024K149), the National Natural Science Foundation of China (Grant No. 52405096), the Natural Science Foundation of Jiangsu Province (Grant No. BK20230848), the Zhishan Young Scholar Program of Southeast University (Grant No. 2242025RCB0037), and the Fundamental Research Funds for the Central Universities (Grant No. 2242025K30015).

Data Availability Statement

The original contributions presented in this study are included in the article. Further inquiries can be directed to the corresponding author.

Conflicts of Interest

Author Cong Zhuo and Yongqing Liu were employed by the Zhejiang Santian A/C Compressor Co., Ltd. The remaining authors declare that the research was conducted in the absence of any commercial or financial relationships that could be construed as a potential conflict of interest.

References

  1. Swift, G.W. Thermoacoustics: A Unifying Perspective for Some Engines and Refrigerators; Springer: Berlin/Heidelberg, Germany, 2017. [Google Scholar]
  2. Chen, G.; Tang, L.; Mace, B.; Yu, Z. Multi-physics coupling in thermoacoustic devices: A review. Renew. Sustain. Energy Rev. 2021, 146, 111170. [Google Scholar] [CrossRef]
  3. Guo, L.; Zhao, D.; Becker, S. Temperature Difference and Stack Plate Spacing Effects on Thermodynamic Performances of Standing-Wave Thermoacoustic Engines Driven by Cryogenic Liquids and Waste Heat. J. Therm. Sci. 2022, 31, 1434–1451. [Google Scholar] [CrossRef]
  4. Hsu, S.-H.; Liao, Z.-Y. Impedance matching for investigating operational conditions in thermoacoustic Stirling fluidyne. Appl. Energy 2024, 374, 123973. [Google Scholar] [CrossRef]
  5. Niu, Y.; Hu, L.; Chen, P.; Liu, Y.; Gao, B. Numerical study of oscillation characteristics in T-shaped cryogenic helium tube. Int. Commun. Heat Mass Transf. 2023, 143, 106725. [Google Scholar] [CrossRef]
  6. Gu, Y.; Timmerhaus, K. Effect of Tube Temperature Profile on Thermal Acoustic Osciallations in Liquid Hydrogen Systems. In Proceedings of the Sixth International Cryocooler Conference, Plymouth, MA, USA, 25–26 October 1990; pp. 329–340. [Google Scholar]
  7. Matveev, K.I. Influence of Porous Inserts and Compact Resonators on Onset of Taconis Oscillations. J. Vib. Acoust. 2024, 146, 014501. [Google Scholar] [CrossRef]
  8. Swift, G.; Gardner, D.; Backhaus, S. Quarter-wave pulse tube. Cryogenics 2011, 51, 575–583. [Google Scholar] [CrossRef]
  9. Luck, H.; Trepp, C. Thermoacoustic oscillations in cryogenics. Part 2: Applications. Cryogenics 1992, 32, 698–702. [Google Scholar] [CrossRef]
  10. Luck, H.; Trepp, C. Thermoacoustic oscillations in cryogenics. Part 1: Basic theory and experimental verification. Cryogenics 1992, 32, 690–697. [Google Scholar] [CrossRef]
  11. Rott, N. Thermally driven acoustic oscillations. Part II: Stability limit for helium. Z. Angew. Math. Phys. ZAMP 1973, 24, 54–72. [Google Scholar] [CrossRef]
  12. Yazaki, T.; Tominaga, A.; Narahara, Y. Stability limit for thermally driven acoustic oscillation. Cryogenics 1979, 19, 393–396. [Google Scholar] [CrossRef]
  13. Tominaga, A. Thermodynamic aspects of thermoacoustic theory. Cryogenics 1995, 35, 427–440. [Google Scholar] [CrossRef]
  14. Shimizu, D.; Sugimoto, N. Numerical study of thermoacoustic Taconis oscillations. J. Appl. Phys. 2010, 107, 034910. [Google Scholar] [CrossRef]
  15. Sugimoto, N.; Shimizu, D. Boundary-layer theory for Taconis oscillations in a helium-filled tube. Phys. Fluids 2008, 20, 104102. [Google Scholar] [CrossRef]
  16. Chen, G.; Tao, S.; Wang, K.; Tang, L.; Li, Z.; Xu, J.; Yu, Z. Full-scale numerical simulations of standing-wave thermoacoustic engines with circular-pore and pin-array stacks. Int. J. Heat Mass Transf. 2024, 228, 125605. [Google Scholar] [CrossRef]
  17. Di Meglio, A.; Massarotti, N. CFD Modeling of Thermoacoustic Energy Conversion: A Review. Energies 2022, 15, 3806. [Google Scholar] [CrossRef]
  18. Sharify, E.M.; Takahashi, S.; Hasegawa, S. Development of a CFD model for simulation of a traveling-wave thermoacoustic engine using an impedance matching boundary condition. Appl. Therm. Eng. 2016, 107, 1026–1035. [Google Scholar] [CrossRef]
  19. Sun, D.; Wang, K.; Guo, Y.; Zhang, J.; Xu, Y.; Zou, J.; Zhang, X. CFD study on Taconis thermoacoustic oscillation with cryogenic hydrogen as working gas. Cryogenics 2016, 75, 38–46. [Google Scholar] [CrossRef]
  20. Putselyk, S. Thermal acoustic oscillations: Short review and countermeasures. In IOP Conference Series: Materials Science and Engineering; IOP Publishing: Bristol, UK, 2020; p. 012080. [Google Scholar]
  21. Hu, L.; Yuan, P.; Niu, Y.; Liu, Y.; Gao, B. Sensitivity analysis of thermoacoustic oscillation in cryogenics system based on response surface method. Therm. Sci. 2023, 27, 3795–3804. [Google Scholar] [CrossRef]
  22. Matveev, K.I.; Leachman, J.W. Thermoacoustic Modeling of Cryogenic Hydrogen. Energies 2024, 17, 2884. [Google Scholar] [CrossRef]
  23. Rao, A.G.; Yin, F.; Werij, H.G.C. Energy Transition in Aviation: The Role of Cryogenic Fuels. Aerospace 2020, 7, 12. [Google Scholar] [CrossRef]
  24. Lai, C.-H.; Hsu, S.-H. Empirical Modeling of Subcritical Hopf Bifurcation of Thermoacoustic Stirling Engine. Aerospace 2024, 11, 347. [Google Scholar] [CrossRef]
  25. Hu, L.; Yang, P.; Liu, Y. Numerical investigation on the control of cryogenic fluid oscillations by applying an external sound source. J. Appl. Phys. 2021, 130, 054903. [Google Scholar] [CrossRef]
  26. Hu, L.; Yang, P.; Chen, P.; Liu, Y. Numerical study on suppression of thermoacoustic oscillation in cryogenic helium pipeline system. Cryogenics 2021, 117, 103311. [Google Scholar] [CrossRef]
  27. Gu, L.; Liu, L.; Li, Z.; Tang, L.; Yu, Z.; Chen, G. Suppression of Taconis oscillations in cryogenic hydrogen tubes using a Helmholtz resonator: Theoretical modelling and numerical simulations. Appl. Therm. Eng. 2025, 274, 126687. [Google Scholar] [CrossRef]
  28. Rao, Y. Chemical Engineering Thermodynamics; Universities Press (India) Privated Limited: Hyderabad, India, 1997. [Google Scholar]
  29. Alfonsi, G. Reynolds-averaged Navier–Stokes equations for turbulence modeling. Appl. Mech. Rev. 2009, 62, 040802. [Google Scholar] [CrossRef]
  30. Chen, G.; Tang, L.; Mace, B.R. Bistability and triggering in a thermoacoustic engine: A numerical study. Int. J. Heat Mass Transf. 2020, 157, 119951. [Google Scholar] [CrossRef]
  31. Guo, L.; Zhao, D.; Xu, J.; Tokhi, M.O.; Karimi, H.R. Predicting unsteady heat-fluid interaction features and nonlinear acoustic behaviors in standing-wave thermoacoustic engines using unsteady RANS, LES and hybrid URANS/LES methods. Int. Commun. Heat Mass Transf. 2023, 142, 106617. [Google Scholar] [CrossRef]
  32. Liu, L.; Liu, Y. Numerical study on a thermoacoustic refrigerator with continuous and staggered arrangements. Therm. Sci. 2022, 26, 3939–3949. [Google Scholar] [CrossRef]
  33. Shenton, M.P.; Leachman, J.W.; Matveev, K.I. Investigating Taconis oscillations in a U-shaped tube with hydrogen and helium. Cryogenics 2024, 143, 103940. [Google Scholar] [CrossRef]
  34. Shenton, M.P.; Leachman, J.W.; Matveev, K. Study of Taconis-Based Cryogenic Thermoacoustic Engine with Hydrogen and Helium. Energies 2025, 18, 4114. [Google Scholar] [CrossRef]
  35. Shenton, M.; Matveev, K.; Leachman, J. Initiation and suppression of Taconis oscillations in tubes with junctions and variable-diameter tube segments. In IOP Conference Series: Materials Science and Engineering; IOP Publishing: Bristol, UK, 2024; p. 012042. [Google Scholar]
  36. Chen, G.; Wang, Y.; Tang, L.; Wang, K.; Yu, Z. Large eddy simulation of thermally induced oscillatory flow in a thermoacoustic engine. Appl. Energy 2020, 276, 115458. [Google Scholar] [CrossRef]
  37. Yazaki, T.; Takashima, S.; Mizutani, F. Complex quasiperiodic and chaotic states observed in thermally induced oscillations of gas columns. Phys. Rev. Lett. 1987, 58, 1108. [Google Scholar] [CrossRef] [PubMed]
  38. Zhang, Q.; Ma, Y.; Xie, F.; Ai, L.; Wu, S.; Li, Y. Numerical Simulation Research on Thermoacoustic Instability of Cryogenic Hydrogen Filling Pipeline. Cryo 2025, 1, 9. [Google Scholar] [CrossRef]
Figure 1. (a) Cryogenic storage system from Linde [23] where unwanted Taconis oscillations could possibly occur; (b) Simplified schematic of a U-shaped helium pipe immersed in the cryogenic storage tank.
Symmetry 17 01361 g001
Figure 2. (a) Symmetric temperature profile along the U-shaped helium pipe; (b) mesh configuration of the U-shaped helium pipe.
Symmetry 17 01361 g002
Figure 3. (a) Time history of acoustic pressure at x = 0 and (b) corresponding FFT spectrum for the benchmark cryogenic helium pipe with Γ = 14,500 K/m and ε = 1.
Symmetry 17 01361 g003
Figure 4. (a) Velocity and (b) temperature profiles at eight instants with evenly spaced time intervals in an acoustic cycle.
Symmetry 17 01361 g004
Figure 5. Time history, frequency spectrum, and time–frequency diagram of pressure fluctuations when ε is 2: (ac) Γ = 14,500 K/m; (df) Γ = 44,500 K/m.
Symmetry 17 01361 g005
Figure 6. Time history, frequency spectrum, and time–frequency diagram of pressure fluctuations when ε is 1: (ac) Γ = 14,500 K/m; (df) Γ = 44,500 K/m.
Symmetry 17 01361 g006
Figure 7. Time history, frequency spectrum, and time–frequency diagram of pressure fluctuations when ε is 0.5: (ac) Γ = 14,500 K/m; (df) Γ = 44,500 K/m.
Symmetry 17 01361 g007
Figure 8. Natural frequencies at different ε: (a) Γ = 14,500 K/m; (b) Γ = 44,500 K/m.
Symmetry 17 01361 g008
Figure 9. Pressure oscillations at the closed end of the helium pipeline when ε = 2: (a) Γ = 7000 K/m; (b) Γ = 17,000 K/m; (c) Γ = 27,000 K/m; (d) Γ = 37,000 K/m.
Symmetry 17 01361 g009
Figure 10. Pressure oscillations at the closed end of the helium pipeline when ε = 1. (a) Γ = 7000 K/m; (b) Γ = 17,000 K/m; (c) Γ = 27,000 K/m; (d) Γ = 37,000 K/m.
Symmetry 17 01361 g010
Figure 11. Pressure oscillations at the closed end of the helium pipeline when ε = 0.5: (a) Γ = 7000 K/m; (b) Γ = 17,000 K/m; (c) Γ = 27,000 K/m; (d) Γ = 37,000 K/m.
Symmetry 17 01361 g011
Figure 12. Spectrums of acoustic pressures at the closed end of the helium pipe when ε = 2: (a) Γ = 7000 K/m; (b) Γ = 17,000 K/m; (c) Γ = 27,000 K/m; (d) Γ = 37,000 K/m.
Symmetry 17 01361 g012
Figure 13. Spectrums of acoustic pressures at the closed end of the helium pipe when ε = 1: (a) Γ = 7000 K/m; (b) Γ = 17,000 K/m; (c) Γ = 27,000 K/m; (d) Γ = 37,000 K/m.
Symmetry 17 01361 g013
Figure 14. Spectrums of acoustic pressures at the closed end of the helium pipe when ε = 0.5: (a) Γ = 7000 K/m; (b) Γ = 17,000 K/m; (c) Γ = 27,000 K/m; (d) Γ = 37,000 K/m.
Symmetry 17 01361 g014
Table 1. Key parameters investigated in this research.
ParametersSymbolsValues and Units
Hot-section temperatureThValues: 150 K to 900 K; increment: 50 K
Cold-section temperatureTcFixed at 10 K
Temperature ratioΓValues: 7000 K/m to 44,500 K/m; baseline value: 14,500 K/m
Length of hot sectionl1/6L, 1/4L, and 1/3L;
Length ratioεValues: 0.5, 1, and 2; baseline value: 1
Table 2. Boundary conditions implemented in the CFD simulations.
StepsHot SectionCold SectionTransition SectionLeft End (x = 0)Right End (x = L)
Step 1: Steady calculationRigid wall, T = ThRigid wall, T = TcRigid wall, linear decrease from Th to TcPressure inlet, p = 10 Pa, T = ThPressure outlet, p = 0 Pa, T = Th
Step 2: Transient calculationRigid wall, T = ThRigid wall, T = TcRigid wall, linear decrease from Th to TcRigid wall, u = 0, T = ThRigid wall, u = 0, T = Th
Table 3. Dependence of oscillation frequency on grid node and timestep size.
Grid Node91,563142,531241,520Timestep Size1.5 × 10−5 s1 × 10−5 s0.5 × 10−5 s
f (Hz)60.86059.1f (Hz)58.46061.3
ER2.9%1.5%N/AER4.7%2.1%N/A
CPUhs431545631CPUhs270545675
Table 4. Comparison with experimental data in the literature.
p0 (kPa)L (m)L − 2l (m)x (m)D (mm)Th (K)Tc,onset (K)fonset (Hz)
Exp. [33]1612.110.910.4254.59300 26.558
CFD1612.110.910.4254.630033.261.8
Exp. [33]2992.110.910.4254.593002154
CFD2992.110.910.4254.63002958.4
Disclaimer/Publisher’s Note: The statements, opinions and data contained in all publications are solely those of the individual author(s) and contributor(s) and not of MDPI and/or the editor(s). MDPI and/or the editor(s) disclaim responsibility for any injury to people or property resulting from any ideas, methods, instructions or products referred to in the content.