1. Introduction
Driven by the rapid development of global e-commerce and intelligent logistics, the express delivery sector has experienced explosive growth. According to the latest data from the China Post Office, in 2024, China’s express delivery business volume exceeded 170 billion packages for the first time, with an average daily processing capacity of 480 million [
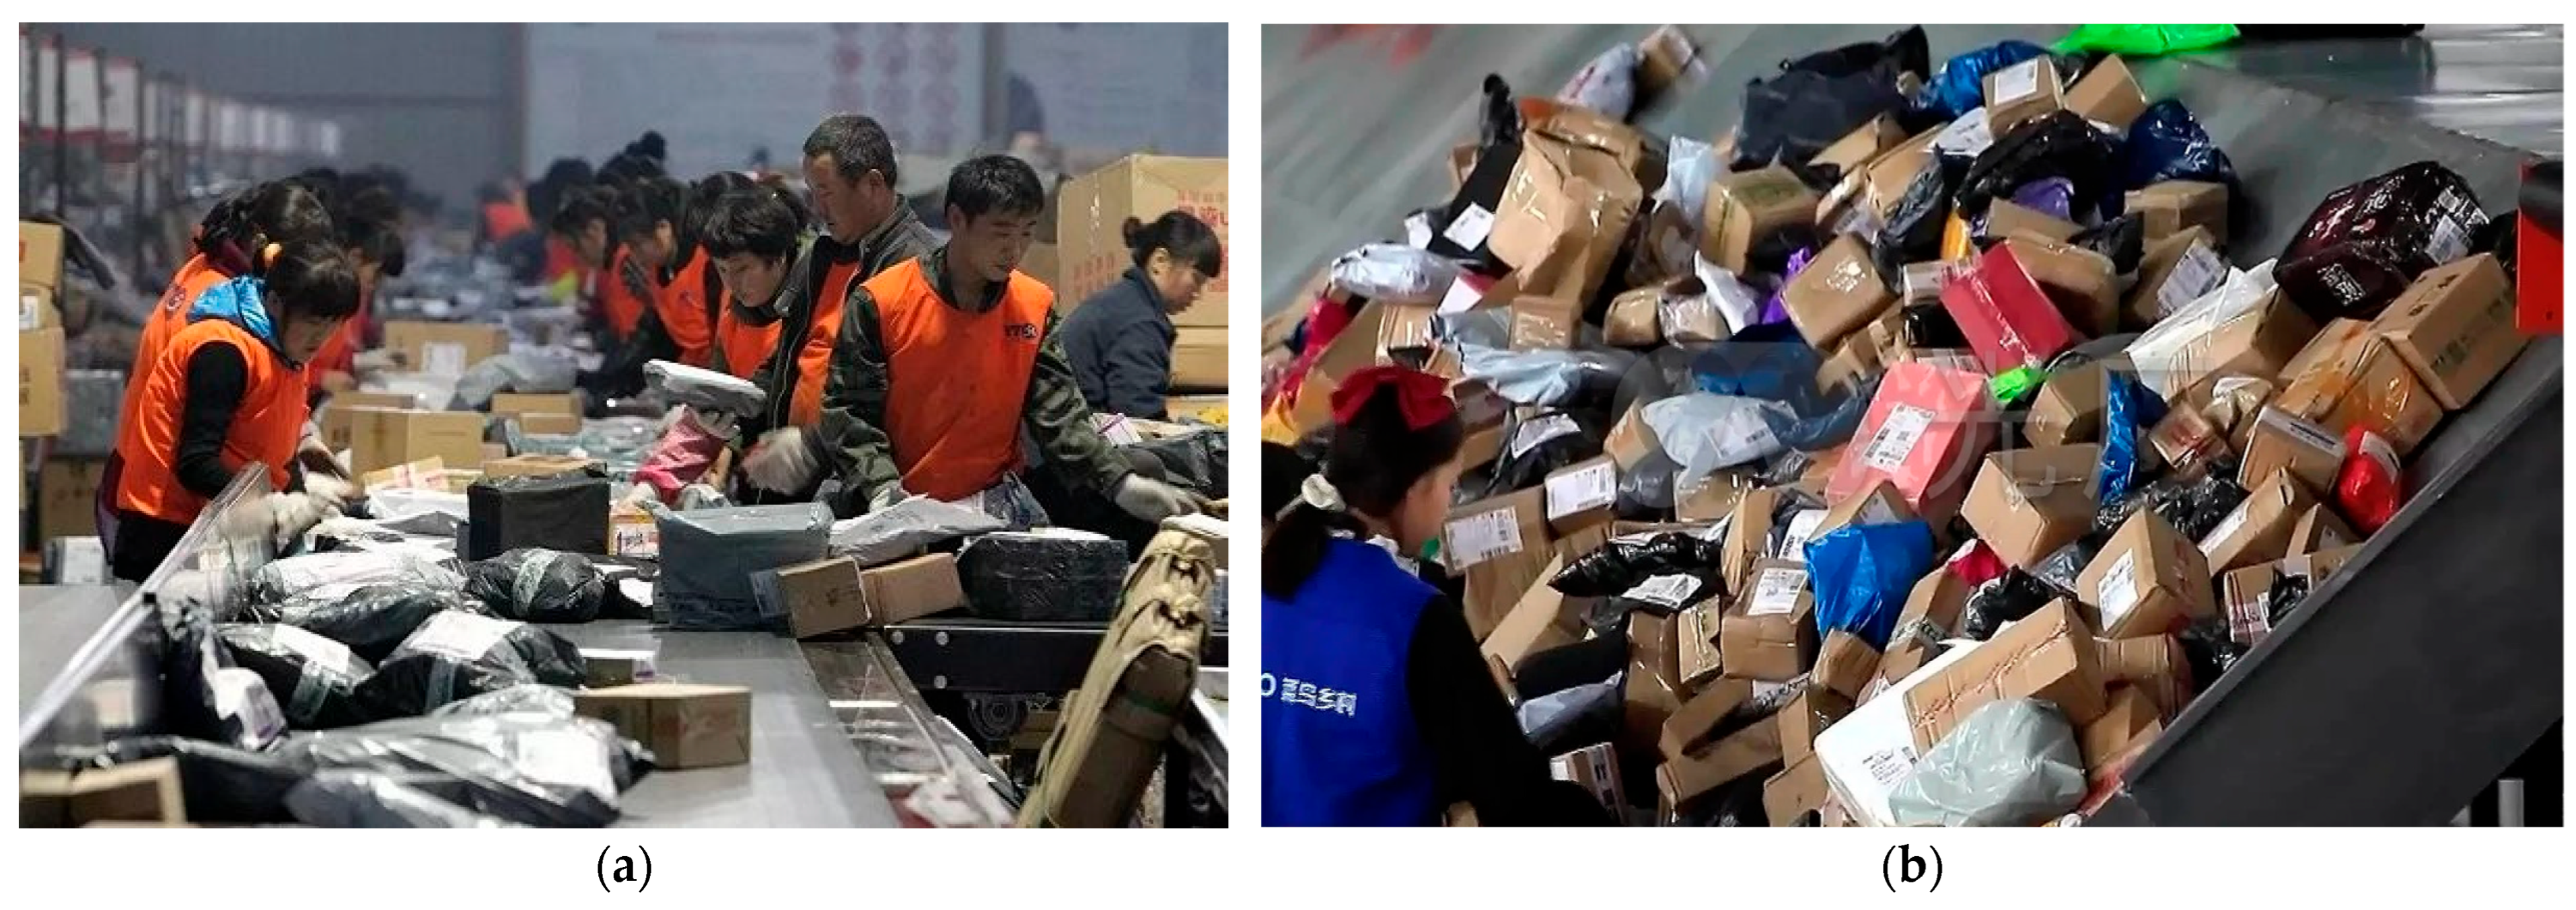
1]. At present, mainstream commercial automatic sorting systems are highly integrated with various technologies, including barcode scanners, RFID, robotic vision, and automated conveying equipment, to enhance overall sorting efficiency and throughput. As illustrated in
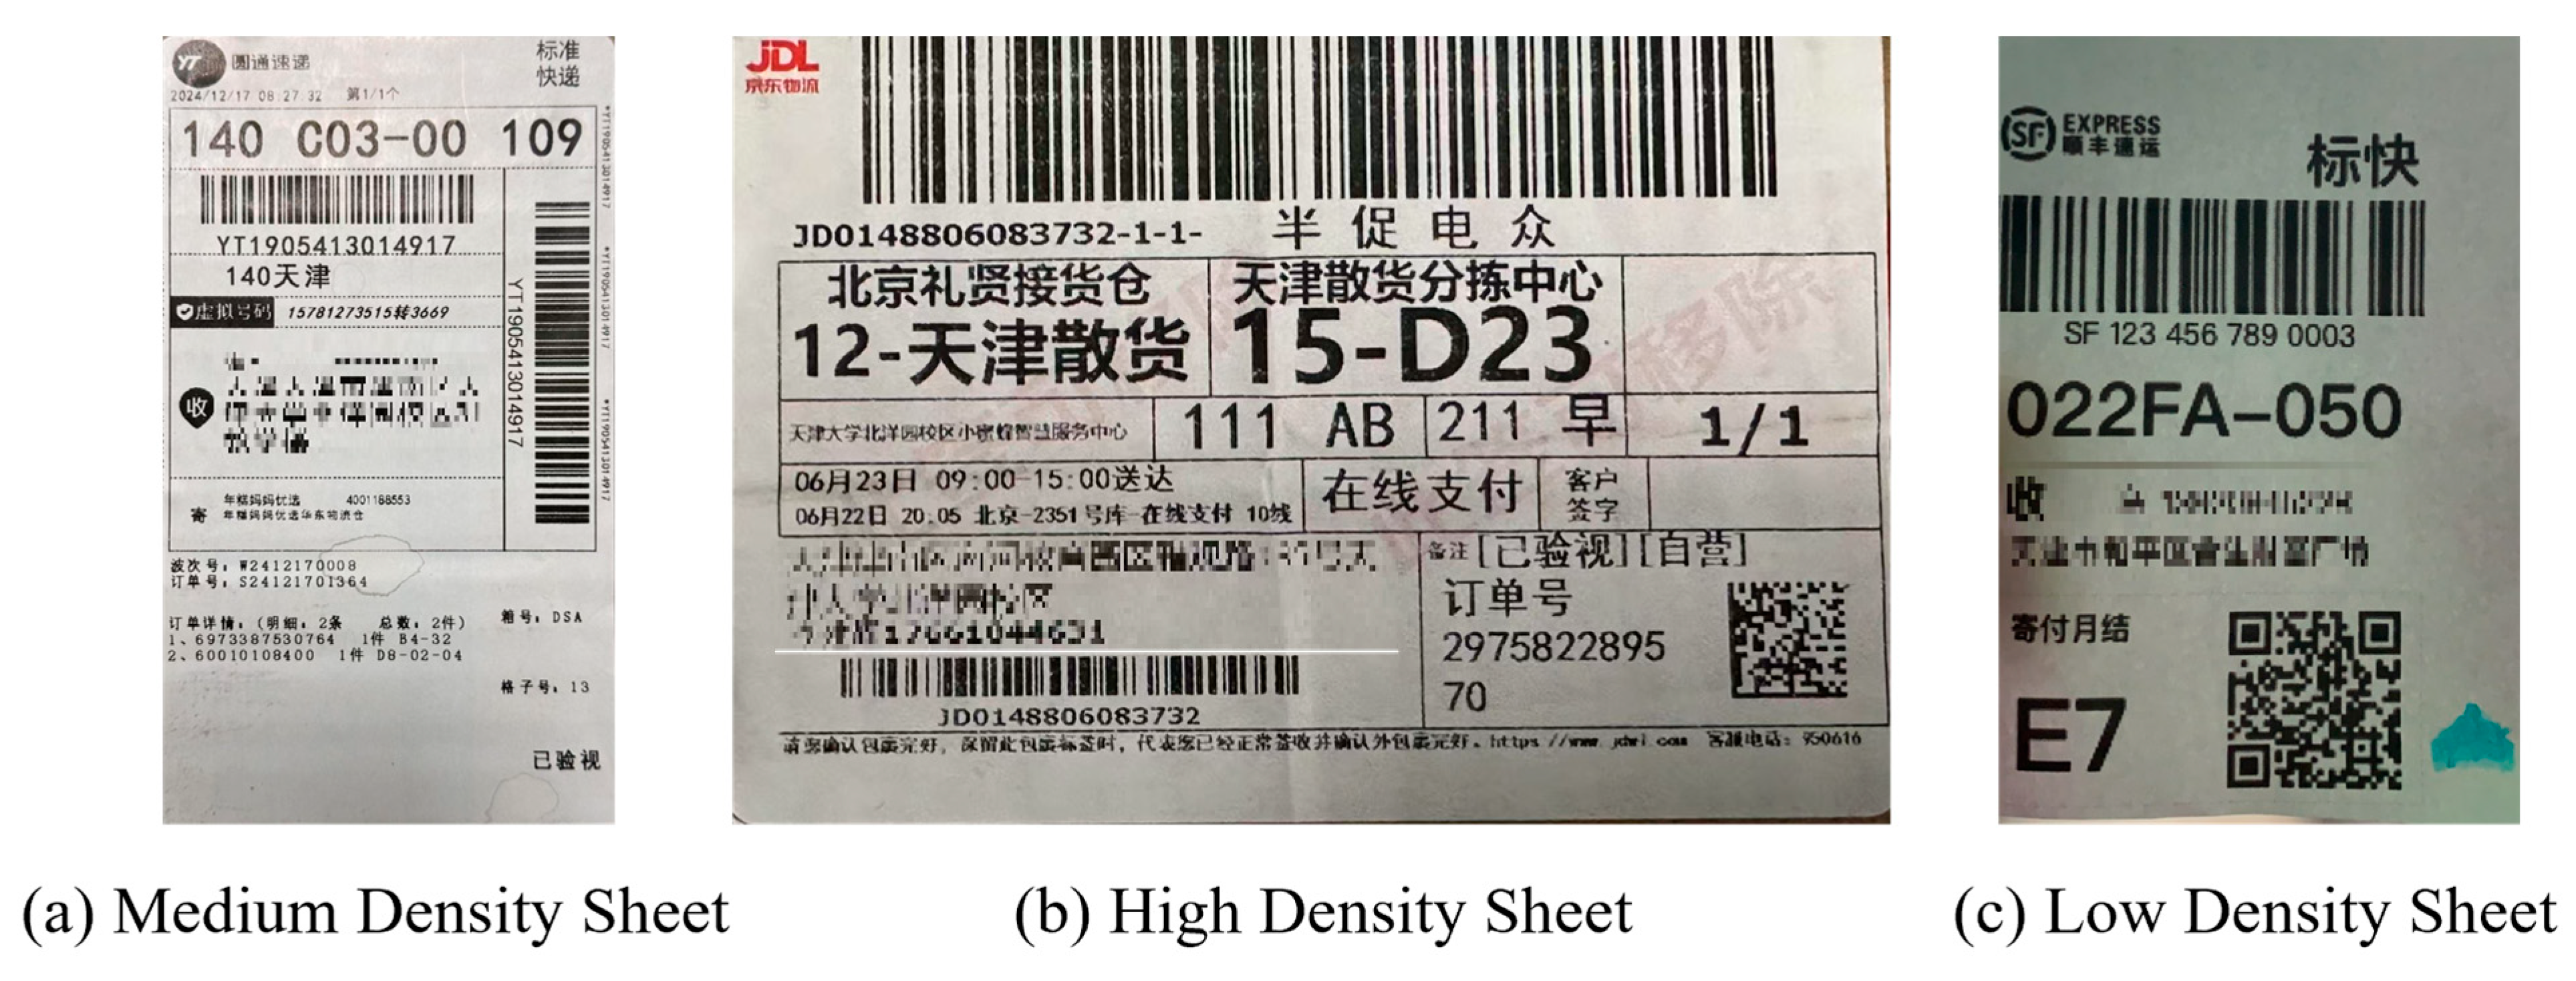
Figure 1, current logistics sorting centers are facing operational pressures due to the accumulation of parcels and a significant imbalance between manual sorting efficiency and processing demand. Efficient sorting has become the primary bottleneck in enhancing the quality and efficiency of the logistics system. As the primary information carrier in the sorting process, the automatic identification technology of the express delivery sheet directly influences both sorting efficiency and accuracy. The express bill, serving as the core carrier of logistics information flow, primarily includes three types of key information: (1) a one-dimensional barcode, which contains the express bill number and logistics routing information, characterized by high coding density and strong fault tolerance; (2) a three-segment code, composed of large font characters that identify the city, outlets, and dispatcher levels, offering intuitive readability; and (3) the user’s personal information, which includes the address and contact details of both the recipient and sender, facilitating the manual review of any anomalies [
2]. These three types of information serve distinct functions in the sorting process: the one-dimensional barcode is utilized for information reading by high-speed automatic sorting equipment; the three-segment code acts as a redundant backup in the event of a barcode failure; and user information is employed during the final manual delivery stage. These three types of information serve distinct functions in the sorting process: the one-dimensional barcode is utilized for information reading by high-speed automatic sorting equipment; the three-segment code acts as a redundant backup in the event of a barcode failure; and user information is provided at the end of the manual delivery process. However, despite the widespread use of traditional optical character recognition (OCR) technology in standard document processing, it encounters significant challenges in real-world logistics scenarios. Issues, such as package stacking and extrusion, result in single-perspective distortion, while uneven illumination in the transportation environment causes image blurriness. Additionally, text and barcode areas may overlap, leading to interference in positioning under dense typesetting, compounded by complex background noise such as tape reflections and stain occlusions. These factors hinder the extraction of key information [
3]. Consequently, the recognition accuracy of traditional OCR in real-world settings falls below 75%, which severely limits the advancement of logistics automation [
4]. It is important to note that while industrial sorting systems frequently incorporate various technologies, such as RFID, robotic vision, and traditional barcode scanners, to enhance overall efficiency, the precise identification and extraction of key information from express delivery sheets remain fundamental requirements for achieving the intelligent sorting and routing of parcels.
In order to achieve accurate sorting, it is essential to first precisely identify the target information area and then extract the semantic content using optical character recognition (OCR). Previous methods for information extraction can be categorized into two main types: traditional digital image processing techniques; and deep learning-driven approaches [
5]. In the traditional method, Huang et al. allocated the three-segment code area using the Halcon visual library and achieved single-field recognition through template matching. However, this approach required customized hardware support, resulting in high deployment costs [
6]. Weihao’s team employed the Hough transform to detect the boundaries of barcodes; however, this method was easily disrupted by surface creases and uneven illumination, leading to a false detection rate of 32% [
7]. Katona et al. proposed a barcode localization algorithm based on morphological operations and the Euclidean distance map, which proved to be more efficient in simple scenarios [
8,
9]. Nevertheless, the recall rate for tainted barcodes was less than 60%. Aramaki et al.’s address region localization algorithm, which is based on connected component analysis, determines the location of the address region by detecting the geometric attributes of connected components in the image in a circular manner. However, it demonstrates poor adaptability to font changes or skewed text [
10]. The deep learning framework significantly enhances robustness through data-driven feature learning [
11], offering a promising alternative to traditional methods. Initial attempts leveraged convolutional neural networks (CNNs) for barcode detection, as pioneered by Zamberletti et al. [
12]; however, the generalization ability of such early approaches was often limited due to insufficient training data. To address complex backgrounds, subsequent research employed more advanced detectors. Kolekar and Ren utilized the SSD detector for barcode positioning, reporting a substantial 45% improvement in detection accuracy compared to traditional methods [
13,
14]; however, challenges remained in handling densely packed fields or overlapping regions. Further pursuing robustness and multi-field capability, Li et al. implemented joint detection of multiple key fields based on the Faster R-CNN network [
15]. While achieving higher accuracy, this approach demanded significant computational resources (e.g., 8 GB GPU memory per thousand images), posing challenges for meeting real-time sorting requirements. Pan et al. developed a parcel detection method, based on the YOLO algorithm, specifically for express stacking scenarios, effectively enhancing target localization capabilities in such complex environments [
16]. Demonstrating the synergy of detection and recognition, R. Shashidhar et al. constructed a license plate system by integrating YOLOv3 with OCR technology, highlighting the practicality of such combined frameworks in dynamic scenes [
17]. Building on YOLO’s efficiency, Xu et al. enhanced the YOLOv4 network, achieving high speed (0.31 s) and accuracy (98.5%), and demonstrated its robustness when combined with Tesseract-OCR for three-segment code recognition [
18]. For structured documents with fixed templates, Liu et al. developed a learning-based recognition model for financial bills, like VAT invoices, overcoming the limitations of rigid template matching [
19]. It is important to highlight that in deployment environments characterized by high throughput and stringent real-time requirements, such as actual express sorting, the YOLO series models—particularly the lightweight variants like YOLOv5s—demonstrate significant advantages in fulfilling real-time processing demands. Their exceptional inference speed and low model complexity make them an appealing choice for industrial edge deployment. This has also been corroborated by recent research in logistics automation [
20]. Despite the advancements made by existing methods, significant challenges remain: traditional schemes rely heavily on manual feature engineering; are sensitive to environmental factors such as changes in illumination and surface deformation; and struggle to address the issue of field overlap in densely typeset documents. Although the deep learning framework enhances positioning accuracy through end-to-end detection, its performance is highly dependent on the quality of the candidate regions produced by the target detection module. When there is spatial overlap between the barcode and the three-segment code region, it can easily lead to OCR recognition errors due to misalignment of the candidate box. Furthermore, most existing methods employ a single-modal decision-making mechanism, prioritizing the recall rate of barcode detection while neglecting text semantic verification. Additionally, they often rely on OCR results to filter out noise but are constrained by character recognition errors. As a result, these methods encounter a trade-off dilemma between accuracy and efficiency in complex logistics scenarios.
In order to address the aforementioned challenges, this paper proposes a three-level collaborative processing method that employs cascade optimization of regional standardization, two-path parallel extraction, and dynamic matching to achieve robust surface information extraction. First, an improved contour detection algorithm, combined with a center of gravity sorting strategy, is utilized to eliminate background interference and correct perspective distortion. The standardized surface image is generated using the lightweight MobileNetV3 for directional classification. Subsequently, a dual-path processing architecture is established, wherein the YOLOv5s model is enhanced to accurately locate barcodes and three-segment codes, while the improved PaddleOCR performs full-text character recognition. Second, a spatial–semantic joint decision-making mechanism is introduced, integrating anti-offset IoU metrics and hierarchical semantic regularization constraints to suppress mismatches through density-adaptive weight adjustment. Finally, a dynamic threshold determination module is designed to output structured sheet information based on comprehensive confidence. The innovative contributions of this paper are as follows:
A region normalization preprocessing technique was developed. By enhancing the contour detection algorithm, implementing perspective correction, and utilizing a lightweight directional classification model, we achieved background interference elimination, geometric distortion correction, and image rotation. This process provides standardized input for subsequent processing;
A dual-path parallel extraction architecture was designed. By enhancing the collaborative optimization of YOLOv5s and PaddleOCR, we achieved positioning-recognition parallel processing, resulting in improved reasoning speed;
An innovative dynamic matching mechanism integrated anti-offset Intersection over Union (IoU) and semantic regularization constraints for the first time, utilizing density perception to enhance matching accuracy.
It is important to note that, unlike the general multi-path OCR architecture, this three-level collaborative framework is specifically designed to address the issue of information overload in logistics sheets. When barcodes, advertising text, and user information are densely overlapped, traditional OCR systems struggle to filter out key fields. This framework achieves semantic information distillation through dynamic matching.
The remainder of this paper is organized as follows.
Section 2 introduces the key technology of the optical character recognition method based on YOLO positioning and intersection over union filtering.
Section 3 presents the experimental results, conducts ablation experiments, and provides a comparative analysis.
Section 4 summarizes the entire text and discusses potential future research directions.
2. Method
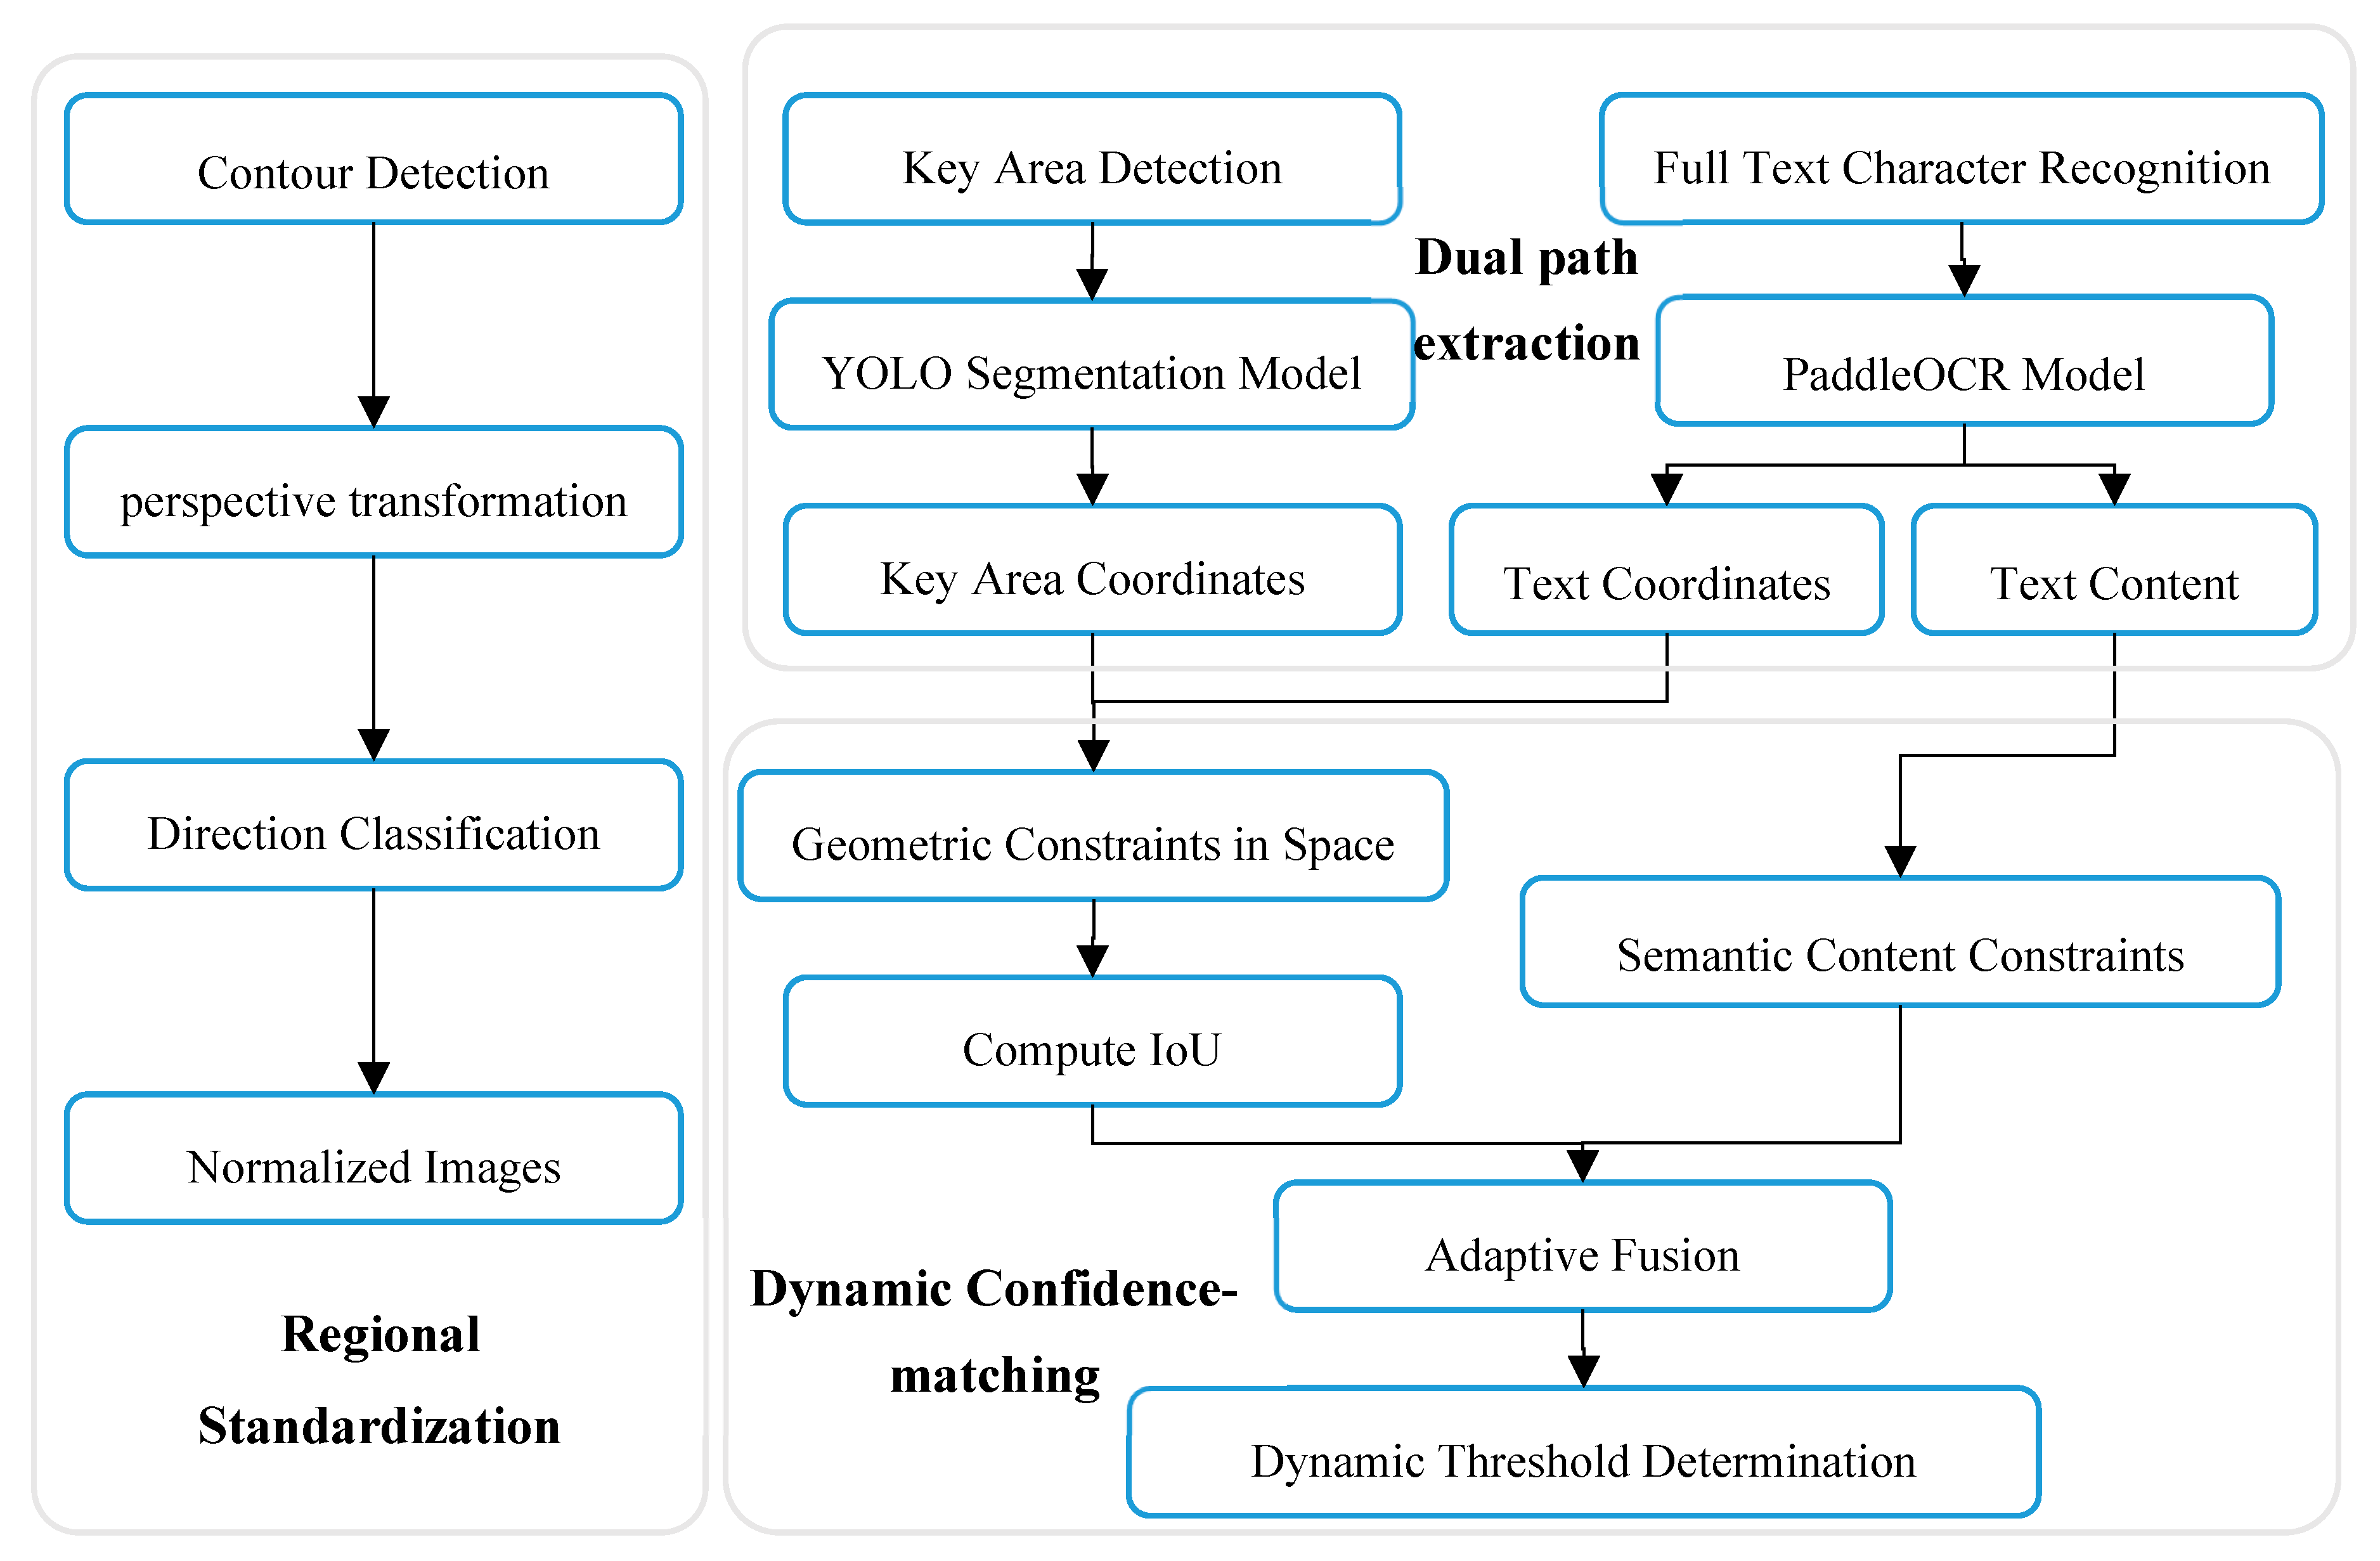
To address the matching failure problem encountered by traditional methods in scenarios, such as detection offset and dense typesetting, we propose a dual-modal collaborative framework. The framework introduces a three-level processing paradigm consisting of regional positioning and normalization; dual-path parallel extraction; and dynamic matching [
21]. First, image distortion is eliminated through geometric correction, resulting in a standardized surface image generated by an enhanced contour detection and geometric correction strategy. Second, the dual-path feature is employed to extract text location and content information in parallel, facilitating the collaborative processing of location and recognition. Third, a density-aware adaptive fusion strategy is proposed, which combines spatial geometric constraints with semantic regular verification. Finally, a dynamic threshold determination module is developed to enable nonlinear adjustments of the threshold based on typesetting density, addressing the issue of fixed threshold adaptation across different scenarios. The overall process is illustrated in
Figure 2. This framework demonstrates significant advantages in the accurate extraction and structured output of character information in complex backgrounds.
It is important to highlight that, for the first time, the dynamic spatial confidence-matching module integrates spatial continuity measurement and semantic regularization constraints through adaptive weight fusion. This innovation overcomes the limitations of traditional fixed-threshold methods and offers a universal solution for logistics order recognition.
2.1. Regional Positioning and Standardization
Image symmetry is highly significant in both the human visual system and machine vision systems. This paper addresses the issue of structural distortion caused by the shooting angle or package compression of express sheet images. The proposed method first restores the geometric symmetry structure through symmetry reconstruction techniques such as perspective correction and direction normalization. This restoration realigns the text and barcode information of the sheet to a regular distribution, thereby providing a unified structural basis for subsequent region detection and character recognition.
In order to address the issue of inaccurate document positioning caused by image distortion, directional deviation, and background interference, the regional positioning and normalization module utilizes YOLOv5 to detect the document area and extract the vertex coordinates [
9]. By applying perspective transformation and directional classification, geometric and rotational corrections are achieved, thereby eliminating deformation interference and providing standardized input for subsequent processing.
2.1.1. Document Region Detection
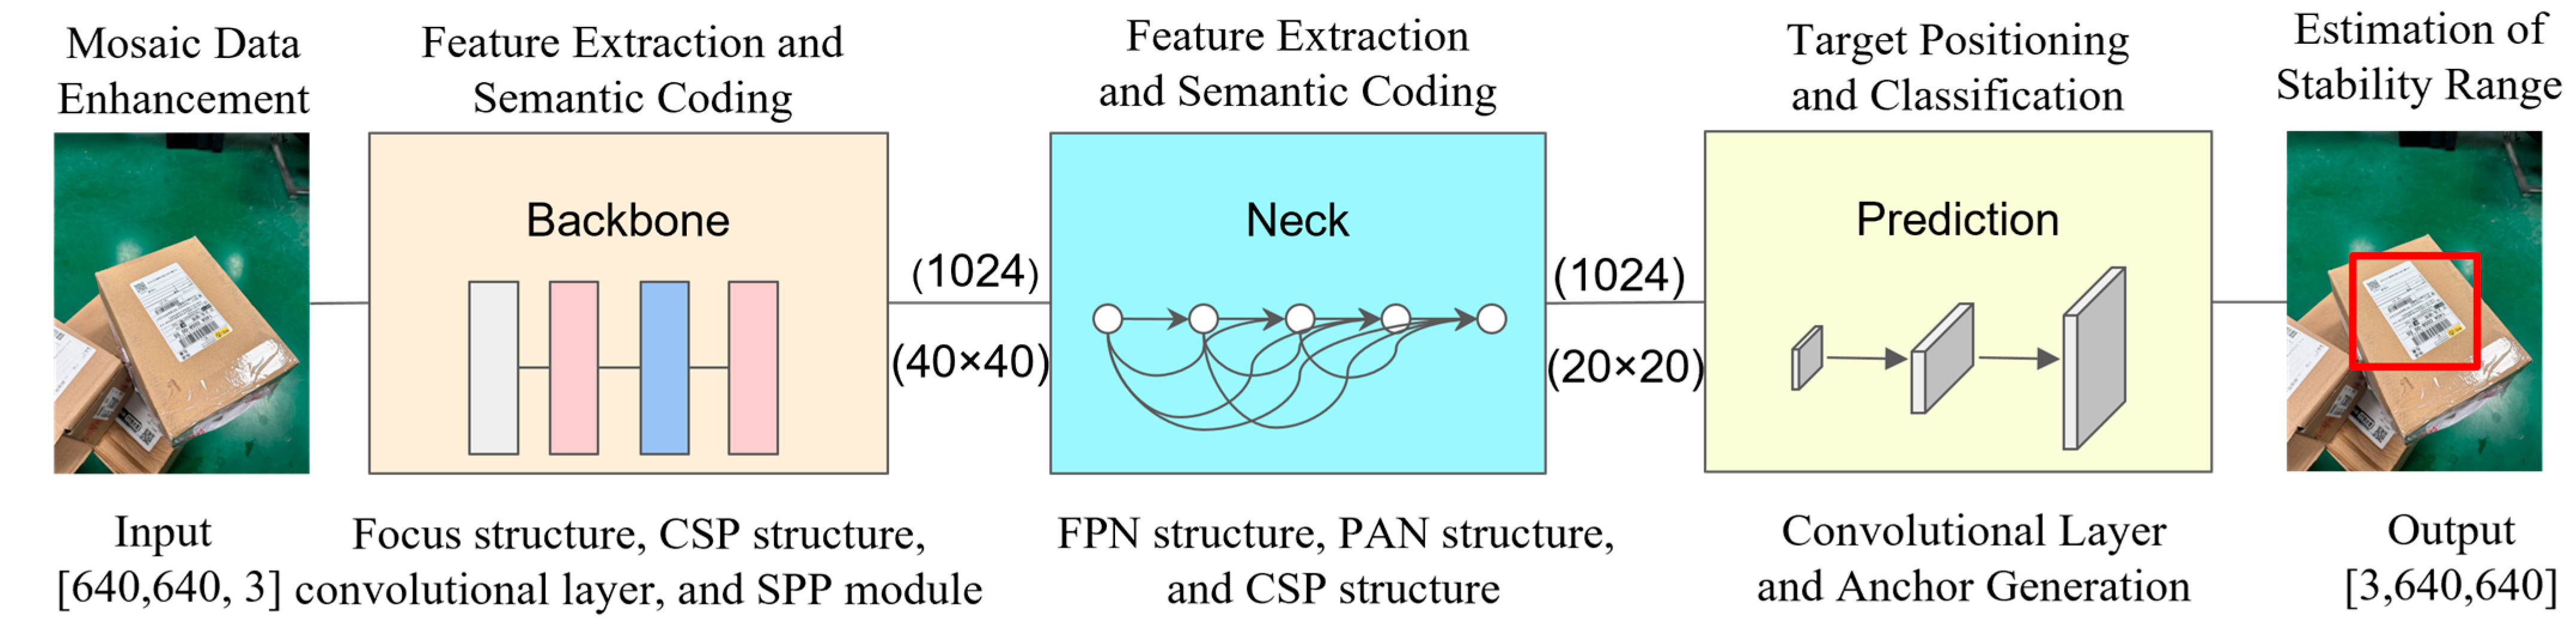
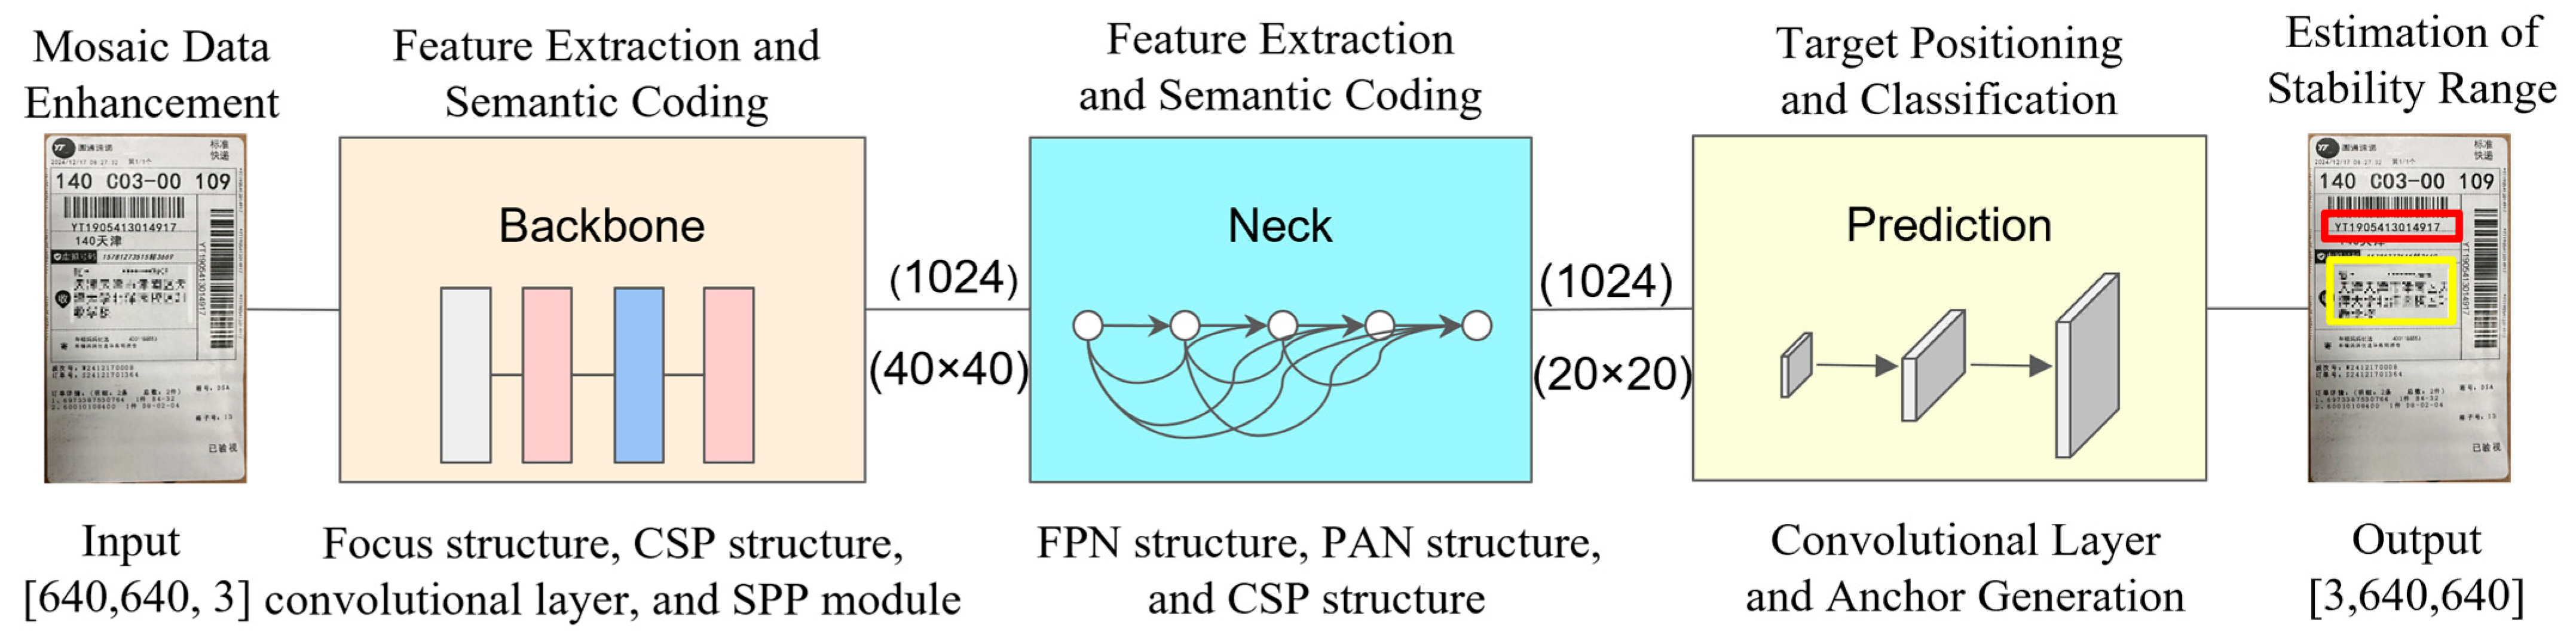
The YOLOv5 model is primarily composed of three components: the feature extraction backbone network (Backbone); the multi-scale feature fusion neck (Neck); and the detection head (YOLO Head) [
22]. As illustrated in
Figure 3, after the input image of the express
sheet is preprocessed and resized to [640, 640, 3] (where the first two values
represent the width and height of the image in pixels, and 3 indicates that the
image contains three color channels: RGB), the CSPDarknet53 backbone network
extracts multi-level features. In the neck component, the FPN + PAN structure
is employed to fuse shallow detail features with deep semantic features, while
the SPP module is utilized to expand the receptive field. The head outputs
three scale feature maps of
,
, and
to detect small, medium, and large targets, respectively. Here,
represents the total number of parameters predicted for each grid position, and
denotes the number of categories. Finally, the input image of the express sheet is tested and the output includes the image containing the predicted sheet area.
The following is a design of the loss function:
Among these,
indicates that the confidence loss is calculated using binary cross-entropy, which measures the accuracy of target existence predictions. For positive samples, the confidence should be close to 1; for negative samples, it should be close to 0. By employing Focal Loss to balance the weights of positive and negative samples [
23], the training bias caused by an excess of background samples is mitigated as follows:
In this context,
represents the number of grids in the feature map (if corresponding).
denotes the number of anchor frames predicted for each grid.
and
is an indicator (1 when the target exists, otherwise 0).
represents the probability that the predicted confidence is activated by the sigmoid function.
and
are the weights for positive and negative samples, respectively.
represents the classification loss, which is utilized to assess the accuracy of category predictions and ensure that the predicted bounding boxes are correctly classified. Each category is predicted independently through multi-label classification, enabling a single object to belong to multiple categories. The classification loss employs binary cross-entropy (BCE) to facilitate multi-label classification as follows:
Among these,
represents the total number of categories (such as the number of single-field face categories).
denotes the true label (0 or 1) for category
.
refers to the unactivated fraction of the model output for category
.
indicates the probability of the category after the activation of the sigmoid function.
represents the regression box loss, which is utilized to optimize the position and size of the predicted bounding box, ensuring that it aligns as closely as possible with the actual bounding box. The Complete Intersection over Union (CIoU) metric is employed, which not only accounts for the overlapping area but also incorporates the distance between the center points and a penalty term for the aspect ratio [
24]. This approach addresses the limitation of traditional Intersection over Union (IoU), which lacks sensitivity to box alignment. The regression box loss comprehensively evaluates the overlap rate, center distance, and aspect ratio consistency between the predicted bounding box and the actual bounding box:
Among these,
represents the Euclidean distance between the center point of the predicted box and the actual box;
denotes the diagonal length of the minimum enclosing area of the two boxes;
is the weight coefficient; and
is the aspect ratio penalty term, as follows:
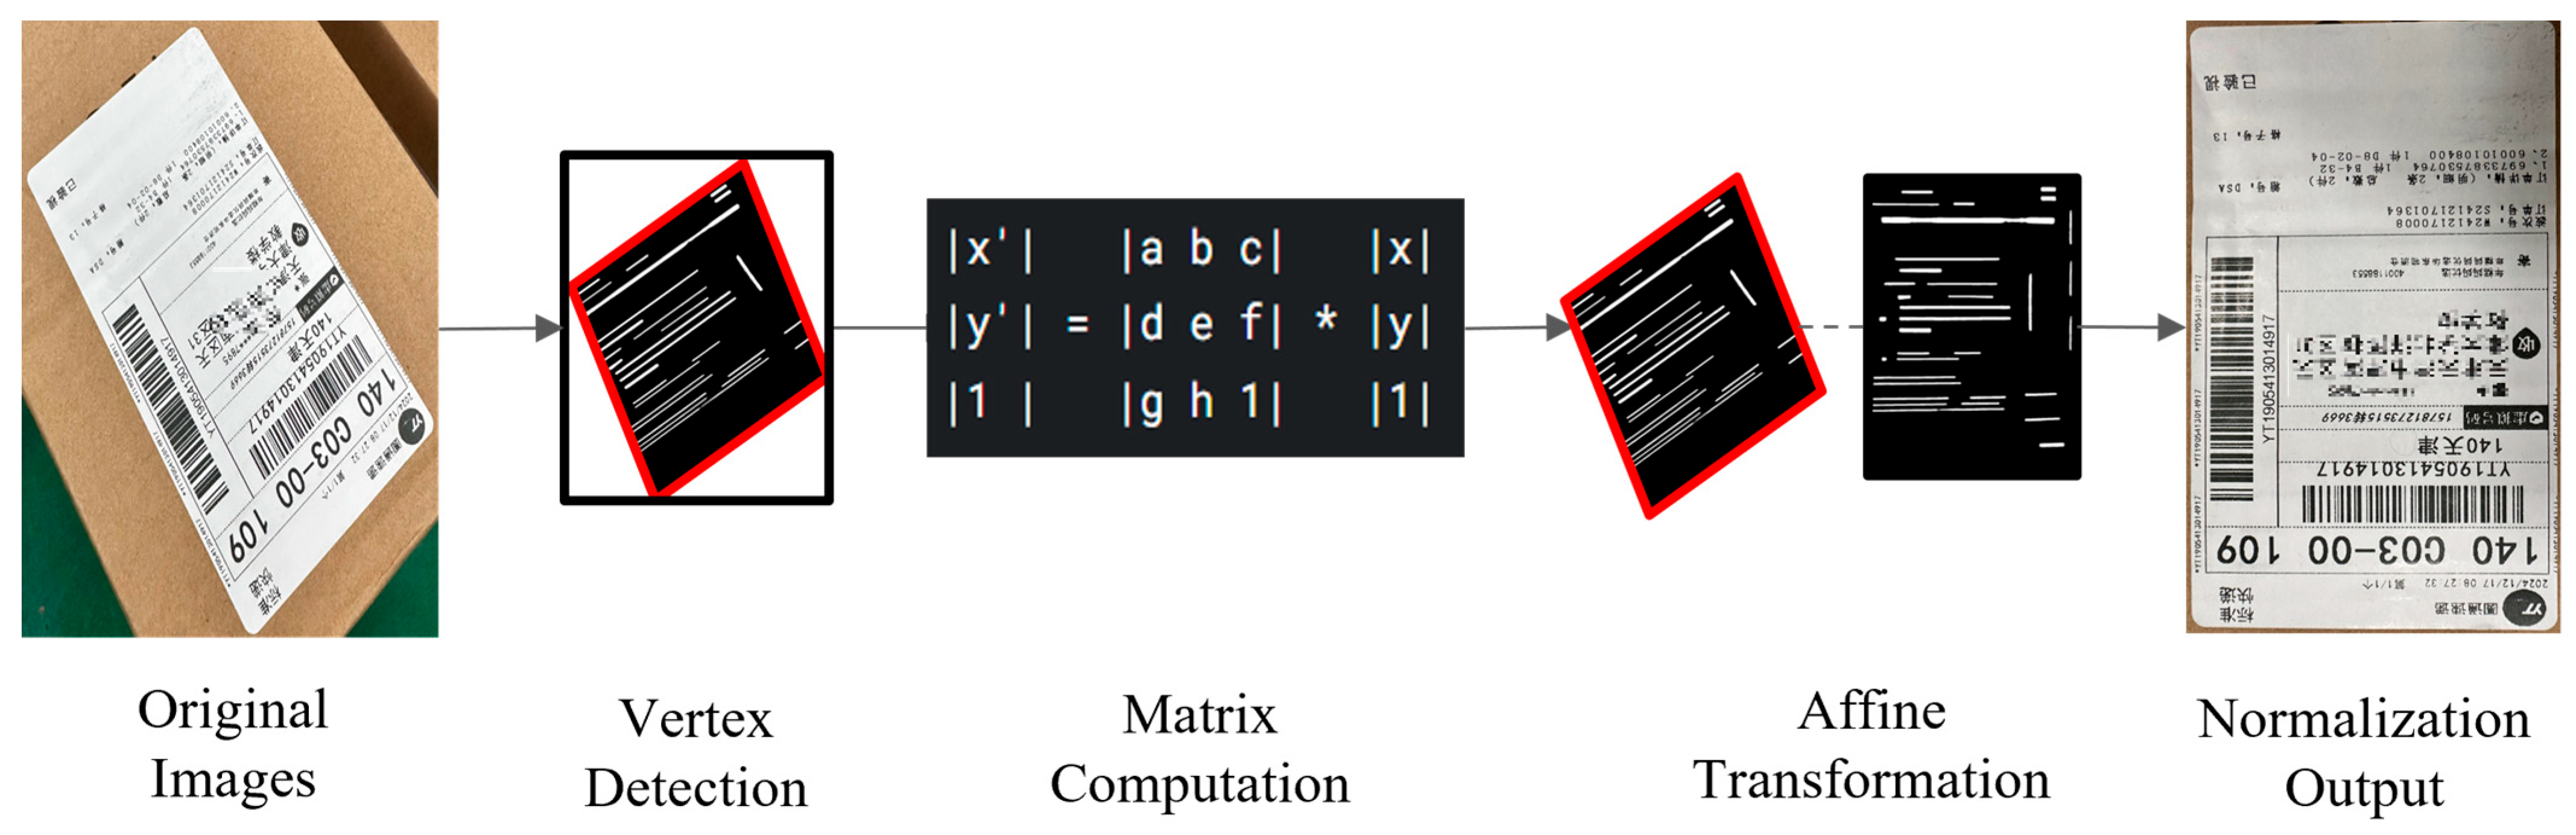
2.1.2. Geometric Correction
The surface single four-vertex coordinate
is obtained through Canny operator edge detection and the Douglas–Peucker algorithm for polygon approximation, as illustrated in
Figure 4 [
25]. The four corner points are sorted in the following order: upper left, upper right, lower right, and lower left, and are denoted as
.
Considering that the four vertices of the document may be arranged in a disorderly manner due to detection errors or distortions, a direct perspective transformation may result in correction failure because of the disordered vertex sequence. By calculating the centroid as the origin of the polar coordinate system and using the polar coordinate angle of each vertex relative to the centroid as the sorting reference, the clockwise order of the vertices can be reliably determined (starting from the upper left). This approach eliminates ambiguity in the vertex arrangement and ensures the accuracy of the perspective transformation matrix. The correct solution involves calculating the centroid
:
The coordinates and
of each corner point are calculated and classified as benchmarks, which can quickly distinguish the upper left (minimum coordinates) and lower right (maximum coordinates) vertices at the ‘diagonal’ position. For this purpose, the coordinates of points
and
are defined. The upper left point,
is the smallest (closest to the origin
and located in the upper left of the center of mass). The lower right point,
is the largest (farthest from the origin and located in the lower right of the center of mass). The remaining two points are distinguished by their
coordinates: the upper right point is the one with a larger
(to the right side of the center of mass), while the lower left point,
, is the smaller point (to the left side of the center of mass). The expression is as follows:
Considering that the quadrilateral in the original image exhibits a non-standard shape due to perspective distortion, and that there is no clear mapping reference between the original vertices and the target vertices, defining the target rectangle provides a unified geometric reference for the perspective transformation. This definition establishes a unique correspondence between the vertices of the original quadrilateral and the target rectangle, ensuring the accuracy of the coordinate mapping when solving the transformation matrix. The target rectangle is defined as an axis-aligned rectangle and the vertex coordinates are as follows:
where
represents the width and
represents the height.
Furthermore, the perspective transformation maps the quadrilateral in the original image to the target rectangle [
26]. The relationship of the transformation is expressed in homogeneous coordinates, as follows:
where (
x,
y) represents
the coordinates of the original point and
denotes the coordinates of the target point.
For each corresponding point
, there are:
After completing the process, the linear equation is obtained:
Among these, four pairs of corresponding points yield a total of eight equations, with the unknown variable represented as
.
The equation is expressed as
, where:
is the coefficient matrix of
, with each row corresponding to an equation. The perspective transformation matrix
is derived using the least squares method or by directly solving the homogeneous equations. The obtained matrix
is used to perform a perspective transformation on the original image, as follows:
The essence of the aforementioned process is to reverse-map each pixel
of the target image back to the original image coordinates
and interpolate the pixel values. The result of the perspective transformation is illustrated in
Figure 4.
Finally, the rotation classification is performed, and the standardized images, following perspective transformation, are classified using the lightweight MobileNetV3 architecture [
27]. This approach incorporates an inverted residual structure to enhance feature representation capabilities. Additionally, the SE channel attention module is employed to improve direction-sensitive features, while the h-swish activation function is utilized to balance computational efficiency with nonlinear fitting [
28,
29]. Furthermore, the output consists of a four-type directional probability distribution for the entire image, indicating the confidence level for each direction. The angle corresponding to the maximum probability is selected as the prediction result, ensuring that the text reading direction is aligned to 0°. The classification results are illustrated in
Figure 5.
2.2. Dual-Path Parallel Extraction
In order to address the challenge of separating field locations from text content extraction in complex scenarios, the dual-path parallel extraction module enables efficient collaborative extraction of field spatial coordinates and semantic content. This is achieved through the dual-path parallel processing of key region detection and full-text character recognition, providing a reliable basis for accurate positioning and text association data for dynamic matching.
2.2.1. Key Area Detection
The YOLO target detection model is employed to identify key information areas. A field-level positioning model is developed for essential fields, such as ‘recipient name,’ ‘telephone number,’ ‘address,’ and ‘delivery order number’, within the dataset. YOLOv5s serves as the backbone network. This model features a lightweight architecture within the YOLOv5 series, achieving efficient feature extraction by reducing both the network depth and the number of channels. This design significantly enhances inference speed while maintaining detection accuracy. Its compact structure is particularly well-suited for multi-scale target detection in complex backgrounds, especially in resource-constrained environments. The results of the key area detection, which offers highly reliable spatial coordinate input for dynamic matching, are presented in
Figure 6.
2.2.2. Full-Text Character Recognition
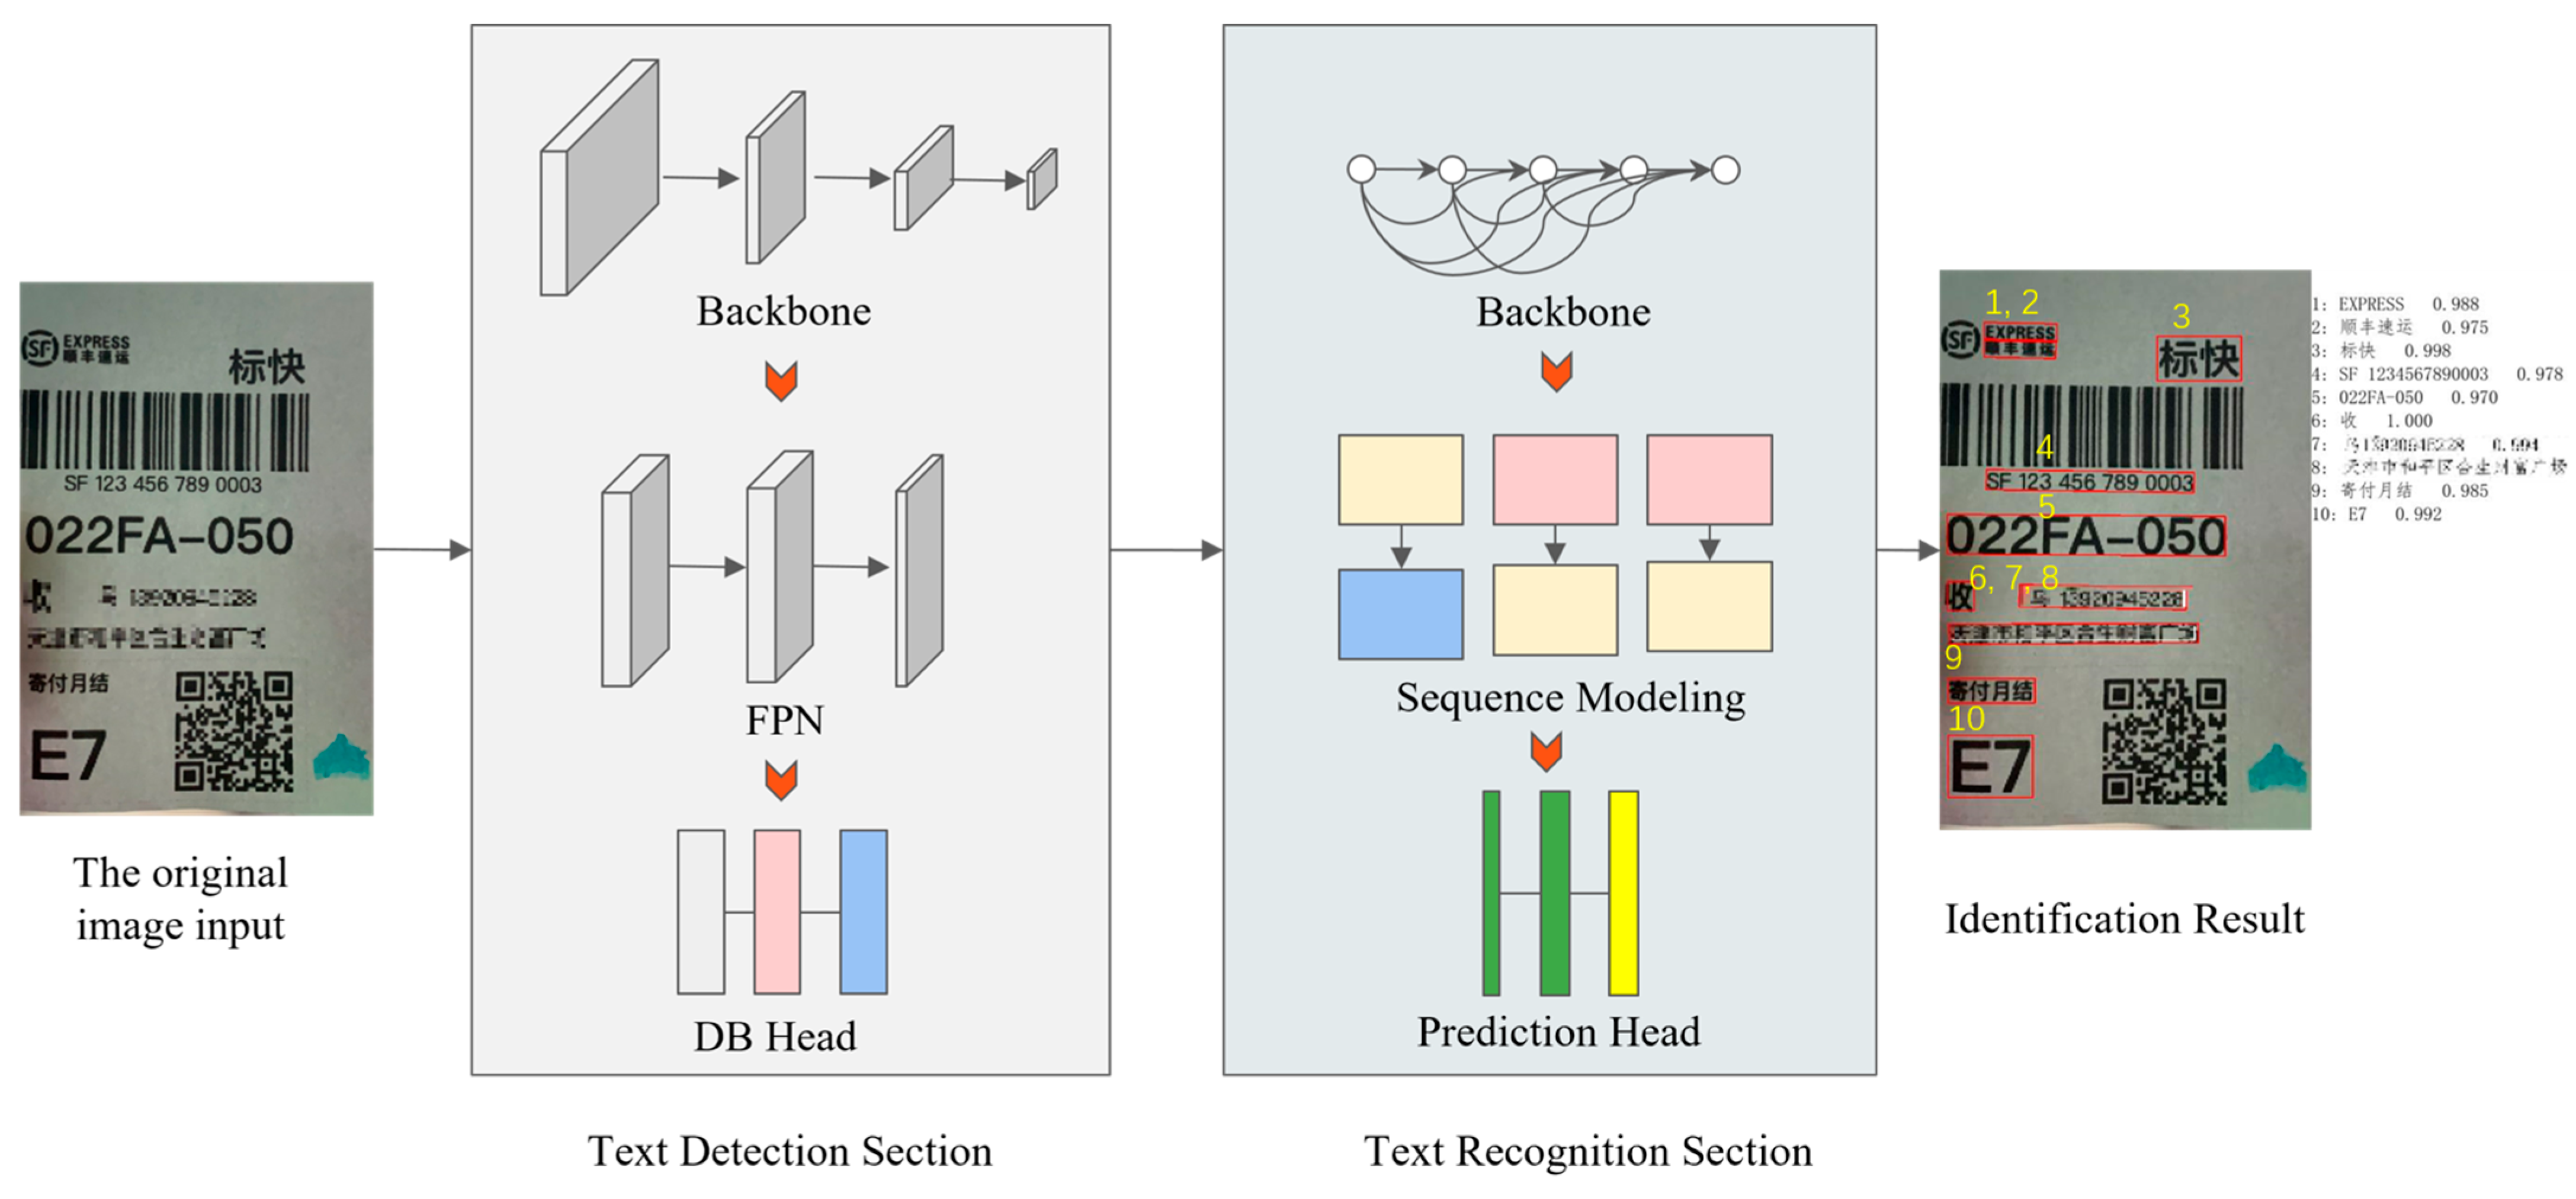
The PaddleOCR model is designed for character recognition and is primarily composed of three components: the text detection network; the direction classification network; and the text recognition network [
30]. The text detection network consists of three elements: the Backbone; the Feature Pyramid Network (FPN); and the DB Head. The original image is normalized and its size is adjusted to
. After identifying the text areas within the image, the coordinates of the text boxes are output in the format
, where N represents the number of detected text instances [
31]. In the direction classification network, the detected text box image is input and the corrected image is output. The text recognition network comprises three components: Backbone; Sequence Modeling; and Prediction Head. This network is designed to identify the text content by taking the corrected image as input and producing a text string as output. The final recognition result is illustrated in
Figure 7. Its recognition text and confidence constitute the decision basis of the semantic constraints.
To address the issues of error transmission and the imbalance in multi-objective optimization among text detection, direction correction, and character recognition tasks, we have designed a loss function that coordinates constraint feature expression and optimization direction through weight distribution and a multi-task joint-learning mechanism. This approach aims to enhance the robustness of the end-to-end system. Specifically, the designed loss function is as follows:
Among these, the weights are assigned values of
,
, and
, which represent the weight coefficients for text detection loss (
), direction classification loss (
), and text recognition loss (
), respectively.
Text detection loss
adopts a dynamic differentiable binarization loss, which consists of three components:
Among these,
and
β are
weight coefficients used to balance the contributions of different loss
components to the total loss.
First, the probability map loss
supervises text region segmentation using binary cross-entropy, differentiates between text and background pixels, and enhances the boundary accuracy of the detection box:
Here,
represents the mask of the actual text area (0 or 1), while
denotes the probability map generated by the model output.
Second, the threshold graph loss supervises dynamic threshold graph learning through the L1 loss, enhancing robustness against blurred or unevenly illuminated text, as follows:
Among these,
represents the predicted threshold map, while
denotes the supervised threshold map generated based on the actual text boundary.
Finally, the binary image loss
jointly optimizes both the probability map and the threshold map, resulting in high-quality segmentation outcomes through differentiable binarization operations:
Here,
represents the result of differentiable binarization,
denotes the actual binary image, and
is the scaling factor;
The direction classification loss
employs the standard cross-entropy loss to ensure the accuracy of text direction correction and to prevent recognition errors caused by reversed text:
where
represents the true direction label (0° or 180°) and
signifies the probability distribution of the predicted direction;
The text recognition loss
consists of two components [
32], each tailored to different scenarios:
First, CTC loses
by directly modeling sequence-to-tag mappings, eliminating the need for character-by-character alignment in complex typesetting text:
Among these,
is all possible character paths,
is the effective alignment path set of the label, and
is the input feature sequence.
Second, attentionlLoss
captures the dependencies between characters using the attention mechanism [
4], thereby enhancing recognition capabilities for long texts and handwritten content:
Here,
represents the real character of step
,
denotes the preorder character, and
signifies the input feature.
2.3. Dynamic Confidence-Matching
In order to address the issue of low robustness in single constraint matching within dense typesetting and detection offset scenarios, a dynamic confidence-matching module has been developed. This module employs dual constraints, including anti-offset Intersection over Union (IoU) measurement and regularized semantic matching. Additionally, it incorporates a density-aware adaptive weight fusion and a dynamic threshold determination mechanism. These innovations facilitate spatial–semantic joint decision-making, significantly enhancing the accuracy and resilience of field–content association in complex logistics menus. It is important to note that the detection box and text block of the dual-path output are filtered using a confidence threshold and geometric correction. This process ensures that the dynamic matching module receives highly reliable input.
2.3.1. Spatial Geometric Constraints
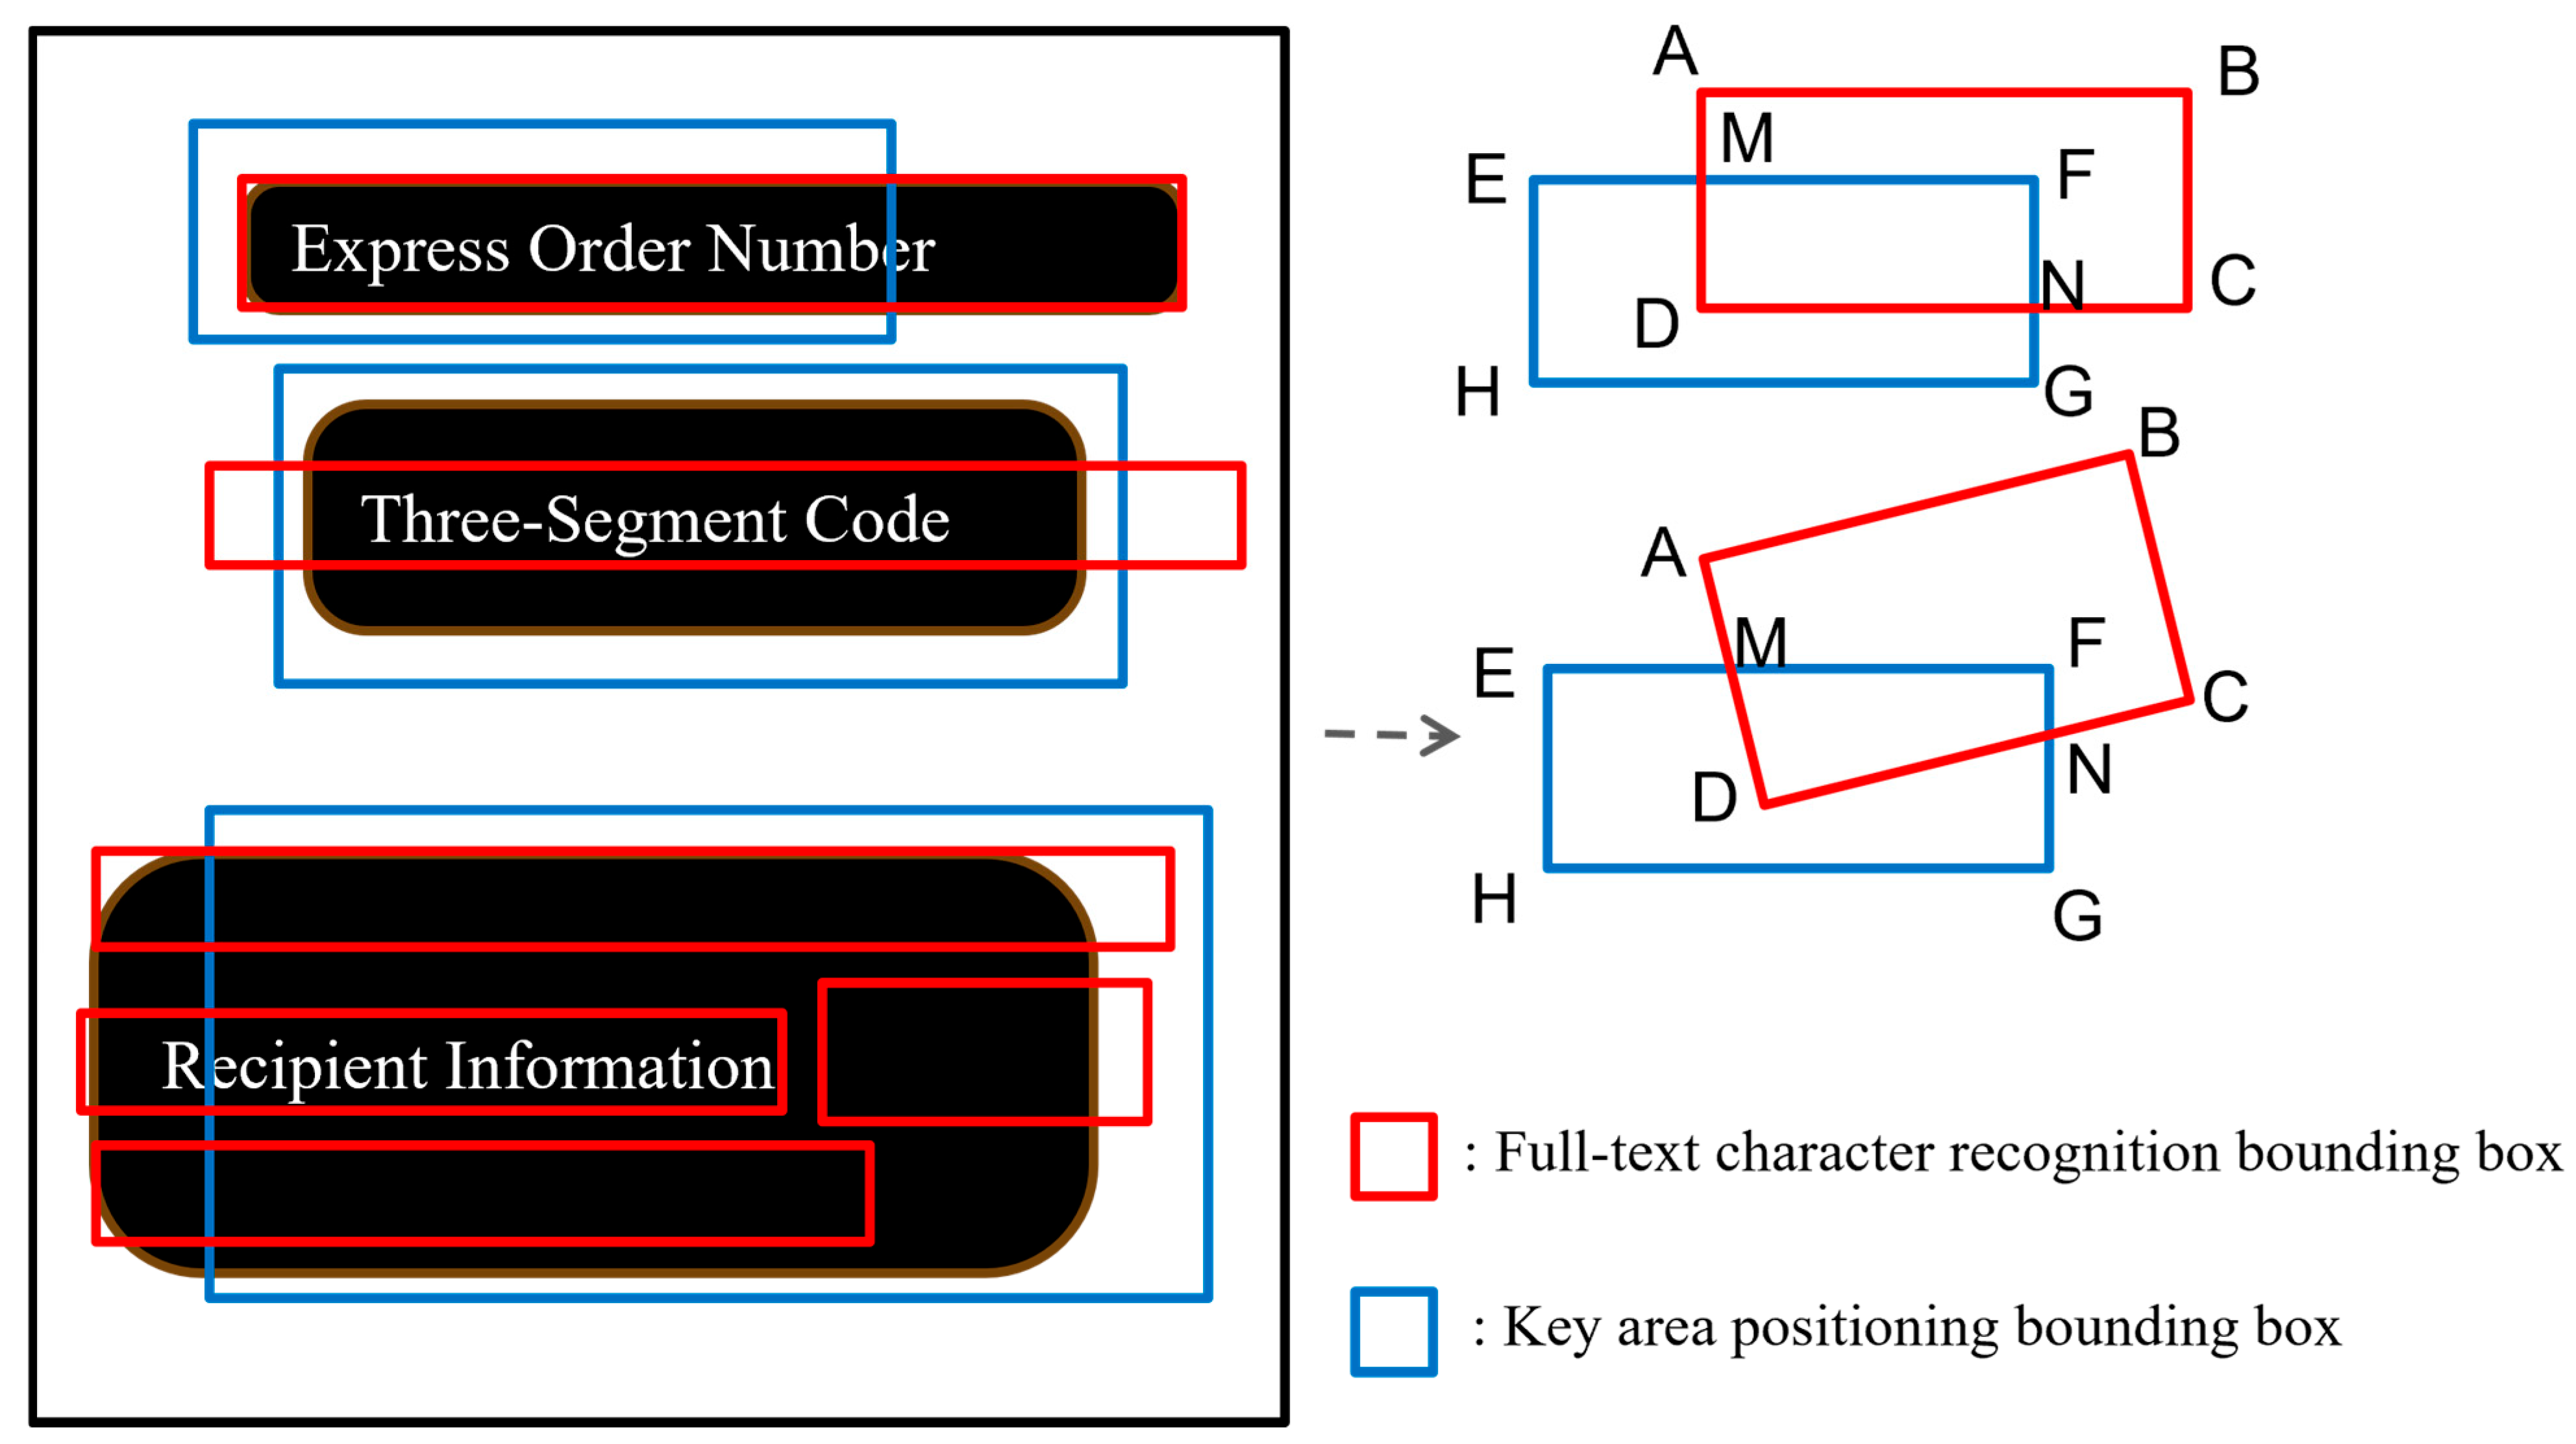
Considering that the single image of the express delivery surface has been rotated, the minimum flat circumscribed rectangle of the full-text character recognition bounding box (resulting from OCR text line detection) and the key area positioning bounding box (derived from YOLOv5 field detection) are employed to standardize the coordinate representation format of the two bounding boxes, as illustrated in
Figure 8. The geometric alignment strategy effectively addresses the matching failures caused by slight offsets in the detection box.
In order to address the issue that traditional fixed threshold methods can lead to mismatches when the detection frame is offset or overlapped, the quantitative spatial overlap degree aims to dynamically assess the positional deviation of the detection frame using an anti-offset continuous geometric metric. This approach overcomes the sensitivity of discrete thresholds to minor displacements and provides a clear geometric similarity foundation for subsequent spatial–semantic joint constraints. The formula for calculating the overlap degree of the detection frame space is as follows:
where
represents the coincidence degree of two rectangular frames and denotes the area of the rectangular frame.
It is important to note that the Intersection over Union (IoU) exhibits anti-offset characteristics; its value will continuously change with the offset of the detection frame [
33]. Compared to traditional fixed threshold methods, IoU can significantly enhance robustness against detection errors.
2.3.2. Semantic Content Constraints
To address the issue of mis-association arising from spatial constraints when the content of fields is similar or densely overlapped—such as when the Intersection over Union (IoU) of adjacent detection boxes is high but semantically independent—this paper introduces semantic content constraints. It combines keyword matching with regular expression verification to enhance the semantic consistency between field content and to prevent logical errors that may result from relying solely on geometric matching. In the implementation of semantic content constraints, a series of field keywords and their corresponding regular expressions are predefined. For example, the format for the ‘telephone’ field corresponds to ‘3 digits followed by 8 digits’. Additionally, fuzzy matching is supported, allowing for the omission of certain characters in fields such as ‘address’.
First, the keyword library is traversed for each detected field and keyword matching is performed to determine whether the text content
, identified by OCR, contains field keywords (such as ‘telephone’):
Among these,
represents the keyword and regular expression for the field, while
denotes the complete matching score of the keyword.
Second, a regular expression-matching process is conducted to extract the substrings that conform to the specified regular expression within the text content
, identified by Optical Character Recognition (OCR). Additionally, the matching ratio is calculated as follows:
where
represents the score obtained from matching a regular expression.
To calculate the current field score
, the weighted sum of the obtained scores is computed as follows:
Among these, the weight defaults to
and
.
In addition, to facilitate the subsequent calculations, semantic similarity is divided into three intervals, as shown in
Table 1.
2.3.3. Adaptive Fusion
To address the issue of matching deviation caused by the weight rigidity of a single constraint under varying layout densities, the adaptive fusion module achieves a sparse scene through dynamic weight distribution based on the density of the detection box. This is combined with a linear weighted fusion formula that incorporates both spatial geometry and semantic content confidence. The elastic decision-making mechanism, which relies on spatial positioning and emphasizes semantic correlation in dense scenes, effectively balances the conflict between positioning accuracy and semantic logic in complex logistics sheets. The fusion formula is defined as follows:
Among these,
guarantees that the total score range is
.
and
depend on the density of the detection box. Furthermore, the density of the detection box is calculated as the total area
of all detection boxes divided by the total area of the image, resulting in the density
of the detection box:
where
and
represent the width and height of the image, respectively, and the value range of
is
.
In addition, to achieve high-efficiency calculations, the detection frame density is divided into three adjustment intervals, as shown in
Table 2.
2.3.4. Adaptive Fusion Dynamic Threshold Determination
In order to address the mismatch problem caused by a fixed threshold when typesetting density varies—such as false filtering in dense areas and false recall in sparse areas—the dynamic threshold module implements an adaptive threshold that adjusts according to density. This adjustment is achieved through a sigmoid nonlinear mapping method driven by the detection frame density. In low-density scenes, the threshold is reduced to enhance the recall rate, while in high-density scenes, the threshold is increased to mitigate mismatches. This approach significantly optimizes the matching robustness of complex facets.
First, the calculated detection frame density
is input into the density mapping function. The sigmoid function is employed to non-linearly map the density, thereby compressing the influence of extreme density values. The formula for calculating the density mapping factor
is as follows:
Second, the dynamic threshold is calculated. Assuming that the basic threshold is denoted as
and the adjustment range is represented by
, the formula for calculating the dynamic threshold
is as follows:
The basic threshold serves as the default value in the medium-density scenario, which is utilized to balance the recall rate and the mismatch rate. The adjustment range enables the threshold to change dynamically within the interval.
The decision logic is as follows:
Among these, a value of 1 indicates that the field positioning box successfully matches the OCR text block, while a value of 0 signifies that the match has failed and requires exclusion or manual review.
Through the above description, it is evident that in medium-density scenes, the threshold maintains the reference value, resulting in a balanced recall rate and mismatch rate. This makes it suitable for conventional layout sheets such as those containing address information. In extreme scenes where text spacing is minimal (less than 5 pixels), the threshold is increased to 0.7 to filter out erroneous associations caused by spatial overlap. For instance, when the Intersection over Union (IoU) between an adjacent phone number and an address box is high but semantically unrelated, this adjustment is crucial. In cases of sparse field distribution, the threshold is reduced to 0.5 to prevent the loss of correct matches due to slight coordinate offsets such as with isolated express order boxes. The density of these distributions is illustrated in
Figure 9.
3. Experiment
This experiment follows a standardized process. First, two types of specialized datasets are constructed: the complete face recognition dataset and the effective information recognition dataset. After cleaning and labeling, the data are divided into training, validation, and test sets at a ratio of 8:1:1. Next, based on the YOLOv5 architecture, the region detection and field recognition model is trained in stages, utilizing multi-task loss joint optimization. Finally, quantitative evaluations are conducted on the independent test set using metrics such as average accuracy and F1 score. All experiments are repeated three times to calculate the mean, ensuring statistical significance.
3.1. Dataset Construction
In order to enhance the accuracy and robustness of the facet recognition model, this paper constructs two new datasets based on the two processes of facet recognition, which are named ‘overall facet recognition dataset’ and ‘effective information recognition dataset’. All datasets encompass a variety of complex scenes, with a total of 12,000 images collected. Each image is accompanied by detailed labels to ensure that the model can be effectively trained and tested across a range of individual scenes. The specific dataset structure and statistical data are presented in
Table 3.
The dataset labeling employs the following strategies:
The total surface area: the bounding box is utilized to define the surface unit and indicate the angle of inclination and the degree of deformation of the surface.
Effective Information Area: this includes fine-grained labeling of key fields, such as express delivery number, recipient information, and address, including character position and category labels.
Interference information annotation: non-target areas, such as advertising text and irrelevant patterns, are annotated to enhance model robustness during training.
In the data-cleaning process, images that are blurred, overexposed, or occupy a small proportion (less than 1% of the image area) are eliminated. Ultimately, 11,500 qualified samples are retained. The two types of datasets are divided at a ratio of 8:1:1, comprising 9200 training sets, 1150 validation sets, and 1150 test sets.
3.1.1. Overall Facet Recognition Dataset
The overall facet recognition dataset aims to address the challenges of disordered stacking of logistics parcels, the small proportion of face sheets, and complex postures. The specific construction method is as follows.
The first aspect is scene diversity design. To account for the variety of materials, different forms of logistics packaging—such as envelopes, express boxes, and plastic bags—are selected to fully capture natural interference factors, including shadows, reflections, and stains present in the actual environment (see
Figure 10a–f). This approach addresses complex sorting conditions such as stacking and occlusion. Additionally, recognizing that parcels are prone to extrusion and friction during logistics transportation, the manipulator adjusts the angle of the parcel to create deformation images such as face-to-face inclination (±45°), wrinkles, and tears (see
Figure 10g–l). This simulates the abnormal postures and physical damage that can occur due to mechanical collisions or manual handling during the real sorting process.
In the data acquisition process, images are collected at intervals of 5 cm, ranging from 10 cm to 100 cm, resulting in the generation of single samples of various sizes. The minimum size for these samples is 32 × 32 pixels and a total of 6000 images are collected. Each type of face sheet captures at least 200 images at different distances to ensure the model’s ability to detect small targets. It is important to note that after the data-cleaning process, the number of qualified samples is reduced to 5500. These qualified samples are labeled, with the labeling information including a single bounding box, tilt angle, and deformation grade, categorized as mild, moderate, or severe.
3.1.2. Effective Information Recognition Dataset
The effective information recognition dataset primarily encompasses various types of express delivery sheets. This dataset emphasizes the extraction of key information from the sheets, including the express order number, recipient details, and address.
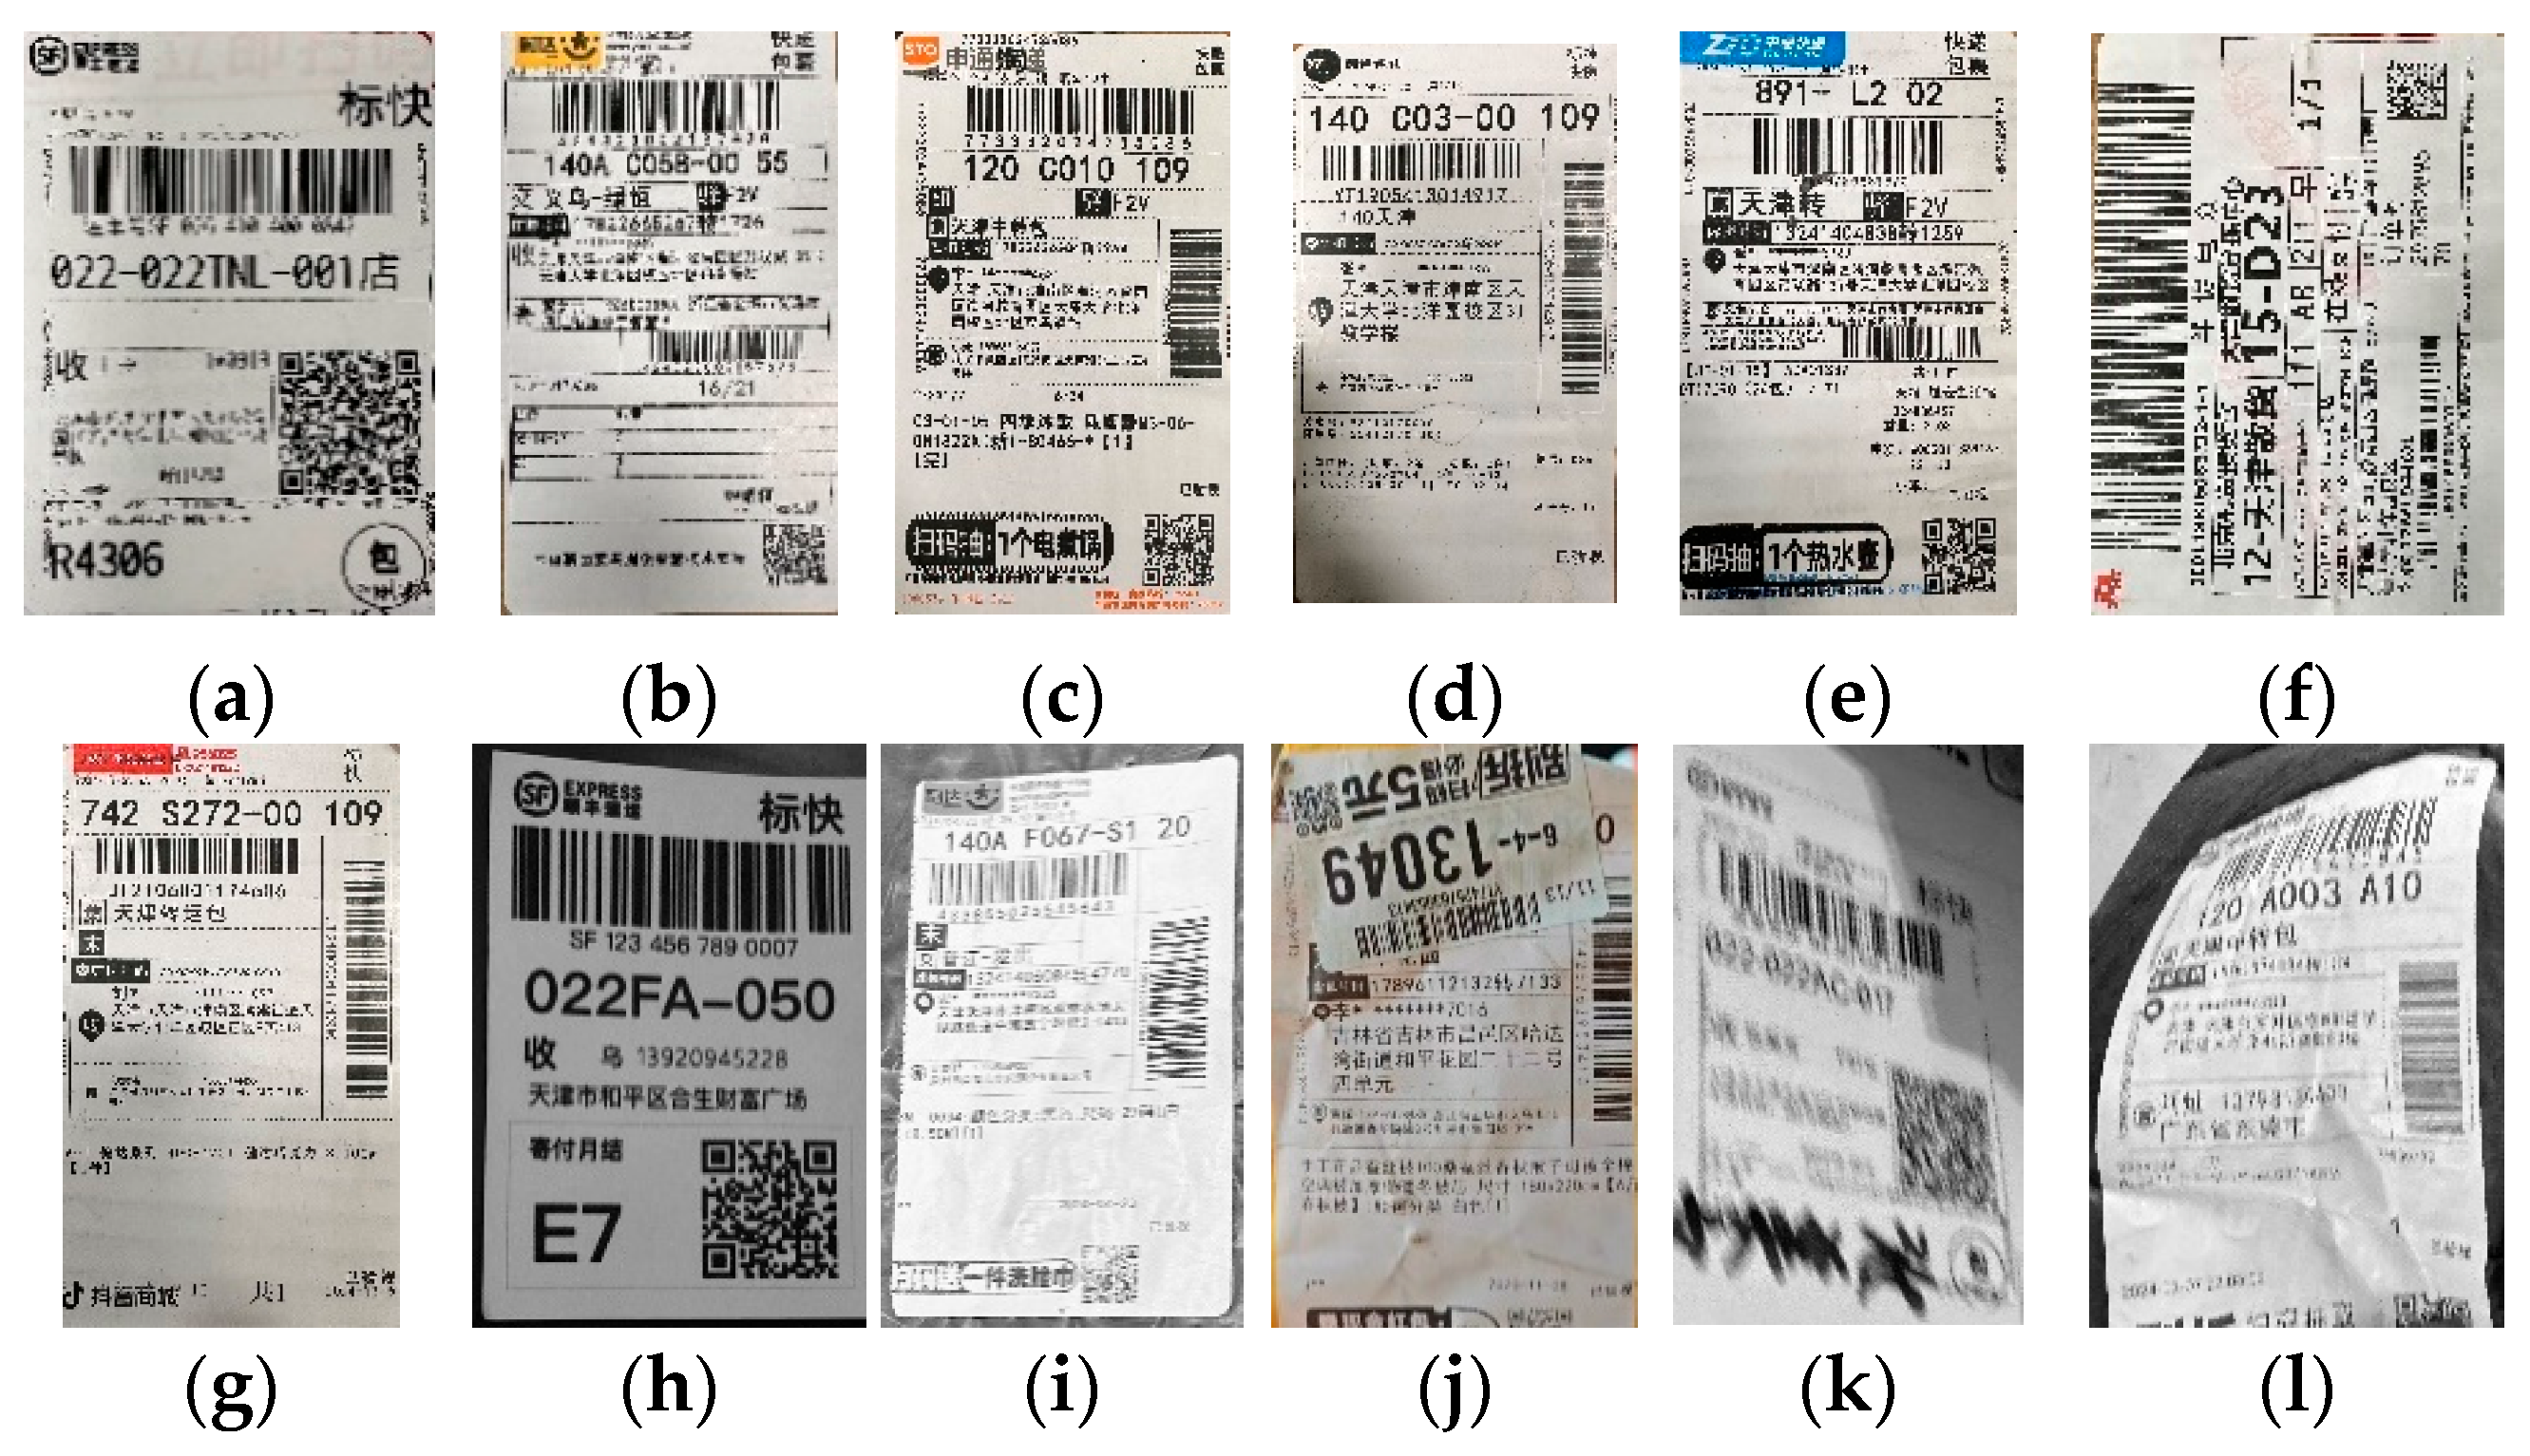
The specific construction method involves selecting the menus from various express companies available on the market, such as Zhongtong, Shentong, Yuantong, Yunda, Postal, and Shunfeng, which exhibit significant differences from one another. This approach ensures that the dataset encompasses a wide range of real-world scenarios (see
Figure 11a–h). Single images are collected from a distance range of 5 cm to 20 cm to maintain the clarity of the characters. Each character’s position and category are annotated, along with any interference information, such as advertising text and stains (see
Figure 11i–l). Subsequently, the data are enhanced to generate both black-and-white and color versions of the face-sheet images, with variations in illumination, blurriness, and noise added to simulate the results from different cameras.
The effective information recognition dataset consists of 6000 images, which include 3000 color images and 3000 black-and-white images. Each image contains an average of 5 to 10 key paragraphs, with each paragraph comprising 10 to 20 characters.
In order to enhance the diversity of the dataset, several virtual sheets have been added to the effective information recognition dataset. These sheets contain additional interference information alongside the effective data. Furthermore, to accommodate various image formats for subsequent recognition tasks, each face sheet is duplicated into two versions: color and black and white.
3.2. Experimental Environment and Training Process
The experiment develops a comprehensive contour detection model and an effective information detection model based on the YOLOv5 architecture. The backbone network utilizes the CSP structure and the Focus structure and incorporates a multi-stage training strategy to enhance face recognition performance. Specifically, the initial phase involves training the overall contour detection model, which includes the Focus module and the CSP structure in its backbone network. The Focus module slices the input image into four sub-images and then combines them to generate down-sampling features with multiple channels, thereby minimizing information loss. The CSP structure extracts multi-scale features through a cross-stage local network, effectively balancing computational efficiency with feature representation capabilities.
Further, the model training is accelerated by the NVIDIA GeForce RTX 3070 GPU. The training parameters include initialization using ImageNet pre-training weights, the Adam optimizer, an initial learning rate of 10
−3, a single batch size of 16 images, and a total of 300 epochs for iterations. It is important to note that an Early Stopping strategy is implemented; if the loss on the validation set does not decrease over 10 consecutive epochs, the training is terminated and reverted to the best weights. The loss function comprises Generalized Intersection over Union (GIoU) for positioning and Focal Loss for classification, which optimizes the positioning accuracy of the single region by balancing the weight of small target detection. The output is the single-region bounding box of the detected surface, which serves as the basis for subsequent geometric correction. The software environment utilizes the PyTorch 1.10.1 framework to construct the target detection algorithm, in conjunction with Python 3.8 to complete model training and verification. The specific hardware configuration is detailed in
Table 4.
3.3. Evaluating Indicators
To comprehensively evaluate the performance of the target detection and recognition model for extracting information from express delivery orders, and in consideration of the actual requirements for real-time detection in the distribution center, the experiment utilizes three core indicators: detection accuracy; speed; and model complexity. These indicators include average accuracy (AP), precision (P), recall rate (R), F1 score (F1), model size, and frames per second (FPS). The calculation formulas for each index are as follows.
The precision rate (P) measures the model’s ability to avoid false detections, while the recall rate (R) evaluates its ability to capture actual targets. The formulas for these calculations are as follows:
Among these metrics, TP represents the number of correctly detected targets, FP denotes the number of falsely detected backgrounds, and FN indicates the number of missed targets. In scenarios involving dense typesetting and the defacement occlusion of express orders, a high-precision (P) value can minimize misjudgments related to field overlap, while a high recall (R) value can decrease the risk of overlooking critical information.
The average precision (AP) is determined by calculating the area under the precision-recall curve across various Intersection over Union (IoU) thresholds. This metric reflects the model’s overall detection capability for individual targets within the express delivery area. A higher AP value indicates superior target localization and classification performance, particularly in complex backgrounds. The calculation formula is as follows:
The F1 measure (F1) effectively balances the harmonic mean of precision and recall, making it suitable for evaluating overall detection performance in scenarios with unbalanced samples such as in text and background areas. The formula for calculation is as follows:
The detection speed index utilizes frames per second (FPS) to indicate the number of images processed by the model each second, serving as a key metric for assessing real-time detection capability. In the experiment, images with a resolution of 640 × 640 pixels are input; the average processing speed is measured multiple times under a fixed hardware configuration.
The model complexity index refers to the size of the model, which can be represented by the number of parameters in millions (M) or the file size in megabytes (MB). A lightweight model is more suitable for edge computing devices and can help to reduce the deployment costs of logistics sorting systems.
3.4. Results
3.4.1. Basic Properties
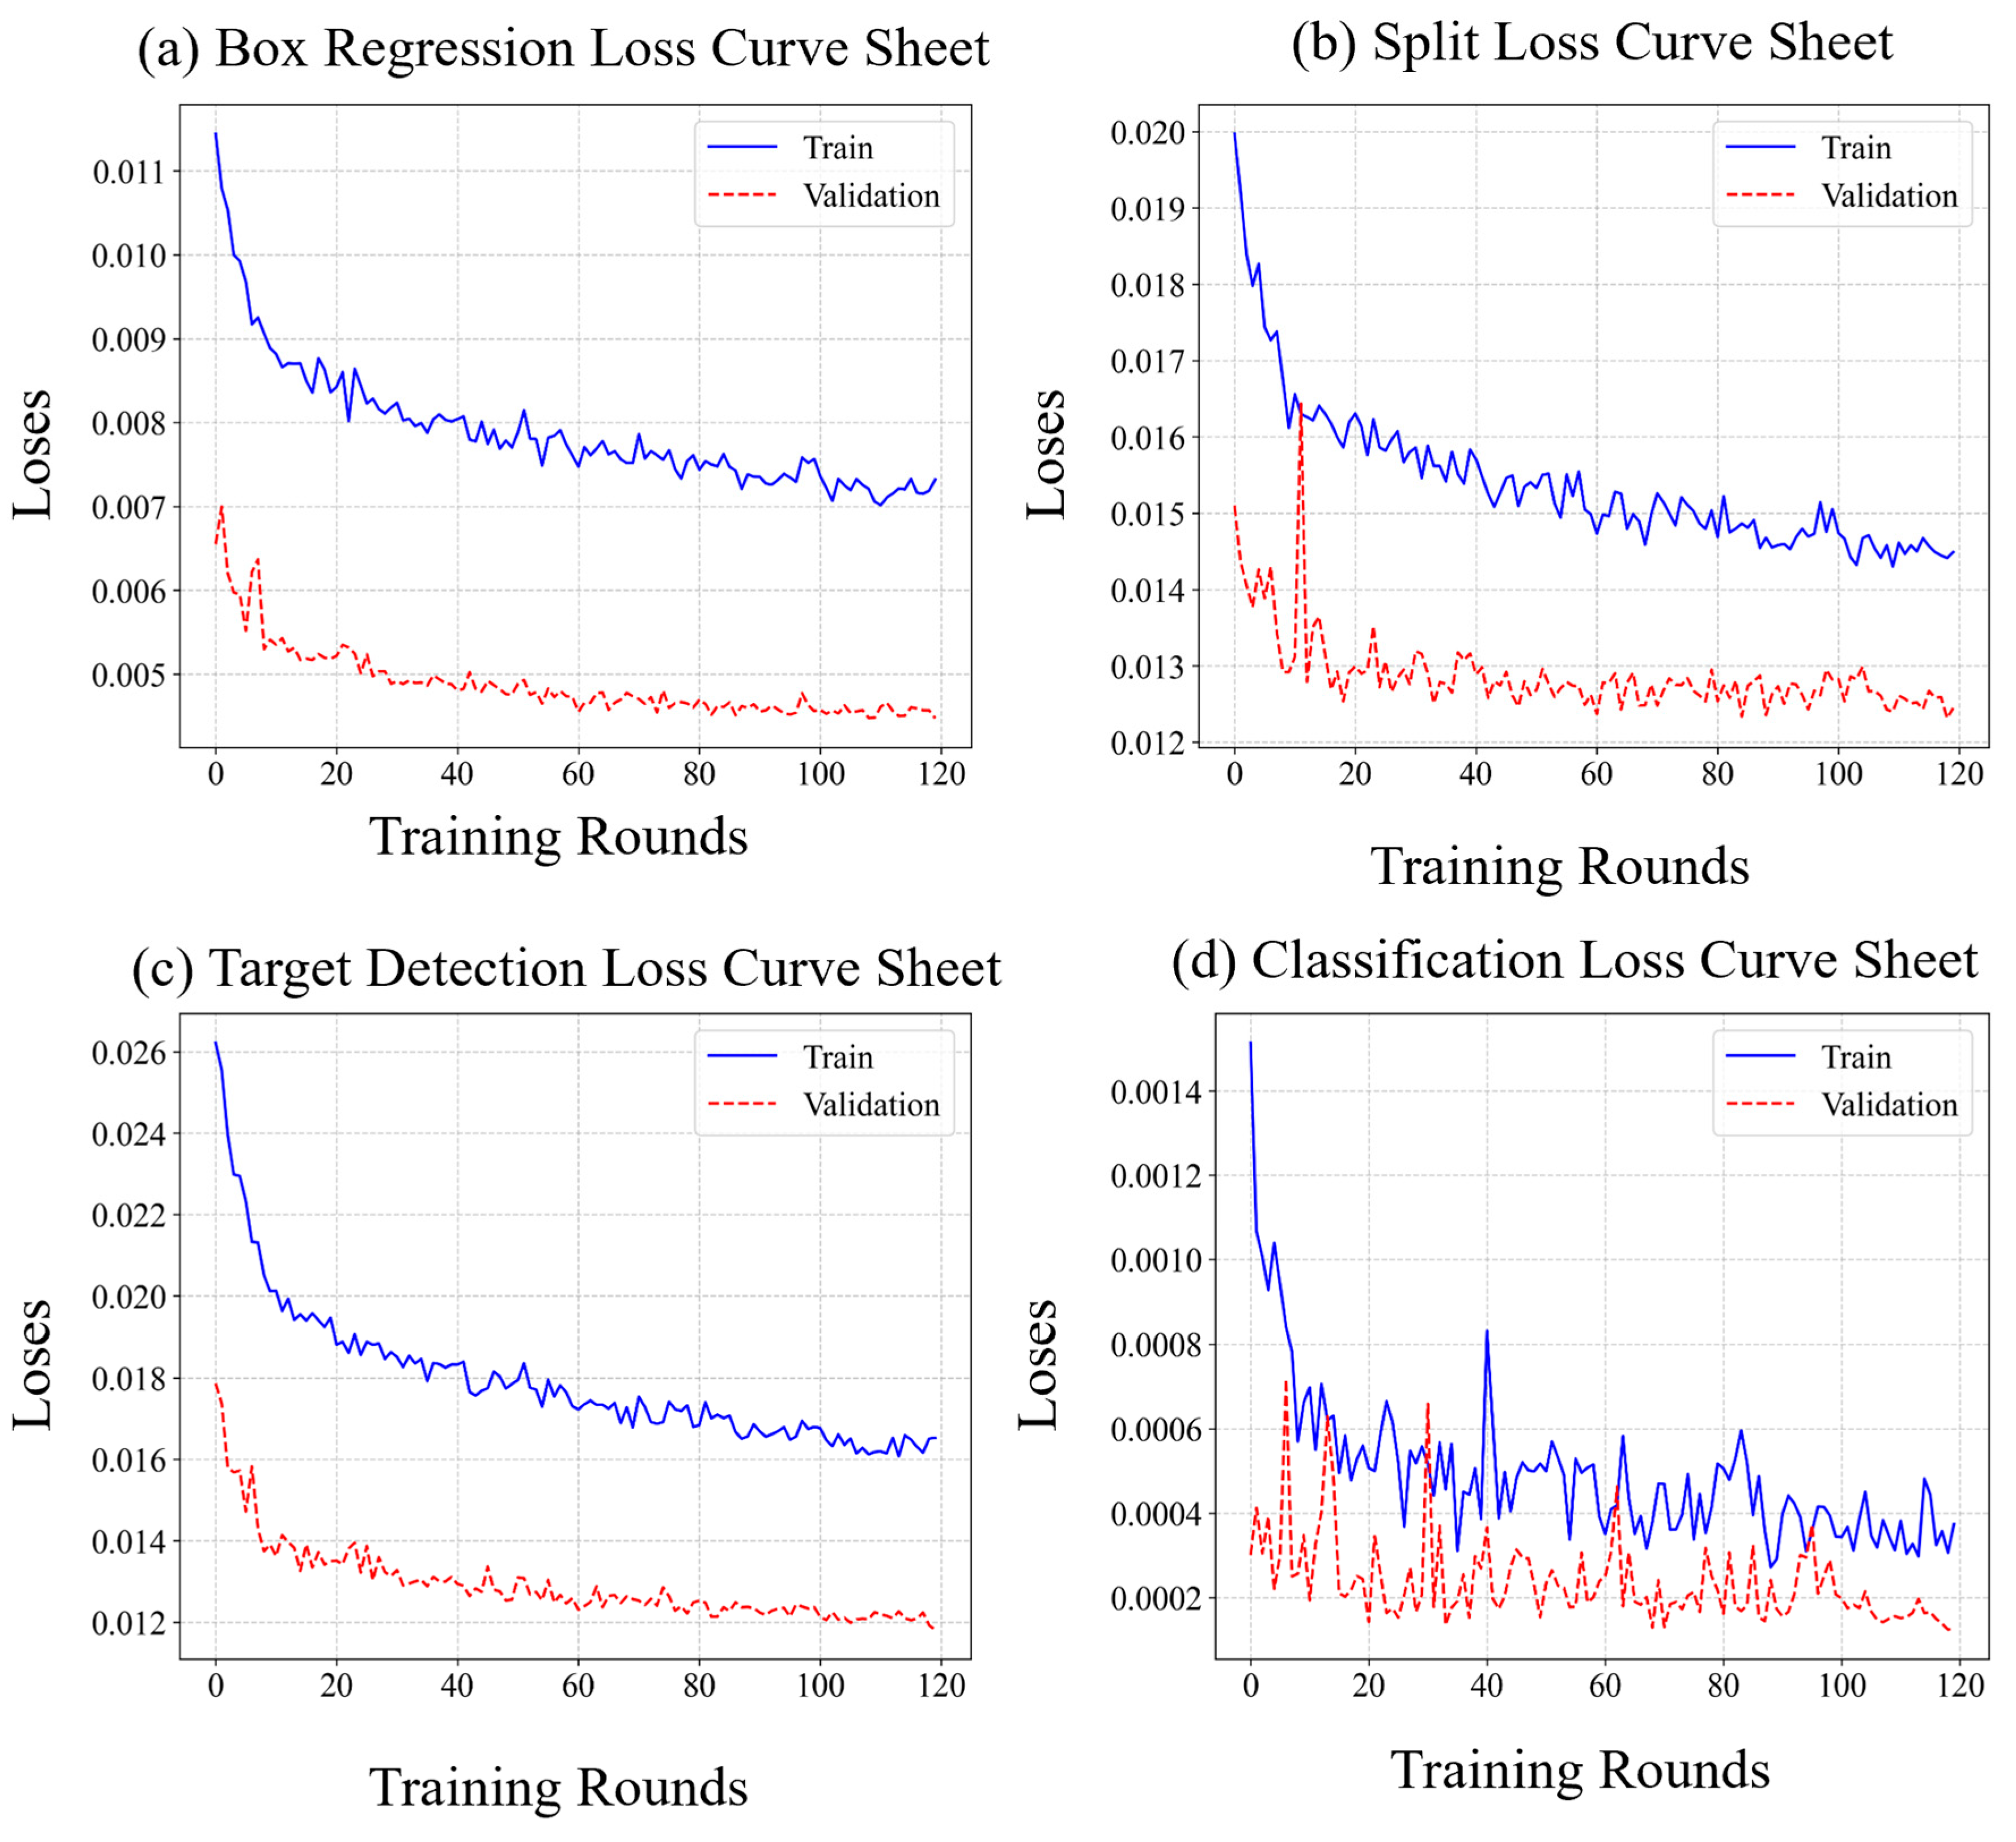
The training loss curve of the YOLOv5 model is illustrated in
Figure 12. The curve indicates that the four primary loss indicators—box regression, classification, target detection, and segmentation—exhibit a stable convergence trend. Specifically, the box regression loss decreased consistently from an initial value of 0.026 to 0.0165, with both the validation set and training set losses decreasing synchronously, maintaining a difference of less than 5%. The classification loss stabilized at approximately 0.0001, the target detection loss converged to 0.0045, and the segmentation loss was reduced to 0.0124, with each metric approaching its theoretical minimum. These experimental results confirm the model’s capability to effectively perform high-precision target detection and instance segmentation tasks in complex environments. Furthermore, its joint optimization strategy successfully balances the parameter conflicts inherent in multi-task learning.
3.4.2. Ablation Experiment
To verify the effectiveness of the proposed dynamic confidence-matching module, this experiment first identifies the region of interest using a traditional method. Subsequently, optical character recognition (OCR) is performed on the area within the detection box. The traditional OCR character recognition method (Baseline) serves as a reference for conducting ablation experiments to assess the impact of spatial geometric constraints, semantic content constraints, adaptive fusion, and dynamic threshold determination on the matching performance of individual information in complex scenes. The results are presented in
Table 5 (control group settings) and
Table 6 (indicator comparisons).
From the comparison between the Baseline and G-Only in
Table 6, it is evident that the spatial geometric constraint strategy significantly enhances matching accuracy. Specifically, the accuracy (P) increases by 5.5% and the F1 score rises by 6.0%, thereby validating the effectiveness of the anti-offset mechanism. The experimental results demonstrate that the spatial geometric constraint mitigates the sensitivity of the traditional fixed threshold method to minor offsets in the detection frame by incorporating the anti-offset IoU metric.
From the comparison between the Baseline and S-Only in
Table 6, it is evident that the semantic content constraint strategy significantly improves matching accuracy, with an increase of 3.1% in accuracy (P). This finding verifies the effectiveness of semantic regular verification. The experimental results demonstrate that the constraint effectively enhances the logical consistency of the field content and mitigates the semantic mis-association caused by background interference or adjacent field overlap. This is achieved through keyword matching and hierarchical regular expressions such as the ‘3-digit area code + 8-digit number’ format rule in the telephone field.
From the comparison between G+S-Fixed and G+S-Adapt presented in
Table 6, it is evident that the density-aware weight allocation strategy significantly enhances matching robustness. Specifically, the accuracy rate (P) increases by 5.4% and the F1 score improves by 4.9%. The experimental results demonstrate that the mechanism dynamically adjusts the spatial–semantic constraint weights by detecting box density, thereby addressing the adaptive limitations of fixed weights across varying layout densities. In low-density scenarios, spatial constraints are prioritized to mitigate semantic misjudgment, while in high-density situations, semantic constraints are reinforced to effectively balance the matching requirements of both sparse and dense layouts.
From the comparison between the G+S-Adapt model and the Full Model presented in
Table 6, it is evident that the density-aware dynamic threshold strategy significantly enhances matching accuracy. Specifically, the accuracy (P) increases by 4.9% and the F1 score rises by 4.8%, while the model size only increases by 0.5 MB. The experimental results demonstrate that this strategy maps the density of the detection boxes to the threshold adjustment interval using the sigmoid function, thereby achieving a nonlinear adaptive threshold based on density. In low-density scenarios, the threshold is lowered to improve the recall rate, whereas in high-density scenarios, the threshold is raised to reduce mismatches.
3.4.3. Contrast Experiment
In order to assess the effectiveness of the proposed dynamic density-aware matching strategy and the advantages of YOLOv5 in terms of model efficiency, this experiment uses the original YOLOv5 as the baseline. It compares the fundamental performance of various target detection models (see
Table 7) and evaluates the impact of the dynamic matching module on detection accuracy and the false detection rate (see
Table 8). This analysis aims to verify the comprehensive competitiveness of the proposed approach in complex logistics scenarios.
The experimental results regarding the basic performance of the target detection models indicate that YOLOv5s outperforms Faster R-CNN in terms of model size (14.4 MB) and memory usage (1.2 GB), achieving a speed of 82 FPS, which is 5.5 times faster than Faster R-CNN. However, YOLOv5s lags behind in average accuracy, with an Average Precision (AP) that is 9.8% lower. Although YOLOv8m and Mask R-CNN demonstrate higher APs of 82.1% and 86.7%, respectively, their model sizes and memory requirements increase significantly—by 3.6 times and 5.1 times, respectively—making them less suitable for deployment on edge devices. While Faster R-CNN leads with an AP of 88.3%, its inference speed of 15 FPS and memory usage of 5.8 GB pose challenges in meeting real-time processing requirements.
The results of the dynamic matching enhancement indicate that it improves the Average Precision (AP) of YOLOv5s from 78.5% to 89.7%, surpassing the original Faster R-CNN. This improvement is achieved while maintaining a high frame rate of 76 frames per second (FPS), which is still 5.8 times faster than Faster R-CNN. Compared to the original YOLOv5s results, the false detection rate has been reduced by 21.3%, and the matching accuracy of key fields, such as the three-segment code, has improved by 14.2%. Additionally, the dynamic matching module only increases memory usage by 0.9 GB, significantly lower than the 5.8 GB required by Faster R-CNN.
In general, YOLOv5 improves the Average Precision (AP) by 11.2% and reduces the false detection rate to 6.8% through the adaptive fusion of the anti-offset Intersection over Union (IoU) metric and the density of the semantic regularization constraint. This approach significantly compensates for the accuracy disadvantages of YOLOv5. In its original configuration, YOLOv5 achieves real-time performance comparable to Faster R-CNN while utilizing only 1/19 of the model’s volume and 1/5 of the memory. When combined with dynamic matching, its overall performance—considering precision, speed, and lightweight design—positions it as the optimal solution for logistics applications.
In order to verify the effectiveness of the proposed dynamic confidence-matching mechanism, this experiment employs traditional face recognition methods as a baseline and compares them with existing mainstream face recognition algorithms. This comparison evaluates performance advantages in terms of recognition accuracy and processing speed. The results are presented in
Table 9.
The results of comparative experiments indicate that the method developed by Liu W et al. demonstrates superior time performance. The target detection time is 0.05 s and the total processing time is 0.12 s, both of which are more efficient than those of other methods. However, the recognition accuracy is relatively low, at only 85.6%, which does not adequately meet the requirements for high-precision applications. In contrast, our method achieves a target detection time of 0.04 s and a total processing time of 0.16 s. While maintaining an efficient target detection time and a reasonable total processing time, our method attains a recognition accuracy of 98.5%. This performance significantly surpasses that of Polat E (92.1%), Katona M (87.2%), and Liu W (85.6%), highlighting the substantial advantages of the proposed dynamic confidence-matching mechanism in the face-sheet recognition task.
3.5. Discussions and Industrial Applications
While our method excels in typical scenarios, we note limitations in extreme cases.
Although this method demonstrates significant advantages in complex logistics scenarios, it is essential to objectively discuss its limitations and potential areas for improvement. As illustrated in
Figure 11, when confronted with extreme physical damage—such as missing key fields or strong reflective materials resulting from facet tearing—the text recognition confidence of the OCR path is considerably diminished, leading to the failure of semantic constraints. Furthermore, the projection occlusion of densely stacked parcels may cause vertex detection offsets in the region normalization module, which can distort subsequent recognition results. Quantitative statistics indicate that such cases account for only 3.7% of the test set, primarily within the ‘mixed package’ category, while conventional scenarios still maintain over 92.8% field matching accuracy.
This scheme can interface with the automatic sorting hardware through a three-level architecture. The first level is the perception layer, where the face-sheet image acquisition module and the system are deployed at the edge computing node, providing real-time output of structured face-sheet information. The second level is the control layer, which transmits field data to the PLC controller via the MQTT protocol to operate the sorting manipulator or shunt device. Finally, the decision-making layer integrates RFID weight checks and sheet information to optimize routing on the cloud platform.


