Abstract
Circular deep excavations, characterized by their symmetrical geometry, are commonly employed in constructing foundations for large-span suspension bridges and as launching shafts for shield tunneling. However, the mechanical behavior of such excavations under asymmetric surface surcharge remains inadequately understood due to a paucity of relevant investigations. This study addresses this knowledge gap by establishing a three-dimensional finite element model (3D-FEA) based on the anchor deep excavation project of a specific bridge. The model is utilized to investigate the influence of asymmetric surcharge on the forces and deformations within the supporting structure. The results show that both the internal force and displacement cloud diagrams of the support structure exhibit asymmetric characteristics. The distribution of displacement and internal forces has spatial effects, and the maximum values all occur in the areas where asymmetric loads are applied. The maximum values of the displacement, axial force, and shear force of underground continuous walls increase with the increase in the excavation depth. The total displacement curves all show the feature of a “bulging belly”. The maximum displacement is 13.3 mm. The axial force is mainly compression, with a maximum value of −9514 kN/m. The maximum positive and negative values of the shear force are 333 kN/m and −705 kN/m, respectively. The bending moment diagram of different monitoring points shows the characteristics of “bow knot”. The maximum values of the positive bending moment and negative bending moment are 1509.4 kN·m/m and −2394.3 kN·m/m, respectively. The axial force of the ring beam is mainly compression, with a maximum value of −5360 kN, which occurs in ring beams 3, 4, and 5. The displacement cloud diagram of the support structure under symmetrical loads shows symmetrical characteristics. Under different load conditions, the displacement curve of the diaphragm wall shows the characteristics of “bulge belly”. The forms of loads with displacements from largest to smallest at the same position are as follows: asymmetric loads, symmetrical loads, and no loads. These findings provide valuable insights for optimizing the structural design of similar deep excavation projects and contribute to promoting sustainable urban underground development.
1. Introduction
In recent decades, deep excavation engineering has developed in the direction of a larger scale, deeper depth, and more unique shape [1,2,3]. The safety challenges of deep excavation engineering during the construction process are gradually increasing [4,5,6], and the management of the surrounding environment has also become more complex [7,8,9]. This not only increases the construction difficulty, but also puts forward higher requirements for deformation control [10,11]. The square deep excavation commonly adopted in conventional excavation is prone to tilting and structural deformation in soft soil layers [12,13,14]. This will have an adverse impact on construction safety [15,16,17,18,19,20]. On the contrary, circular deep excavations can convert external loads into stresses in the four directions [21,22]. This characteristic makes full use of the compressive strength of concrete, thereby effectively reducing the risks of structural deformation and uneven settlement [23]. Therefore, circular deep excavations are widely used in anchoring projects in soft soil areas [24,25]. The circular deep excavation construction project belongs to the issue of the development and utilization of underground space. Many scholars have conducted research on issues related to the development and utilization of underground space. The existing research methods mainly include numerical simulation [26,27,28,29,30,31], field monitoring [32,33,34,35,36,37,38,39], model tests [40,41,42], and theoretical analysis [43,44,45,46,47,48,49].
In terms of numerical simulation, Shi et al. [26] and Gao et al. [27] have studied the deformation characteristics of a circular underground diaphragm wall caused by excavation. Ge et al. [28] conducted a study on the impact of excavation on the surrounding environment using the PLAXIS 3D software. Meanwhile, Wu et al. [29] applied a numerical model considering ventilation shafts to the design of circular continuous walls. Kuang et al. [30] conducted a study on the influence of precipitation on the deformation of foundation pits. Huang et al. [31] analyzed the stability of the dismantling of steel supports for variable cross-section foundation pits. In terms of on-site monitoring, Shi et al. [32] verified the newly proposed construction method by using the on-site monitoring method. Liu et al. [33], Gao et al. [34], and Ren et al. [35] studied the deformation characteristics of the retaining structure during the construction of circular deep excavations. Ren et al. [36] conducted a comparative study on the monitoring results of two adjacent deep excavations. Xia et al. [37] studied the deformation characteristics of adjacent buildings during the excavation process. Additionally, Zhao et al. [38] proposed an automatic monitoring system for controlling construction disturbances in deep excavation. Tang et al. [39] studied the impact of excavation on an existing subway.
In terms of model experiments, Chen et al. [40] and Wei et al. [41] conducted full-scale tests to, respectively, study the influence of the deep excavation radius on excavation and the influence of excavation on metro shield tunnels. Similarly, Guo et al. [42] adopted physical model tests and revealed the response law of the stress field caused by excavation. In terms of theoretical analysis, Li et al. [43] proposed a calculation method for earth pressure that considers the comprehensive influence of the excavation process and deformation mode of the diaphragm wall. Moreover, Yan et al. [44] proposed a two-stage method to quantify the influence of deep excavation on adjacent arch bridges. Xu et al. [45] conducted deformation and internal force analyses on the supporting structure of the deep excavation by using three calculation methods. In addition, Meng et al. [46] proposed an analytical method considering the combined effect of excavation and precipitation on existing tunnels. Meanwhile, Sun et al. [47] established a deformation analytical model for circular excavation tunnels based on the Mindlin bit transfer solution. Xu et al. [48] and Suraparb et al. [49] analyzed the stability of the diaphragm wall in deep circular deep excavations.
To sum up, the problems related to the development and utilization of underground space have been paid more and more attention by scholars, and a wealth of results have been achieved. On the one hand, the research objects are square deep excavations [28,29,30,31,32,34,36,37,38,39] and circular deep excavations [26,27,33,35,48]. On the other hand, the research contents mainly include the deformation of deep excavations and the internal force analysis of supporting structures [26,27,29,33,34,35,36,37,38], and the impact of deep excavation construction on the nearby environment [28,30,31,41,44,45,46,47,48,49]. By comparison, it can also be found that many deep excavations are symmetrical structures [26,27,28,29,30], and the construction is mostly carried out under symmetrical conditions [31,32,33,34,35]. These research results have certain positive significance for the development and utilization of underground space. However, in previous studies on circular deep excavations, the calculation of internal forces and deformations of the diaphragm wall usually adopted the elastic foundation beam method and the plane continuous medium finite element method [25,26,29]. These two methods are applicable to solving plane problems and do not take into account the three-dimensional force and deformation characteristics caused by the spatial effect of circular retaining walls, thus having significant limitations [25]. It is worth noting that the circular diaphragm wall is a three-dimensional spatial structure, and its analysis and calculation is a complex three-dimensional spatial problem [33,35,48]. The current research still provides insufficient explanations for the behavior of the circular deep excavation support system, and there are also few experiences available for reference [44,45].
It is inevitable that there will be material stacking loads and construction machinery loads at the construction site. The occurrence of these loads usually leads to the deep excavation being subjected to asymmetric loads. Compared with the action of symmetrical load conditions, the mechanical response of the supporting structure will be different [14,50,51,52]. If the working environment at the construction site is merely simplified to symmetrical conditions, it may cause the research results to be inconsistent with the actual situation [50,51,52].
Generally, the anchor is the main load-bearing structure of a suspension bridge [53,54]. With the continuous increase in the current bridge span, the volume of the anchor foundation is also getting larger and larger [55,56,57,58,59]. Whether during the construction or the operation period, the deformation requirements for bridge foundations have always been very strict [53,54,55,56,57,58,59,60]. The research on the excavation deformation of large-diameter circular deep excavation under asymmetric loads not only helps to improve the accuracy of deep excavation construction deformation prediction during the construction period of bridge foundations, but also has certain guiding significance for the deformation analysis of the foundation during the operation period of bridges.
In view of this, on the basis of the above research, this paper carried out related research on the construction mechanical behavior of super-large-diameter circular deep excavation under asymmetric load in the background of the anchor deep excavation engineering of a bridge. The research content mainly includes the following four parts: Firstly, a numerical model was established. Secondly, we verified the reliability of the numerical model. Thirdly, studies were conducted on the displacement and internal forces of the diaphragm wall and the axial force of the ring beam. Fourthly, the influence of different load forms on the displacement of the diaphragm wall was discussed. The research conclusion has certain reference significance for the design and construction of similar projects.
2. Project Overview
The research object of this paper is the deep excavation of the anchor foundation of a certain bridge. This project is located in Guangzhou City. The main span of the bridge adopts a double-layer steel truss suspension structure with a length of 2180 m. The bridge has two anchorages, located on the east and west sides of the bridge, respectively, and the circular gravity anchoring scheme is adopted. The object selected for this study is the deep anchor deep excavation on the east side (referred to as the deep excavation), and the cross-sectional view is illustrated in Figure 1. The depth and diameter of the deep excavation are 32 m and 120 m, respectively. The open excavation method was used for construction, and each excavation was 2 m, which was divided into 16 excavations.
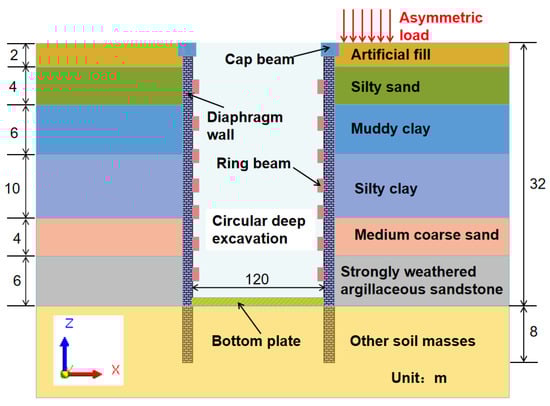
Figure 1.
Cross-section view of deep excavation.
Take into account the material stacking that may occur during the construction process. According to the calculation of the construction unit, during the construction period, a surface load of 30 kPa will be generated within a radius of 30 m around the deep excavation (the form of the load is vertical and a downward uniformly distributed load). The load distribution diagram is shown in Figure 2. This belongs to a typical problem of symmetrical structures under asymmetric loads [14,25,51,52]. The supporting structure mainly consists of diaphragm wall, cap beam (referred to as ring beam 1), ring beams, and bottom plate. Among them, there are a total of 8 ring beams, with a longitudinal spacing of 4 m. The materials of the supporting structure are all reinforced concrete. The thickness, total height, and embedding depth of the diaphragm wall are 1.5 m, 40 m, and 8 m, respectively. In addition, the simplified soil layer consists of a total of 8 layers. From top to bottom, respectively, they are artificial fill, silty sand, muddy clay, silty clay, medium-coarse sand, strongly weathered argillaceous sandstone, moderately weathered argillaceous sandstone, and micronized argillaceous sandstone. The specific contents of soil layer parameters are listed in Table 1. The relevant parameters of the supporting structure are illustrated in Table 2. It should be noted that the soil material parameters shown in Table 1 are derived from the engineering geological investigation report and the triaxial compression test. Among them, the thickness of the soil layer was determined through field drilling exploration. The unit weight of soil is determined through density tests conducted in the laboratory. The cohesion, friction angle, elastic modulus, and Poisson’s ratio are determined through indoor triaxial compression tests. In addition, the material parameters involved in Table 2 are provided by the manufacturer. Furthermore, each excavation was carried out after the water had fallen 3 m below the excavation face. Therefore, the influence of groundwater on excavation is not considered in this study.
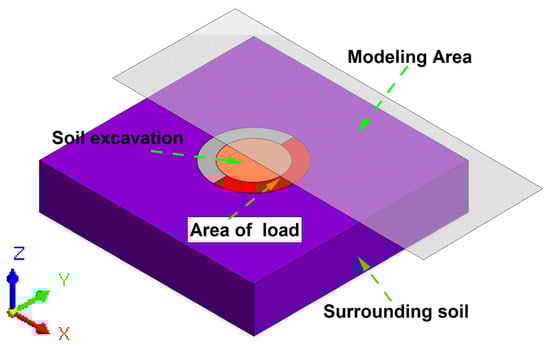
Figure 2.
Schematic diagram of load distribution.

Table 1.
Soil layer parameters.
Table 2.
Parameters of support structure.
3. Model Building and Numerical Calculation
3.1. Basic Assumptions
(1) The influence of groundwater is not taken into account. (2) The soil layer is continuously and evenly distributed. (3) Each excavation is carried out in layers and as a whole. (4) The surface load is uniformly distributed. (5) Other assumptions are consistent with those in reference [15].
3.2. Calculation Model
The three-dimensional finite element model was established by using MIDAS GTS NX software (version 2022). It should be noted that symmetry refers to the phenomenon where the same parts of an object or figure repeat regularly under certain changing conditions (such as rotation around a straight line, reflection of a plane, and so on.) [52]. As observed in Figure 2, the subject of this study is symmetrical. For the convenience of calculation, the research object was halved in this modeling [15,31]. In order to reduce the influence of model boundary conditions on the simulation process, the model size was selected as 480 m × 240 m × 100 m, as shown in Figure 3. The number of units and nodes of the model are 97,763 and 82,498, respectively. The model coordinate system is consistent with those in reference [15]. The upper boundary of the model is free, the bottom is fully constrained, and the side limits the horizontal displacement. The element type of the base plate is the plate element, and the constitutive relations and element types of other structural components are consistent with those in reference [15].

Figure 3.
Numerical model.
3.3. Arrangement of Monitoring Points
It is important to note that the diaphragm wall is one of the most crucial structural components in deep excavation engineering [50,51,52]. The deformation and force on the diaphragm wall can not only indirectly reflect the surface settlement situation [11,12,13,14], but also determine the safety situation of the deep excavation during the construction process [18,19,20]. Obviously, deep excavation construction and the action of asymmetric loads may have certain influences on the deformation and force of the diaphragm wall. In view of this, the deformation and force-bearing issues of the diaphragm wall are of crucial importance. Therefore, during the actual construction process, multiple monitoring points were set up for the diaphragm wall. Representative locations were selected as monitoring points in this study. The specific locations of the monitoring points are shown in Figure 4. As depicted in Figure 4, there are a total of five monitoring points for the diaphragm wall in this study. They are, respectively, O, A1, B1, A2, and B2. Among them, both A1 and A2 are located in the middle of the asymmetric load layout area. Both B1 and B2 are located in the middle of the no-load layout area, and O is located in the middle of the deep excavation. The included angle of each monitoring point is 30°.

Figure 4.
Schematic diagram of displacement monitoring points.
3.4. Simulated Construction
The construction process of this research consists of a total of 19 parts. The specific content is summarized in Table 3. It should be noted that “Stage 16” is referred to when the excavation is completed.
Table 3.
Main construction procedure.
4. Comparative of Simulation and Field Measurements
Figure 5 presents the comparison between the simulated values and the monitored values. Figure 5a is a comparison chart of the total displacement of monitoring point A1 when the excavation is completed. Obviously, the results of both methods exhibit a “bulging belly” feature. This research conclusion is consistent with reference [25]. In terms of the maximum value, the monitored value and the simulated value are 14.2 mm and 13.1 mm, respectively. The maximum values all occur at a position of −16 m below the surface. It is not difficult to find that the on-site monitoring results are larger, with a difference of 8.4% between the two. Figure 5b indicates the comparison of the maximum axial forces of the cap beam at different excavation stages. By comparison, it can be seen that the results of both methods also exhibit a “funnel” feature. The maximum values of the monitored value and the simulated value are −3863 kN and −3648 kN, respectively. The maximum values all occur in step 5. The on-site monitoring results are even greater, with a difference of 5.9% between the two. To sum up, the numerical simulation results are in good agreement with the monitoring results. The reliability of the model established in this research was verified. Furthermore, the displacement values are all less than the requirements of the specifications, and the deep excavation is in a safe state [34,35].
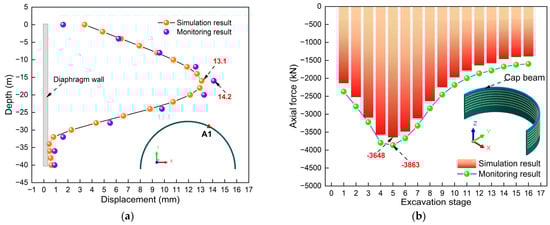
Figure 5.
Comparison of simulated and monitored values: (a) Comparison of total displacement; (b) Axial force comparison diagram.
Meanwhile, it can be found that the monitoring results are larger. The possible reason is that numerical simulation cannot fully consider the complexity of actual construction conditions, resulting in certain differences between the simulation results and the actual deformation. For example, construction machinery loads that may occur near deep excavation. The load of construction machinery is often greater than the load set in this study, and the displacement of the diaphragm wall usually increases with the increase in adjacent loads [51]. However, during the calculation, it is impossible to conduct a comprehensive and accurate simulation of the load of construction machinery, which in turn leads to an overestimation of the on-site monitoring data. To sum up, this model has a certain degree of reliability. Based on this model, relevant research on the construction mechanical behavior of super-large-diameter circular deep excavation under asymmetric loads can be carried out.
5. Numerical Calculation Results
5.1. Total Displacement of Diaphragm Wall
Figure 6 presents the cloud map of the total displacement of the diaphragm wall. Obviously, the total displacement varies at different construction stages. The displacement cloud map presents asymmetric characteristics. This phenomenon is different from the result under symmetrical conditions [22,23]. It can be observed that the maximum displacements of stages 1, 3, and 16 are 3.7 mm, 4.7 mm, and 13.3 mm, respectively. The maximum values all occur in the areas subjected to asymmetric loads, and show a continuous downward trend with the increase in the excavation depth. This might be because the deep excavation and supporting structure in this study are in a symmetrical form, while the load is in an asymmetrical form. Under the action of asymmetric loads, the soil body will be compressed. Due to the transmissible nature of force, the soil will exert a force on the adjacent diaphragm wall. Therefore, it shows that the displacement of the diaphragm wall in the area where the load acts is greater. On the contrary, in other areas, the extrusion effect resulting from the appearance of the load is relatively weak [51,52]. Therefore, it shows the phenomenon that the displacement of the diaphragm wall in the non-load-action area is relatively small. The maximum horizontal displacement of the diaphragm wall meets the minimum requirements of the current relevant specifications [34,35]. This indicates that the design of the supporting structure and the excavation method in this study have a certain degree of reliability.
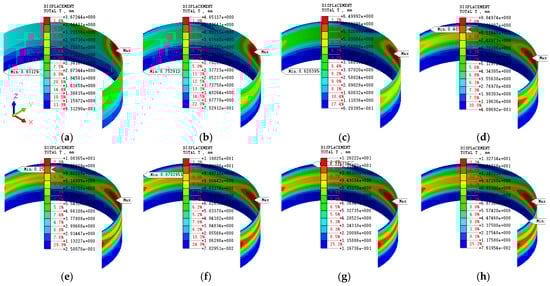
Figure 6.
Total displacement cloud map: (a) Stage 1; (b) Stage 3; (c) Stage 5; (d) Stage 8; (e) Stage 9; (f) Stage 11; (g) Stage 13; (h) Stage 16.
In order to present the displacement changes in more detail, we extracted the calculation results and drew the curve graph related to the total displacement. It should be noted that representative monitoring points were selected for this study. The specific distribution of the monitoring points is shown in Figure 4. Figure 7 illustrates the displacement comparison chart of monitoring point A1. Figure 7a is the displacement curve graph. Obviously, at different stages, the displacement curves present different characteristics. But, overall, it shows the characteristic of a “bulging belly”. This research conclusion is consistent with reference [25]. Specifically, in stage 1, the maximum value occurs at the top of the diaphragm wall. This might be because, at this stage, the excavation depth is only 2 m and there is an asymmetric load acting on the soil near A1. Under the action of the load, the top of the diaphragm wall produced the maximum displacement. In addition, it can be found that the position where the maximum value occurs shows a continuous downward trend with excavation. When the excavation is completed, the maximum displacement occurs at −16 m below the surface. By comparison, it can also be found that the displacement at the same horizontal position keeps increasing with the increase in the excavation depth. It is worth noting that, at different construction stages, there was displacement at the top of the diaphragm wall, and it was all close to 4 mm. This also indicates that asymmetric loads have a significant impact on the top displacement of the diaphragm wall.
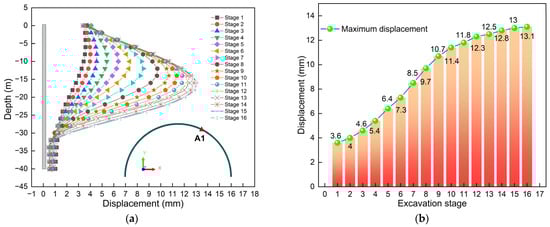
Figure 7.
Displacement comparison diagram of monitoring point A1: (a) Curve of displacement; (b) Maximum value.
Figure 7b is a bar chart comparing the maximum displacement. Obviously, the maximum value shows a pattern of “increasing rapidly first and then slowly”. By comparison, it can be found that the maximum increase is the largest at stage 1, which is 3.6 mm. This also indicates that asymmetric loads and excavation had the greatest impact on stage 1. In addition, the maximum displacement occurs at the completion of excavation, which is 13.1 mm. This also indicates that asymmetric loads have a greater impact on the initial excavation of the deep excavation in the load action area, while having a relatively smaller impact on the later excavation of the deep excavation. In addition, excavation is the main factor causing the deformation of the diaphragm wall.
Figure 8 illustrates the displacement comparison chart of monitoring point B1. Figure 8a is the displacement curve graph. Obviously, at different stages, the displacement curves present different characteristics. But overall, it presents an “S” shape. This is somewhat different from the shape presented in Figure 7a. Specifically, during the first three stages, the maximum value occurs at the top of the diaphragm wall. This might be because, during these stages, the excavation depth is relatively small and there is no asymmetric load acting on the soil near B1. This is the result of the combined action of excavation and asymmetric loads. In addition, it can be found that the position where the maximum value occurs shows a continuous downward trend with excavation. When the excavation was completed, the maximum displacement also occurred at a position of −16 m below the surface. The position where the maximum value occurs is close to A1 (see Figure 7 for details). This indicates that asymmetric loads have a relatively small influence on the location where the maximum displacement of the diaphragm wall occurs. Furthermore, the displacement at the same position keeps increasing with the increase in the construction depth of the deep excavation. It is worth noting that, at different construction steps, there is displacement at the top of the diaphragm wall, and the displacement is close to 3 mm. Obviously, the top displacement of B1 is less than that of A1. This also indicates that asymmetric loads have a greater impact on the top displacement of the diaphragm wall in the load action zone.
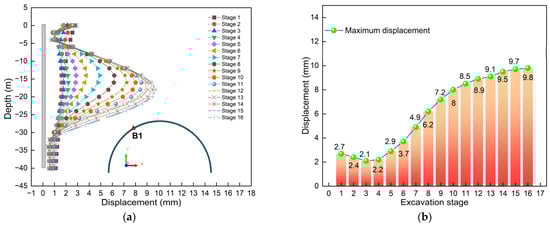
Figure 8.
Displacement comparison diagram of monitoring point B1: (a) Curve of displacement; (b) Maximum value.
Figure 8b is a bar chart comparing the maximum displacement. Obviously, the maximum value shows a pattern of “increasing rapidly at first, then decreasing slowly, and then increasing continuously”. By comparison, it can be found that the increase is the largest at stage 1, which is 2.7 mm. This also indicates that asymmetric loads and excavation have had the greatest impact on stage 1. Furthermore, the maximum value occurs when the excavation is completed, with a value of 9.8 mm. By comparison, it can be found that the maximum displacement of A1 is greater, and the difference between the two is 33.7%. This might be because B1 is far from the area where the asymmetric load acts, and thus is relatively less affected. This also indicates that asymmetric loads have a greater impact on the displacement of the diaphragm wall in the load action zone.
Figure 9 illustrates the displacement comparison diagram of monitoring point A2. Figure 9a is the displacement curve graph. Obviously, at different stages, the displacement curves present different characteristics. But overall, it presents a “bulging belly” shape. The position where the maximum value occurs keeps decreasing as the excavation progresses. When the excavation is completed, the maximum displacement occurs at a position of −16 m below the ground surface. The position where the maximum displacement occurs is close to A1 and B1 (see Figure 7a for details). This once again indicates that asymmetric loads have a relatively small influence on the location where the maximum displacement of the diaphragm wall occurs upon the completion of excavation. Furthermore, the displacement at the same position keeps increasing with the increase in the construction depth of the deep excavation. It is worth noting that, at different construction steps, there is displacement at the top of the diaphragm wall, and the top displacement is the greatest at step 1. This also indicates that asymmetric loads have the greatest impact on the top displacement of the diaphragm wall at the initial stage of excavation. It is worth noting that the top displacement gradually decreases during the excavation process. This might be because, as can be found from Figure 9a, as the excavation depth increases, the displacement of the diaphragm wall gradually increases. In order to maintain deformation coordination, the top displacement of the supporting structure gradually decreases during the excavation process. This also verifies the reliability of the model established in this study from another aspect.

Figure 9.
Displacement comparison diagram of monitoring point A2: (a) Curve of displacement; (b) Maximum value.
Figure 9b is a bar chart comparing the maximum displacement. Obviously, the maximum value shows a pattern of “increasing rapidly first and then slowly”. The increase was the largest in stage 1, which was 2.5 mm. This also indicates that asymmetric loads and excavation have the greatest influence on stage 1. By comparison, it can be found that, at stage 1, the maximum displacement of A1 is 44% greater than that of A2. Furthermore, the maximum displacement occurred when the excavation was completed, which was 11.7 mm. When the excavation is completed, the maximum displacement of A1 is 12% greater than that of A2. This might be because A1 and A2 are in different positions. Therefore, the influence of asymmetric loads on them is also different.
Figure 10 presents the displacement comparison diagram of monitoring point B2. Figure 10a is the displacement curve graph. Obviously, at different stages, the characteristics presented by the displacement curve are also different. But overall, it presents a “bulging belly” shape. It can be found that the position where the maximum value occurs continuously decreases with the excavation. When the excavation is completed, the maximum displacement occurs at a position of −16 m below the ground surface. The location where the maximum displacement occurs is close to the area where the asymmetric load acts (see Figure 7a for details). This once again indicates that asymmetric loads have a relatively small influence on the location where the maximum displacement of the diaphragm wall occurs. Furthermore, the displacement at the same position keeps increasing with the increase in the construction depth of the deep excavation. It is worth noting that, at different construction steps, there is displacement at the top of the diaphragm wall, and the top displacement is the greatest at step 1. This also indicates that asymmetric loads have the greatest impact on the top displacement of diaphragm wall at the initial stage of excavation. It is worth noting that the top displacement gradually decreases during the excavation process. The reason is the same as that in Figure 9a. Obviously, the top displacement of B2 is less than that of B1. This might be because B2 is farther away from the asymmetric load. Therefore, the influence of asymmetric loads is smaller. This also indicates that the influence of asymmetric loads on the displacement of the diaphragm wall weakens with the increase in distance.

Figure 10.
Displacement comparison diagram of monitoring point B2: (a) Curve of displacement; (b) Maximum value.
Figure 10b is a bar chart comparing the maximum displacement. Obviously, the maximum value shows a pattern of “increasing rapidly first and then continuously”. By comparison, it can be found that the maximum increase is the largest at stage 1, which is 1.7 mm. This also indicates that asymmetric loads and excavation have had the greatest impact on stage 1. Furthermore, the maximum displacement occurred when the excavation was completed, which was 10.8 mm. By comparison, it can be found that, at stage 1, the maximum displacement of B1 is 59% greater than that of B2. This might be because B2 is farther from the area where the asymmetric load acts, and thus is relatively less affected. It is worth noting that the maximum displacement of B2 at the completion of excavation is 10.2% greater than that of B1. This also reflects the complexity of the mechanical performance of circular deep excavation support structures under asymmetric loads.
Figure 11 is a comparison chart of the displacement of monitoring point O. Figure 11a is the displacement curve graph. Obviously, at different stages, the displacement curves present different characteristics. But overall, it presents a “bulging belly” shape. It can be found that the position where the maximum value occurs continuously decreases with the excavation. When the excavation is completed, the maximum displacement occurs at a position of −16 m below the ground surface. The location where the maximum displacement occurs is close to the area where the asymmetric load acts (see Figure 7a for details). Furthermore, the displacement at the same position keeps increasing with the increase in the construction depth of the deep excavation. It is worth noting that, at different construction steps, there is displacement at the top of the diaphragm wall, and the top displacement is the greatest at step 1. This also indicates that asymmetric loads have the greatest impact on the top displacement of diaphragm wall at the initial stage of excavation. It is worth noting that the top displacement gradually decreases during the excavation process. The reason is the same as that in Figure 9a.
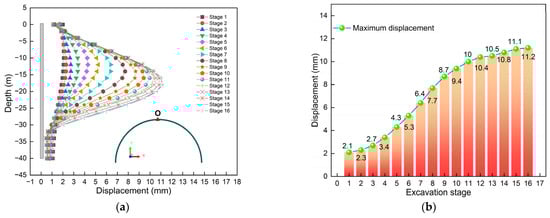
Figure 11.
Displacement comparison diagram of monitoring point O: (a) Curve of displacement; (b) Maximum value.
Figure 11b is a bar chart comparing the maximum displacement. Obviously, the maximum value shows a pattern of “increasing rapidly first and then slowly”. By comparison, it can be found that the maximum increase is the largest at stage 1, which is 2.1 mm. This also indicates that asymmetric loads and excavation have had the greatest impact on stage 1. Furthermore, the maximum displacement occurs when the excavation is completed, which is 11.2 mm. This also indicates that asymmetric loads have a greater impact on the initial construction of the deep excavation in the load action area, while having a relatively smaller impact on the later construction of the deep excavation.
Figure 12 illustrates the comparison of the diaphragm wall displacement. Figure 12a presents the comparison curve of the total displacement. Obviously, when the excavation is completed, the displacements of different monitoring points of the diaphragm wall are not the same. The displacement curve of monitoring point A1 shows an “S” feature, while the other monitoring points all show a “belly bulge” feature. This also indicates the complexity of the influence of an asymmetric load on the excavation of circular deep excavations. It can also be found that, at the same position, the order of displacement from largest to smallest is A1, A2, O, B2, and B1. Obviously, the maximum displacements at different monitoring points are different. This once again verifies that the circular diaphragm wall is a three-dimensional spatial structure, and its analysis and calculation is a complex three-dimensional spatial problem [25]. This might be because A1 and A2 are located in the asymmetric load action zone, the O displacement is located in the transition zone, while B1 and B2 are located in the non-load-action zone. The reason why the displacement A2 < A1 might be that, as can be seen from Figure 4, although both A2 and A1 are located in the area directly affected by asymmetric loads, their positions are not the same. Observation reveals that the area of action of asymmetric loads on A1 is larger, while that on A2 is relatively smaller. From the relevant knowledge of structural mechanics, it can be known that the action effect of uniformly distributed loads is positively correlated with the action area of uniformly distributed loads. Therefore, the larger the area where the uniformly distributed load acts, the greater the load effect it generates, which in turn leads to a greater impact on A1, and thus shows the phenomenon that the displacement A2 < A1. Furthermore, the reason why the displacement B1 < B2 might be that, as can be seen from Figure 4, although neither B2 nor B1 is in the direct action area of the asymmetric load, their positions are not the same. Under the action of asymmetric load, the diaphragm wall in the load area has a tendency to deform towards the inside of the deep excavation, and the diaphragm wall is connected with the ring beam, so the ring beam will also move towards the inside of the deep excavation. This kind of movement deformation will cause the displacement far from the area affected by asymmetric loads to be suppressed, and this suppression effect decreases as the distance from the asymmetric action area increases. Obviously, B1 is closer to the area where the asymmetric load acts, so the phenomenon of displacement B1 < B2 occurs. This once again indicates that the influence of asymmetric loads on the diaphragm wall has a spatial effect, and the impact of asymmetric loads is greater. Figure 12b is a comparison chart of the maximum displacement when the excavation is completed. Obviously, the maximum displacements of different monitoring points vary, presenting a characteristic of “fluctuating changes”. The maximum value appears in A1, with a value of 13.1 mm. The minimum value appears in B1, with a value of 9.8 mm. The reason is the same as that in Figure 12a.
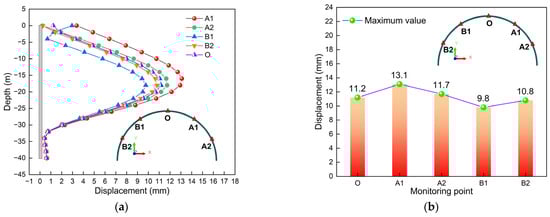
Figure 12.
Comparison of diaphragm wall displacement: (a) Total displacement comparison curve; (b) Maximum displacement comparison diagram.
To sum up, the circular diaphragm wall is a three-dimensional spatial structure, and its analysis and calculation is a complex three-dimensional spatial problem. Asymmetric loads have a significant impact on the initial construction of the deep excavation in the load action area, while having a relatively small impact on the later construction of the deep excavation. Excavation is the main factor for the deformation of the diaphragm wall. The maximum displacement occurs when the excavation is completed. Under the action of asymmetric loads, both the internal force and displacement cloud diagrams of the supporting structure present asymmetric characteristics. The displacement distribution has a spatial effect, and the maximum values all occur in the areas where asymmetric loads act. The total displacement of the diaphragm wall increases with the increase in the excavation depth. The total displacement curves all exhibit the feature of “belly bulge”. Therefore, during the design and construction, it is not only necessary to pay attention to the influence of asymmetric loads on excavation, but also to optimize the excavation conditions and support structure to minimize the adverse effects of asymmetric loads and excavation on the deep excavation as much as possible.
5.2. Axial Force of Diaphragm Wall
Figure 13 illustrates the axial force cloud diagram of the diaphragm wall in the XX direction. In this study, the vibrating chord-type axial force (model: BGK-4900, manufacturer: Jikang Instrument (Beijing) Co., Ltd, Beijing, China.) meter was used to measure the axial force of the diaphragm wall. Obviously, the axial force varies at different construction stages. The axial force cloud pattern presents an asymmetric characteristic. This phenomenon is somewhat different from the result under symmetrical conditions [22,23]. Observation reveals that the maximum axial forces in stages 1, 3, and 16 are −1675 kN/m, −2621 kN/m, and −9514 kN/m, respectively. The maximum value occurs in the area subjected to asymmetric loads and shows a continuous downward trend as the construction stage increases. This might be because the deep excavation and supporting structure in this study are symmetrically designed, while the load is in an asymmetrical form. Under the action of load, the soil body will be compressed. Due to the force transfer, the soil will exert force on the adjacent diaphragm wall, thus showing that the axial force generated by the load area is larger. On the contrary, in other non-load-affected areas, the extrusion effect caused by the appearance of the load is relatively weak. Therefore, it shows the phenomenon that the axial force in the non-load-action area is relatively small.
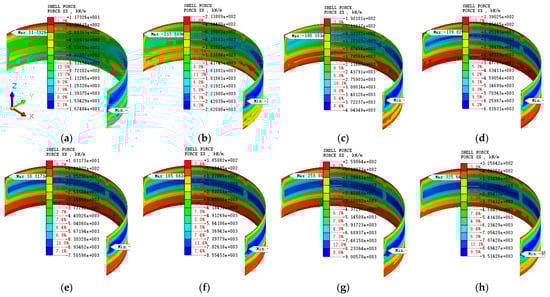
Figure 13.
Axial force cloud map: (a) Stage 1; (b) Stage 3; (c) Stage 5; (d) Stage 8; (e) Stage 9; (f) Stage 11; (g) Stage 13; (h) Stage 16.
Figure 14 presents the bar chart of axial force comparison. Figure 14a is the comparison chart of the maximum values. Obviously, at different excavation stages, the axial force values also vary, showing the characteristic of “increasing rapidly at first and then slowly”. The maximum axial forces are all negative, which indicates that, during the excavation process, the axial forces generated by the diaphragm wall are mainly pressure. This is mainly because the excavation causes the loss of soil inside the deep excavation. Therefore, under the action of surface loads and earth pressure, the diaphragm wall has a tendency to deform towards the interior of the deep excavation. Due to the supporting effect of the cap beam on the top of the diaphragm wall, the deformation of the top is suppressed. Therefore, it is manifested that the axial force generated by the diaphragm wall is mainly pressure. The conclusion of this study is consistent with the references [22,23]. By comparison, it can be found that the maximum increase is the largest in stage 1, which is 1675 kN/m. This also indicates that the asymmetric load and excavation have the greatest impact on the axial force in stage 1. Furthermore, the maximum axial force occurs when the excavation is completed, which is −9514 kN/m. This also indicates that asymmetric loads have a greater impact on the initial construction of the deep excavation in the load action area, while having a relatively smaller impact on the later construction of the deep excavation.
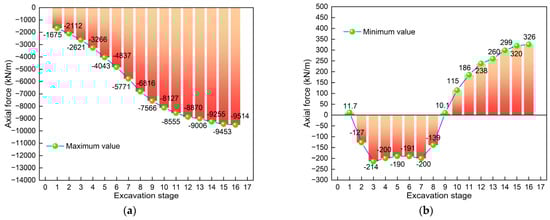
Figure 14.
Comparison of diaphragm wall axial force: (a) Maximum value; (b) Minimum value.
Figure 14b is a comparison chart of the minimum axial force. Obviously, at different excavation stages, the axial force values also vary, showing the characteristic of “first increasing, then decreasing, and then increasing again”. The minimum axial force values from stages 2 to 8 are negative, indicating that the diaphragm walls are all compressed in these stages. It is worth noting that the minimum axial force values in other stages are positive, indicating that there are tensile parts in the diaphragm wall at this stage. This might be due to the influence caused by the emergence of asymmetric loads.
In summary, the axial force cloud diagram of the diaphragm wall shows asymmetric characteristics. The axial force is mainly compression. The maximum value increases with the increase in the excavation depth. The maximum value occurs in the area subjected to asymmetric loads and shows a continuous downward trend as the construction stage increases. Conversely, pulling forces may also occur in other areas, but the values are relatively small. Therefore, in the design and construction, it is not only necessary to consider the state of the diaphragm wall under compression, but also to grasp the tension area in time through simulation and monitoring. When necessary, measures should be taken to reduce the adverse effects of tensile force on deep excavation; for example, more longitudinal force-bearing reinforcing bars configured on the tensile side to enhance the tensile capacity; increase the thickness of the diaphragm wall or deepen the embedded section.
5.3. Bending Moment of Diaphragm Wall
Figure 15 presents the bending moment cloud diagram of the diaphragm wall in the YY direction. Obviously, the bending moment varies at different construction stages. The bending moment cloud diagram presents an asymmetric characteristic. This phenomenon is somewhat different from the result under symmetrical conditions [25]. The bending moment values can be positive or negative, which indicates that some parts of the diaphragm wall are under tension while others are under compression. It can be observed that the maximum normal bending moments of stages 1, 3, and 16 are 189.5 kN·m/m, 286.7 kN·m/m, and 1509.4 kN·m/m, respectively. The maximum negative bending moments are −192.2 kN·m/m, −278 kN·m/m, and −2394.3 kN·m/m, respectively. The maximum values all occur in the areas where asymmetric loads act, and show a continuous downward trend with the increase in construction stages. This might be because the deep excavation and supporting structure in this study are symmetrically designed, while the load is in an asymmetrical form. Under the action of load, the soil body will be compressed. Due to the transitability of force, the soil will exert a force on the adjacent diaphragm wall, thus showing that the bending moment generated in the load-acting area is greater. On the contrary, in other non-load-affected areas, the extrusion effect caused by the appearance of the load is relatively weak. Therefore, it shows the phenomenon that the bending moment in the non-load-action area is relatively small.
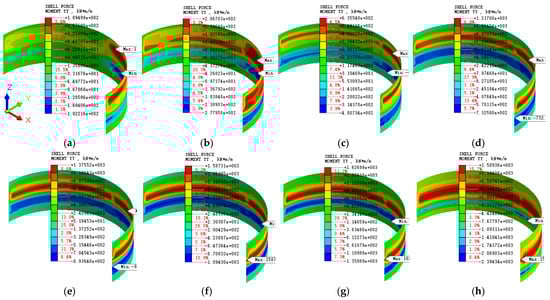
Figure 15.
Bending moment cloud map: (a) Stage 1; (b) Stage 3; (c) Stage 5; (d) Stage 8; (e) Stage 9; (f) Stage 11; (g) Stage 13; (h) Stage 16.
Figure 16 illustrates the bar chart of bending moment comparison. Figure 16a is a comparison chart of the maximum normal bending moment. Obviously, at different excavation stages, the bending moment values also vary, showing the feature of “increasing first and then decreasing”. The maximum normal bending moment occurs at stage 12. This phenomenon is different from the result under symmetrical loading [22,23]. This might be the effect produced under the action of asymmetric loads. By comparison, it can be found that the maximum increase is the largest at stage 1, with an increase of 189.5 kN·m/m. This also indicates that the asymmetric load and excavation have the greatest impact on the maximum normal bending moment in stage 1. Figure 16b is a comparison chart of the maximum negative bending moment. Obviously, at different excavation stages, the bending moment values also vary, showing the characteristic of “slowly increasing at first and then rapidly increasing”. The maximum value occurred when the excavation was completed, which was −2394.3 kN·m/m. It can also be found that the increase in working conditions 14, 15, and 16 are relatively large. The maximum increase occurs in working condition 15, with an increase of 376 kN·m/m. This indicates that the construction of the last three stages has the greatest impact on the maximum negative bending moment. Furthermore, it can be found that the maximum positive and negative values of the bending moment are 1509.4 kN·m/m and −2394.3 kN·m/m, respectively. Obviously, the absolute value of the maximum negative bending moment is larger, with a difference of 59% between the two. This indicates that the maximum bending moment generated during the excavation process is negative. Therefore, during the design and construction phases, it is necessary to pay close attention to the areas where the diaphragm wall experiences the maximum negative bending moment. If necessary, measures can be taken to reduce the adverse impact of excavation on the supporting structure.
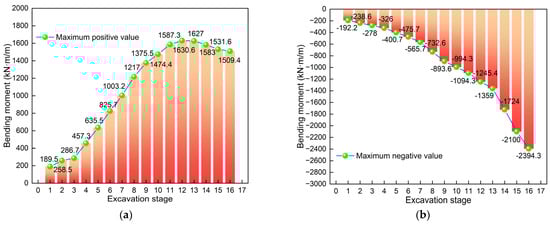
Figure 16.
Comparison of diaphragm wall bending moment: (a) Maximum positive value; (b) Maximum negative value.
In order to present the variation in the bending moment of the diaphragm wall in more detail, we extracted the calculation results and drew the curve graph related to the bending moment. It should be noted that representative monitoring points were selected for this study. The specific distribution of the monitoring points is shown in Figure 4. Figure 17 presents the comparison curve of bending moments of the diaphragm wall. Figure 17a–e illustrate the bending moment curves at different monitoring points. It can be seen that, although the bending moment values at different monitoring points may vary, they generally present a “bow knot” feature. The normal bending moment mainly occurs within the range of 0 to −22 m, with the maximum value at the position of −20 m. The negative bending moment is mainly concentrated within the range of −22 m to −35 m. The maximum value occurs at the position of −30 m. It is worth noting that the bending moment values at the top of the diaphragm wall and within the range of −35 m to −40 m are 0. This indicates that the design of the supporting structure in this study is reasonable. Figure 17f illustrates the comparison curve of bending moments at different monitoring points when the excavation is completed. It can be seen that the maximum normal bending moments, from largest to smallest are A1, A2, B1, B2, and O. The difference is that the absolute values of the maximum negative bending moment, from largest to smallest, are O, A1, A2, B2, and B1. It can be observed that the sequence of the maximum positive and negative bending moment from largest to smallest is not the same.
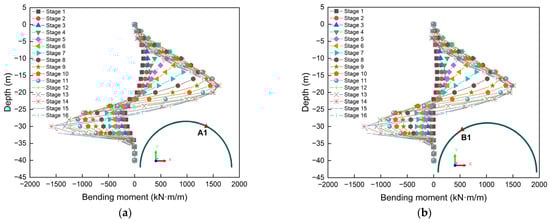
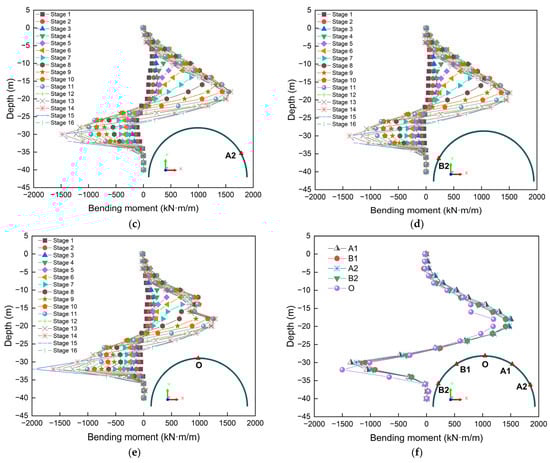
Figure 17.
Comparison of diaphragm wall bending moment: (a) Monitoring point A1; (b) Monitoring point B1; (c) Monitoring point A2; (d) Monitoring point B2; (e) Monitoring point O; (f) Bending moment comparison diagram.
Figure 18 illustrates the bending moment comparison bar chart of the diaphragm wall. Figure 18a shows the comparison of the maximum normal bending moments at different monitoring points when the excavation is completed. It can be seen that different monitoring points result in different bending moment values. The maximum positive values of A1, B1, A2, B2, and O are, respectively, 1500 kN·m/m, 1409 kN·m/m, 1481 kN·m/m, 1418 kN·m/m, and 1195 kN·m/m. Obviously, the value of A1 is the largest and that of O is the smallest, with a difference of 26% between the two. This indicates that excavation under asymmetric loading has the greatest impact on monitoring point A1. Figure 18b presents the comparison of the maximum negative bending moments at different monitoring points when the excavation is completed. It can be seen that different monitoring points result in different bending moment values. The maximum negative values of A1, B1, A2, B2, and O are, respectively, −1349 kN·m/m, −1096 kN·m/m, −1247 kN·m/m, −1162 kN·m/m, and −1502 kN·m/m. Obviously, the value of O is the largest and that of B1 is the smallest, with a difference of 37% between the two. This indicates that excavation under asymmetric loading has the greatest impact on monitoring point O. In conclusion, excavation under asymmetric loads has the greatest impact on monitoring points A1 and O, which requires attention during design and construction. This once again verifies that the circular diaphragm wall is a three-dimensional spatial structure, and its analysis and calculation is a complex three-dimensional spatial problem [25]. If solved as a planar problem without considering the three-dimensional force and deformation characteristics brought by the spatial effect of the circular retaining wall, the research results may have significant limitations [33,35,48].
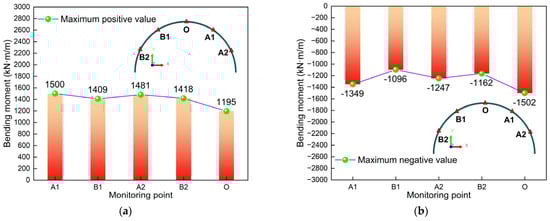
Figure 18.
Comparison bar graph of bending moment: (a) Maximum positive value; (b) Maximum negative value.
To sum up, the bending moment varies at different construction stages. The bending moment cloud diagram presents an asymmetric characteristic. The bending moment values can be positive or negative, which indicates that some parts of the diaphragm wall are under tension while others are under compression. The maximum values all occur in the areas where asymmetric loads act, and show a continuous downward trend with the increase in construction stages. The order of the maximum positive bending moment and negative bending moment from largest to smallest is not the same. The bending moment graphs of different monitoring points all present the feature of a “bow knot”. The circular diaphragm wall is a three-dimensional spatial structure, and its analysis and calculation is a complex three-dimensional spatial problem. Therefore, it is necessary to consider the three-dimensional force and deformation characteristics brought by the spatial effect of the circular diaphragm wall, thereby enhancing the reliability of the research results.
5.4. Shear Force of Diaphragm Wall
Figure 19 presents the shear cloud diagram of the diaphragm wall in the YZ direction. Obviously, the shear force varies at different construction stages. The shear cloud map presents asymmetric characteristics. Observation reveals that the maximum positive shear forces in stages 1, 3, and 16 are 32.3 kN/m, 51.3 kN/m, and 333 kN/m, respectively. The maximum negative shear forces are −58.8 kN/m, −93.7 kN/m, and −705 kN/m, respectively. The maximum values all occur in the areas where asymmetric loads act. The reason might be that the deep excavation and supporting structure in this study are symmetrically designed, while the load is in an asymmetrical form. Under the action of load, the soil body will be compressed. Due to the transmissible nature of force, the soil will exert a force on the adjacent diaphragm wall, thus showing that the shear force generated in the load-acting area is greater. On the contrary, in other non-load-affected areas, the extrusion effect caused by the appearance of the load is relatively weak. Therefore, it shows the phenomenon that the shear force in the non-load-action area is relatively small.

Figure 19.
Shear force cloud map: (a) Stage 1; (b) Stage 3; (c) Stage 5; (d) Stage 8; (e) Stage 9; (f) Stage 11; (g) Stage 13; (h) Stage 16.
Figure 20 is a bar chart of shear force comparison. Figure 20a is a comparison chart of the maximum positive shear force. Obviously, at different excavation stages, the shear force values are also different, presenting the feature of “first increasing, then decreasing, and then increasing again”. The maximum positive shear force occurs when the excavation is completed. By comparison, it can be found that the maximum increase is the greatest at stage 16, which is 98 kN/m. This also indicates that the asymmetric load and excavation have the greatest impact on the maximum positive shear force in stage 16. Figure 20b is a comparison chart of the maximum negative shear force. Obviously, at different excavation stages, the shear force values are also different, presenting the feature of “first increasing, then decreasing, and then increasing again”. The maximum value also occurred when the excavation was completed, which is −705 kN/m. It can also be found that the maximum increase occurs in stage 16, which is 213 kN/m. This indicates that the construction in the final stage has the greatest impact on the shear force. Furthermore, it can also be found that the maximum positive and negative values of the shear force are 333 kN/m and −705 kN/m, respectively. The absolute value of the maximum negative shear force is larger. The difference between the two is 111%. This indicates that the maximum shear force generated during the excavation process is negative. At stage 16, the increase in shear force is the greatest, which requires attention in the design and construction.
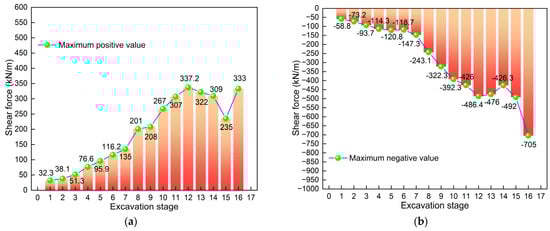
Figure 20.
Comparison bar graph of shear force: (a) Maximum positive value; (b) Maximum negative value.
To sum up, the shear force varies at different construction stages. The shear cloud map presents asymmetric characteristics. The maximum values all occur in the areas where asymmetric loads act. The maximum shear forces all occur when the excavation is completed. The construction in the final stage has the greatest impact on shear force. The absolute value of the maximum negative shear force is larger. The maximum shear force generated during the excavation process is negative. It is necessary to pay attention to the adverse effect of maximum negative shear force in design and construction.
5.5. Supporting Structure Axial Force
Figure 21 shows the axial force cloud diagram of the ring beam. Obviously, the axial force varies at different construction stages. The axial force cloud pattern presents an asymmetric characteristic. Observation reveals that the maximum axial forces in stages 1, 3, and 16 are −2140 kN, −3096 kN, and −5360 kN, respectively. The maximum values of stages 1 and 3 both occur in ring beam 1, and the maximum value of stage 16 occurs in ring beam 4. The minimum axial forces are 197 kN, −610 kN, and 1179 kN, respectively. The minimum values all occur in the areas where there is no load on ring beam 1. Furthermore, the maximum values of the first five stages all occur in the areas where asymmetric loads act, while the maximum values of the other stages occur in other areas. This indicates that the influence of asymmetric loads on the axial force of ring beams weakens with the increase in the excavation depth. It is worth noting that, when the excavation is completed, the axial forces of ring beams 3, 4, and 5 are relatively the greatest, all approaching −5360 kN. Therefore, ring beams 3, 4, and 5 are the objects that need to be focused on during the construction process. It can also be seen that the internal forces of the ring beam are not all compression in the non-load-action zone; in some stages, they are tension. This phenomenon also requires the attention of design and construction. As can be seen from Figure 21, the part where tensile force occurs is mainly the area of ring beam 1, far from the asymmetric load action zone. The reason for the occurrence of tensile force might be that, under the action of asymmetric load, the ring beam in the load action zone is compressed, and there is a tendency for it to deform towards the interior of the foundation pit, which in turn causes pressure on the ring beam in this area. Due to the distance between the acting force and the reaction force, the ring beam in the asymmetric load action zone will exert a force on the ring beam far from the load action zone. Under the action of this force, it may cause tension in the ring beam. In addition, it can be seen that the excavation has a relatively significant impact on the axial force of ring beams 1 to 6. The following text will conduct a detailed analysis and study.
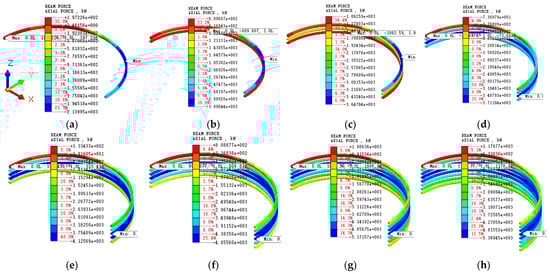
Figure 21.
Axial force cloud map of the ring beam: (a) Stage 1; (b) Stage 3; (c) Stage 5; (d) Stage 8; (e) Stage 9; (f) Stage 11; (g) Stage 13; (h) Stage 16.
Figure 22 presents the axial force comparison bar graph of the ring beam. Figure 22a is a comparison chart of the maximum axial force. Obviously, at different stages, the axial force values are different, presenting the characteristics of “first increasing rapidly, then decreasing, and finally increasing slowly”. The maximum value occurs when the excavation is completed. The maximum axial forces are all negative, which indicates that the axial force of the ring beam is mainly compression. By comparison, it can be found that the increase is the largest in stage 1, which is 2140 kN. This also indicates that the asymmetric load and excavation have the greatest impact on the axial force in stage 1. Figure 22b is a comparison chart of the minimum axial force. At different excavation stages, the axial force values are also different, showing the characteristics of “first increasing, then decreasing, and then increasing again”. The maximum value also occurs when the excavation is completed. The minimum values can be both positive and negative, which indicates that, in addition to being compressed, some areas of the ring beam are also under tension. It can also be found that the maximum increase occurs in stage 4, which is 540 kN. This indicates that the construction in stage 4 has the greatest impact on the axial force. Furthermore, it can be found that the maximum and minimum values of the axial force are −5360 kN and 1179 kN/m, respectively. This indicates that the axial force generated during the excavation process is mainly compression. To sum up, the axial force of the ring beam during the excavation process is mainly compression. The increase in axial force is the greatest in stages 1 and 4, which requires attention in design and construction.
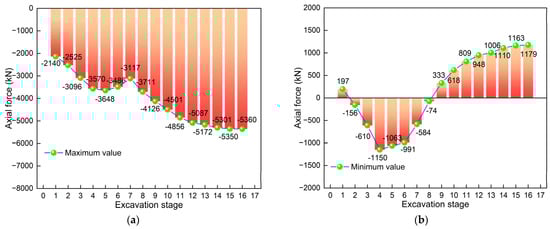
Figure 22.
Axial force comparison diagram: (a) Maximum axial force; (b) Minimum axial force.
Figure 23 illustrates the comparison of axial forces between ring beam 1 and 2. Figure 23a shows the comparison of the maximum axial force of the ring beam 1. Obviously, the axial force value varies at different stages, showing the characteristic of “increasing rapidly first and then decreasing”. The maximum axial force occurs in stage 5, with a value of −3648 kN. The maximum axial forces are all negative, which indicates that the axial force of ring beam 1 is mainly compression. By comparison, it can be found that the increase is the largest in stage 1, which is 2140 kN. This also indicates that the asymmetric load and excavation have the greatest impact on the axial force in stage 1. Figure 23b presents the comparison of the maximum axial forces of ring beam 2. Obviously, the axial force values vary at different construction stages, showing the characteristic of “first increasing and then tending to stabilize”. The maximum value also occurs in stage 9, with a value of −2949 kN. The maximum values are all negative, which indicates that ring beam 2 is mainly under compression. It can also be found that the maximum increase occurs in stage 4, which is 791 kN. This indicates that the construction in stage 4 has the greatest impact on the axial force. To sum up, the axial force of ring beams 1 and 2 during the excavation process is mainly compression. The increase in axial force is the greatest in stages 1 and 4, which requires attention in design and construction.
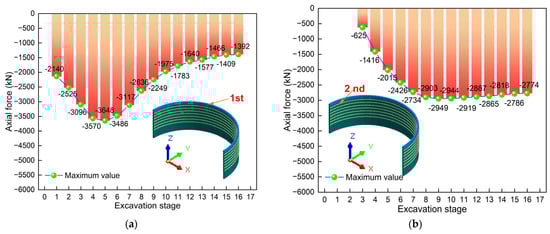
Figure 23.
Axial force comparison diagram of the ring beam: (a) Ring beam 1; (b) Ring beam 2.
Figure 24 presents the axial force comparison diagram of ring beam 3 and 4. Figure 24a illustrates the comparison diagram of the maximum axial force of ring beam 3. Obviously, the axial force value varies at different stages, showing the characteristic of “increasing rapidly at first and then tending to stabilize”. The maximum axial force occurs at stage 14, with a value of −4537 kN. The maximum axial forces are all negative, which indicates that the axial force of ring beam 3 is mainly compression. By comparison, it can be found that the increase is the largest at stage 5, with a value of 1102 kN. This also indicates that the asymmetric load and excavation have the greatest impact on the axial force in stage 5. Figure 24b shows the comparison of the maximum axial forces of ring beam 4. Obviously, at different stages, the axial force values also vary, showing the characteristic of “increasing rapidly at first and then slowly”. The maximum value also occurs when the excavation is completed, with a value of −5360 kN. The maximum values are all negative, which indicates that ring beam 4 is mainly under compression. It can also be found that the maximum increase occurs in stage 7, with a value of 1530 kN. This indicates that the construction in stage 7 has the greatest impact on the axial force. To sum up, the axial force of ring beams 3 and 4 during the excavation process is mainly compression. The increase in axial force is the greatest at stages 5 and 7, which requires attention in design and construction.
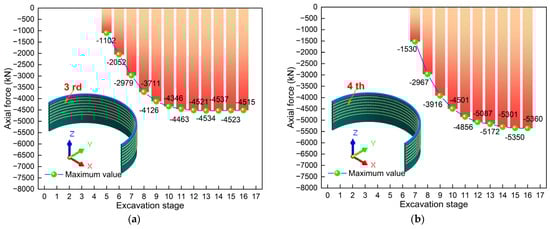
Figure 24.
Axial force comparison diagram of the ring beam: (a) Ring beam 3; (b) Ring beam 4.
Figure 25 illustrates the comparison of the axial forces of ring beams 5 and 6. Figure 25a shows the comparison diagram of the maximum axial force of ring beam 5. Obviously, the axial force value varies at different stages, showing the characteristic of “increasing rapidly at first and then slowly”. The maximum axial force occurred when the excavation was completed, with a value of −4679 kN. The maximum axial forces are all negative, which indicates that the axial force of ring beam 5 is mainly compression. By comparison, it can be found that the increase is the largest at stage 9, with a value of 1500 kN. This also indicates that the asymmetric load and excavation have the greatest impact on the maximum axial force in stage 9. Figure 25b presents the comparison diagram of the maximum axial force of ring beam 6. Obviously, the axial force value varies at different stages, showing the characteristic of “increasing rapidly at first and then slowly”. The maximum value also occurred when the excavation was completed, with a value of −3752 kN. The maximum values are all negative, which indicates that ring beam 6 is mainly under compression. It can also be found that the maximum increase occurs in stage 11, which is 1530 kN. This indicates that the construction in stage 11 has the greatest impact on the axial force. To sum up, the axial force of ring beams 5 and 6 during the excavation process is mainly compression. The increase in axial force is the greatest at stages 9 and 11, which requires attention in design and construction.
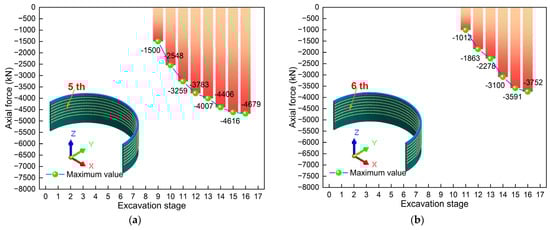
Figure 25.
Axial force comparison diagram of the ring beam: (a) Ring beam 5; (b) Ring beam 6.
To sum up, the axial force varies at different construction stages. The axial force of the ring beam is mainly compression, and the maximum compression generally shows the characteristic of “constantly increasing” with the increase in the excavation depth. The axial force cloud pattern presents an asymmetric characteristic. The maximum values of the first five stages all occur in the area where the asymmetric load acts, and the maximum values of the other stages occur in other areas. When the excavation is completed, the axial forces of ring beams 3, 4, and 5 are relatively maximum. Ring beams 3, 4, and 5 are the objects that need to be given special attention during the construction process. The internal forces of the ring beam are not all compression in the non-load-action zone; tensile forces may also occur in some stages. This phenomenon also requires the attention of design and construction.
6. Discussion
In this paper, the mechanical behavior of large-diameter circular deep excavation under asymmetric load is studied. The results show that the deformation and internal forces of the supporting structure under asymmetric loads present asymmetric characteristics. Asymmetric loads have a more obvious influence on the deformation and internal forces of adjacent supporting structures. The research results play a positive role in the design optimization and construction guidance of similar engineering structures. However, this study only focuses on the action of asymmetric loads, and the load form is relatively simple. Previous studies related to the influence of different load forms on the construction mechanical behavior of super-large diameter circular deep excavation have been relatively few [21,22,23]. Furthermore, the environment for the construction of deep excavation related to the anchor foundation of bridges is usually rather complex [24,25]. Therefore, it is necessary to discuss the relevant contents of construction mechanics behavior under different load forms. This discussion selects the total displacement of the diaphragm wall as the research object. The load forms are as follows: (1) no load, (2) symmetrical load, and (3) asymmetric load. It should be noted that the size of the surface load involved in this study is 30 kPa, and other conditions are consistent with the previous text except for changing the form of the load action.
Figure 26 presents the cloud diagram of the total displacement of the diaphragm wall under symmetric loading. Obviously, the displacement varies at different stages. The displacement cloud map shows symmetrical features. This is mainly because, under this load form, both the supporting structure and the load are symmetrical. Therefore, the displacement cloud map presents symmetrical features. The conclusion of this study is consistent with the references [22,23]. This also verifies the rationality of the model established in this study from another aspect. At stages 1, 5, 11, and 16, the maximum displacements were 2.7 mm, 5.6 mm, 11.8 mm, and 12.9 mm, respectively. Obviously, the maximum displacement occurs when excavation is completed and the minimum displacement occurs at stage 1.
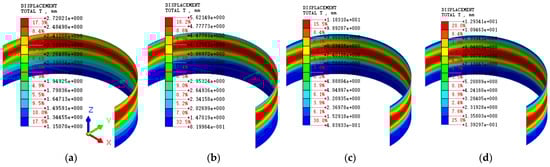
Figure 26.
Cloud diagram of total displacement under symmetric load: (a) Stage 1; (b) Stage 5; (c) Stage 11; (d) Stage 16.
Figure 27 illustrates the cloud diagram of the total displacement of the diaphragm wall under no load. Obviously, the displacement varies at different stages. The displacement cloud map shows symmetrical features. The conclusion of this study is consistent with the references [22] and [23]. This also verifies the rationality of the model established in this study from another aspect. It should be noted that, under the condition of no load, both the supporting structure and the soil are symmetrical. Therefore, the displacement cloud map presents symmetrical features. At stages 1, 5, 11, and 16, the maximum displacements are 1.8 mm, 4.5 mm, 10.8 mm, and 12 mm, respectively. Obviously, the maximum displacement occurs when excavation is completed and the minimum displacement occurs at stage 1.
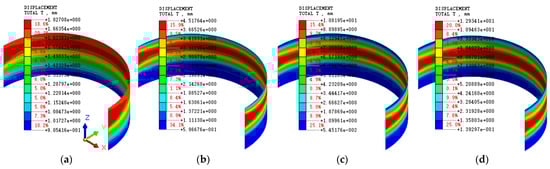
Figure 27.
Cloud diagram of total displacement without load: (a) Stage 1; (b) Stage 5; (c) Stage 11; (d) Stage 16.
Figure 28 illustrates the displacement comparison curve. By comparison, it can be found that, whether under symmetrical load or no load, the total displacement deformation curve of the diaphragm wall presents a “belly bulge” feature. This indicates that excavation is the main factor for the deformation of the diaphragm wall. Therefore, it is necessary to attach importance to the simulation and optimal design of excavation conditions. It is worth noting that there are also some differences in Figure 28a,b. For instance, under the action of symmetrical loads, the displacement at the top of the diaphragm wall is greater when the excavation is completed. Furthermore, it can also be seen that the displacement of the diaphragm wall is greater under symmetrical loads. This also indicates that the load has had a certain impact on the construction of the deep excavation. Therefore, it is necessary to pay attention to the influence of load in similar projects.
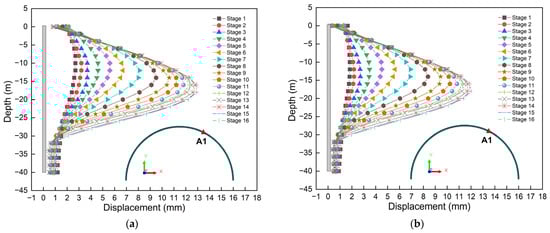
Figure 28.
Displacement comparison curve: (a) Symmetrical load; (b) No load.
Figure 29 presents the comparison of displacements under different load forms. Figure 29a shows the displacement comparison curve of monitoring point A1 when the excavation is completed. Obviously, the displacement varies under different load forms. However, the displacement curves all exhibit a “belly bulge” feature. The load forms of displacement at the same position from large to small are asymmetric load, symmetrical load, and no load, in sequence. Obviously, the displacement is the smallest when there is no load and the maximum when there is an asymmetric load. Figure 29b illustrates the displacement comparison diagram. By comparison, it can be found that the load forms of displacement from large to small in the same construction stage are, respectively, asymmetric load, symmetrical load, and no load. Obviously, the displacement is the smallest when there is no load and the maximum when there is an asymmetric load. This might be because, when there is a load near the deep excavation, the load will compress the soil. Due to the interaction of forces, the soil will compress the diaphragm wall, thus resulting in the phenomenon of minimum displacement when there is no load.
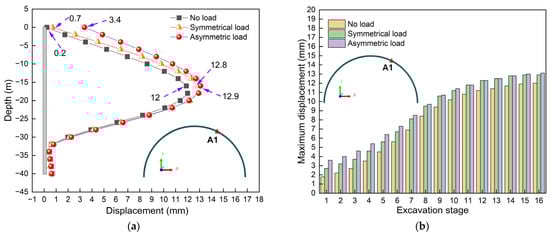
Figure 29.
Displacement comparison curve: (a) Displacement comparison curve graph; (b) Displacement comparison bar chart.
In addition, when the load is in an asymmetric form, the soil in the load-acting area will compress the diaphragm wall, resulting in a greater displacement of the supporting structure in the load-acting area, while the deformation of the supporting structure in the non-load-acting area is suppressed, thus resulting in a smaller displacement. When the load is symmetrically arranged, the squeezing effect produced by this load has a certain cancelation, thus resulting in the phenomenon that the displacement is the greatest when the asymmetric load acts. In addition, it can be found that, with the increase in the depth, under different forms of loads, the displacement differences in the supporting structure during the excavation process gradually decrease. In the anchoring area of the supporting structure, this deformation difference is close to zero. That is to say, the influence of the load on the displacement of the supporting structure weakens with the increase in depth. Therefore, the influence of asymmetric loads on deep excavation needs to be emphasized. On the one hand, when constructing the deep excavation, efforts should be made to minimize the possible loads nearby. On the other hand, efforts should be made to try to avoid the load appearing in an asymmetric form. If necessary, measures can be taken to reduce the adverse effects caused by asymmetric loads.
The main shortcomings of this study are as follows: (1) The influence of pipelines, vehicles, and rainy weather that may appear around the excavation is not considered. (2) There was no comparative analysis of the influence of the load magnitude, range, and position changes. (3) The impact of groundwater was not carried out. (4) The influence of asymmetric loads on the soil at the bottom of the pit and the soil around the deep excavation was not investigated. (5) Although this study compared and analyzed the influence of different load forms on excavation in the discussion section, it only compared the total displacement of the diaphragm wall, and the research content was not rich enough.
Future research directions are as follows: (1) Consider the surrounding environment of deep excavation engineering more comprehensively. Factors such as pipelines, rainy weather, and vehicle loads that may occur around the deep excavation project will be included in the research. (2) Based on this research, a comparative analysis will be conducted on the magnitude, range of the load, as well as the influence of position changes. (3) Conduct an analysis of the impact of groundwater on excavation. (4) Conduct research on the influence of asymmetric loads on the soil at the bottom of the pit and the soil around the deep excavation. (5) Further enrich the content of research on the influence of different load forms on excavation, including the internal force and deformation characteristics of the supporting structure and the surrounding soil. (6) Determine the active force acting on the wall in the section below the surface force and in other sections.
7. Conclusions
In this paper, the mechanical behavior of large-diameter circular deep excavation construction under asymmetric load was studied by means of numerical simulation and field monitoring. The main findings are summarized as follows:
(1) Based on the modified Moorish Coulomb constitutive model, MIDAS/GTS NX was used to numerically simulate the ultra-large-diameter circular deep excavation project under asymmetric loads. The simulation results are in good agreement with the measured data. During the construction process, the displacement of the supporting structure is relatively small, and the deep excavation tends to be safe. The support structure of “diaphragm wall + ring beam” is feasible for the construction of super-large-diameter circular deep excavation projects. In addition, both the internal force and displacement cloud maps of the supporting structure present asymmetric characteristics. Displacement and internal force distribution have spatial effects, and the maximum values all occur in the areas where asymmetric loads act.
(2) The total displacement, axial force, and maximum shear force of the diaphragm wall increase with the increase in the excavation depth. The total displacement curves all exhibit the feature of a “bulging belly”. The maximum displacement is 13.3 mm, which occurs at a position −16 m below the surface. The axial force is mainly compression, with a maximum value of −9514 kN/m. Pulling forces may also occur at other positions, but the values are relatively small. The maximum positive and negative values of the shear force are 333 kN/m and −705 kN/m, respectively.
(3) The bending moment diagrams of different monitoring points all show the characteristics of a “bow knot”. The maximum positive bending moment shows the feature of “increasing first and then decreasing” with the increase in the excavation depth, and the maximum negative bending moment shows the feature of “constantly increasing”. The maximum values are 1509.4 kN·m/m and −2394.3 kN·m/m, respectively.
(4) The axial force of the ring beam is mainly compression, and the maximum compression generally shows the characteristic of “constantly increasing” with the increase in the excavation depth. The maximum value is −5360 kN, which occurs in ring beams 3, 4, and 5. Axial force also has tensile force, and its value is relatively small. The maximum value is 1179 kN, which occurs in ring beam 1.
(5) The displacement cloud map of the supporting structure under symmetrical loading shows symmetrical characteristics. The form of load has a certain influence on the displacement of diaphragm wall, but the influence weakens with the increase in the depth. Excavation is the main factor for the deformation of diaphragm wall. Under different load conditions, the total displacement-based deformation curves of diaphragm walls all exhibit the “belly bulge” feature. The load forms of the displacement at the same position from large to small are asymmetric load, symmetric load, and no load.
Author Contributions
Conceptualization, P.Z. and P.G.; methodology, P.G. and Y.Q.; software, P.Z.; validation, F.L., Z.W. and P.Z.; formal analysis, F.L., P.Z., Y.Q. and Z.W.; investigation, P.Z. and Y.Q.; resources, P.G. and Z.W.; data curation, F.L. and P.Z.; writing—original draft preparation, P.Z. and Y.Q.; writing—review and editing, P.G. and Z.W.; visualization, F.L. and Y.Q.; supervision, P.G.; project administration, Z.W. and P.Z.; funding acquisition, F.L., P.G. and Z.W. All authors have read and agreed to the published version of the manuscript.
Funding
This research was funded by the Key Research and Development Project of Shaanxi Province, grant number 2025CY-YBXM-450, the Fundamental Research Funds for the Central Universities, grant number JZ2025HGTB0205, and the Tongling Huabiao Project Management Co., Ltd. Sponsored Research Project, grant number 2025tlxyxdz067.
Data Availability Statement
The original contributions presented in this study are included in the article. Further inquiries can be directed to the corresponding author.
Conflicts of Interest
The authors declare that this study received funding from Tongling Huabiao Project Management Co., Ltd. The funder was not involved in the study design, collection, analysis, interpretation of data, the writing of this article, or the decision to submit it for publication. Youqiang Qiu is employed by the CCCC First Highway Consultants Co., Ltd. The remaining authors declare that the research was conducted in the absence of any commercial or financial relationships that could be construed as a potential conflict of interest.
References
- Guo, P.; Sun, T.; Li, H.; Wang, Y. Performance of pipeline suspension system for in-situ protecting large-diameter pressurized pipelines straddling deep braced excavation in clays. Tunn. Undergr. Space Technol. 2025, 163, 106752. [Google Scholar] [CrossRef]
- Cai, H.; Li, M.; Hou, Y.; Chen, J. Observed Behaviors of an Ultra-Deep Excavation with an Innovative Pre-Support System in Shanghai Soft Deposits. J. Shanghai Jiaotong Univ. 2024, in press. [Google Scholar] [CrossRef]
- Guo, P.; Gong, X.; Wang, Y. Displacement and force analyses of braced structure of deep excavation considering unsymmetrical surcharge effect. Comput. Geotech. 2019, 113, 103102. [Google Scholar] [CrossRef]
- Hsiung, B.-C.B.; Phan, H.K. Exploration of maximum wall deflection and stability for deep excavation in loose to medium-dense sand. Acta Geotech. 2024, 19, 531–547. [Google Scholar] [CrossRef]
- Guo, P.; Gong, X.; Wang, Y.; Lin, H.; Zhao, Y. Analysis of observed performance of a deep excavation straddled by shallowly buried pressurized pipelines and underneath traversed by planned tunnels. Tunn. Undergr. Space Technol. 2023, 132, 104946. [Google Scholar] [CrossRef]
- Liu, S.; Wang, Z.; Chen, Y.; Fang, G.; Zhao, Y.; Yang, J.; Sun, H. Characteristics stochastic analysis of long and narrow deep excavations under soil spatial variability. Sci. Rep. 2025, 15, 8185. [Google Scholar] [CrossRef]
- Guo, P.; Gong, X.; Wang, Y.; Lin, H.; Zhao, Y. Minimum cover depth estimation for underwater shield tunnels. Tunn. Undergr. Space Technol. 2021, 115, 104027. [Google Scholar] [CrossRef]
- Li, Y.; Yao, A.; Li, H.; Gong, Y.; Tian, T. Calculation method of multi-stage earth pressure for foundation excavation considering excavation process. Acta Geotech. 2023, 18, 6123–6141. [Google Scholar] [CrossRef]
- Guo, P.; Liu, F.; Lei, G.; Li, X.; Zhu, C.-W.; Wang, Y.; Lu, M.; Cheng, K.; Gong, X.; Wang, Y. Predicting Response of Constructed Tunnel to Adjacent Excavation with Dewatering. Geofluids 2021, 2021, 5548817. [Google Scholar] [CrossRef]
- Zhai, G.; Dai, J.; Chen, G.; Pan, Z.; Liang, C.; Liu, Z.; Jiang, X. Mechanism mode and prevention and control measures of karst collapses induced by foundation pit excavation. Carbonates Evaporites 2024, 39, 88. [Google Scholar] [CrossRef]
- Guo, P.; Lei, G.; Luo, L.; Gong, X.; Wang, Y.; Li, B.; Hu, X.; Hu, H.; Wang, Y. Soil Creep Effect on Time-Dependent Deformation of Deep Braced Excavation. Adv. Mater. Sci. Eng. 2022, 2022, 5655592. [Google Scholar] [CrossRef]
- Yin, Z.; Jin, R.; Guan, S.; Chen, Z.; Dai, G.; Zhu, W. Research on Construction Sequencing and Deformation Control for Foundation Pit Groups. Appl. Sci. 2025, 15, 7719. [Google Scholar] [CrossRef]
- He, M.; Sui, Q.; Tao, Z. Excavation compensation theory and supplementary technology system for large deformation disasters. Deep. Undergr. Sci. Eng. 2023, 2, 105–128. [Google Scholar] [CrossRef]
- Qiu, L.; Yin, P.; Wang, L.; Shi, H.; Chen, Z. Analysis of stress and deformation of retaining structure in deep foundation pit based on spatial effect. J. Transp. Sci. Eng. 2023, 39, 70–79. (In Chinese) [Google Scholar] [CrossRef]
- Zhu, X.; Zhao, W.; Zhao, J.; Dai, G.; Jin, R.; Chen, Z.; Zhu, W. Deformation Characteristics and Base Stability of a Circular Deep Foundation Pit with High-Pressure Jet Grouting Reinforcement. Appl. Sci. 2025, 15, 6825. [Google Scholar] [CrossRef]
- Wu, D.; Xu, K.; Guo, P.; Lei, G.; Cheng, K.; Gong, X.; Yuan, J. Ground Deformation Characteristics Induced by Mechanized Shield Twin Tunnelling along Curved Alignments. Adv. Civ. Eng. 2021, 2021, 6640072. [Google Scholar] [CrossRef]
- Zhang, H.; Guo, P.; Wang, Y.; Zhao, Y.; Lin, H.; Liu, Y.; Shao, Y. Fracture Behavior of Rock with Initial Damage: Theoretical, Experimental, and Numerical Investigations. Geofluids 2020, 2020, 8886843. [Google Scholar] [CrossRef]
- Roeun, D.; Sukkarak, R.; Likitlersuang, S. Influences of Subsoil Modelling on Underground Deep Excavation Behaviour in Phnom Penh City, Cambodia. Int. J. Geosynth. Ground Eng. 2024, 10, 27. [Google Scholar] [CrossRef]
- Wang, Y.-X.; Guo, P.-P.; Ren, W.-X.; Yuan, B.-X.; Yuan, H.-P.; Zhao, Y.-L.; Shan, S.-B.; Cao, P. Laboratory Investigation on Strength Characteristics of Expansive Soil Treated with Jute Fiber Reinforcement. Int. J. Geomech. 2017, 17, 04017101. [Google Scholar] [CrossRef]
- Wang, Y.; Guo, P.; Lin, H.; Zhao, Y. Risk management technologies for deep excavations in water-rich areas. Water 2024, 16, 323. [Google Scholar] [CrossRef]
- Ma, A.; Wang, W.; Zhu, W.; Xu, Z.; Ye, G. Sensitivity Analysis and Application of the Shanghai Model in Ultra-Deep Excavation Engineering. Geotechnics 2025, 5, 6. [Google Scholar] [CrossRef]
- Xu, Z.; Guo, S.; Guo, L.; Guo, P.; Ding, H.; Liu, K.; Xu, B.; Wu, B.; Wu, W.; Wang, Y. Stability analysis of super-large special-shaped deep excavation in coastal water-rich region considering spatial variability of ground parameters. Water 2023, 16, 98. [Google Scholar] [CrossRef]
- Sun, H.; Wang, L.; Chen, S.; Deng, H.; Zhang, J. A Precise Prediction of Tunnel Deformation Caused by Circular Foundation Pit Excavation. Appl. Sci. 2019, 9, 2275. [Google Scholar] [CrossRef]
- Wang, L.; Shao, G. Force Analysis of Circular Diaphragm Wall Based on Circular Cylindrical Shell Theory. Appl. Sci. 2023, 13, 4450. [Google Scholar] [CrossRef]
- Zhang, J.; Wu, R.; Zhang, Z. Study on the factors affecting the spatial effect of circular underground continuous walls. J. Transp. Sci. Eng. 2022, 38, 70–79. (In Chinese) [Google Scholar] [CrossRef]
- Shi, H.; Jia, Z.; Wang, T.; Cheng, Z.; Zhang, D.; Bai, M.; Yu, K. Deformation Characteristics and Optimization Design for Large-Scale Deep and Circular Foundation Pit Partitioned Excavation in a Complex Environment. Buildings 2022, 12, 1292. [Google Scholar] [CrossRef]
- Gao, X.; Tian, W.; Zhang, Z. Analysis of Deformation Characteristics of Foundation-Pit Excavation and Circular Wall. Sustainability 2020, 12, 3164. [Google Scholar] [CrossRef]
- Ge, C.; Yang, M.; Li, P.; Zhang, M. Influence of deep foundation pit excavation on surrounding environment: A case study in Nanjing, China. Acta Geophys. 2025, 73, 495–516. [Google Scholar] [CrossRef]
- Wu, G.; Chen, W.; Bian, H.; Yuan, J. Structure optimisation of a diaphragm wall with special modelling methods in a large-scale circular ventilating shaft considering shield crossing. Tunn. Undergr. Space Technol. 2017, 65, 35–41. [Google Scholar] [CrossRef]
- Kuang, R.; Xu, C.; Zeng, C.; Xue, X.; Zhao, Y.; Li, B.; Yi, L. Numerical Simulation of Horizontal Barrier in Controlling Groundwater and Deformation During Foundation Pit Dewatering. Water 2025, 17, 1763. [Google Scholar] [CrossRef]
- Huang, Q.; Yao, X.; Wu, J.; Fan, X.; Jin, Y.; Zheng, C. Stability Analysis of Removal of Steel Supports in Variable-Section Pits. Buildings 2025, 15, 1903. [Google Scholar] [CrossRef]
- Shi, X.; Rong, C.; Cheng, H.; An, G.; Wu, Q.; Zheng, L. Stability analysis of deep foundation pit with a double-row cast-in-place piles and diagonal steel lattice braces under sloped excavation conditions. Sci. Rep. 2024, 14, 22761. [Google Scholar] [CrossRef]
- Liu, H.; Liu, X.; Zhou, X.; Wang, L.; Wang, K.; Zhang, J.; Guo, X. Study on Spatiotemporal Evolution Laws and Deformation Characteristics of Circular Deep and Large Foundation Pits in Soft Soils. Arab. J. Sci. Eng. 2024, 49, 13975–13999. [Google Scholar] [CrossRef]
- Gao, X.; Bi, Y.; Dong, Y.; Wang, J.; Liu, X.; Li, J. Research on the Response Characteristics of Excavation and Support in Circular Sand Soil Foundation Pit Based on Parameter Verification. J. Mar. Sci. Eng. 2025, 13, 349. [Google Scholar] [CrossRef]
- Ren, B.; Shen, Y.; Zhao, T.; Li, X. Deformation monitoring and remote analysis of ultra-deep underground space excavation. Undergr. Space 2023, 8, 30–44. [Google Scholar] [CrossRef]
- Ren, D.; Kang, C.; Peng, T.; Li, Y.; Wang, J. Deformation Behavior of a Large-Scale Excavation and the Effect of an Adjacent Foundation Pit on the Excavation. Int. J. Civ. Eng. 2024, 22, 1493–1505. [Google Scholar] [CrossRef]
- Xia, B.; Zheng, G.; Zhou, H.; He, Y. Evaluation of building damage caused by excavation-induced ground movements in three-dimensional deformation field: A case study in Tianjin, China. Acta Geotech. 2025, in press. [Google Scholar] [CrossRef]
- Zhao, Y.; Chen, X.; Hu, B.; Huang, L.; Lu, G.; Yao, H. Automatic monitoring and control of excavation disturbance of an ultra-deep foundation pit extremely adjacent to metro tunnels. Tunn. Undergr. Space Technol. 2023, 142, 105445. [Google Scholar] [CrossRef]
- Tang, W.; Tang, L.; Ling, X.; Kong, X.; Zhang, Y. Long-term performance of subway tunnels induced by the symmetrical excavation of semicircular deep foundation pits in the Northeast Region hard silty clay. Tunn. Undergr. Space Technol. 2024, 154, 106052. [Google Scholar] [CrossRef]
- Chen, L.; Guo, C.; Pan, Y.; Liang, H.; Tang, M.; Zhai, K. Influence of Excavation Radius on Behavior of Circular Foundation Pits Supported by Prefabricated Recyclable Structures: Full-Scale Experimental and Numerical Analysis. Buildings 2024, 14, 3110. [Google Scholar] [CrossRef]
- Wei, G.; Feng, F.; Cui, Y.; Wang, X.; Diao, H.; Wu, Y. Research on the influence of foundation pit excavation on the lateral force and deformation of side shield tunnels based on full-scale experiments. Tunn. Undergr. Space Technol. 2023, 140, 105236. [Google Scholar] [CrossRef]
- Guo, Y.; Ren, X.; Liu, S.; Fu, X.; Yuan, G.; Zhang, G.; Yang, Y.; Yang, Z.; Wang, X.; Ni, M. Development and application of similar material for physical model test of an ultradeep foundation pit in round gravel strata. Sci. Rep. 2025, 15, 16515. [Google Scholar] [CrossRef]
- Zhao, P.; Qiu, Y.; Wang, Z.; Guo, P. Performance of typical structural components in basement-addition for existing building. Sci. Rep. 2025, 15, 12779. [Google Scholar] [CrossRef]
- Yan, X.; Tong, L.; Li, H.; Liu, W.; Xiao, Y.; Wang, W. Effects of the excavation of deep foundation pits on an adjacent double-curved arch bridge. Undergr. Space 2025, 21, 164–177. [Google Scholar] [CrossRef]
- Xu, Q.; Xie, J.; Zhu, H.; Lu, L. Supporting behavior evolution of ultra-deep circular diaphragm walls during excavation: Monitoring and assessment methods comparison. Tunn. Undergr. Space Technol. 2023, 143, 105495. [Google Scholar] [CrossRef]
- Meng, F.; Qiao, S. Study on the deformation of existing tunnel under the combined effect of pit excavation and dewatering based on the Kerr foundation model. Tunn. Undergr. Space Technol. 2025, 158, 106382. [Google Scholar] [CrossRef]
- Sun, H.; Chen, Y.; Zhang, J.; Kuang, T. Analytical investigation of tunnel deformation caused by circular foundation pit excavation. Comput. Geotech. 2019, 106, 193–198. [Google Scholar] [CrossRef]
- Xu, Q.; Xie, J.; Sun, Z.; Lu, L.; Yu, H. Stability Analysis of Trench Wall for Diaphragm Wall in Ultra-Deep Circular Foundation Pit: A Comprehensive Investigation. Appl. Sci. 2023, 13, 12037. [Google Scholar] [CrossRef]
- Keawsawasvong, S.; Ukritchon, B. Undrained basal stability of braced circular excavations in non-homogeneous clays with linear increase of strength with depth. Comput. Geotech. 2019, 115, 103180. [Google Scholar] [CrossRef]
- Wang, D.-H.; Fu, Z.-N.; Ye, C.-H.; Jing, J.-G.; Gao, J.-J.; Liu, N.-W.; Xu, H. Deformation Behavior of an Asymmetric Foundation Pit Under Varying Tides. Indian Geotech. J. 2025, in press. [Google Scholar] [CrossRef]
- Wu, C.; Wang, X.; Ren, Y.; Zhou, Y. Symmetry-Inspired Friction Compensation and GPI Observer-Based Nonlinear Predictive Control for Enhanced Speed Regulation in IPMSM Servo Systems. Symmetry 2025, 17, 1012. [Google Scholar] [CrossRef]
- Juozapaitis, A.; Daniūnas, A. Innovative Suspension Structures: The Role of Straight Elements Under Asymmetric Loads. Appl. Sci. 2025, 15, 7009. [Google Scholar] [CrossRef]
- Li, Y.; Dan, D.; Pan, R. Identification of global main cable line shape parameters of suspension bridges based on local 3D point cloud. Low-Carbon Mater. Green Constr. 2025, 3, 1. [Google Scholar] [CrossRef]
- Gaute-Alonso, A.; Garcia-Sanchez, D.; Ramos-Gutierrez, Ó.R.; Ntertimanis, V. Enhancing stress measurements accuracy control in the construction of long-span bridges. Sci. Rep. 2024, 14, 10961. [Google Scholar] [CrossRef]
- Ding, Y.; Zhao, L.; Xian, R.; Liu, G.; Xiao, H.; Ge, Y. Aerodynamic stability evolution tendency of suspension bridges with spans from 1000 to 5000 m. Front. Struct. Civ. Eng. 2023, 17, 1465–1476. [Google Scholar] [CrossRef]
- Jung, M.-R.; Zhang, F.; Kim, M.-Y. Extended Deflection Theories of Self-anchored Suspension Bridges with Extensible Hangers and Floating Girders. KSCE J. Civ. Eng. 2024, 28, 3928–3940. [Google Scholar] [CrossRef]
- Cheng, J.; Yuan, Y.; Yu, Z.; Sun, K. Estimation of the Anti-sliding Safety Factor Between the Main Cable and Middle Saddle of Three-Pylon Steel Suspension Bridges. Int. J. Steel Struct. 2024, 24, 709–718. [Google Scholar] [CrossRef]
- Barni, N.; Bartoli, G.; Mannini, C. Lyapunov stability of suspension bridges in turbulent flow. Nonlinear Dyn. 2024, 112, 16711–16732. [Google Scholar] [CrossRef]
- Xie, K.; Ning, J.; Wang, Q.; Yao, H. Deformation prediction during the construction of segmental bridges based on GA-SMO-SVM algorithm: An example of CFST arch bridge. J. Civ. Struct. Health Monit. 2025, 15, 31–57. [Google Scholar] [CrossRef]
- Garrione, M.; Zanolin, F. Rich Dynamics for a Model Arising in the Study of Suspension Bridges. J. Nonlinear Sci. 2025, 35, 11. [Google Scholar] [CrossRef]
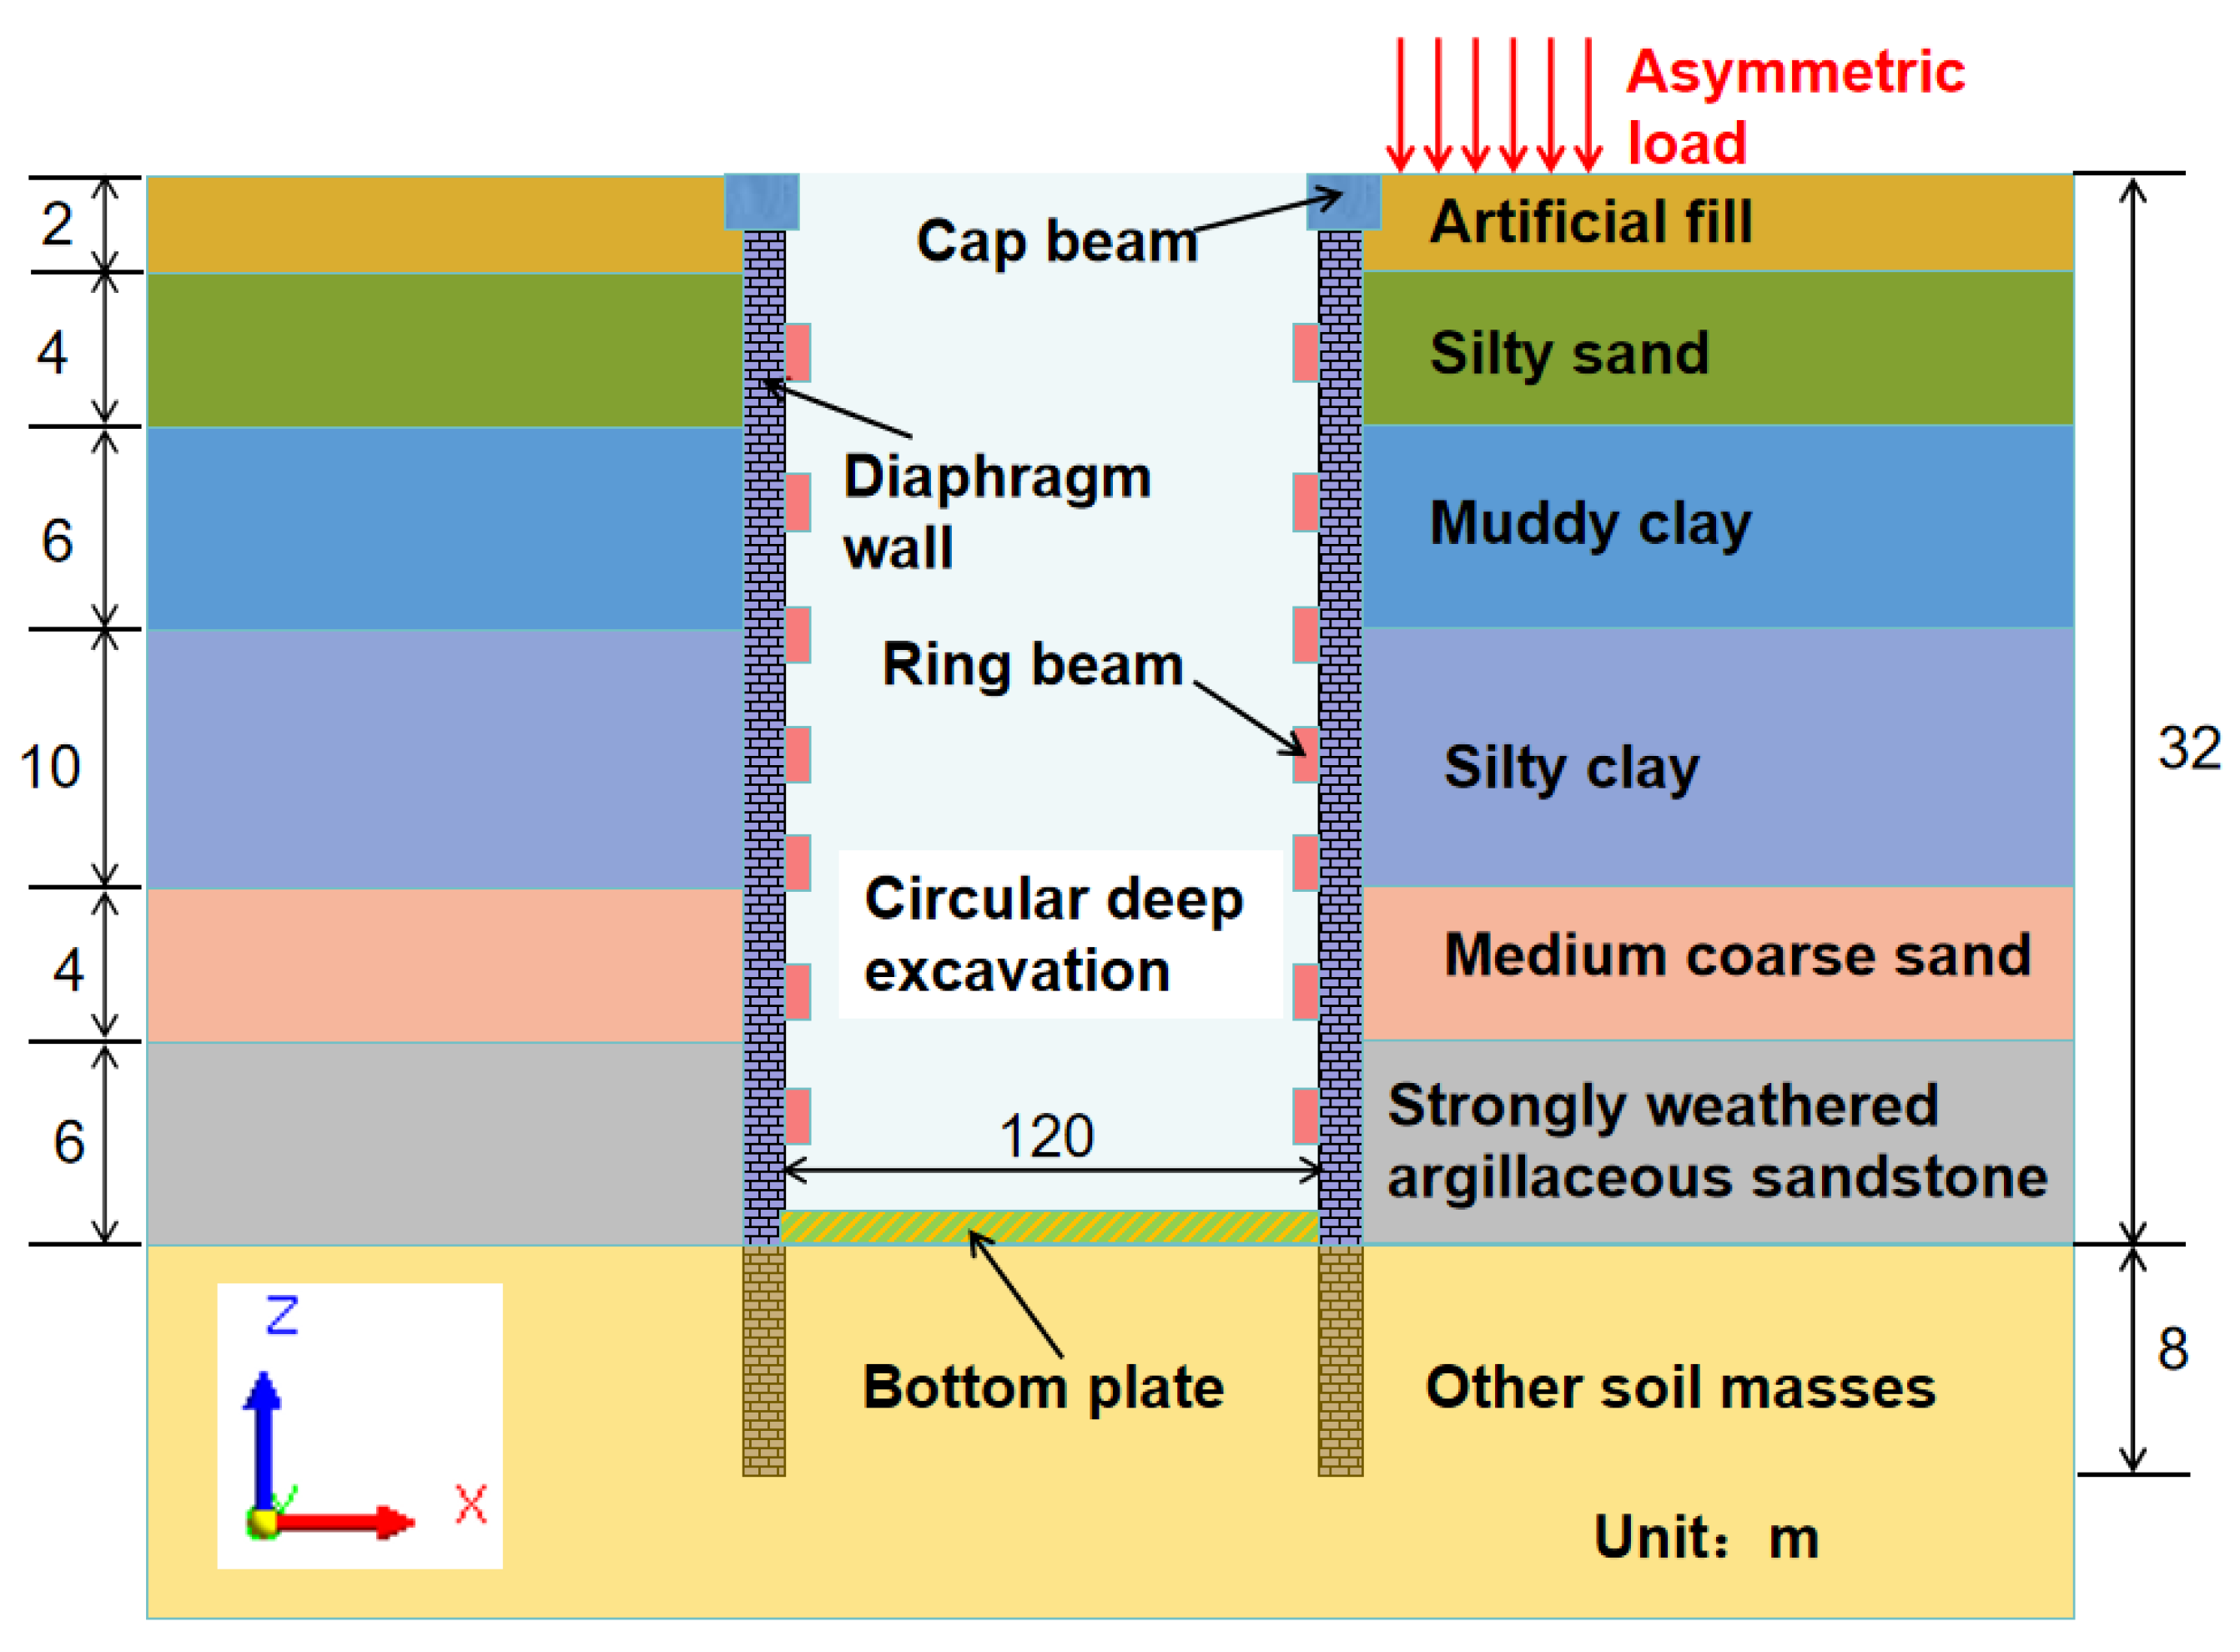

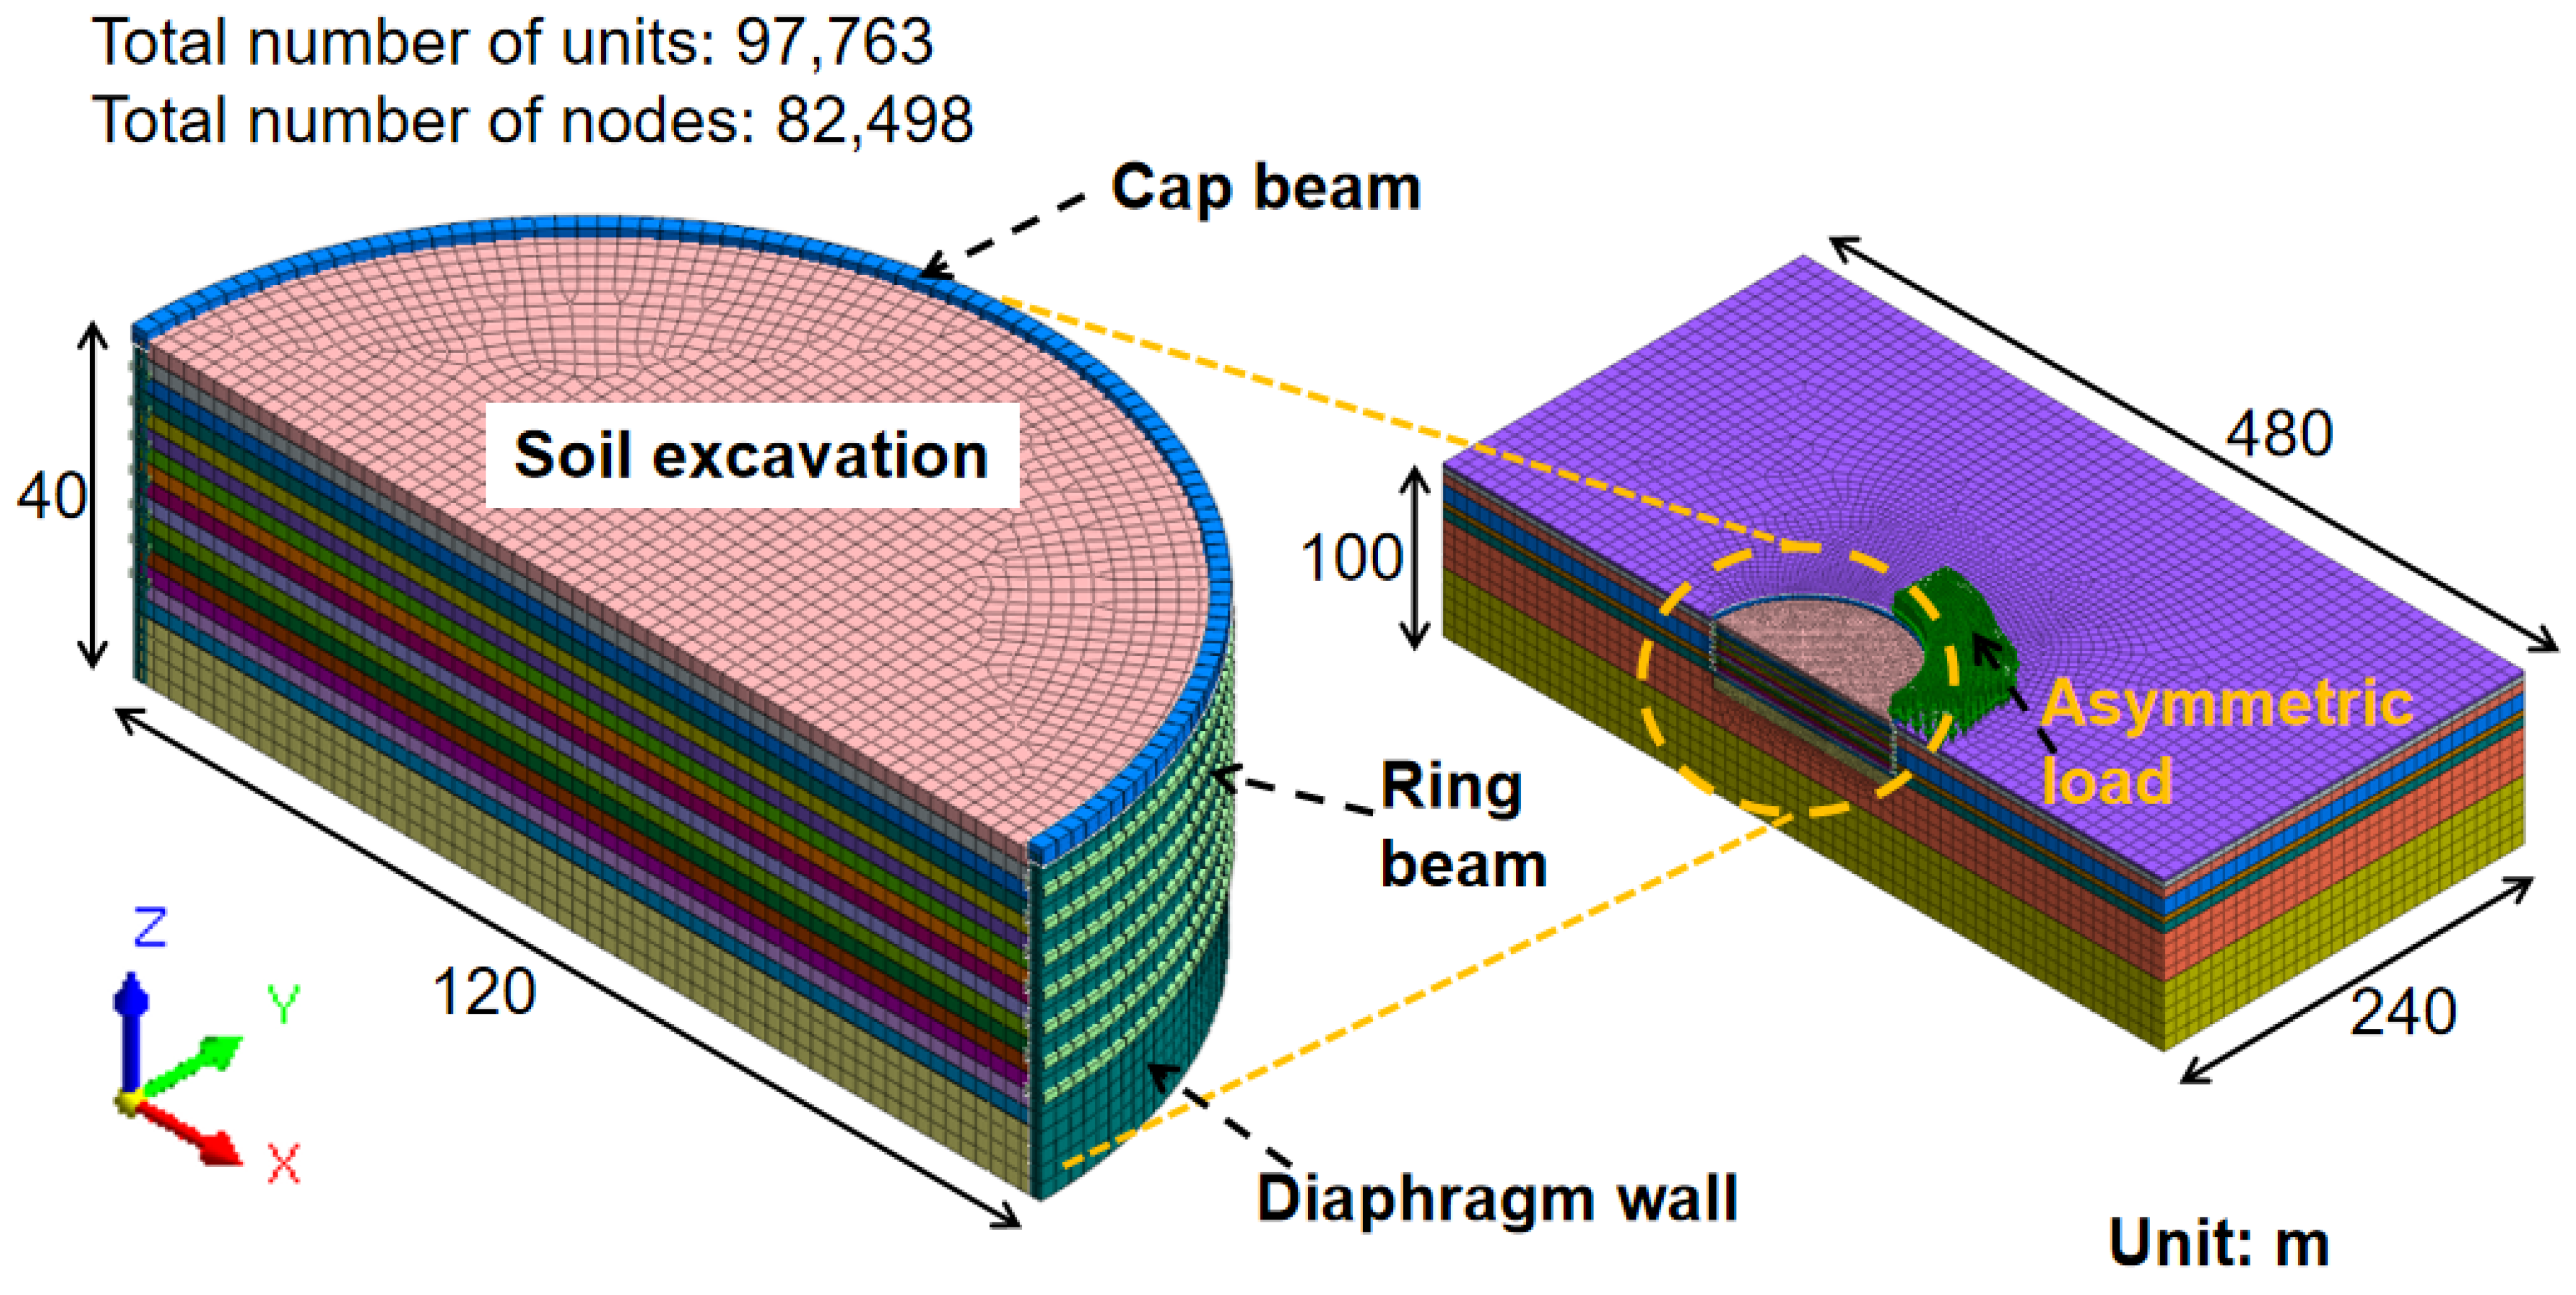
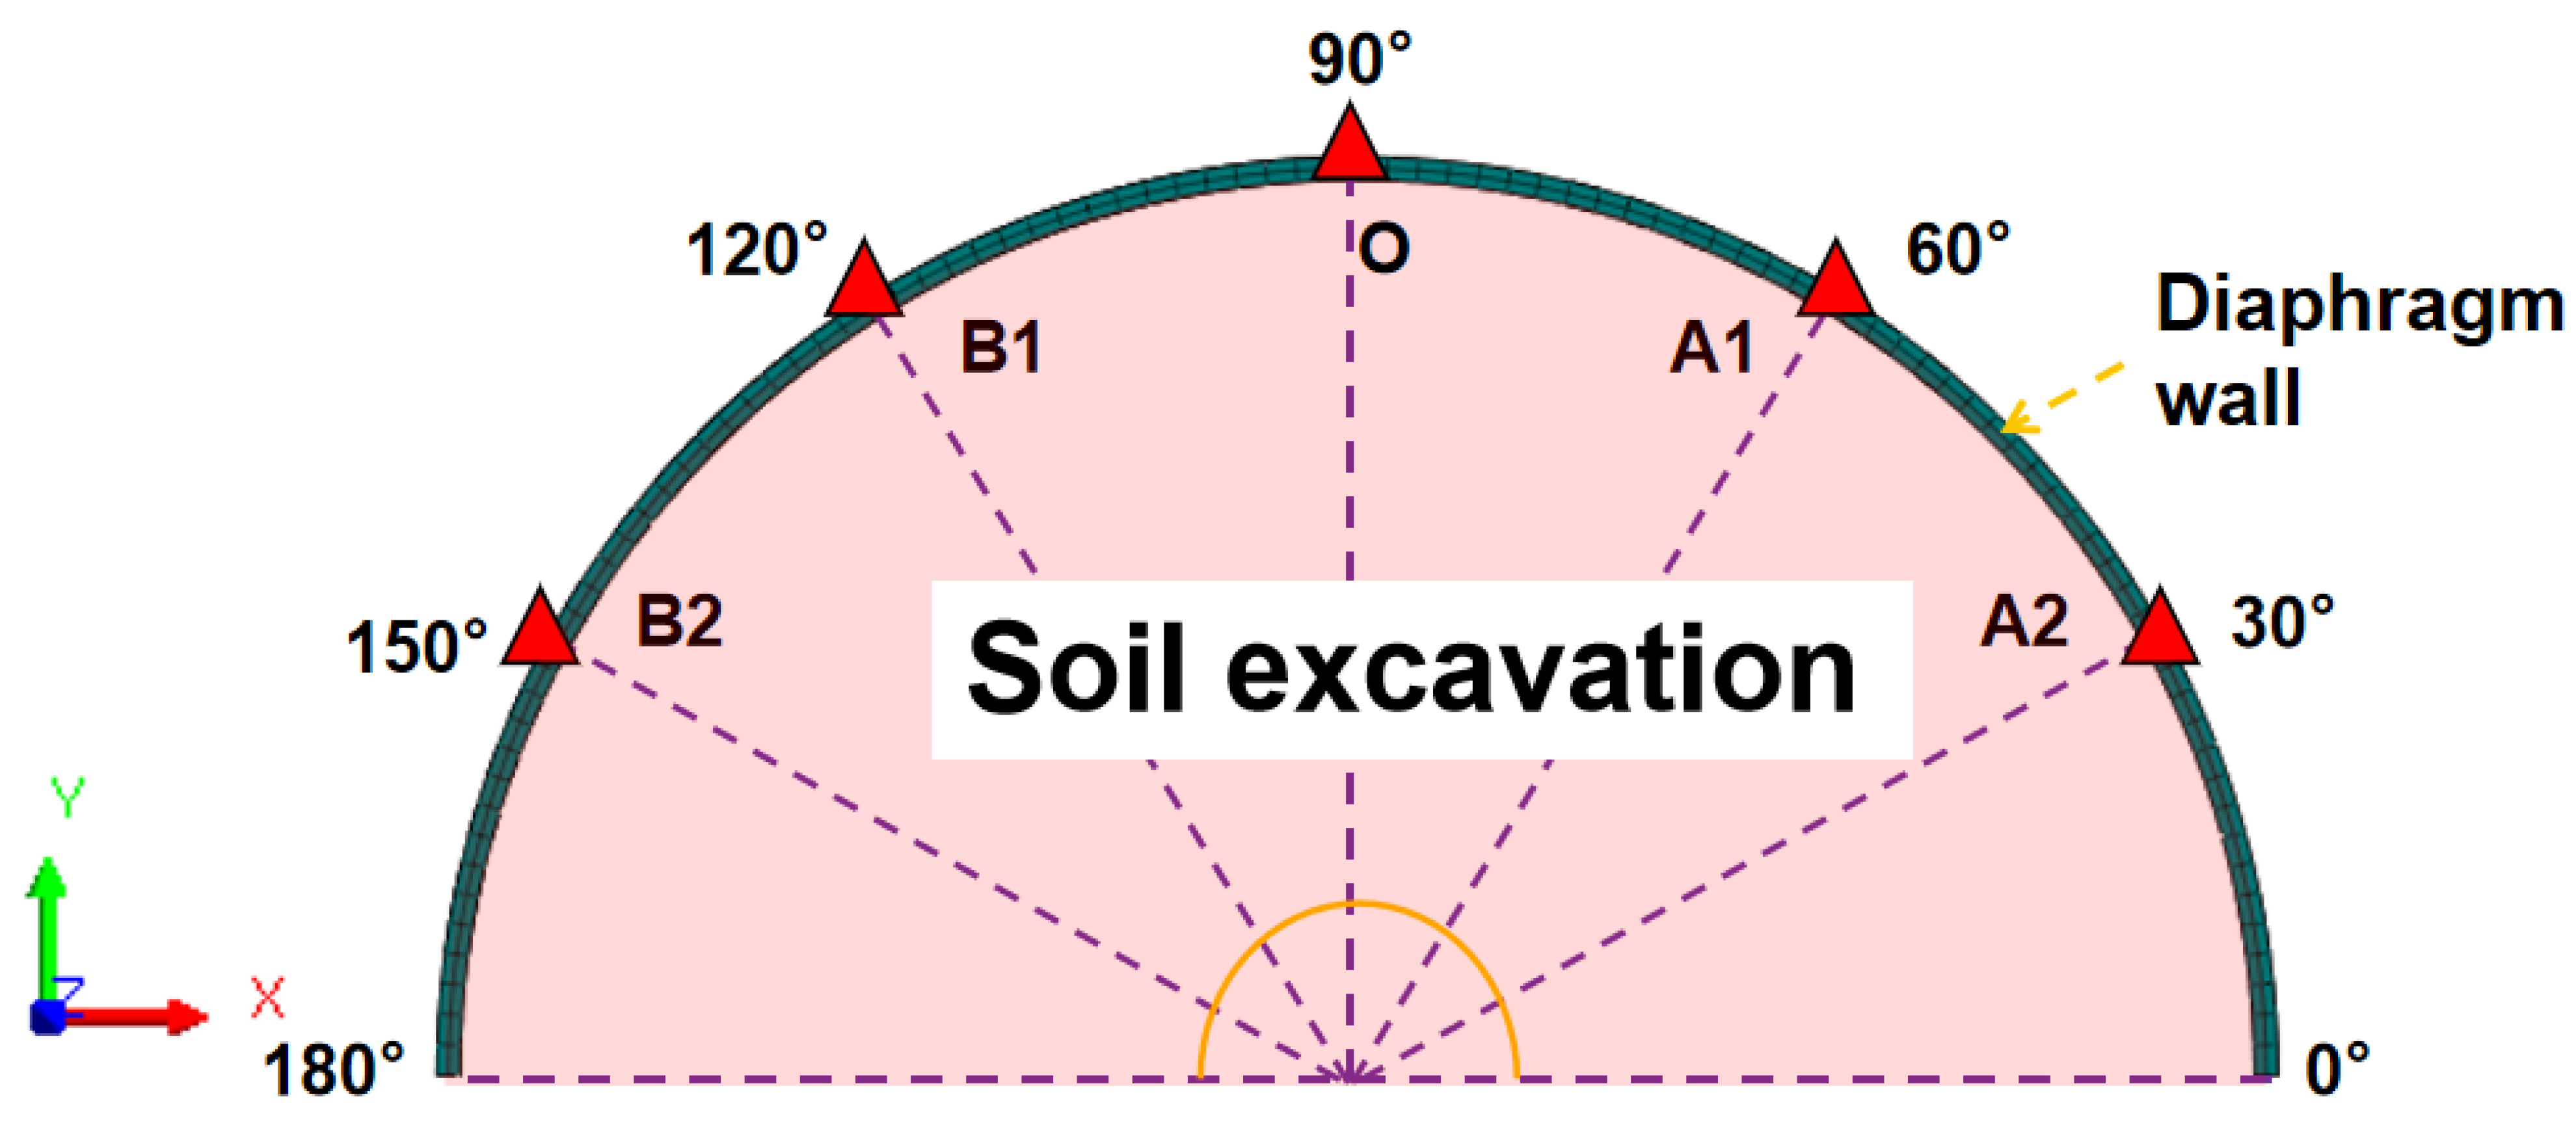
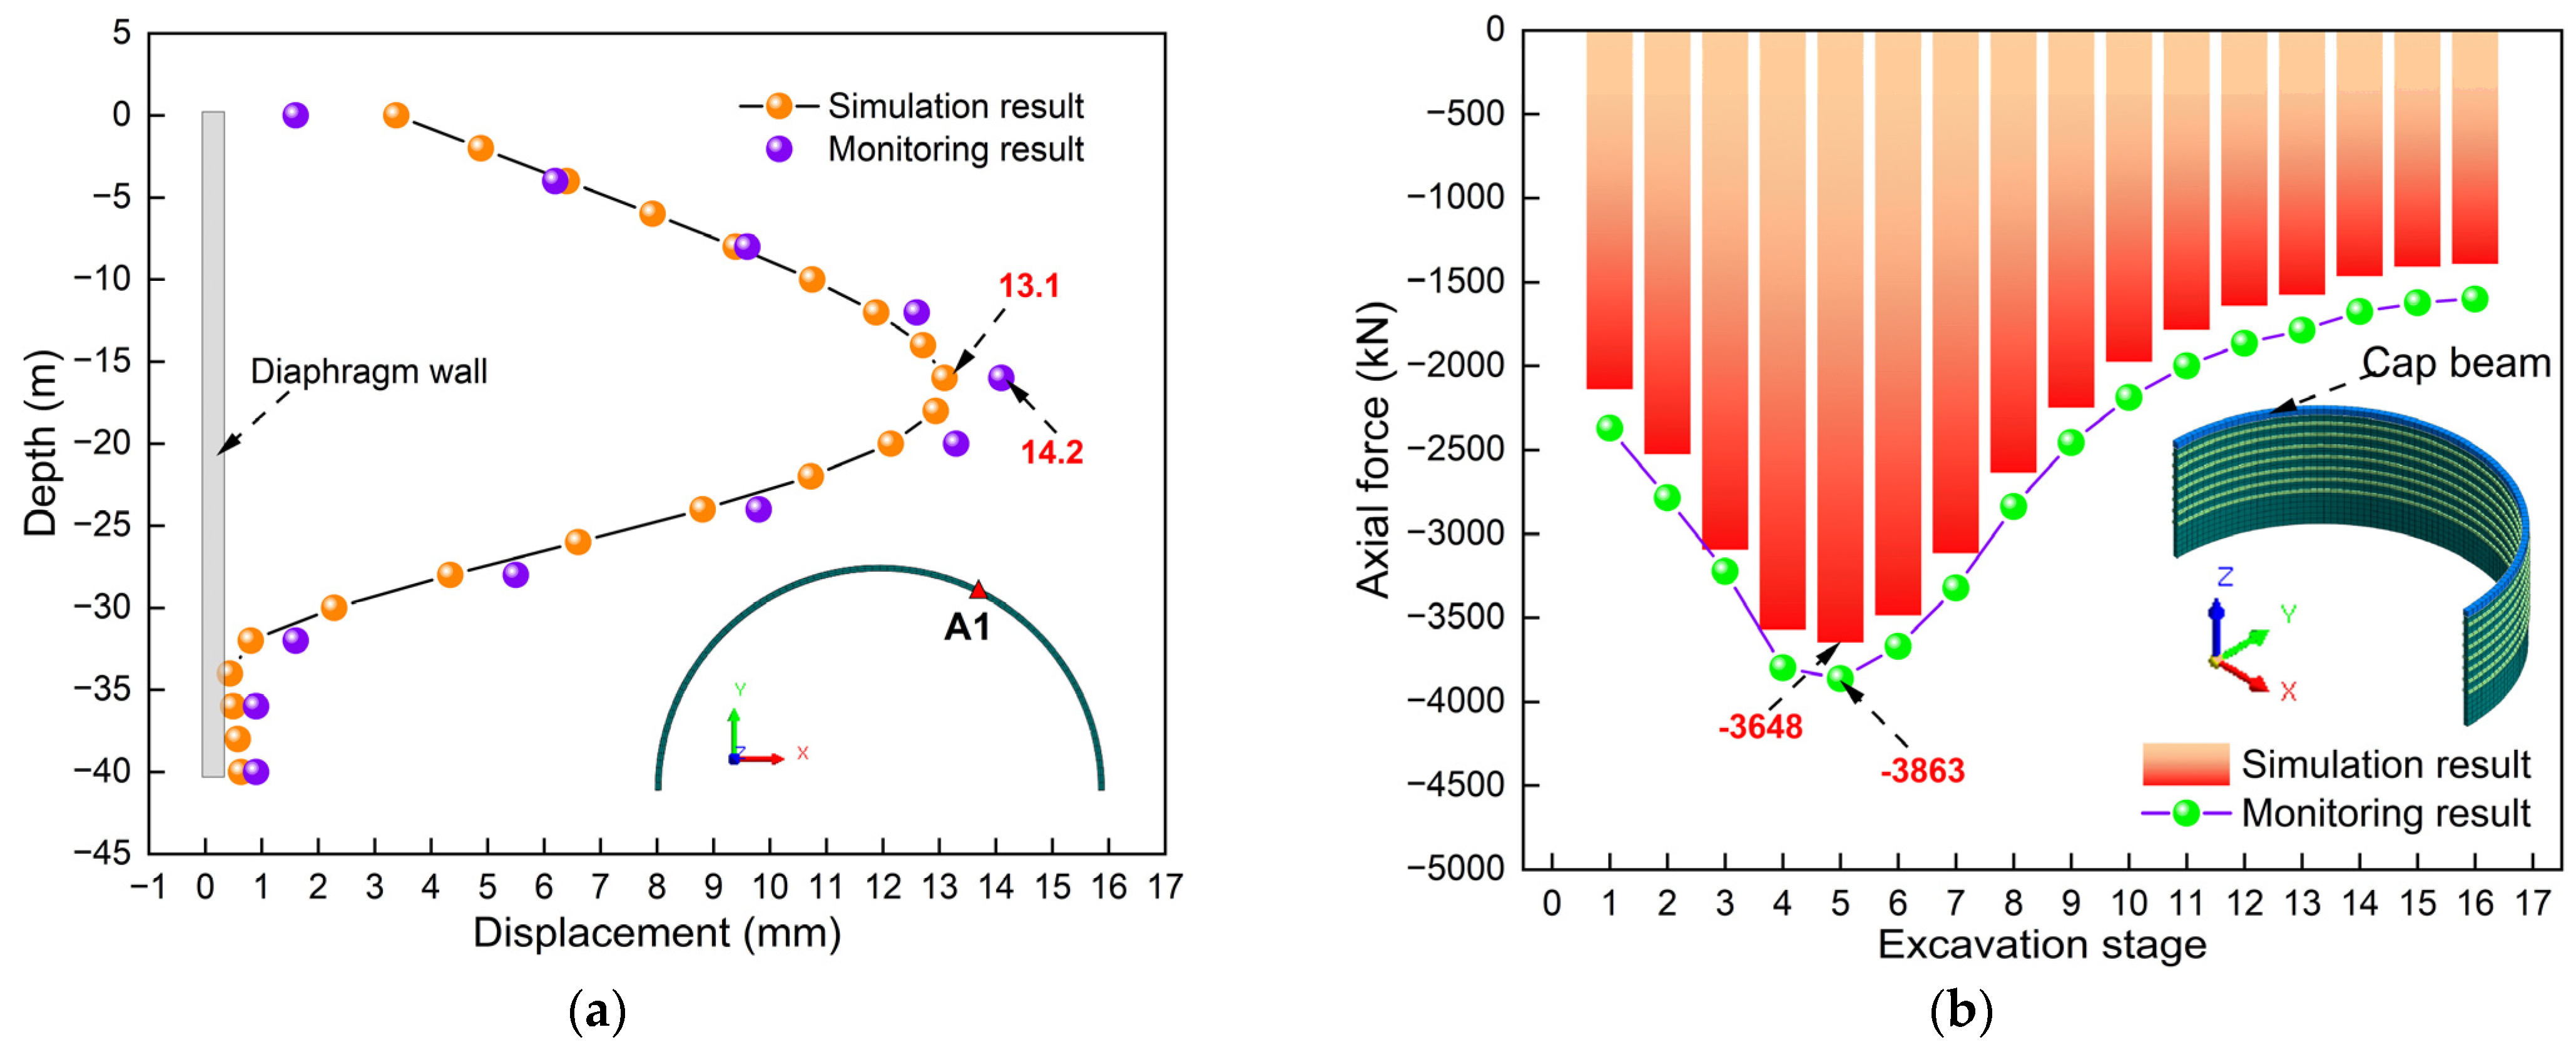


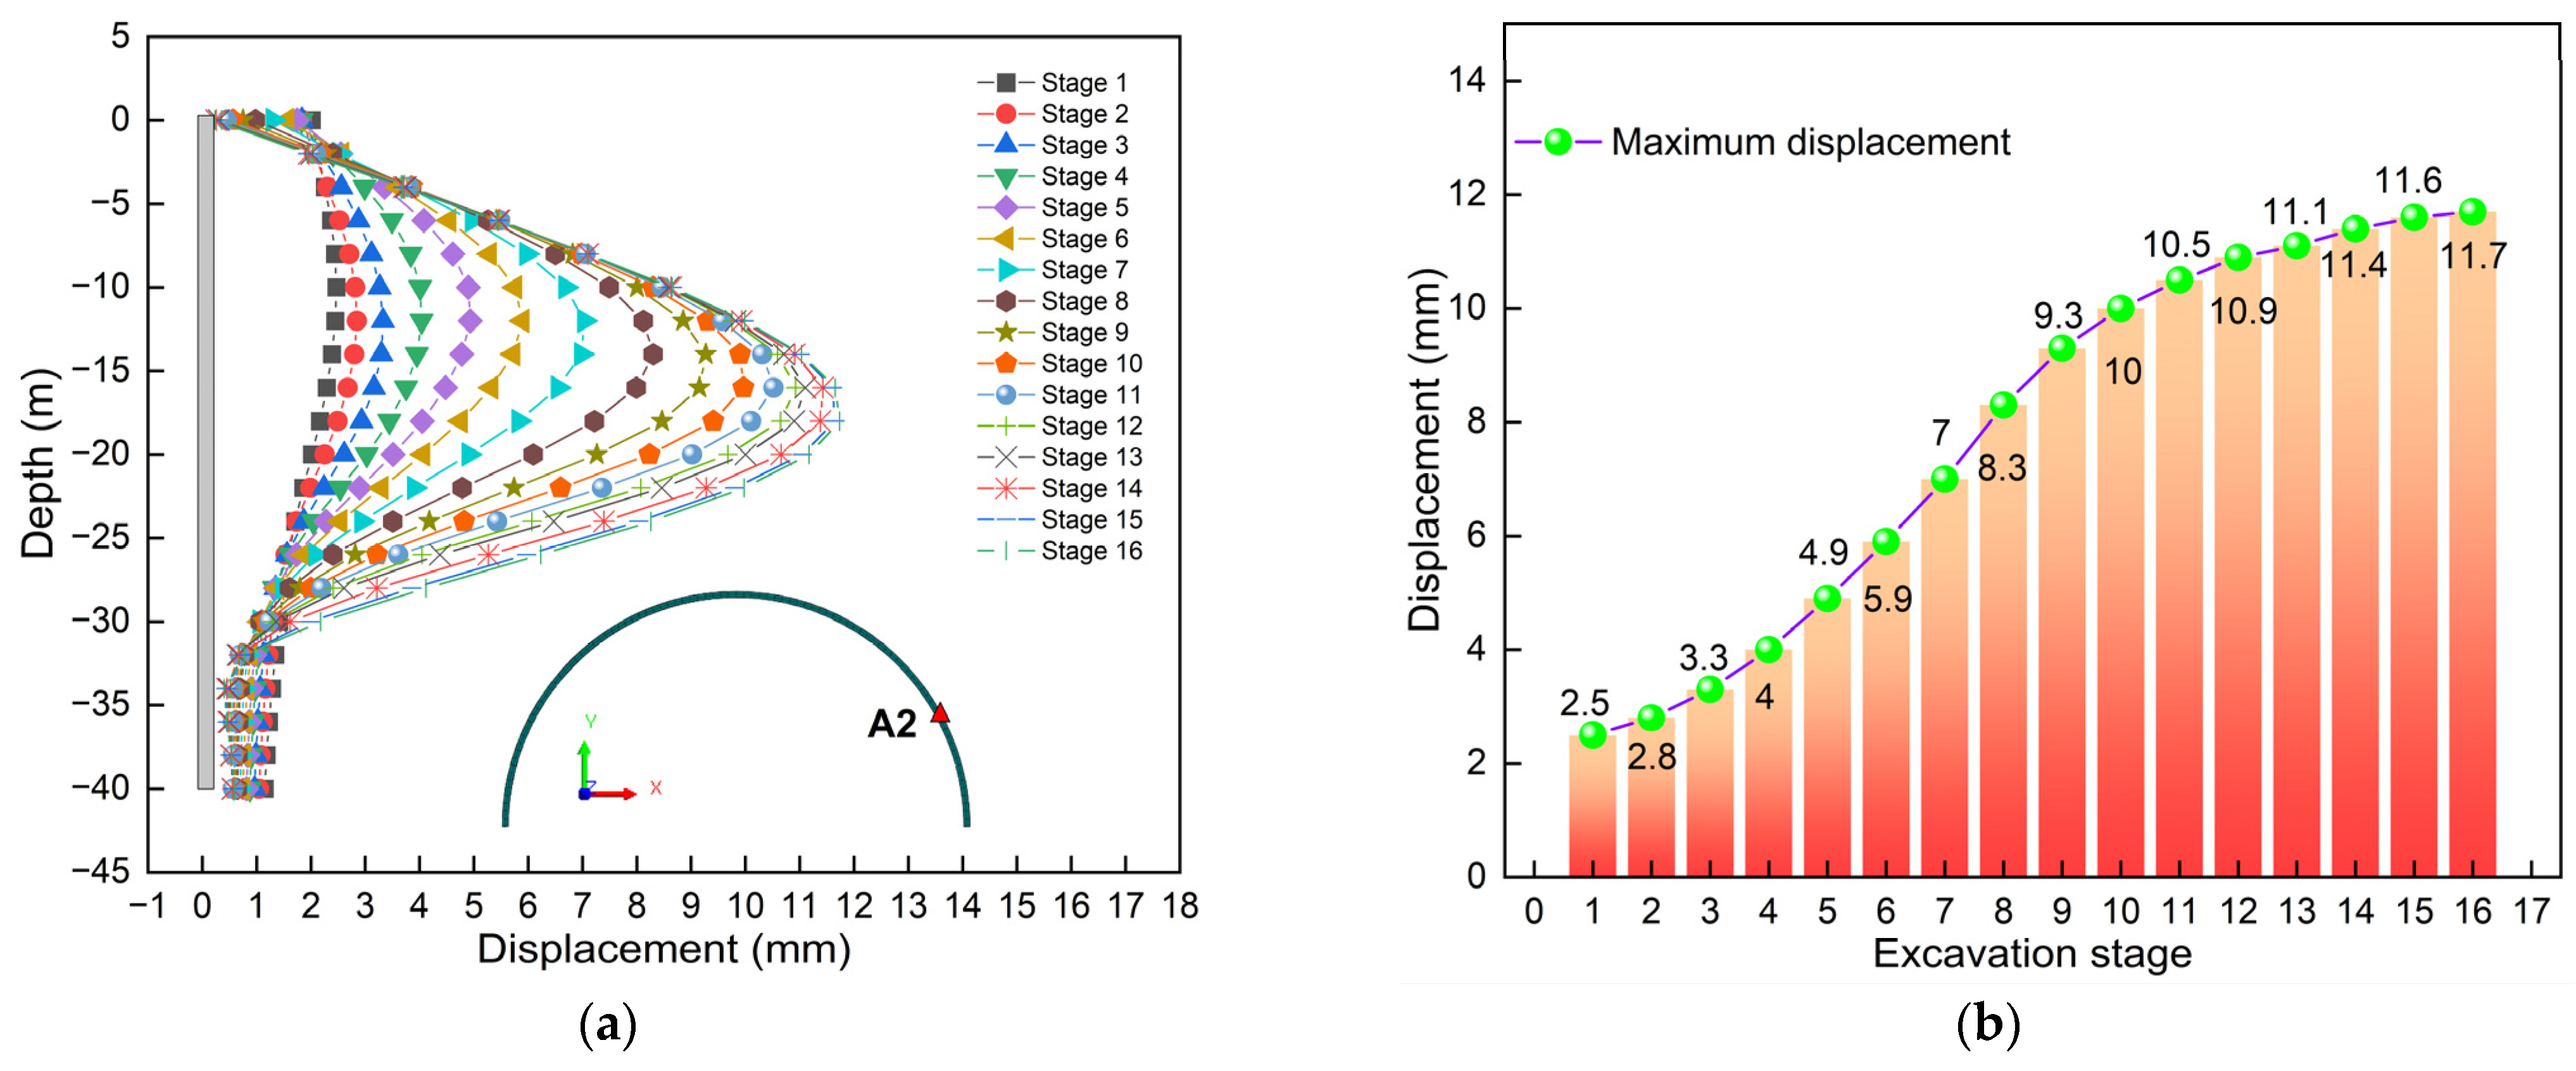
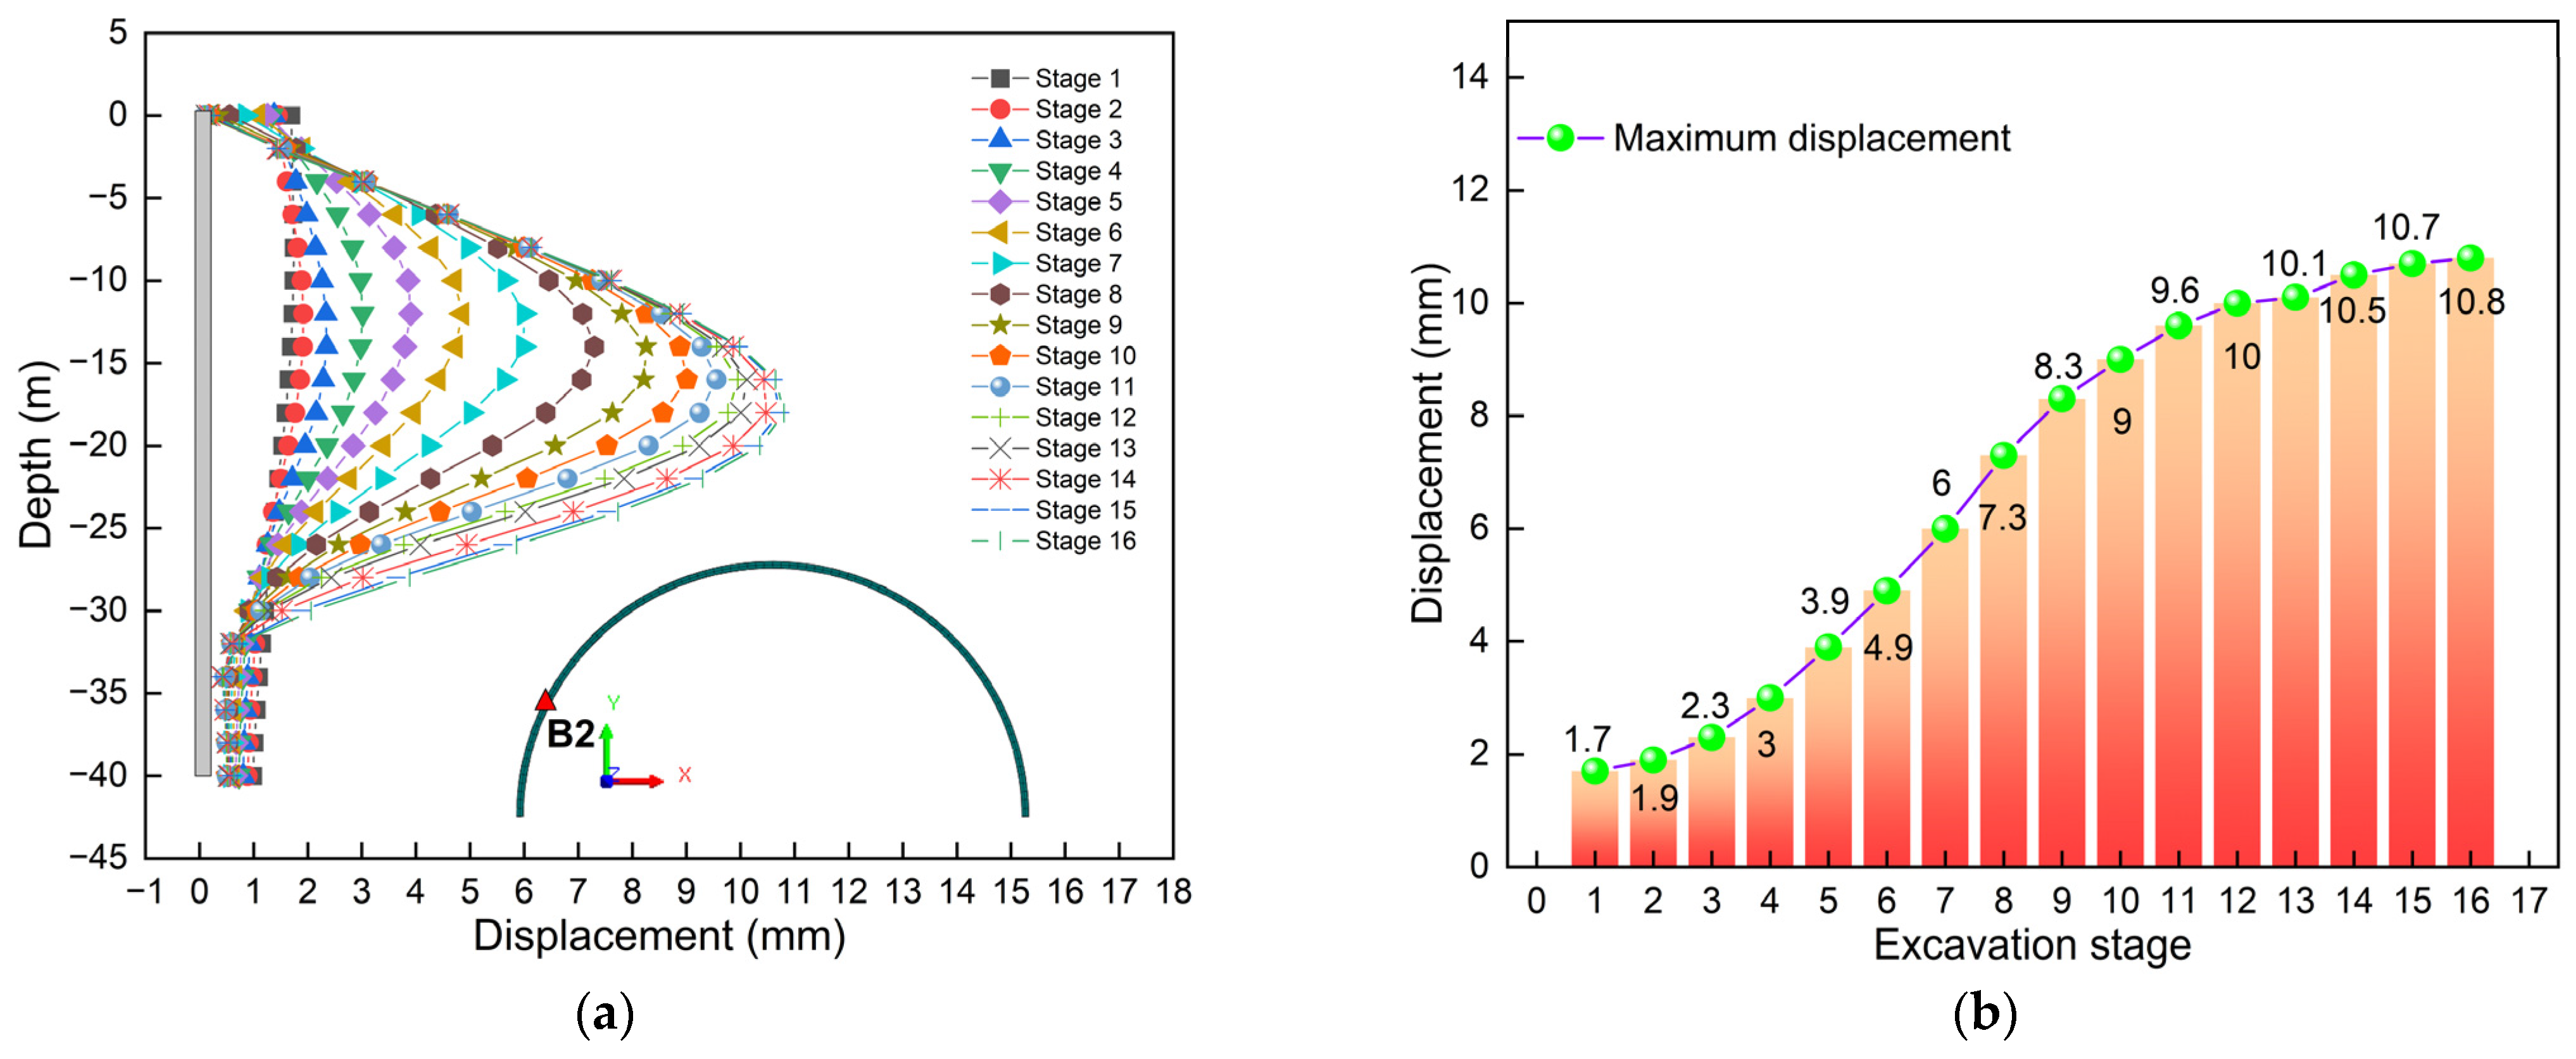

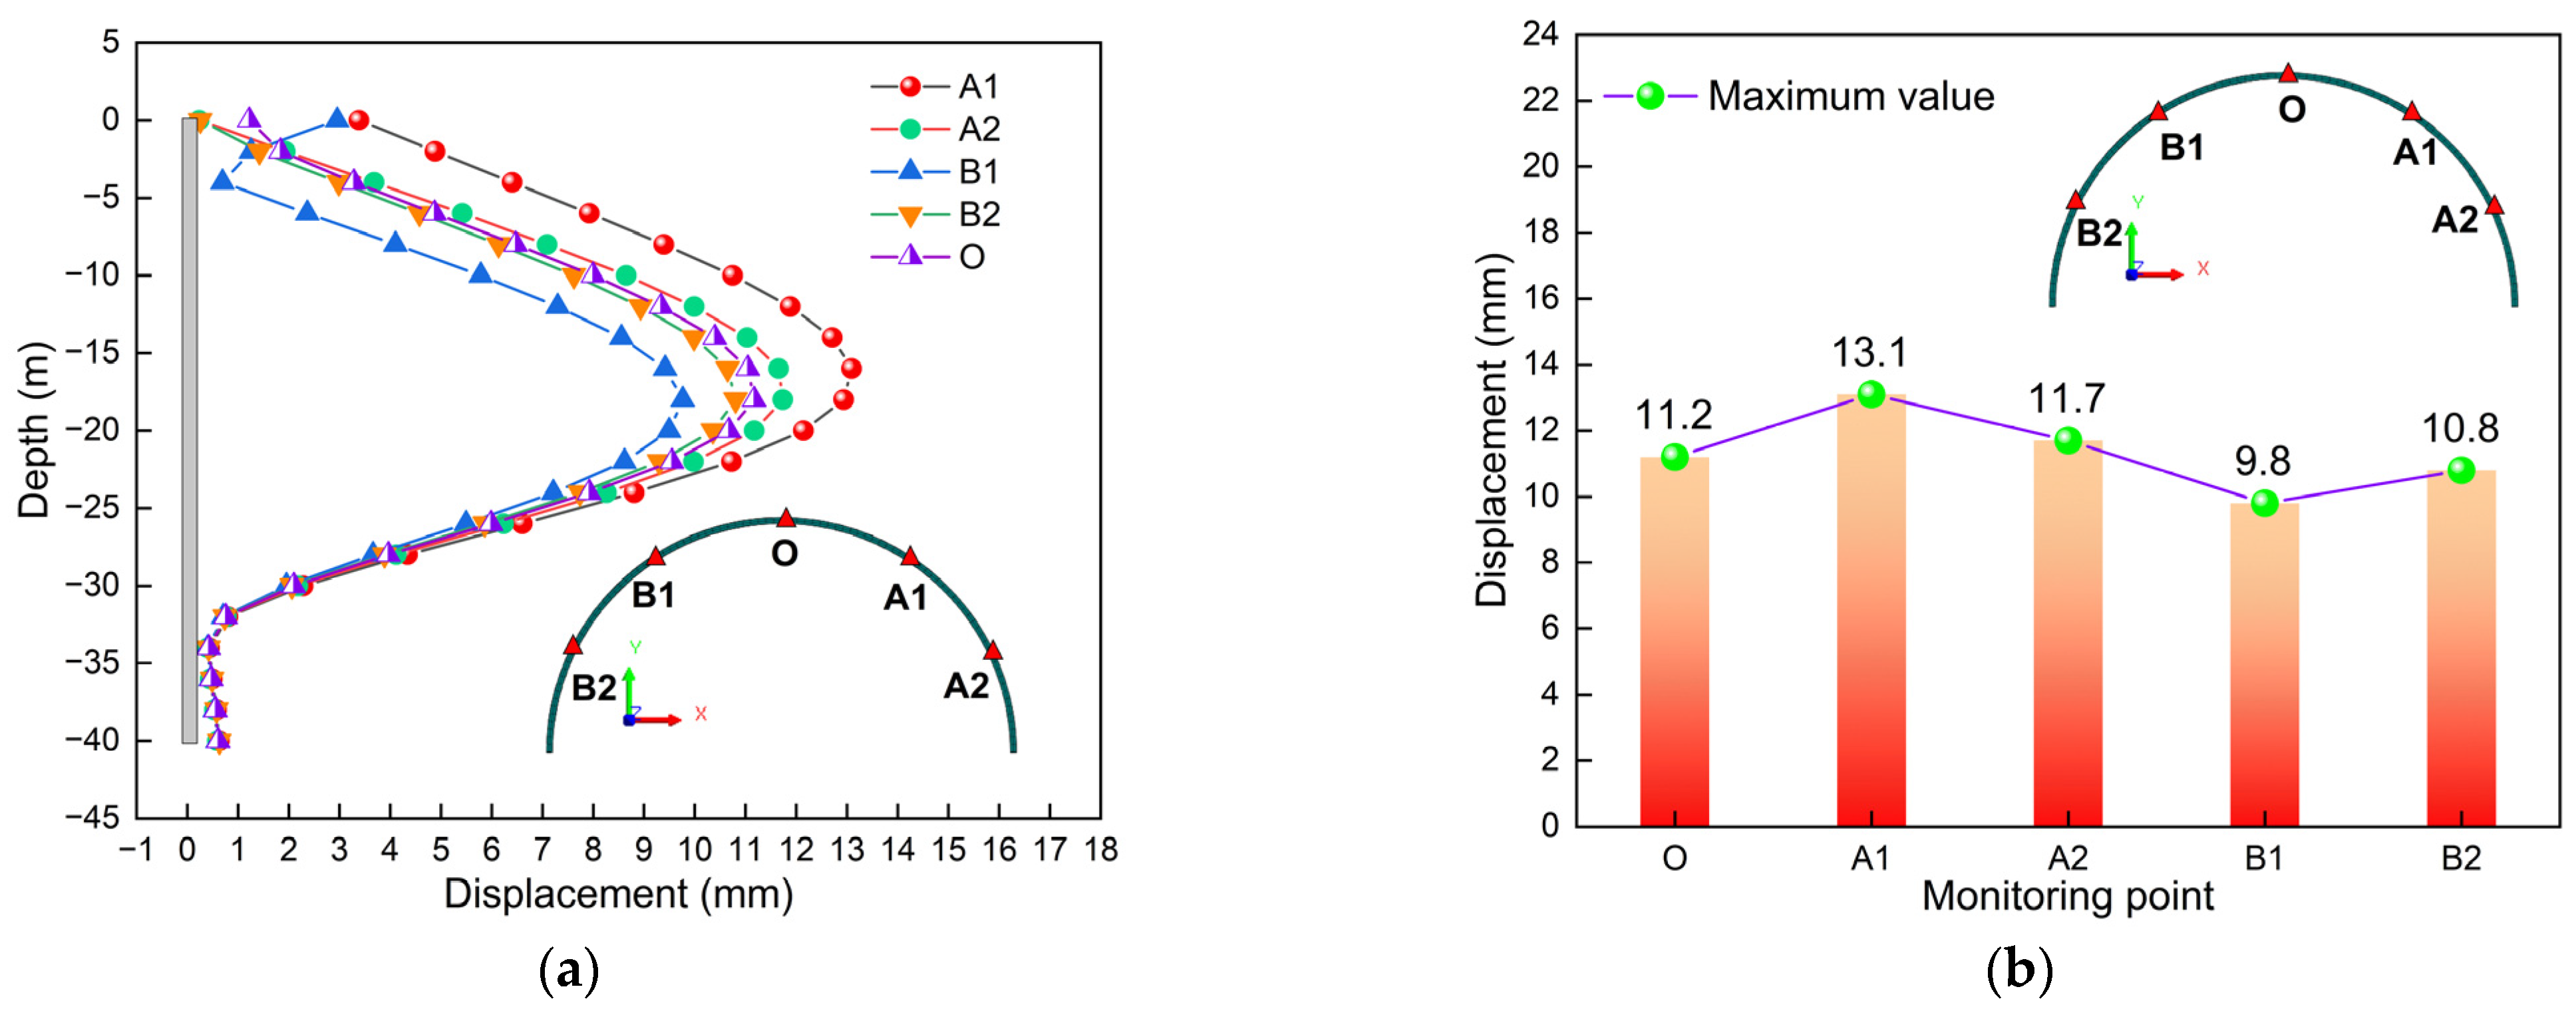
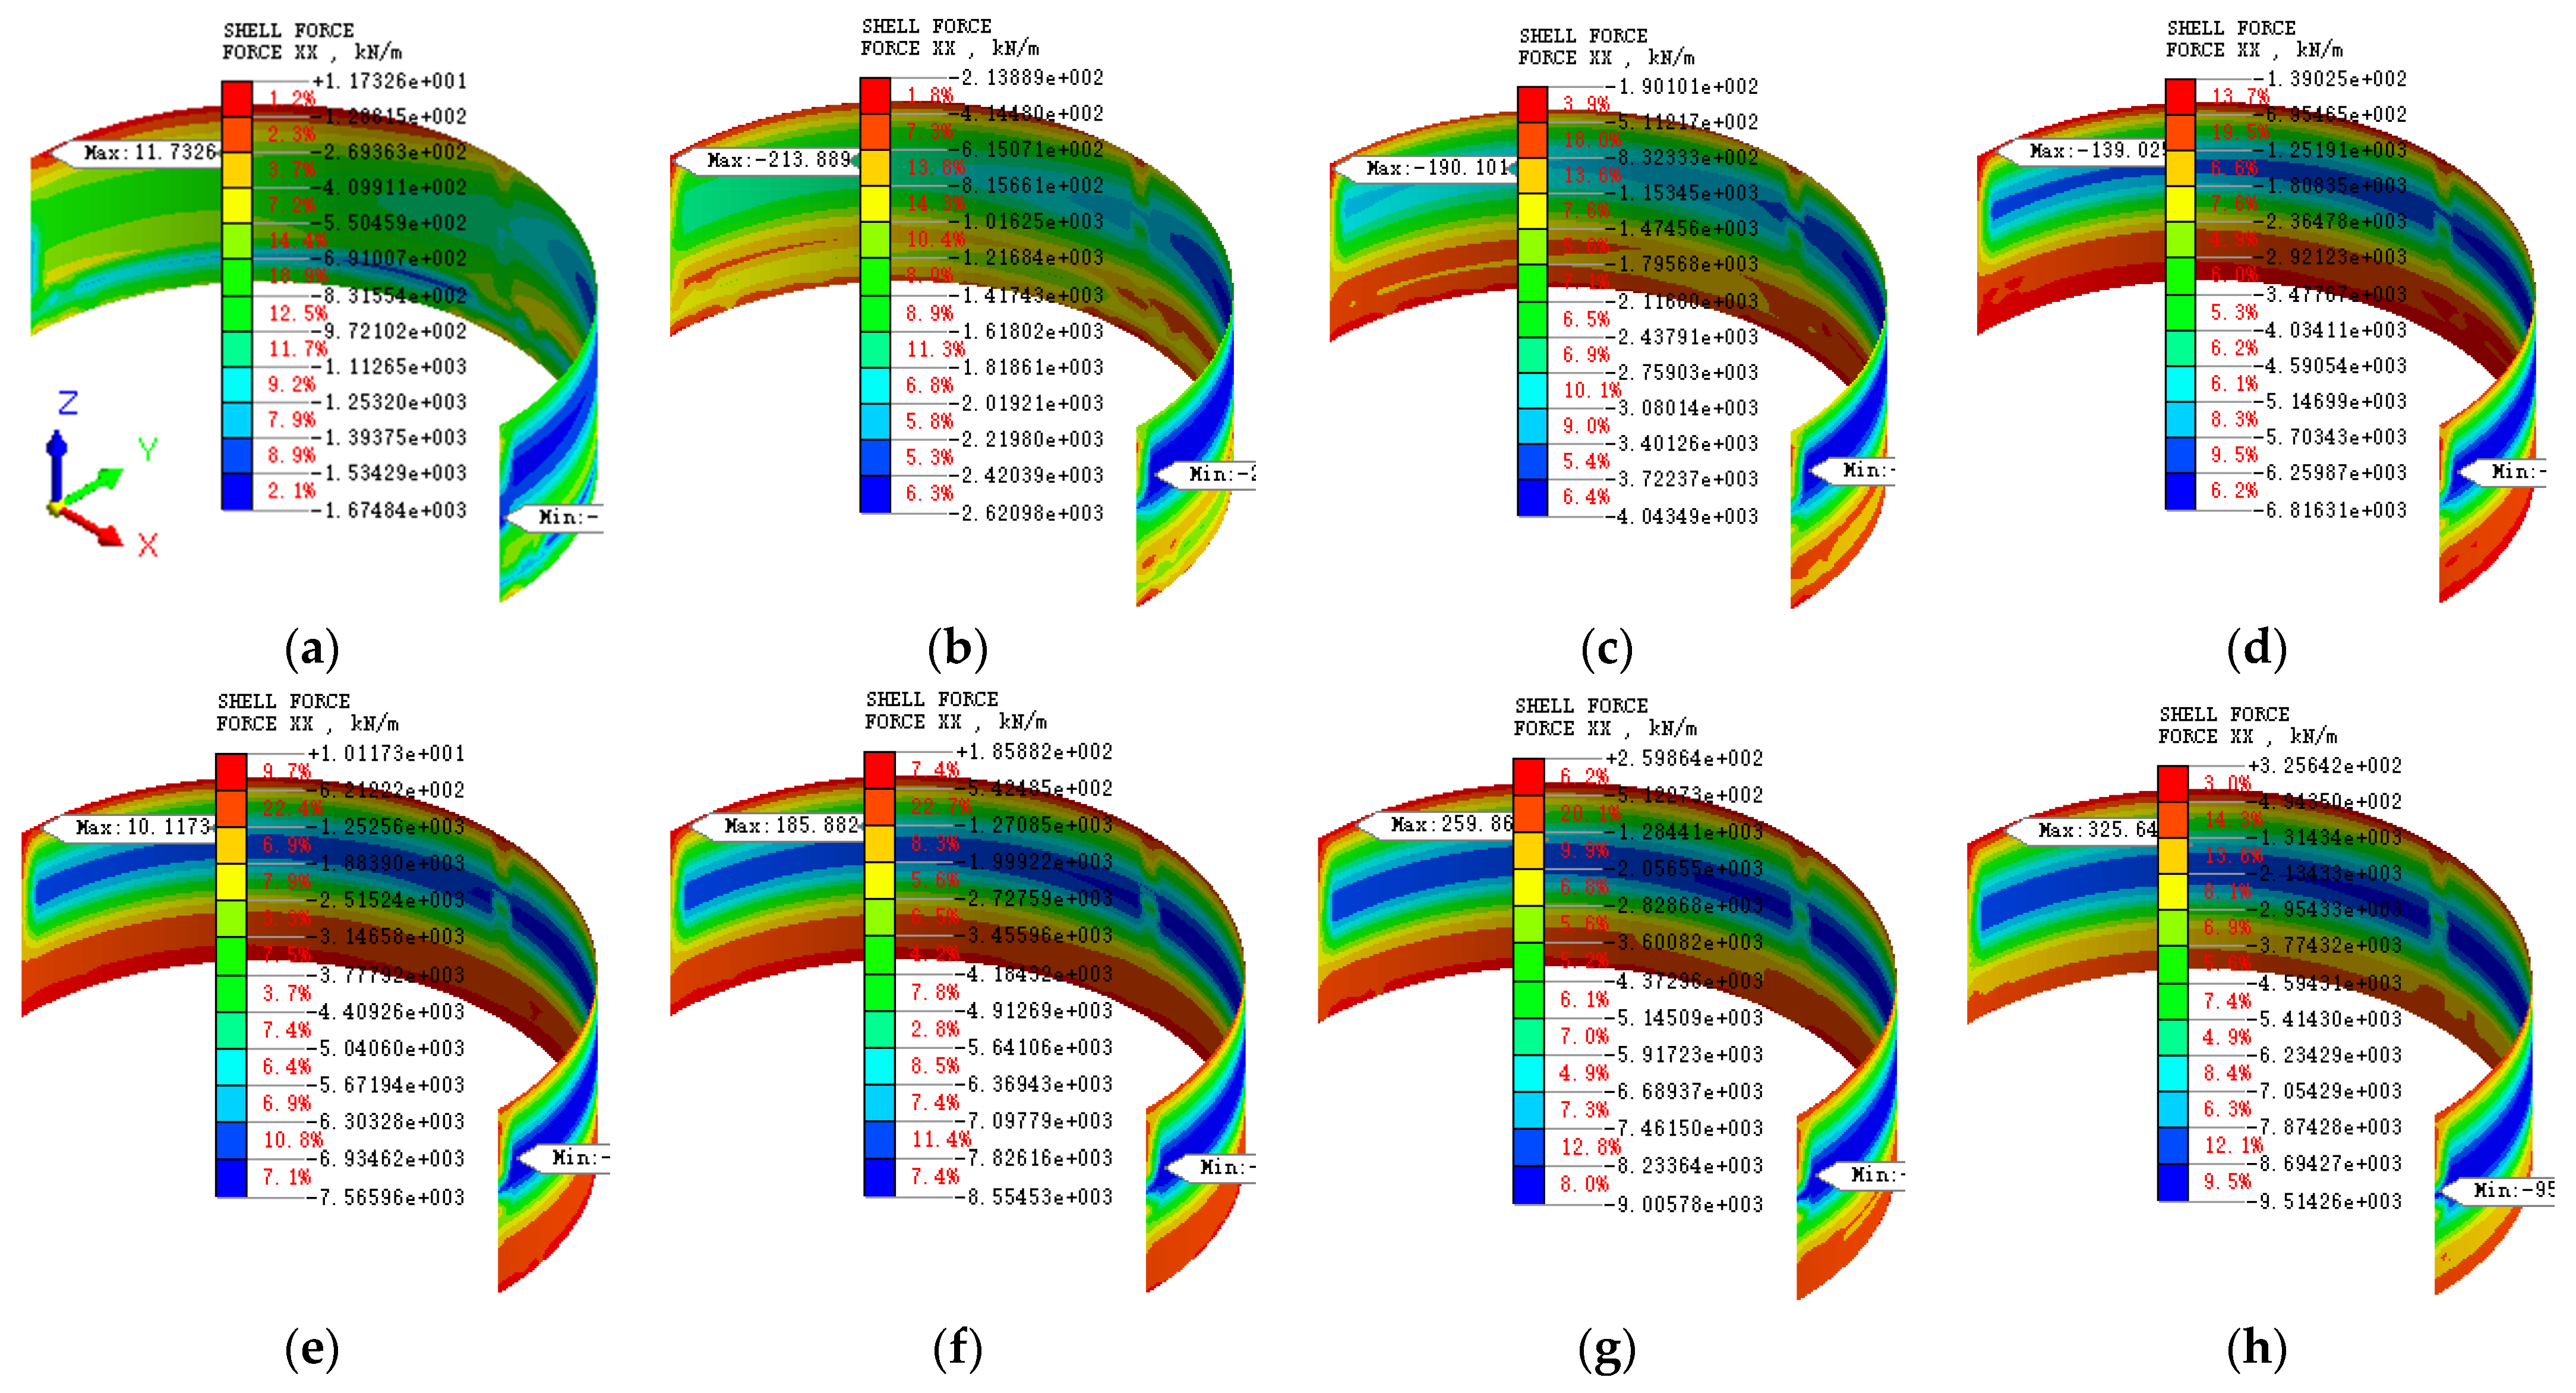
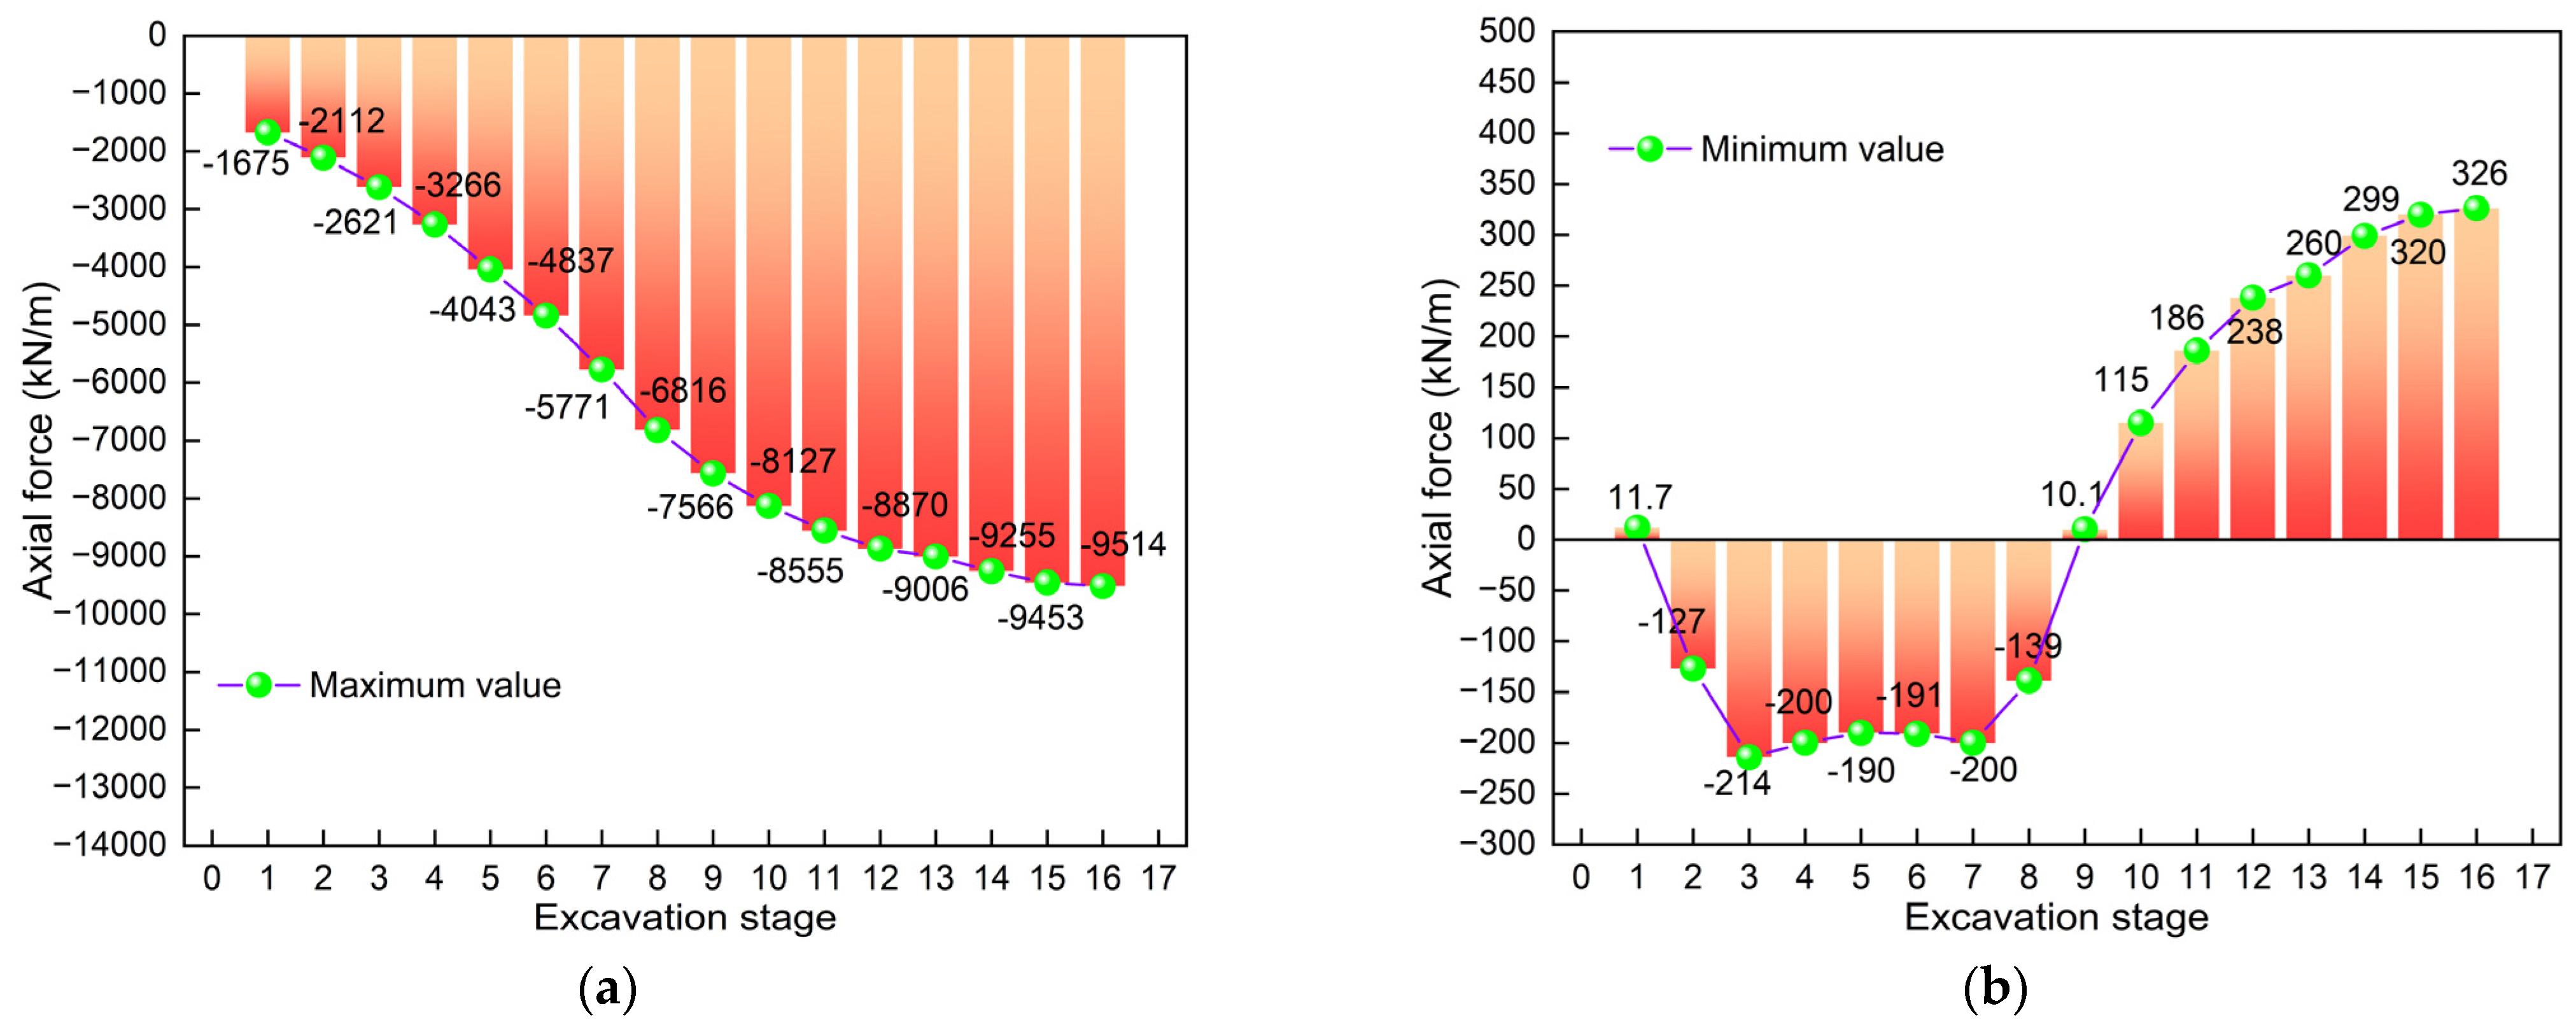
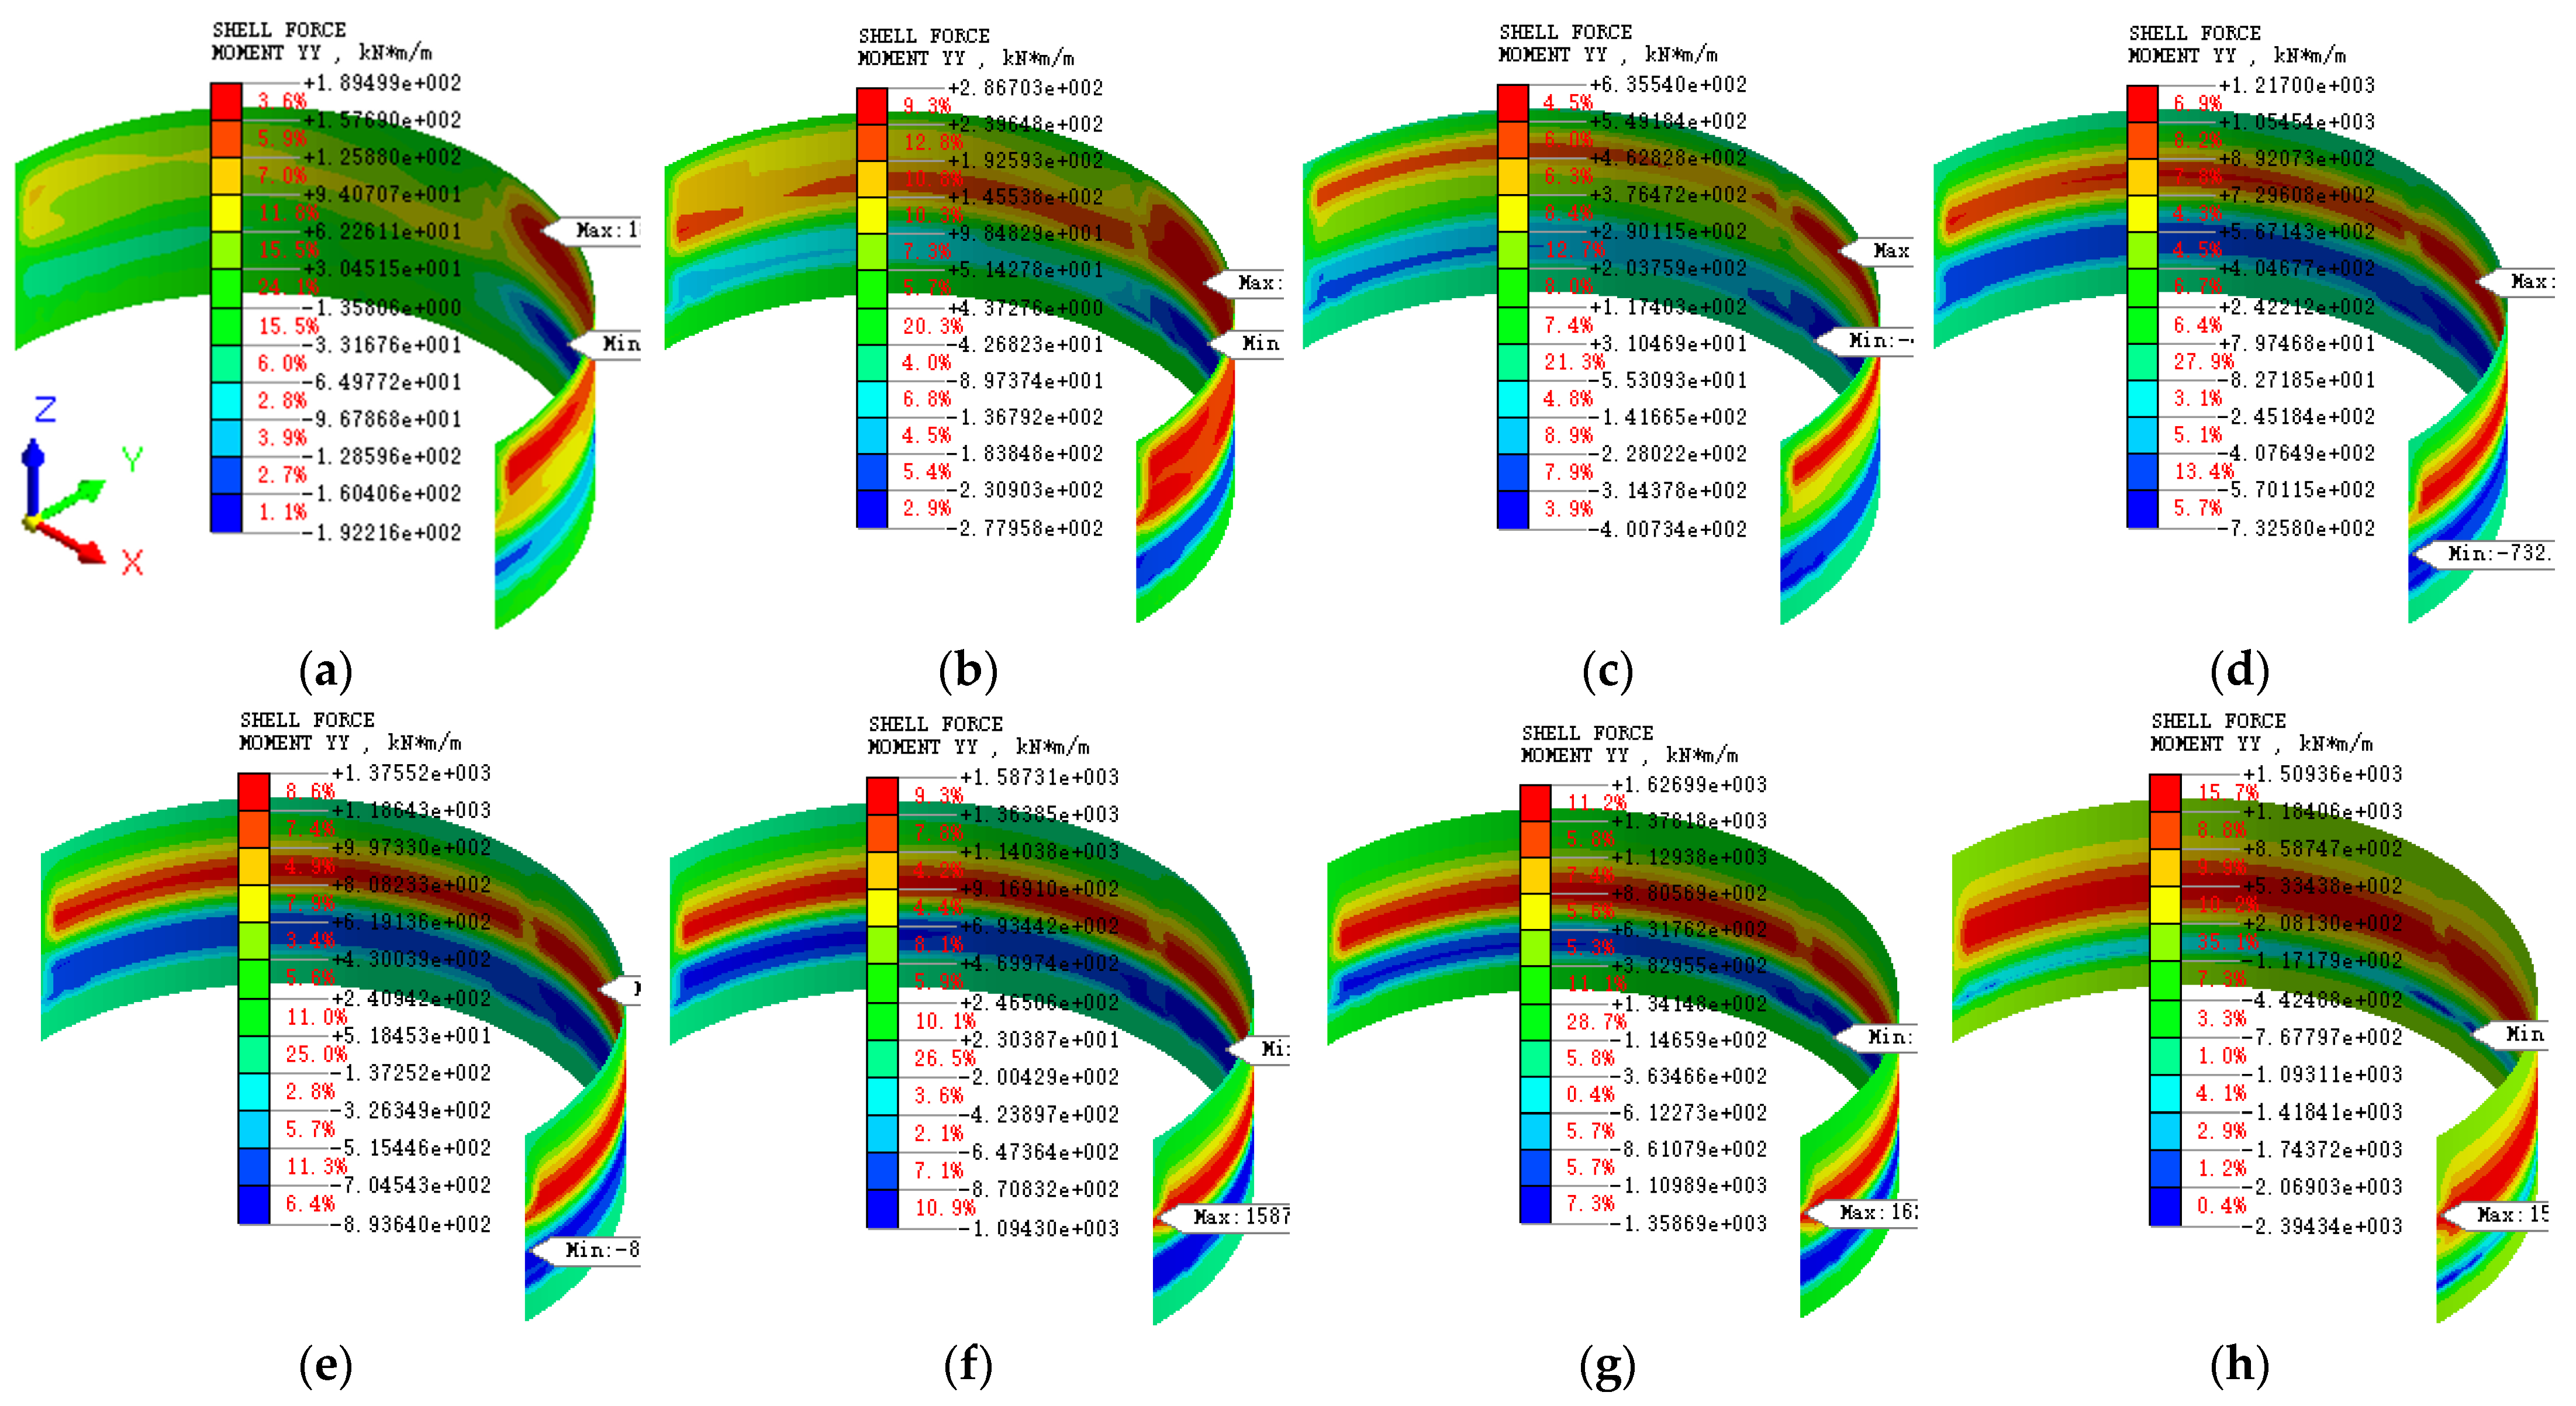

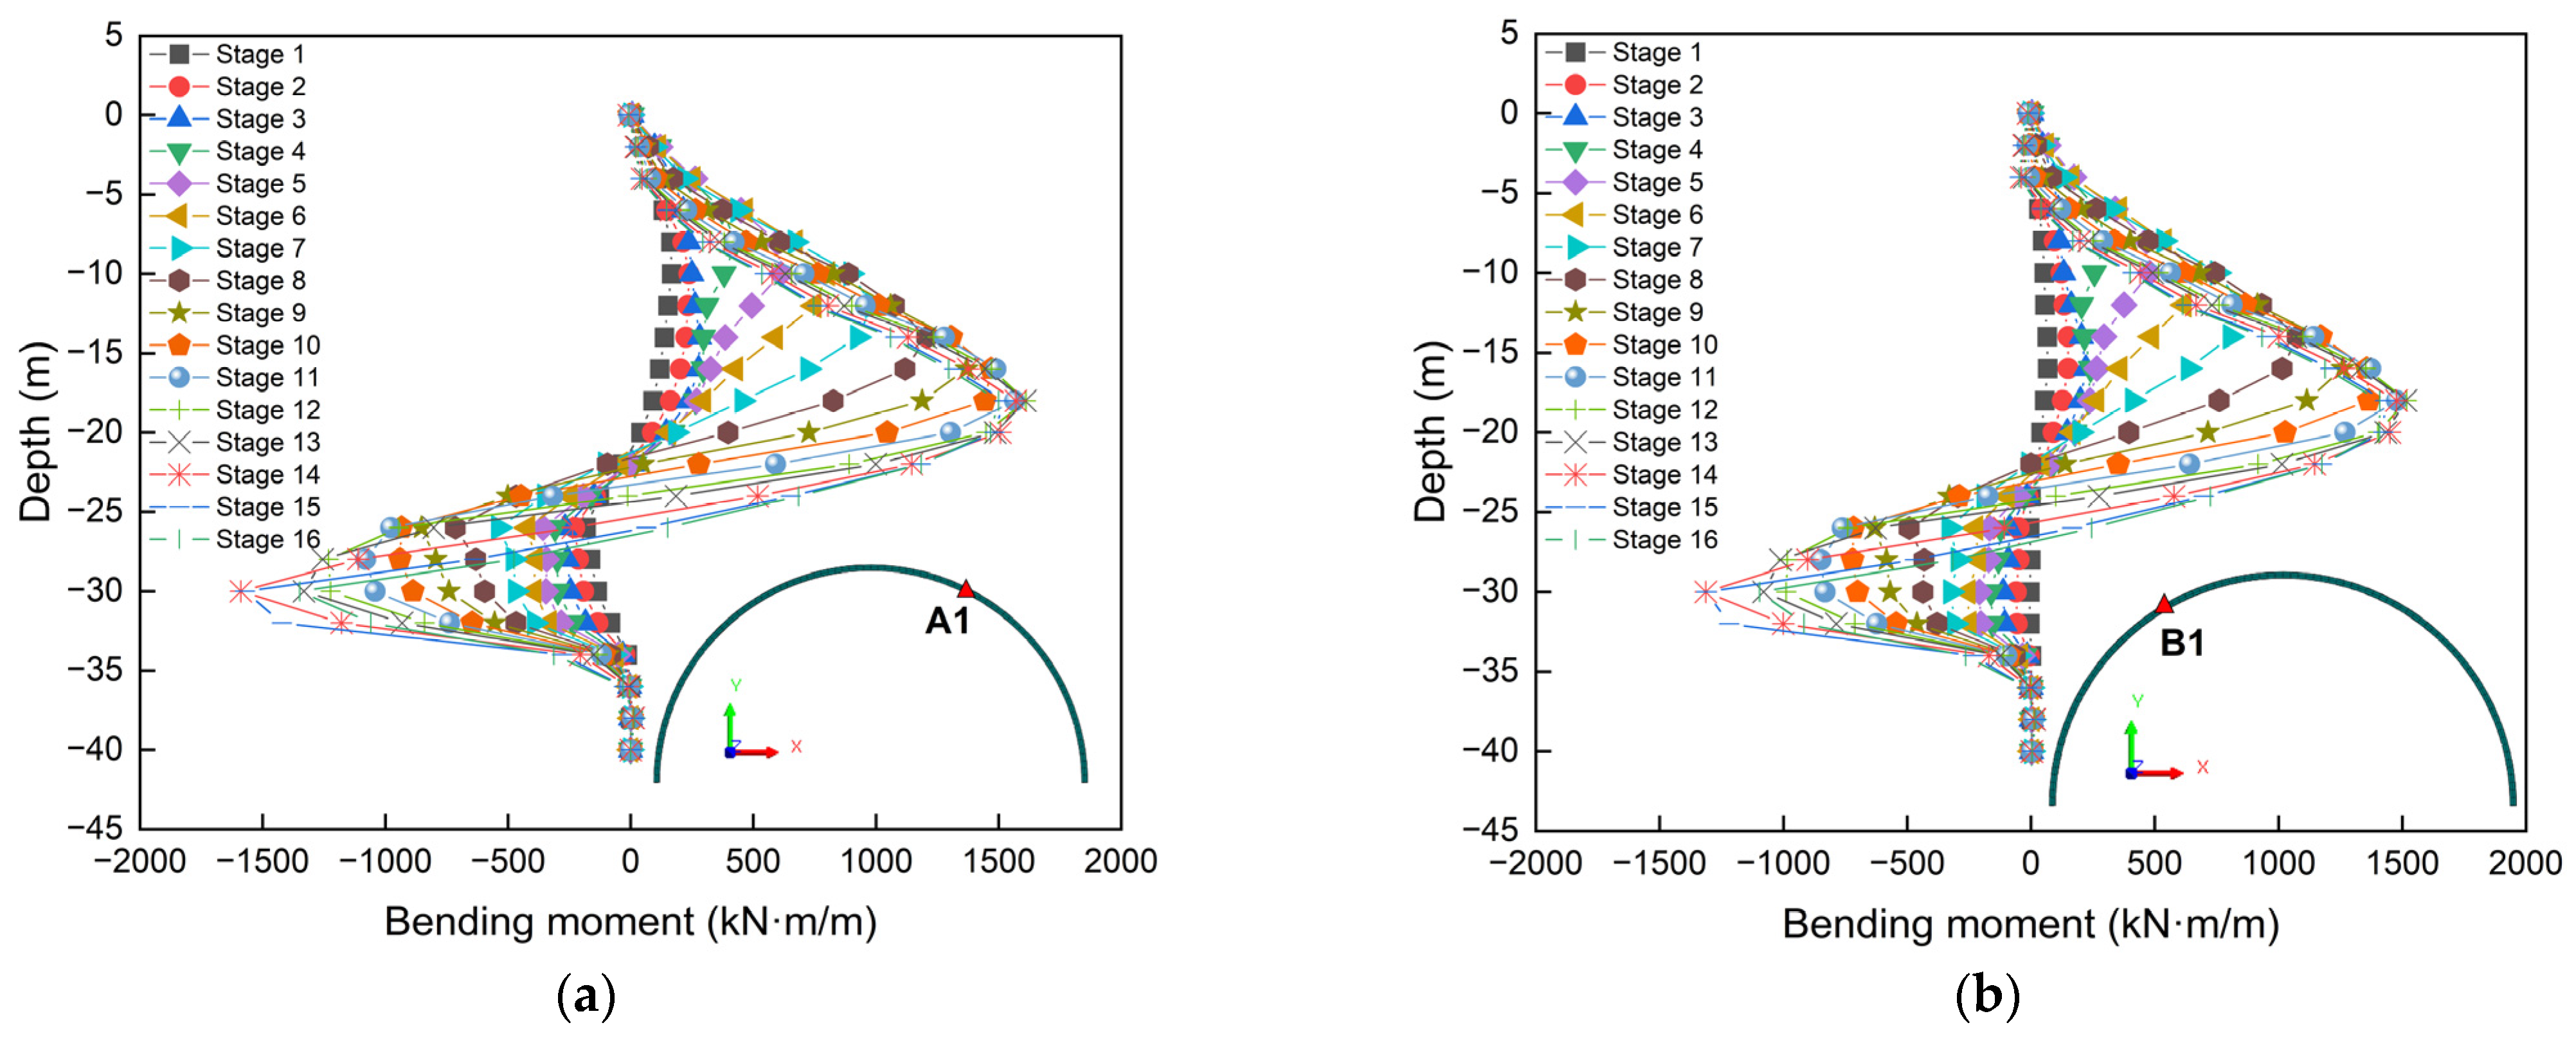
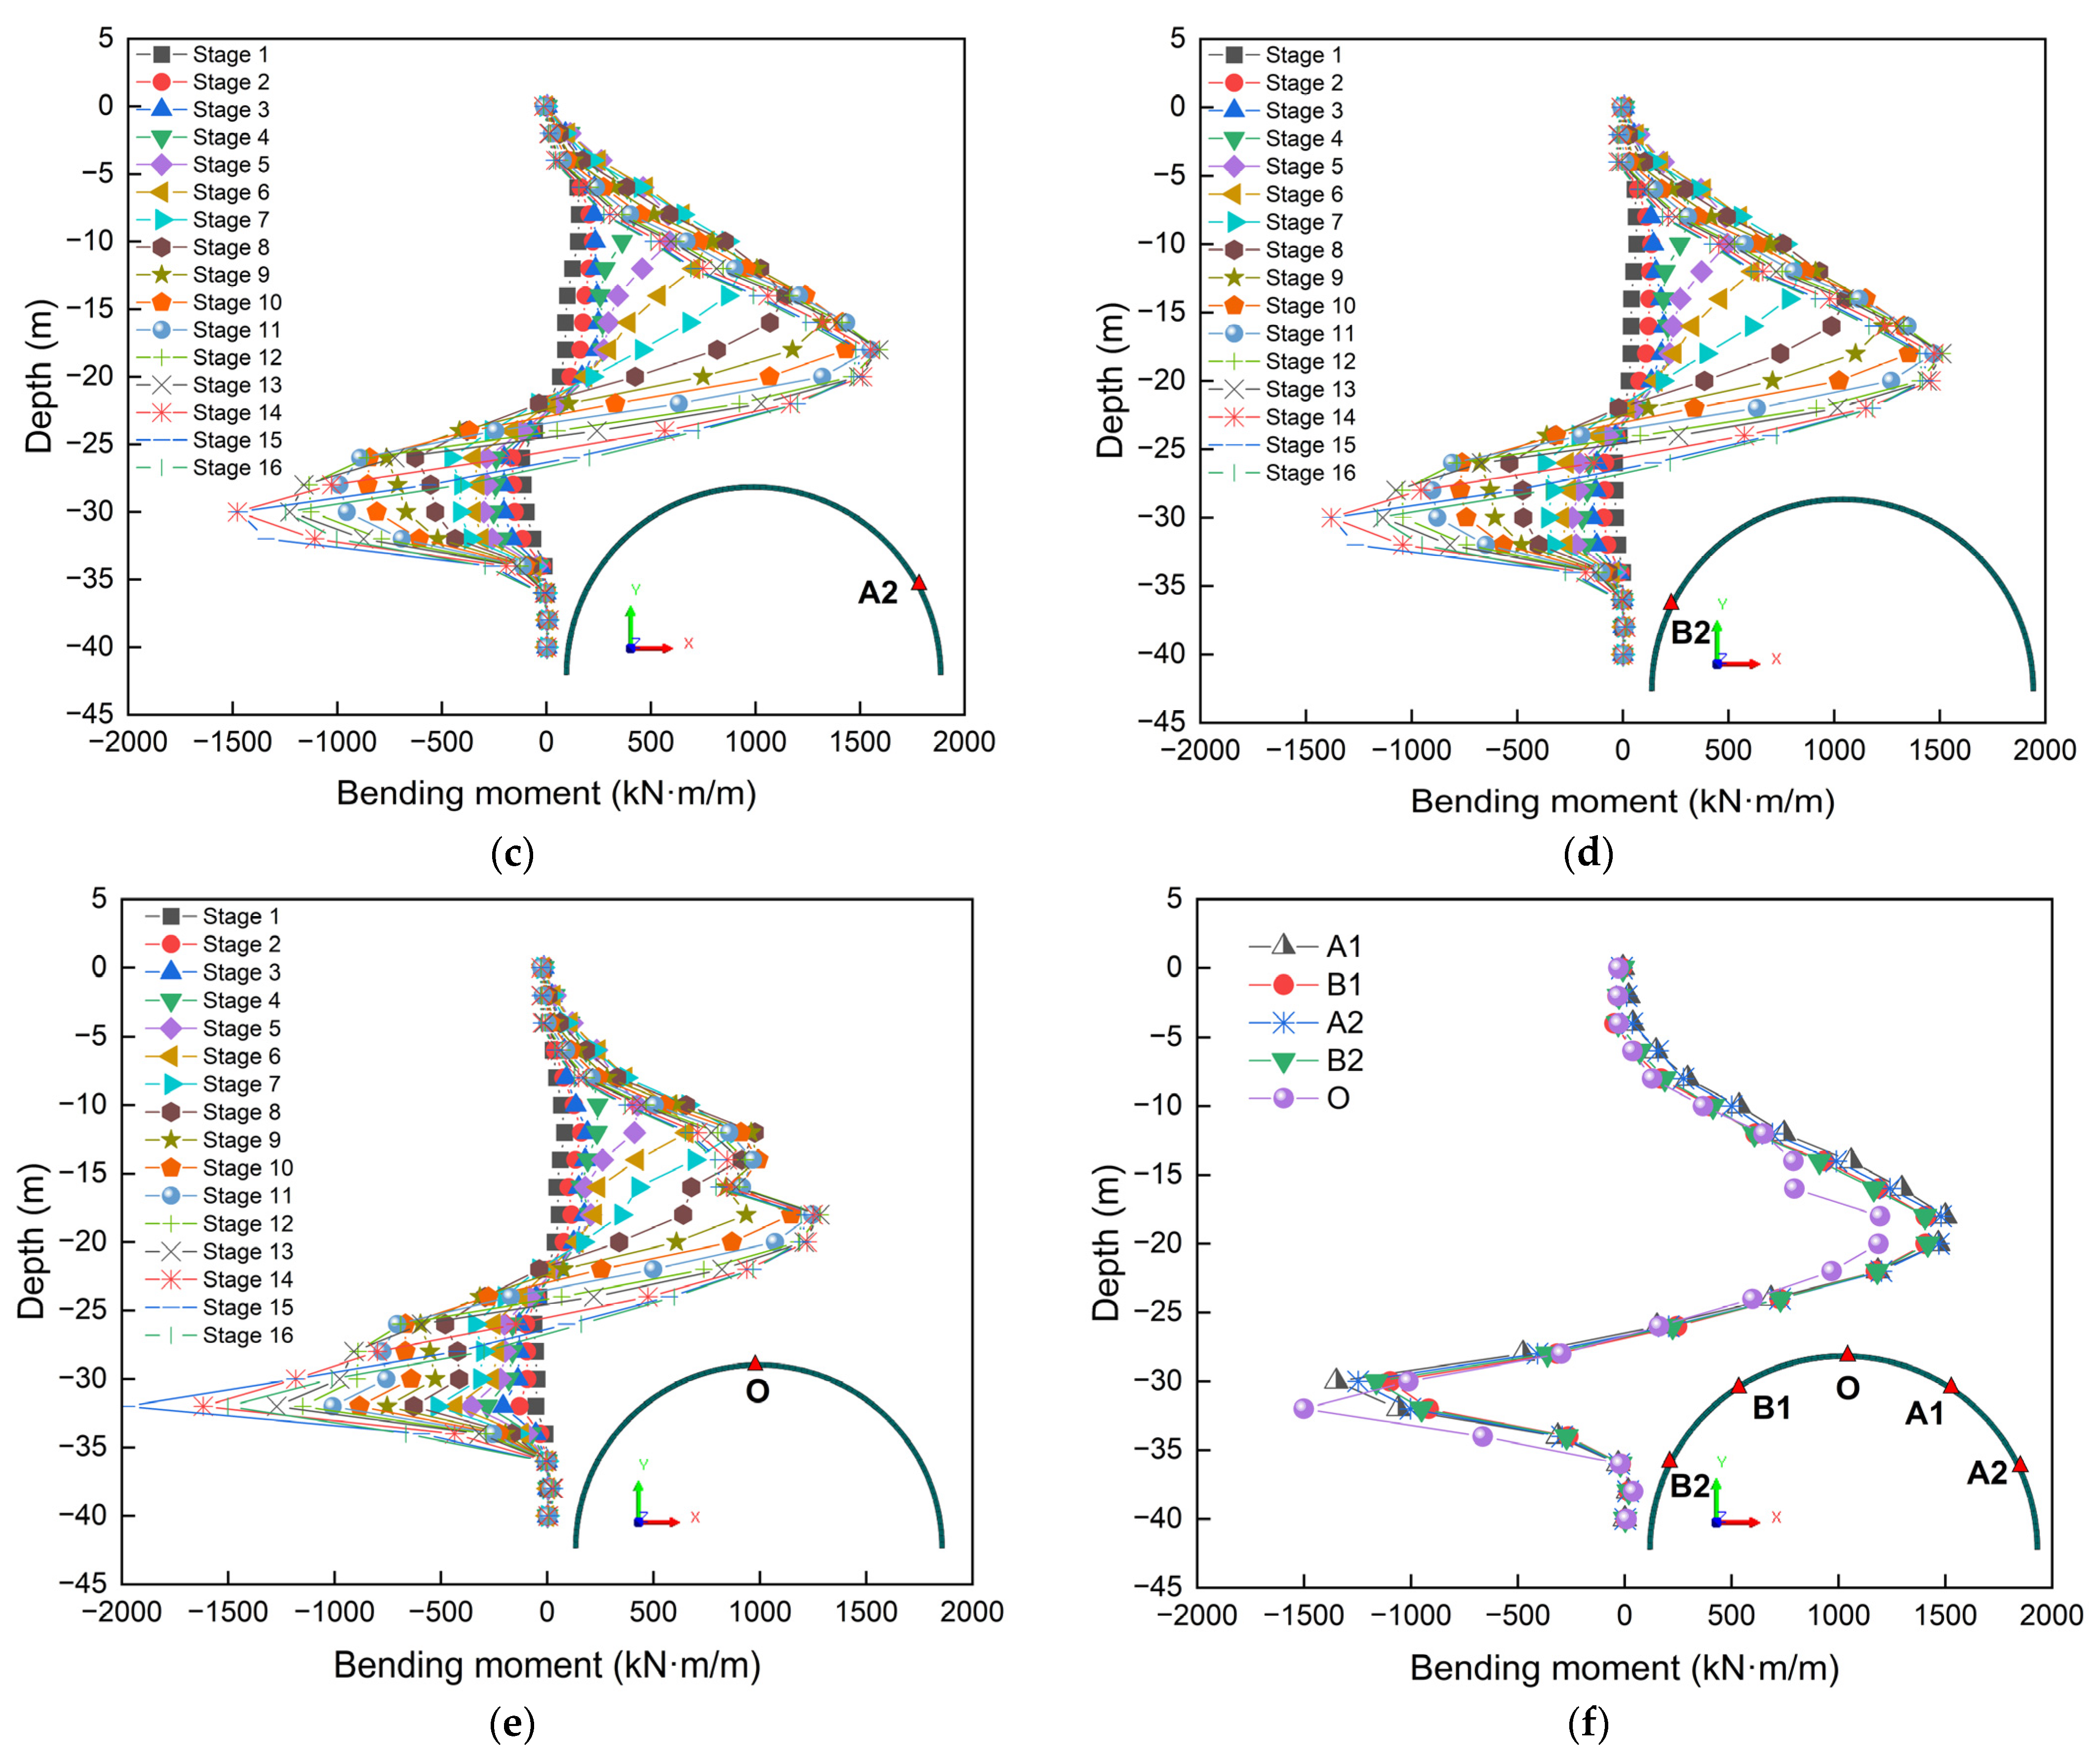
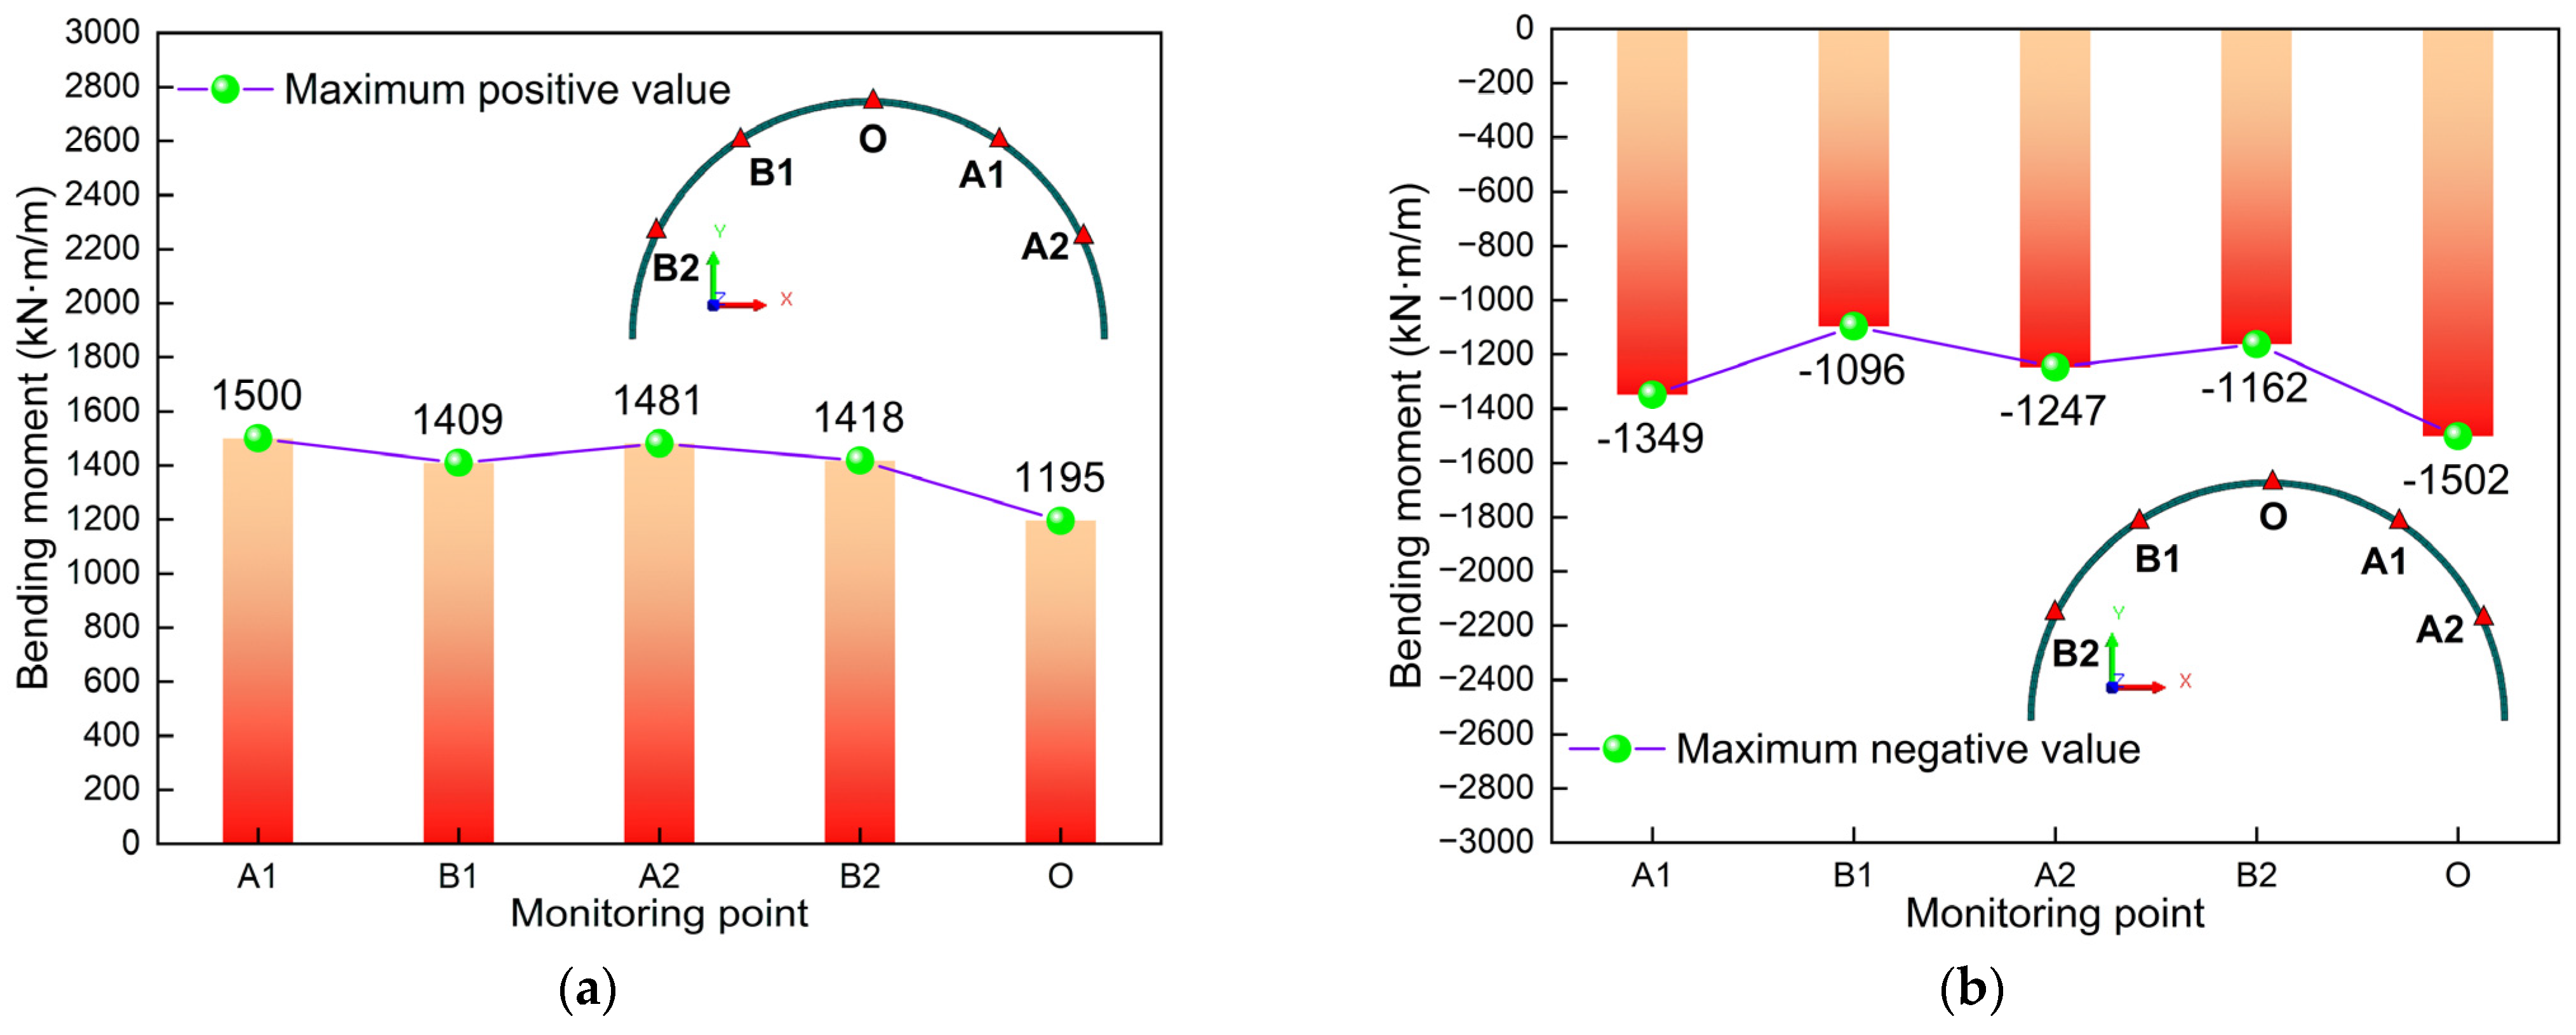
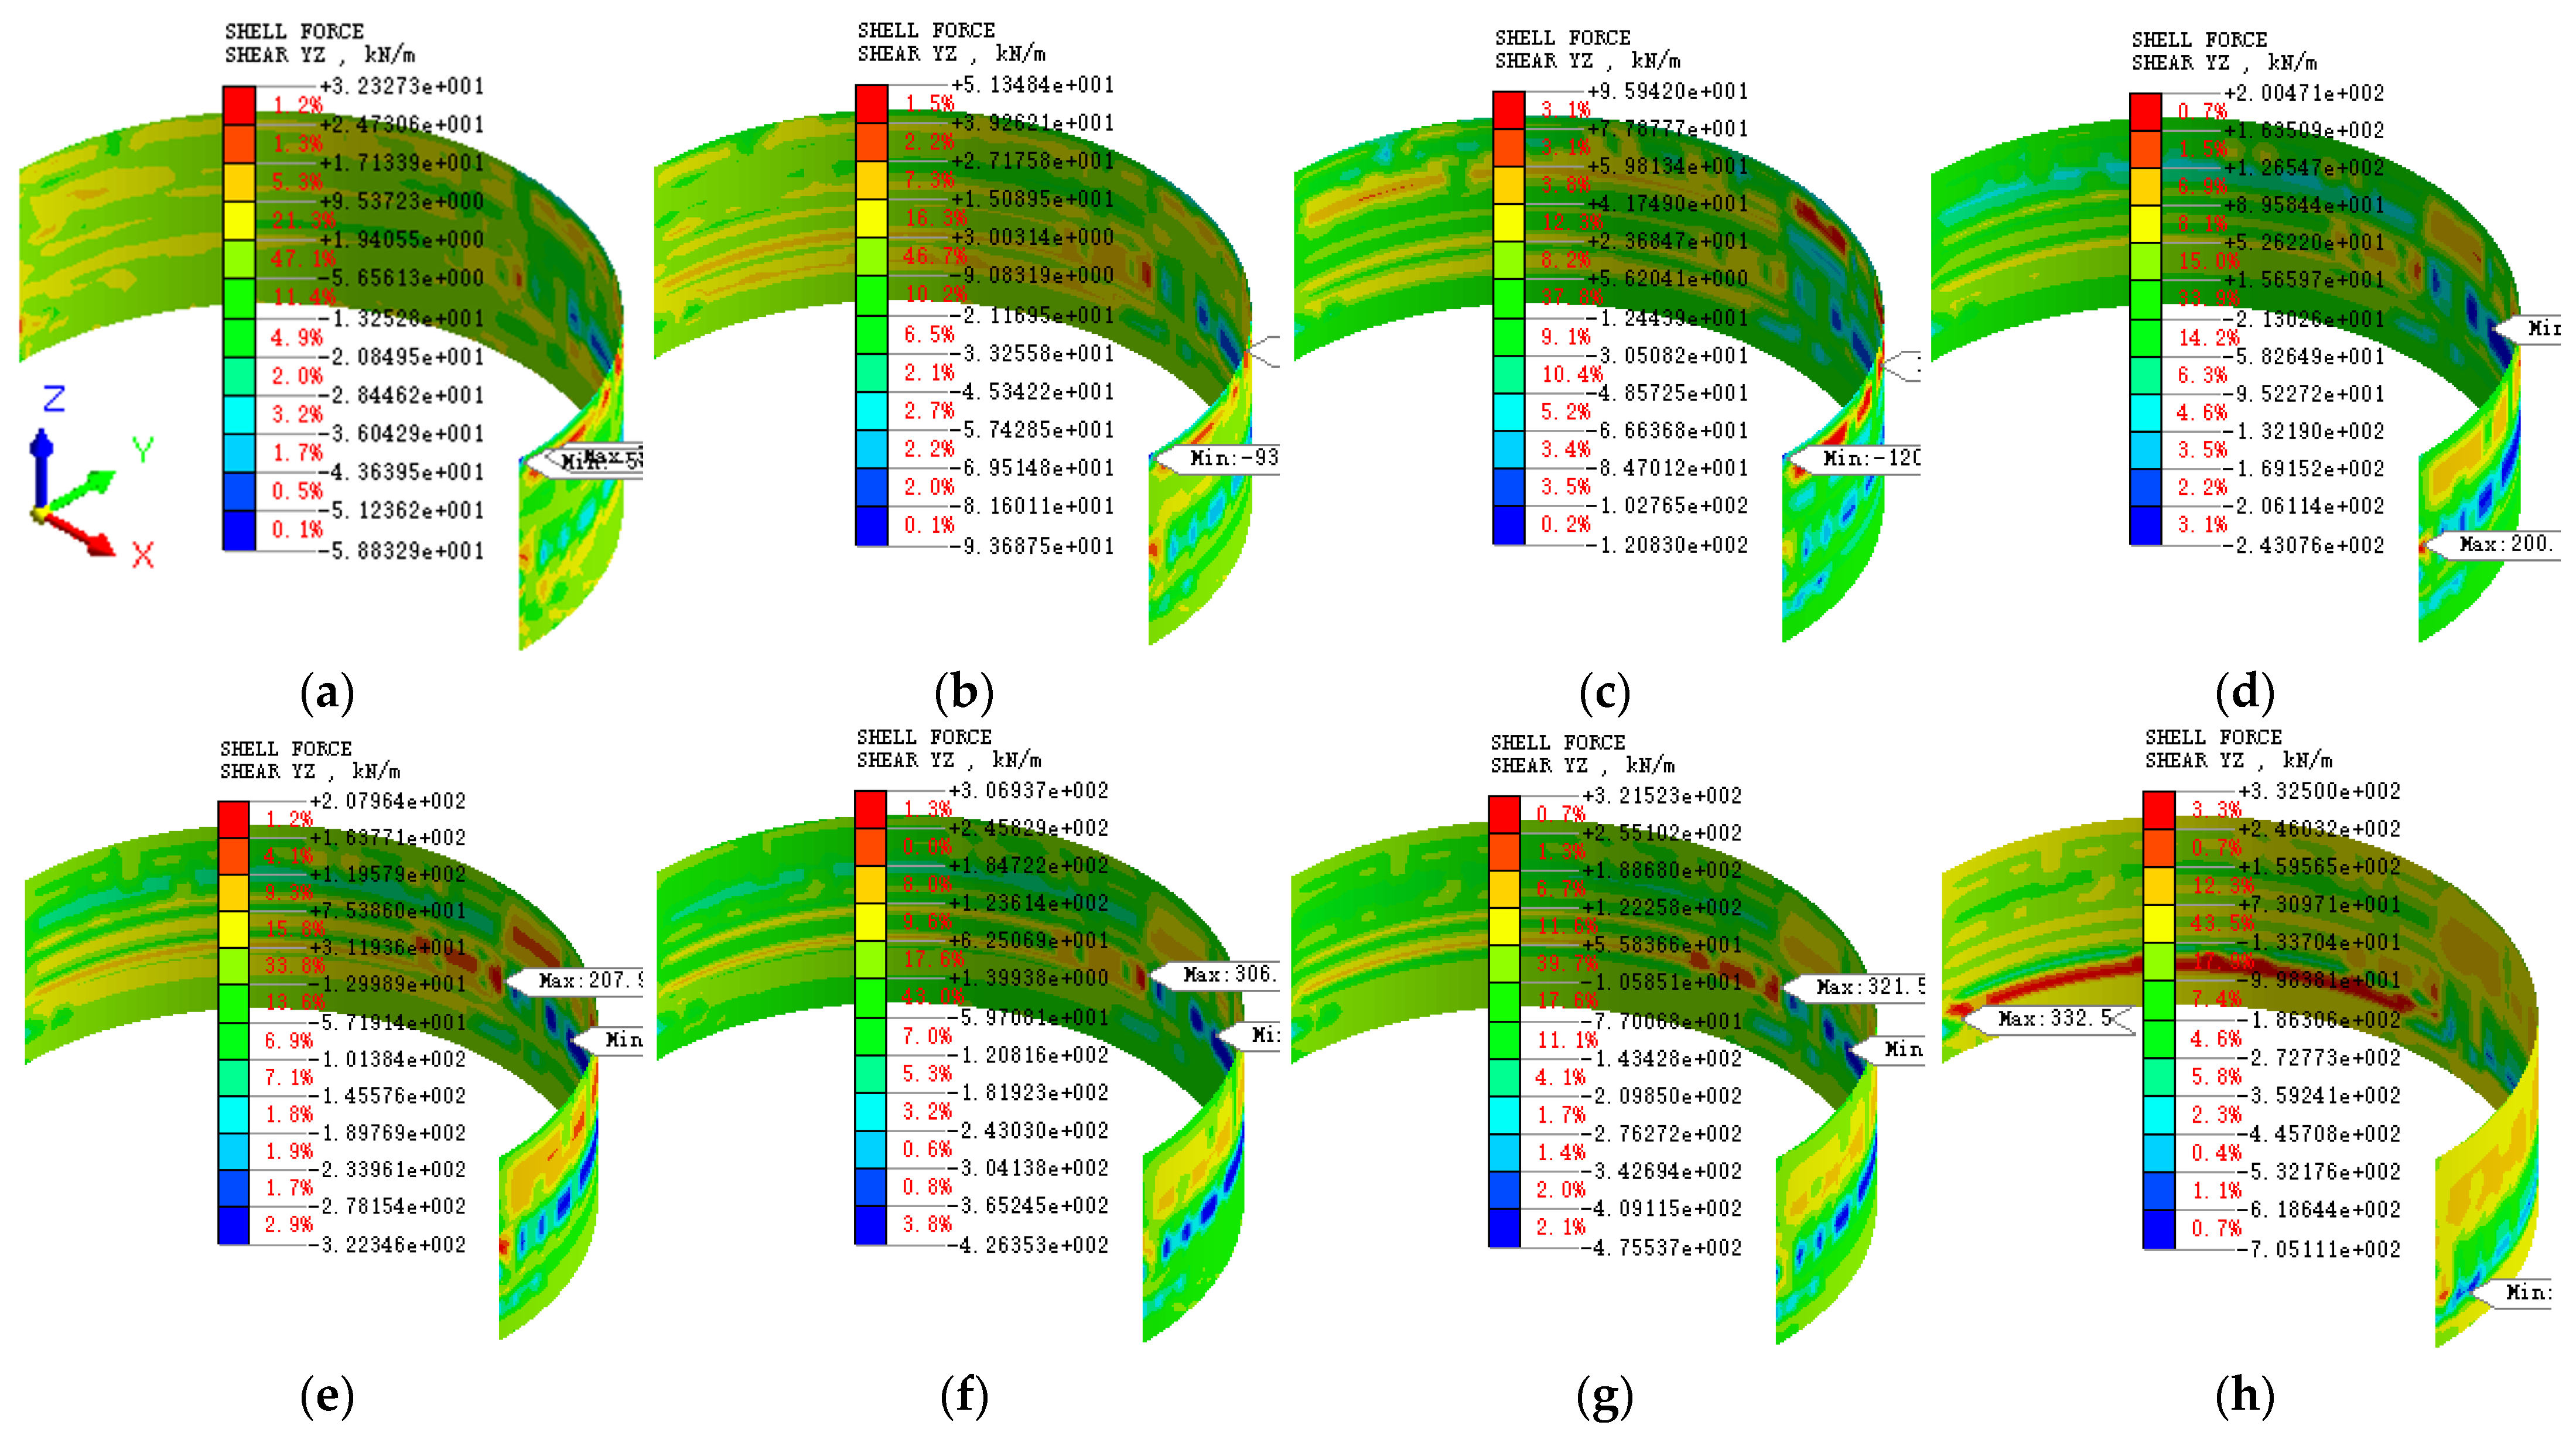

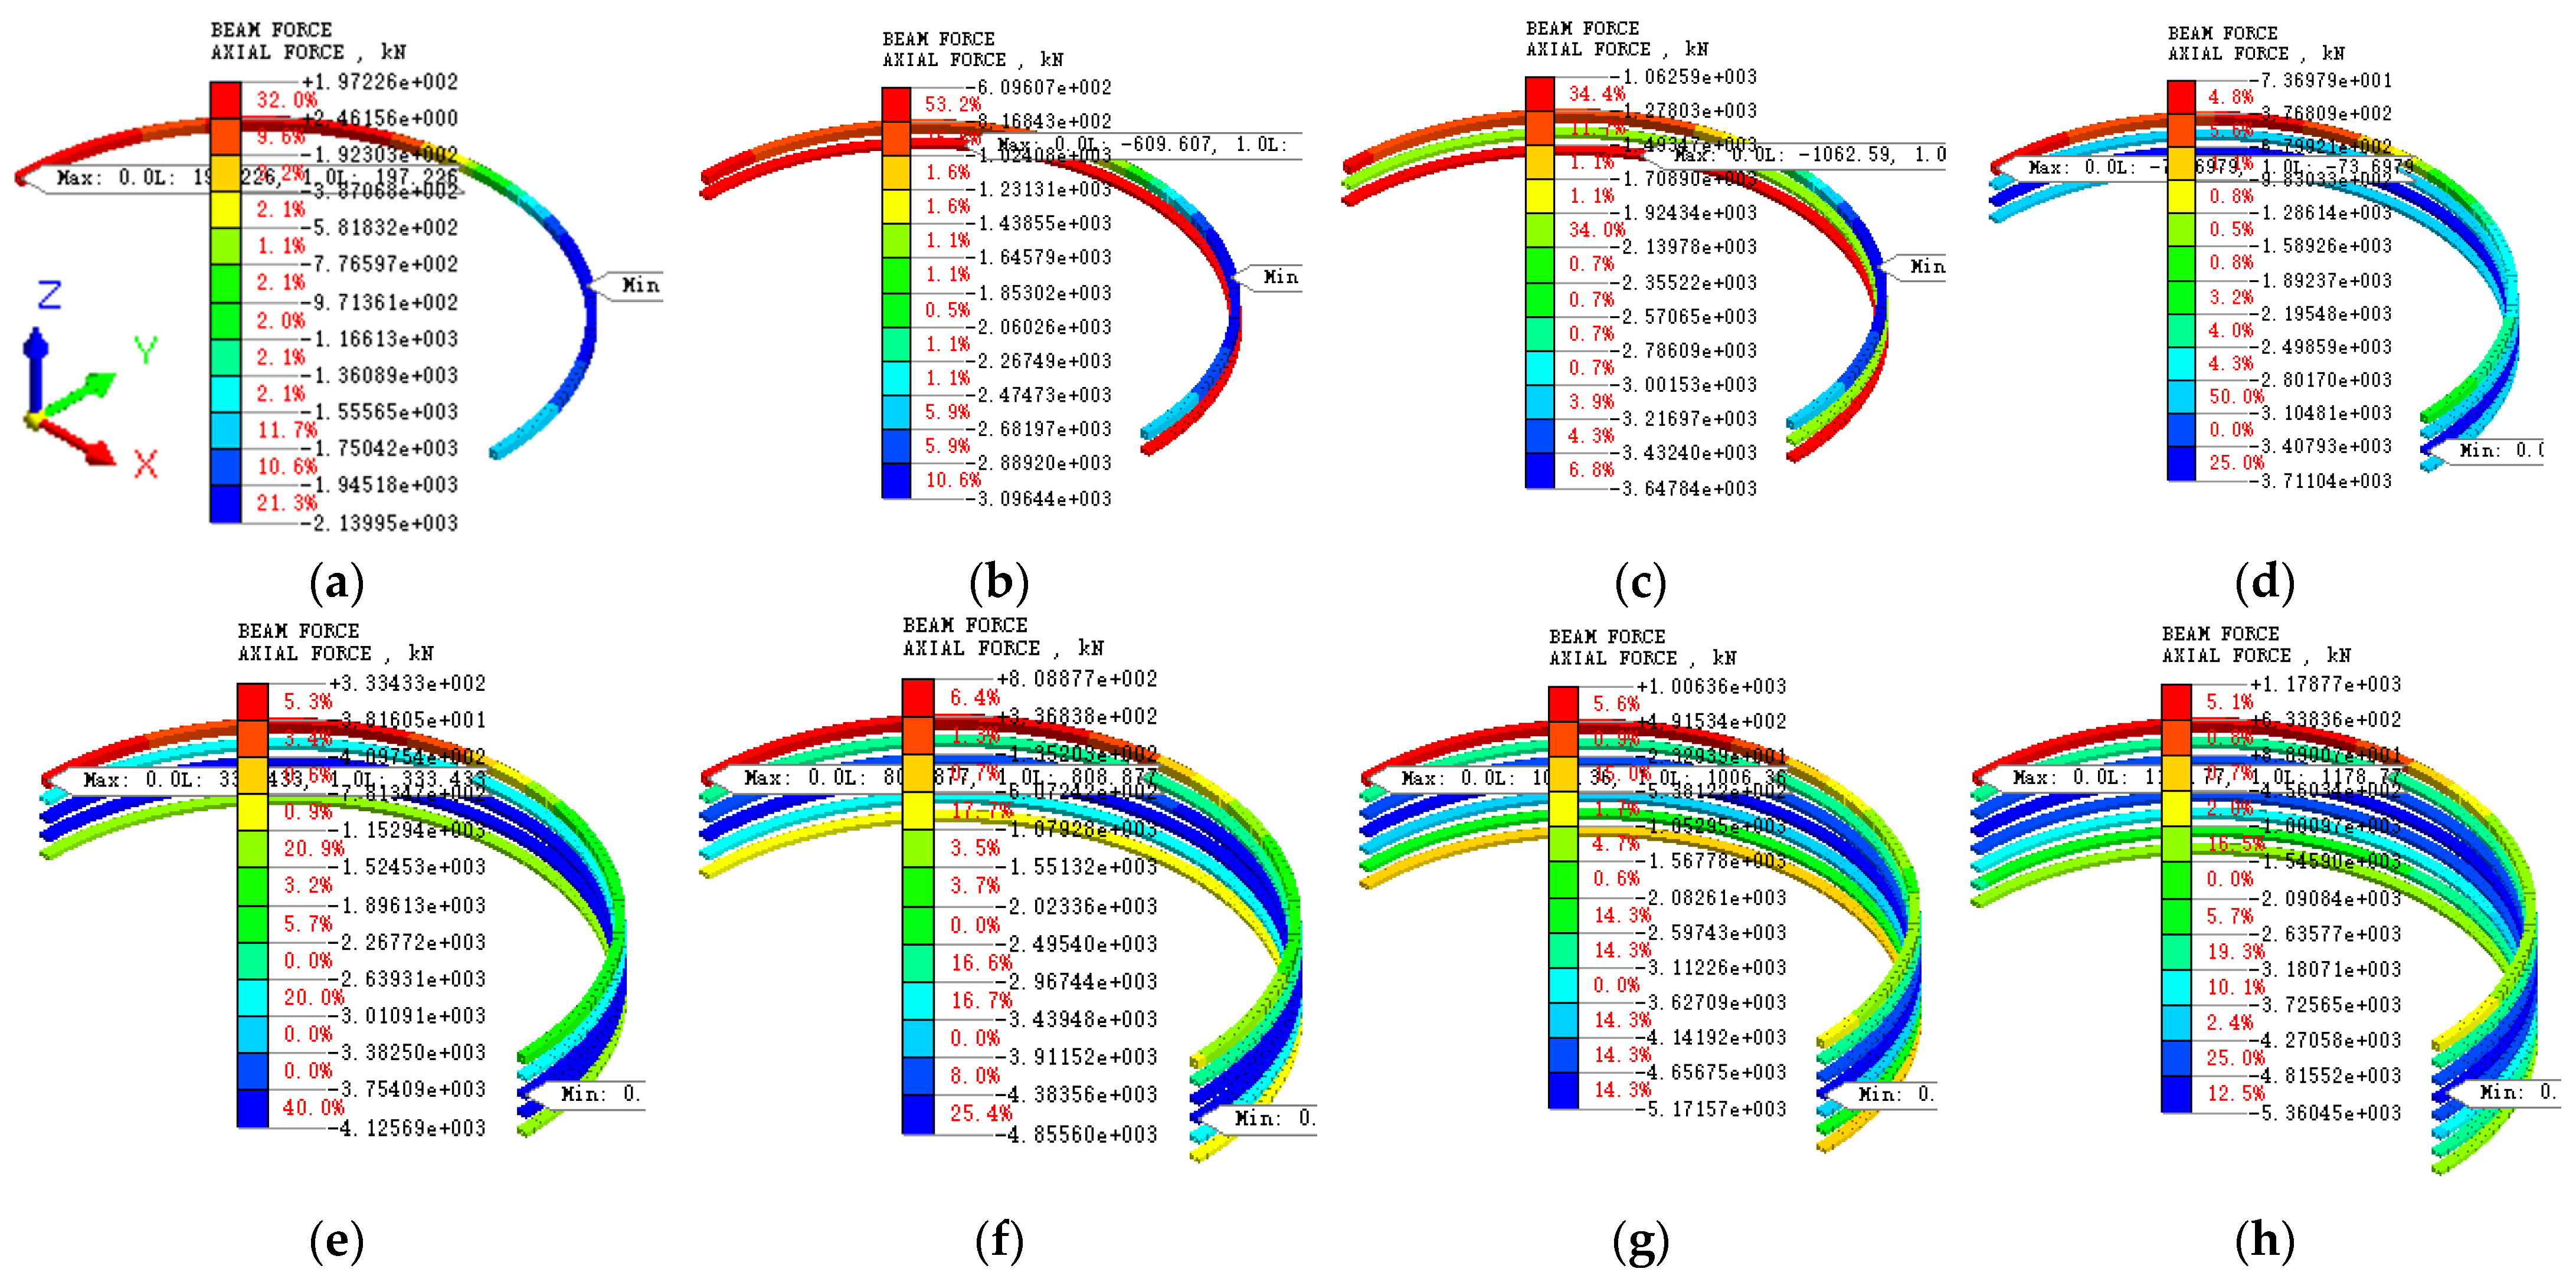
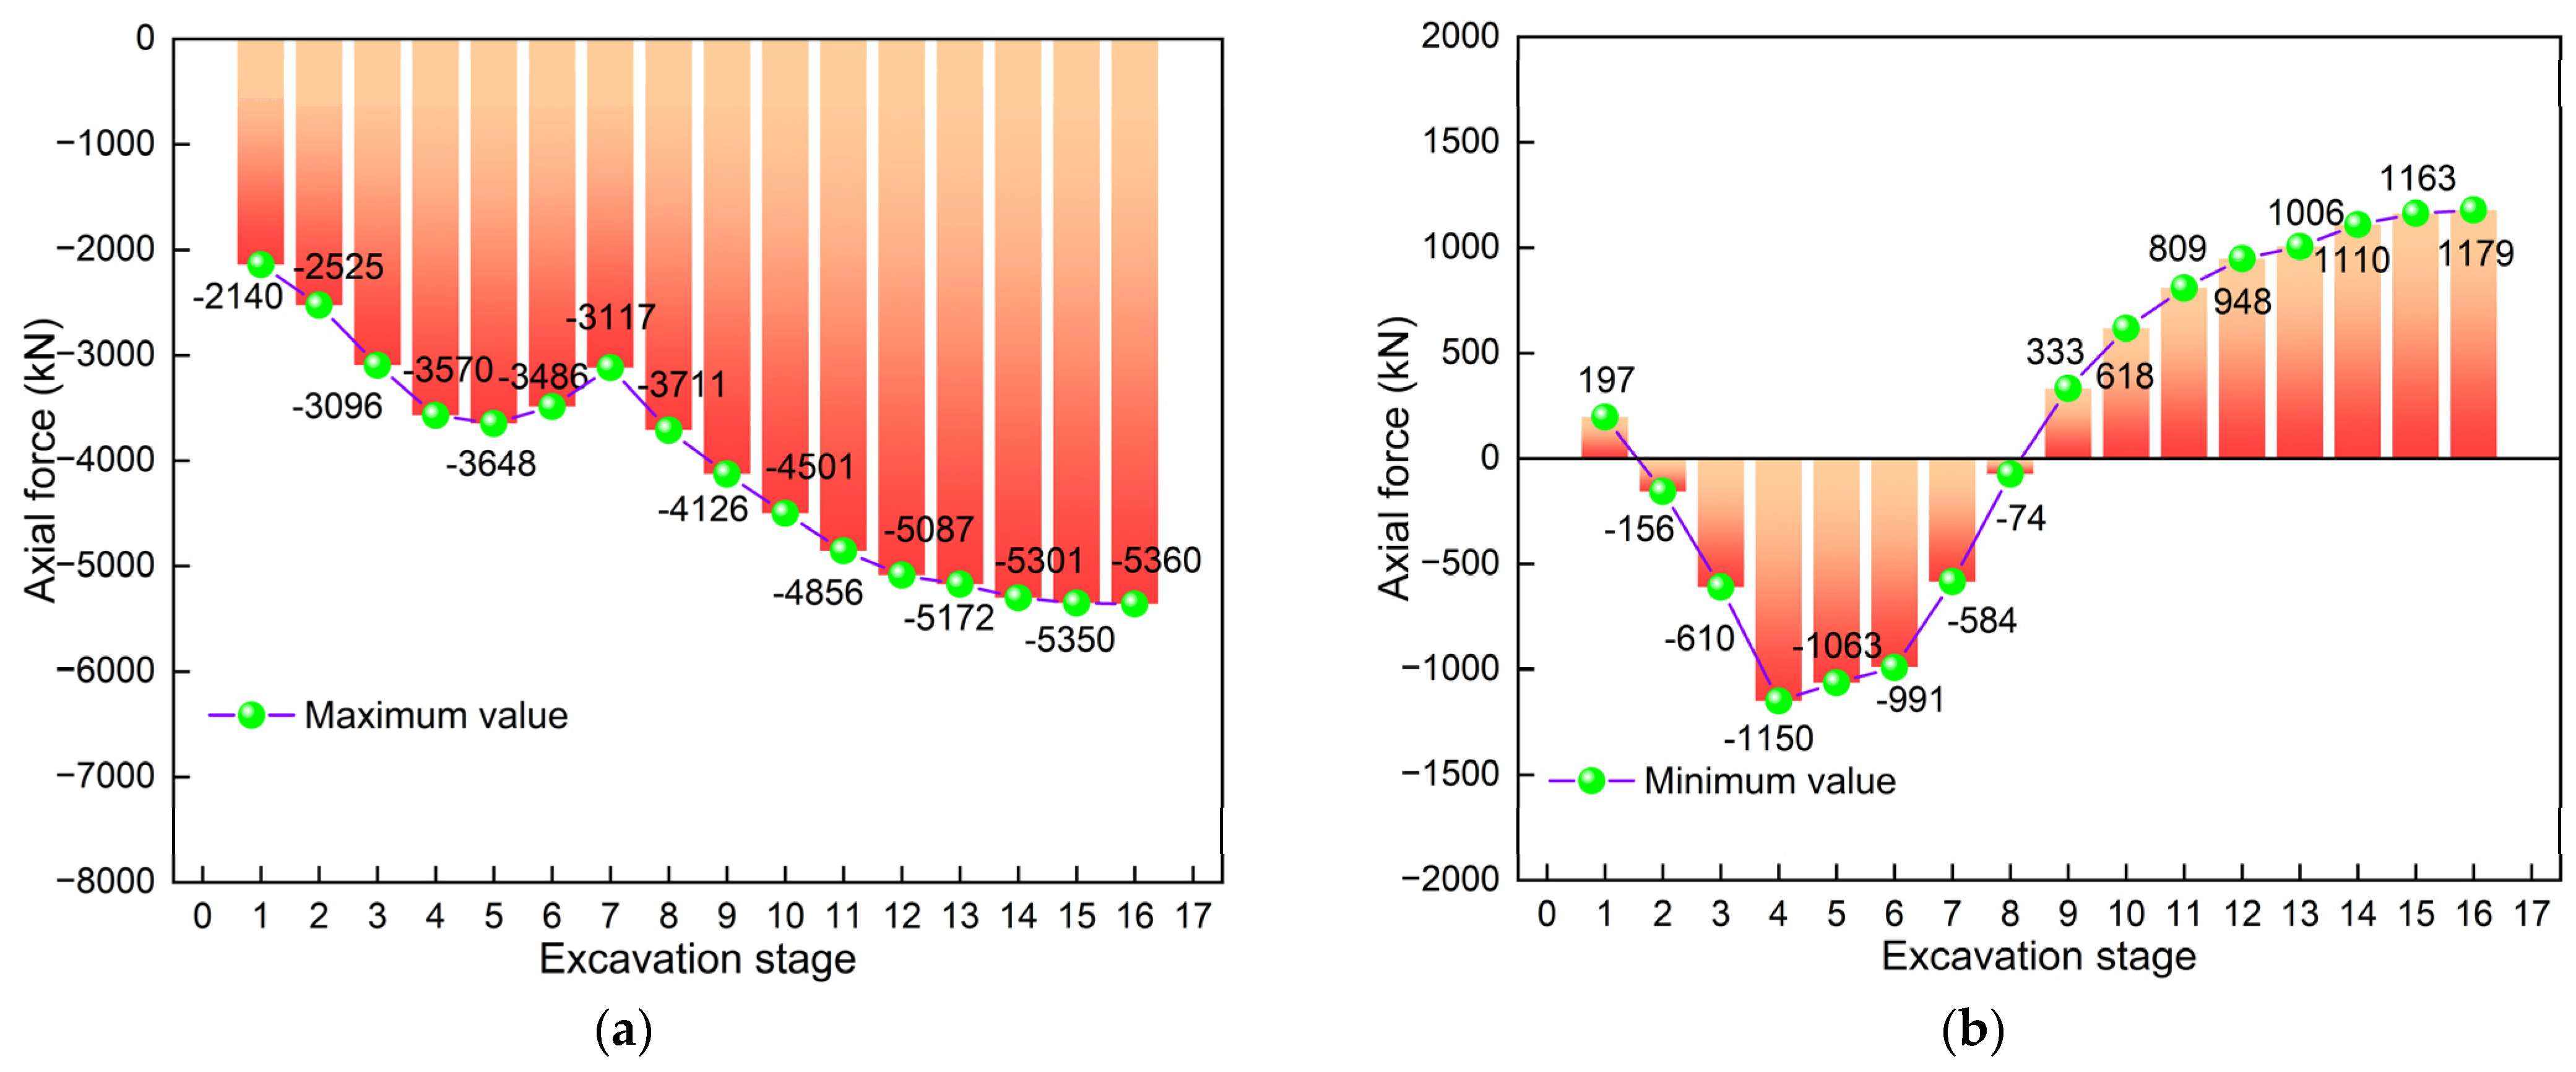


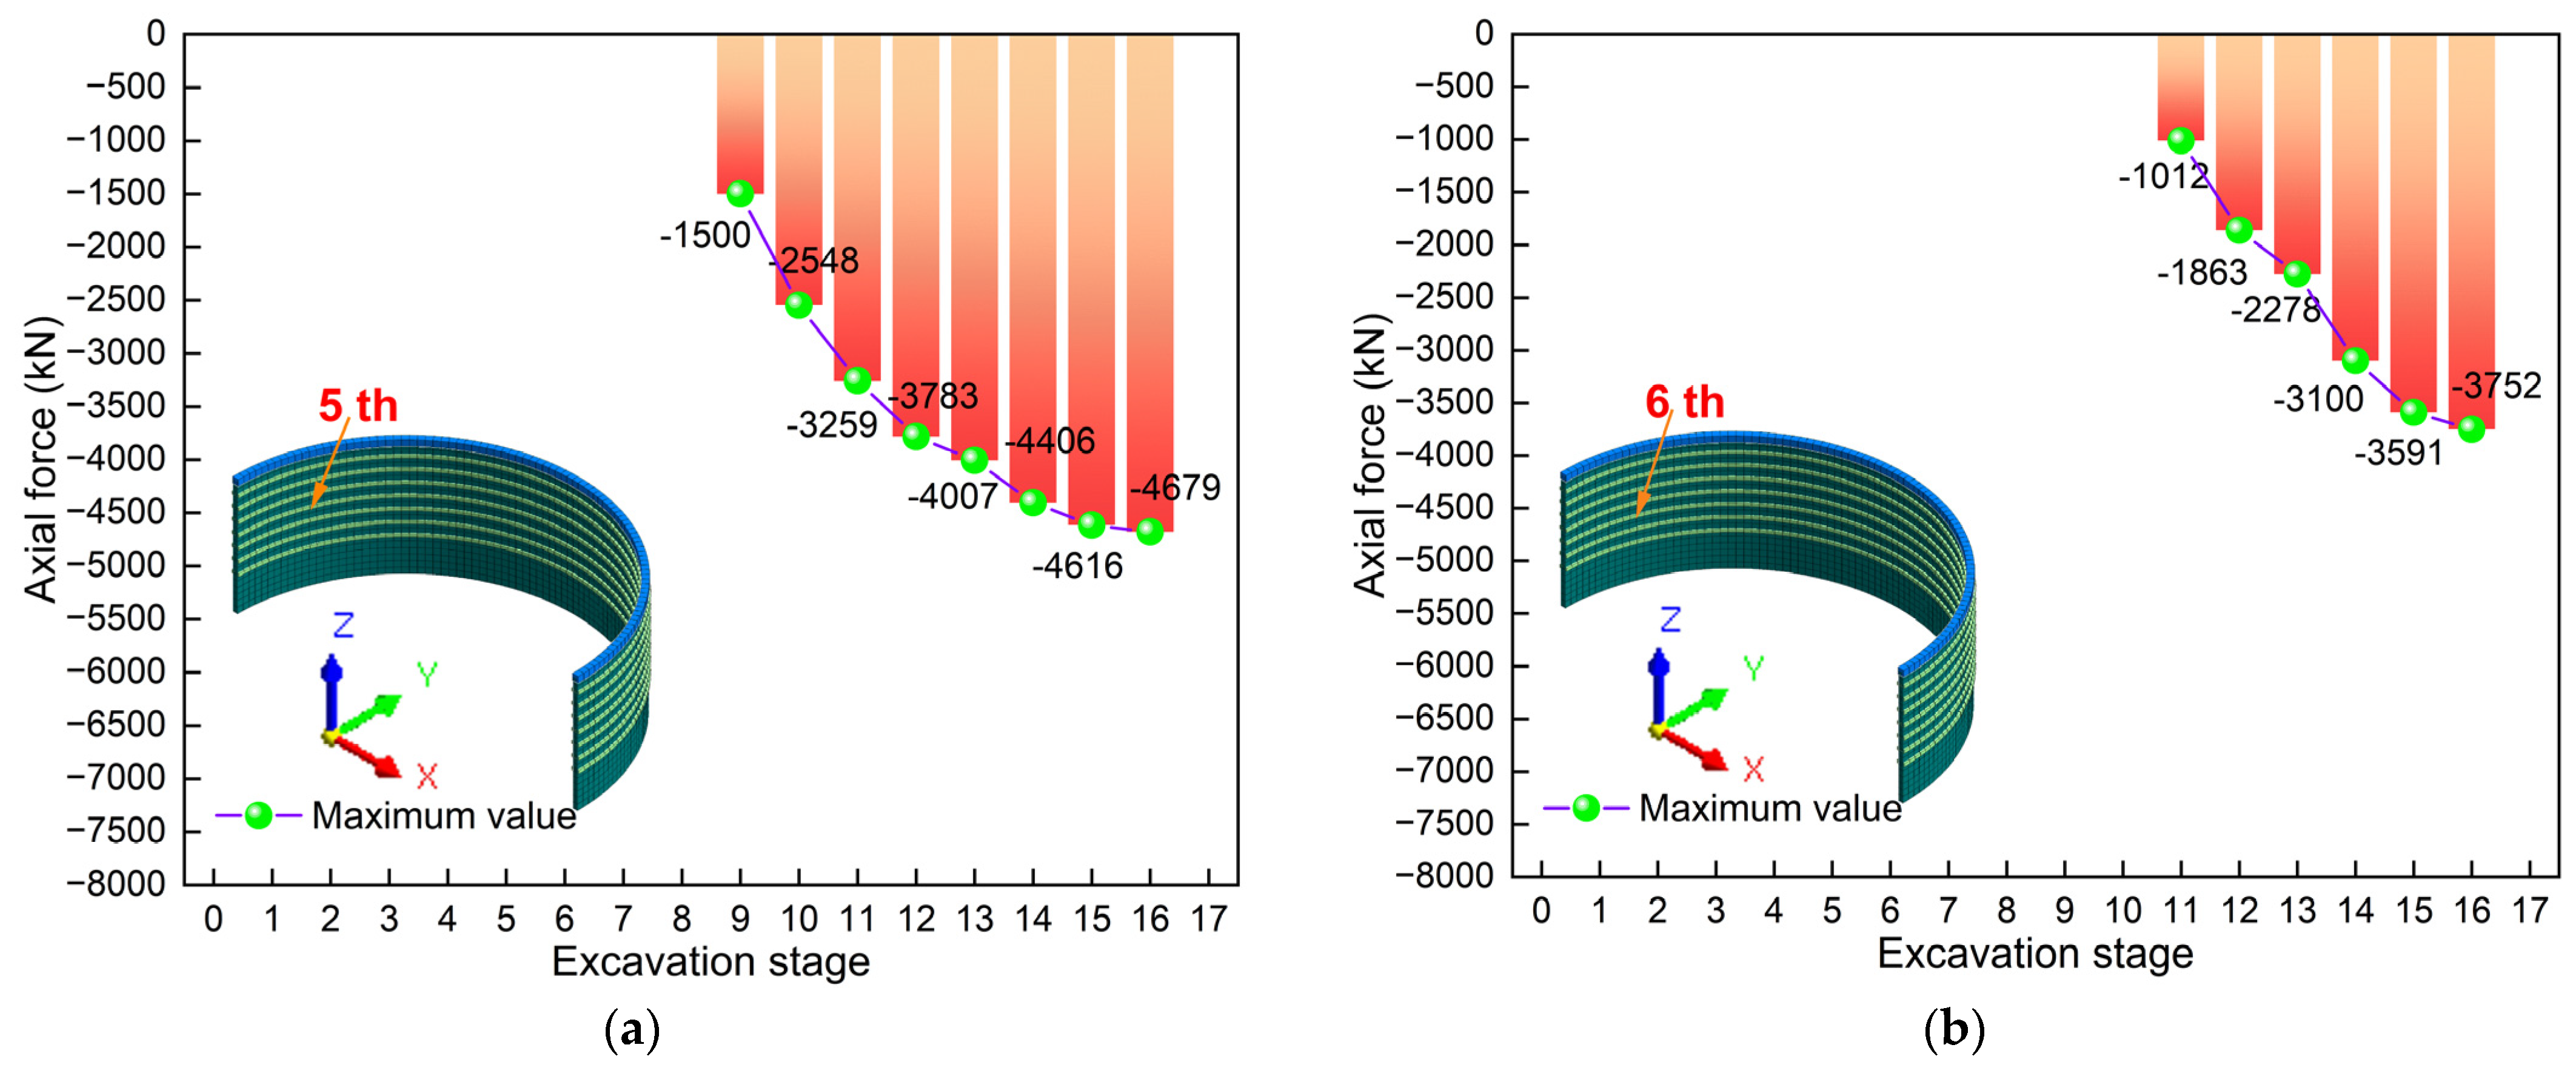


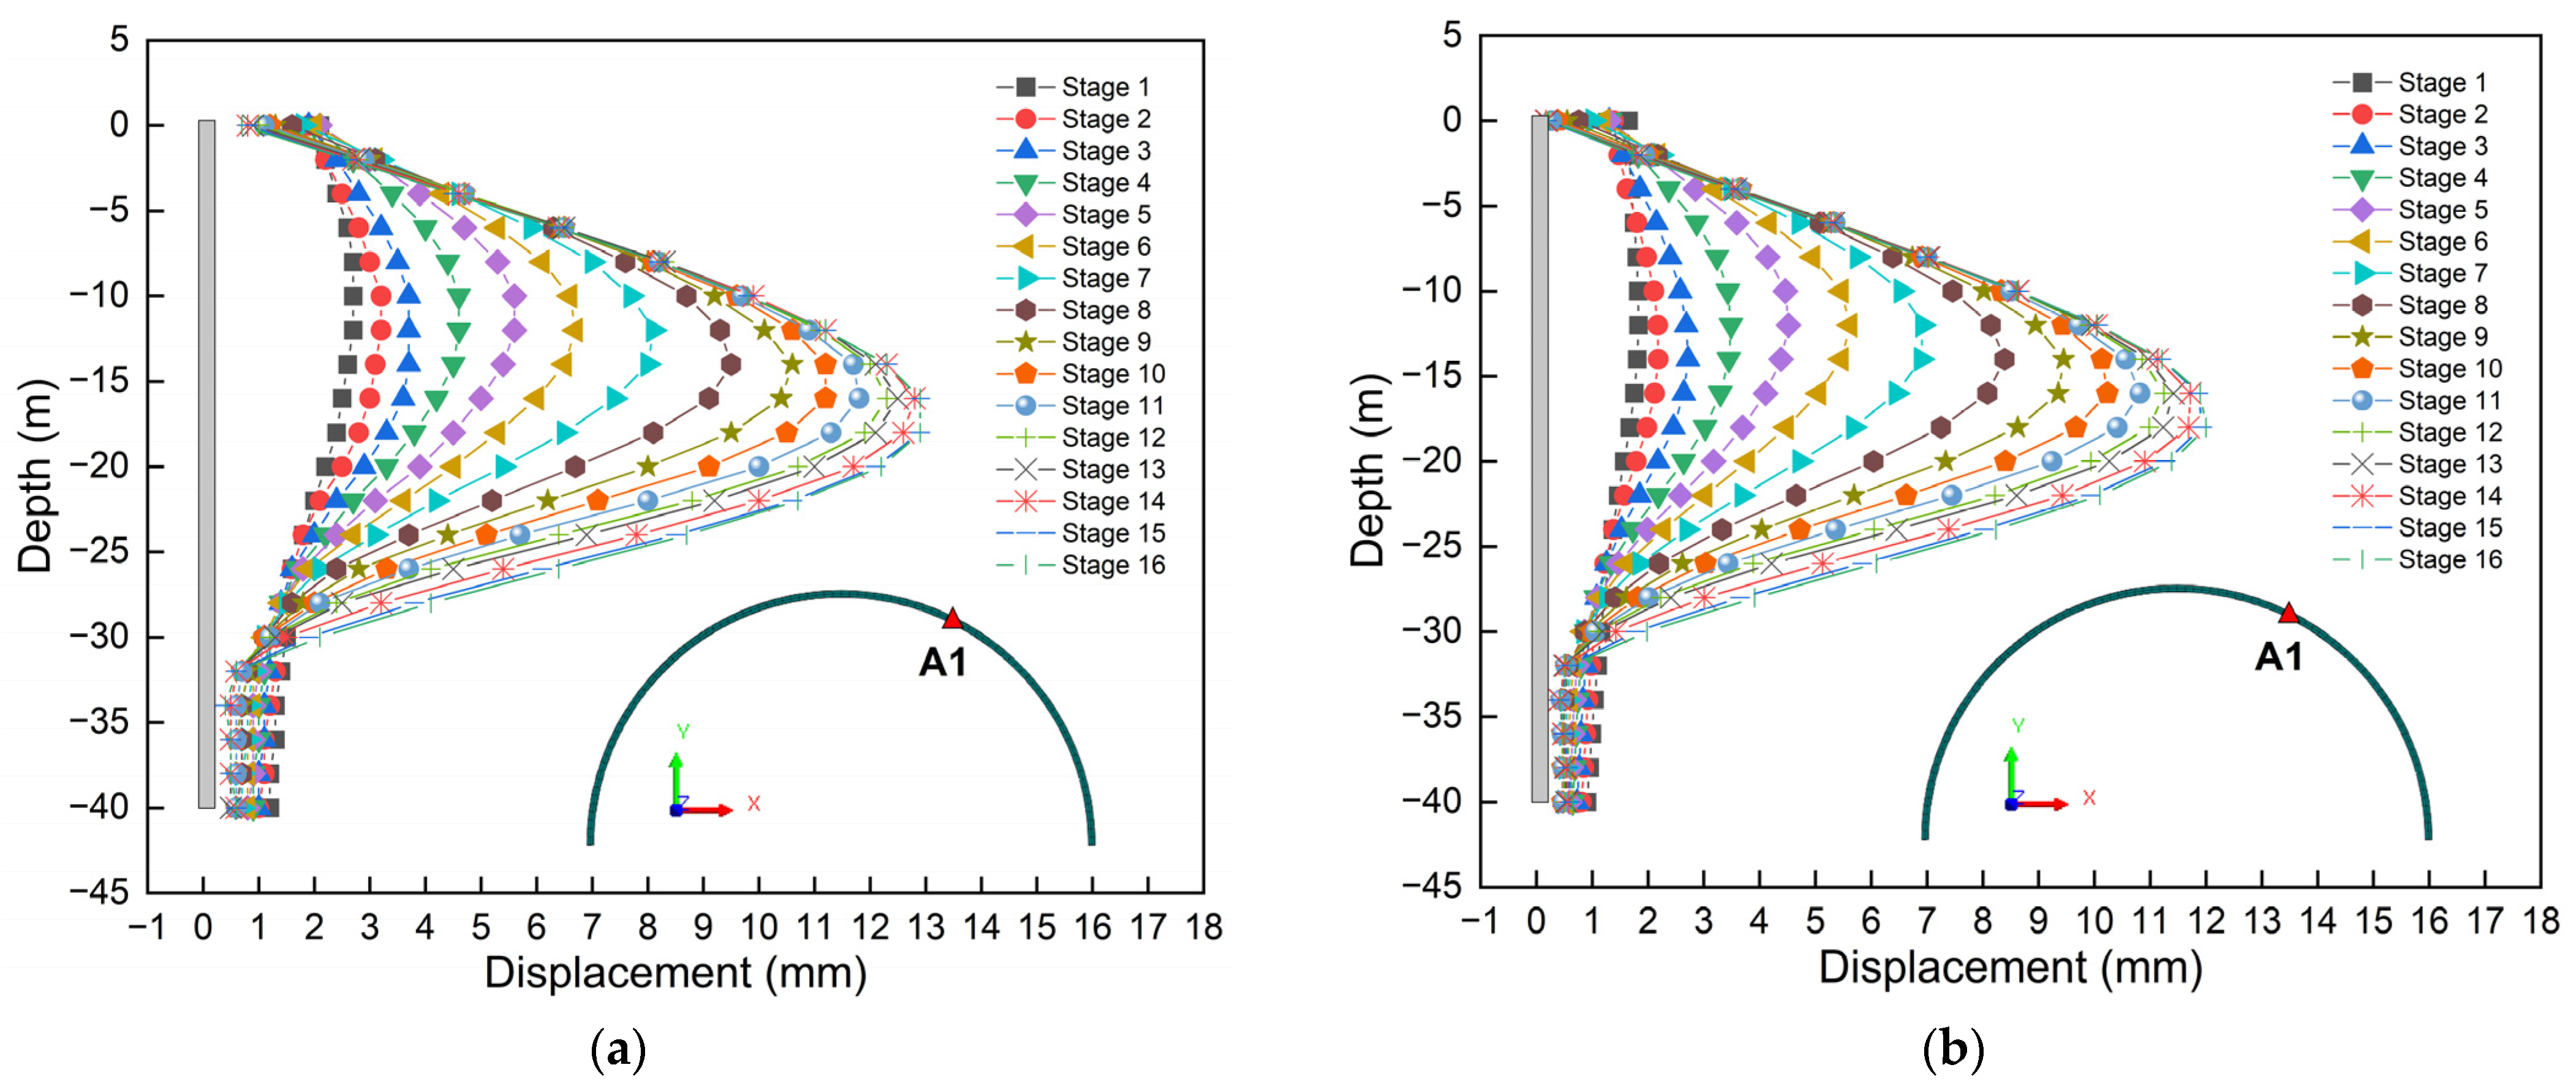
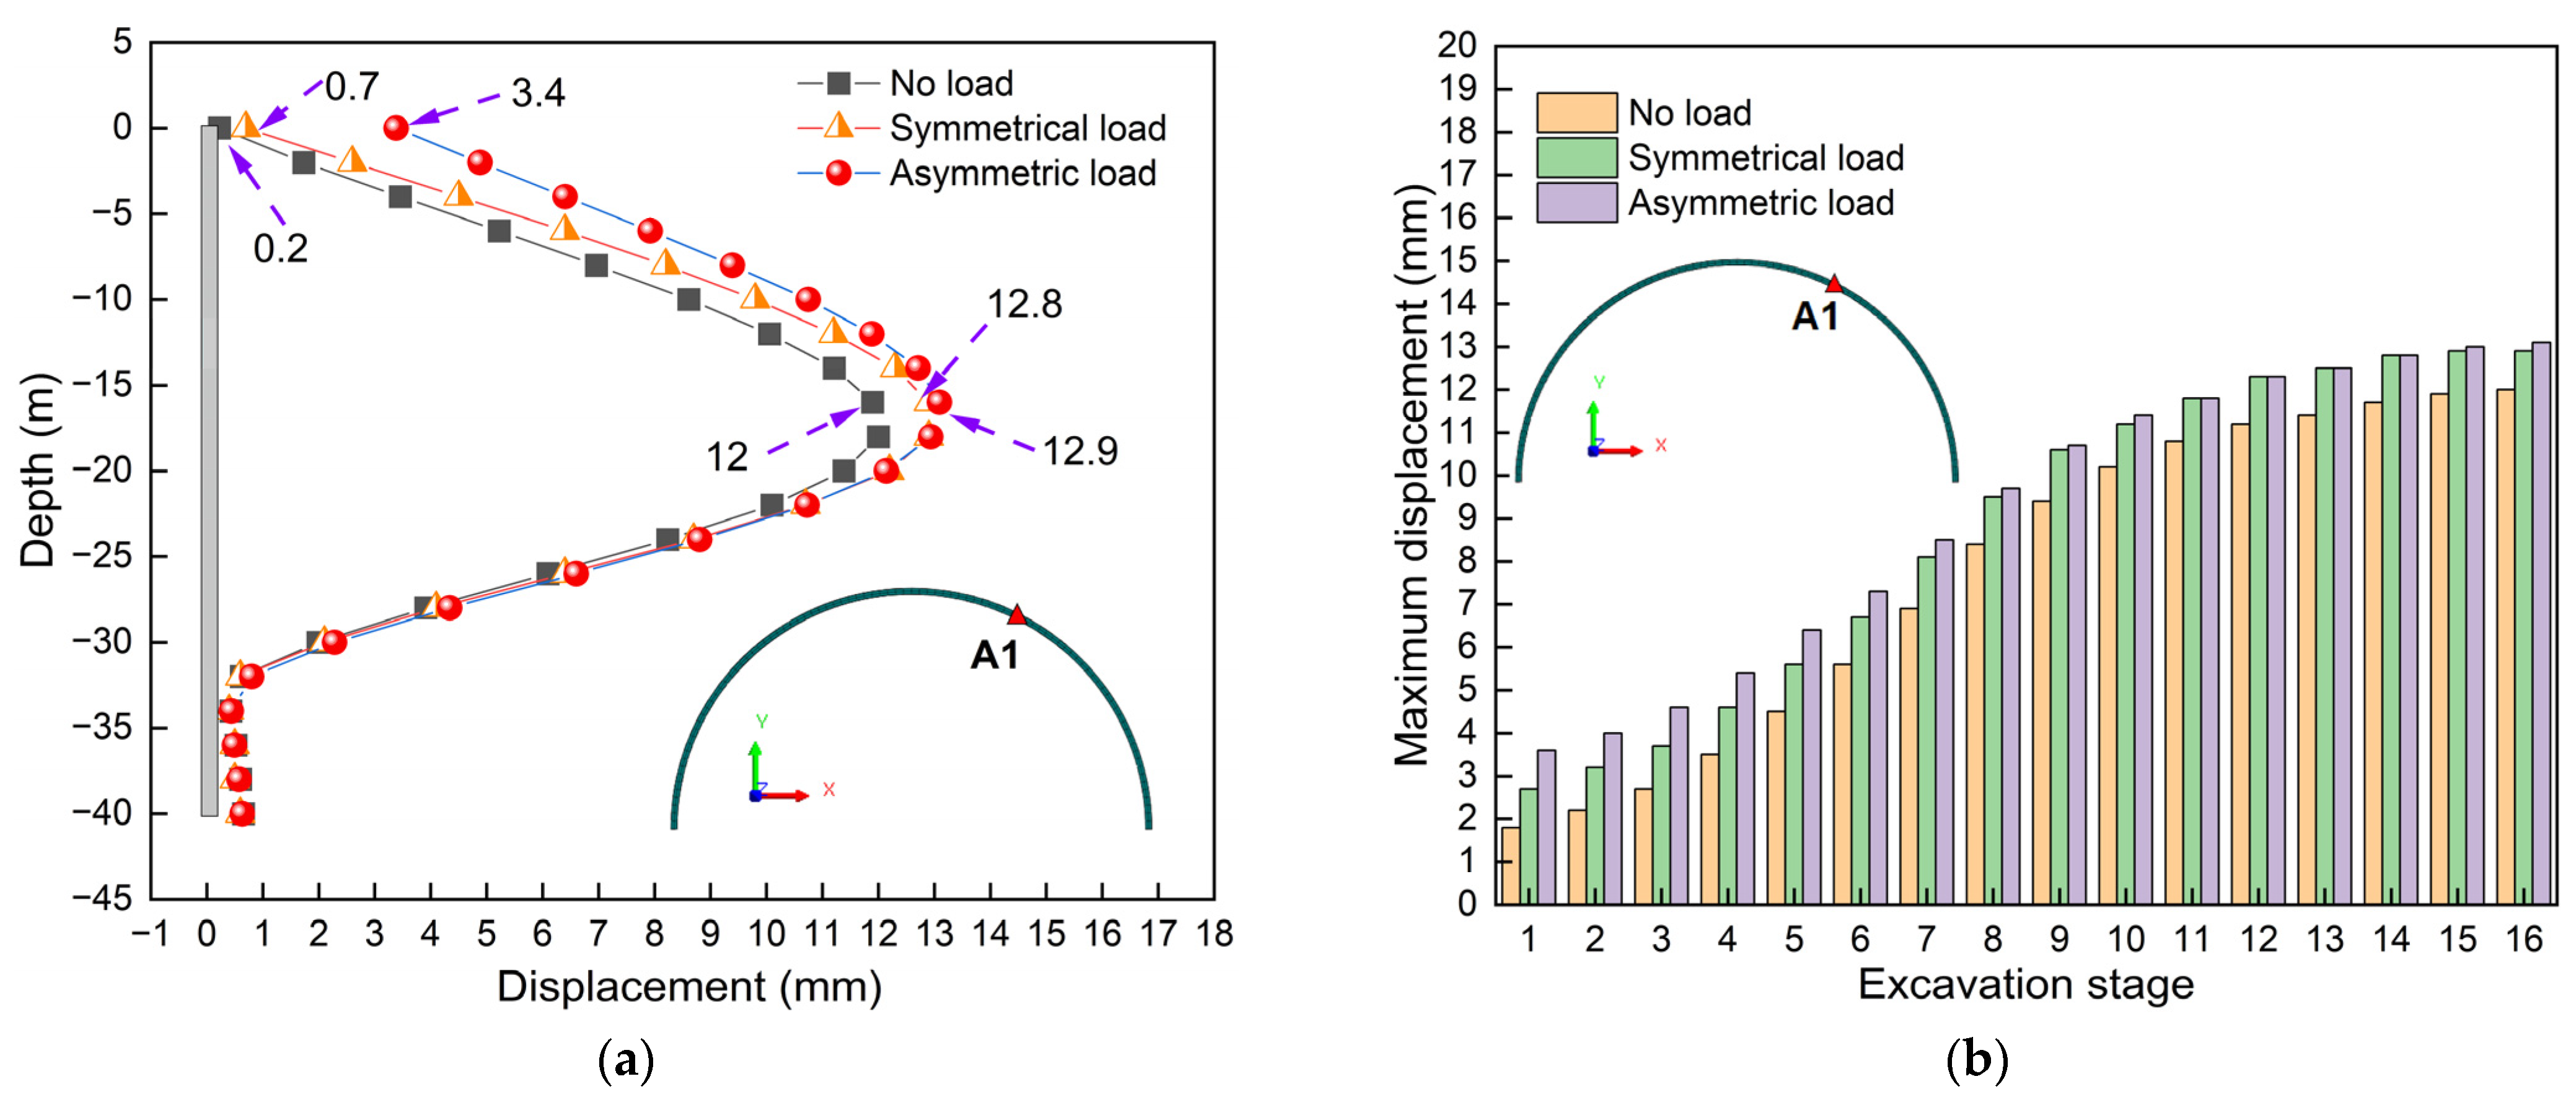
Disclaimer/Publisher’s Note: The statements, opinions and data contained in all publications are solely those of the individual author(s) and contributor(s) and not of MDPI and/or the editor(s). MDPI and/or the editor(s) disclaim responsibility for any injury to people or property resulting from any ideas, methods, instructions or products referred to in the content. |
© 2025 by the authors. Licensee MDPI, Basel, Switzerland. This article is an open access article distributed under the terms and conditions of the Creative Commons Attribution (CC BY) license (https://creativecommons.org/licenses/by/4.0/).