Article

Cotton-YOLO: A Lightweight Detection Model for Falled Cotton Impurities Based on Yolov8

College of Mechanical Engineering, DongHua University, Shanghai 201600, China
*
Author to whom correspondence should be addressed.
Symmetry 2025, 17(8), 1185; https://doi.org/10.3390/sym17081185
Submission received: 1 July 2025 / Revised: 18 July 2025 / Accepted: 22 July 2025 / Published: 24 July 2025
(This article belongs to the Section Computer)

Abstract

As an important pillar of the global economic system, the cotton industry faces critical challenges from non-fibrous impurities (e.g., leaves and debris) during processing, which severely degrade product quality, inflate costs, and reduce efficiency. Traditional detection methods suffer from insufficient accuracy and low efficiency, failing to meet practical production needs. While deep learning models excel in general object detection, their massive parameter counts render them ill-suited for real-time industrial applications. To address these issues, this study proposes Cotton-YOLO, an optimized yolov8 model. By leveraging principles of symmetry in model design and system setup, the study integrates the CBAM attention module—with its inherent dual-path (channel-spatial) symmetry—to enhance feature capture for tiny impurities and mitigate insufficient focus on key areas. The C2f_DSConv module, exploiting functional equivalence via quantization and shift operations, reduces model complexity by 12% (to 2.71 million parameters) without sacrificing accuracy. Considering angle and shape variations in complex scenarios, the loss function is upgraded to Wise-IoU for more accurate boundary box regression. Experimental results show that Cotton-YOLO achieves 86.5% precision, 80.7% recall, 89.6% mAP50, 50.1% mAP50–95, and 50.51 fps detection speed, representing a 3.5% speed increase over the original yolov8. This work demonstrates the effective application of symmetry concepts (in algorithmic structure and performance balance) to create a model that balances lightweight design and high efficiency, providing a practical solution for industrial impurity detection and key technical support for automated cotton sorting systems.

1. Introduction

In the complex systems of nature and industrial production, the principle of symmetry always plays a key role in revealing laws and optimizing processes. As an important branch of the textile industry, cotton spinning occupies a basic position in the national economy [1]. In 2024, China’s cotton output reached 6.164 million tons, up 9.7% year on year, with Xinjiang contributing 5.686 million tons as the main producing region, accounting for 92.3% of the country’s total output. Cotton, as one of the most important natural fibers in the world, is not only the core raw material of the textile industry, but also an important economic crop. During the processes of cotton harvesting, transportation and processing, some non-fibrous substances that do not belong to cotton, namely, cotton impurities, are often mixed in [2]. The fiber quality and impurity content of cotton form a pair of “symmetrical contradictions”. The fiber quality of cotton directly affects the quality of textile products, while the impurity content is directly related to processing costs and production efficiency [3]. However, the current cotton sorting process is facing considerable challenges. The existing sorting methods mainly rely on manual labor, which is inefficient and has difficulty meeting the growing market demand and the processing requirements of high-quality cotton. Although there are already improved techniques abroad, their core technologies have long been monopolized and the equipment costs are high, making it difficult for them to become widespread in domestic cotton spinning enterprises. The asymmetry between this technology and demand urgently calls for a fast and accurate method to detect impurities in falled cotton, thereby increasing the efficiency and quality symmetries in the cotton processing flow, and providing support for, and guaranteeing, subsequent cotton processing.
Researchers have conducted extensive studies on the detection of impurities in cotton. Currently, the commonly used methods mainly include traditional image processing methods, traditional machine learning methods and deep learning methods.
Traditional methods rely on manually designed image features and algorithmic rules, and realize impurity detection through preprocessing, feature extraction and threshold segmentation. Ding et al. [4] can accurately detect common impurities based on the Gabor filter, Otsu method and morphological filtering. Xia et al. [5] used the Canny algorithm to distinguish impurities and raw cotton through gray second-order differentiation, gradient threshold selection, non-maximum suppression and morphological operations. He et al. [6] used wavelet transformation, regional average gradient threshold and multi-scale discrimination to detect cotton knot impurities. Li et al. [7] constructed an RGB three-dimensional color model and combined nonlinear dual-threshold and differential algorithms to realize fine impurity detection. Some studies are based on near-infrared spectroscopy technology. For example, Li et al. [8] constructed a spectrum acquisition system, and improved the prediction accuracy through the SELU activation function and standardized preprocessing. Zhou et al. [9] used MSC to preprocess spectral data and combined it with the PLSR algorithm to construct an impurity content prediction model.
Although traditional methods are effective in simple scenes, their insufficient feature generalization ability is prominent when facing industrial-grade complex backgrounds (such as cotton wool texture interference and impurity scale differences), prompting researchers to turn to deep learning methods. At present, deep learning object detection algorithms have been widely used in the field of cotton processing. Yolo (You Only Look Once) is a representative single-stage object detection algorithm, which is famous for its real-time performance and high accuracy. The core idea is to transform object detection into a regression problem, and directly predict the location and category of the object through a single forward inference, which significantly improves the detection speed [10]. Yolov1 creates a single-stage real-time detection framework, but its accuracy is limited. Yolov2 improves stability with anchor boxes and multi-scale prediction. Yolov3 introduces a Darknet-53 backbone and feature pyramid to enhance multi-scale detection. Yolov4 integrates CSPDarknet53, spatial pyramid pooling, and systematic training strategies. Yolov5 uses the CSPDarknet53 architecture, optimizes the SPPF module and relies on the anchor-based mechanism to obtain high flexibility, but generates model redundancy due to anchor box dependence. Yolov6 turns to anchor-free design and uses RepVGG to reparameterize the backbone and decouple the detection head to improve efficiency, but its lightweight ability is insufficient. The unified framework of yolov8 is an anchor-free paradigm with full task compatibility. Through C2f cross-stage feature fusion and other optimization of bounding box regression, the mAP is 5–10% higher than that of the previous generation, and it also supports multi-task expansion and efficient deployment [11]. Zhang et al. [12] proposed a cotton weed detection method based on the improved Canny operator and yolov5 neural network, which effectively improved the detection speed and accuracy. Xu et al. [13] proposed an anchor-free lightweight detection network model based on the improved yolov4-tiny to improve the recognition rate of white and near-cotton color impurities in raw cotton. Li et al. [14] improved the accuracy and speed of impurity detection by enhancing the backbone network and header network of yolov7. Zhou et al. [15] integrated the context enhancement module and selective kernel attention into the yolov5s model to improve the overall efficiency, but ignored the number of parameters of the model. Zhang et al. [16] used the multi-channel fusion segmentation algorithm and the improved yolov4 model to realize the detection of cotton impurities and the calculation of impurity rate. Although the goal was achieved in the detection function, the model volume and detection speed were not specifically optimized. Jiang et al. [17] proposed a cotton impurity instance segmentation algorithm based on yolov8s-Seg to realize the pixel-level segmentation of cotton and impurities. However, the model has a large number of parameters and the mAP50 index is 80.8, so there is still room for improvement in model lightweight and detection accuracy. The yolov5-U-Net++ model proposed by Feng et al. [18] shows high performance in cotton foreign fiber detection, al-though the accuracy is 98.80%, the model size is as high as 94.2 MB, and the lightweight performance needs to be further improved. Aiming at the problems of complex shapes and large scale differences of cotton impurities, Wang et al. [19] improved the yolov5 model by introducing an adaptive anchor box algorithm, embedding the MCA attention mechanism in the feature fusion layer, and using the GIoU loss function to optimize the matching accuracy, which effectively improved the performance, but the number of parameters was still 7.06 M, and the model simplicity needed to be optimized. Liu et al. [20] introduced the GhostBottleneck module and SoftPool structure into the yolov5 model, which improved the detection accuracy by 2.59% while reducing the model volume, providing a feasible idea for balancing model lightweight and detection accuracy, but there is still room for improvement in the targeted optimization of carding machines dropping cotton impurities. Zhang et al. [21] used a BP neural network combined with selection, crossover and mutation operations of the genetic algorithm in YCbCr color space to optimize the weights and thresholds of the neural network, and the impurity detection rate reached 92.3%. Han et al. [22] proposed a raw cotton impurity detection algorithm based on residuals and an attention mechanism. The visual attention mechanism was introduced into the Faster RCNN network, ResNet50 was used as the feature extraction network and RoIAlign was used to reduce the quantization error. Xu et al. [23] cut the redundant structure of a MobileNetV3 network and deployed an improved receptive field module in the pooling layer. The experimental results show that the detection of a single image takes 0.02 s and the average accuracy rate reaches 89.05%.
Although object detection technology has made important progress in the field of clutter detection, its industrial application still faces many technical challenges. Traditional image processing methods are not robust to illumination changes and impurity morphology diversity, and need to rely on much manual parameter adjustment, which is difficult to adapt to complex scenes of industrial pipelines. The method of combining near-infrared spectroscopy technology with traditional machine learning requires professional spectrum acquisition equipment, and it cannot locate the spatial position of impurities, which is difficult to meet the needs of “detection–sorting” integration. Although the deep learning models represented by yolo and Faster RCNN perform well in general detection, their inherent defects due to a large number of parameters and high computational complexity make it difficult to meet the strict requirements of real-time and low power consumption in industrial scenarios. In particular, the existing models have obvious deficiencies in feature representation ability and spatial context modeling in dealing with the key problems such as missing detection of small impurities, misidentification of adhesion targets, and poor adaptability to morphological variations, which are common in cotton spinning production lines. Therefore, it is necessary to further study the design method of lightweight models for balancing detection accuracy and reasoning efficiency.
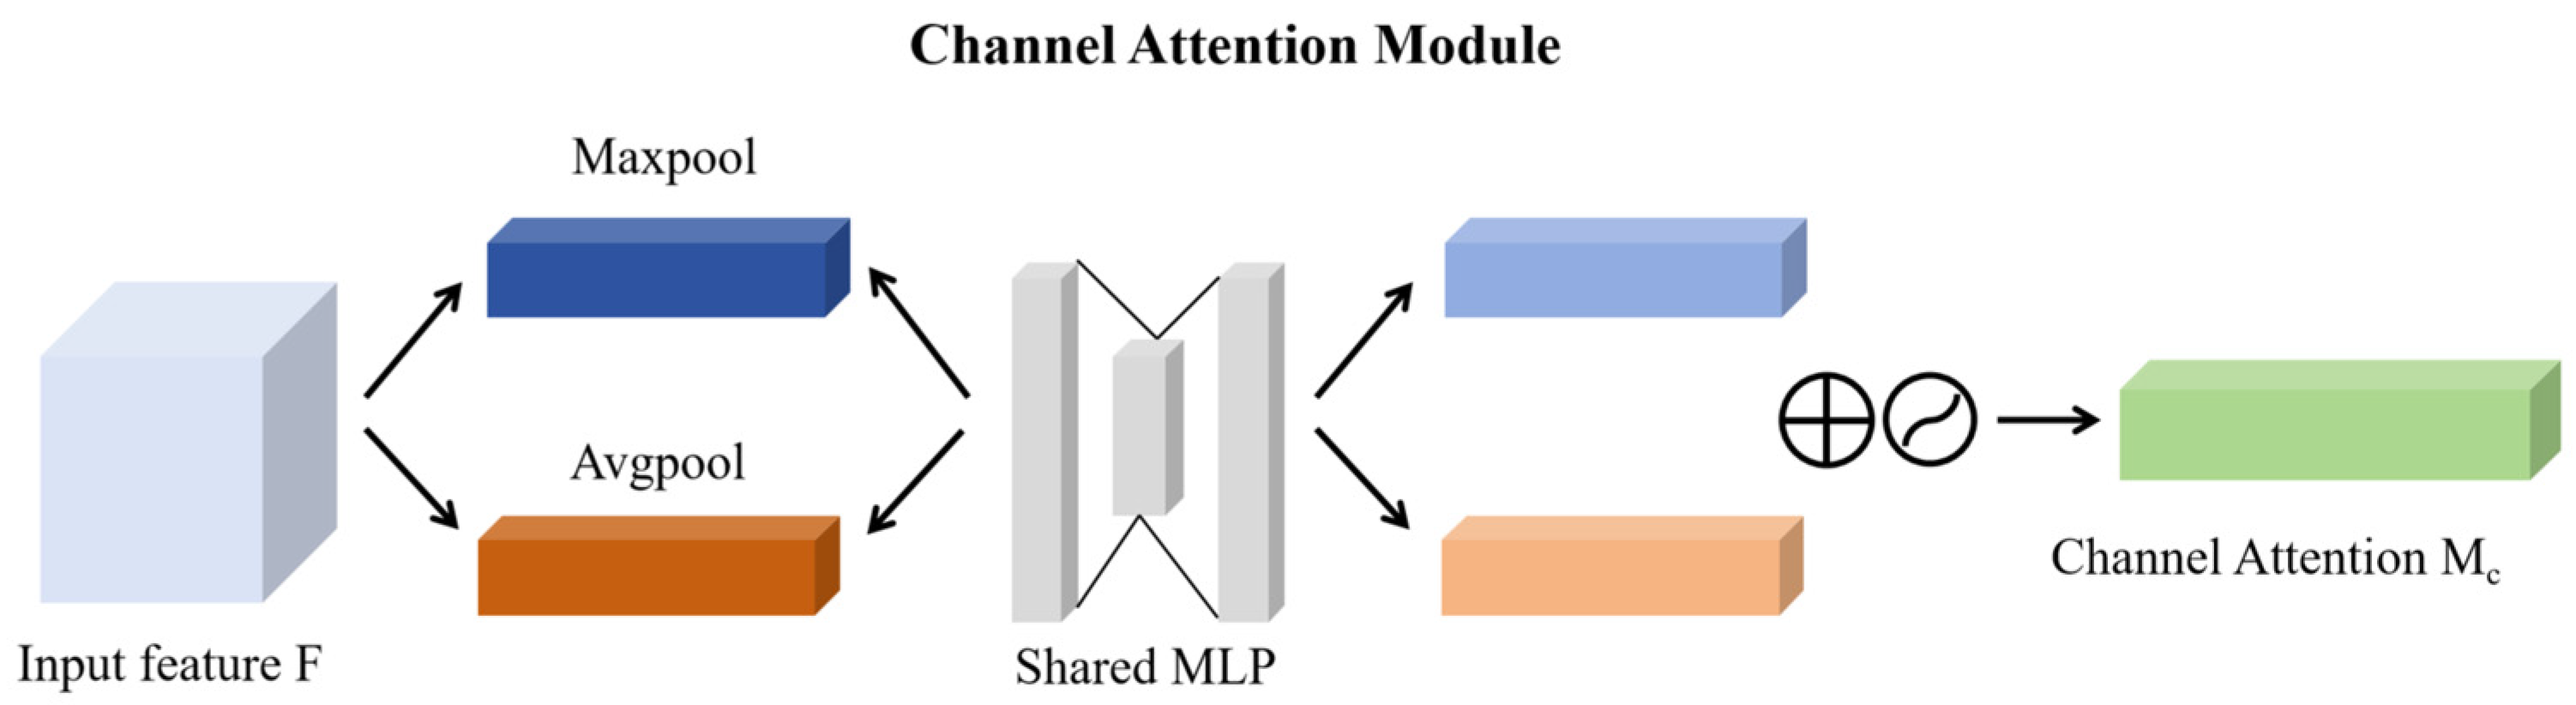
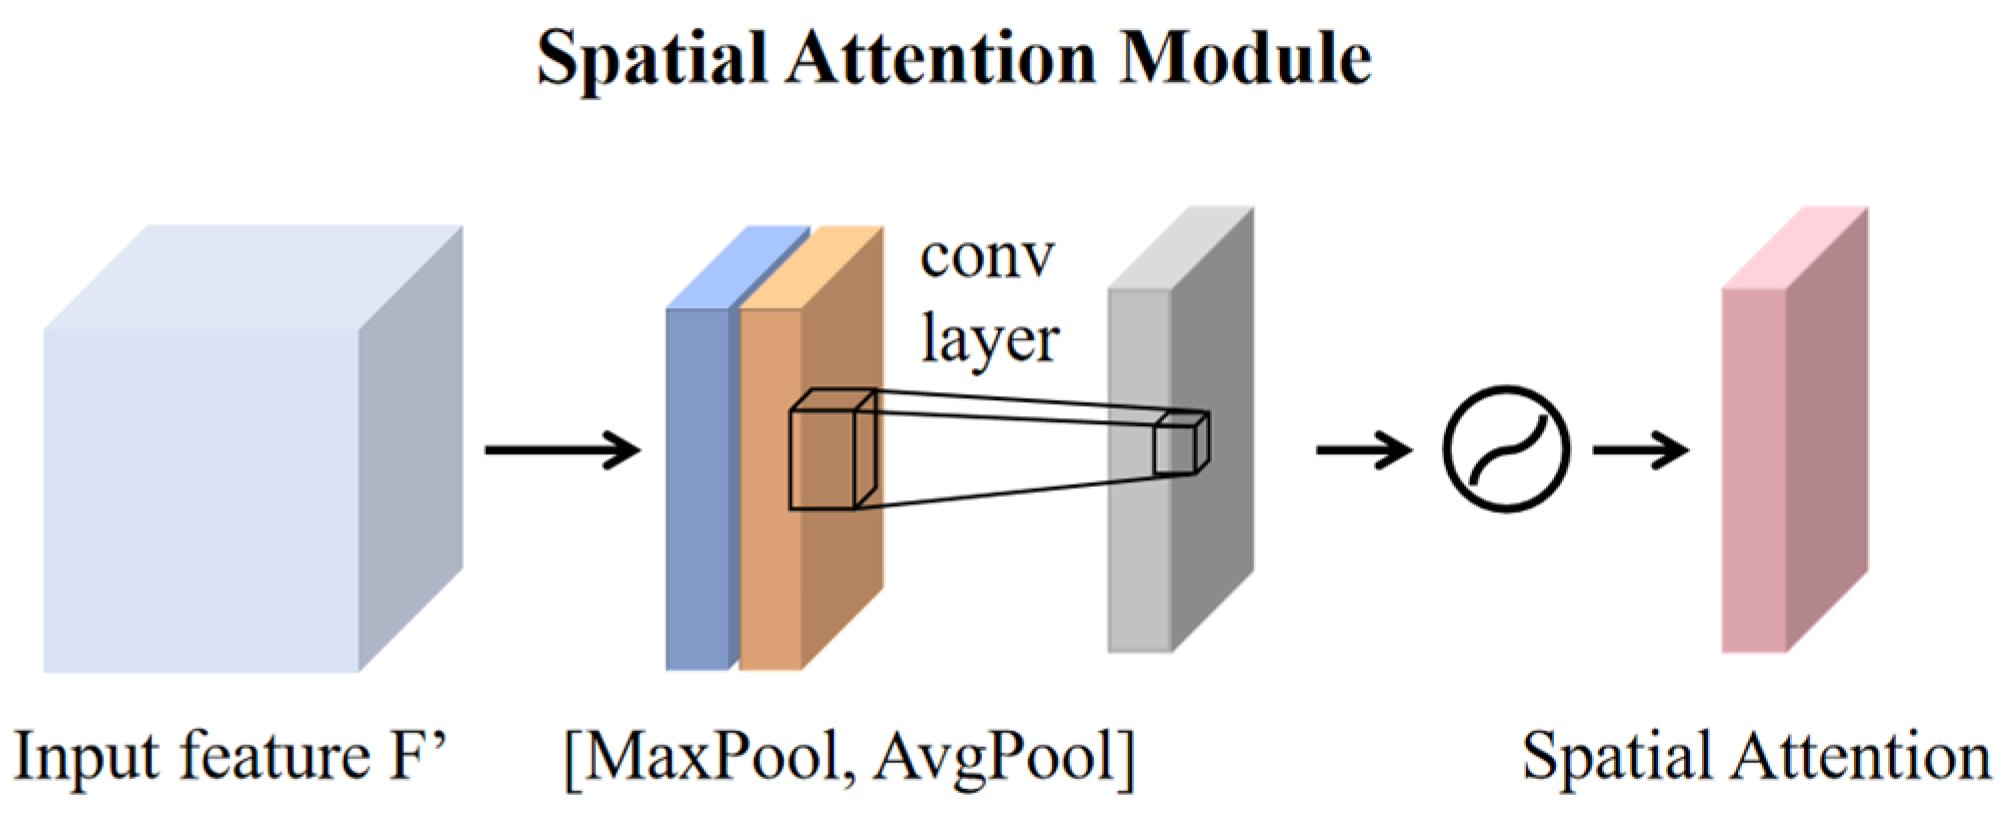
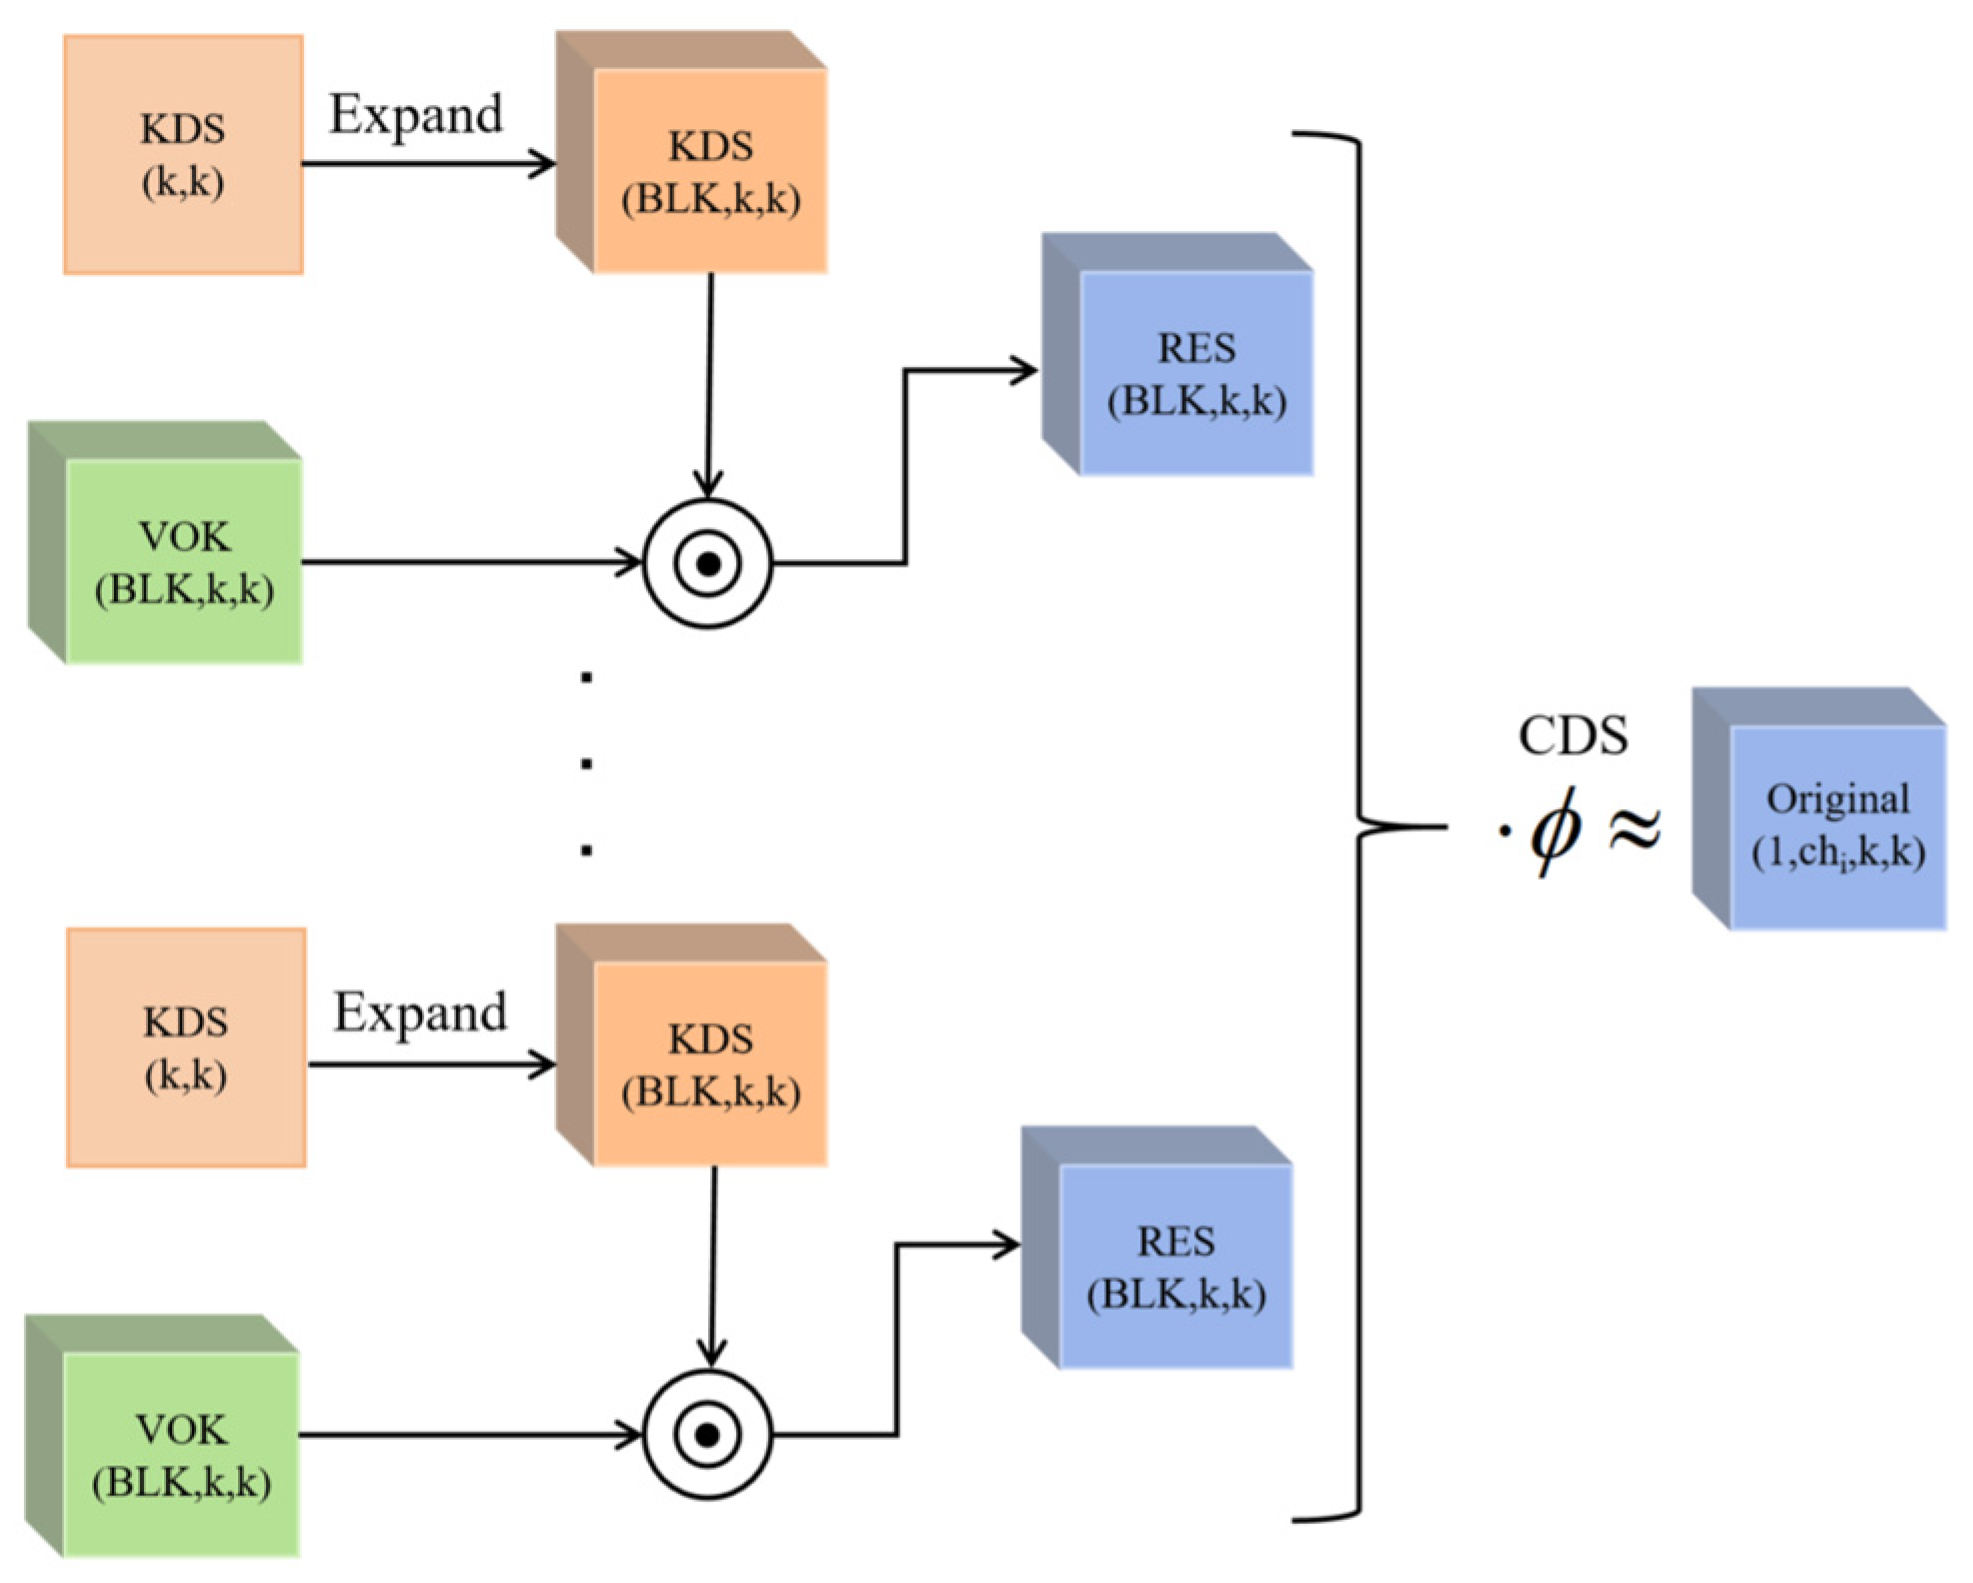
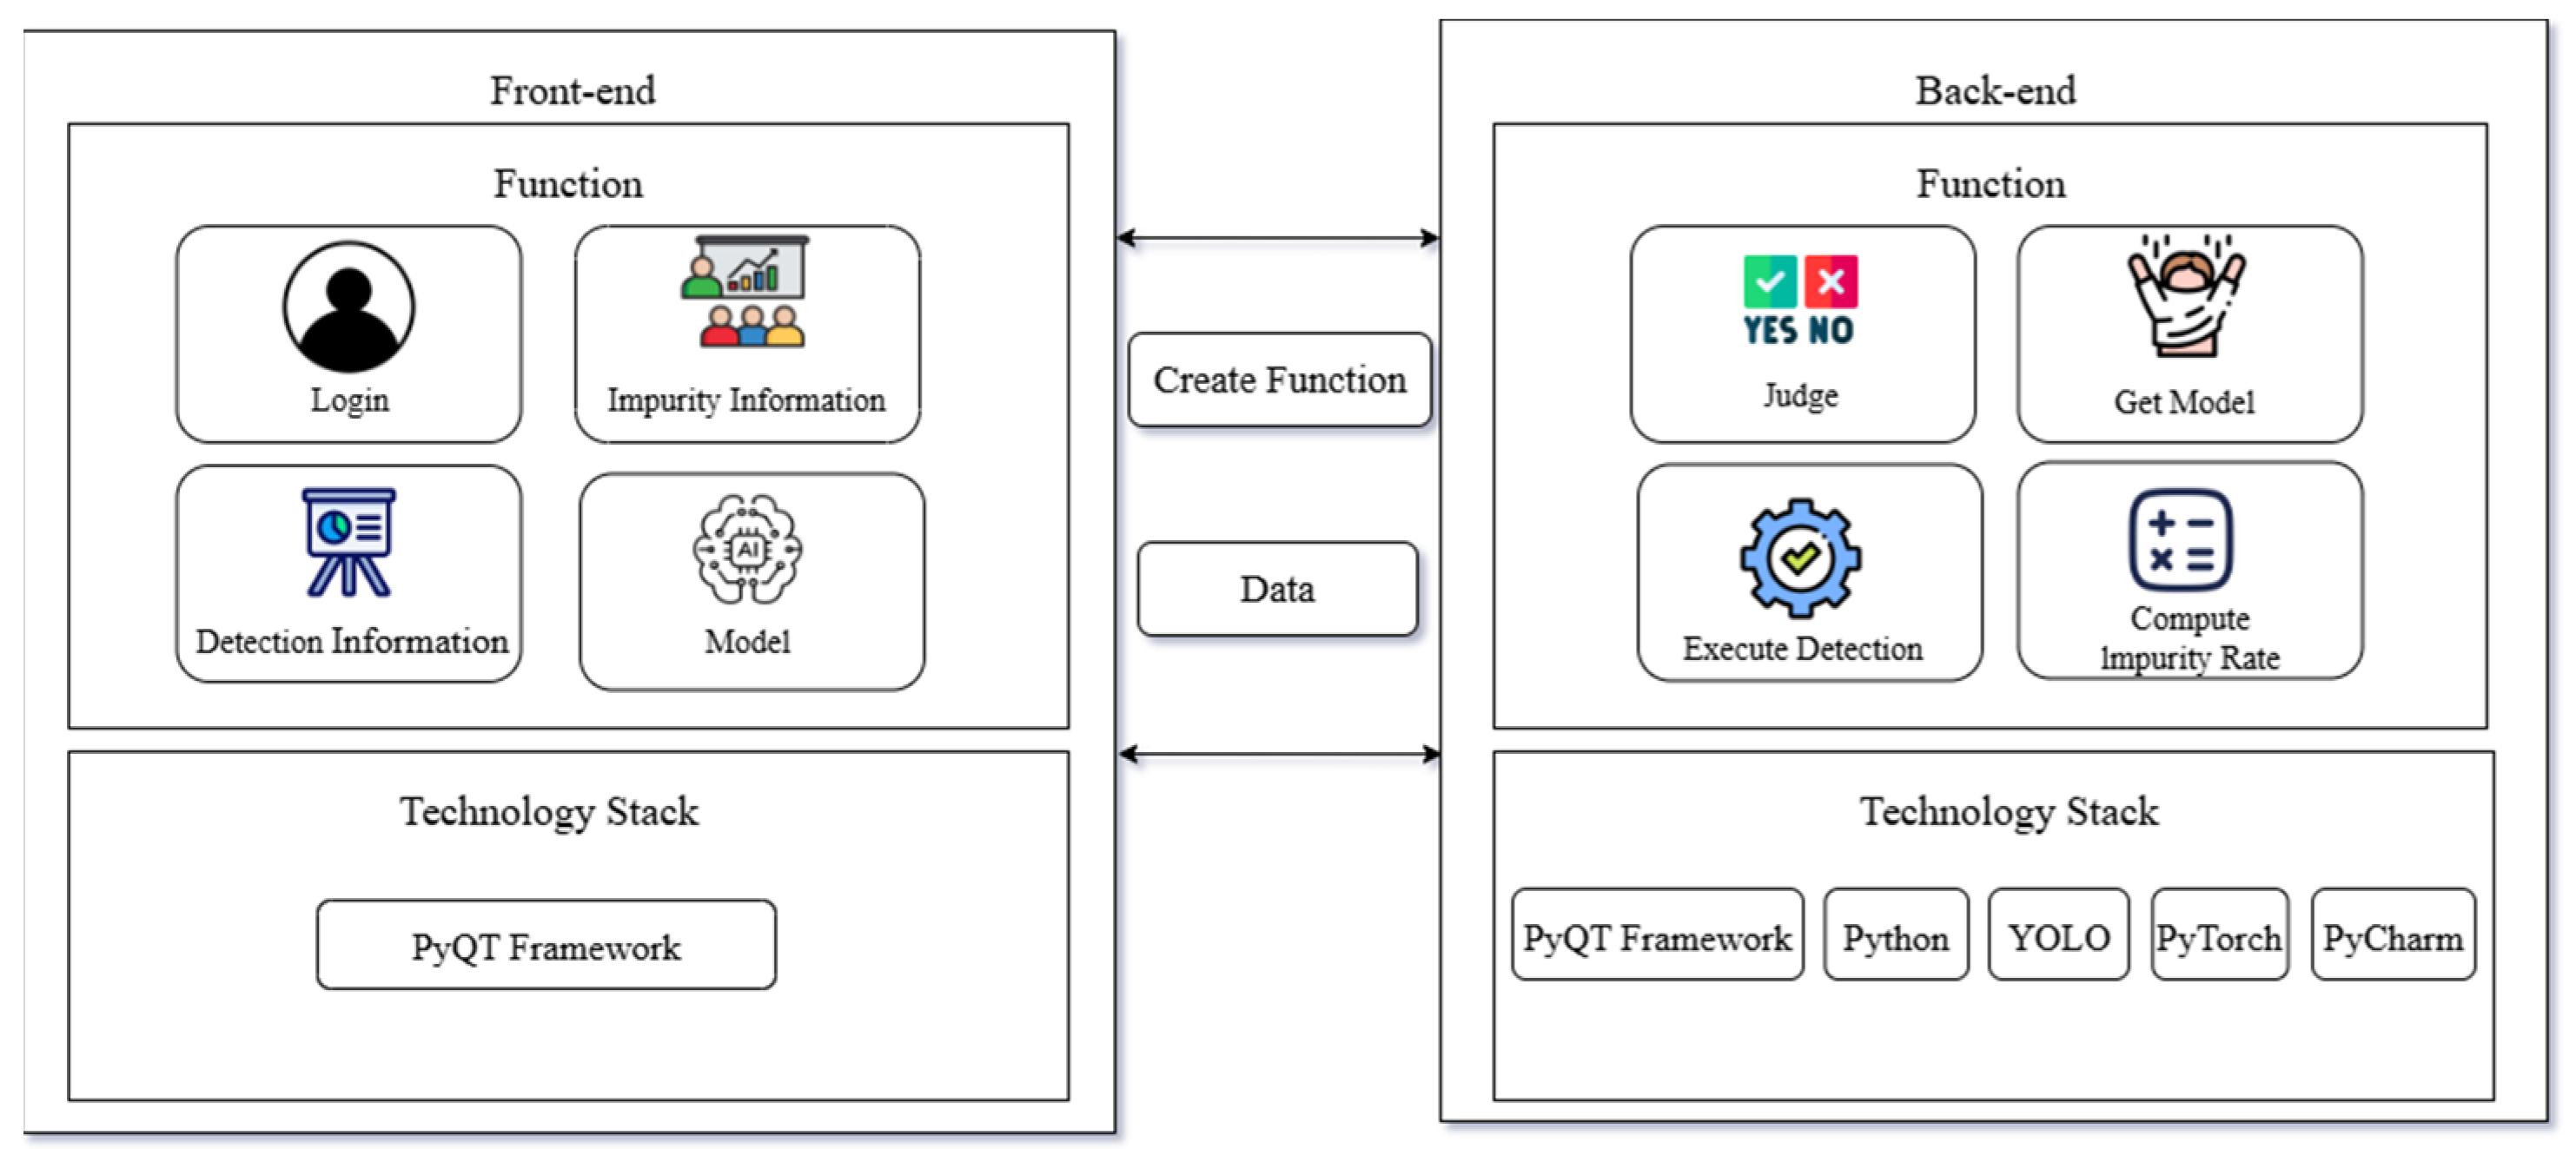
In this study, based on the previous research on falled cotton impurity detection and the successful application of the yolo series of algorithms in the field of agriculture, we address the problems of the existing models in terms of insufficient feature characterization capability (missed detection of tiny impurities), inefficient computation (arithmetic limitations of industrial equipment), and poor localization robustness (overlapping and false detection of impurities), and propose an improved model—Cotton-YOLO—based on yolov8, through the effective application of symmetry concepts in the algorithmic structure and performance balancing. Cotton-YOLO is a falled cotton impurity detection model based on yolov8. The CBAM attention module is introduced to dynamically suppress the interference of cotton wool and enhance the characteristics of small impurities through the channel and spatial coordination mechanism. The C2f_DSConv lightweight structure was used to replace the standard convolution with the Distributed Shift convolution (DSConv), and the Variable Quantization Kernel (VQK) and Distributed Shift operation (KDS/CDS) were used to reduce the number of parameters and computational redundancy by 12%. While maintaining the ability of multi-scale feature fusion, the model could be run on low-power devices. The inference speed is 50.51 fps. The Wise-IoU loss is improved, and the bounding box regression is optimized by the dynamic outlier mechanism. Compared with the improved intersection and union loss such as GIoU and DIoU, it can more accurately measure the geometric and distribution differences between the predicted box and the real box when dealing with the overlap of falled cotton impurities, scale differences and irregular shapes. We develop a visual detection platform to automate the entire process from image acquisition to impurity rate calculation, meeting real-time detection requirements and providing a symmetrical solution that balances efficiency and light weight for cotton impurity detection.

2. Methodology

In this study, we firstly design and build an experimental platform for collecting the relevant datasets of cotton impurities; then, we collect and pre-process the original images and complete the annotation work to construct the standardized training data; then, we carry out the model selection and optimization, carry out the targeted improvement of the yolov8 model, and verify the optimization effect through multiple sets of comparative experiments; after that, we calculate the content of the impurities in the cotton fall; then, we design the visualization platform interface based on the improved Cotton-YOLO model. After that, the impurity content in falled cotton is calculated; finally, the interface of the visualization platform is designed based on the improved Cotton-YOLO model, and the specific steps are shown in Figure 1.

2.1. Design and Construction of the Drop-In Detection Platform

2.1.1. Sample Collection

The samples adopted in this research, as shown in Figure 2, are falled cotton (including cotton and impurities) collected from the actual production site. All of them are derived from the falled cotton generated in the first impurity zone during the operation of the JFM1203 carding machine. This machine is produced by Qingdao Hongda Textile Machinery Co., Ltd. (located in Qingdao, China) and used by multiple textile enterprises. The research samples were mixed from the falled cotton collected by the above-mentioned different enterprises. This study focuses on the detection of the amount of impurities under the standard production conditions of the card, which can include soil, leaves and branches, collectively referred to as impurities.

2.1.2. Design of the Falling Debris Image Acquisition System

The image acquisition system consists of a camera, a computer, a light source and a support frame. The camera is a MotionBLITZCube4 model, which is the only grayscale camera that can meet the requirements of impurity target detection. At the same time, it can effectively reduce the computational load, and the grayscale image meets the core requirements of industrial scenarios for high frame rate and low computational load. The light source is a ring-shaped shadowless LED light source, which provides uniform, stable light and reduces the impact of image shadows and reflections on the results. The computer is connected to the camera for collecting and storing image data. The camera is mounted on a support frame, and the shooting angle and height can be adjusted according to actual needs. The schematic diagram of the image acquisition system in Figure 3 shows the connection and layout relationship of the components.

2.2. Data Acquisition and Pre-Processing

2.2.1. Image Pre-Processing

In this study, an image acquisition system was used to collect images of falled cotton samples, and a total of 1000 images in JPG format with a size of 1280 × 1064 pixels were acquired. Considering that some irrelevant information exists in the original images, which may affect the efficiency of model training and detection accuracy, image cropping and background separation are applied to the original images. By accurately defining the effective region of the image and removing the blank part of the edge and irrelevant background, the image used for model training is finally obtained, which provides more valuable input data for subsequent model training.

2.2.2. Data Labeling

The accuracy of dataset labeling directly affects the accuracy of impurity target detection. The impurities in the images were marked by one highly trained person using the Labelimg software (version 1.8.6), as shown in Figure 4 below. After the annotation is completed, the sampling inspection is carried out by multiple professionals to ensure the accuracy of the annotation. The labeled file is saved in .txt format, and each line corresponds to an impurity target, containing information such as target category number, center coordinates and width to height ratio, thus constructing the falled cotton impurity detection dataset. In order to ensure the effectiveness of model training and generalization ability, the dataset is divided into a training set and a test set in the ratio of 8:2, where the training set contains 800 images and the test set contains 200 images.

2.3. Presentation of Cotton-YOLO

This study is oriented towards the detection of falled cotton impurities in industrial scenarios, so the network is required to have a faster detection speed as well as a higher detection accuracy, so the yolo series is chosen as the base model in this study. As discussed in the previous section, compared with the anchor frame redundancy of yolov5 and the multitasking limitation of yolov6, yolov8 has a streamlined structure and adopts a dynamic computation strategy to reduce the number of parameters, which is easy to integrate and optimize. Therefore, yolov8 is chosen as the base model in this study.
The Cotton-YOLO model is improved based on yolov8, aiming to improve the performance of falled cotton impurity detection, and its network structure is shown in Figure 5 below. The overall structure incorporates the CBAM attention module and the C2f_DSConv module on the basis of yolov8, while the loss function is improved to enhance the detection of tiny impurities, reduce the model complexity and improve the positioning accuracy.

2.3.1. CBAM Attention Module

In production operations, the features of tiny impurities in the images of falled cotton impurities are easily overwhelmed by the complex texture of lint fibers, and the spatial distribution of impurities in different regions varies significantly. The traditional feature extraction network of yolov8 lacks the ability to focus on key regions, resulting in insufficient expression of small target features. For this reason, the CBAM (Convolutional Block Attention Module) is introduced to dynamically enhance the key region features through the channel and spatial dual attention mechanism through the channel and spatial dual attention mechanism [24]. The CBAM module is highly efficient and lightweight, and it can be integrated into a variety of convolutional neural network architectures; the structure is shown in Figure 6 shown.
(1)
Channel Attention Module
The channel attention module enhances the network expression capability by focusing on the importance of channel dimension features; its implementation process is shown in Figure 7: Firstly, global maximum pooling and global average pooling are performed for each channel of the input feature map, and two feature vectors characterizing the global maximum response and average response at the channel level are generated. Then, the two vectors are input into the fully-connected layer shared by the parameter for the nonlinear transformation, and their output vectors are integrated into the channel statistics element-by-element by means of the weights. Then, the two vectors are nonlinearly transformed into a fully connected layer with shared input parameters to merge the advantages of the two pooled features through a weight-sharing mechanism, and their output vectors are summed up element-by-element to integrate the channel statistical information; subsequently, the merged features are mapped to the [0, 1] interval through a sigmoid function to generate the channel-attention weight vector M c ( F ) , which quantifies the importance of each channel.
M C F = σ M L P a v g F a v g + M L P max F max
where σ is the sigmoid activation function, F a v g and F m a x are the global average pooling and maximum pooling results, respectively, and MLP is the multilayer perceptron.
Finally, this weight vector is multiplied with the original feature map at the channel level to achieve reinforcement of critical channels and suppression of non-critical channels.
(2)
Spatial Attention Module
The spatial attention module improves the network’s ability to perceive salient regions by capturing the relationship features between spatial locations. The implementation logic is shown in Figure 8. Firstly, the global Max pooling and average pooling operations are performed on the input feature maps along the channel dimension, respect-ively, to generate two single-channel two-dimensional feature maps. Then, the two feature maps are concatenated into dual-channel features along the channel dimension, and sent to the convolutional network containing the standard convolution layer for spatial context modeling, and the attention distribution of the spatial dimension is learned through convolution operation. The sigmoid function activation is then applied to the single-channel feature map output by the convolution to generate an attention weight matrix M s ( F ) with each pixel position in the interval [0, 1].
M S F = σ f 7 × 7 F a v g s ; F max s
where [ · ; · ] denotes the channel splicing operation, f 7 × 7 is the 7 × 7 convolutional kernel, and F a v g s and F m a x s are the channel dimensional average pooling and maximum pooling results, respectively.
Ultimately, this weight matrix is multiplied position-by-position with the original feature map to achieve the effect of dynamically adjusting the feature response according to spatial importance.

2.3.2. C2f_DSConv Modul

Although the C2f module of yolov8 is lighter than C3, there is still computational redundancy in the standard convolution in its Bottleneck structure. In the production operation, the detection of falled cotton impurities needs to balance real-time and accuracy, so it is necessary to reduce the complexity of the model while maintaining the ability of multi-scale feature fusion. For this reason, the standard convolution is replaced by DSConv, which reduces the computational cost through quantization and dynamic distribution offset.
DSConv (Distribution Shift Convolution), proposed by Nascimento et al. [25] in 2019, is a lightweight convolutional operation method specifically designed to improve memory access efficiency and runtime speed. The core idea is to adapt the statistical properties of the input features by dynamically adjusting the weight distribution of the convolution kernel, thus improving the generalization ability and computational efficiency of the model. Differently from the traditional convolution, DSConv decomposes the standard convolution into the following two parts, as shown in Figure 9: Variable Quantized Kernel (VQK) and Distribution Offset Operation. The Variable Quantized Kernel quantizes the floating-point tensor in the weights to integers, thus reducing memory usage and computation time; at the same time, it maintains the same output as the original convolution by applying Kernel Distribution Shift (KDS) and Channel Distribution Shift (CDS).
The VQK quantizes the original floating-point model parameters into integer parameters with variable numbers of bits and keeps them with the same data dimensions as the original convolution (number of input channels, number of output channels, convolution kernel height, convolution kernel width). In the quantization process, the number of bits to be quantized by the input network is entered, and the new integer weights wq are obtained after Equation (3) and stored in the VQK for subsequent training and inference. Compared to the original floating-point model parameters, the integer-type parameters are more lightweight.
w q Z 2 b 1 w q 2 b 1 1
where wq denotes the value of each parameter in the tensor; b denotes the number of bits.
In this study, the convolution in the Bottleneck structure of the C2f module is replaced with DSConv to obtain the C2f_DSConv module, which is shown in Figure 10. This operation reduces the number of parameters and operations and improves the running speed of the model.

2.3.3. Wise-IoU Losses

In the target detection task, the traditional IoU (Intersection over Union) loss function has poor regression effect when dealing with target overlap or large-scale differences. In the scenario of falled cotton impurity detection, the shape of the impurity presents irregular characteristics, and the distribution of the impurity in different regions is complex, with a large number of overlapping phenomena, which makes it difficult for the traditional IoU loss function to accurately measure the difference between the predicted frame and the real frame. Therefore, in this paper, Wise-IoUv3 version is used as a new loss function to balance the model training results of images with different qualities and obtain more accurate detection results [26]. The schematic diagram of the WIoU parameters is shown in Figure 11. There are three versions of WIoU, namely, WIoUv1, WIoUv2 and WIoUv3, and the v1 version introduces a two-layer attention mechanism [27]. It enhances the attention to specific quality anchor frames by dynamic adjustment.
WIoUv3 is formed on the basis of WIoUv1 and WIoUv2, i.e., by constructing the non-monotonic focusing coefficients r and WIoUv1 through the degree of outliers β. The WIoU formula is as follows:
L W I o U V 1 = R W I o U L I o U
R W I o U = exp x x g t 2 y y g t 2 W g 2 + H g 2 *
L W I o U V 3 = r L W I o U V 1
β = L * I o U L I o U 0 , +
r = β δ β δ
where x, y denote the coordinates of the center of the prediction frame; xgt, ygt denote the coordinates of the center of the real frame; Wg, Hg denote the width and height of the included prediction frame as well as the real frame; the superscript * in (Wg2 + Hg2)* denotes that the Wg, Hg are separated from the computational graph, which is beneficial for convergence.

2.4. Indicators for the Assessment of the Model

In order to comprehensively and objectively compare the detection performance of the different models in this study on the falled cotton impurity dataset, precision (P), recall (R), mean accuracy (mAP), frames per second (FPS), and parameters (Params) are selected as the core evaluation indexes in this study. Among them, precision (P) reflects the proportion of positive samples predicted by the model to be positive samples, which is used to measure the prediction accuracy of the model; recall (R) indicates the proportion of positive samples correctly identified by the model to the proportion of all actual positive samples, which is an intuitive reflection of the model’s capability of capturing the target samples; and the mean average precision (mAP) comprehensively evaluates the model’s detection effect under different categories and different confidence levels. The mAP is a comprehensive assessment of the model’s performance in detecting various types of falled cotton impurities, while the frames per second (FPS) characterizes the model’s image processing speed, reflecting the real-time detection efficiency of the model in practical applications. Params represent the total number of parameters to be learned during the model training process, the size of which directly affects the model complexity and training time: fewer parameters means the model structure is more concise and the training efficiency is higher. The formula for these indicators is as follows:
P = T P T P + F P
R = T P T P + F N
m A P = 1 N i = 1 N A P i
where TP denotes the count of positive samples correctly classified as positive, FN denotes the count of positive samples incorrectly classified as negative, FP denotes the count of negative samples incorrectly classified as positive, and TN denotes the number of negative samples classified as negative. N represents the number of target categories.

2.5. Calculation of the Trash Content of Falled Cotton

Falled cotton impurity rate is a core parameter reflecting the degree of impurity removal during cotton processing, and its accurate calculation is of great significance in assessing the effectiveness of the processing process and guaranteeing the quality of the finished product. In this study, we quantify the ratio of the impurity pixels to the total area of the image to achieve the estimation of the impurity rate of falled cotton.
First, by setting a suitable gray-level threshold, pixel points with gray-level values higher than the threshold in the falled cotton image are classified as impurity regions, and pixel points with gray-level values within a threshold interval are classified as cotton fiber regions, so as to achieve the separation of the impurity regions from the cotton fiber regions. The pixel-counting algorithm is used to calculate the impurity rate by accurately calculating the number of pixels in the impurity part of the image and the total number of pixels in the image. The formula for calculating the impurity rate is as follows:
R = N i N t × 100 %
where Ni denotes the number of pixels in the impurity section and Nt denotes the total number of pixels in the image.
The above method can effectively estimate the impurity rate of falled cotton and provide key data support for the design of the visualization interface of falled cotton impurity detection.

3. Case Validation

3.1. Experimental Configuration

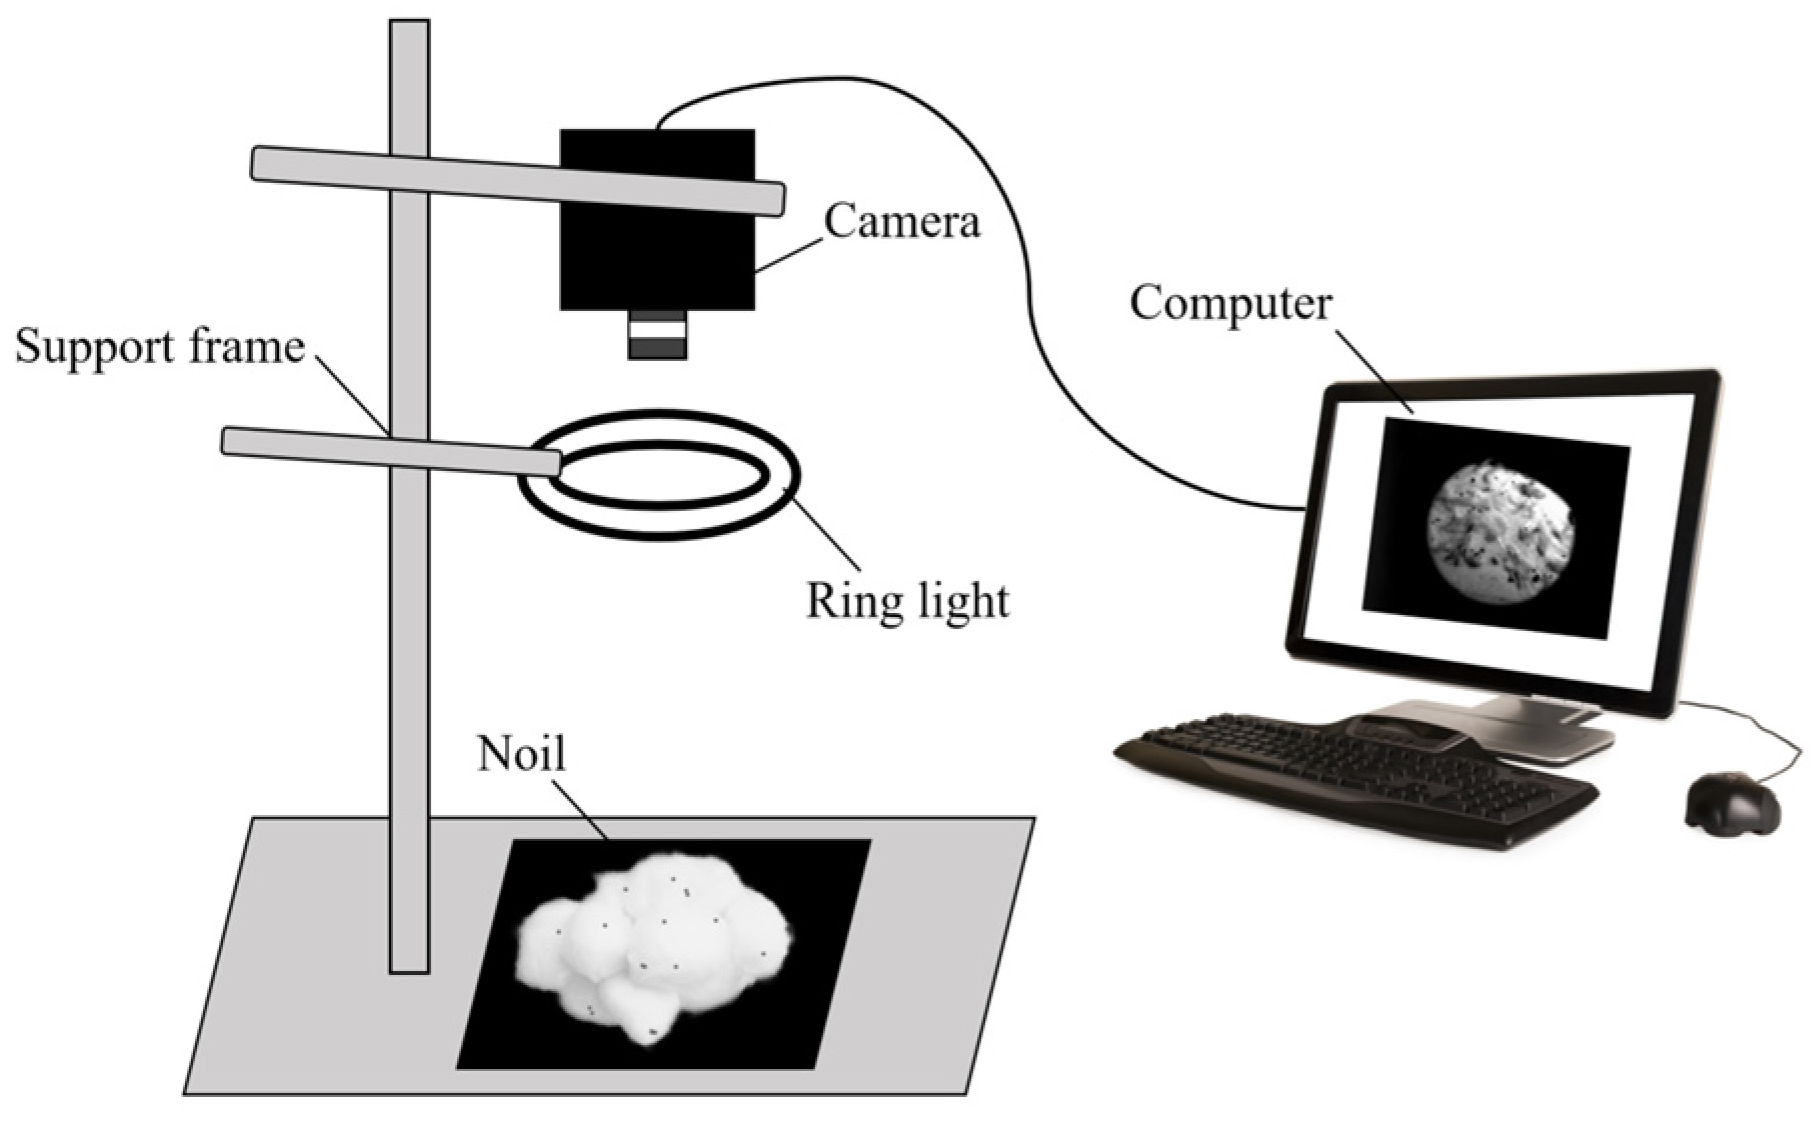
In order to validate the effectiveness of the method used in this study for the detection of falled cotton impurities, 5 kg of dropout cotton was collected from the card processing site and randomly divided into 200 samples; each dropout sample was opened completely to maximize the exposure of foreign fibers, and each sample was of the same weight. A graphical device was then used to capture images of all 200 samples. The hardware platform and software environment used for model training and testing in this study are described in Table 1.
In this study, this paper uses the SGD optimizer to fine-tune the model parameters by initializing the learning rate to 0.01. The training process consists of 200 epochs, where batch size (denoting the number of images trained in each batch) is set to 2. The training and validation losses converge progressively over the course of the 200 epochs, as shown in Figure 12.

3.2. Performance Comparison Experiments for Alternative Models

Cotton-YOLO shows excellent comprehensive performance in impurity detection tasks. This experiment aims to comprehensively evaluate the performance of Cotton-YOLO, an improved lightweight detection model for falled cotton impurities based on yolov8. We select multiple representative object detection models for comparison, including the classic Faster RCNN, lightweight MobileNet-SSD, efficient EfficientDet-D0, and yolo series yolov5, yolov6, yolov8, and yolov8-nano models. Several key performance indicators, such as precision (P), recall (R), mAP50, mAP50–95, number of parameters and FPS, were used to measure the performance of each model in the falled cotton impurity detection task, and the experimental results are shown in Table 2.
The experimental results show that Cotton-YOLO achieved an accuracy rate of 0.865 in the detection task of falled cotton impurities. Although slightly lower than Faster RCNN’s 0.929, compared with MobileNet-SSD’s 0.814, EfficientDet-D0’s 0.79, yolov6’s 0.761 and yolov8-Nano’s 0.811, they were, respectively, 5.1%, 7.5%, 10.4% and 5.4% higher. In terms of recall rate, Cotton-YOLO reached 0.807, which is much higher than other alternative models, indicating that it can detect falled cotton impurities more comprehensively. Furthermore, the performance of mAP50 reached an impressive 0.896, both higher than other comparison models, and was more than 10% higher than Faster RCNN and yolov6, verifying the model’s strong identification ability for impurity features. Meanwhile, mAP50–95 reached 0.501, also surpassing other comparison models and maintained excellent robustness under strict positioning standards. In terms of parameter quantity, the parameter quantity of Cotton-YOLO is only 2,714,105, which is lower than that of all other models except yolov8-Nano, and is much lower than that of Faster RCNN, MobileNet-SSD, EfficientDet-D0 and yolov6. In terms of detection speed, the detection rate of Cotton-YOLO reached 50.51 fps. Although it was slightly lower than the 50.76 of yolov5, it exceeded all the remaining models. Although the accuracy of Cotton-YOLO is slightly lower than that of FasterRCNN, mAP50–95 is only 1% less than yolov5, and the number of parameters is slightly more than that of yolov8-Nano; Cotton-YOLO far exceeds these three models in other aspects. The golden triangle balance of precision, speed and lightweight of Cotton-YOLO makes it have broad practical implementation potential in production scenarios.
Compared with the original yolov8 model, Cotton-YOLO performs better in multiple key performance indicators. In terms of accuracy, Cotton-YOLO is 0.865, which is higher than yolov8’s 0.862. It can bring more accurate results in the detection of falled cotton impurities with high precision requirements. In terms of recall rate, Cotton-YOLO reached 0.807, which is higher than yolov8’s 0.804, enabling the detection of more cotton impurities and enhancing the comprehensiveness of the detection. It has more obvious advantages in terms of the number of parameters and detection speed. In terms of parameter quantity, yolov8 is 3,005,843 and Cotton-YOLO is 2,714,105, a reduction of 12%. It occupies fewer hardware resources and is suitable for deployment on resource-constrained devices. In terms of detection speed, the Cotton-YOLO rate is 50.51 fps, which is 3.5% higher than the 48.78 fps of yolov8. It can process images faster and meet the real-time detection requirements. Although both are 0.896 on mAP50, showing the same performance, Cotton-YOLO has a lower parameter count and a faster detection speed. It can be seen that Cotton-YOLO is more in line with the actual production requirements of falled cotton impurity detection. Figure 13 shows the visual representation of the detection results achieved by Cotton-YOLO.

3.3. Ablation Experiments

Using the same training and validation datasets containing images of falled cotton impurities, this study employs a variety of techniques for model enhancement. The detection results of different models are shown in Figure 14, and the metrics of these experiments are recorded in Table 3. First, the yolov8 + CBAM model, which contains the new CBAM module, shows an increase in precision (P) of about 1%, indicating that the module effectively improves the accuracy of the model in identifying positive samples. The average precision mean mAP50–95 improved by 0.2%, which implies that the model’s integrated detection performance is optimized under different intersection over union (IoU) ratio thresholds. Meanwhile, the frame rate (FPS) is improved by about 4%, showing a significant improvement in the inference speed of the model, but there is a small increase in the number of model parameters. Taken together, the addition of the new CBAM module has a positive impact on the model performance, especially in terms of accuracy and inference speed. In addition the new DSConv module yolov8 + DSConv model, the accuracy rate is improved by about 0.7%, which optimizes the model’s ability to identify positive samples to some extent. In addition, the yolov8 + DSConv model has a significant advantage in the number of parameters, which decreased by about 12% compared with the original model, compensating for the increase in the number of parameters of the yolov8 + CBAM model. The results show that the DSConv module has a positive impact on the model performance. The yolov8 + WIoU model with an improved loss function of Wise-IoU improves recall by about 0.3%, mAP50 by about 0.2%, and mAP50–95 by about 0.1% compared to the original yolov8 model. While maintaining the computational volume (the number of parameters remains unchanged) and inference speed (the frame rate FPS is maintained at 48.78), the model achieves performance improvement in both recall and mean average precision, which fully demonstrates that the Wise-IoU loss function plays a positive role in model optimization.
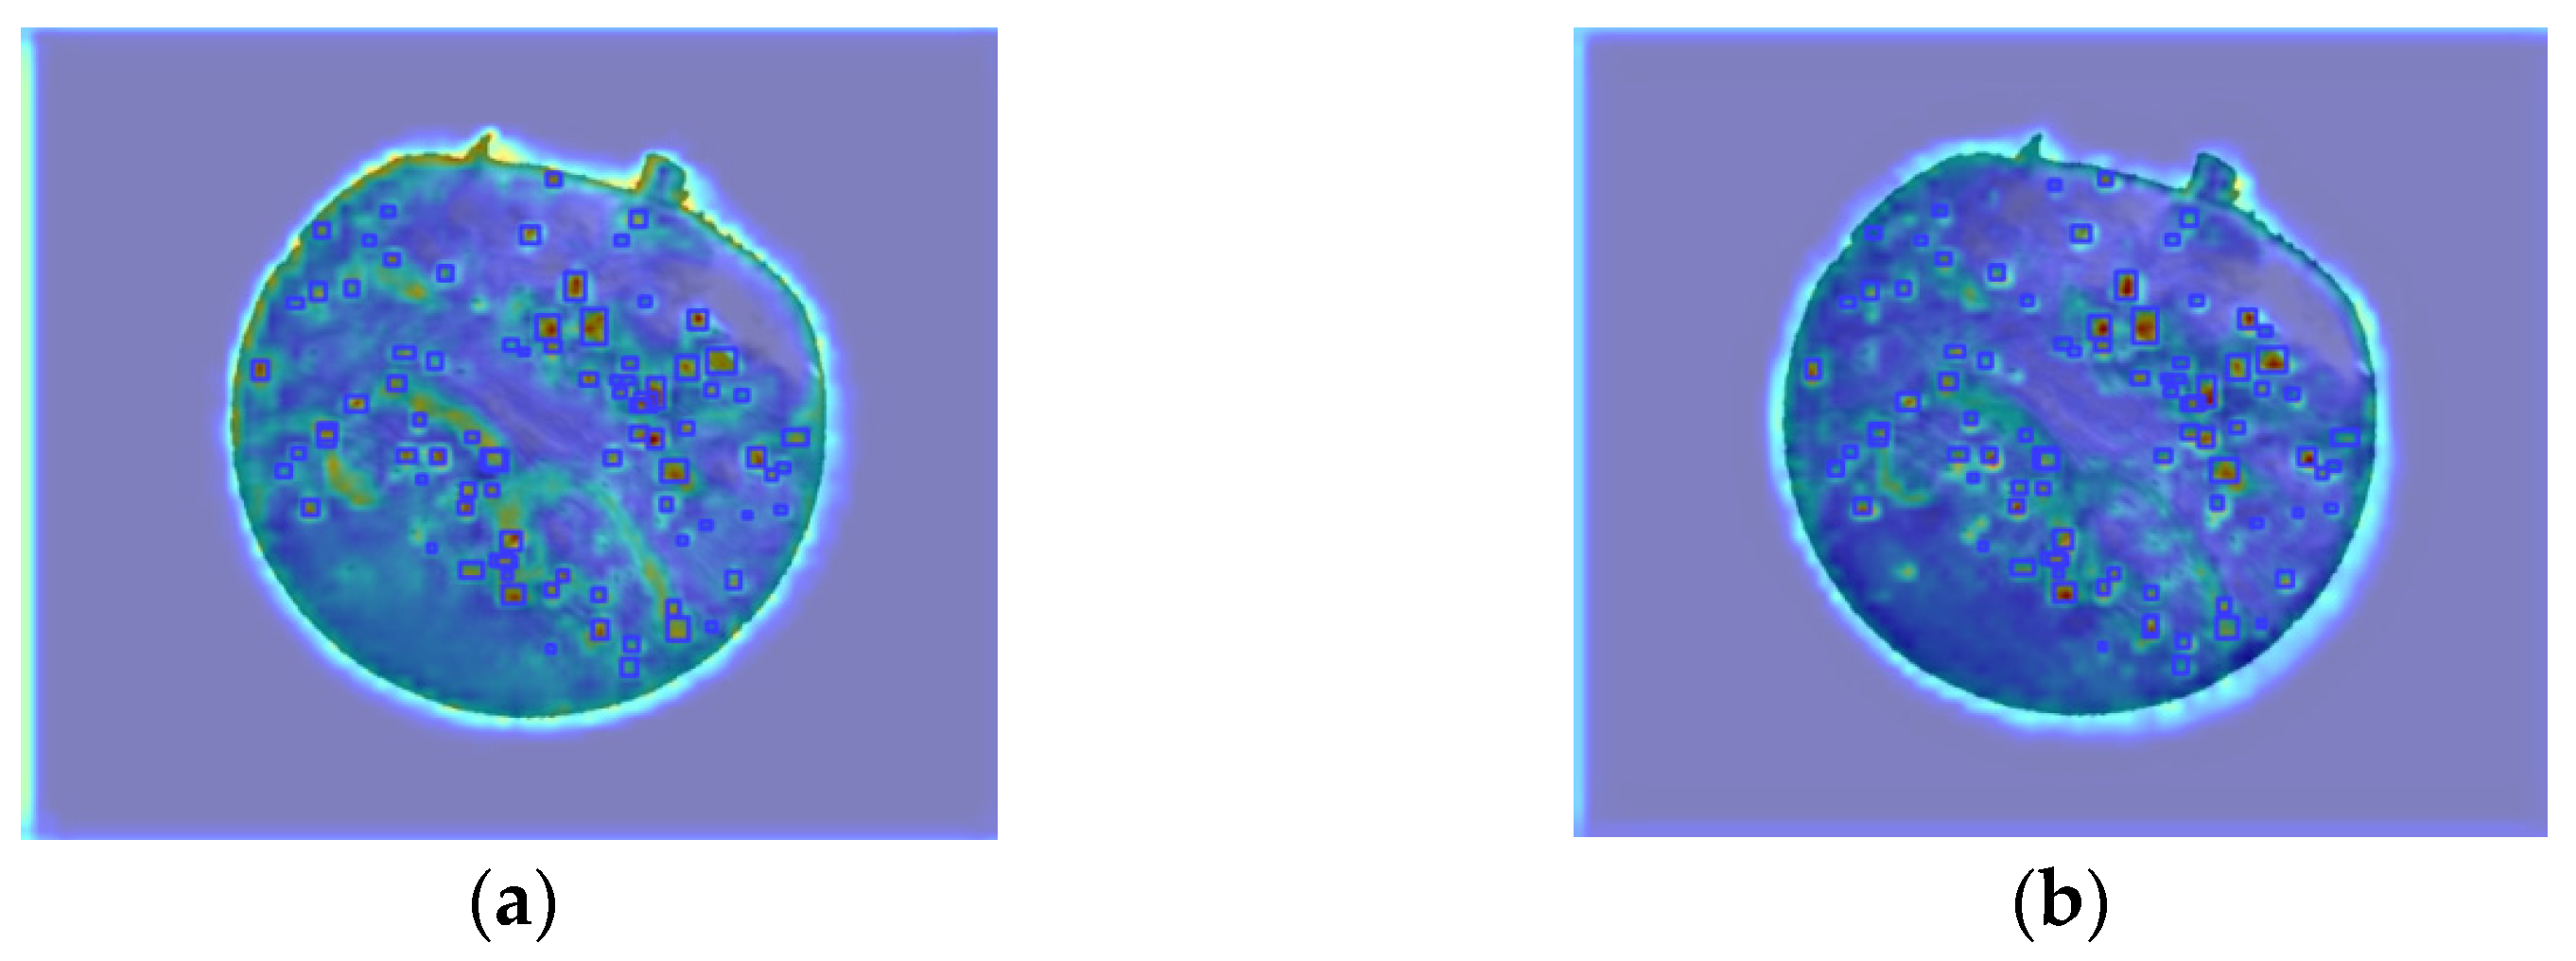
In order to verify the performance of CBAM in the detection of falled cotton impurities, the GradCAM++ method was applied to generate the class activation heat map; the visualization of the heat map before and after adding CBAM attention is shown in Figure 15. As can be seen from the figure, before the introduction of the CBAM attention mechanism, the response of the heat map to the tiny impurities is more scattered, and there are a large number of false activations (darker-colored regions) in the background region of the falled cotton (non-impurity region), indicating that the model has insufficient ability to capture the characteristics of the impurities, and is susceptible to the interference of the complex texture; after the introduction of the CBAM, the heat map is significantly focused on the location of the real impurities, and the false activations in the background region are reduced dramatically, which intuitively proves that CBAM effectively suppresses the background noise and enhances the feature representation of tiny impurities through the synergistic mechanism of channel and spatial attention.

3.4. Discussion of Experimental Results

Experimental analysis shows that the improvement strategy proposed in this study has a significant optimization effect on the performance of falled cotton impurity detection. The CBAM module significantly enhances the ability to capture tiny impurity features through the dual attention mechanism of channel and space. Experiments show that the introduction of this module improves the accuracy rate by about 1% and the inference speed by 4%, which verifies its dynamic feature focusing ability in the case of complex lint backgrounds. However, the small increase in the number of parameters may pose a challenge for deployment in extreme lightweight scenarios, requiring a trade-off between precision and efficiency. The C2f_DSConv module reduces the number of model parameters by 12% while maintaining the ability of multi-scale feature fusion by replacing the standard convolution with lightweight DSConv. Experiments show that the accuracy of the yolov8 + DSConv model is improved by about 0.7%, but the mAP50–95 is reduced to 0.498, which is 0.6% lower than that of the original model. This phenomenon stems from the fact that the quantization operation of DSConv slightly underpreserves some fine-grained features, such as impurity edge texture, when reducing the computational cost, resulting in a slight decrease in localization accuracy at medium and high IoU thresholds. However, its lightweight feature provides the feasibility for real-time detection of mobile terminals or embedded devices. The Wise-IoU loss function balances the training weights of samples with different qualities through a dynamic outlier mechanism, and without increasing the number of parameters and inference elapsed time, the recall rate with the mAP50–95 increases by 0.3% and 0.1%, respectively, which proves that it is effective in optimizing the localization precision of irregularly distributed impurities, especially in overlapping and complex shape impurity scenarios. Compared with the existing models, Cotton-YOLO also shows obvious advantages in terms of comprehensive performance.
In general, the Cotton-YOLO model combines the advantages of CBAM, C2f_DSConv and Wise-IoU, but its mAP50–95 is 0.501, which is slightly lower than that of yolov8 + CBAM (0.506) and yolov8 + WIoU (0.505). This difference is a reasonable trade-off in module collaborative optimization: the feature enhancement effect of CBAM is partially offset by the lightweight operation of DSConv, while the localization accuracy improvement of Wise-IoU alleviates this loss. Considering the requirements of industrial scenarios, Cotton-YOLO maintains the same mAP50 as the original model (89.6%) while reducing the number of parameters by 12% and increasing the frame rate by 3.5% (50.51 fps), which far exceeds the frame rate threshold of 20 Hz in the carding machine detection scene. The buffer space is also reserved for the falled cotton transmission speed fluctuation, and the triangle balance of “precision-speed–lightweight” is realized.
In conclusion, the improvement strategy in this study effectively improves the accuracy and speed, and reduces the model parameters to achieve light weight.

4. Visual Interface Design for Dropout Impurity Detection

In the current textile production field, the falled cotton impurity detection work mostly relies on manual completion. The manual detection method is not only inefficient, but also susceptible to the interference of subjective factors of the detector, resulting in uneven accuracy. In order to improve the efficiency and accuracy of falled cotton impurity detection and meet the needs of practical engineering applications, this study develops a set of visual interface systems for falled cotton impurity detection based on an improved model.

4.1. Development Framework

This system uses Python as the programming language, and PyQT framework to build the front-end graphical user interface (GUI) and realize the back-end functions. At the same time, the PyTorch framework and yolo framework are used to build the model and execute the model prediction instructions, and the development environment is PyCharm. The overall development framework of the system is shown in Figure 16.

4.2. Falled Cotton Impurity Detection System Function Introduction

The visual interface of falled cotton impurity detection integrates login authentication, falled cotton impurity detection, impurity rate calculation and visualization and other core functions, which can realize rapid impurity detection, automatic calculation of impurity rate and human–computer interaction.
The operator completes the authentication through the preset username and password, and the system triggers a real-time prompt mechanism when the input is wrong or the information is missing. After successful login, it supports uploading pictures or video folders for subsequent detection, and provides picture switching and retrieval functions to facilitate data preprocessing.
The cotton impurity detection is based on the Cotton-YOLO model and adopts a multi-process collaborative architecture: the child process executes the model prediction command, and the main process realizes the dynamic display of detection progress (updated once per second) through the pyqtSignal signal mechanism and the QProgressBar component, which effectively avoids interface stagnation. After the detection, the system feeds back the detection time and result annotation information immediately, which supports the interactive viewing and management of the detection result images.
Based on the impurity position information obtained by detection and combined with Formula (12), the system automatically calculates the impurity content of falled cotton, and presents it in visual form, as shown in Figure 17 below. The operator can preset the alarm threshold of the impurity rate. When the detection result exceeds the threshold, the system automatically triggers the warning prompt. In addition, the system supports dataset-level result statistics, which can summarize qualified and unqualified images with impurity rates and display the proportion of unqualified images in real time. Users can click on any image number to view the impurity detection results and impurity rate details of the image.
The above functional design constructs the automation and visualization process of cotton impurity detection, which provides a technical scheme with engineering application value for impurity detection and quality control of cotton spinning production.

5. Conclusions and Prospects

In the automation and intelligent transformation of the cotton spinning industry, the accuracy and efficiency of falled cotton impurity detection directly affect product quality and processing cost, which is the key issue of industrial upgrading. In order to solve the problems of insufficient accuracy of traditional methods and the large number of parameters of deep learning models, this study carries out a series of works. Firstly, an impurity detection detection platform is built and a dataset is established to provide a basis for model training. Based on the symmetry design of yolov8, a lightweight model Cotton-YOLO is proposed. By fusing the dual-path symmetric CBAM attention module and the C2f_DSConv lightweight structure, the feature capture ability of small impurities is enhanced, and the complexity is reduced. At the same time, the Wise-IoU loss function is introduced to optimize the bounding box regression to improve the robustness of irregular and overlapping impurity localization. The key results include the following: In terms of light weight, the number of parameters is reduced to 2.71 M, which is about 12% less than that of the original yolov8 (3.01 M). In terms of efficiency, the inference speed reaches 50.51 fps, which is 3.5% higher than the original, and meets the industrial real-time requirement. In terms of precision, the precision rate is 86.5%, the recall rate is 80.7%, and the mAP50 rate is 89.6%. Finally, the visual detection interface was designed to realize the automation of the whole process and provide an operation carrier for industrial landing.
This research has promising applications. The Cotton-YOLO model and lightweight strategy can detect falled cotton impurities, aiding cotton quality improvement and textile machinery upgrades. It can also extend to agriculture, food processing, resource recycling, and pharmaceuticals, offering references for foreign object sorting tasks requiring speed, accuracy, and lightweight design.
Although it performs well in the detection of falled cotton impurities, Cotton-YOLO also has limitations: poor robustness in complex scenarios (e.g., extreme light, shadows, dynamic impurities) and failure to distinguish impurity types (e.g., soil, branches), restricting fine sorting. Future work will achieve fine-grained impurity classification, enhance complex environment adaptability and tiny impurity detection via adaptive preprocessing and multi-modal fusion, and use NAS to optimize edge device adaptation, advancing field validation and cross-domain applications.

Author Contributions

Conceptualization, J.L. and Z.Z.; methodology, J.L. and Z.Z.; software, Z.Z. and Y.H.; validation, J.L. and Z.Z.; project administration, J.L.; data curation, Z.Z. and Y.H.; investigation, J.L., Z.Z. and Y.H.; supervision, Y.H. and X.W.; writing—original draft preparation, Z.Z.; writing—review and editing, J.L., Z.Z. and X.W.; resources, X.W.; funding acquisition, J.L. and X.W. All authors have read and agreed to the published version of the manuscript.

Funding

This research was funded by the National Key R&D Program of China (No. 2023YFB3210900) and the Fundamental Research Funds for the Central Universities (No. 2232024G-05-3).

Data Availability Statement

The data presented in this study are available upon request from the corresponding author.

Conflicts of Interest

The authors declare no conflicts of interest.

References

  1. Zhu, Y.; Zheng, B.; Luo, Q.; Jiao, W.; Yang, Y. Uncovering the Drivers and Regional Variability of Cotton Yield in China. Agriculture 2023, 13, 2132. [Google Scholar] [CrossRef]
  2. Wei, W.; Zhang, C.; Deng, D. Content Estimation of Foreign Fibers in Cotton Based on Deep Learning. Electronics 2020, 9, 1795. [Google Scholar] [CrossRef]
  3. Zhang, H.; Li, D. Applications of Computer Vision Techniques to Cotton Foreign Matter Inspection: A Review. Comput. Electron. Agric. 2014, 109, 59–70. [Google Scholar] [CrossRef]
  4. Ding, M.X.; Wang, Y.K.; Huang, W. Cotton Impurity Detection Algorithm Based on Gabor Filter. J. Image Graph. 2011, 16, 586–592. [Google Scholar]
  5. Xia, B.; Zhang, Y.L.; Wang, F. Research of Canny-based Image Segmentation Method of Raw Cotton Impurities. Adv. Text. Technol. 2017, 25, 23–26. [Google Scholar] [CrossRef]
  6. He, X.L.; Song, Y. Research on NEP Impurity Detection in Spinning Process with Computer Vision. Comput. Simul. 2013, 30, 402–405. [Google Scholar]
  7. Li, X.G.; Zheng, P. Design and Implementation of Intelligent Detection System based on RFID. Appl. Mech. Mater. 2014, 543, 1171–1174. [Google Scholar] [CrossRef]
  8. Li, Q.; Zhou, W.; Zhang, X.; Li, H.; Li, M.; Liang, H. Cotton-Net: Efficient and Accurate Rapid Detection of Impurity Content in Machine-Picked Seed Cotton Using near-Infrared Spectroscopy. Front. Plant Sci. 2024, 15, 1334961. [Google Scholar] [CrossRef] [PubMed]
  9. Zhou, W.; Li, H.; Liang, H. The Quantitative Detection of Botanical Trashes Contained in Seed Cotton with near Infrared Spectroscopy Method. J. Eng. Fibers Fabr. 2022, 17, 15589250221078921. [Google Scholar] [CrossRef]
  10. Vijayakumar, A.; Vairavasundaram, S. YOLO-Based Object Detection Models: A Review and Its Applications. Multimed. Tools Appl. 2024, 83, 83535–83574. [Google Scholar] [CrossRef]
  11. Mao, M.; Hong, M. YOLO Object Detection for Real-Time Fabric Defect Inspection in the Textile Industry: A Review of YOLOv1 to YOLOv11. Sensors 2025, 25, 2270. [Google Scholar] [CrossRef] [PubMed]
  12. Zhang, C.; Li, T.; Li, J. Detection of Impurity Rate of Machine-Picked Cotton Based on Improved Canny Operator. Electronics 2022, 11, 974. [Google Scholar] [CrossRef]
  13. Xu, T.; Ma, A.; Lv, H.; Dai, Y.; Lin, S.; Tan, H. A Lightweight Network of near Cotton-coloured Impurity Detection Method in Raw Cotton Based on Weighted Feature Fusion. IET Image Process. 2023, 17, 2585–2595. [Google Scholar] [CrossRef]
  14. Li, Q.; Ma, W.; Li, H.; Zhang, X.; Zhang, R.; Zhou, W. Cotton-YOLO: Improved YOLOV7 for Rapid Detection of Foreign Fibers in Seed Cotton. Comput. Electron. Agric. 2024, 219, 108752. [Google Scholar] [CrossRef]
  15. Zhou, Q.; Li, H.; Cai, Z.; Zhong, Y.; Zhong, F.; Lin, X.; Wang, L. YOLO-ACE: Enhancing YOLO with Augmented Contextual Efficiency for Precision Cotton Weed Detection. Sensors 2025, 25, 1635. [Google Scholar] [CrossRef] [PubMed]
  16. Zhang, C.; Li, T.; Zhang, W. The Detection of Impurity Content in Machine-Picked Seed Cotton Based on Image Processing and Improved YOLO V4. Agronomy 2021, 12, 66. [Google Scholar] [CrossRef]
  17. Jiang, L.; Chen, W.; Shi, H.; Zhang, H.; Wang, L. Cotton-YOLO-Seg: An Enhanced YOLOV8 Model for Impurity Rate Detection in Machine-Picked Seed Cotton. Agriculture 2024, 14, 1499. [Google Scholar] [CrossRef]
  18. Feng, J. Research on Abnormal Fiber Image Detection Technology of Southern Xinjiang Cotton Based on YOLOv5 and U-Net++. Master’s Thesis, Tarim University, Alar, China, 2023. Available online: https://link.cnki.net/doi/10.27708/d.cnki.gtlmd.2023.000428 (accessed on 20 April 2025).
  19. Wang, Z.P.; Wu, Z.X.; Zhang, L.J.; Abudurexiti, M.; Zhang, Q. Cotton impurity detection based on ZC-YOLO. Wool Text. J. 2024, 52, 95–101. [Google Scholar] [CrossRef]
  20. Hu, D.; Liu, X.; Xu, J. Improved YOLOv5-based image detection of cotton impurities. Text. Res. J. 2024, 94, 906–917. [Google Scholar] [CrossRef]
  21. Zhang, Z.Q.; Zhang, T.H.; Diao, Q.; Dong, L. A cotton impurity detection algorithm based on improved genetic algorithm. Electron. Des. Eng. 2017, 25, 22–26. [Google Scholar] [CrossRef]
  22. Xu, J.; Han, L.; Liu, X.P.; Wang, S.P.; Lu, Z.; Hu, D.J. Detection of raw cotton impurities based on residual and attention mechanism. J. Optoelectron. Laser 2022, 33, 421–428. [Google Scholar] [CrossRef]
  23. Xu, J.; Hu, D.J.; Liu, X.P.; Han, L.; Yan, H.Y. Cotton impurity image detection based on improved RFB-MobileNetV3. J. Text. Res. 2023, 44, 179–187. [Google Scholar] [CrossRef]
  24. Woo, S.; Park, J.; Lee, J.-Y.; Kweon, I.S. CBAM: Convolutional Block Attention Module. In Computer Vision—ECCV 2018; Ferrari, V., Hebert, M., Sminchisescu, C., Weiss, Y., Eds.; Lecture Notes in Computer Science; Springer: Cham, Switzerland, 2018; Volume 11211, pp. 3–19. [Google Scholar] [CrossRef]
  25. Nascimento, M.G.D.; Prisacariu, V.; Fawcett, R. DSConv: Efficient Convolution Operator. In Proceedings of the 2019 IEEE/CVF International Conference on Computer Vision (ICCV), Seoul, Republic of Korea, 27 October–2 November 2019; pp. 5147–5156. [Google Scholar] [CrossRef]
  26. Tong, Z.; Chen, Y.; Xu, Z.; Yu, R. Wise-IoU: Bounding Box Regression Loss with Dynamic Focusing Mechanism. arXiv 2023, arXiv:2301.10051. [Google Scholar] [CrossRef]
  27. Wang, W.; Liu, W. Small Object Detection with YOLOv8 Algorithm Enhanced by MobileViTv3 and Wise-IoU. In Proceedings of the 2023 12th International Conference on Computing and Pattern Recognition (ICCPR ‘23), Xiamen, China, 27–29 October 2023; pp. 174–180. [Google Scholar] [CrossRef]
Figure 1. Research technology roadmap.
Symmetry 17 01185 g001
Figure 2. Schematic diagram of a sample of falled cotton impurities.
Symmetry 17 01185 g002
Figure 3. Schematic diagram of the image acquisition system.
Symmetry 17 01185 g003
Figure 4. (a) Image of the falled cotton sample before annotation; (b) The labeled image of the falled cotton sample.
Symmetry 17 01185 g004
Figure 5. Structure of the Cotton-YOLO network.
Symmetry 17 01185 g005
Figure 6. CBAM module structure.
Symmetry 17 01185 g006
Figure 7. Structure of channel attention module.
Symmetry 17 01185 g007
Figure 8. Structure of the spatial attention module.
Symmetry 17 01185 g008
Figure 9. Structure of the DSConv module.
Symmetry 17 01185 g009
Figure 10. (a) Bottleneck structure; (b) C2f module structure; (c) Bottleneck-D structure; (d) C2f_DSConv module structure.
Symmetry 17 01185 g010
Figure 11. Schematic diagram of WIoU parameters.
Symmetry 17 01185 g011
Figure 12. Loss curves for the Cotton-YOLO model.
Symmetry 17 01185 g012
Figure 13. Cotton-YOLO’s detection results.
Symmetry 17 01185 g013
Figure 14. (a) The detection results of the yolov8 model; (b) The detection results of the yolov8 + CBAM model; (c) The detection results of the yolov8 + DSConv model; (d) The detection results of the yolov8 + WIoU model; (e) The detection results of the Cotton-YOLO model.
Symmetry 17 01185 g014
Figure 15. (a) Yolov8 heat map effect; (b) Yolov8 + CBAM heat map effect.
Symmetry 17 01185 g015
Figure 16. System development framework diagram.
Symmetry 17 01185 g016
Figure 17. Display interface of test results.
Symmetry 17 01185 g017
Table 1. Experimental test platform.
NameParameter
CPUIntel(R)Core(TM) i7-9750H@2.60GHz
GPUNVIDIA GTX1650(4096MiB)
Computer systemWindows 11
Deep learning frameworkPyTorch-2.0.1
Computational platformCUDA-11.8
Integrated development environmentPyCharm-2023.1.6
Programming languagePython-3.8.20
Table 2. Comparative experimental results.
ModelpRmAP50mAP50–95ParametersFPS
Faster RCNN0.9290.5560.7550.48928,273,88145.63
MobileNet-SSD0.8140.7950.8270.4466,204,00442.36
EfficientDet-D00.79 0.7730.8060.4314,874,21743.65
yolov50.8640.8020.8930.5022,503,13950.76
yolov60.7610.7980.7610.3874,314,61543.72
yolov80.8620.8040.8960.5043,005,84348.78
yolov8-Nano0.8110.7450.8290.4111,714,27149.75
Cotton-YOLO0.8650.8070.8960.5012,714,10550.51
Table 3. Results of ablation experiments.
ModelpRmAP50mAP50–95ParametersFPS
yolov80.8620.8040.8960.5043,005,84348.78
yolov8 + CBAM0.8720.7990.8940.5063,092,60151.02
yolov8 + DSConv0.8690.7490.8920.4982,627,34748.08
yolov8 + WIoU0.8640.8070.8980.5053,005,84348.78
Cotton-YOLO0.8650.8070.8960.5012,714,10550.51
Disclaimer/Publisher’s Note: The statements, opinions and data contained in all publications are solely those of the individual author(s) and contributor(s) and not of MDPI and/or the editor(s). MDPI and/or the editor(s) disclaim responsibility for any injury to people or property resulting from any ideas, methods, instructions or products referred to in the content.

