Article

Transient Dynamic Analysis of Composite Vertical Tail Structures Under Transportation-Induced Vibration Loads

by
Wei Zheng
1,
Wubing Yang
1,
Sen Li
1,
Dawei Wang
1,
Weidong Yu
1,
Zhuang Xing
1,
Lan Pang
1,
Zhenkun Lei
2,* and
Yingming Wang
2
1
AVIC SAC Commercial Aircraft Company Ltd., Shenyang 110000, China
2
State Key Laboratory of Structural Analysis, Optimization and CAE Software for Industrial Equipment, Dalian University of Technology, Dalian 116024, China
*
Author to whom correspondence should be addressed.
Symmetry 2025, 17(8), 1182; https://doi.org/10.3390/sym17081182
Submission received: 23 June 2025 / Revised: 10 July 2025 / Accepted: 11 July 2025 / Published: 24 July 2025
(This article belongs to the Special Issue Symmetry in Impact Mechanics of Materials and Structures)

Abstract

The potential damage to aviation products caused by vibration and shock during road transportation has long been overlooked, despite structural failure under dynamic loading emerging as a critical technical challenge affecting product reliability. For aviation components, both stress and vibration analysis are essential prerequisites prior to formal assembly. This study investigates a symmetric vertical tail, a common aviation structure, employing an innovative model group analysis method to characterize its dynamic stress and strain distributions under real transportation conditions. Experimental measurements of vibration acceleration and impact loads during transport served as input data for constructing a numerical model based on stress and vibration theory. The model elucidates the mechanical responses of the tail in both modal and vibrational states, enabling effectively evaluation of dynamic vibrations on the tail and its critical subcomponents during road transport. The findings provide actionable insights for optimizing aviation component packaging design, mitigating vibration-induced damage, and enhancing transportation safety.

1. Introduction

As key components of aviation equipment, the safety and reliability of structural parts during transportation directly impact overall system performance and mission success. With the rapid advancement of aviation technology, structural components are increasingly designed to be larger, more precise, and lighter [1,2,3]. For instance, typical parts—such as titanium alloy frames combined with carbon fiber-reinforced composite panels—require micron-level surface accuracy and stringent control of residual stress control withstand extreme operational conditions [4,5,6]. Consequently, quantitative analysis of stress and strain distributions during transportation is critical for evaluating product performance.
Large packaging containers are transported via land, sea, or air, each subjecting cargo to varying levels of vibration and shock. Among these, land transportation induces the most severe vibrations, particularly under poor road conditions. Thus, the structural design of aviation component packaging must account for complex and dynamic vibration environments, including random vibrations, cyclic shocks, and low-frequency, high-amplitude oscillations [7,8,9]. Statistical data indicate that approximately 30% of transportation-related damage in aerostructures stems from vibration-induced fatigue crack propagation and interfacial debonding [10,11,12]. Notably, during land transport, the cumulative effect of vibrational loads can cause irreversible alterations in the dynamic behavior of structural components. As a result, developing packaging systems with high-performance vibration damping has emerged as a critical technical challenge in land transportation engineering [13,14].
In conventional vibration-absorbing packaging design, passive cushioning materials such as foam and rubber remain the primary solution. Inspired by grapefruit peels, Hu [15] developed a biomimetic multifunctional composite material capable of resisting diverse external impacts, thereby improving product durability. However, this approach relies heavily on intrinsic material properties for vibration damping and suffers from inherent limitations, including inefficient energy absorption and narrow frequency-band adaptability. To address these issues, Lee [16] proposed a topology-optimized foam cushioning design to enhance vibration resistance while minimizing packaging volume. Although effective for low-velocity impacts, such materials exhibit stress hardening under high-frequency vibrations, leading to over 50% attenuation in damping performance.
Vibration isolators incorporating spring-damping elements are widely adopted for large packaging due to their adaptability and reliability. Qu [17] introduced a parallel air spring isolation system for precision equipment transport across varying road conditions, achieving high isolation efficiency and lateral stability. Huang [18] designed a compact transmission-blocking structure integrating piezoelectric actuators and rubber isolators to suppress vibration propagation, demonstrating harmonic reduction alongside broadband attenuation. Li [19] developed a self-induced vibration suppression device using a solid-liquid friction nanogenerator, where a liquid-tuned damper unit improved damping efficiency by 19.6%. Dynamic dampers leveraging anti-resonance characteristics are another effective solution. Hu [20] replaced conventional dampers with an inertial mechanical network, achieving superior damping performance. To simultaneously mitigate transverse, torsional, and axial vibrations in rotor systems, He [21] designed a bionic spider-web dynamic damper, which not only meets multi-axis damping requirements but also reduces size, mass, and component count. Kakou [22] and Joubaneh [23] demonstrated that electromagnetically grounded sensors offer optimal damping performance. Liu [24] reviewed advances in inertial vibration isolators across automotive, civil, marine, and power transmission engineering, highlighting their potential to enhance performance and reduce costs.
Enhancing the safety of aerostructural components during transport also hinges on rational packaging design. By analyzing dynamic characteristics, the safety performance of these components can be more intuitively assessed. Lee et al. [25] employed finite element simulations to predict peak accelerations in packaging under real-world impact and vibration. Bernad et al. [26] studied deformation in multilayer stacked packages under mechanical excitation, identifying external loads and system properties as key influencing factors. For complex-shaped products with uneven mass distribution, empirical cushioning design methods often fail to ensure sufficient energy absorption. Kim [27] proposed an analytical-experimental optimization process, reducing package volume by 22% and maximum acceleration by 25%. Zhang et al. [28] investigated random vibration effects on cargo safety, using stacking height and road unevenness as critical factors to optimize multilayer packaging. Pan [29] analyzed road-transport vibration characteristics at launch sites and developed a virtual instrument-based monitoring system.
The demand for lightweight structures to improve fuel efficiency has elevated composites for their high specific strength and stiffness as core materials for load-bearing components [30,31,32,33,34]. However, composite structures are more susceptible to manufacturing defects and in-service damage than metals [35,36,37,38,39], necessitating rigorous damage studies to ensure reliability. Vertical tail structures, comprising composites and metal parts, require precise stress–strain evaluation during transport to guarantee safety. Current mechanical testing methods, such as contact sensors and optical nondestructive testing, lack real-time monitoring capabilities for transport processes [40,41,42], limiting accurate assessment of dynamic structural evolution.
Combining experimental tests with finite element simulations has emerged as a robust tool for analyzing transport-induced vibrations. Vibration data collection typically involves laboratory-based virtual tests or real-world transport trials [43]. To evaluate the dynamic response of a symmetric vertical tail (SVT) in a wooden packaging box (WPB) under actual transport conditions, this study employed triaxial accelerometers to monitor impact loads throughout the transport chain. A refined finite element model was developed using measured load spectra to elucidate stress and strain evolution in critical substructures, revealing damage mechanisms in stress-concentration zones. By correlating transport loads with structural safety at the mechanical response level, this work provides theoretical support for WPB optimization.

2. Materials and Testing

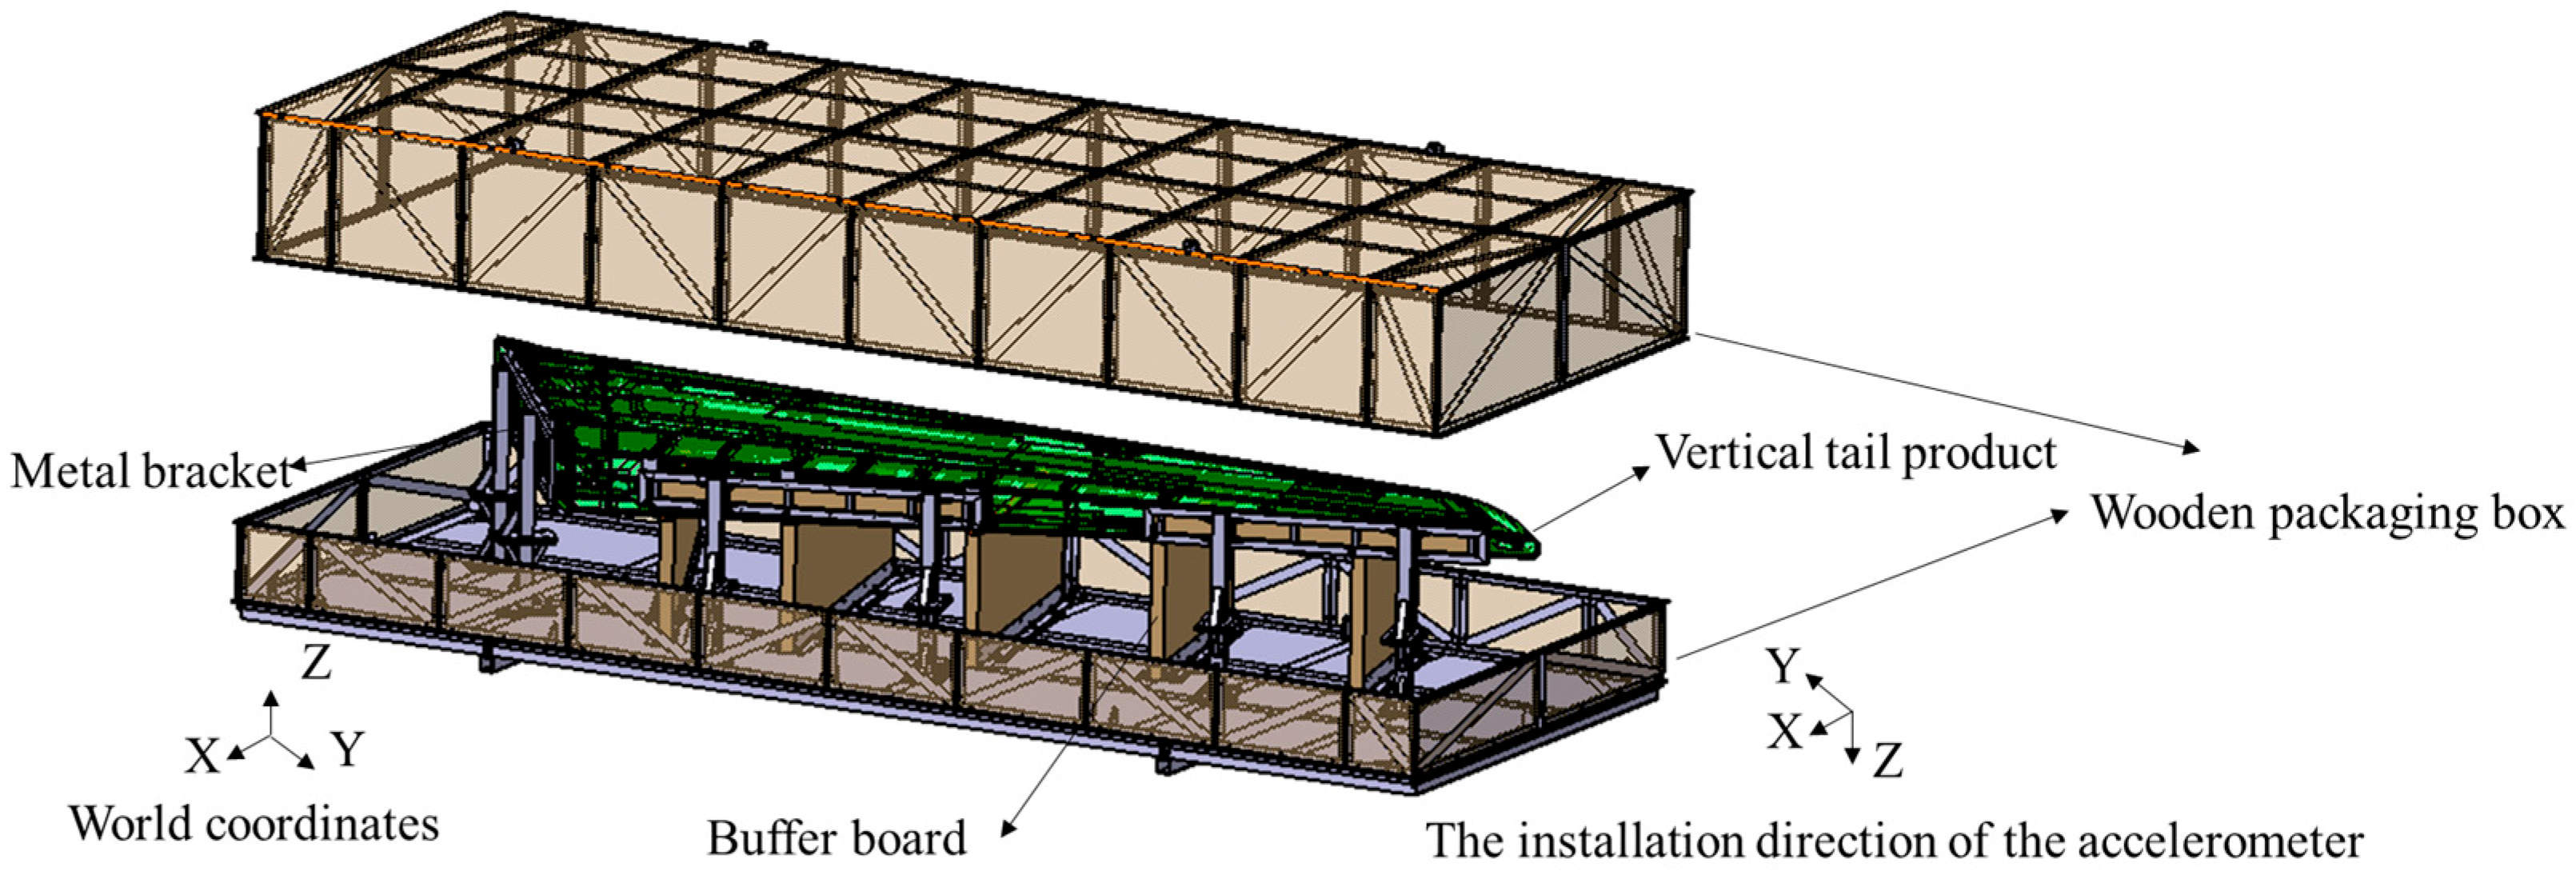
2.1. Geometry Models

Figure 1 illustrates an assembly model comprising four primary components: the symmetric vertical tail (SVT), wooden packaging box (WPB), metal support structure, and buffer boards. The SVT has approximate dimensions of 8650 mm (length) × 3700 mm (width) × 600 mm (height) and a mass of 429 kg. Its construction primarily includes metal structural elements, composite sandwich panels, and composite laminates.

2.2. Material Properties

For flakeboard, metal, and bufferboard, key parameters include density (ρ) and elastic modulus (E). The WPB flakeboard is fabricated by gluing and compressing renewable wood chips to minimize the inherent anisotropy of natural wood. Consequently, the flakeboard is treated as isotropic in this study, with material properties detailed in Table 1.
The plain composite laminate (PCL) is a 17-ply laminate and the variable-thickness laminate (VTL) is 43-ply laminate. Their stacking sequence and mechanical properties are listed in Table 2, Table 3 and Table 4. For carbon fiber reinforced plastics (CFRP) laminates, Ex, Ey, and Ez are the elastic moduli along in-plane fiber direction, transverse to fiber direction and thickness direction, respectively. Gxy, Gxz, and Gyz are the three shear moduli, and vxy is the in-plane Poisson’s ratio. XT, YT, and ZT are the longitudinal, transverse, and interlaminar tensile strengths. XC, YC, and ZC are the longitudinal, transverse, and interlaminar compressive strengths, respectively. Sxy, Sxz, and Syz represent the XY, XZ, and YZ shear strengths.
The aramid honeycomb sandwich panel consists of skin layers and core structure. The skin layer is a 12-ply laminate with the stacking sequence listed in Table 2. The hexagonal aramid honeycomb core is inserted between the 90° and −45° plies (i.e., penultimate and third layers), where L, W are parallel, perpendicular to the honeycomb strip direction, and T is along to honeycomb thickness direction. The strength and modulus in each direction are listed in Table 5.

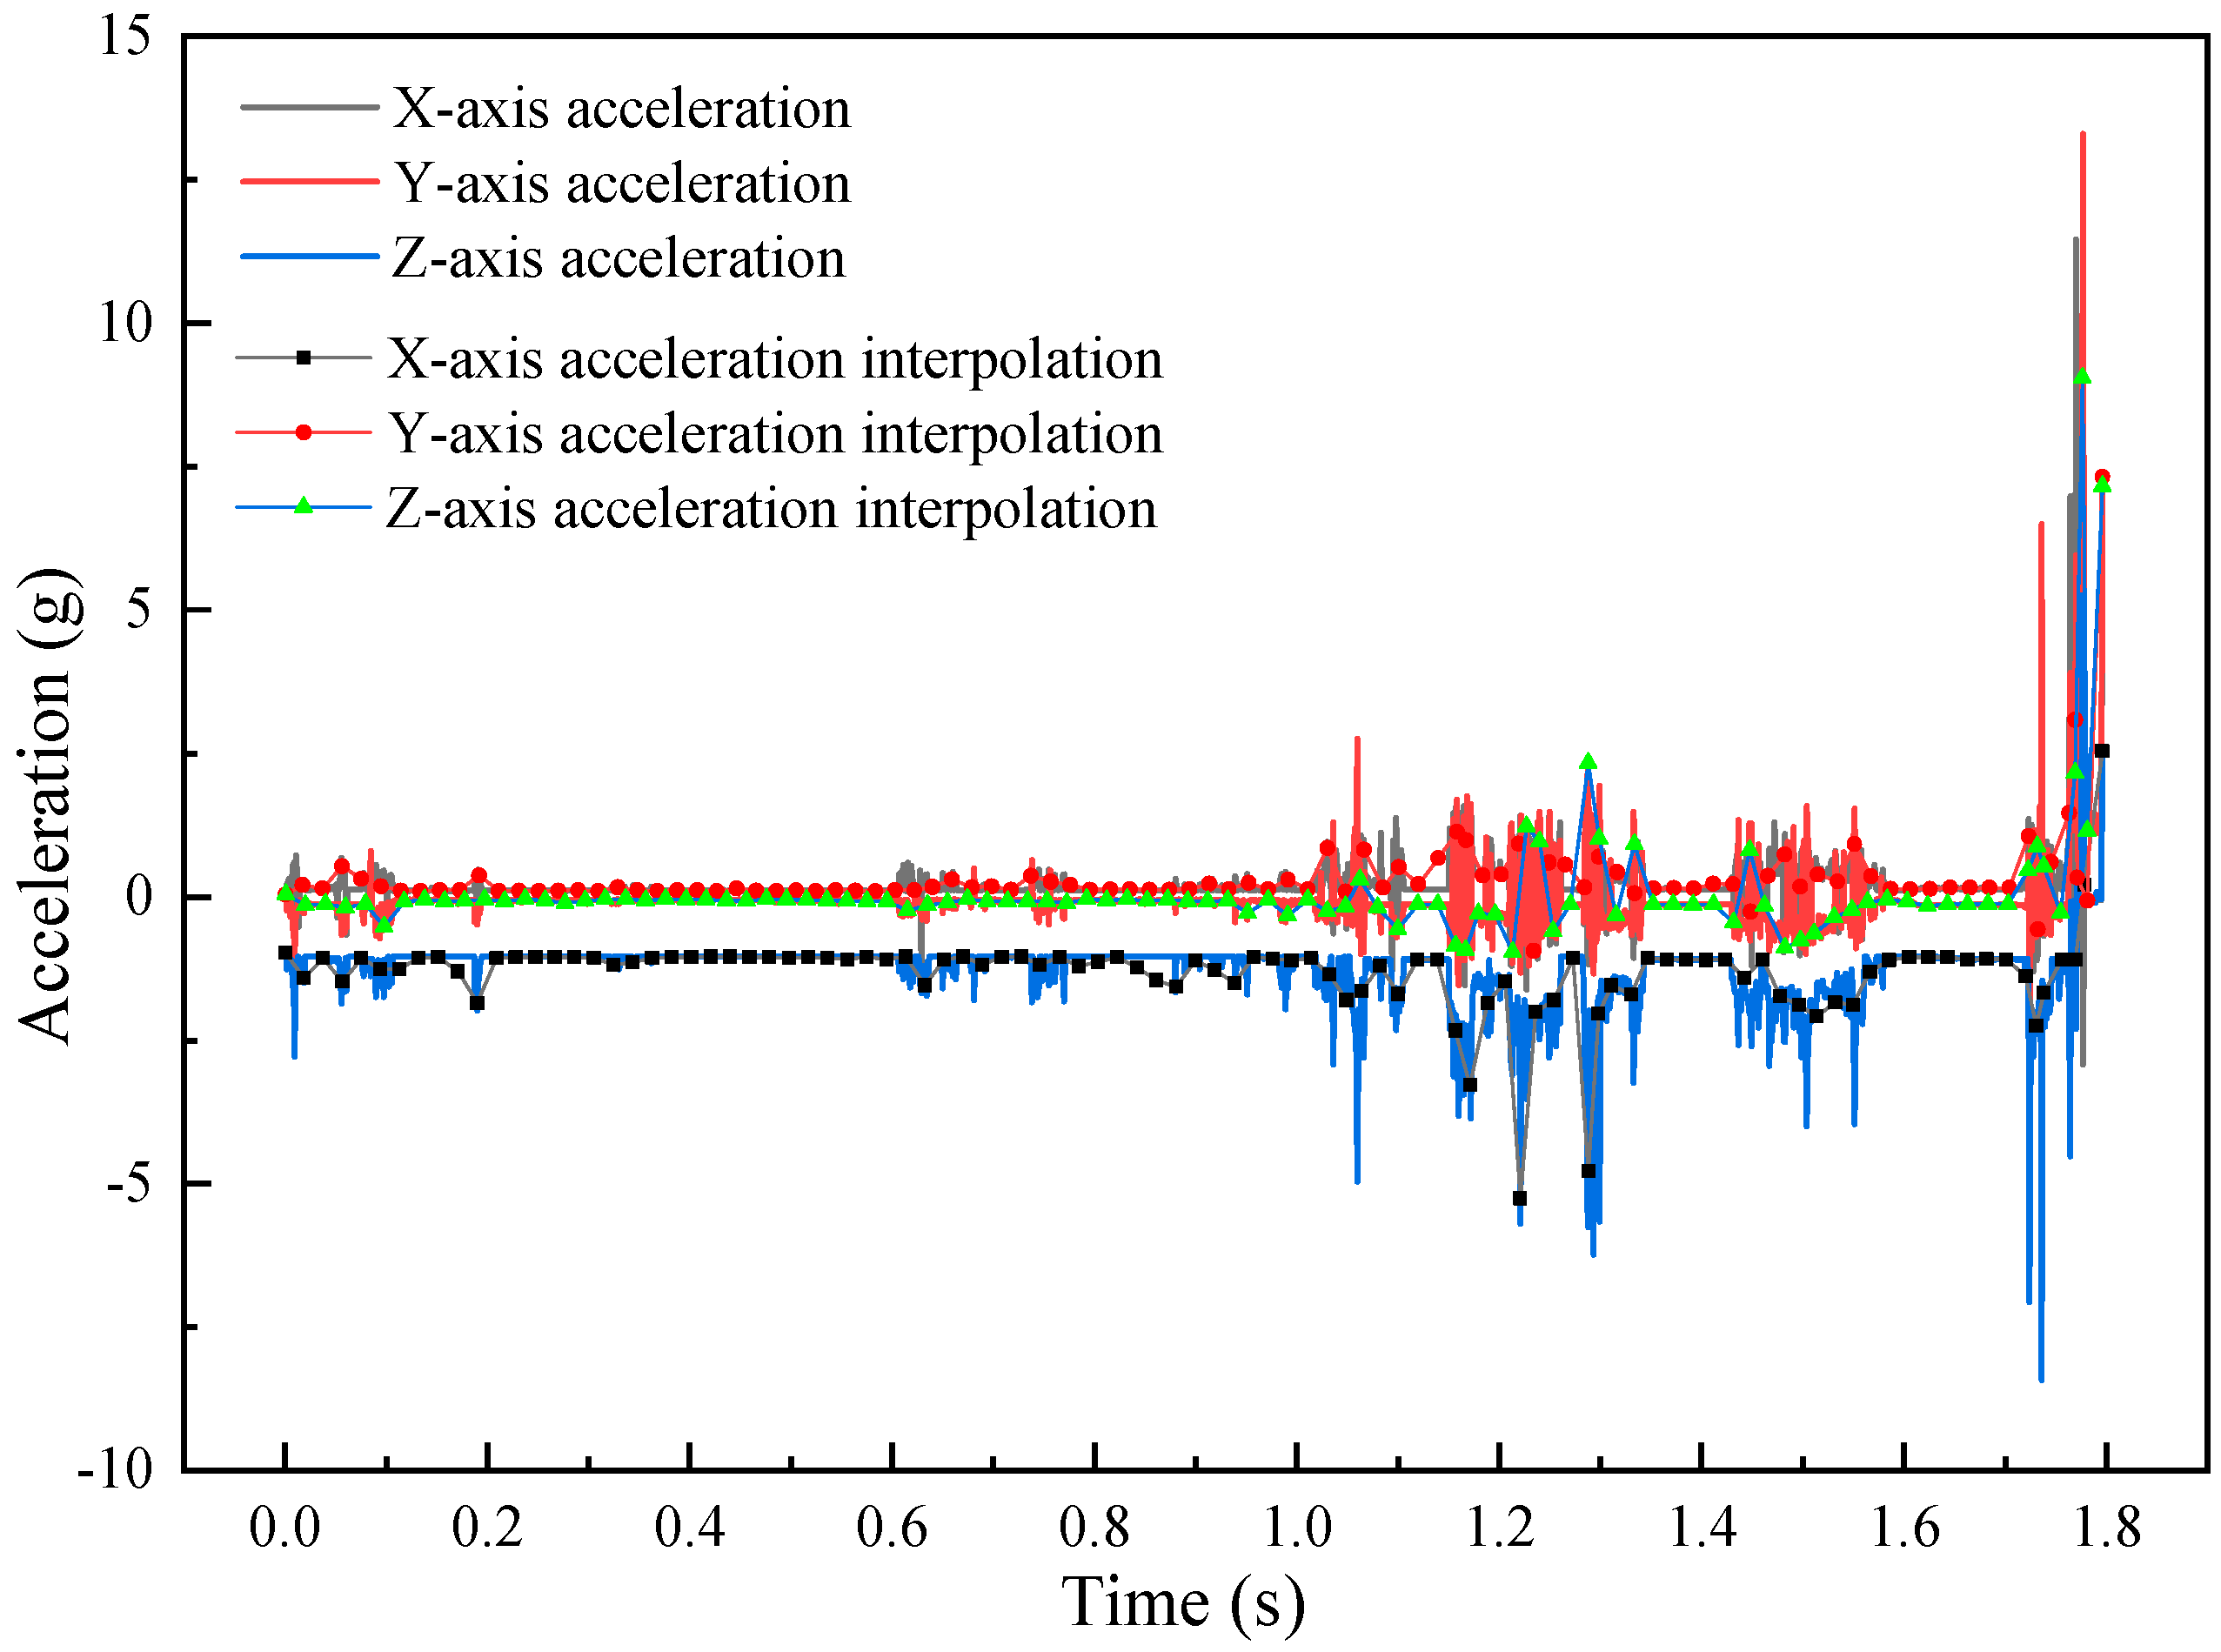
2.3. Transportation Vibration and Shock Testing

Aircraft structural components are typically transported from manufacturing facilities in specialized packaging systems equipped with internal sensors to monitor vibration and shock profiles. The vibrational response of aircraft components during road transport is influenced by multiple factors, including road surface conditions, vehicle mechanical status, transportation speed, and driver operation techniques. The primary vibration and shock excitation sources in road transportation can be classified into four fundamental types: sinusoidal vibration, periodic vibration, random vibration, and discrete shock events [26]. During actual transport operations, the SVT experiences complex vibrational loading resulting from the vector superposition of multiple shock types acting simultaneously in all three orthogonal axes (X, Y, and Z). This superposition effect is particularly pronounced due to road surface turbulence and vehicle dynamics.
To precisely characterize the SVT’s dynamic response during transportation, a triaxial accelerometer (model MT-Shock300-EB, Nanjing Meditech Technology Co., Ltd., Najing, China) was installed inside the packaging structure. This instrumentation serves to record shock impulses, vibration spectra, and acceleration transients providing quantitative data for assessing the SVT’s transport-induced dynamic loading. The accelerometer was configured with a sampling frequency of 1000 Hz (sufficient to resolve all relevant frequency components), a measurement range of ±300 g (adequate for transport loading scenarios), and a temperature stability of ±0.5% over −40 °C to +85 °C (ensuring reliability under varying environmental conditions). The acquired acceleration data (Figure 2) provide peak acceleration magnitudes, shock duration characteristics, frequency domain profiles, and root-mean-square vibration levels. This comprehensive dataset enables rigorous evaluation of packaging system performance, structural response characteristics, and potential damage mechanisms during the complete transportation cycle. The experimental setup and data collection protocol were designed to meet ASTM D4169 standards [44] for transportation simulation testing.

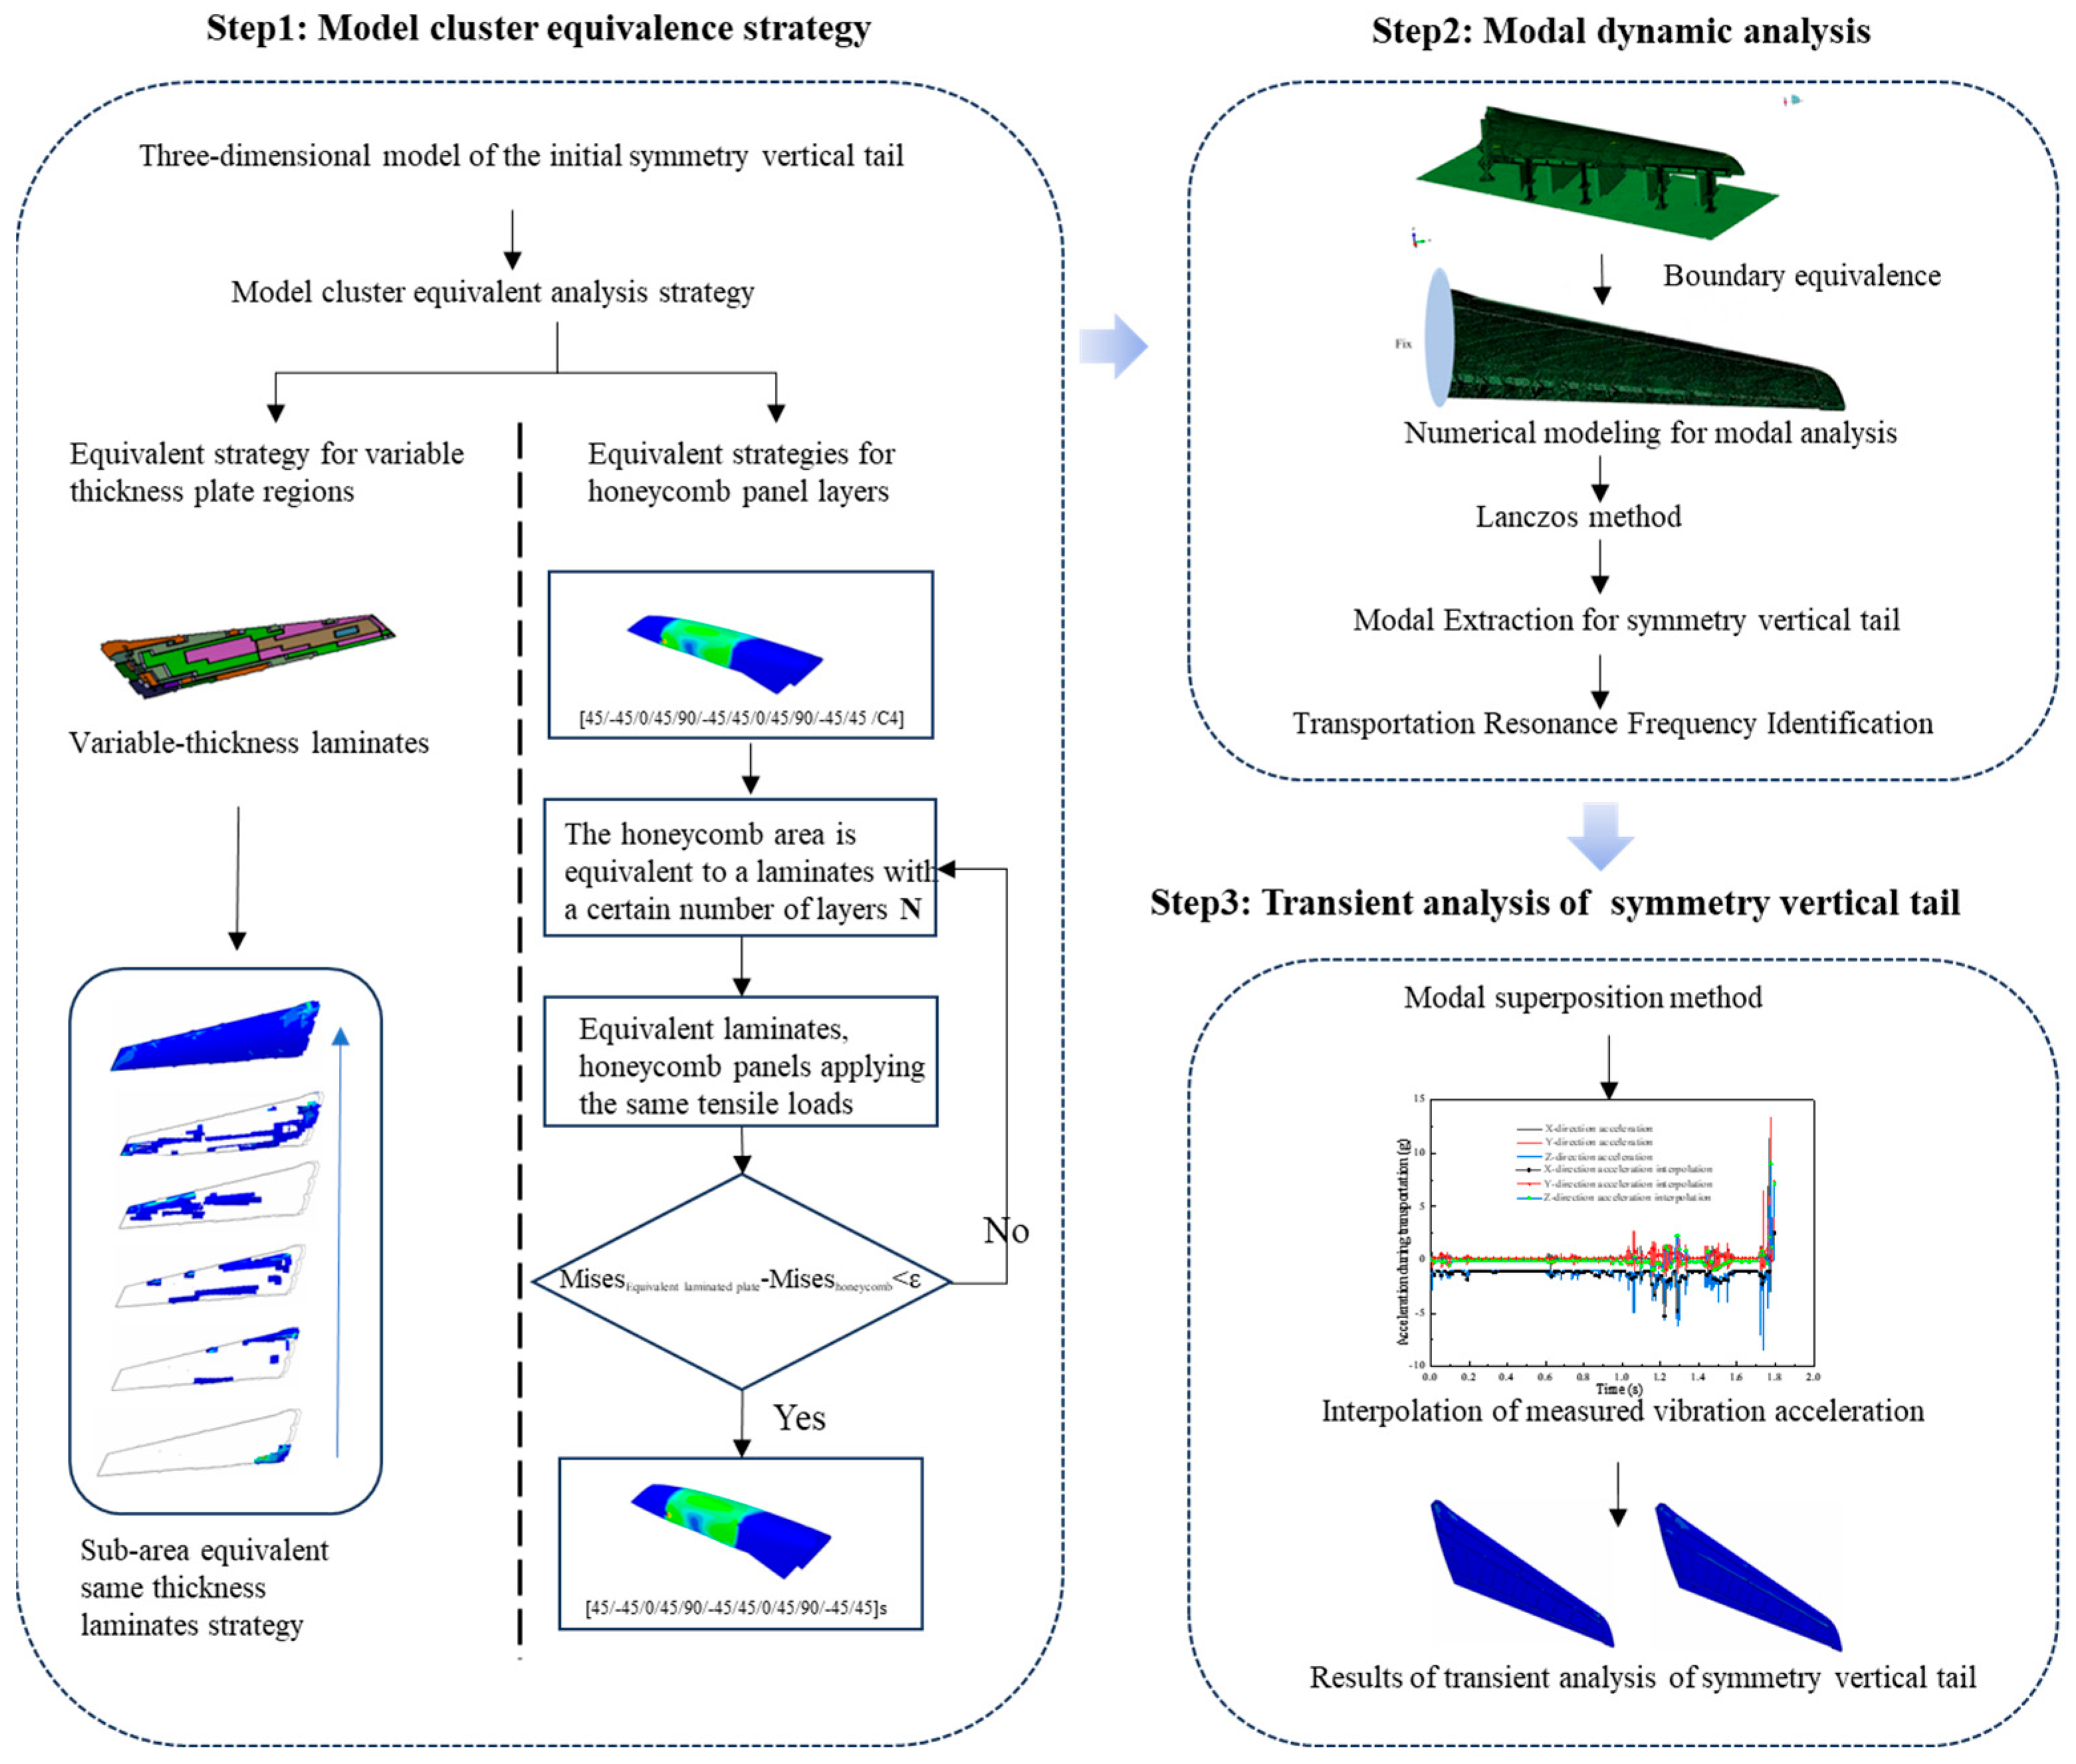
3. Methods and Numerical Modeling

This study investigates the dynamic characteristics of the SVT in the air transportation environment through a full-scale analysis system, as illustrated in Figure 3. Based on stress and vibration theory, a high-fidelity finite element model of the physical specimen was established, and a novel model group equivalent (MGQ) method was proposed for the characteristics of complex assemblies, as described below.
Firstly, in the MGO method, the thickness regionalization equivalent method was used to analyze the variable-thickness composite components, and it is named as variable-thickness laminates (VTLs). The honeycomb sandwich structure was analyzed by calculating the stress difference between the equivalent laminate and the honeycomb sandwich structure within an acceptable error threshold (0.1 MPa) to obtain an equivalent laminate strategy. It is named as honeycomb-equivalent laminates (HELs).
Secondly, to address computational bottleneck in transportation-condition analysis, a three-phase optimization scheme was implemented, including (a) the equivalent replacement of the packing box supports by fixed-end constraints at endpoints (Boundary Conditions), (b) the deployment of a 20 mm hexahedral-dominant meshes in critical stress zone and the verification of mesh independence to confirm convergence at 560,875 nodes (Meshing Strategy), and (c) the construction of a general contact system with tangential Coulomb friction coefficient of 0.3 and normal hard contact with a Lanczos eigenvalue solver to obtain the first 20 modal parameters (Contact Algorithm).
Finally, to account for the non-stationary road spectrum, a cubic spline interpolation algorithm was used to spatiotemporally reconstruct the measured acceleration time histories, generating 100 equivalent load nodes. The solid line in Figure 2 represents the actual collected vibration acceleration, and the dashed points represent the interpolated inputs for numerical modeling. The transient analysis was performed via the modal superposition method to resolve the transient stress and strain distribution. All simulations were conducted in ABAQUS 2022, providing a robust framework for aviation equipment airworthiness verification.
In order to ensure SVT safety during transportation and operational reliability, the minimum stress of the SVT during transportation is taken as the standard for the evaluation of the transportation process. According to the permissible requirements of safety factor verification, composite assemblies are required to meet 1.5 times the safety factor. In this study, the design allowable value was obtained by dividing the strength parameters of CFRP materials in Table 4 of the manuscript by the safety factor (1.5). For the transportation safety of the SVT, the base limit value of 65 MPa was selected as the design’s allowable strength to further improve the safety. Taking the SVT fixation within the wooden packaging box (WPB) as the modeling objective, the SVT stress concentration zones were identified to provide design guidelines for WPB optimization and safe transit protocols.

4. Results and Discussion
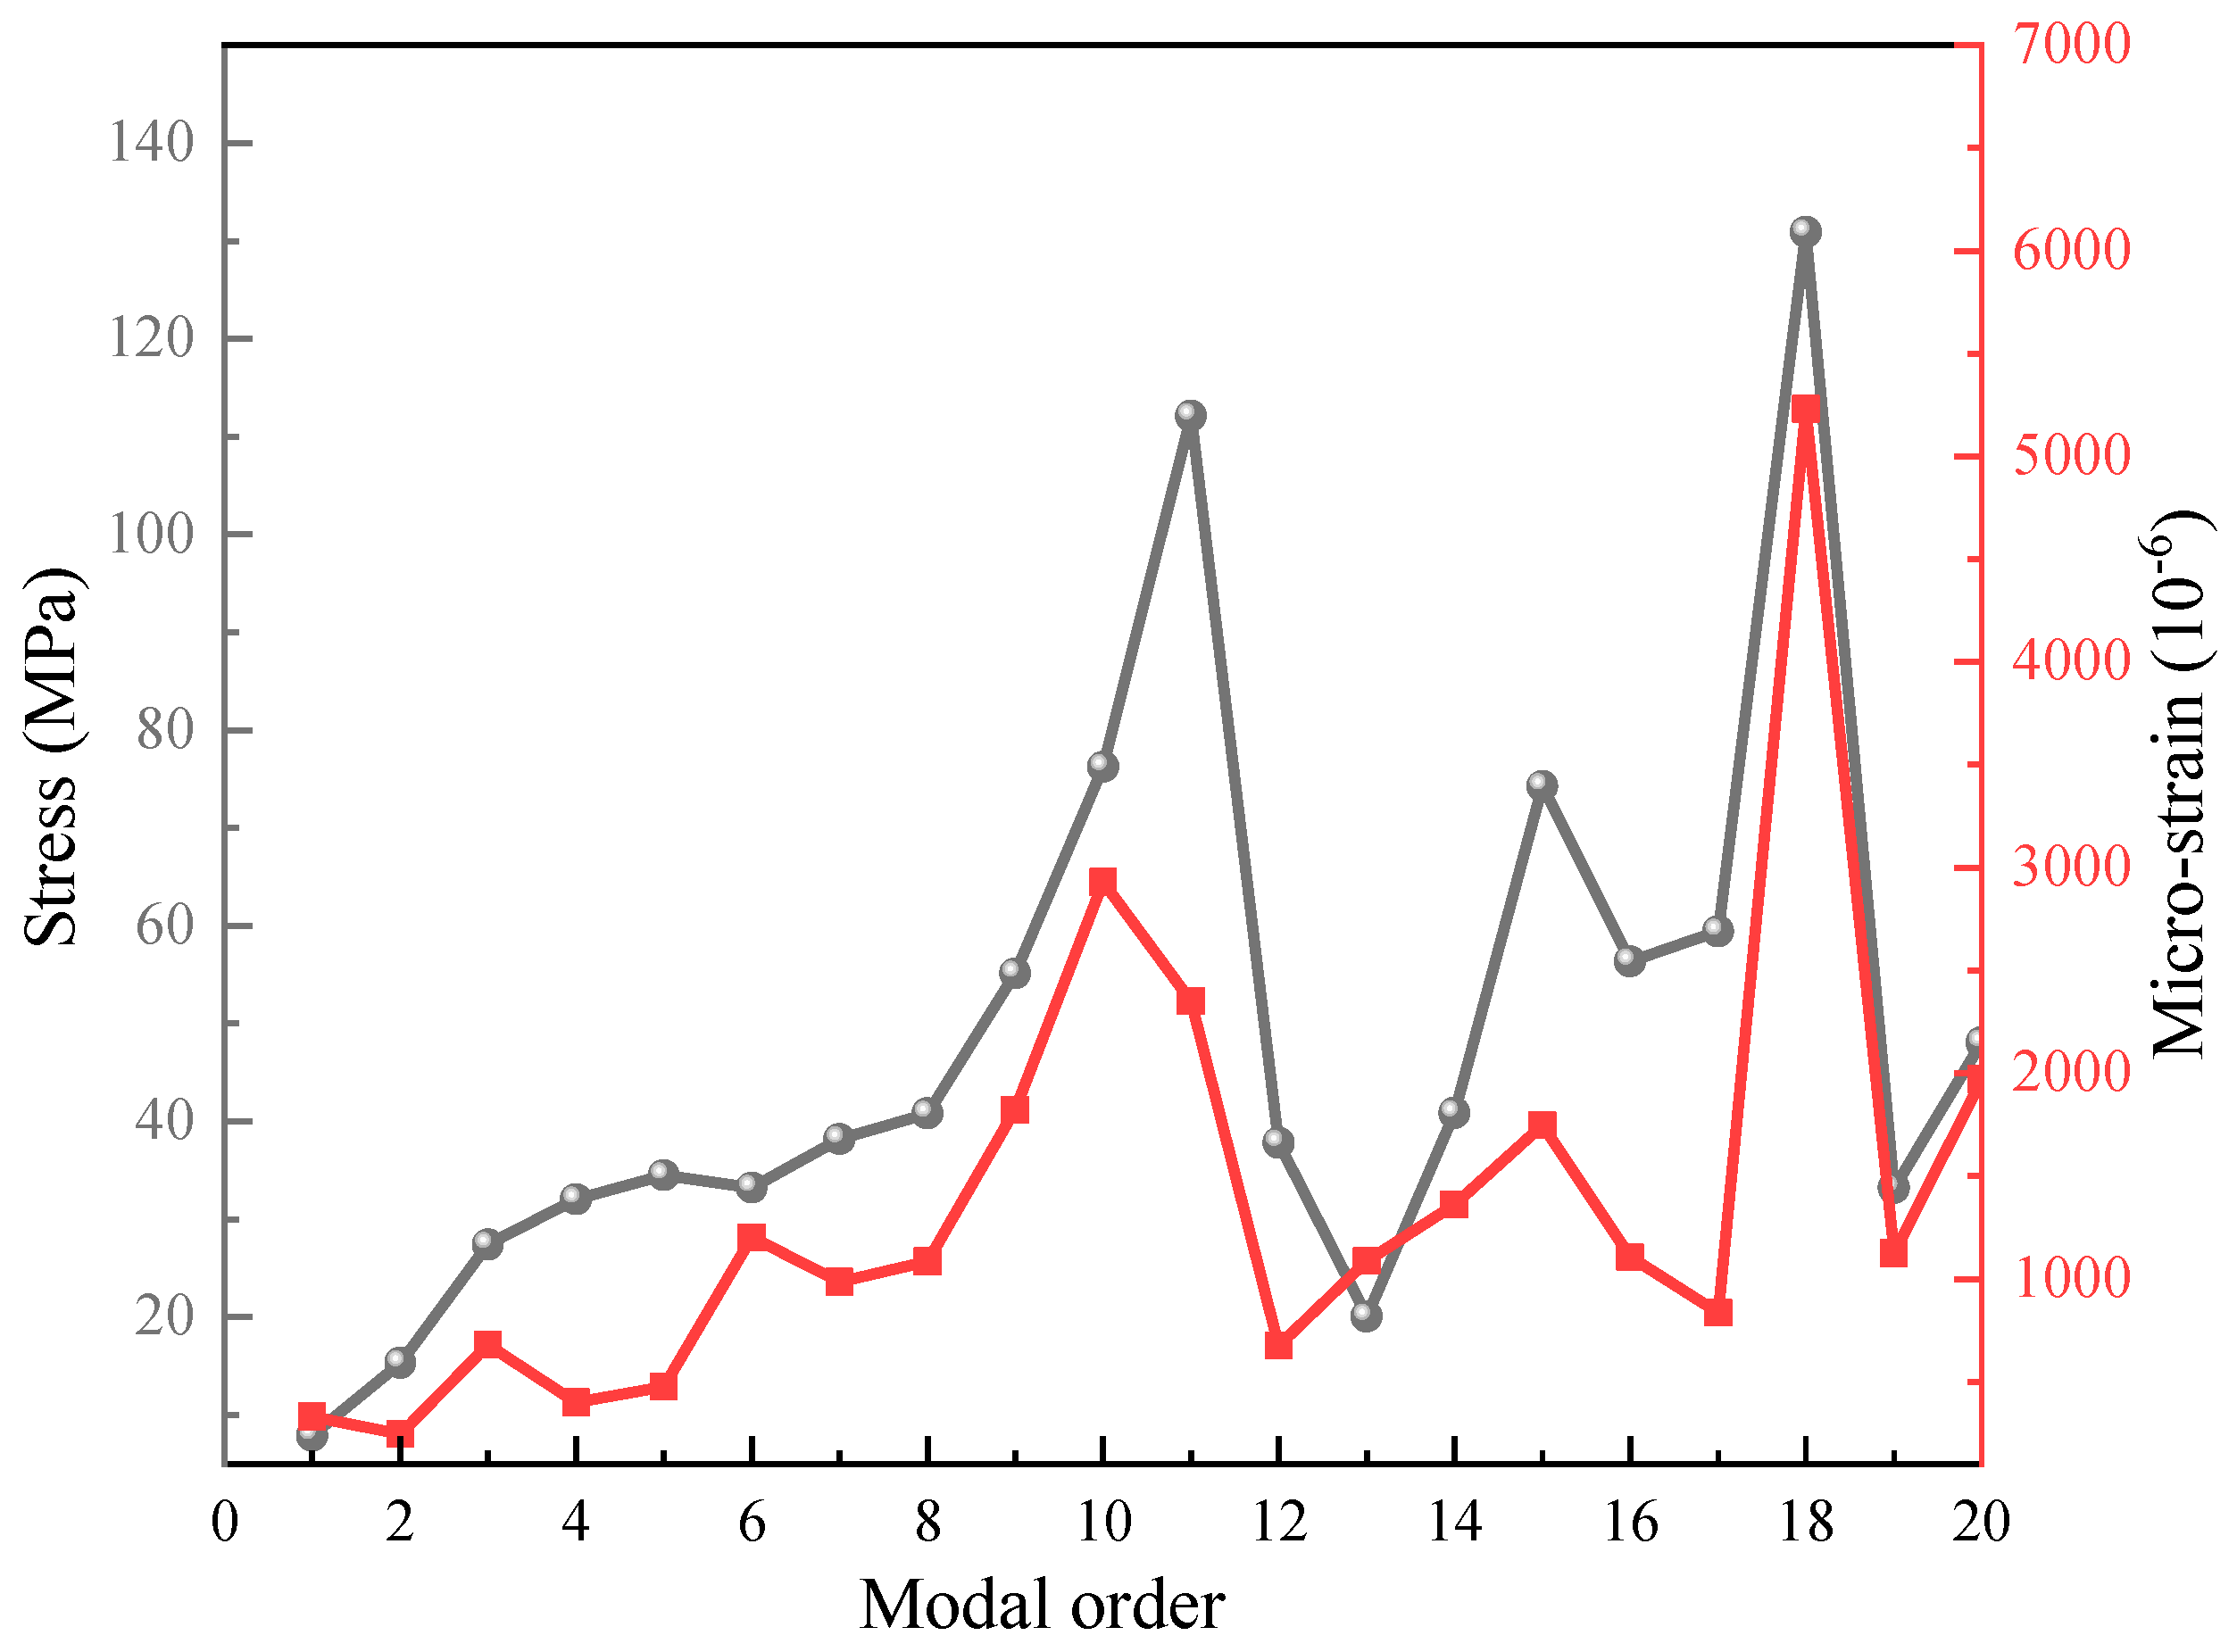
4.1. Modal Analysis

The Lanczos method has been widely adopted in structural eigenvalue extraction due to its computational accuracy and efficiency [45,46,47]. In this study, this method was employed to obtain the first 20 orders of constrained modal parameters for the SVT, as summarized in Table 6.
It can be seen that the first 20 modal frequencies range from 9.0452 Hz to 65.524 Hz. The Z-direction translational effective mass ratio (0.49/0.52 = 94%) exceeds the 90% threshold, confirming the sufficiency of 20 modes for transient analysis. The contribution of the rotational degrees of freedom is higher in the first six order modes. Specifically, Z-axis rotation dominates in the 1st mode; X- and Y-axis rotation dominates in the 2nd mode; Z-axis rotation dominates in the 3rd mode; Y- and Z-axis rotation dominates in the 4th mode; X- and Z-axis rotation dominates in the 5th mode; and Z-axis rotation dominates in the 6th mode. Among the first 20 modes, the maximum rotational response occurs in the 18th mode (59.981 Hz), and the maximum Z-direction translational response occurs in the 12th mode (42.094 Hz). The analysis of effective mass fractions reveals the dominant vibration directions for each modal order, providing critical insights into the structure’s dynamic behavior. This modal decomposition forms the foundation for subsequent transient response analysis.
Figure 4 demonstrates the SVT stress and strain evolution at different modal orders. Both stress and strain exhibit a non-monotonic increasing trend with higher modal orders and the distinct peaks occur at the 11th, 15th, and 18th modal orders.
Figure 5 illustrates the SVT stress distribution at the 11th, 12th, 15th, and 18th order modes. The stress concentration occurs in the upper-right region at the 11th mode (39.906 Hz), and it shifts to the upper-left region at the 18th mode (59.981 Hz). At the 12th and 15th modes, there is a broader stress distribution, which helps to reduce the stress concentration effects. Nevertheless, it shows significantly higher stress–strain magnitudes than other modes.
Therefore, considering the trends of effective mass fraction and stress–strain, special attention should be paid to avoid the resonance phenomenon with 39.906 Hz (11th mode), 42.094 Hz (12th mode), 47.225 Hz (15th mode), and 59.981 Hz (18th mode) during transportation to improve the safety of SVT during transportation.
To better characterize the structural deformation patterns at natural frequencies, this study examines the first six orders of constrained mode shapes for the SVT, as illustrated in Figure 6 and Figure 7. The analysis reveals several key findings regarding stress and strain distribution.
It is observed that in the 1st to 6th modes, the evolution of stress concentration is progressive, merging from dual concentration regions to a single dominant region, and the affected area is gradually expanding with increasing mode order. The strain distribution patterns consistently correlate with stress concentration regions.
In the 1st and 2nd modes, the stress concentration is localized at the SVT upper section. In the 3rd and 4th modes, the stress concentration shifts to the SVT base region. In the 5th and 6th modes, the stress concentration returns to the SVT upper structure. It indicated that the natural frequency excitation during transport significantly alters the spatial distribution of stress–strain fields and magnitude of localized deformation. Therefore, reducing the resonance phenomenon during transportation can further reduce the stress–strain values of the symmetric droop tail structure.

4.2. Transient Dynamics Analysis of SVT

Based on the modal analysis results (Table 6), the highest frequency among the first 20 modes of the SVT during transportation is 65.524 Hz, corresponding to a period of 0.015 s (1/65.524). To ensure numerical accuracy in the transient analysis, the time increment was smaller than the period value and set to 0.005 s (1/3 of the minimum period). The total analysis duration was 5 s to adequately capture vibration decay. A damping ratio of 0.09 was applied for the 1–100 Hz frequency range [48], because the lower damping ratios prolong vibration decay and the higher damping reduces peak stress amplitudes.
(1)
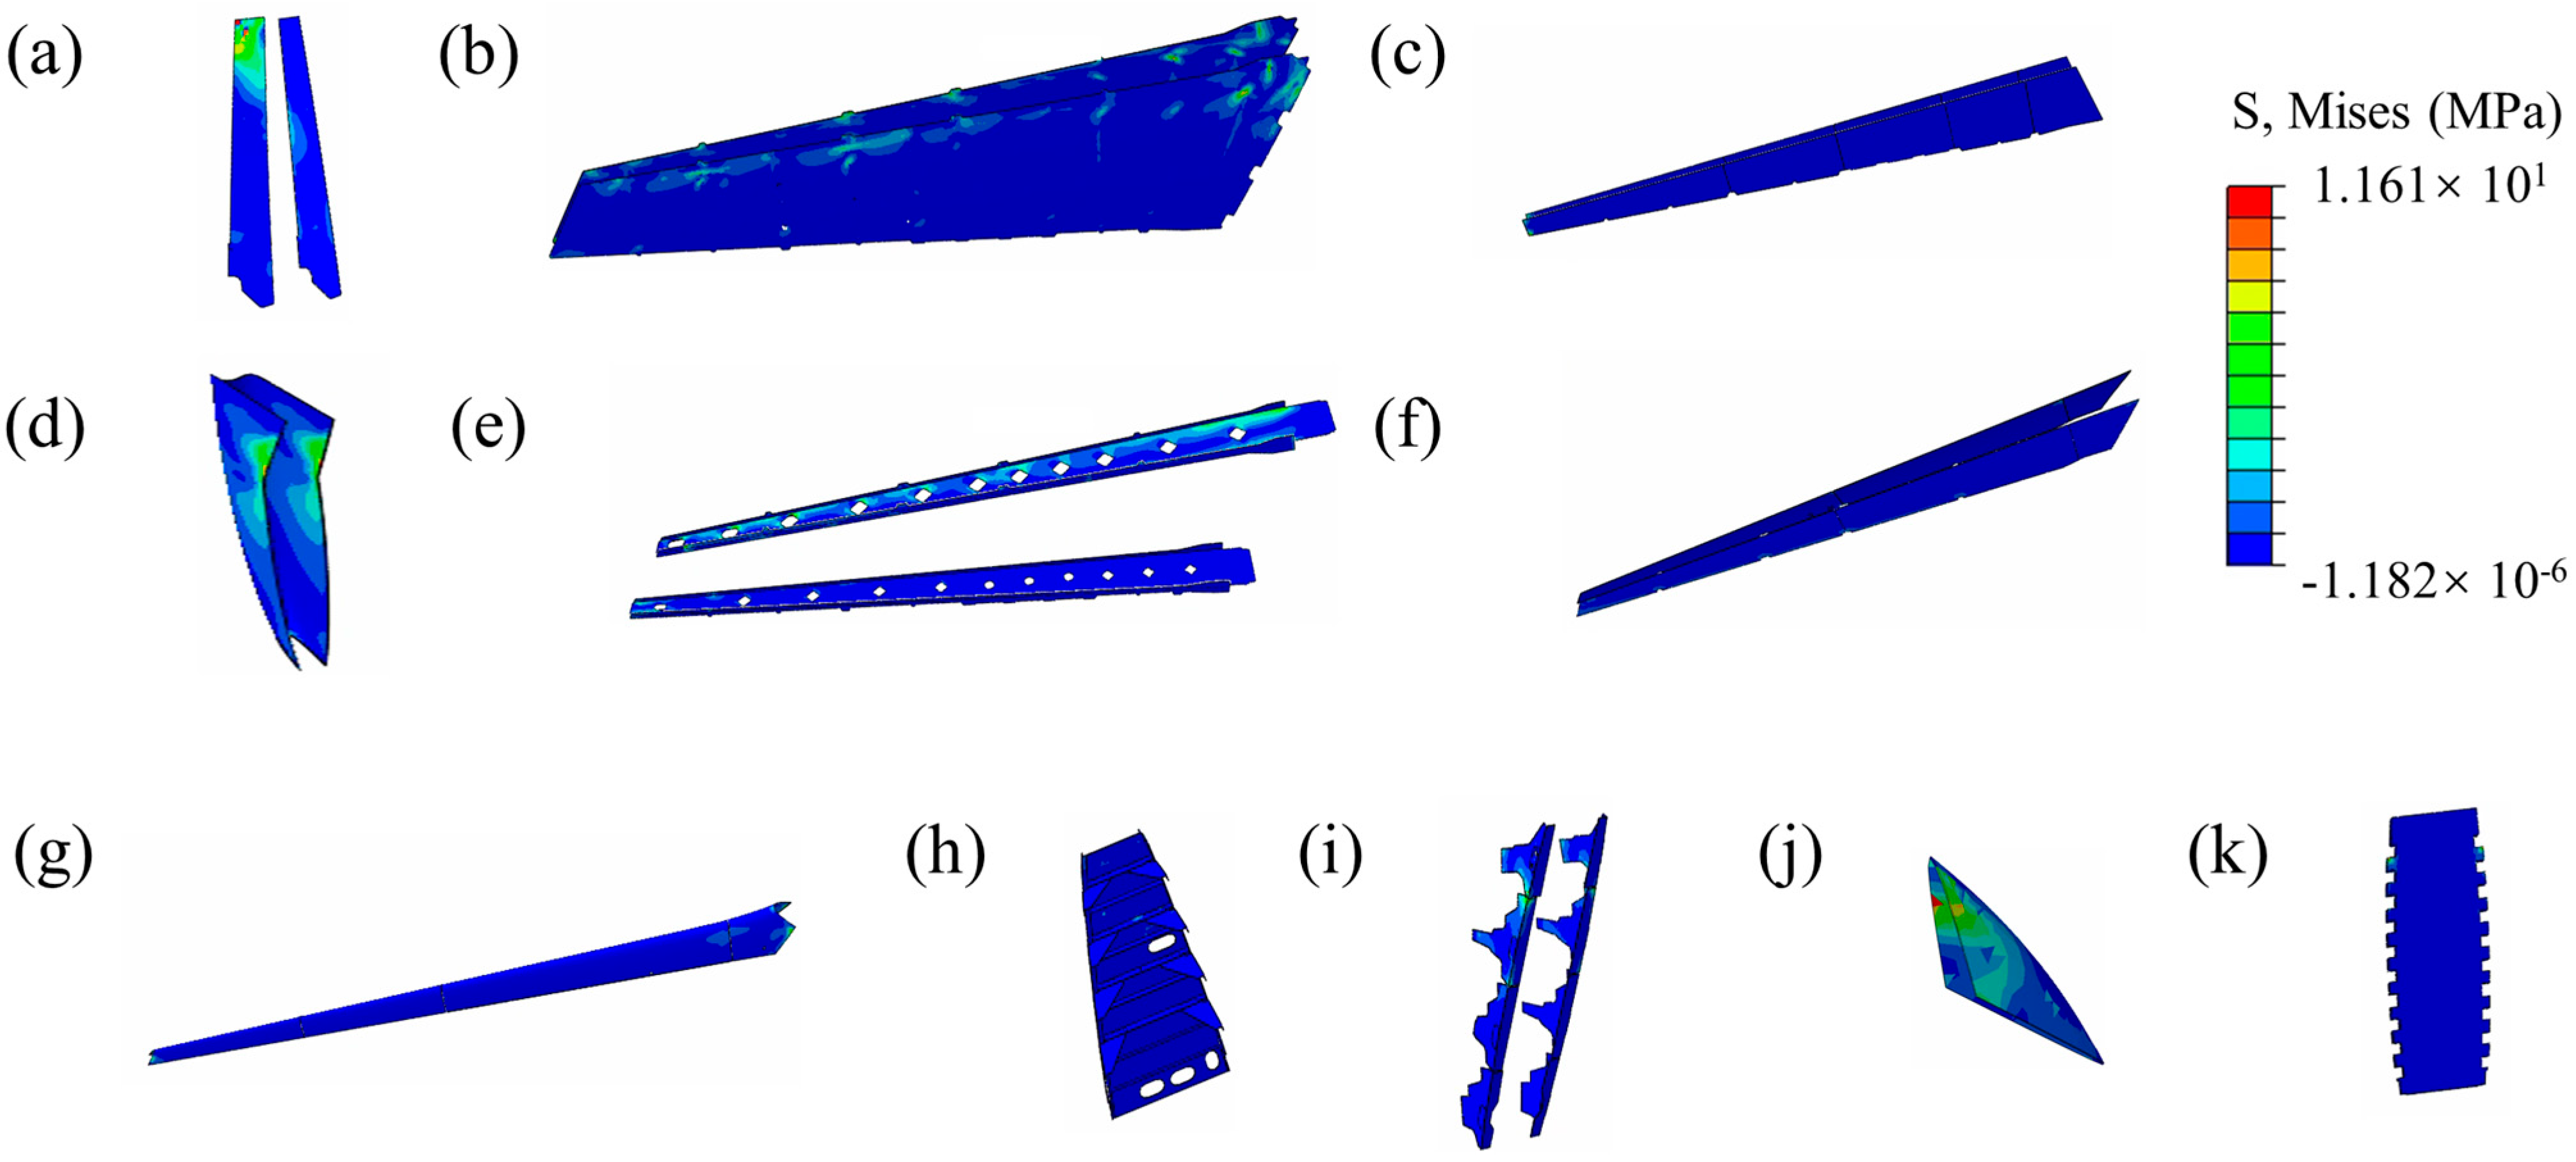
Stress–strain response to transportation shock
According to the calculation results of the modal superposition method, the SVT’s dynamic response is shown in Figure 8. The stress–strain distribution shows that during transportation, the maximum stress of 11.61 MPa and the maximum strain of 491.9 με are induced by triaxial vibration acceleration impacts. The peak stress is 82% below the 65 MPa threshold specified in aviation transportation standards. This confirms the adequacy of the packaging box design, the structural integrity during transport, and absence of fatigue-critical stress concentrations.
To comprehensively characterize the transient response of the SVT during transportation, this study analyzed the stress–strain distribution across typical structural components, as illustrated in Figure 9 and Figure 10.
For the composite components (Figure 9a–g), the peak stress (11.61 MPa) is located in the upper component of Figure 9g. For the metal metallic components (Figure 9h–k), the peak stress (8.026 MPa) is located in the upper component of Figure 9h. Accordingly, targeted reinforcement of upper packaging regions with enhanced cushioning materials could reduce peak stresses during transport. The components (Figure 9b,d,e,i,j) have relatively uniform stress distribution, while the stress concentration is observed on the components (Figure 9a,c,f,k). Although the overall stress is less than the permissible requirement, the service life of the structure can be significantly extended by alleviating the stress concentration phenomenon.
Figure 10 illustrates the strain distribution of typical components, being moderate correlation with stress patterns. However, the peak strains for the composite components are found in the member of Figure 10f, followed by the member of Figure 10g, and the same for the metallic structural members are found in Figure 10h. It can be seen that the strain distribution does not exactly correspond to the stress concentration point, and the member shape and the layup sequence will have an effect on the stress transfer, which in turn affects the strain distribution.
(2)
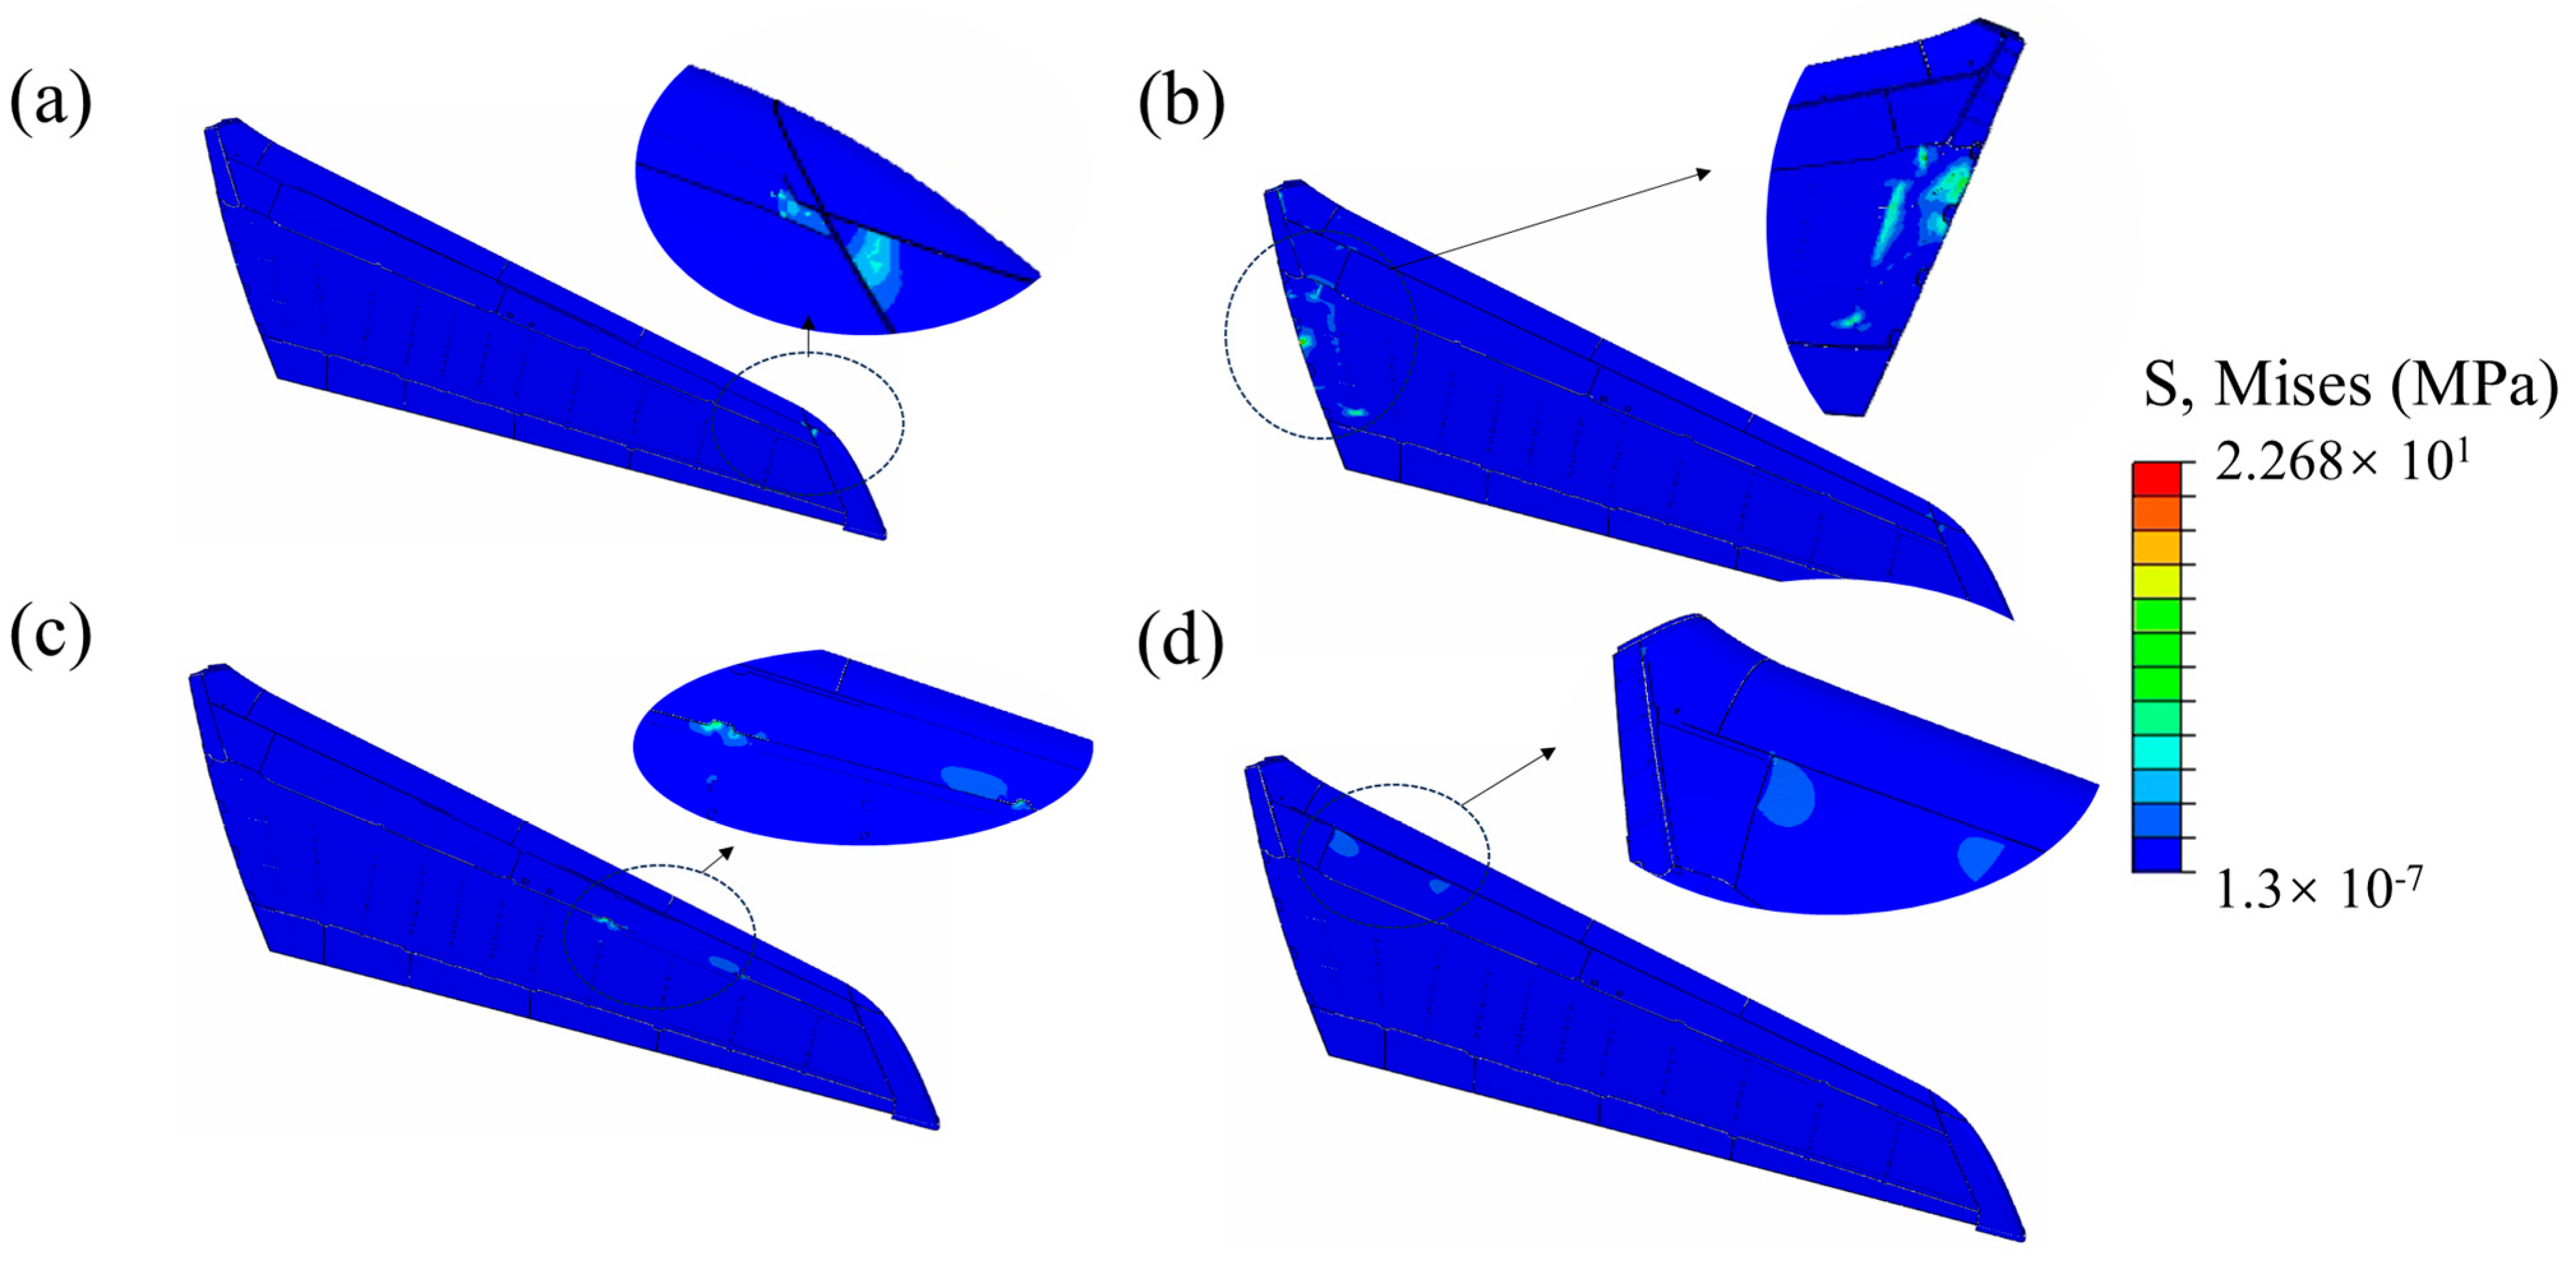
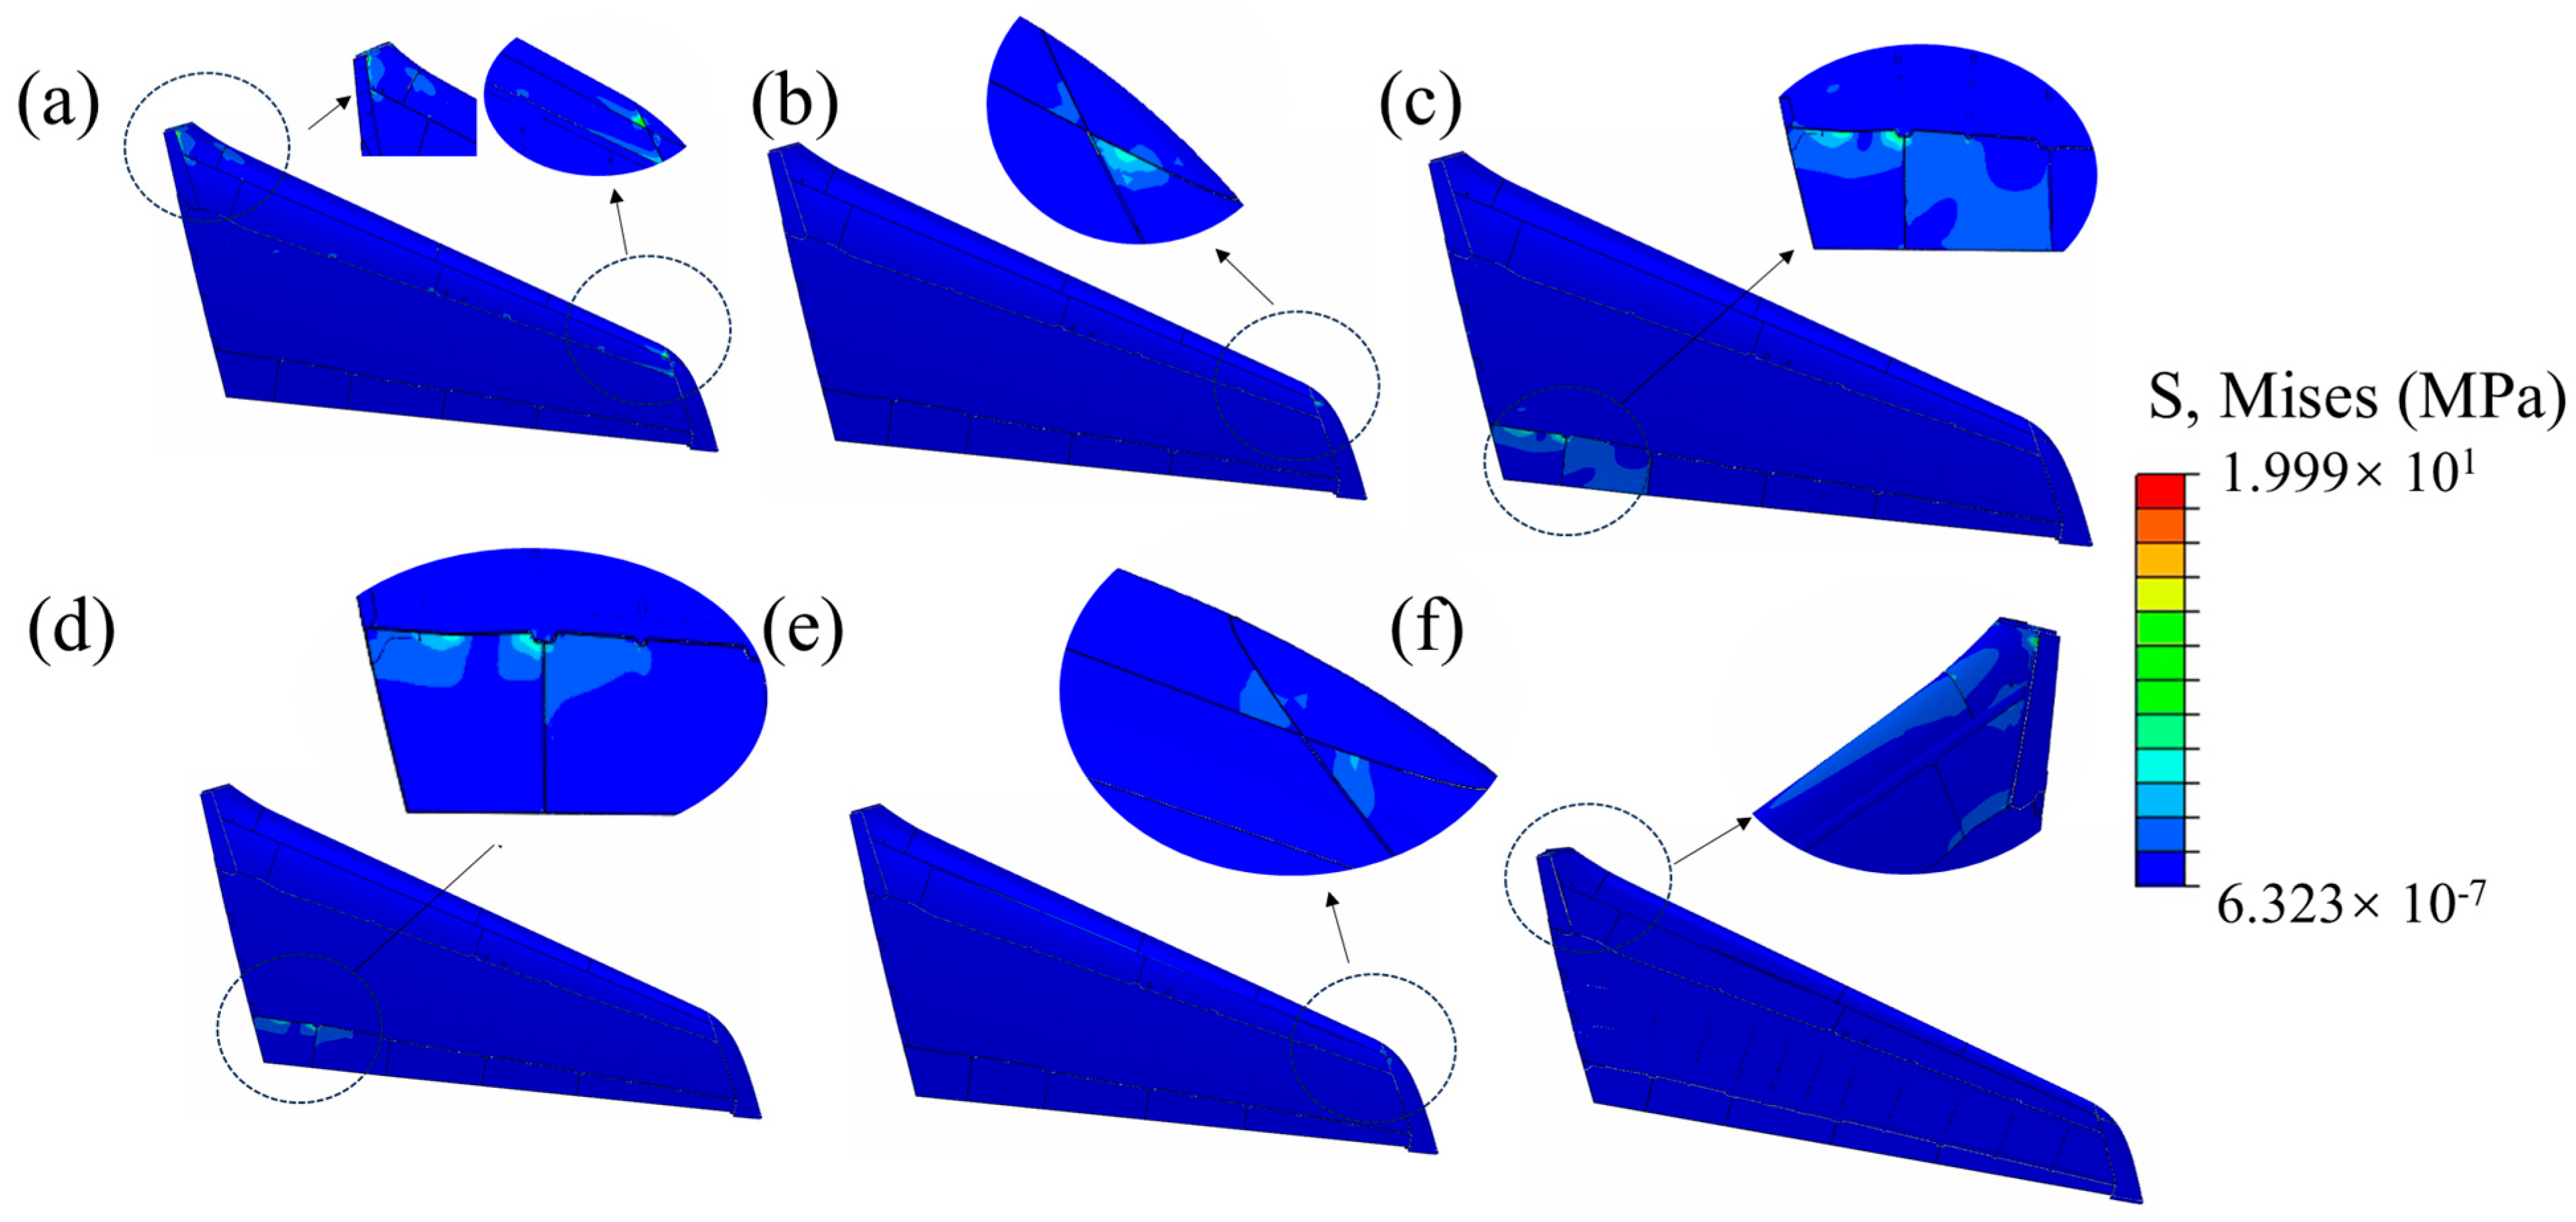
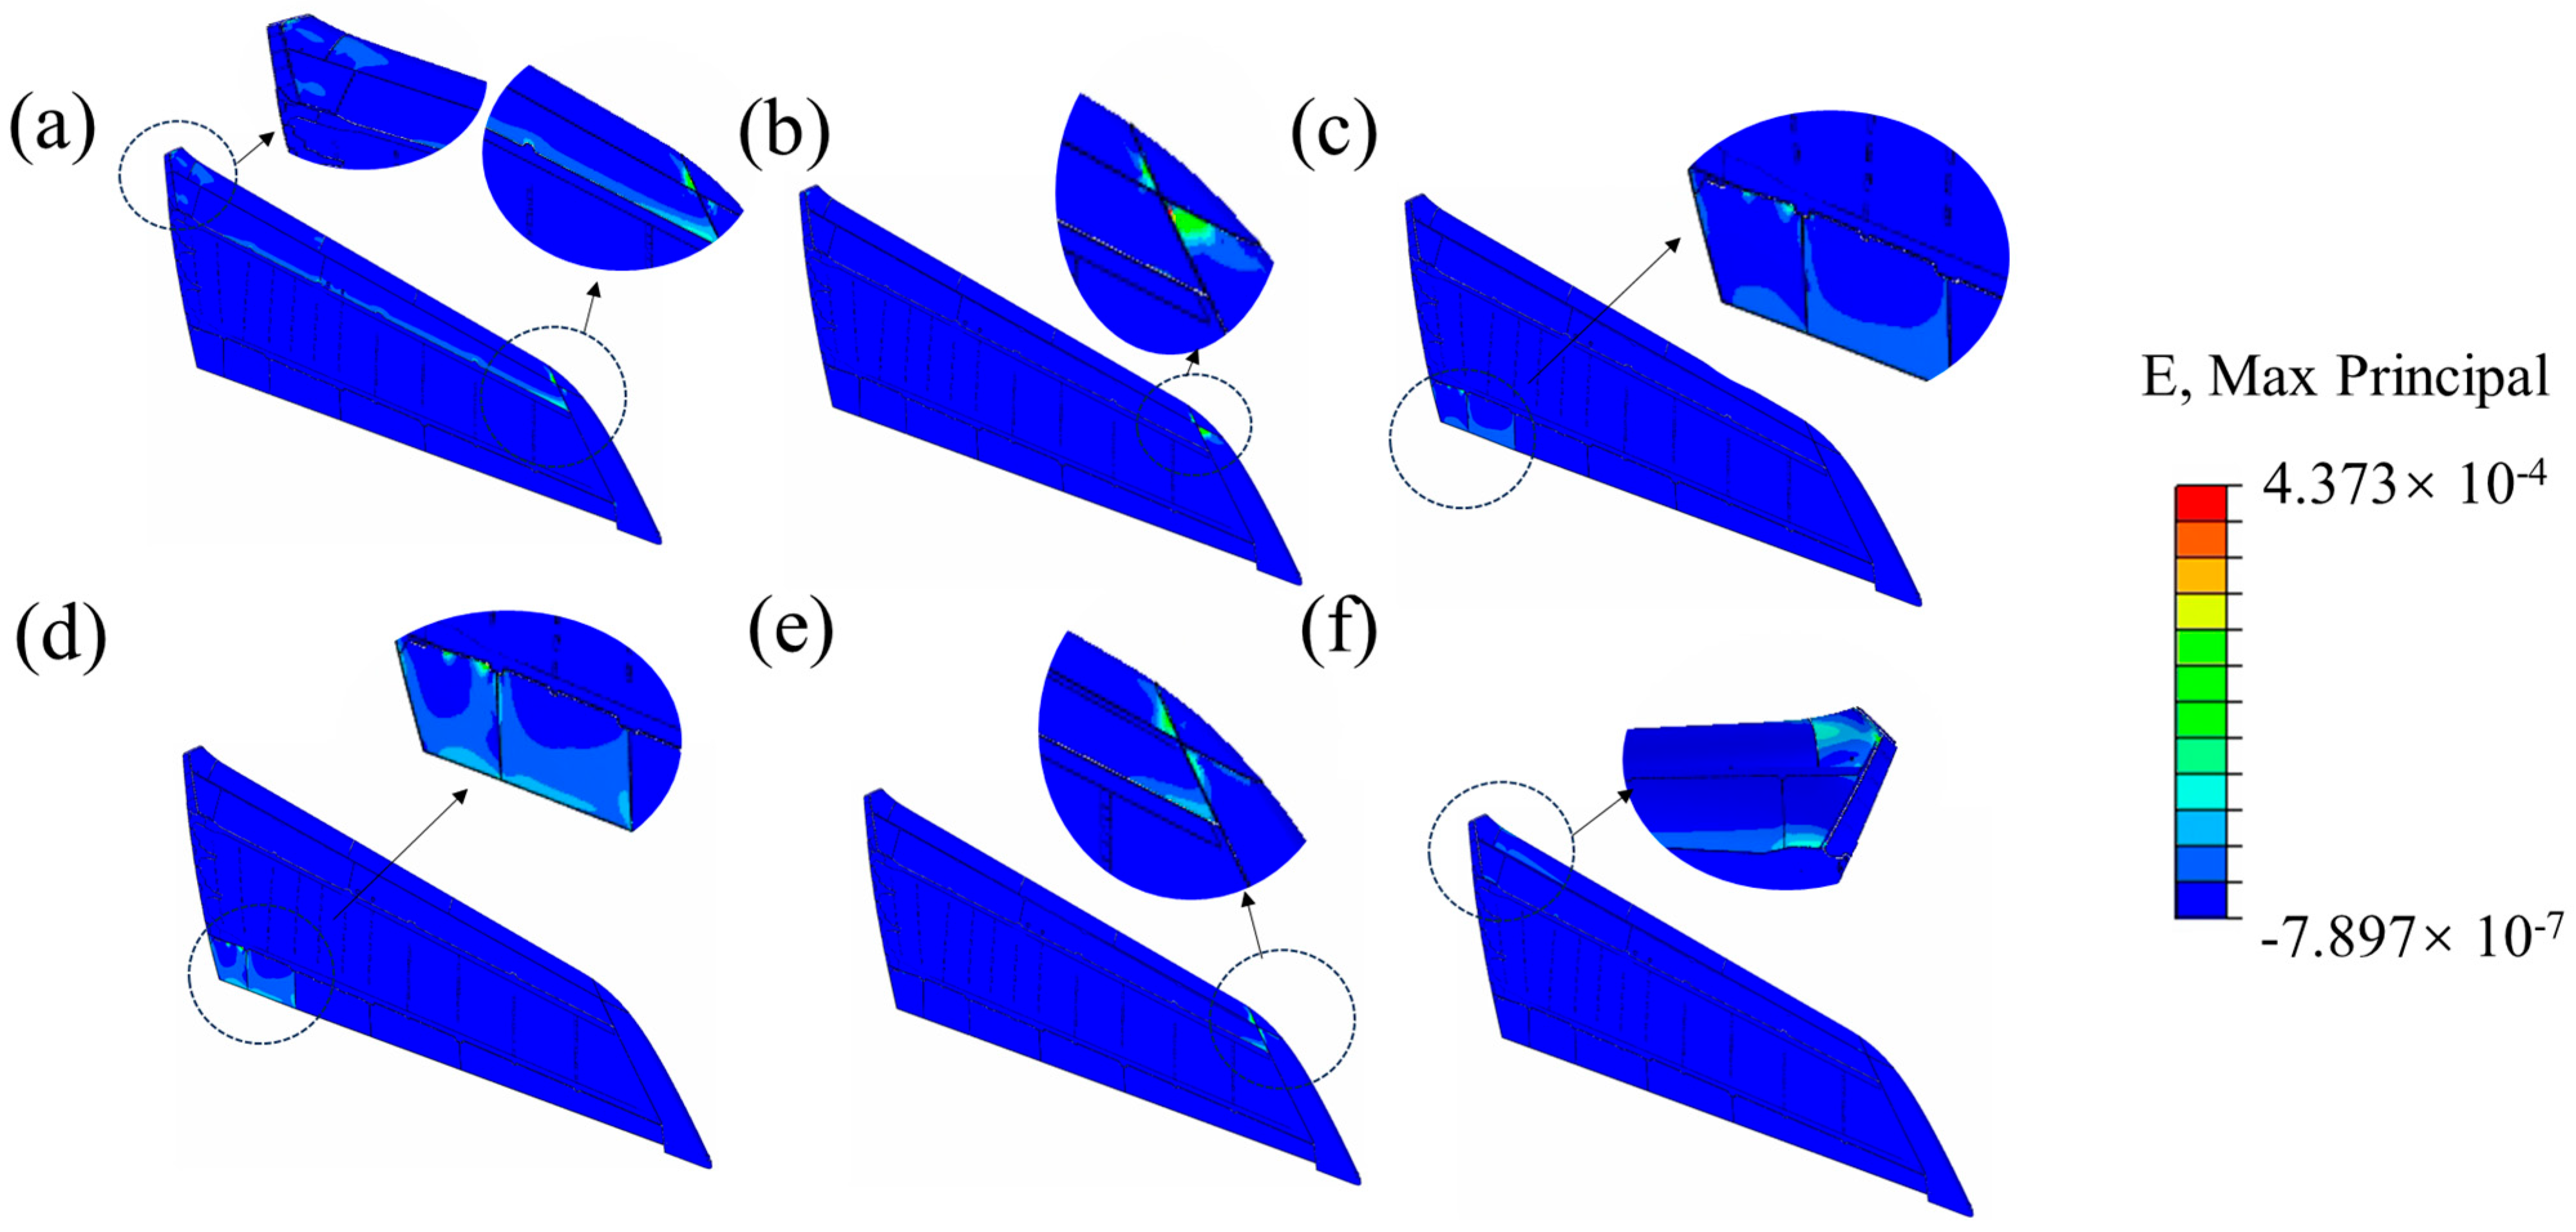
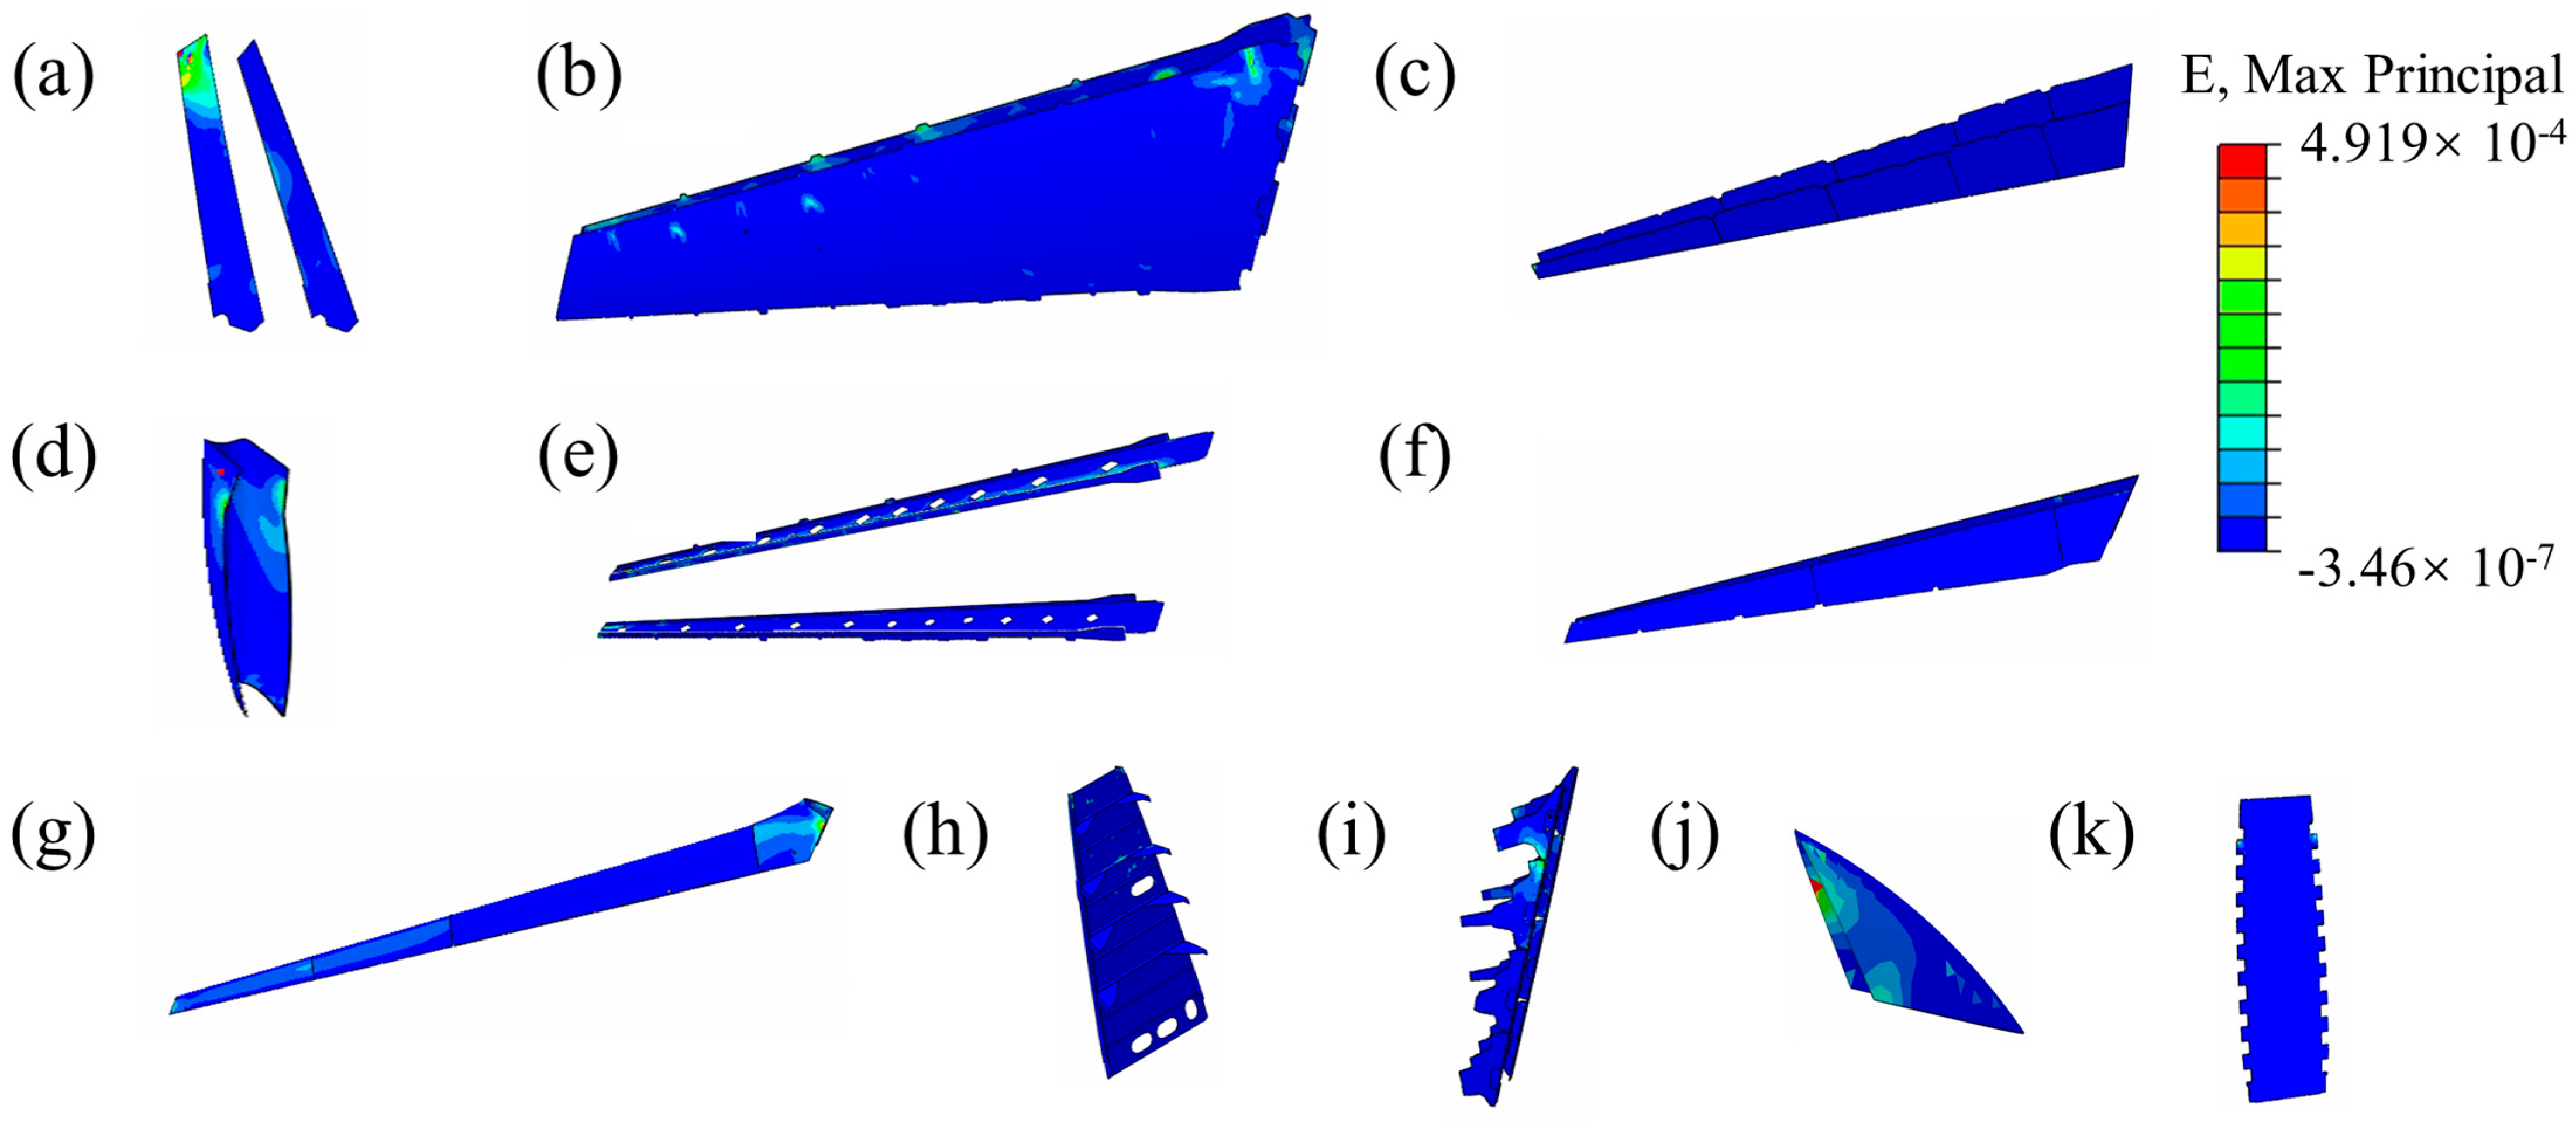
Interlaminar stress–strain response of typical substructures
Compared to metallic components, composite materials exhibit more complex damage evolution mechanisms during transportation. This study examines three representative composite substructures in SVT, aiming to investigate the effects of acceleration impacts on composite laminations during transportation.
The composites damage is usually characterized by transverse, longitudinal, and shear stresses. By comparative analysis, all interlaminar stress components during transportation remain below the von Mises stress level. Therefore, the von Mises stress criterion provides a conservative damage assessment. Composite damage is typically characterized by three stress components of plain composite laminates (PCLs, Figure 9a), variable-thickness laminates (VTLs, Figure 9b) and honeycomb-equivalent laminates (HELs, Figure 9d), respectively. The interlaminar stress–strain behavior of these typical substructures are discussed as follows.
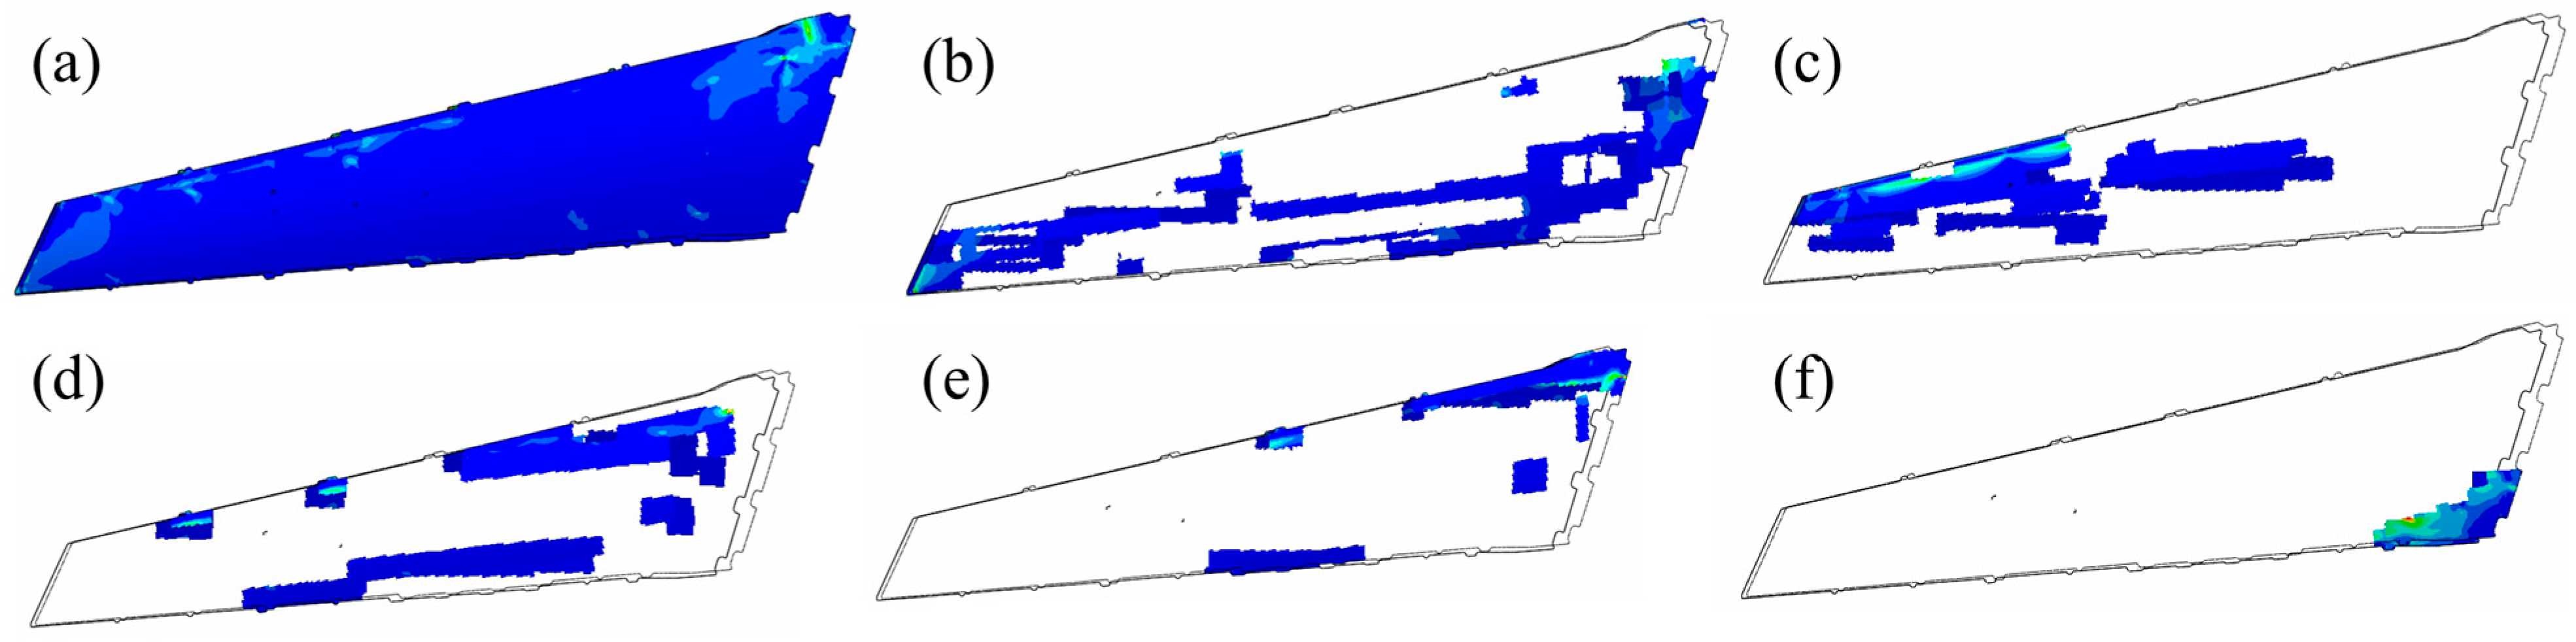
Interlaminar stress–strain behavior of PCL
The typical PCL consists of 17 plies with the layup sequence listed in Table 2. Figure 11 illustrates the through-thickness stress–strain evolution. The stress and strain exhibit a slight decrease followed by a significant increase with plies. During transportation, the stress is less than 1.5 MPa, and the strain is less than 70 με in the whole layup range, which greatly satisfies the requirements of the allowable values.
The stress and strain cloud maps of the 5th and 17th layers are plotted in the small graph in Figure 11. It shows that the stress and strain distributions in the 5th layer are more homogeneous than those in the 17th layer, because the 5th layer is located in the middle of the PCL. The area of stress distribution in the 17th layer is less than that of the 5th layer, especially the area of strain distribution where it is reduced abruptly. This is because the 17th layer is located on the outer side of the PCL, which is not only affected by the stress between the 16th layer, but also by its connection structure. Therefore, the risk of damage to the outer 17th layer of the PCL is higher compared to the inner layer.
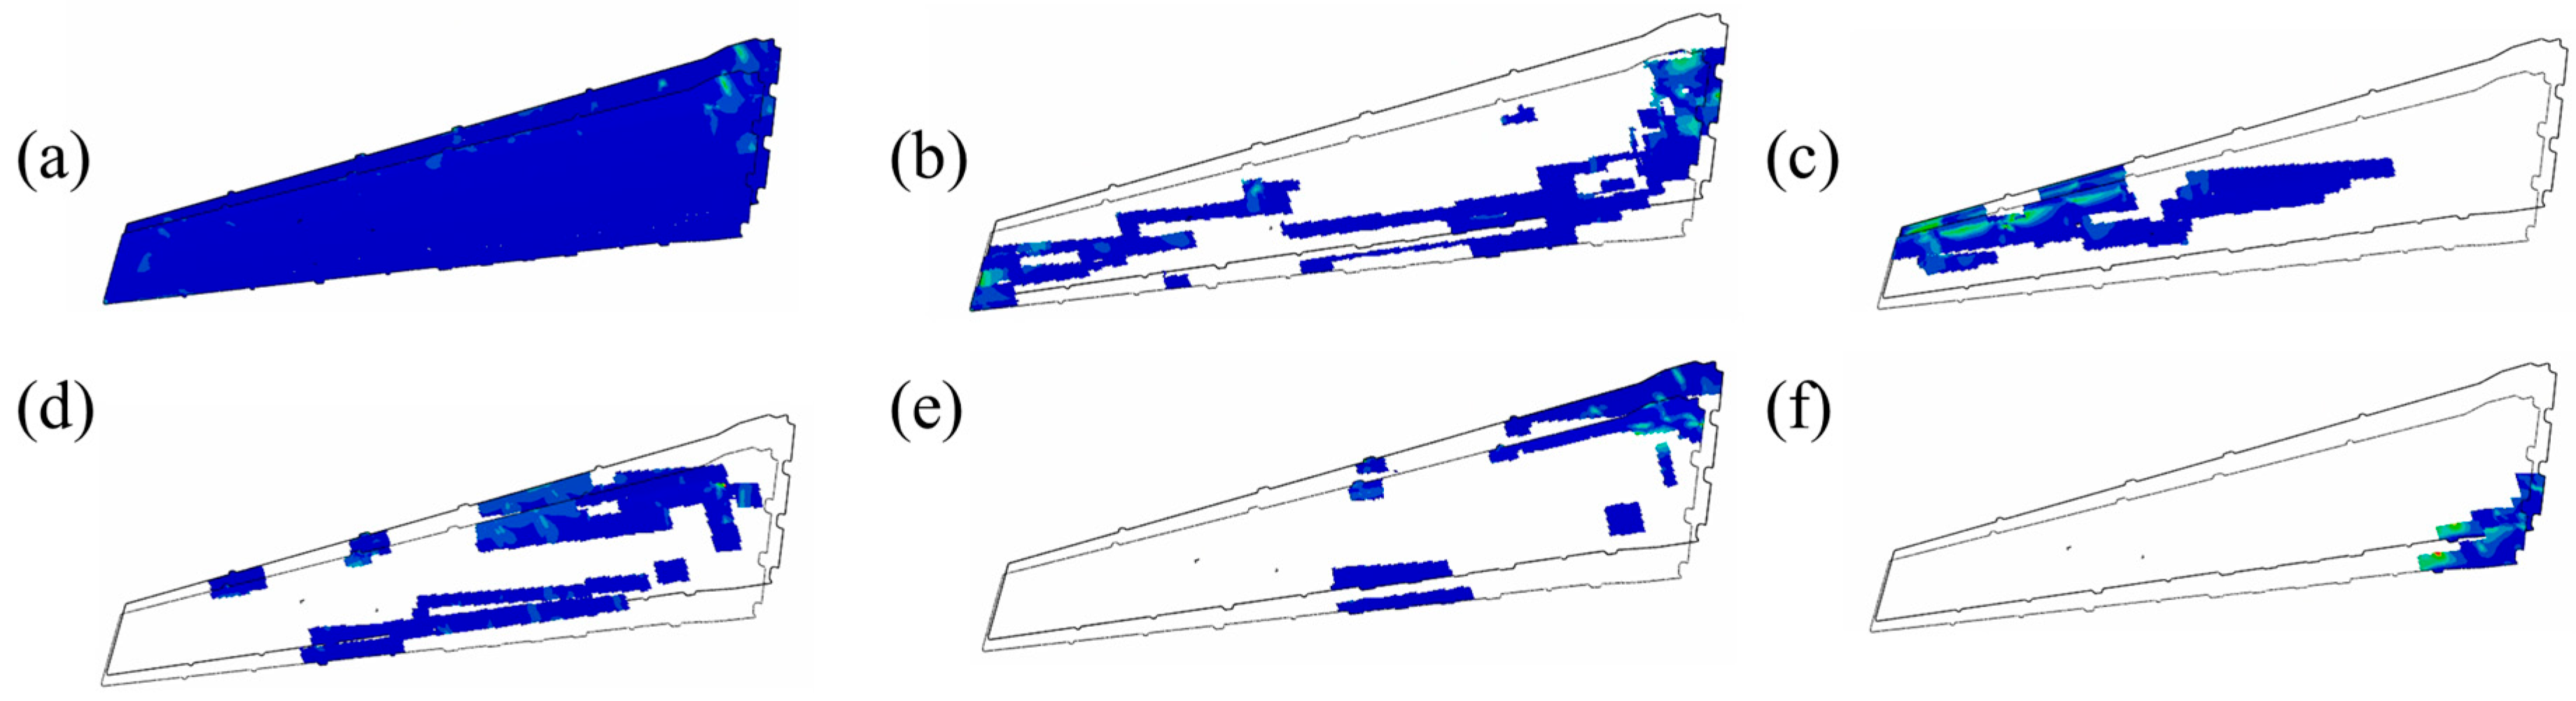
Interlaminar stress–strain behavior in VTL
The typical VTL has 43-ply with the layup sequence listed in Table 2. Figure 12 shows the trend of stress and strain with ply for the VTL. It can be found that in the first 24 plies, the stress and strain show obvious fluctuating trends with the increase in plies. In the 24th to 43rd layers, the strain gradually increases with the increase in layers, while the stress shows a fluctuating increasing trend. During transportation, the stresses in all layers were less than 3 MPa, and the strains were less than 45 με over the entire range of layers, which complied with the specified permissible values. The sudden decrease in stress–strain in the 24th ply is due to the area decrease in the variable-thickness layup area from the 23rd ply to the 24th ply. Comparing with the PCL, it can be found that the overall stress–strain variations of the VTL are more drastic, but their strain extremes are lower than those of the PCL. The extreme distribution of VTL interlaminar strains increases the risk of composite delamination damage.
The distribution of stress and strain for the VTL is plotted in Figure 13 and Figure 14. It can be found that the stress and strain distributions are well compatible, which explains their lower strains during transportation. Through the use of variable-thickness paving technology, it can effectively transfer the stress concentration area from the low layup to the high layup, thus further reducing the overall stress concentration effect and making the stress distribution more uniform. Nevertheless, the maximum strain values appear in Figure 14d, while the minimum strain values appear in Figure 14f. It indicates that the extreme values of the strains are not directly related to the layup area of the composite, but closely related to the position and angle of the layup.
Interlaminar stress–strain behavior in HEL
The typical HEL consists of 12 layers of composite with the layup sequence listed in Table 2. Unlike PCL and VTL, the stress–strain trend of HEL shows a U-shaped distribution, first decreasing, then flattening, and finally increasing, as shown in Figure 15. On the one hand, because HEL has symmetrical layups, this reduces the risk of interlaminar stress and internal delamination. During transportation, the stresses in each layer of the HEL are less than 1.5 MPa, and the strains are less than 60 με throughout the range of composite layers, which satisfy the allowable values. Comparing the strain changes of the three typical sub-structures, there is a correlation between the transient stress–strain trends during transportation and the layup angle.
The stress–strain distribution in the 10th, 11th, 17th, and 18th plies of the HEL is plotted in Figure 16. By comparing the stress distribution regions in Figure 16c,d with Figure 16g,h and Figure 16a,b with Figure 16e,f, it can be found that the stress distribution of the symmetric equivalent layer shows an increasing trend compared to the original layup. This phenomenon coincides with the trend of the stress values changing with the layup in Figure 15, which is mainly due to the large stress extremes, thus affecting the range of the surrounding high-strain distribution. Meanwhile, the stress–strain distribution of the honeycomb-equivalent laminates shows some compatibility, and the location of the high stress–strain distribution of the symmetric equivalent layer and the original ply layer remains the same.

5. Conclusions

This study developed an innovative model group collaborative analysis strategy to address the computational challenges posed by mesh proliferation in numerical simulations of complex assemblies. By integrating experimentally measured transportation vibration spectra with advanced numerical modeling, the nonlinear dynamic response of the symmetric vertical tail (SVT) under transport conditions is systematically elucidated. The key findings are summarized as follows:
(1)
The spatial-temporal reconstruction of 100 equivalent acceleration nodes enabled quantitative determination of stress–strain distribution patterns. The SVT dynamic response characterization reveals the critical stress concentration zones, which is helpful to the optimal packaging design and the safe transportation. The SVT vibration modal analysis identified four resonant frequency bands (39.906 Hz, 42.094 Hz, 47.225 Hz, and 59.981 Hz) requiring mitigation of stress concentration.
(2)
The transient response assessment obtained using the modal superposition method showed that the peak equivalent stress (11.61 MPa) during transportation is 82% below the threshold stress of land transportation standards. This indicates that the existing packaging solution has sufficient safety margins. Further analysis of the distribution characteristics of typical structural components reveals that by optimizing the stiffness distribution of the cushioning pads in the upper part of the SVT, the stress level in the critical region can be further reduced, which provides a clear direction for packaging improvement.
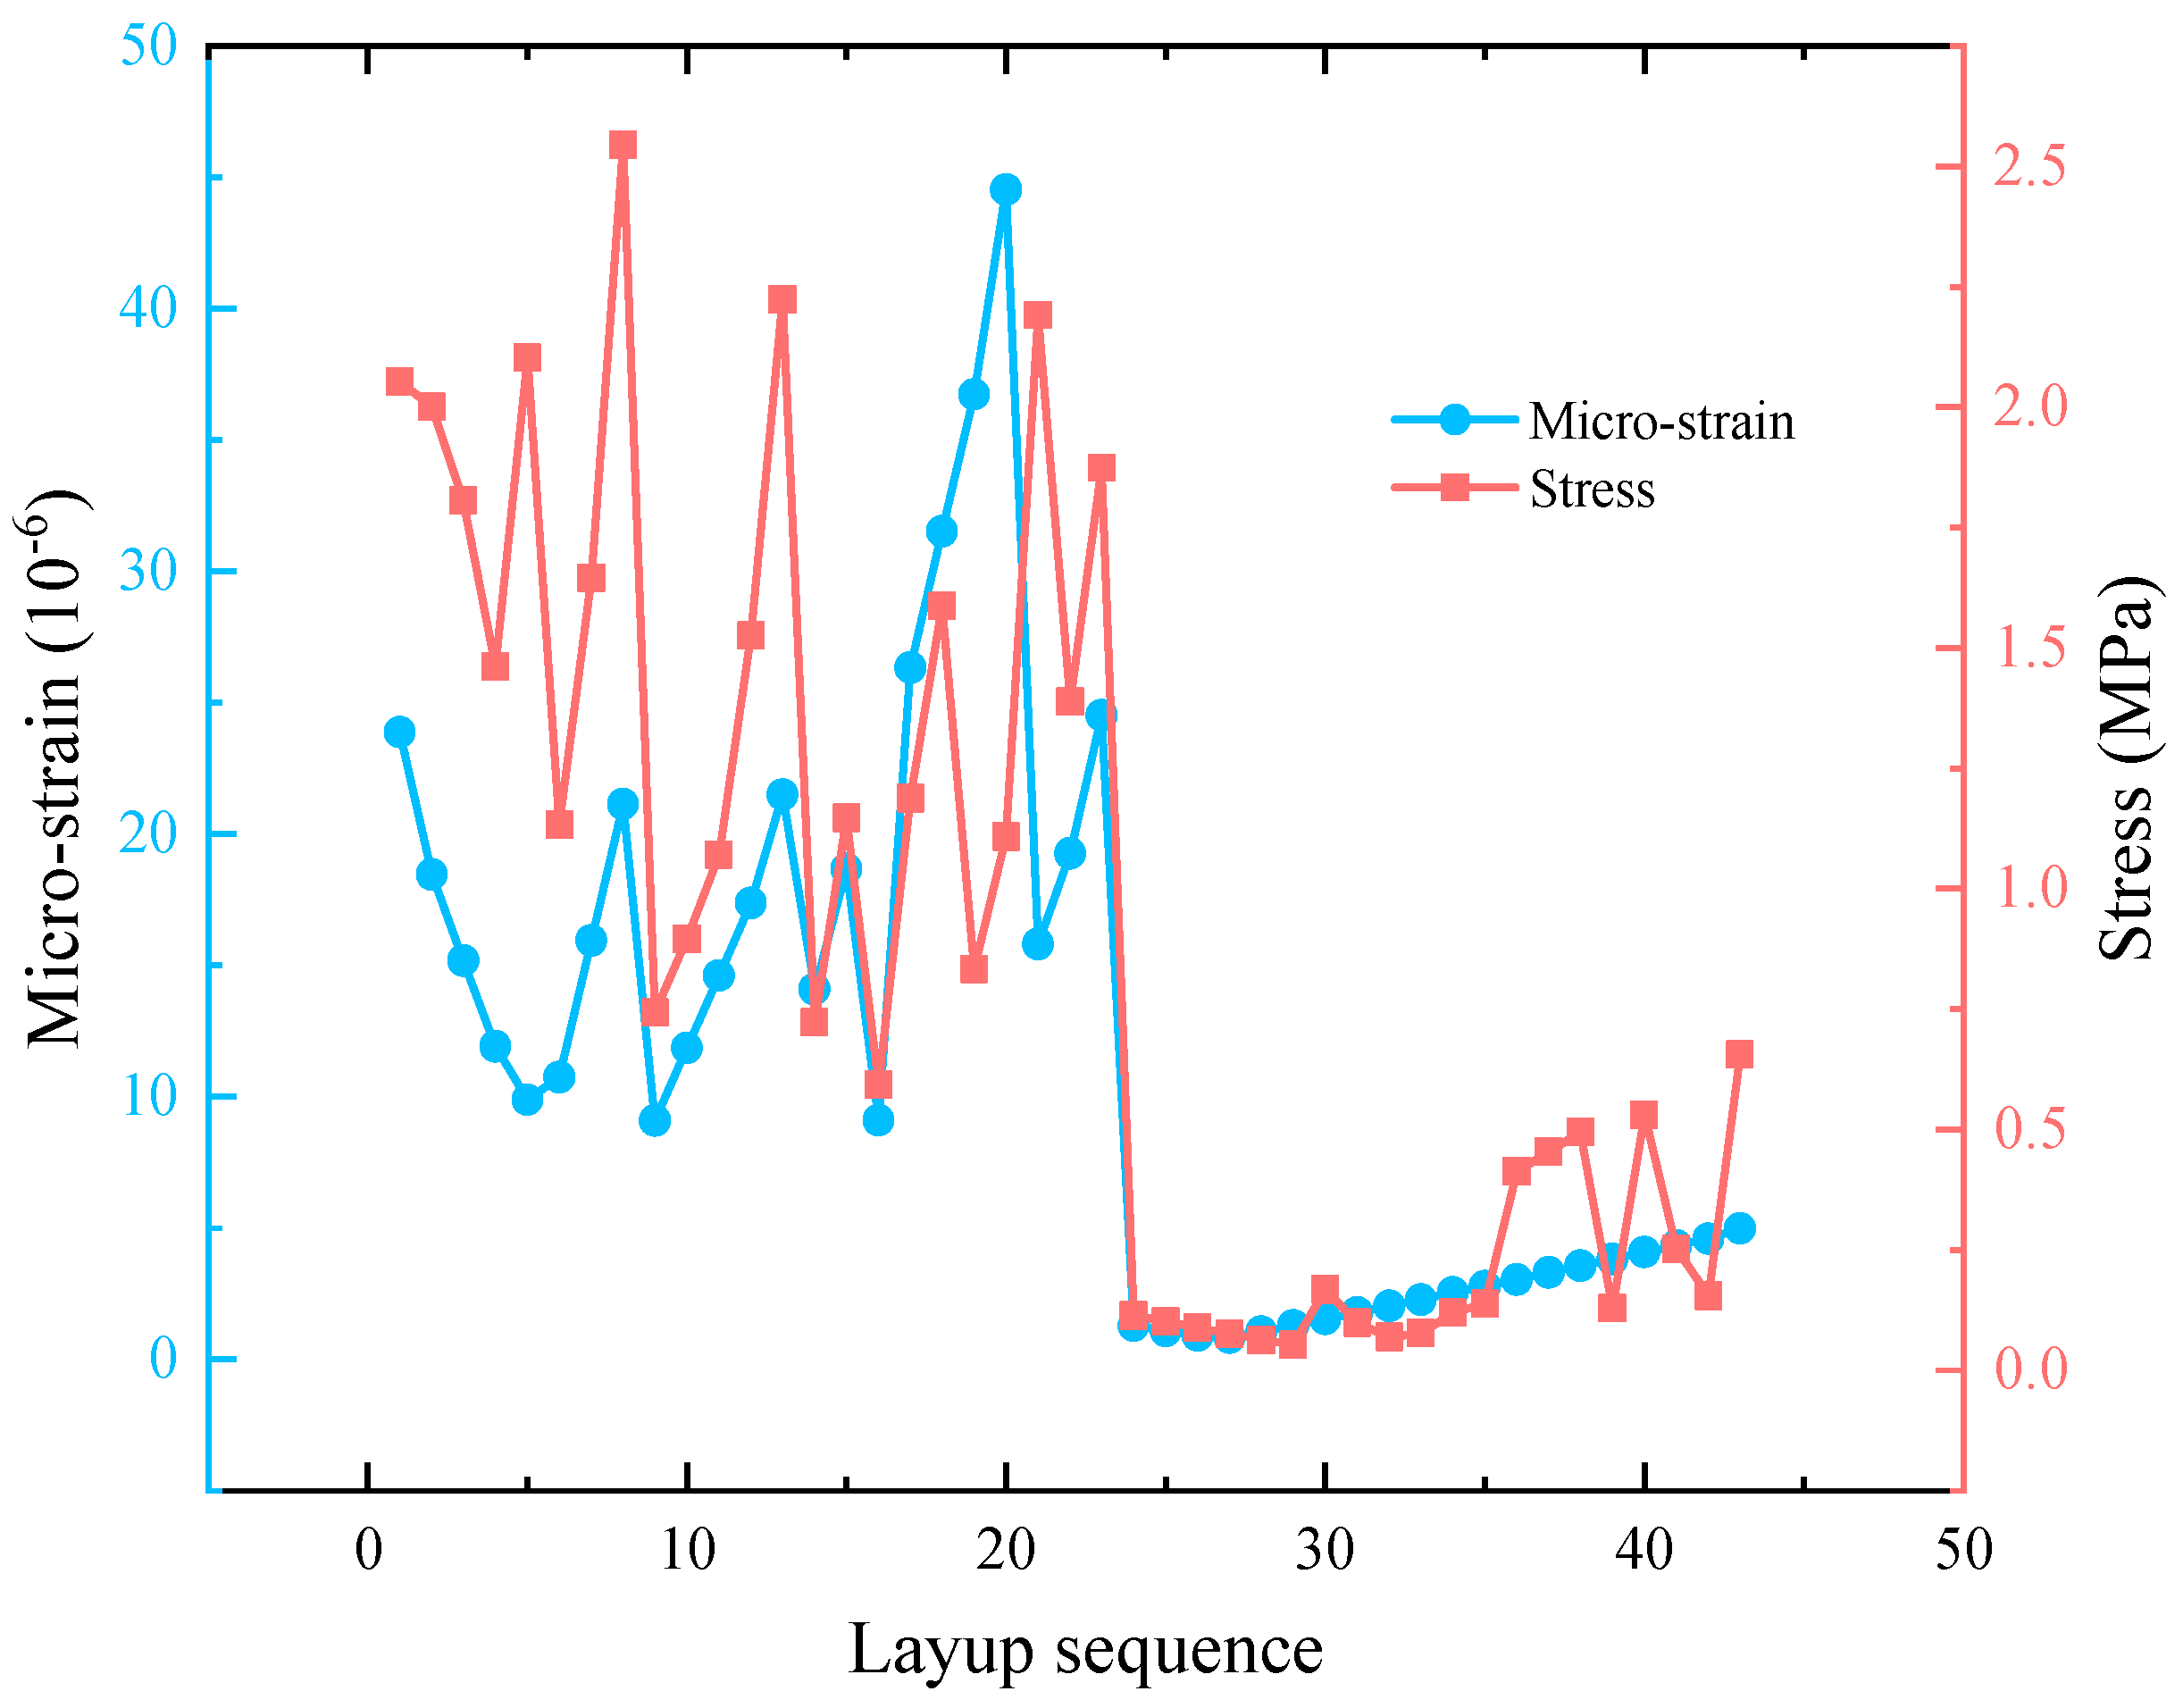
(3)
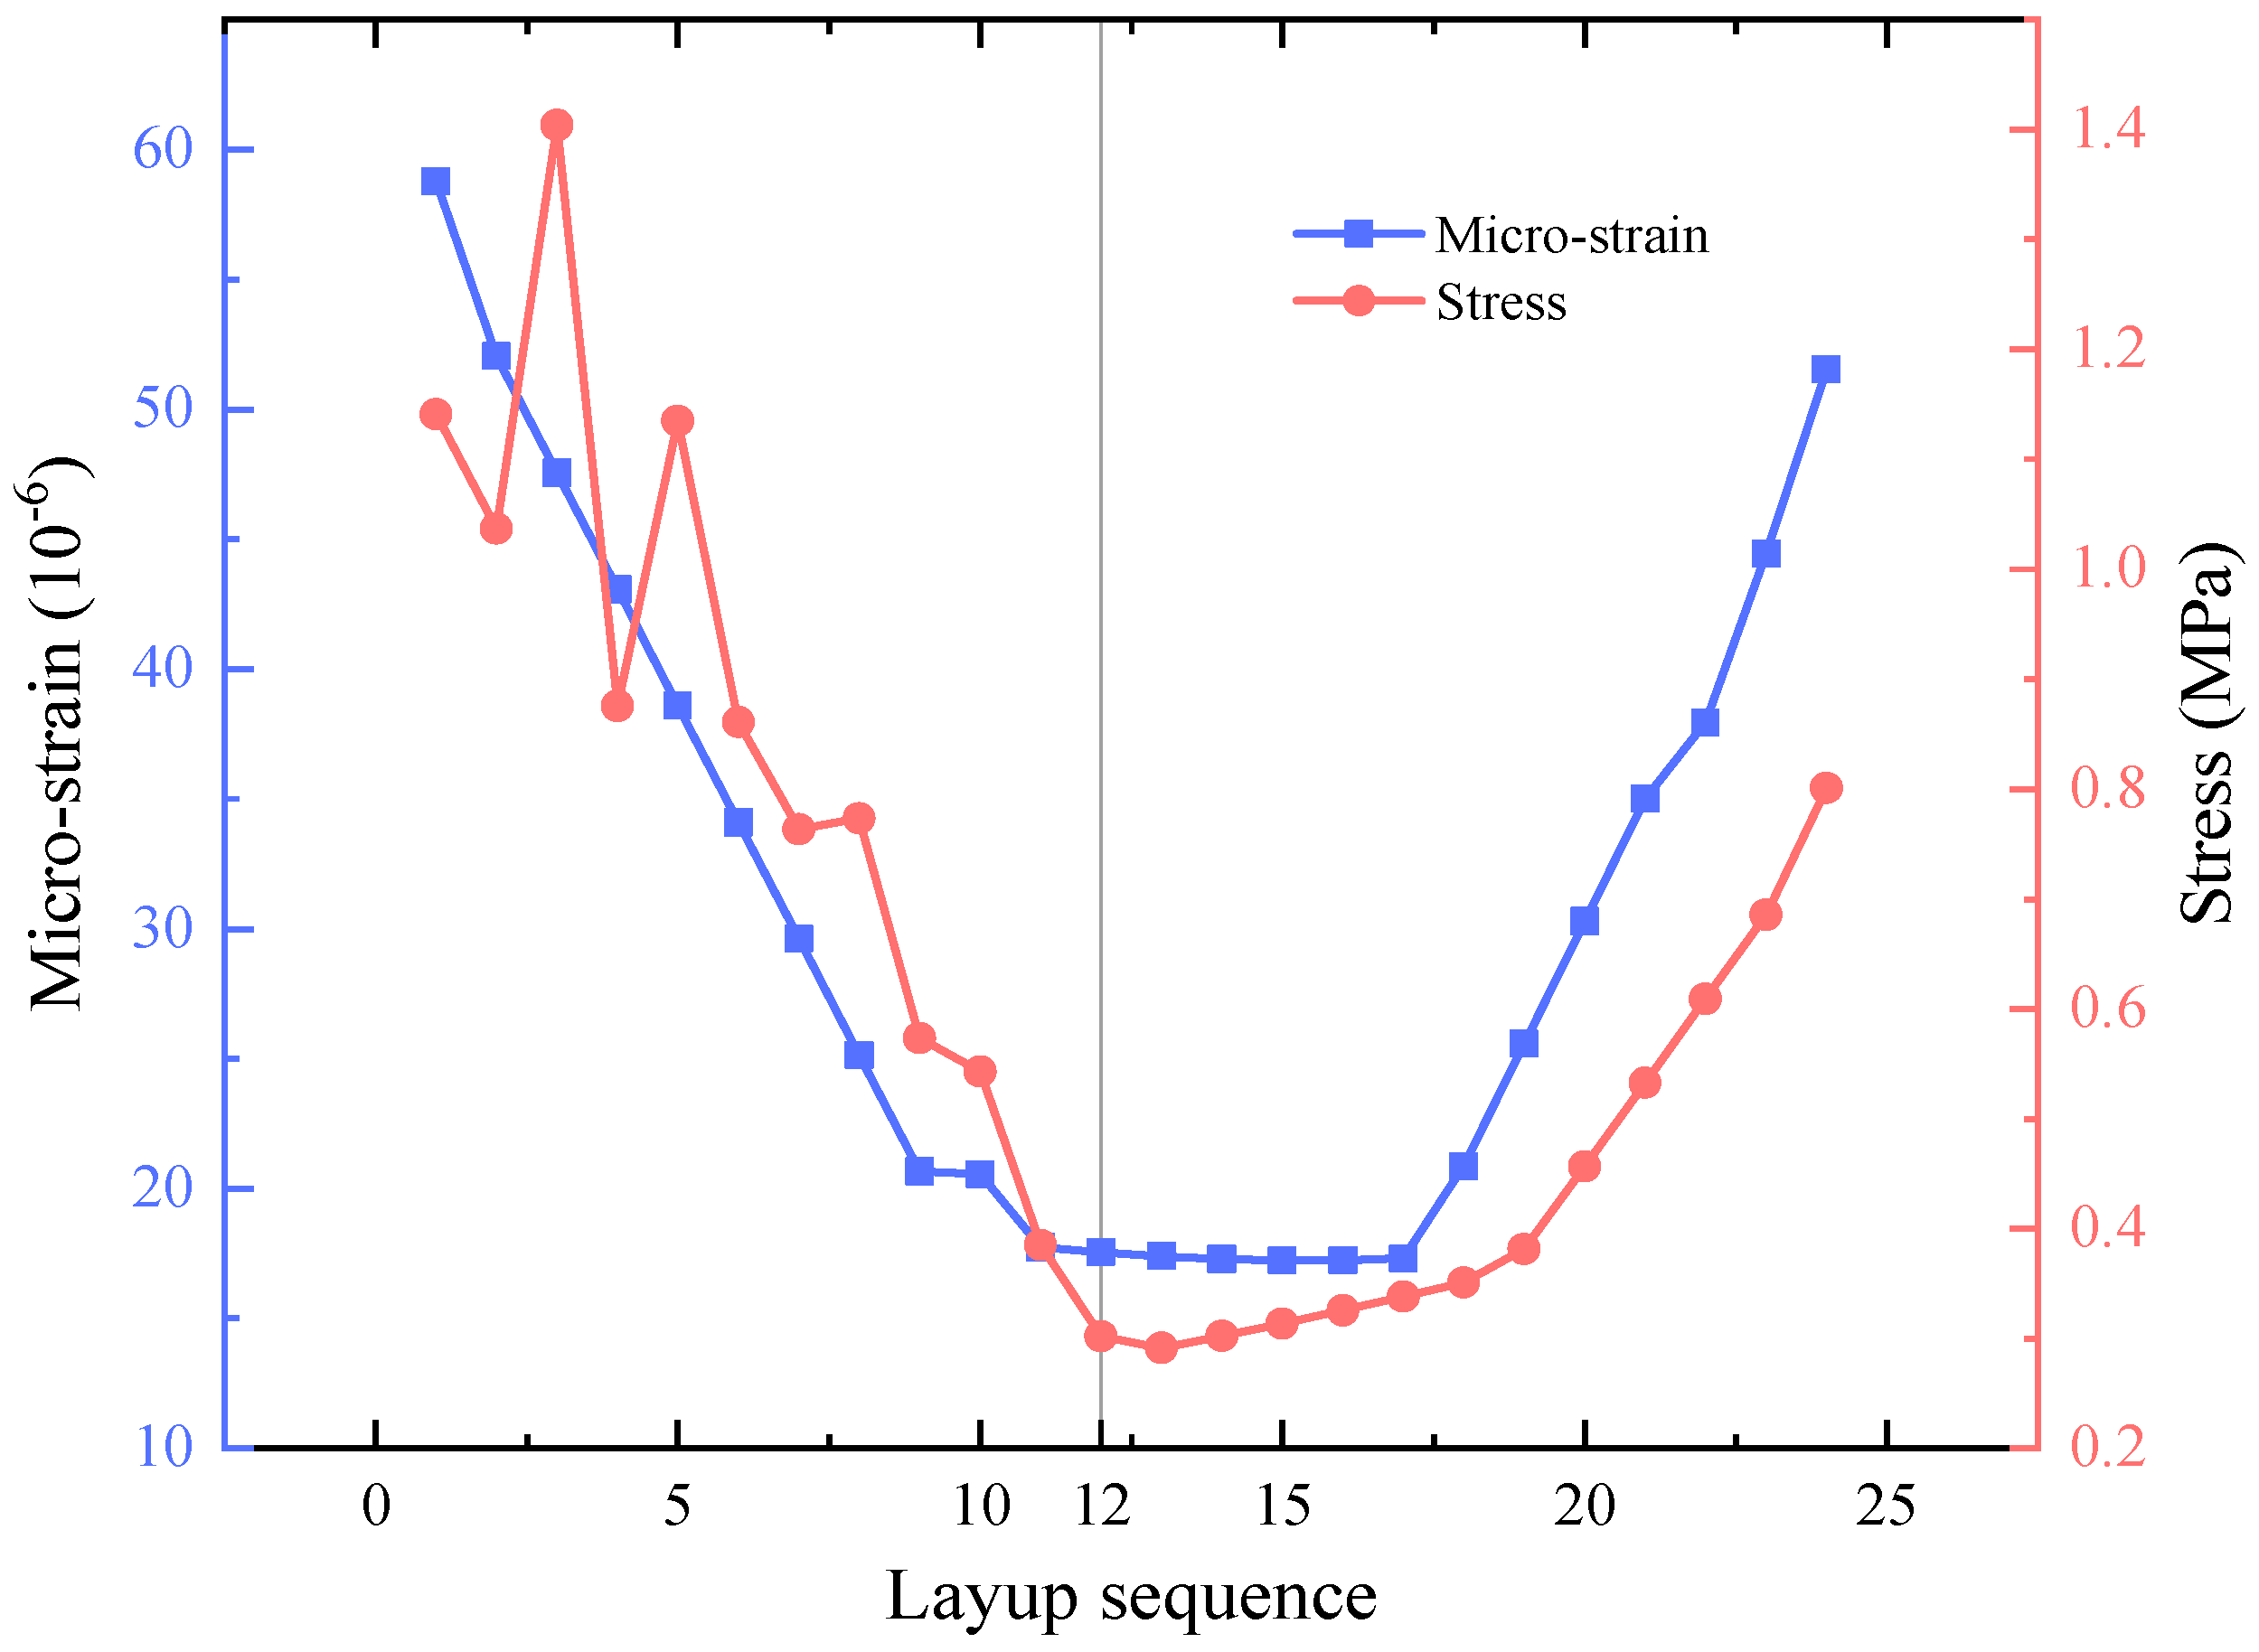
The stress distribution of a typical composite structure showed a quasi-periodic evolution pattern concerning the layup angle, while the strain response shows non-monotonic characteristics due to the stress redistribution effect of the variable-thickness design. This heterogeneous response mechanism reveals the physical nature of variable-thickness layups to effectively reduce the stress concentration effect and inhibit the strain development by improving the stress transfer path, which provides new theoretical support for the impact-resistant design of composite structures.
(4)
The established “load reconstruction-modal synthesis-transient solution” framework can provide fundamental understanding of composite structure transport dynamics, delivers a complete workflow for aviation packaging design, reduces computational costs through model group equivalence, and offers direct applicability to other aerospace transport systems.

Author Contributions

W.Z.: Investigation, Formal analysis, Writing, Methodology. W.Y. (Wubing Yang) and Z.L.: Supervision, Resources, Editing, Review, Methodology. S.L.: Review, Editing, Methodology. D.W.: Investigation, Resources. W.Y. (Weidong Yu) and Z.X.: Review, Methodology. L.P. and Y.W.: Validation. All authors have read and agreed to the published version of the manuscript.

Funding

This research received no external funding.

Data Availability Statement

Data will be made available on request.

Conflicts of Interest

Authors Wei Zheng, Wubing Yang, Sen Li, Dawei Wang, Weidong Yu, Zhuang Xing, and Lan Pang are employed by the AVIC SAC commercial aircraft company Ltd. The remaining authors declare that the research was conducted in the absence of any commercial or financial relationships that could be construed as potential conflicts of interest.

References

  1. Paternoster, A.; Vanlanduit, S.; Springael, J.; Braet, J. Measurement and Analysis of Vibration and Shock Levels for Truck Transport in Belgium with Respect to Packaged Beer during Transit. Food Packag. Shelf Life 2018, 15, 134–143. [Google Scholar] [CrossRef]
  2. Gobbato, M.; Conte, J.P.; Kosmatka, J.B.; Farrar, C.R. A Reliability-Based Framework for Fatigue Damage Prognosis of Composite Aircraft Structures. Probabilistic Eng. Mech. 2012, 29, 176–188. [Google Scholar] [CrossRef]
  3. Lu, F.; Ishikawa, Y.; Shiina, T.; Satake, T. Analysis of Shock and Vibration in Truck Transport in Japan. Packag. Technol. Sci. 2008, 21, 479–489. [Google Scholar] [CrossRef]
  4. Kuriakose, V.M.; Sreehari, V.M. Experimental Investigation on the Enhancement of Vibration and Flutter Characteristics of Damaged Composite Plates Using Piezoelectric Patches. Compos Struct. 2021, 275, 114518. [Google Scholar] [CrossRef]
  5. Pagani, A.; Enea, M.; Carrera, E. Component-Wise Damage Detection by Neural Networks and Refined FEs Training. J. Sound Vib. 2021, 509, 116255. [Google Scholar] [CrossRef]
  6. Luo, L.; Liu, D.; Jiang, Z.; Cheng, D. Research on the Design and Damping Control of Rocket Maritime Transportation Device. J. Phys. Conf. Ser. 2024, 2775, 012023. [Google Scholar] [CrossRef]
  7. Lepine, J.; Rouillard, V.; Sek, M. On the Use of Machine Learning to Detect Shocks in Road Vehicle Vibration Signals. Packag. Technol. Sci. 2017, 30, 387–398. [Google Scholar] [CrossRef]
  8. Kitazawa, H.; Li, L.; Hasegawa, N.; Rattanakaran, J.; Saengrayap, R. Evaluation of Shock-Proof Performance of New Cushioning System for Portable Packaging of Apples. Environ. Control. Biol. 2018, 56, 167–172. [Google Scholar] [CrossRef]
  9. Hasegawa, K. Analysis of Vibration and Shock Occurring in Transport Systems. Packag. Technol. Sci. 1989, 2, 69–74. [Google Scholar] [CrossRef]
  10. Rouillard, V.; Richmond, R. A Novel Approach to Analysing and Simulating Railcar Shock and Vibrations. Packag. Technol. Sci. 2007, 20, 17–26. [Google Scholar] [CrossRef]
  11. Singh, J.; Singh, S.P.; Joneson, E. Measurement and Analysis of US Truck Vibration for Leaf Spring and Air Ride Suspensions, and Development of Tests to Simulate These Conditions. Packag. Technol. Sci. 2006, 19, 309–323. [Google Scholar] [CrossRef]
  12. Griffiths, K.R.; Hicks, B.J.; Keogh, P.S.; Shires, D. Wavelet Analysis to Decompose a Vibration Simulation Signal to Improve Pre-Distribution Testing of Packaging. Mech. Syst. Signal Process 2016, 76–77, 780–795. [Google Scholar] [CrossRef]
  13. Fan, Y.; Xu, B.; Wang, J.; Wu, J.; Liu, Z.; Cai, L. Transport Vibration and Shock Characteristics of A 110 KV/40MVA Vehicular Mobile Transformer. IEEJ Trans. Electr. Electron. Eng. 2022, 17, 1110–1120. [Google Scholar] [CrossRef]
  14. Paternoster, A.; Vanlanduit, S.; Springael, J.; Braet, J. Vibration and Shock Analysis of Specific Events during Truck and Train Transport of Food Products. Food Packag. Shelf Life 2018, 15, 95–104. [Google Scholar] [CrossRef]
  15. Hu, R.Z.; Liu, L.; Liu, E.J.; Tu, J.; Yao, X.H.; Song, P.; Zhang, D.Y.; Huang, Z.H.; Chen, T. Biomimetic Hierarchical Composites Inspired by Natural Pomelo Peel for Mechanical-Damage Resistance and Storage of Fruits. Chem. Eng. J. 2024, 485, 149853. [Google Scholar] [CrossRef]
  16. Lee, W.; Kim, J.; Park, C. Topology Optimization for Polymeric Foam Shock-Absorbing Structure Using Hybrid Cellular Automata. Int. J. Autom. Technol. 2014, 8, 365–375. [Google Scholar] [CrossRef]
  17. Qu, D.; Liu, X.; Liu, G.; Bai, Y.; He, T. Analysis of Vibration Isolation Performance of Parallel Air Spring System for Precision Equipment Transportation. Meas. Control. 2019, 52, 291–302. [Google Scholar] [CrossRef]
  18. Huang, X.; Su, J.; Ren, L.; Hua, H. Development of Curved Beam Periodic Structure in Broadband Resonance Suppression for Cylindrical Shell Structure. JVC/J. Vib. Control. 2017, 23, 1267–1284. [Google Scholar] [CrossRef]
  19. Li, Y.; Wang, K.; Yang, H.; Sun, Y.; Zhang, H.; Xiao, K.; Li, Z.; Li, D.; Li, J. Solid-Liquid Triboelectric Nanogenerator Based Self-Sensing Vibration Device. Nano Energy 2024, 131, 110211. [Google Scholar] [CrossRef]
  20. Hu, Y.; Wang, K.; Chen, M.Z.Q. Semi-Active Suspensions with Low-Order Mechanical Admittances Incorporating Inerters. In Proceedings of the 2015 27th Chinese Control and Decision Conference, CCDC 2015, Qingdao, China, 23–25 May 2015. [Google Scholar]
  21. He, F.; Du, J.; Liu, Y. The Bio-Inspired Spider Web Dynamic Vibration Absorber Applied to the transverse-Torsional-Axial Vibration in Rotor Systems. Mech. Syst. Signal Process 2025, 237, 112993. [Google Scholar] [CrossRef]
  22. Kakou, P.; Barry, O. Simultaneous Vibration Reduction and Energy Harvesting of a Nonlinear Oscillator Using a Nonlinear Electromagnetic Vibration Absorber-Inerter. Mech. Syst. Signal Process 2021, 156, 107607. [Google Scholar] [CrossRef]
  23. Joubaneh, E.F.; Barry, O.R. On the Improvement of Vibration Mitigation and Energy Harvesting Using Electromagnetic Vibration Absorber-Inerter: Exact H2 Optimization. J. Vib. Acoust. 2019, 141, 061007. [Google Scholar] [CrossRef]
  24. Liu, C.; Chen, L.; Lee, H.P.; Yang, Y.; Zhang, X. A Review of the Inerter and Inerter-Based Vibration Isolation: Theory, Devices, and Applications. J. Franklin Inst. 2022, 359, 7677–7707. [Google Scholar] [CrossRef]
  25. Lee, Y.-S.; Ryu, C.-H.; Kim, H.-S.; Choi, Y.-J. A Study on the Free Drop Impact of a Cask Using Commercial FEA Codes. Nucl. Eng. Des. 2005, 235, 2219–2226. [Google Scholar] [CrossRef]
  26. Bernad, C.; Laspalas, A.; González, D.; Liarte, E.; Jiménez, M.A. Dynamic Study of Stacked Packaging Units by Operational Modal Analysis. Packag. Technol. Sci. 2010, 23, 121–133. [Google Scholar] [CrossRef]
  27. Kim, W.-J.; Kum, D.-H.; Park, S.-H. Effective Design of Cushioning Package to Improve Shockproof Characteristics of Large-Sized Home Appliances. Mech. Based Des. Struc. 2009, 37, 1–14. [Google Scholar] [CrossRef]
  28. Zhang, H.; Feng, X. Study on Damage Analysis and Random Vibration Detection of Transportation Goods. In Lecture Notes in Electrical Engineering; Springer: Berlin/Heidelberg, Germany, 2018; Volume 477. [Google Scholar]
  29. Pan, X.; Lin, Y.; Liu, X.; Han, Y. Design and Implementation of a Vibration Measurement and Analysis System for Spacecraft Road Transportation. In Proceedings of the 6th International Conference on Traffic Engineering and Transportation System (ICTETS 2022), Guangzhou, China, 23–25 September 2022; p. 1259101. [Google Scholar] [CrossRef]
  30. Wunderlich, T.F.; Dähne, S.; Reimer, L.; Schuster, A. Global Aerostructural Design Optimization of More Flexible Wings for Commercial Aircraft. J. Aircr. 2021, 58, 6. [Google Scholar] [CrossRef]
  31. Kennedy, G.J.; Martinsy, J.R.R.A. A Comparison of Metallic and Composite Aircraft Wings Using Aerostructural Design Optimization. In Proceedings of the 12th AIAA Aviation Technology, Integration and Operations (ATIO) Conference and 14th AIAA/ISSMO Multidisciplinary Analysis and Optimization Conference, Indianapolis, IN, USA, 17–19 September 2012. [Google Scholar]
  32. Ma, Y.; Abouhamzeh, M.; Elham, A. Geometrically Nonlinear Coupled Adjoint Aerostructural Optimization of Natural-Laminar-Flow Strut-Braced Wing. J. Aircr. 2023, 60, 3. [Google Scholar] [CrossRef]
  33. Krupa, E.P.; Cooper, J.E.; Pirrera, A.; Nangia, R. Improved Aerostructural Performance via Aeroservoelastic Tailoring of a Composite Wing. Aeronaut. J. 2018, 122, 1442–1474. [Google Scholar] [CrossRef]
  34. Brooks, T.R.; Martins, J.R.R.A.; Kennedy, G.J. Aerostructural Tradeoffs for Tow-Steered Composite Wings. J Aircr. 2020, 57, 5. [Google Scholar] [CrossRef]
  35. Zhang, X.; Wu, X.; He, Y.; Yang, S.; Chen, S.; Zhang, S.; Zhou, D. CFRP Barely Visible Impact Damage Inspection Based on an Ultrasound Wave Distortion Indicator. Compos. B Eng. 2019, 168, 152–158. [Google Scholar] [CrossRef]
  36. Wanhill, R.J.H.; Molent, L.; Barter, S.A. Milestone Case Histories in Aircraft Structural Integrity. In Comprehensive Structural Integrity; Elsevier: Amsterdam, The Netherlands, 2023. [Google Scholar]
  37. Lotfi, A.; Li, H.; Dao, D.V.; Prusty, G. Natural Fiber–Reinforced Composites: A Review on Material, Manufacturing, and Machinability. J. Thermoplast. Compos. Mater. 2021, 34, 089270571984454. [Google Scholar] [CrossRef]
  38. Nauman, S. Piezoresistive Sensing Approaches for Structural Health Monitoring of Polymer Composites—A Review. Eng 2021, 2, 197–226. [Google Scholar] [CrossRef]
  39. Shah, S.Z.H.; Lee, J.; Megat-Yusoff, P.S.M.; Hussain, S.Z.; Sharif, T.; Choudhry, R.S. Multiscale Damage Modelling of Notched and Un-Notched 3D Woven Composites with Randomly Distributed Manufacturing Defects. Compos Struct. 2023, 318, 117109. [Google Scholar] [CrossRef]
  40. Mendoza, E.A.; Prohaska, J.P.; Kempen, C.; Esterkin, Y.; Sunjian, S. Fiber Optic Acousto-Ultrasound Condition Monitoring System for Advanced Structures. In Proceedings of the SHMII 2015—7th International Conference on Structural Health Monitoring of Intelligent Infrastructure, Torino, Italy, 1–3 July 2015. [Google Scholar]
  41. Shipunov, G.S.; Baranov, M.A.; Nikiforov, A.S.; Golovin, D.V.; Tihonova, A.A. Study Smart-Layer Effect on the Physical and Mechanical Characteristics of the Samples from Polymer Composite Materials under Quasi-Static Loading. PNRPU Mech. Bull. 2020, 2020, 188–200. [Google Scholar] [CrossRef] [PubMed]
  42. Wang, B.; Zhong, S.; Lee, T.L.; Fancey, K.S.; Mi, J. Non-Destructive Testing and Evaluation of Composite Materials/Structures: A State-of-the-Art Review. arXiv 2020, arXiv:2002.12201. [Google Scholar] [CrossRef]
  43. Huang, S.; Geng, Y.; Han, Y.; Gu, M. Design of Shocks & Vibrations Monitoring System for Long Distance Transportation in Confined Spaces. In Proceedings of the 2023 China Automation Congress (CAC), Chongqing, China, 17–19 November 2023; pp. 4886–4892. [Google Scholar]
  44. ASTM D4169-23; Standard Practice for Performance Testing of Shipping Containers and Systems. ASTM International: West Conshohocken, PA, USA, 2023.
  45. Kumar, M.; Kar, V.R.; Chandravanshi, M.L. Free Vibration Analysis of Sandwich Composite Plate with Honeycomb Core. Mater. Today Proc. 2022, 56, 931–935. [Google Scholar] [CrossRef]
  46. Rezaiee-Pajand, M.; Sarmadi, H.; Entezami, A. A Hybrid Sensitivity Function and Lanczos Bidiagonalization-Tikhonov Method for Structural Model Updating: Application to a Full-Scale Bridge Structure. Appl. Math. Model. 2021, 89, 860–884. [Google Scholar] [CrossRef]
  47. Tieming, X.; Shuiting, Z.; Liao, Y. Free Modal Analysis for Spiral Bevel Gear Wheel Based on the Lanczos Method. Open Mech. Eng. J. 2015, 9, 637–645. [Google Scholar] [CrossRef]
  48. Dassault Systèmes. Abaqus Analysis User’s Guide: Analysis Volume; Dassault Systèmes: Paris, France, 2021. [Google Scholar]
Figure 1. Models of SVT and WPB.
Symmetry 17 01182 g001
Figure 2. Acceleration load profile during transportation.
Symmetry 17 01182 g002
Figure 3. Flowchart for transient analysis of SVT.
Symmetry 17 01182 g003
Figure 4. Variation of stress–strain distribution with modal order for SVT.
Symmetry 17 01182 g004
Figure 5. Stress variation for (a) 11th, (b) 12th, (c) 15th, and (d) 18th modes.
Symmetry 17 01182 g005
Figure 6. Stress distribution of SVT in the first six orders of modal analysis, (a) 1st, (b) 2nd, (c) 3rd, (d) 4th, (e) 5th and (f) 6th modes.
Symmetry 17 01182 g006
Figure 7. Strain distribution of SVT in the first six orders of modal analysis (a) 1st, (b) 2nd, (c) 3rd, (d) 4th, (e) 5th and (f) 6th modes.
Symmetry 17 01182 g007
Figure 8. Stress–strain distribution for SVT transient analysis, (a) Von Mises distribution, (b) strain distribution.
Symmetry 17 01182 g008
Figure 9. Transient stress distribution in typical components in SVT: (ag) composite elements, (hk) metal elements.
Symmetry 17 01182 g009
Figure 10. Transient strain distribution of typical components in SVT: (ag) composite members, (hk) metal members.
Symmetry 17 01182 g010
Figure 11. Stress and strain trends of PCL with layup.
Symmetry 17 01182 g011
Figure 12. Stress and strain trends of VTL with layup.
Symmetry 17 01182 g012
Figure 13. Transient stress distribution of VTL: (a) 5th layer, (b) 9th layer, (c) 14th layer, (d) 20th layer, (e) 23th layer, (f) 24th layer.
Symmetry 17 01182 g013
Figure 14. Transient strain distribution of VTL: (a) 5th layer, (b) 9th layer, (c) 14th layer, (d) 20th layer, (e) 23th layer, (f) 24th layer.
Symmetry 17 01182 g014
Figure 15. Stress and strain trends of HEL with layup.
Symmetry 17 01182 g015
Figure 16. Stress and strain distribution of HEL with layup: (ad) stress distribution of 10th, 11th, 17th, 18th layers, (eh) strain distribution of 10th, 11th, 17th, 18th layers.
Symmetry 17 01182 g016
Table 1. Material parameters of flakeboard, metal, and bufferboard.
Nameρ/(kg/m3)E/(N/m2)v
Metal2.7 × 1036.9 ×10100.33
Flakeboard4 × 1029.8 × 1090.35
Bufferboard1 × 1036.1 × 1060.49
Table 2. Stacking sequence of composite laminates.
NameStacking Sequence
Plain composite laminates
(PCL)
[45/−45/0/45/90/−45/45/0/−45/90/45/−45/−45/−45/−45/−45/45]
Variable-thickness laminates
(VTL)
[45/90/90/−45/0/−45/0/−45/45/45/90/−45/−45/−45/013/−45/05/−45/0/0/45/0/0/45/−45/−45/45]
Aramid honeycomb sandwich[45/−45/0/45/90/−45/45/0/45/90/−45/45]
Table 3. CFRP matrix composite materials elastic parameters.
NameEx/GPaEy/GPaEz/GPaGxy/GPaGxz/GPaGyz/GPaVxy
CFRP1208.98.94.534.534.530.32
Table 4. CFRP matrix composite materials strength parameters.
NameXT/MPaXC/MPaYT/MPaYC/MPaZT/MPaZC/MPaSxy/MPaSxz/MPaSyz/MPa
CFRP2380123621613321613313386200
Table 5. Aramid honeycomb material parameters.
NameGrid Material Thickness/mmGrid Length/mmT-Directional Modulus/MPaL-Directional Modulus/MPaW-Directional Modulus/MPaL-Directional Shear Strength/MPaW-Directional Shear Strength/MPa
Aramid honeycomb0.0842.754.4815.1731.030.620.66
Table 6. Results of constrained modal analysis of SVT.
Modal OrderFrequency (Hz)Effective Mass Fraction
X-FlatY-FlatZ-FlatX-TurnY-TurnZ-Turn
19.04521.34 × 10−71.65 × 10−84.34 × 10−25.31 × 1055.85 × 10718.693
216.4761.34 × 10−29.52 × 10−39.42 × 10−81.8007140.011.78 × 107
324.9019.64 × 10−89.00 × 10−101.77 × 10−21.58 × 1052.60 × 1077.3503
425.2562.87 × 10−56.35 × 10−72.86 × 10−5252.9941,7971867.4
525.7591.27 × 10−61.56 × 10−61.28 × 10−34052.41.59 × 1063374.5
629.3898.32 × 10−51.86 × 10−58.35 × 10−31.52 × 1051.20 × 10756,150
731.5736.12 × 10−55.08 × 10−53.38 × 10−27.43 × 1054.95 × 1071.03 × 105
832.6913.76 × 10−61.65 × 10−74.56 × 10−27.53 × 1056.55 × 107659.21
936.571.79 × 10−58.20 × 10−61.40 × 10−24.69 × 1052.16 × 10723,295
1037.0391.82 × 10−61.03 × 10−56.62 × 10−31.89 × 1051.00 × 10713,985
1139.9061.08 × 10−51.31 × 10−64.72 × 10−22.47 × 1056.60 × 10767.868
1242.0941.54 × 10−55.44 × 10−70.263793.59 × 1063.86 × 108290.97
1345.3621.37 × 10−62.00 × 10−82.20 × 10−327,9813.14 × 10634.003
1445.4341.76 × 10−65.70 × 10−84.41 × 10−356,9166.31 × 1069.7166
1547.2257.21 × 10−73.96 × 10−63.39 × 10−43790.35.00 × 105723.14
1653.5286.71 × 10−43.16 × 10−43.23 × 10−412,4414.99 × 1059.97 × 105
1755.7371.46 × 10−39.56 × 10−43.77 × 10−5456.5752,9792.66 × 106
1859.9815.45 × 10−51.79 × 10−57.80 × 10−5588.491.08 × 10535,943
1965.1752.19 × 10−58.42 × 10−61.68 × 10−3168.091.97 × 10618,513
2065.5242.26 × 10−51.69 × 10−51.14 × 10−435,0692.38 × 10534,218
Disclaimer/Publisher’s Note: The statements, opinions and data contained in all publications are solely those of the individual author(s) and contributor(s) and not of MDPI and/or the editor(s). MDPI and/or the editor(s) disclaim responsibility for any injury to people or property resulting from any ideas, methods, instructions or products referred to in the content.

