Article

A Comprehensive Investigation on Shell Hydroforming of AA5052 Through Numerical Modeling and Experimental Analysis

by
Arun Achuthankutty
,
Karthik Narayanan
,
Ajith Ramesh
* and
Ratna Kishore Velamati
*
Department of Mechanical Engineering, Amrita School of Engineering, Coimbatore, Amrita Vishwa Vidyapeetham, India
*
Authors to whom correspondence should be addressed.
Symmetry 2025, 17(7), 989; https://doi.org/10.3390/sym17070989
Submission received: 22 May 2025 / Revised: 16 June 2025 / Accepted: 18 June 2025 / Published: 23 June 2025
(This article belongs to the Section Engineering and Materials)

Abstract

This study investigates the shell hydroforming of 1.2 mm-thick AA5052 aluminum alloy sheets to produce hemispherical domes which possess inherent spatial symmetry about their central axis. Shell hydroforming is widely used in fabricating lightweight, high-strength components for aerospace, automotive, and energy applications. The forming process was driven by a spatially symmetrical internal pressure distribution applied uniformly across the blank to maintain balanced deformation and minimize geometrical distortion. Experimental trials aimed at achieving a dome depth of 50 mm revealed wrinkle formation at the blank periphery caused by circumferential compressive stresses symmetrical in nature with respect to the dome’s central axis. To better understand the forming behavior, a validated 3D finite element (FE) model was developed, capturing key phenomena such as material flow, strain rate evolution, hydrostatic stress distribution, and wrinkle development under symmetric boundary conditions. The effects of the internal pressure (IP), blank holding force (BHF), coefficient of friction (CoF), and flange radius (FR) were systematically studied. A strain rate of 0.1 s−1 in the final stage improved material flow, while a symmetric tensile hydrostatic stress of 160 MPa facilitated dome expansion. Although tensile stresses can induce void growth, the elevated strain rate helped suppress it. An optimized parameter set of IP = 5.43 MPa, BHF = 140 kN, CoF = 0.04, and FR = 5.42 mm led to successful formation of the 50 mm dome with 19.38% thinning at the apex. Internal pressure was identified as the most critical factor influencing symmetric formability. A process window was established to predict symmetric failure modes such as wrinkling and bursting.

1. Introduction

Recent advances in sheet metal forming (SMF) have primarily focused on improving the ability to shape materials, creating more complex designs, and streamlining production processes [1]. One notable trend is the growing adoption of nontraditional forming techniques, such as hydroforming, which are particularly effective for lightweight materials used in the automotive and aerospace industries. To meet the challenging demands for improved performance, reduced energy consumption, and higher safety standards, advanced materials like high-strength steels and lightweight alloys are increasingly being utilized [2]. Key process parameters such as the radius of the punch nose, the temperature of the blank, and the applied blank holding force play a critical role in determining product quality [3]. Researchers are working to address common challenges like spring-back, wrinkling, and tearing through experimental methods and advanced simulations. Computer-aided engineering (CAE) tools, particularly those based on finite element analysis (FEA), are now essential in designing tools and optimizing processes. Additionally, there is a growing emphasis on the environmental sustainability of SMF, with a particular focus on tribology [4].
Hydroforming is an advanced metal forming process that stands out for its ability to produce complex components with fewer operations, lighter weights, and improved stiffness [5]. This technology has seen rapid growth, especially in the automotive and aerospace industries, where materials like aluminum and titanium alloys are highly sought after. Significant strides have been made in shell, tube, and sheet hydroforming, with ongoing research focusing on innovative techniques and process optimization to enhance both performance and efficiency [6].
The effectiveness of hydroforming depends on key factors such as the material’s properties, preform geometry, lubrication, and precise control of the process [7]. While the technology offers clear advantages, it is still relatively new, with researchers addressing limitations and exploring its potential for broader applications. Studies have shown that hydroforming improves metal flow and minimizes thinning in critical areas, outperforming conventional deep drawing methods [8,9,10]. Tools like forming limit diagrams (FLDs) and simulations are essential for predicting formability, while factors such as axial feed conditions and temperature significantly affect fracture behavior and material performance, especially for aluminum alloys [11,12,13,14].
Finite element (FE) simulations play a crucial role in designing and optimizing hydroforming processes, providing accurate predictions for spring-back and final component shapes [15,16]. Advanced models, like the 3D nonlinear FE approach developed by Achuthankutty et al. [17], effectively simulate material flow in sheet hydroforming using the arbitrary Lagrangian-Eulerian (ALE) method. These advancements highlight hydroforming’s potential to enhance formability and precision for various materials, supporting its broader adoption across industries.
Shell hydroforming (SHF) enables the efficient production of thin-walled, complex components with a uniform thickness and high surface quality [18,19]. Researchers have focused on optimizing parameters like fluid pressure and blank size through finite element simulations and experimental studies [20]. Recent innovations include lower-pressure hydroforming for tubular components, double-sided pressure hydroforming for sheets, and dieless hydroforming for ellipsoidal shells. Warm forming methods have further improved the formability of high-strength aluminum alloys, though challenges with surface quality persist [19].
SHF, also known as integral hydro bulge forming (IHBF) technology, is especially suited for producing thin, large elliptical pressure vessel heads in small batches or with varying dimensions. Improved forming stability can be achieved using a high-stiffness ring with a fixed boundary and increased thickness [21]. An innovative approach using circular plates with different thicknesses has shown better formability than conventional deep drawing, enabling the production of semi-ellipsoid shells with specific thickness ratios and minimal thinning [22]. The process begins with plastic deformation at the center of a flat blank, where the radius is infinite, and continues outward toward regions with larger curvatures. This sequence is repeated until the shell reaches a uniform spherical shape or fractures [23]. Further research into shell hydroforming has explored spherical shells with different preform types. Zhang et al. [24] studied deformation behaviors and roundness issues, offering valuable insights into shaping complex geometries.
Building on previous advancements, our current research focuses on the numerical modeling and experimental evaluation of the shell hydroforming process, specifically for AA5052 aluminum alloy. Known for its excellent formability and impressive strength-to-weight ratio, AA5052 is a popular choice in automotive, marine, and aerospace applications [25,26]. Figure 1 illustrates the shell hydroforming process, showcasing its mechanisms and potential for efficiently producing complex structures.
While several studies have explored SHF for forming aluminum alloys, most focus on general behavior under fixed loading conditions or do not incorporate a validated numerical model combined with optimization techniques. For instance, Zhang et al. [24] investigated deformation and roundness in spherical shells but did not address thinning control or process optimization. Similarly, studies using AA5XXX series alloys often concentrate on sheet or tube hydroforming, with limited application to dieless shell forming scenarios. The current study distinguishes itself by targeting AA5052, a widely used alloy in lightweight applications, and integrating experimental validation, FE modeling, and multi-objective optimization, specifically aiming to minimize thinning while achieving a target dome height. This combination, especially in a dieless forming set-up, is not addressed in the prior SHF literature, making the present work a significant contribution to the advancement of SHF for AA5XXX alloys.
Despite significant advancements in hydroforming, particularly in tube and sheet hydroforming, shell hydroforming (SHF) remains relatively underexplored, especially in terms of process optimization, deformation prediction, and defect control. Existing studies often rely on traditional die-based methods, which are costly and inflexible, making them unsuitable for low-volume production or complex geometries. Additionally, the absence of robust numerical models and validated experimental data in SHF limits the ability to predict key outcomes such as thinning, the dome height, and wrinkle formation with high accuracy.
This study addresses these gaps by designing and fabricating a custom experimental SHF set-up, eliminating the need for expensive dies and enabling cost-effective exploration of forming behavior; developing and validating a 3D finite element (FE) model that accurately predicts material flow, thickness variation, and deformation patterns, including wrinkling; introducing a process window to classify failure zones (e.g., bursting, tearing, and incomplete forming), thus guiding safe process design; analyzing the influence of the hydrostatic stress and strain rate, providing insight into void nucleation and growth control, an area rarely quantified in SHF studies; and implementing a response surface methodology (RSM)-based multi-objective optimization approach to identify optimal process parameters for achieving the maximum dome height with minimal thinning which surpasses the predictive capabilities of simpler methods, like the Taguchi method.
This work contributes a comprehensive and validated framework for understanding, predicting, and optimizing shell hydroforming processes. By bridging experimental findings with advanced simulation and optimization, this study offers practical solutions for producing lightweight, complex shell structures without traditional dies. These contributions are particularly relevant for aerospace, automotive, and custom component manufacturing, where precision forming of thin-walled shells is critical.

2. Methodology

2.1. Experimental Set-Up

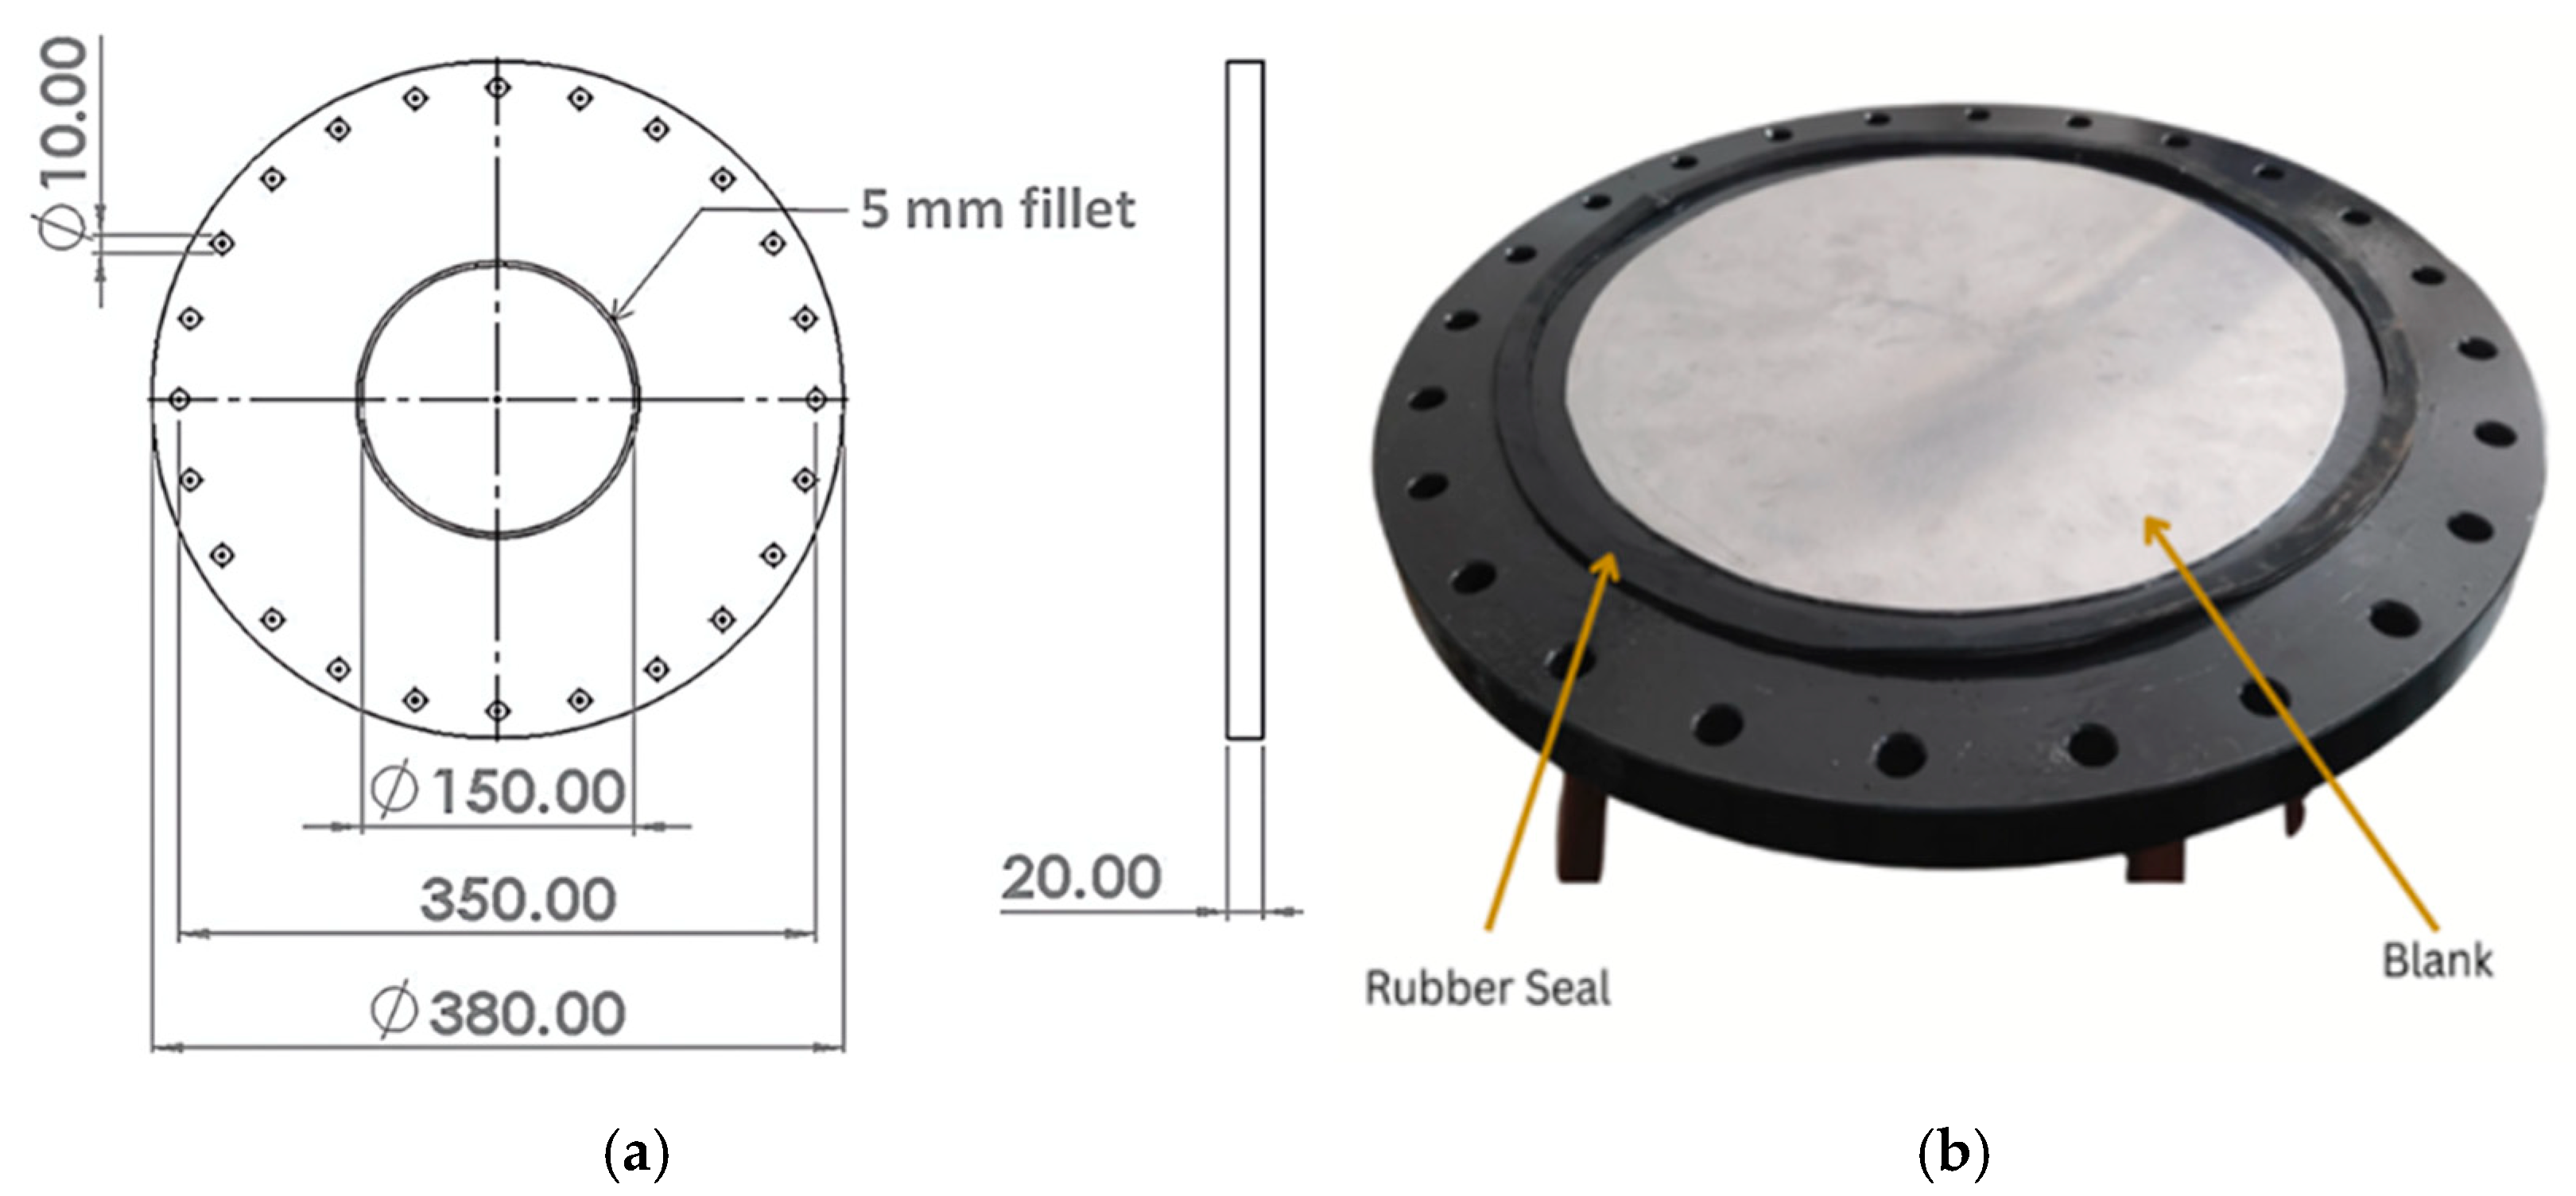
The experimental set-up for shell hydroforming was designed to preserve axisymmetric conditions throughout the process, reflecting the inherent symmetry of the hemispherical dome. The lower blank holder, shown in Figure 2, features a centrally located hole 150 mm in diameter and a flange radius of 5 mm. This set-up ensures that internal pressure and boundary constraints are applied uniformly about the central axis, maintaining symmetry in the deformation response.
To maintain symmetry in clamping, a total of 24 bolt holes were arranged evenly around the circumference. The bolts and nuts were torqued in a sequential pattern (as outlined in [27]) to ensure uniform distribution of the blank holding force, preserving radial symmetry in the boundary conditions during forming. A torque wrench was also used to ensure consistent torque during the process. The blank holding force exerted by each bolt was determined using Equation (1):
T = K × D × F
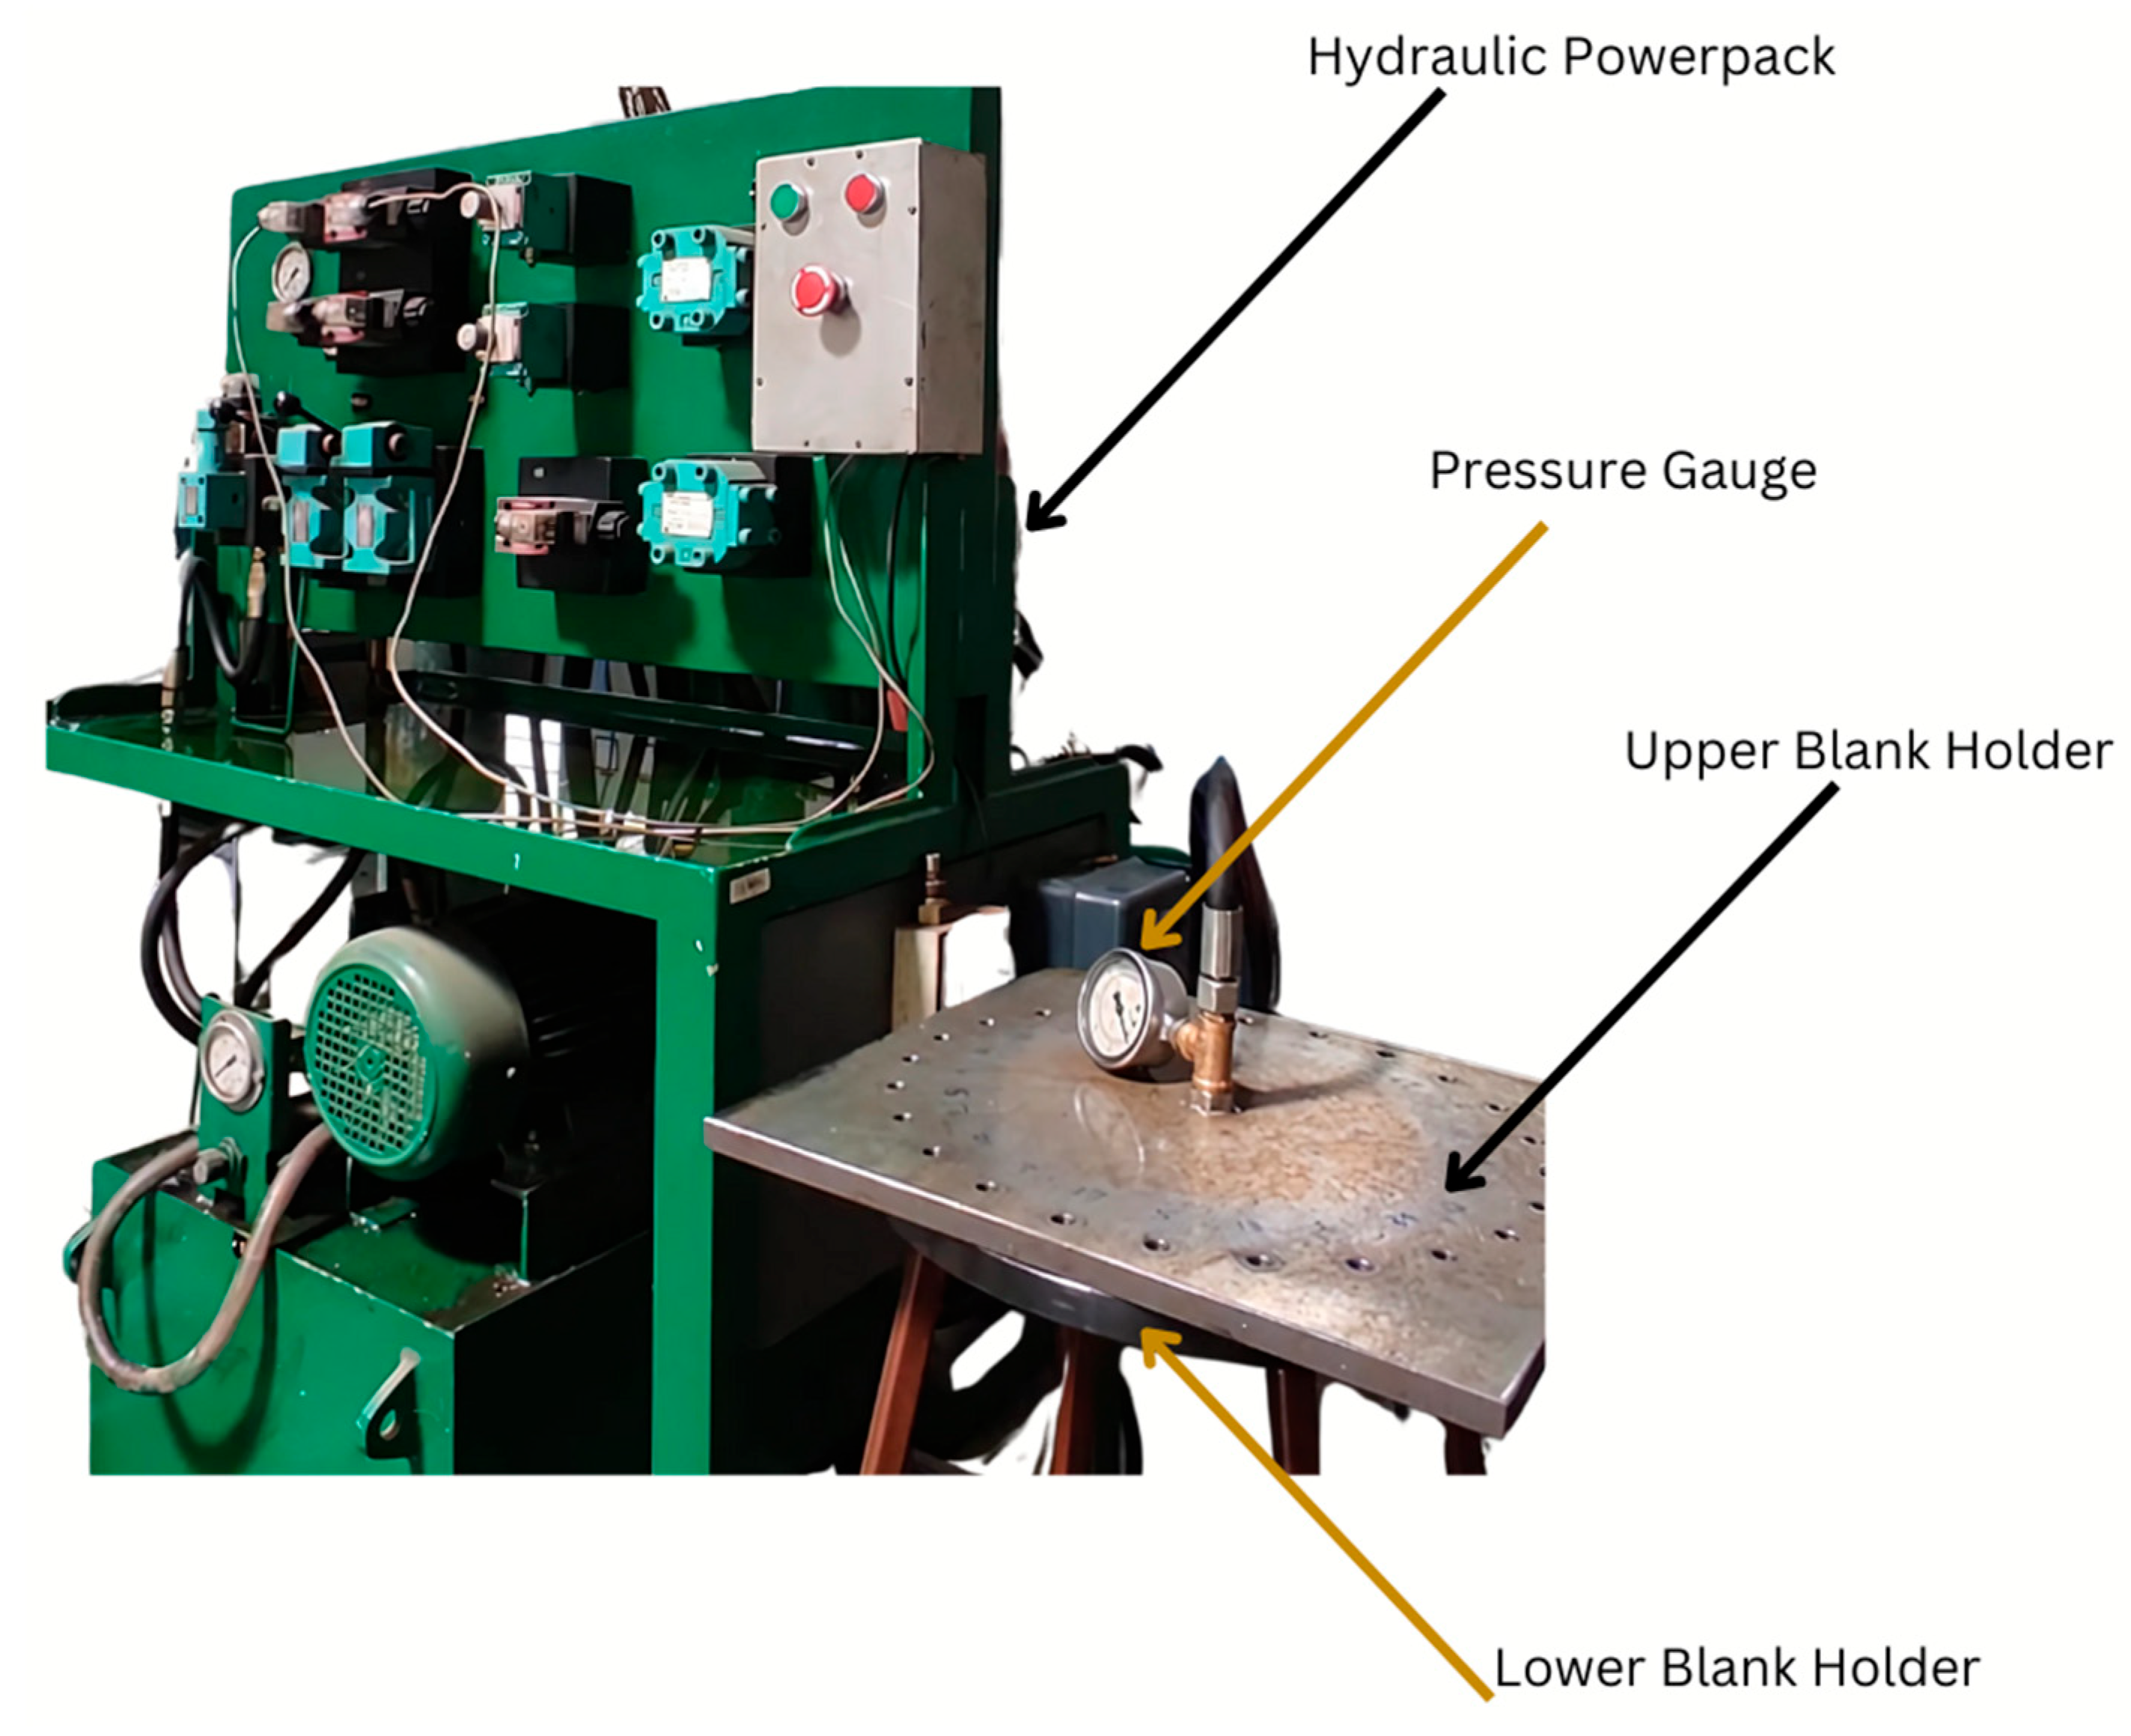
where T is the applied torque, K is the friction constant, D is the bolt diameter, and F is the blank holding force. Figure 3 presents the assembled experimental configuration used for shell hydroforming trials.
The blank material used in this study was AA5052. The blank material composition was determined using spark atomic emission spectrometry, and the results are presented in Table 1. The material properties determined through a uniaxial tensile test are given in Table 2, with tensile specimens prepared according to ASTM standards E8/E8M [28].

2.2. Dome Height Calculation for Constant Strain Rate

To maintain consistent material deformation under symmetric pressure application, the dome height (hd) profile was calculated to ensure a constant strain rate aligned with the axisymmetric nature of the shell geometry. This calculation was based on fundamental geometrical and material relationships [29], as described below.
Equivalent Strain: The equivalent strain ε ¯ is defined as follows:
ε ¯ = ln t 0 t d
where t0 is the initial sheet thickness and td is the instantaneous apex thickness.
Instantaneous Apex Thickness: The relationship for the apex thickness td is given below:
t d = t 0 d C 2 d C 2 + 4 h d 2 2
Here, dc is the bulge diameter, and hd is the instantaneous dome height.
Strain Rate Relationship: The equivalent strain ε ¯ can be related to the strain rate ε ˙ and time (t) as follows:
ε ¯ = ε ˙ t
By combining these relationships, the instantaneous dome height (hd) as a function of time (t) can be derived as follows:
h d = d C 2 e ε ˙ t 2 1
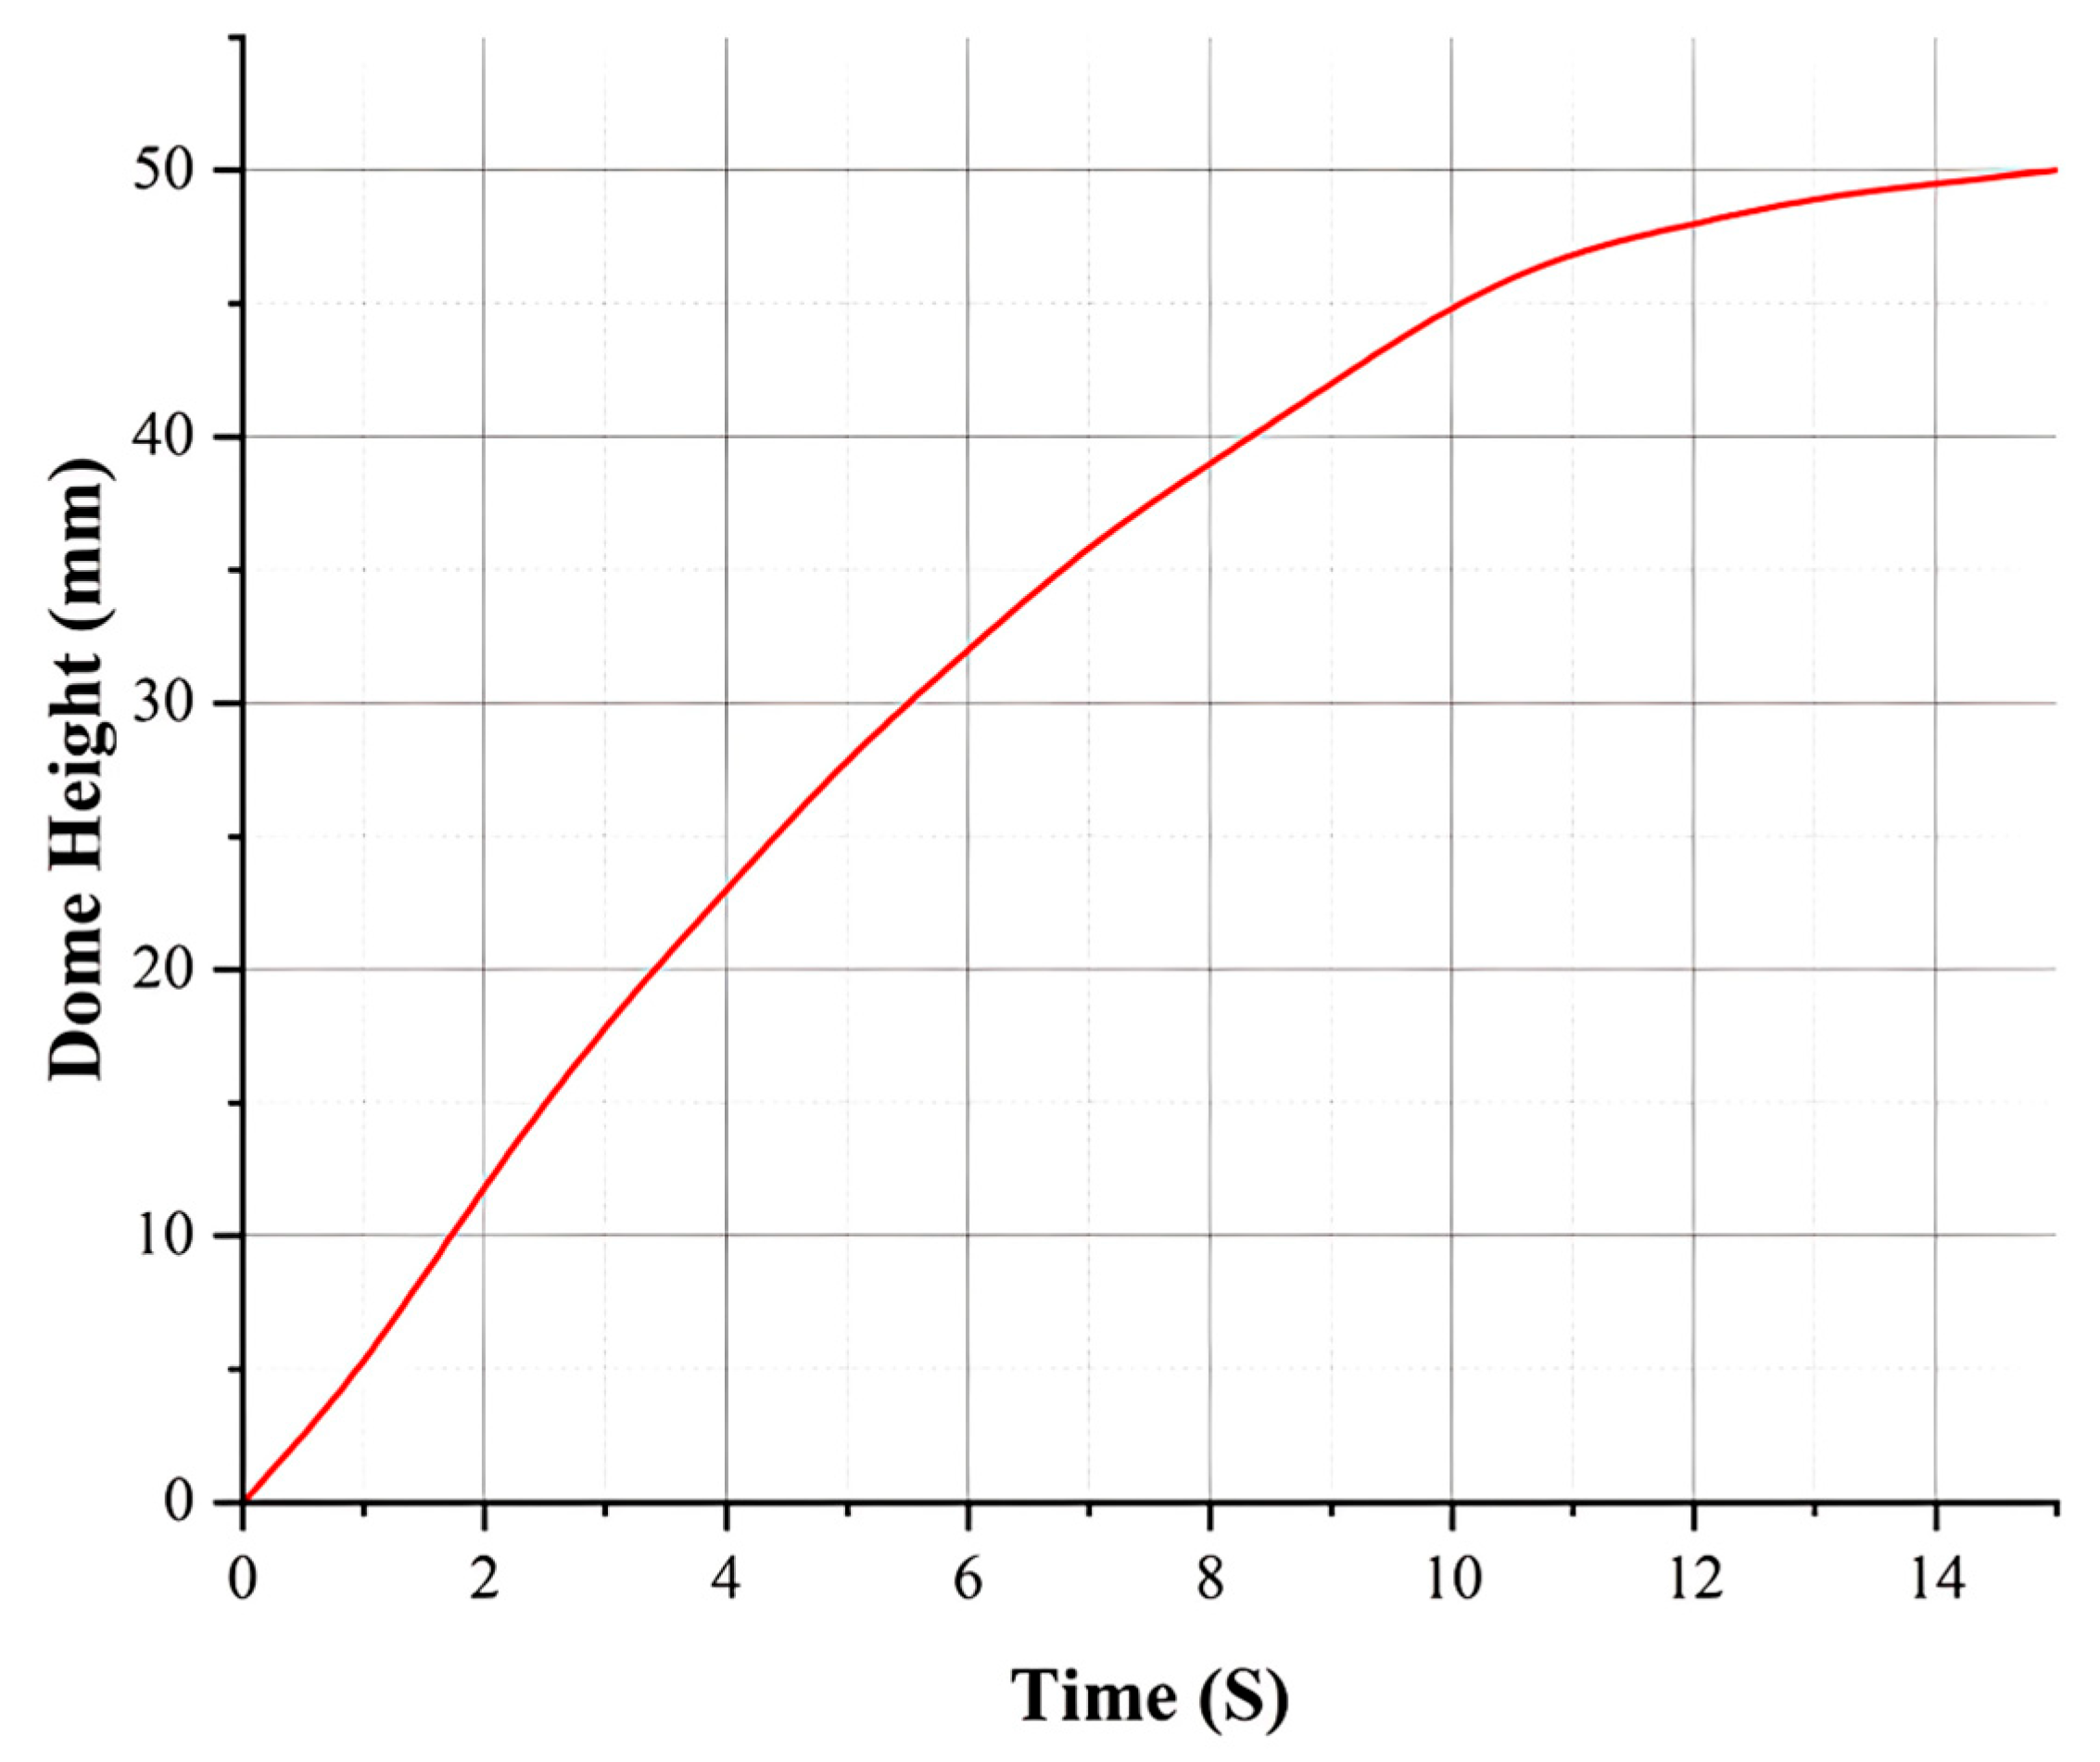
In this study, the bulge diameter (dc) was fixed at 150 mm, the initial thickness (t0) was fixed at 1.2 mm, and the strain rate ε ˙ was approximated to be 0.025 s−1, a typical value observed in hydroforming processes. The reference dome height profile as a function of time was plotted using Equation (5), as shown in Figure 4. This provided a reliable framework for designing and conducting hydroforming experiments. From this, a dome height of 50 mm was selected, ensuring geometric and deformation symmetry around the central axis during hydroforming.

2.3. Finite Element Modeling

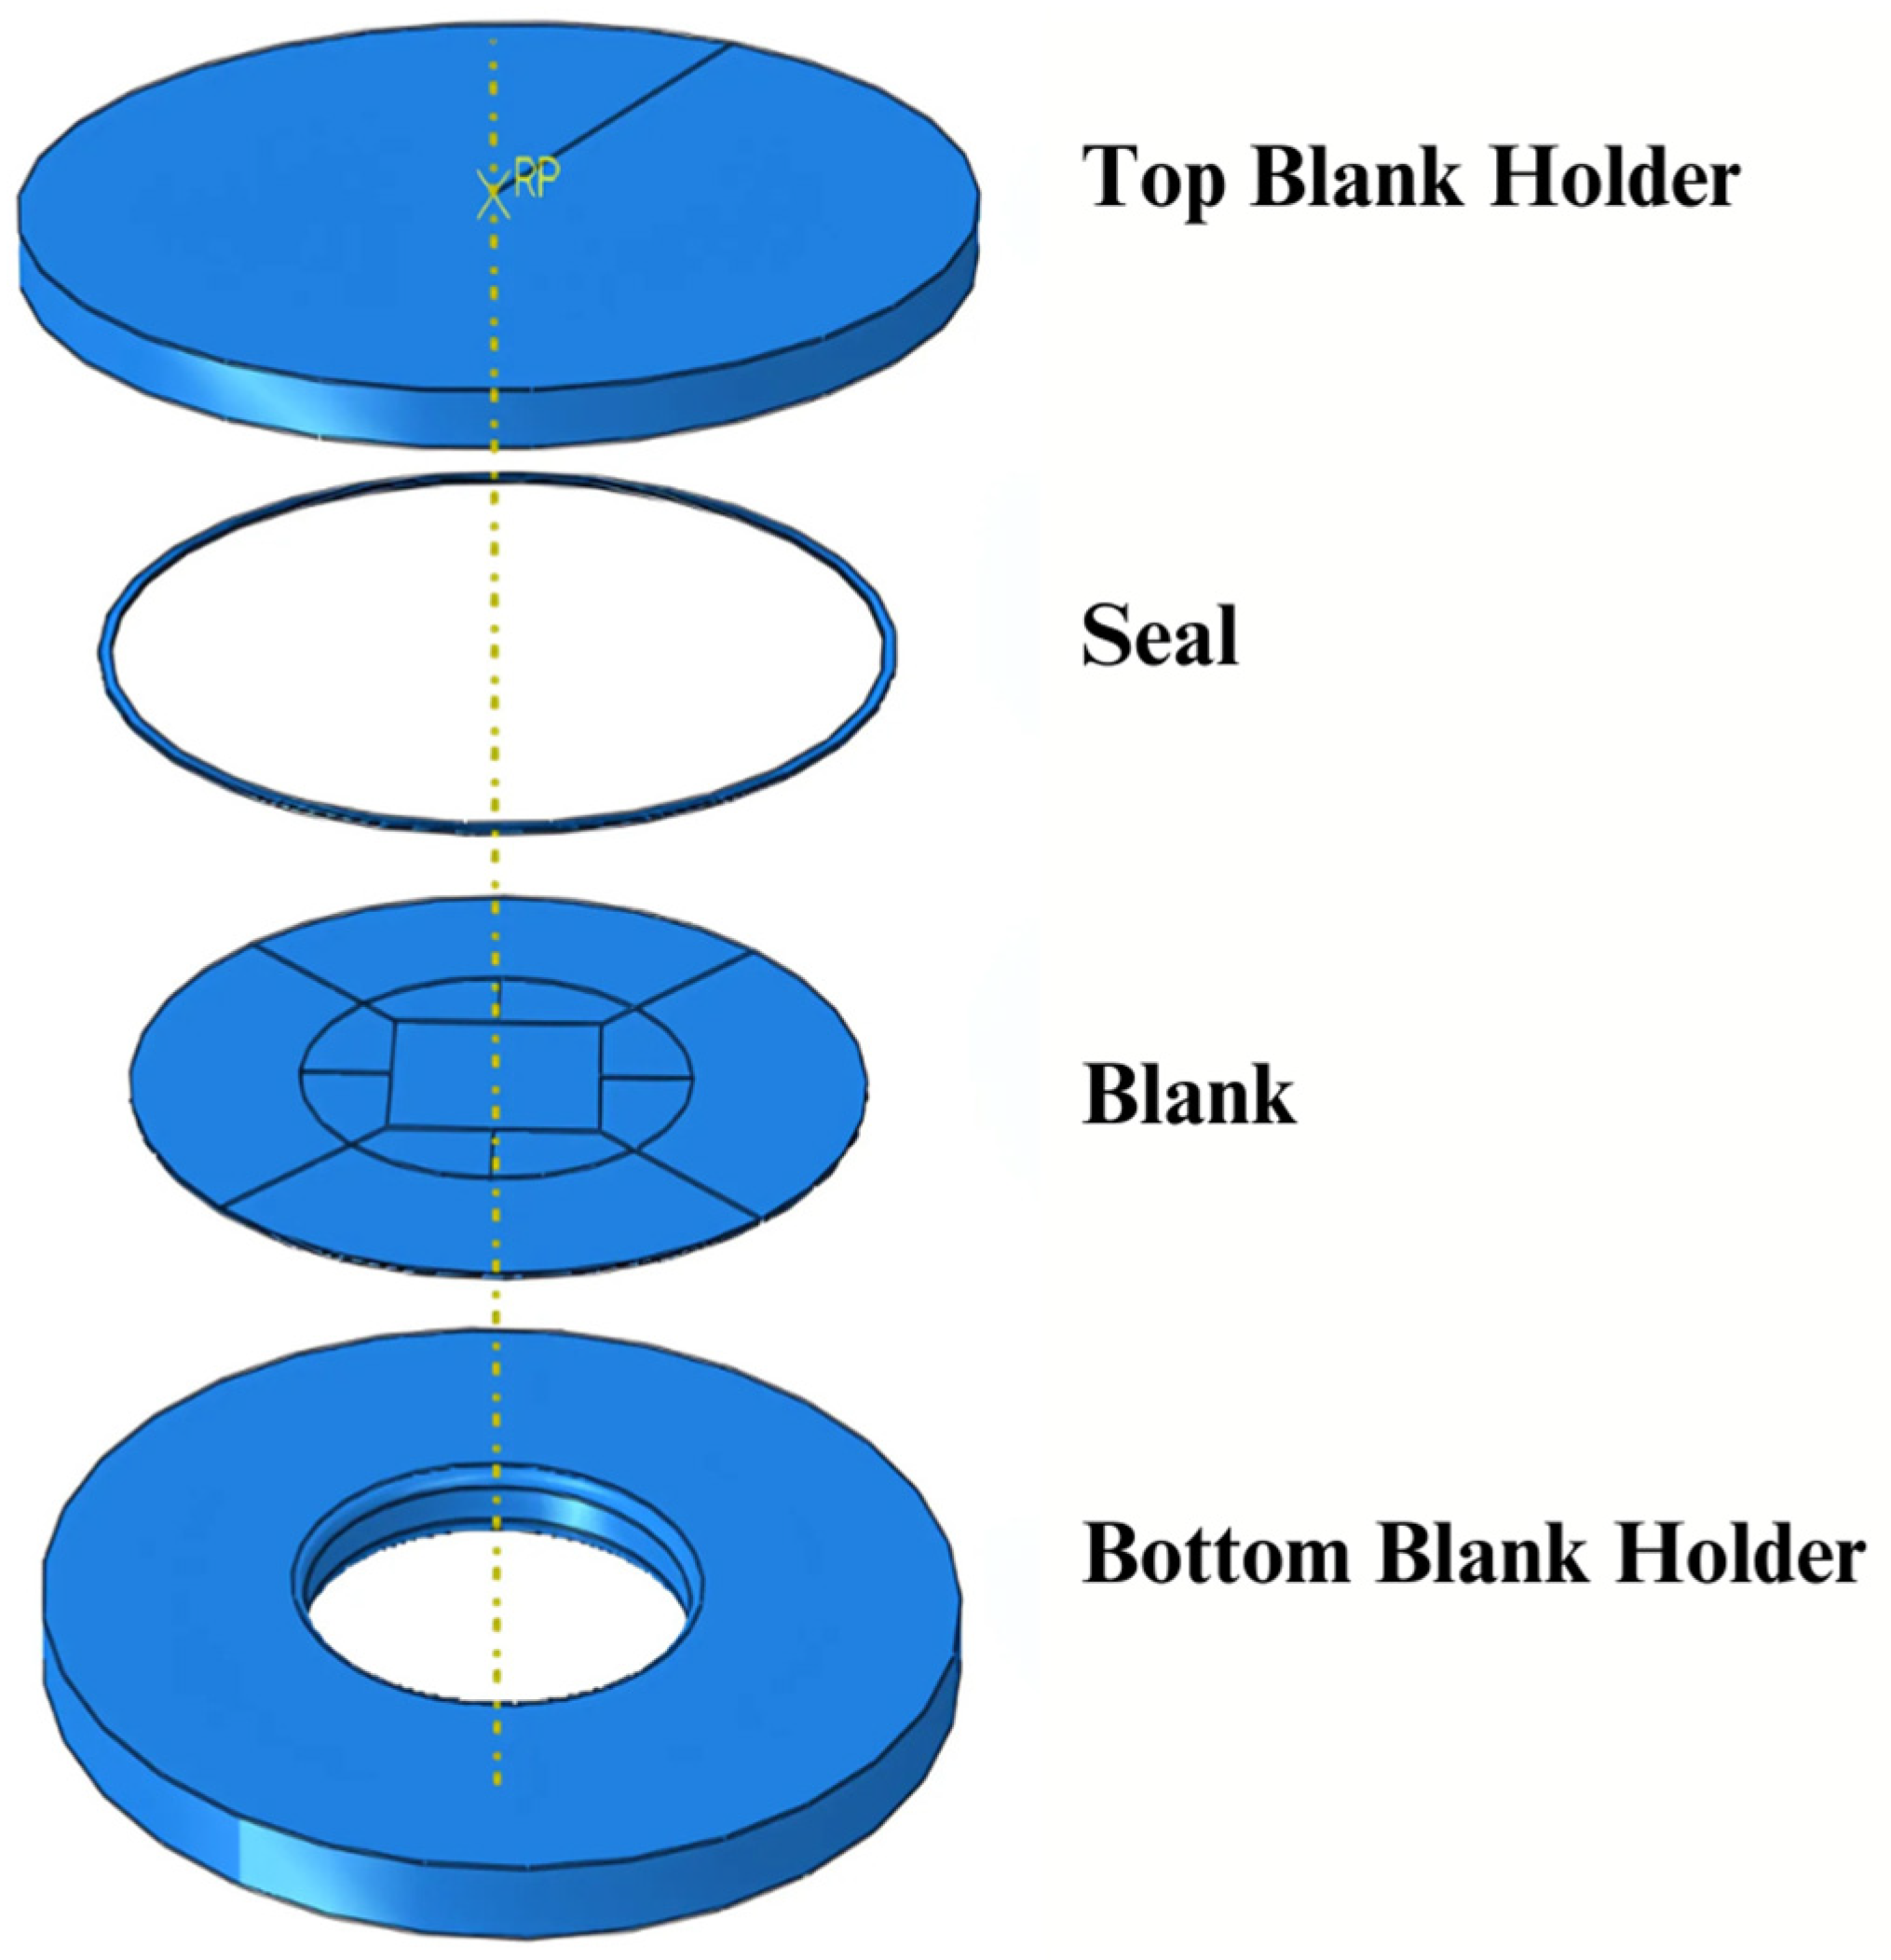
A 3D nonlinear finite element model was developed using Abaqus 2022 to replicate the axisymmetric deformation behavior observed experimentally. The model incorporated a circular blank and symmetric boundary conditions, reflecting the spatial symmetry of the hydroforming set-up. The model simulated a 1.2 mm-thick sheet with a blank holding force (BHF) of 340 kN, a flange radius (FR) of 5 mm, and a peak internal pressure (IP) of 5.5 MPa, achieving a dome height of 50 mm. Figure 5 presents an exploded view of the model, which comprises four components: the top blank holder, bottom blank holder, blank, and rubber seal. The top and bottom blank holders were modeled as discrete rigid bodies, while the blank and rubber seal were modeled as deformable components. The dimensions of all parts matched those in the experimental set-up.
Surface-to-surface interactions were defined between the contact interfaces, blank holders, blank, and rubber seal using a coefficient of friction (CoF) of 0.08. The system was subjected to two primary loads: internal pressure (IP) (fluid pressure) applied on the blank and blank holding force (BHF) acting on the upper blank holder through surface traction.
The arbitrary Lagrangian-Eulerian (ALE) method was employed for the blank. The blank holders were assigned ENCASTRE boundary conditions, ensuring no movement and maintaining radial symmetry throughout the simulation. Given the symmetry of the pressure distribution and geometric constraints, the model accurately captured uniform material flow and wrinkle evolution. The mesh used was the C3D8R element, an 8-node linear brick with reduced integration. Four elements were assigned along with the thickness direction. Each node in the C3D8R element had three translational degrees of freedom (U1, U2, and U3), enabling full 3D displacement tracking.
A mesh convergence study was conducted by refining mesh densities across the radial and thickness directions. The final mesh, consisting of 119,232 elements, was selected based on convergence of the dome height and equivalent stress values. A global mesh size of 1 mm was used, with four elements assigned along the thickness direction to capture the through-thickness stress and strain gradients accurately. A minimum element size of 0.6 mm was used in the apex and flange radius regions, where high stress and strain concentrations were expected. The medial axis sweep meshing technique was used to maintain high-quality hex elements in critical regions. A coarser mesh was used in peripheral zones, reducing computational cost without sacrificing accuracy.

2.4. Process Optimization

This study aimed to optimize the process parameters and achieve better outcomes in the hydroforming process. The key parameters examined included the BHF, CoF, FR, and IP. The optimization utilized the design of experiments (DOE) approach, specifically the response surface methodology (RSM), to determine the number of simulations required for various parameter combinations. The RSM was chosen for its ability to model nonlinear relationships, including interaction and square terms, and generate a predictive regression model, which are essential for accurately analyzing complex forming behaviors [30]. While methods such as the Taguchi technique have also been used in similar manufacturing optimization studies [31], the present study required a more comprehensive modeling framework, which the RSM effectively provided. The ranges for these optimization parameters are provided in Table 3.
Using the DOE technique, 25 unique parameter combinations were identified. Simulations were conducted for each combination, and the results are summarized in Table 4. The thinning at the dome apex, the critical location, was measured for evaluation in each case.

3. Results and Discussions

3.1. Experimental Results

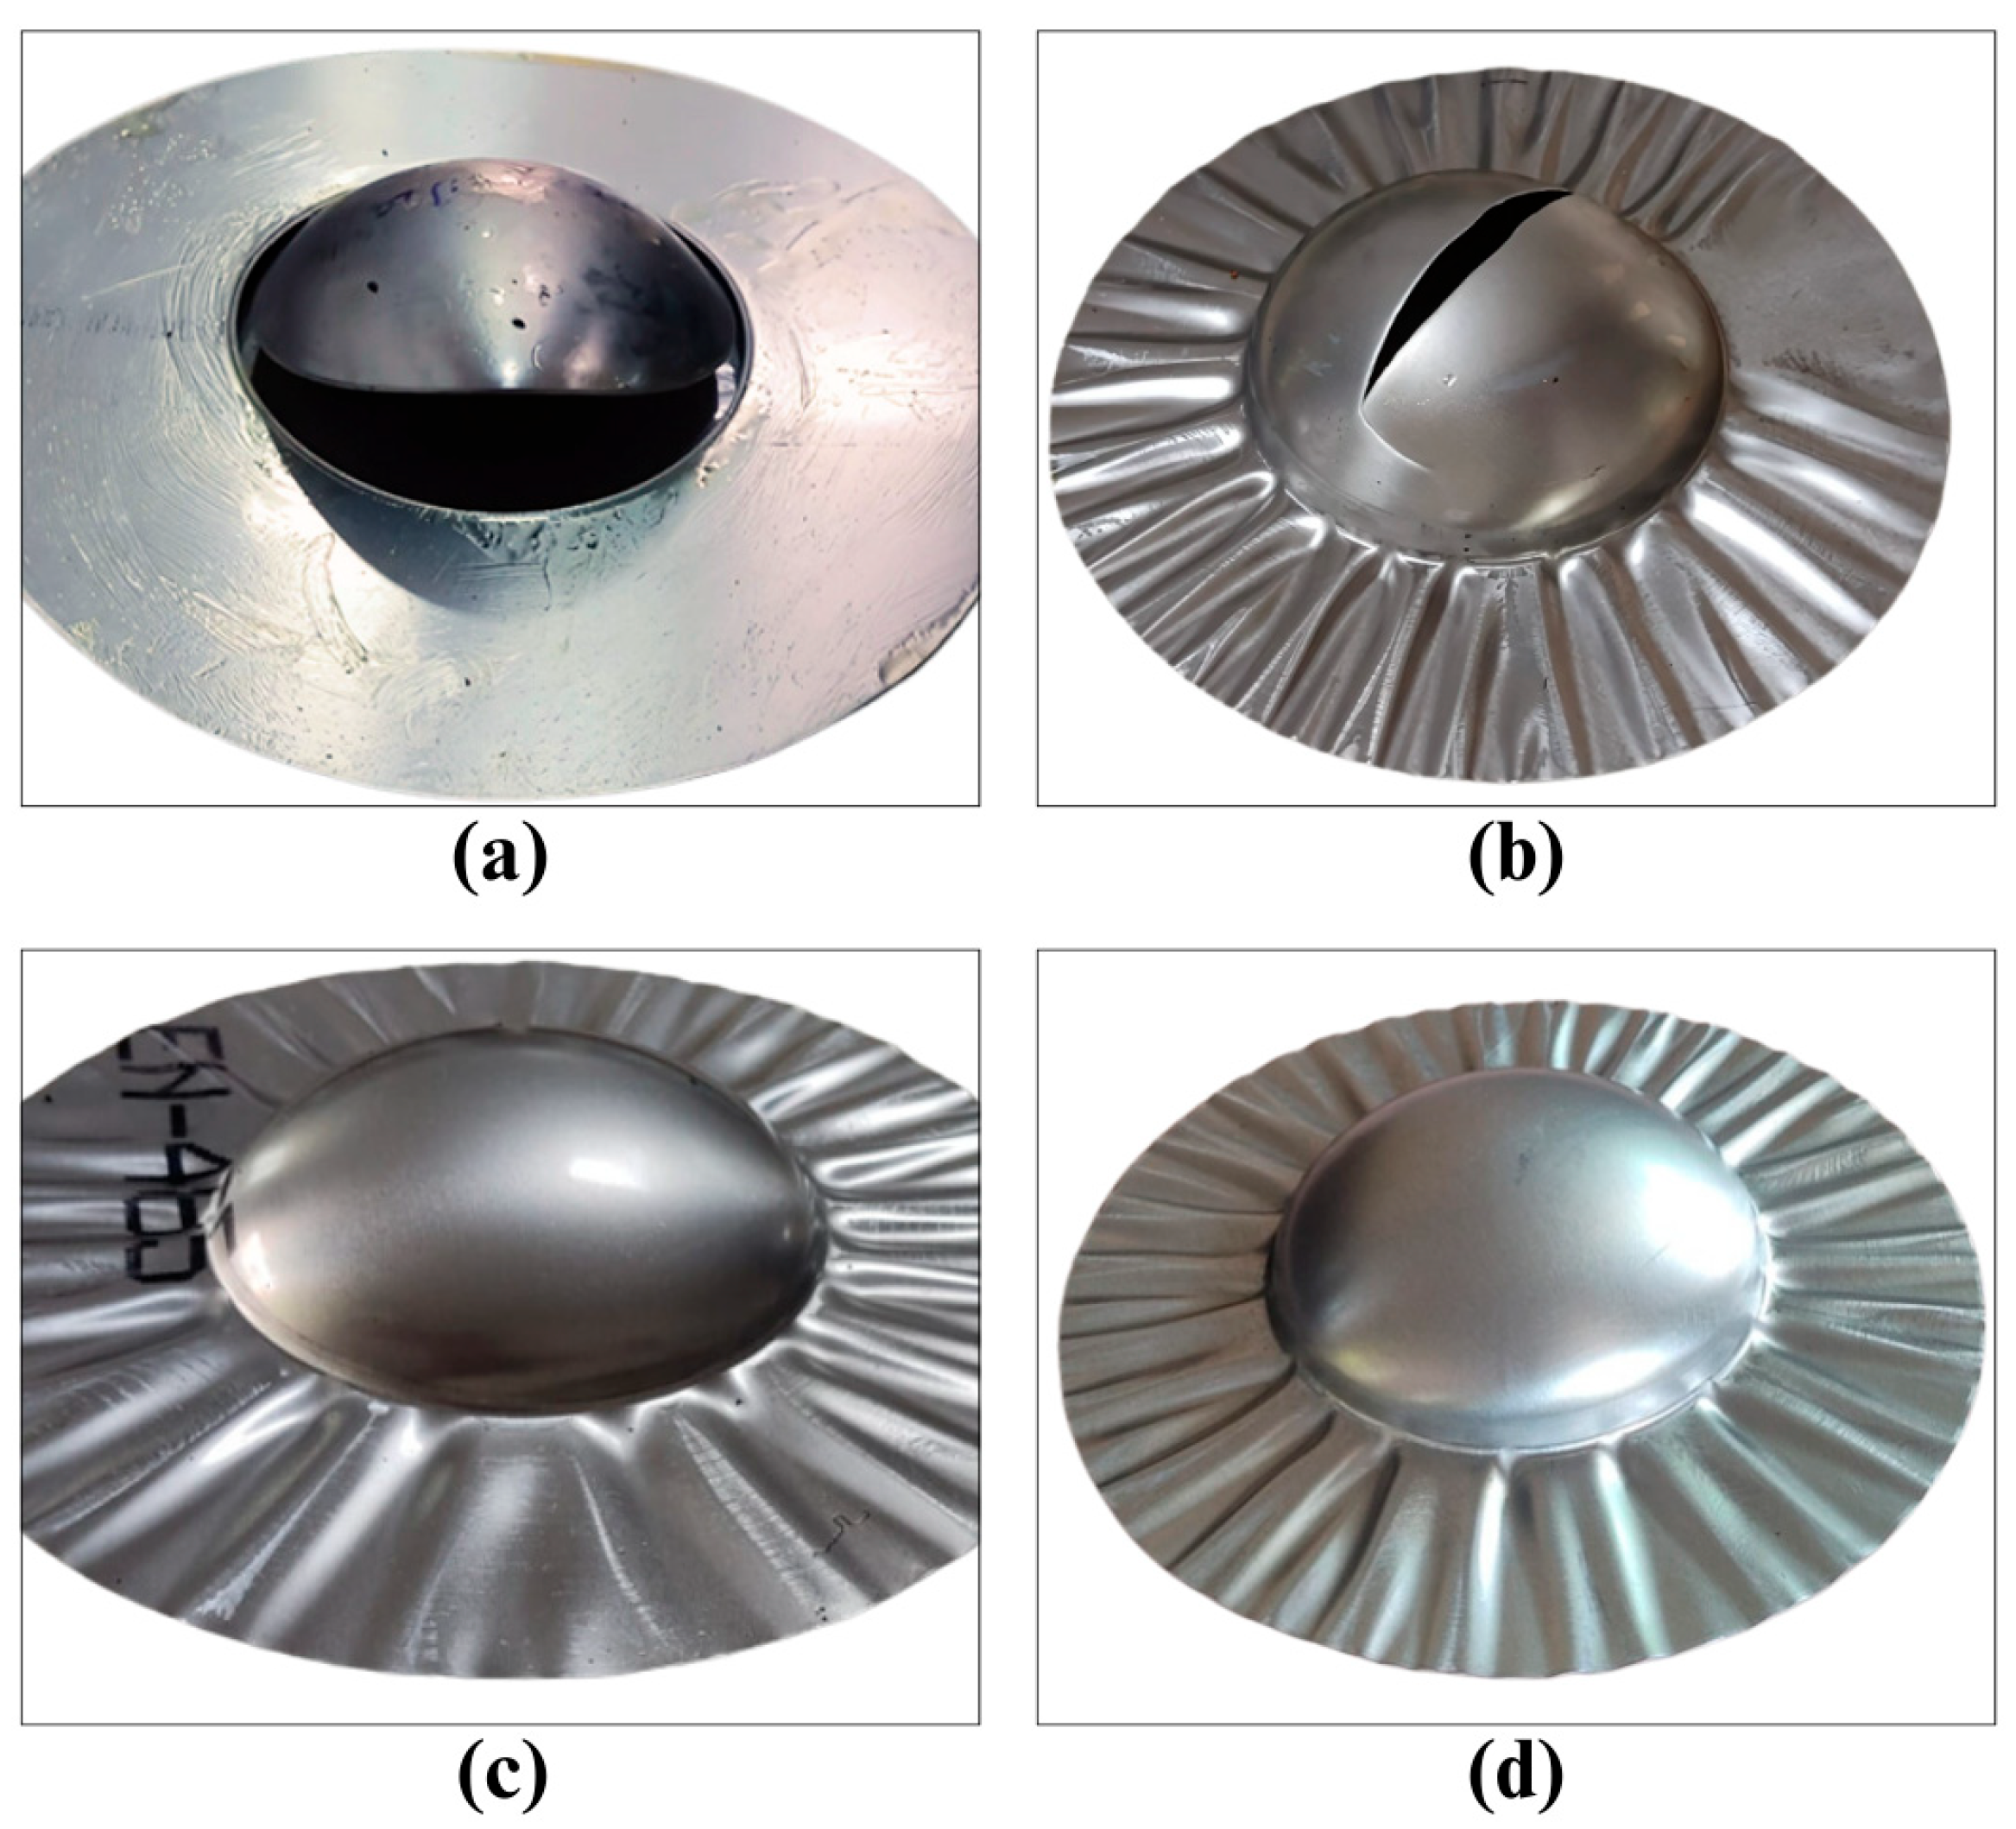
The experiments were aimed at achieving a dome height of 50 mm, with the sheet thickness set to 1.2 mm. Optimal forming conditions were reached with a BHF of 340 kN and an IP of 5.5 MPa, which successfully produced fully formed components (as shown in Figure 6d). However, increasing the BHF to 380 kN restricted material flow, resulting in tearing at an IP of 4.8 MPa (illustrated in Figure 6a). On the other hand, reducing the BHF below 140 kN led to oil leakage along the edges of the blank at an IP of 3 MPa, with the leakage becoming more pronounced at a 100 kN BHF.
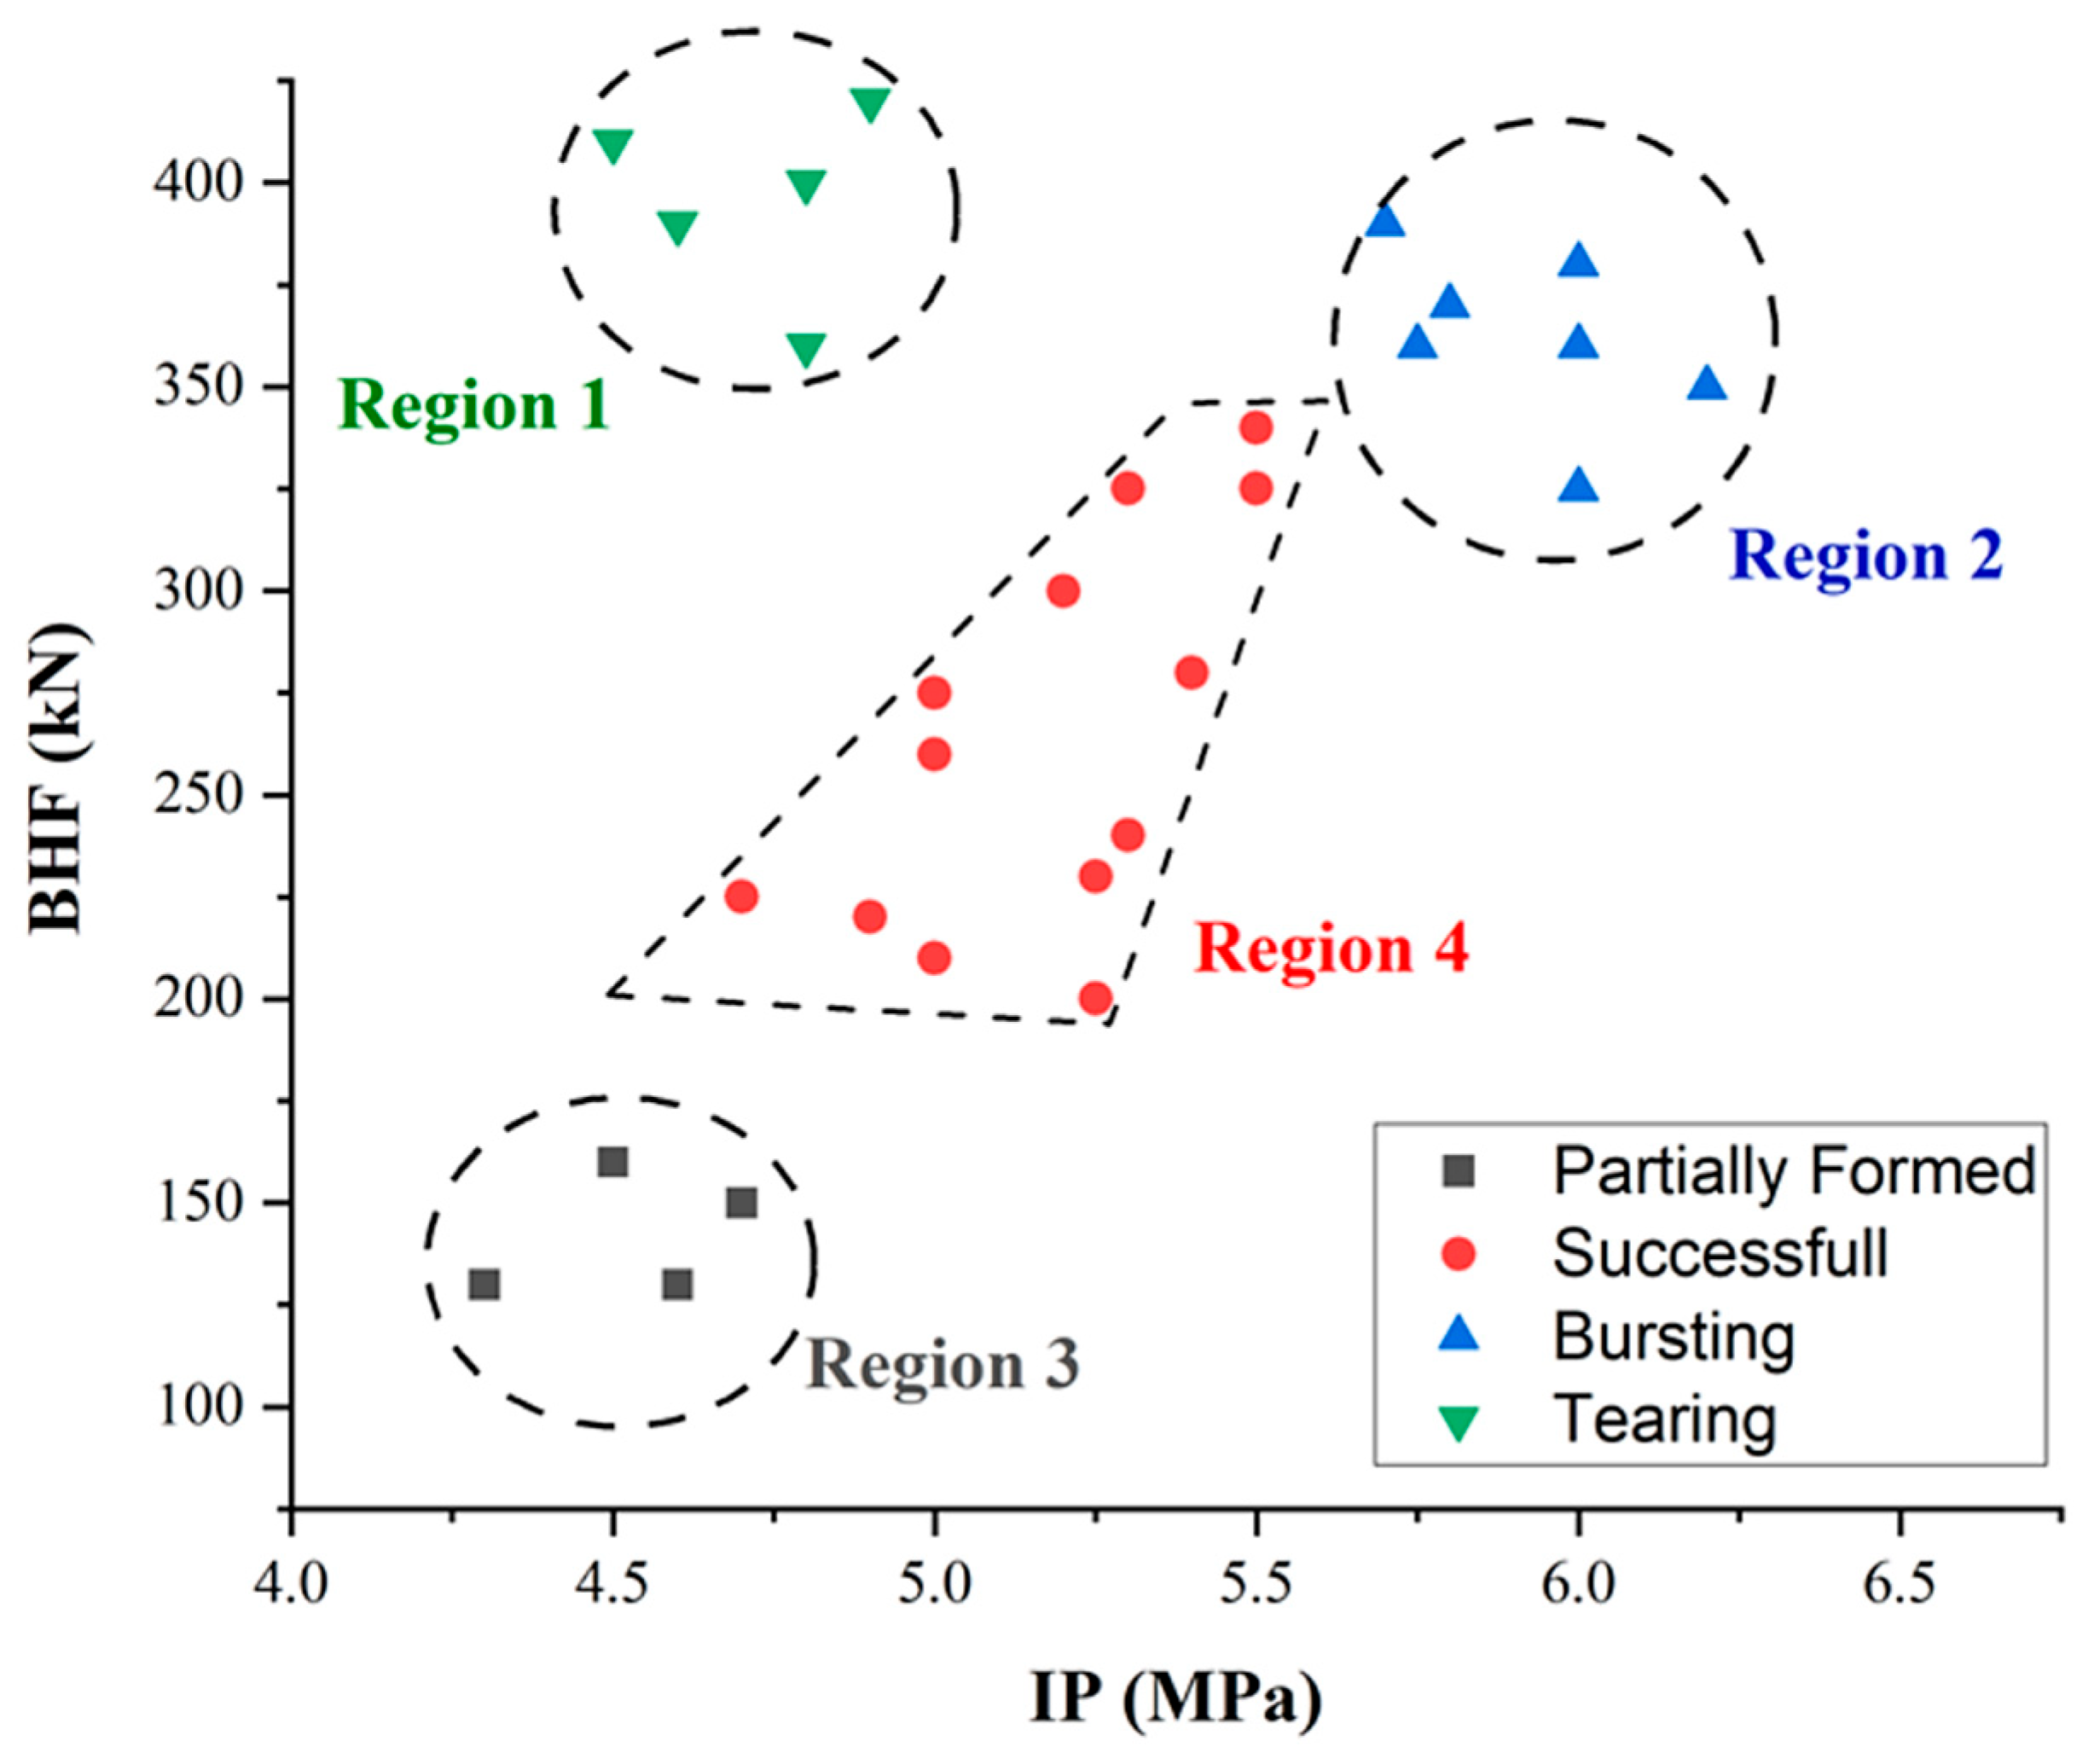
A process window, shown in Figure 7, was developed based on various trials. The regions within the process window were categorized as follows:
  • Region 1: A high BHF combined with low IP caused failures near the die hole entry, as shown in Figure 6a.
  • Region 2: A high BHF and high IP led to bursting at the dome apex (Figure 6b).
  • Region 3: A low BHF and IP resulted in dome heights below 45 mm (Figure 6c).
  • Region 4: Optimal forming conditions achieved dome heights between 45 mm and 55 mm (Figure 6d).
Figure 7. Process window for shell hydroforming process for varying BHF and IP.
Symmetry 17 00989 g007
Wrinkles were observed symmetrically around the dome periphery, caused by circumferential compressive stresses pulling the material into the die. The symmetric formation of wrinkles aligns with the radial geometry and boundary conditions applied during the process. These wrinkles were eliminated during post-processing by trimming the excess material, ensuring a clean component (see Figure 8).
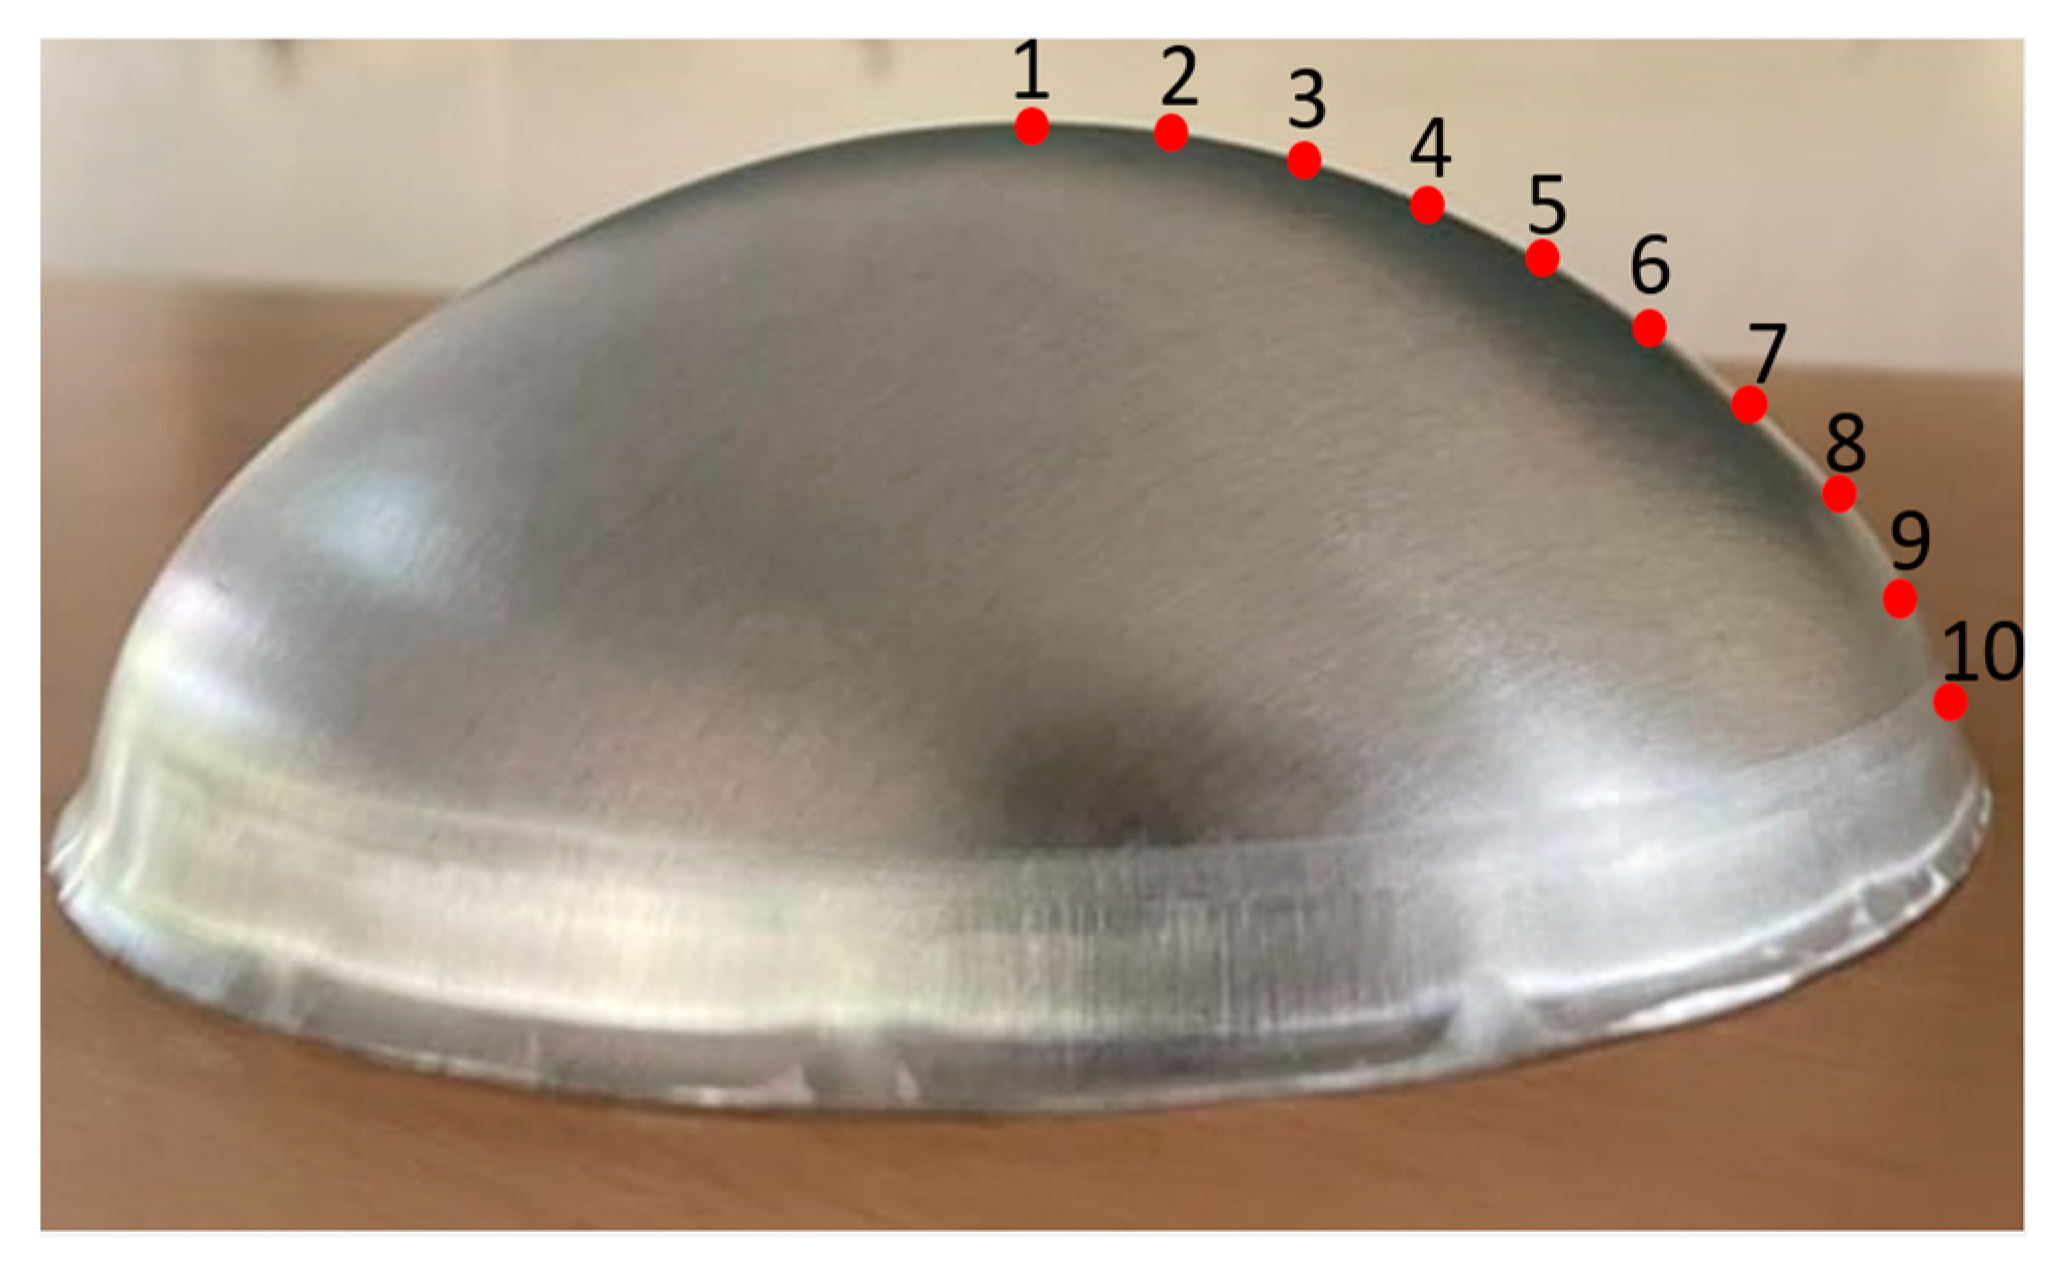
The final formed component achieved a height of 50 mm (Figure 8) under a BHF of 340 kN and an IP of 5.5 MPa. A detailed thickness distribution assessment was conducted by sectioning the dome and measuring the thinning percentage from the apex to the base at 10 evenly spaced locations (Table 5). The results revealed a minimum thickness of 0.87 mm at the apex and a maximum thickness of 1.12 mm at the base, resulting in a thickness variation of 25% across the shell.

3.2. Numerical Results

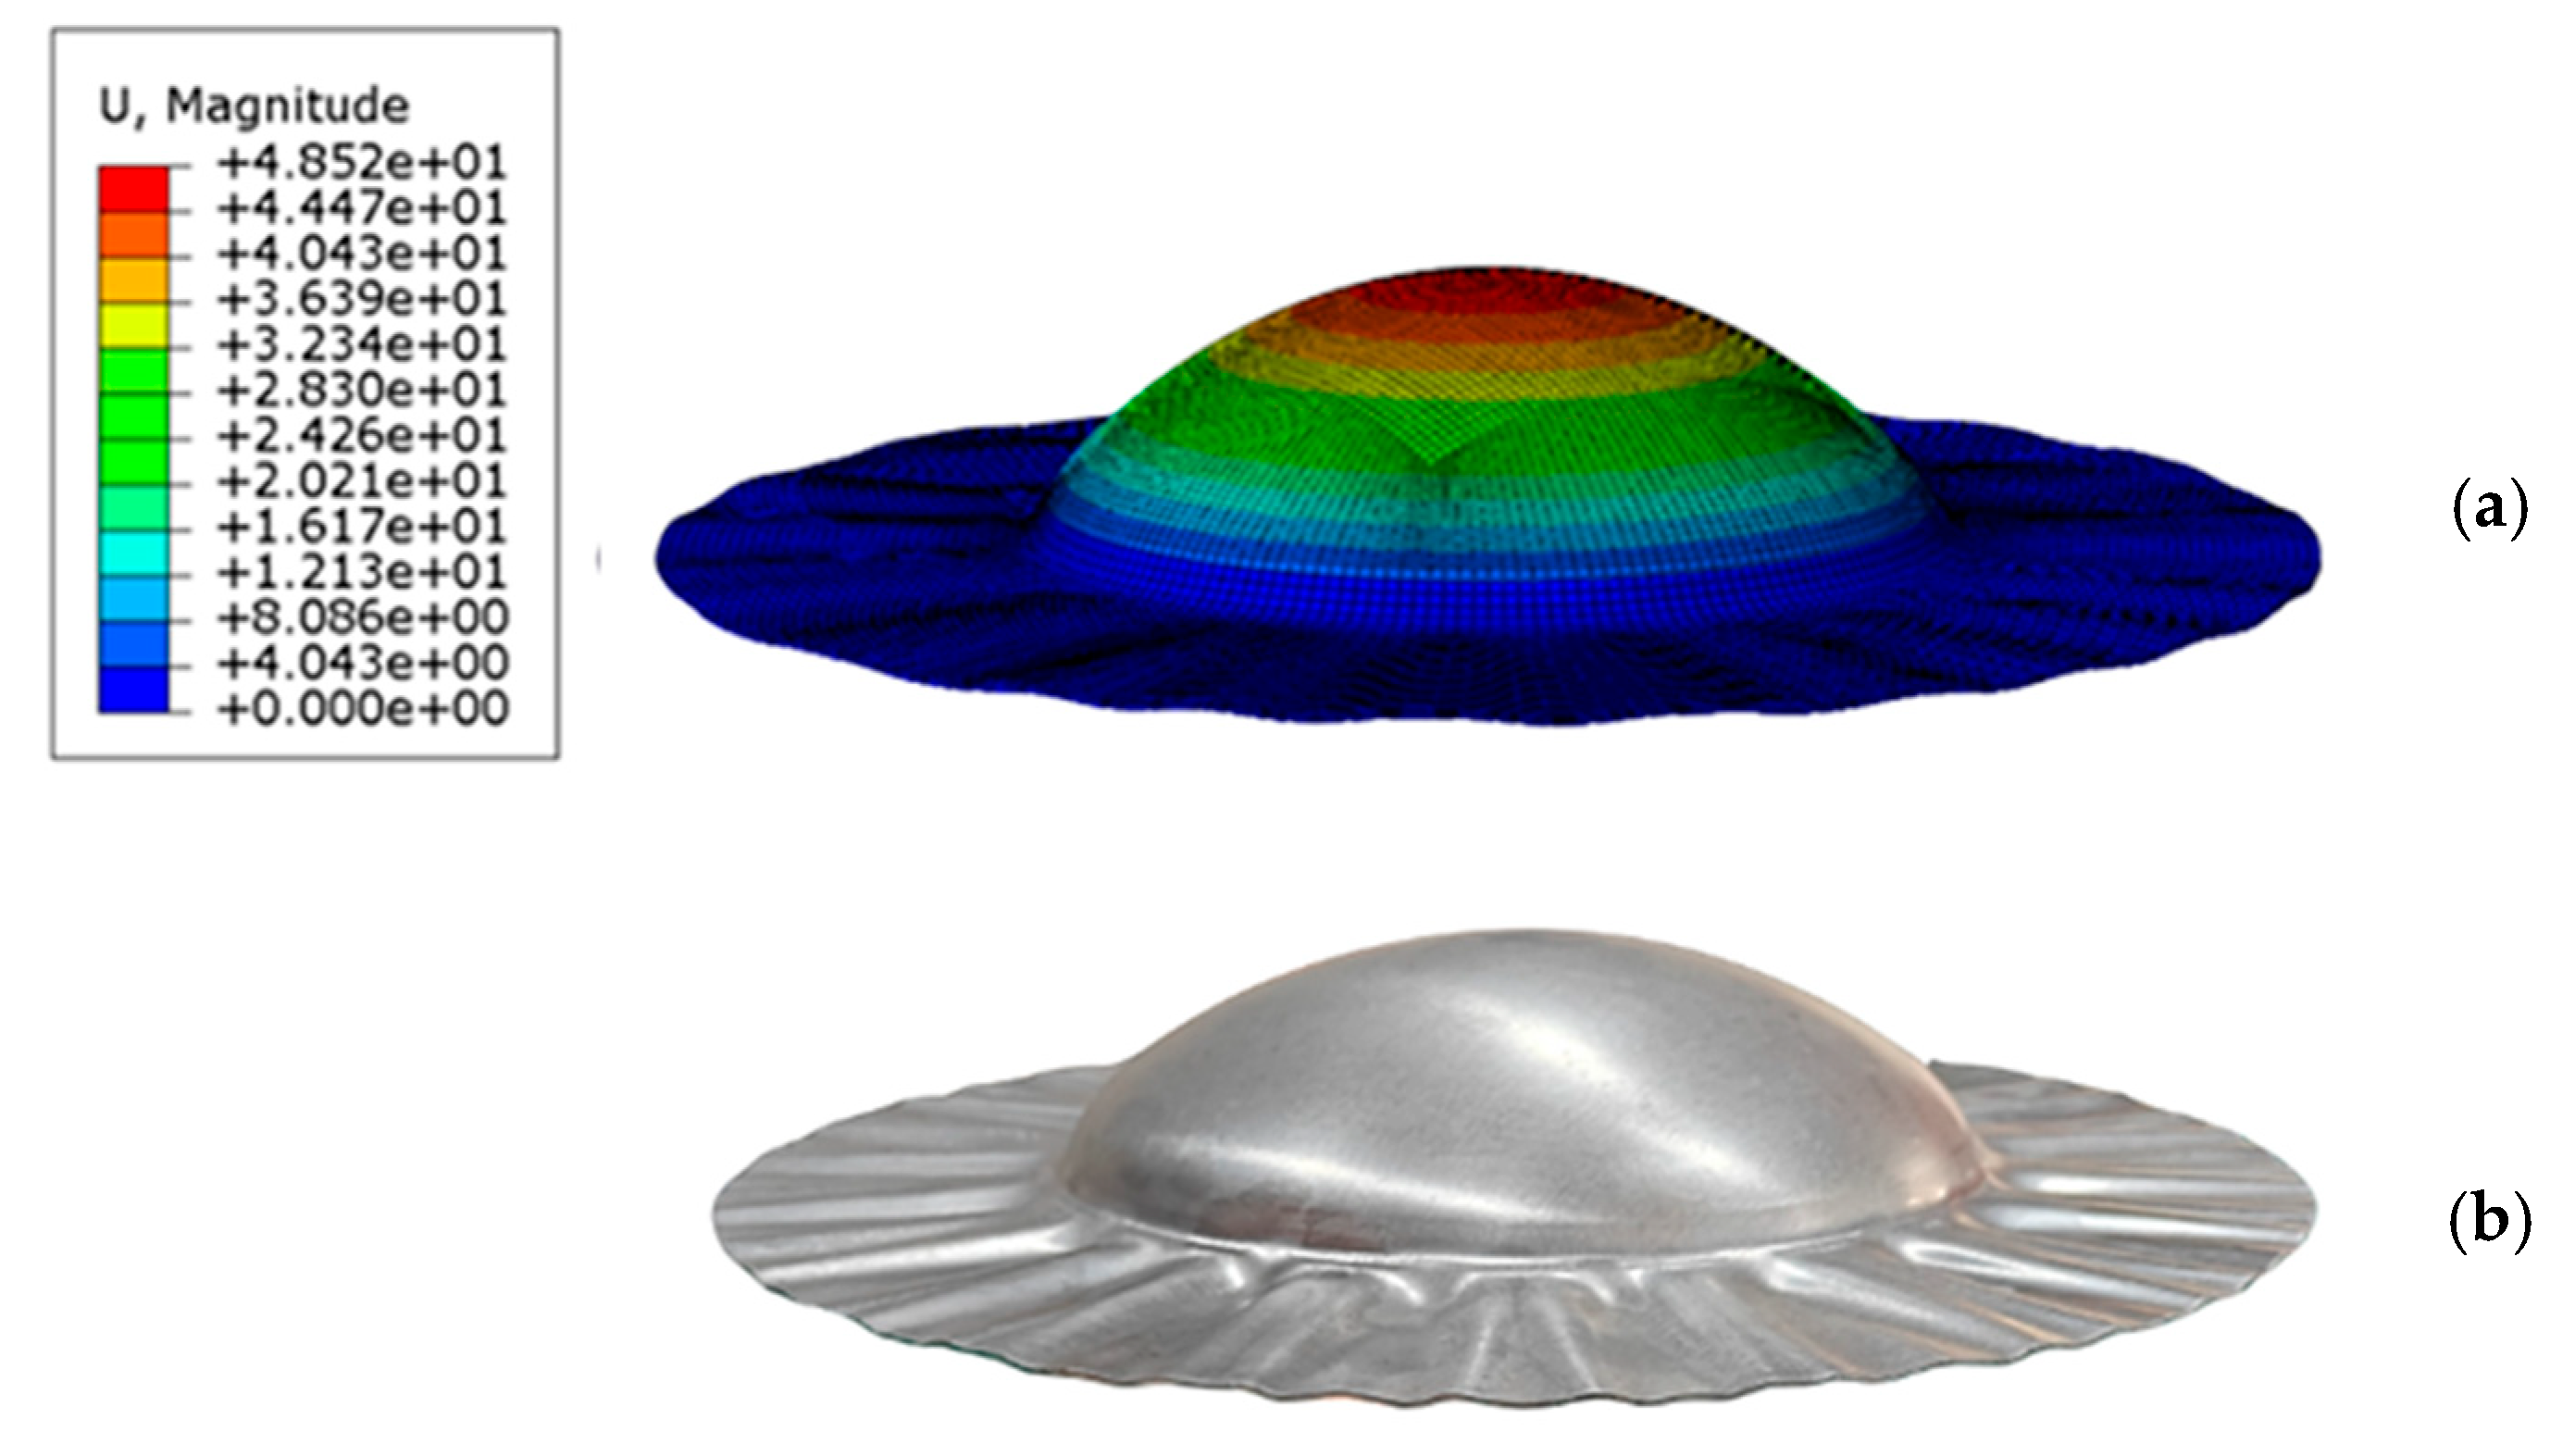
The finite element simulation, developed with axisymmetric boundary conditions and a symmetric internal pressure of 5.5 MPa, accurately replicated the deformation behavior observed in the experiments. The simulation set-up mirrored the experimental parameters, including a friction coefficient of 0.08 and a blank holding force of 340 kN. As shown in Figure 9, the simulation results closely matched the experimental observations, with wrinkle formation occurring symmetrically along the outer region of the dome, consistent with the actual shell hydroforming (SHF) components.
The simulation revealed a maximum height of 48.52 mm under the same experimental conditions (Table 6). The wrinkle formation, observed in the experiment, was also replicated in the simulation. Thickness distribution measurements were taken at identical locations for both the simulation and the experiment. A comparison of these results is presented in Figure 10.
The distribution of von Mises stress and equivalent plastic strain (Figure 11 and Figure 12) showed clear radial symmetry, with higher concentrations near the apex and a lower die fillet, consistent with expectations for a symmetric pressure-driven forming process.
Locations 8 and 9 (marked in Figure 8) had the maximum thickness since these regions retained more material due to material flow during the forming process. However, these same locations exhibited the lowest von Mises stress and equivalent plastic strain.
During the initial forming stages, the blank began to wrap around the fillet area. By the end of the forming process, the blank was fully wrapped around the fillet, which halted further material flow. This explains the significant stretching observed at position 10, where the material underwent considerable deformation.
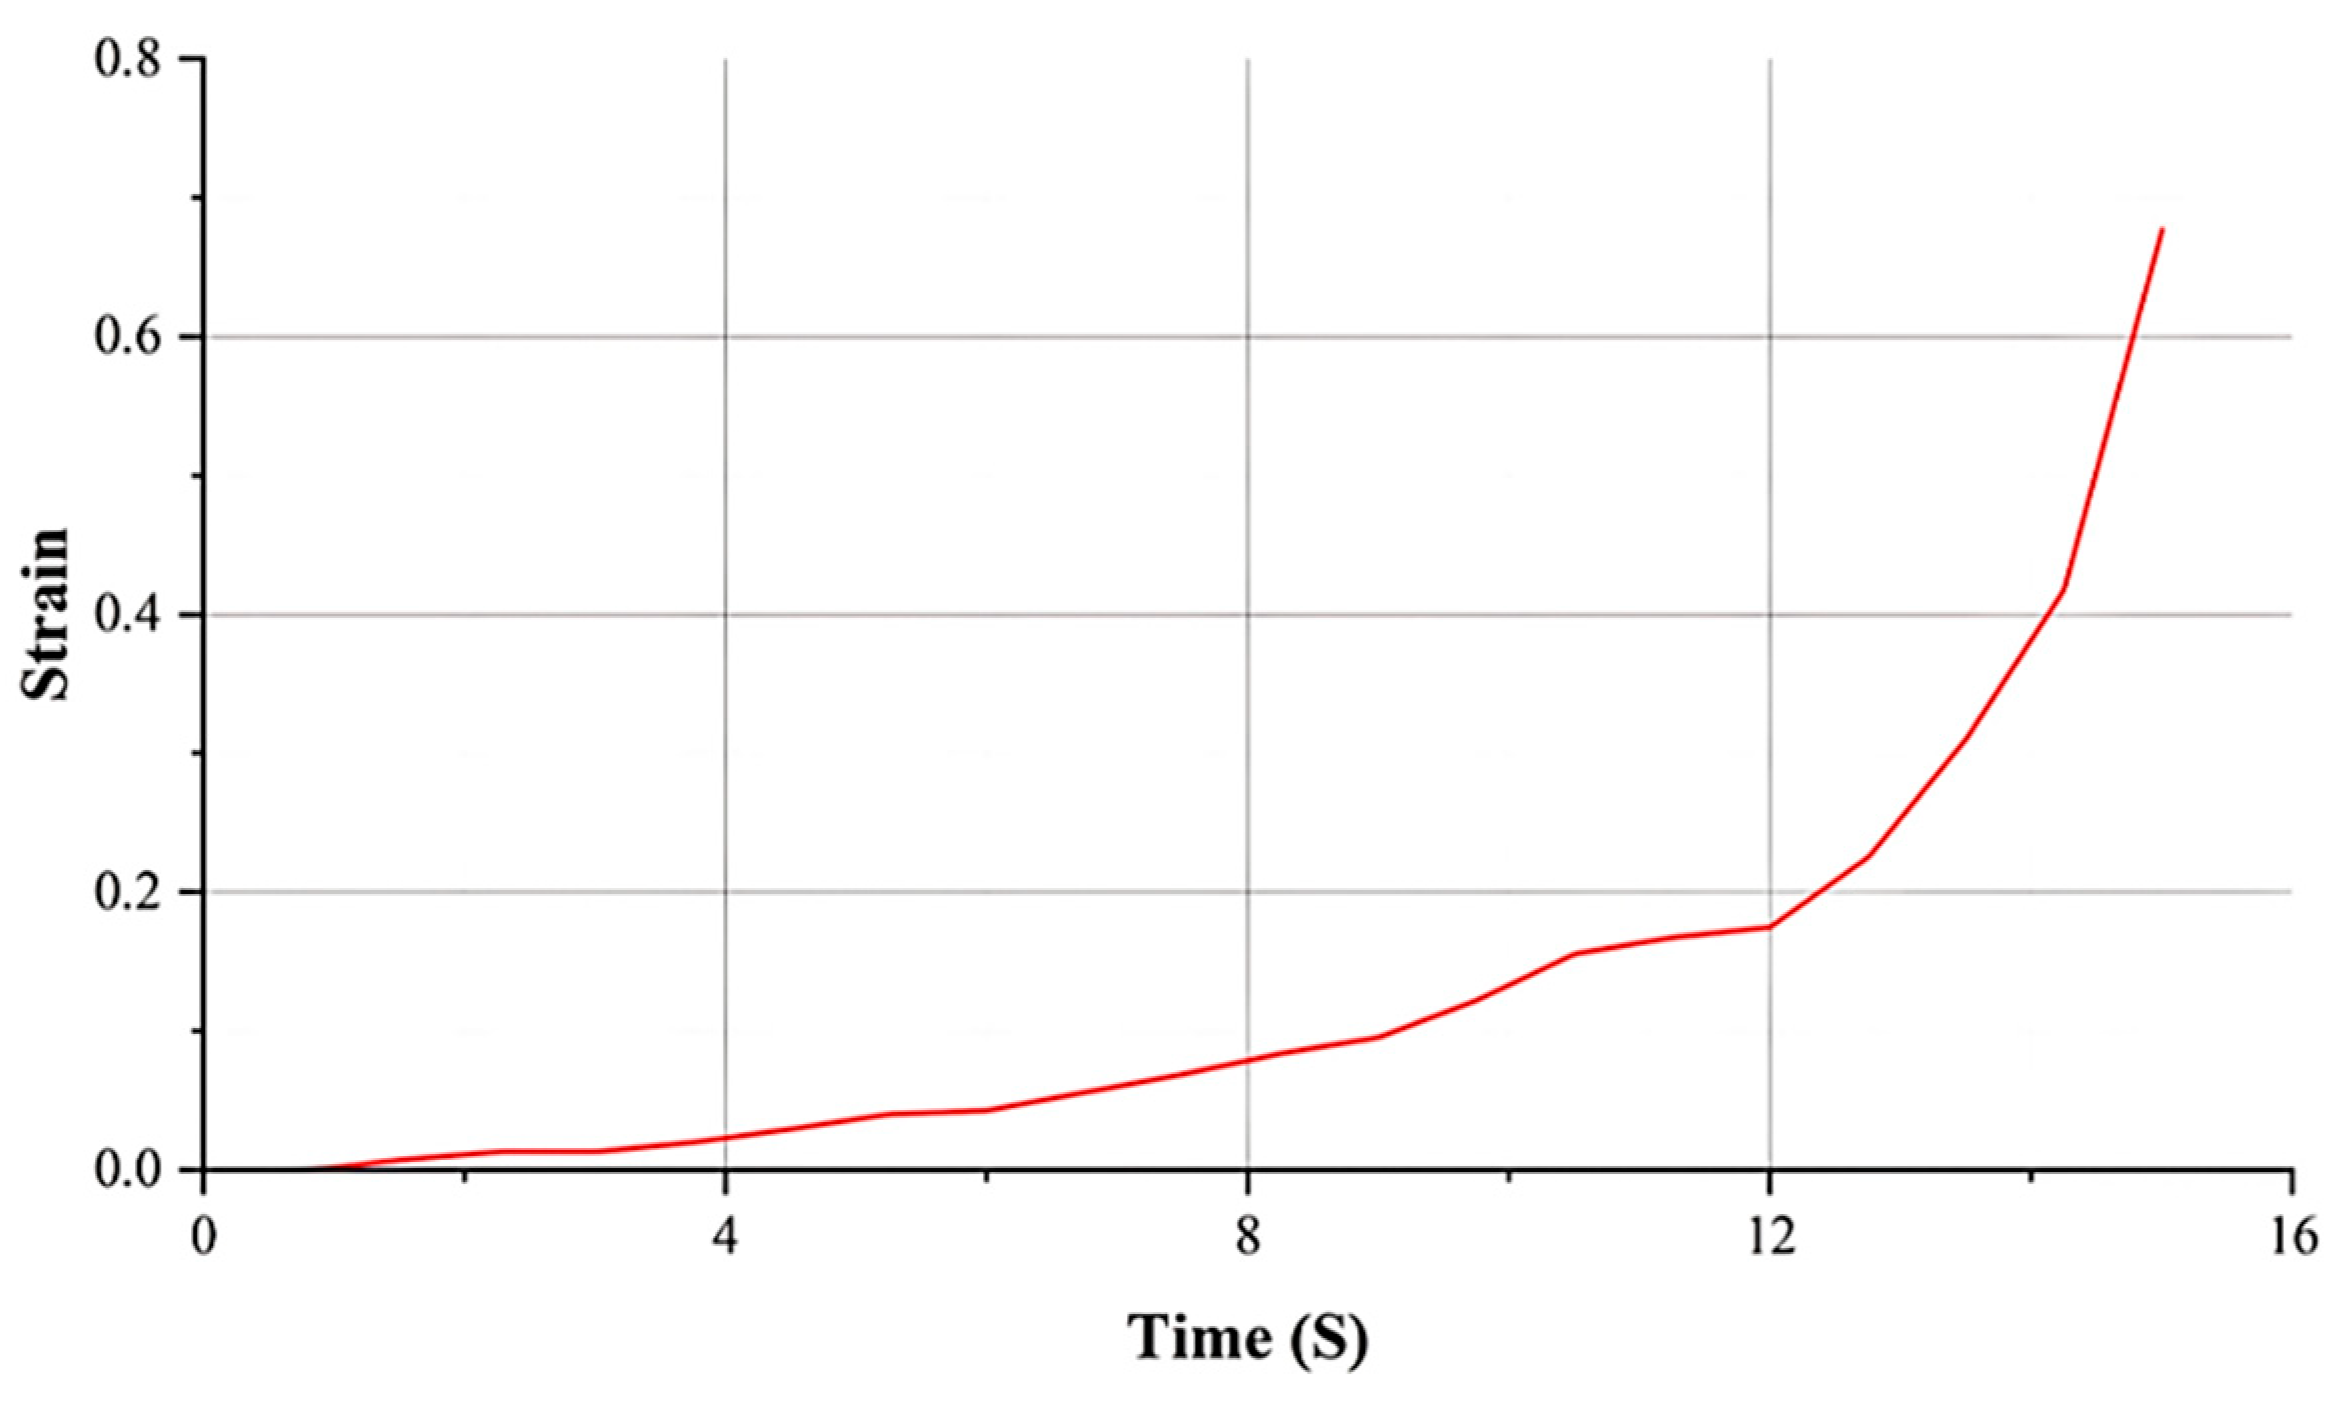
The strain rate history was analyzed at the dome’s apex throughout the hydroforming process. Using the slope of the strain–time curve (Figure 13), the strain rate was determined. The results revealed strain rates across three time intervals: 0.0086 s−1 from 0 to 5 s, 0.025 s−1 from 5 to 10 s, and 0.1 s−1 from 10 to 15 s. Higher strain rates increased the flow stress due to strain rate sensitivity, which is a critical property of materials like AA5052. This material exhibits high strain rate sensitivity, which significantly impacts its formability and strength. These findings emphasize the need to monitor and control strain rates during the hydroforming process to achieve the best possible forming results.
The hydrostatic stress and strain were analyzed in detail to understand their impact on volumetric deformation behavior during the shell hydroforming process. Hydrostatic stress is calculated as the average of the principal stresses (S11, S22, and S33) using the following formula:
σ = 1 3 S 11 + S 22 + S 33
In this study, the hydrostatic stress at the dome’s apex was found to be 160 MPa, indicating uniform tensile pressure during deformation. This tensile stress influences the material’s behavior, especially at higher strain rates. At a strain rate of ε ˙ = 0 1 s during the final stage, the strain rate sensitivity increases the material’s flow stress. While tensile hydrostatic stress generally promotes void formation, an elevated strain rate limits the time available for void growth, helping delay failure and maintain deformation uniformity. This interplay between tensile hydrostatic stress and strain rate sensitivity minimizes significant defects, such as premature void expansion or cracking, ensuring controlled material deformation.
The hydrostatic strain (ε) gives insights into volumetric deformation behavior and is calculated as the average of the normal strains (LE11, LE22, and LE33) using the following formula:
ε = 1 3 L E 11 + L E 22 + L E 33
In this case, the hydrostatic strain was minimal, being ε = 0.001, indicating that the deformation was primarily dominated by shape changes rather than volumetric changes. This result shows that the material underwent geometric distortion. Additionally, the shear strain (LE12) was observed, with a value of LE12 = 0.1, which plays a significant role in localized deformation mechanisms, enabling the formation of complex geometries. The combination of minimal hydrostatic strain and noticeable shear strain indicates that the deformation was largely driven by shape transformation, with localized shearing enhancing the material’s ability to respond to forming stresses.
These findings emphasize the intricate balance between hydrostatic stress, strain rate sensitivity, and shear strain in shaping the material’s deformation behavior. Tensile hydrostatic stress plays a significant role in driving material expansion, while minimal volumetric strain and significant shear strain contribute to maintaining controlled deformation. At higher strain rates, the tensile hydrostatic stress, combined with the strain rate sensitivity, limits void growth and delays failure, ensuring a defect-free process. This insight is critical for optimizing hydroforming processes, particularly for strain rate-sensitive materials like aluminum alloys, where precise control of stress and strain conditions is essential for achieving optimal formability and strength.

3.3. Optimization Results

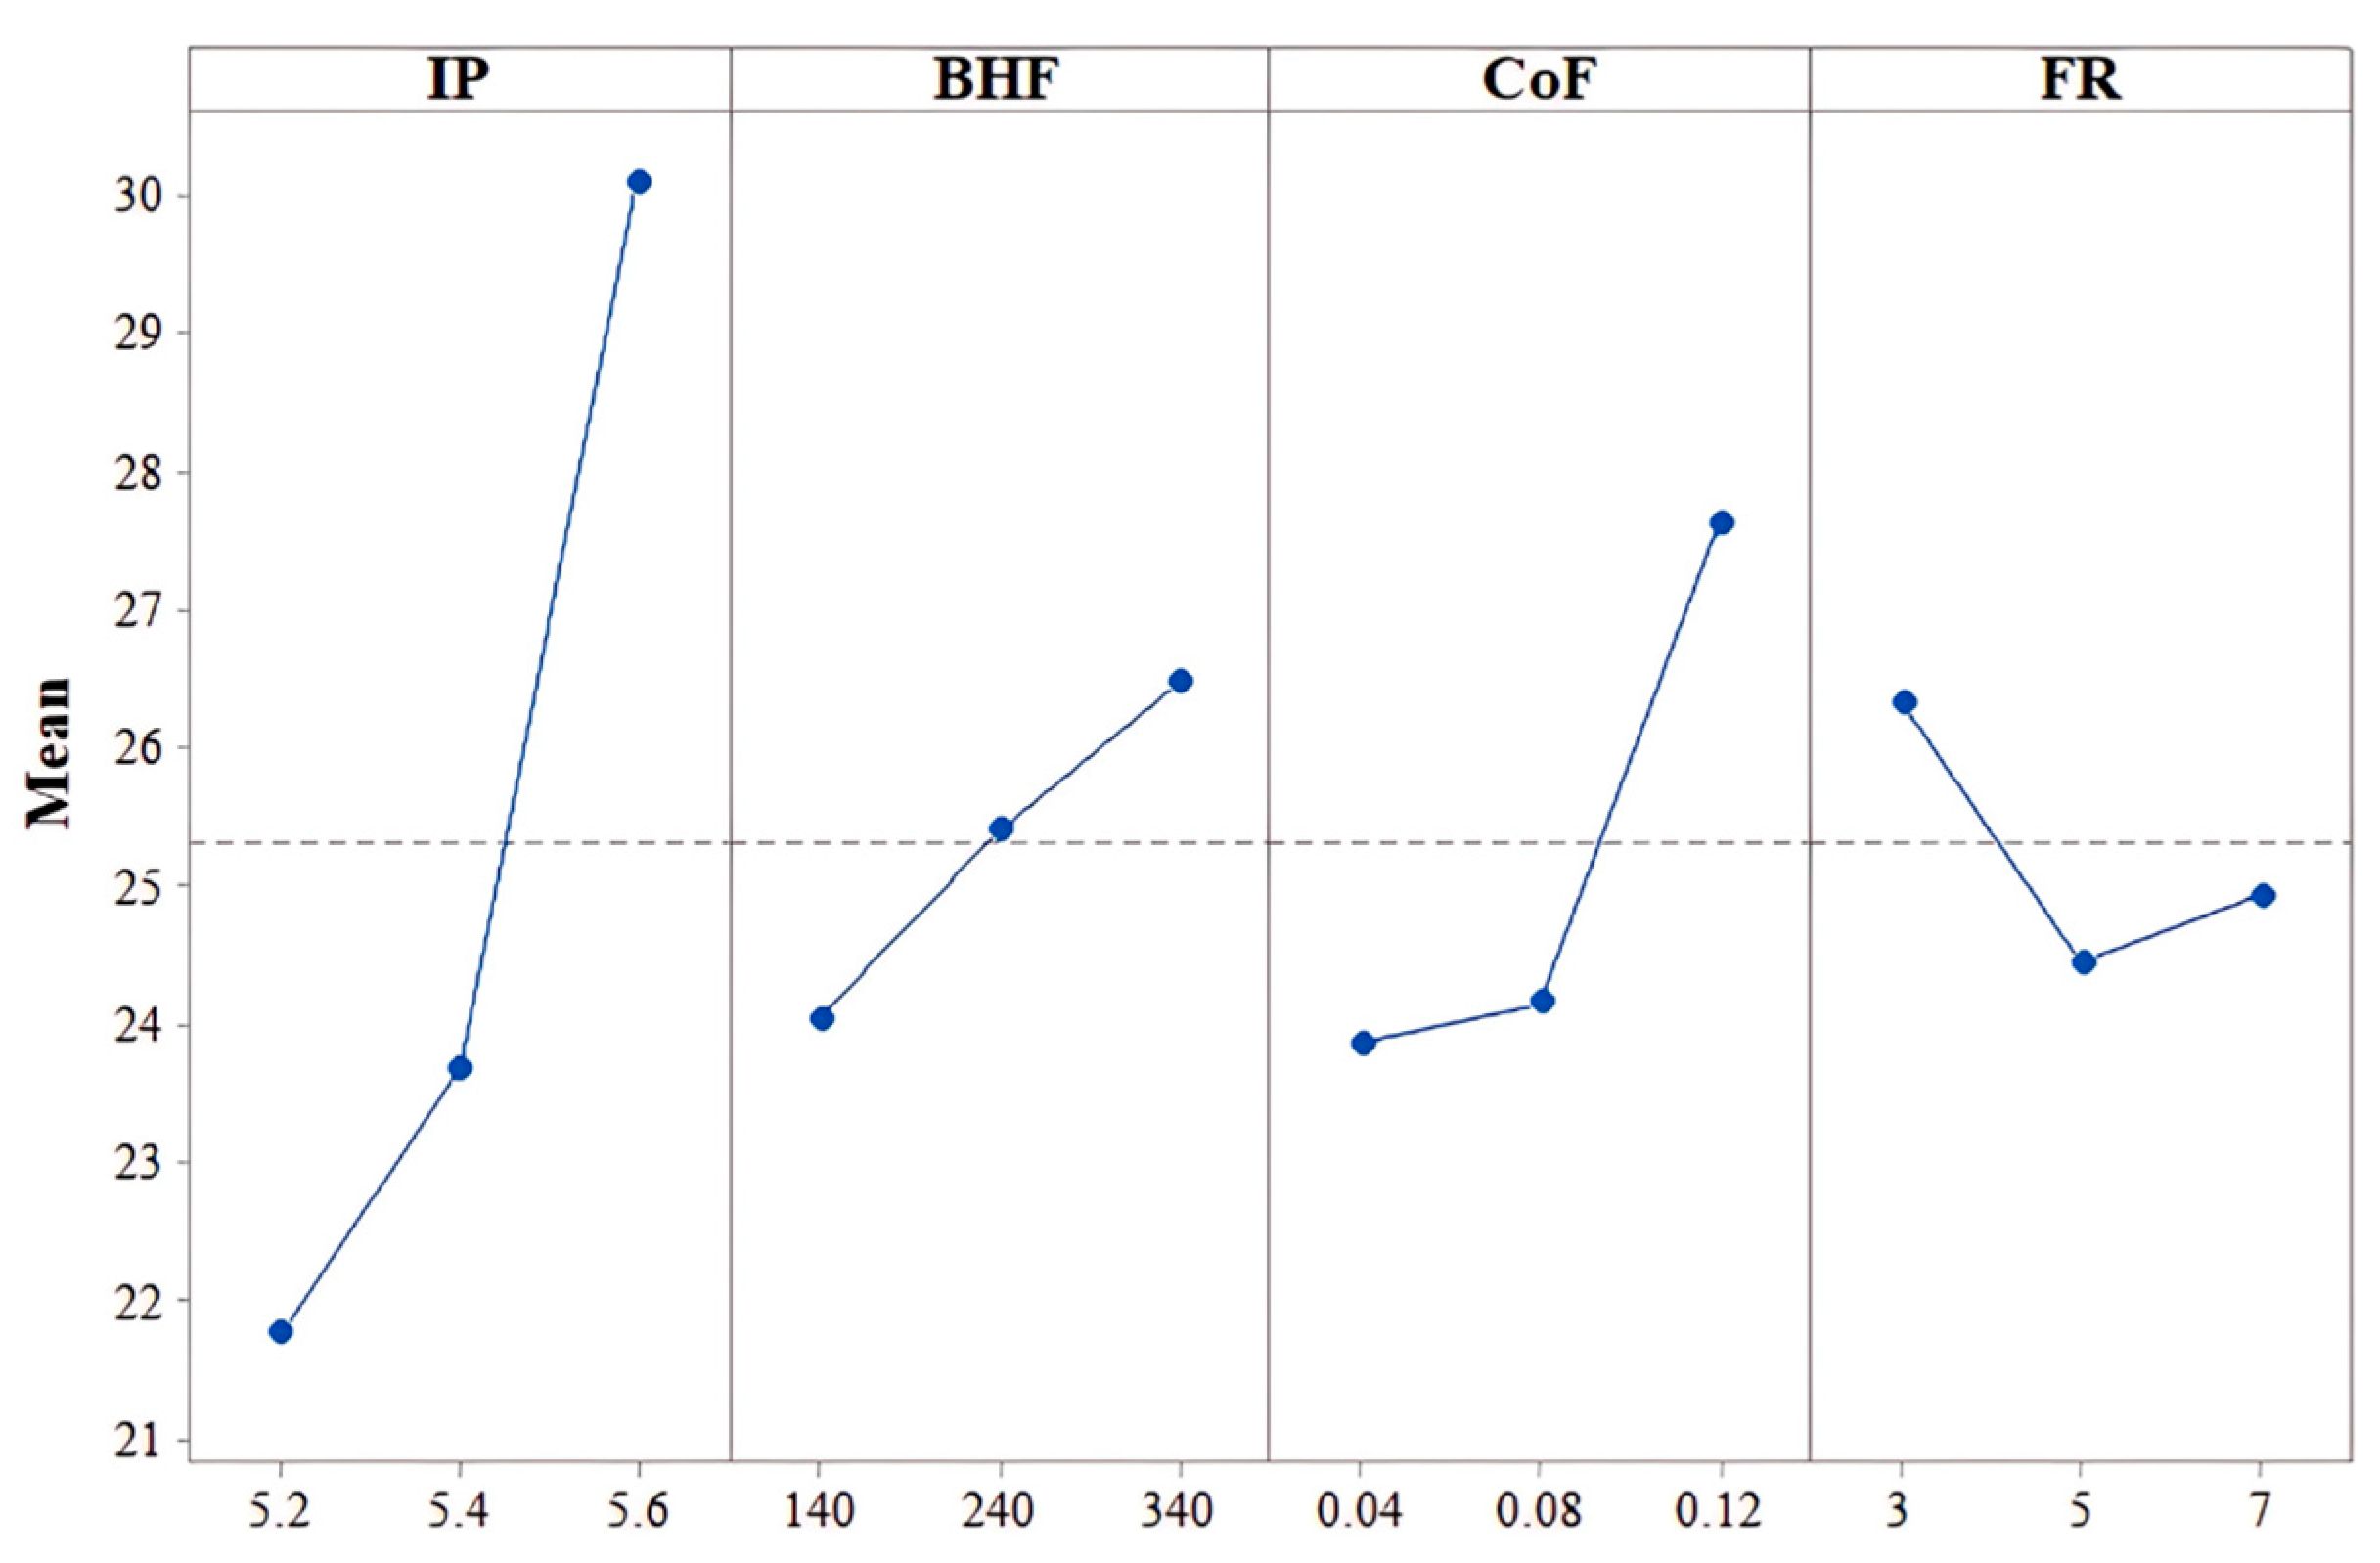
Figure 14 presents the main effect plot on the thinning percentage, whereas Figure 15 illustrates the main effect plot for the dome height.
In the thinning percentage plot, it can be observed that the IP had a significant impact, with higher pressure values leading to increased thinning. The BHF also affected thinning, though to a lesser extent, with an increasing trend. The CoF exhibited a rise in thinning as its value increased, indicating that frictional resistance plays a role in material flow restriction. Additionally, the FR showed a slight decrease in thinning with an increase in its value.
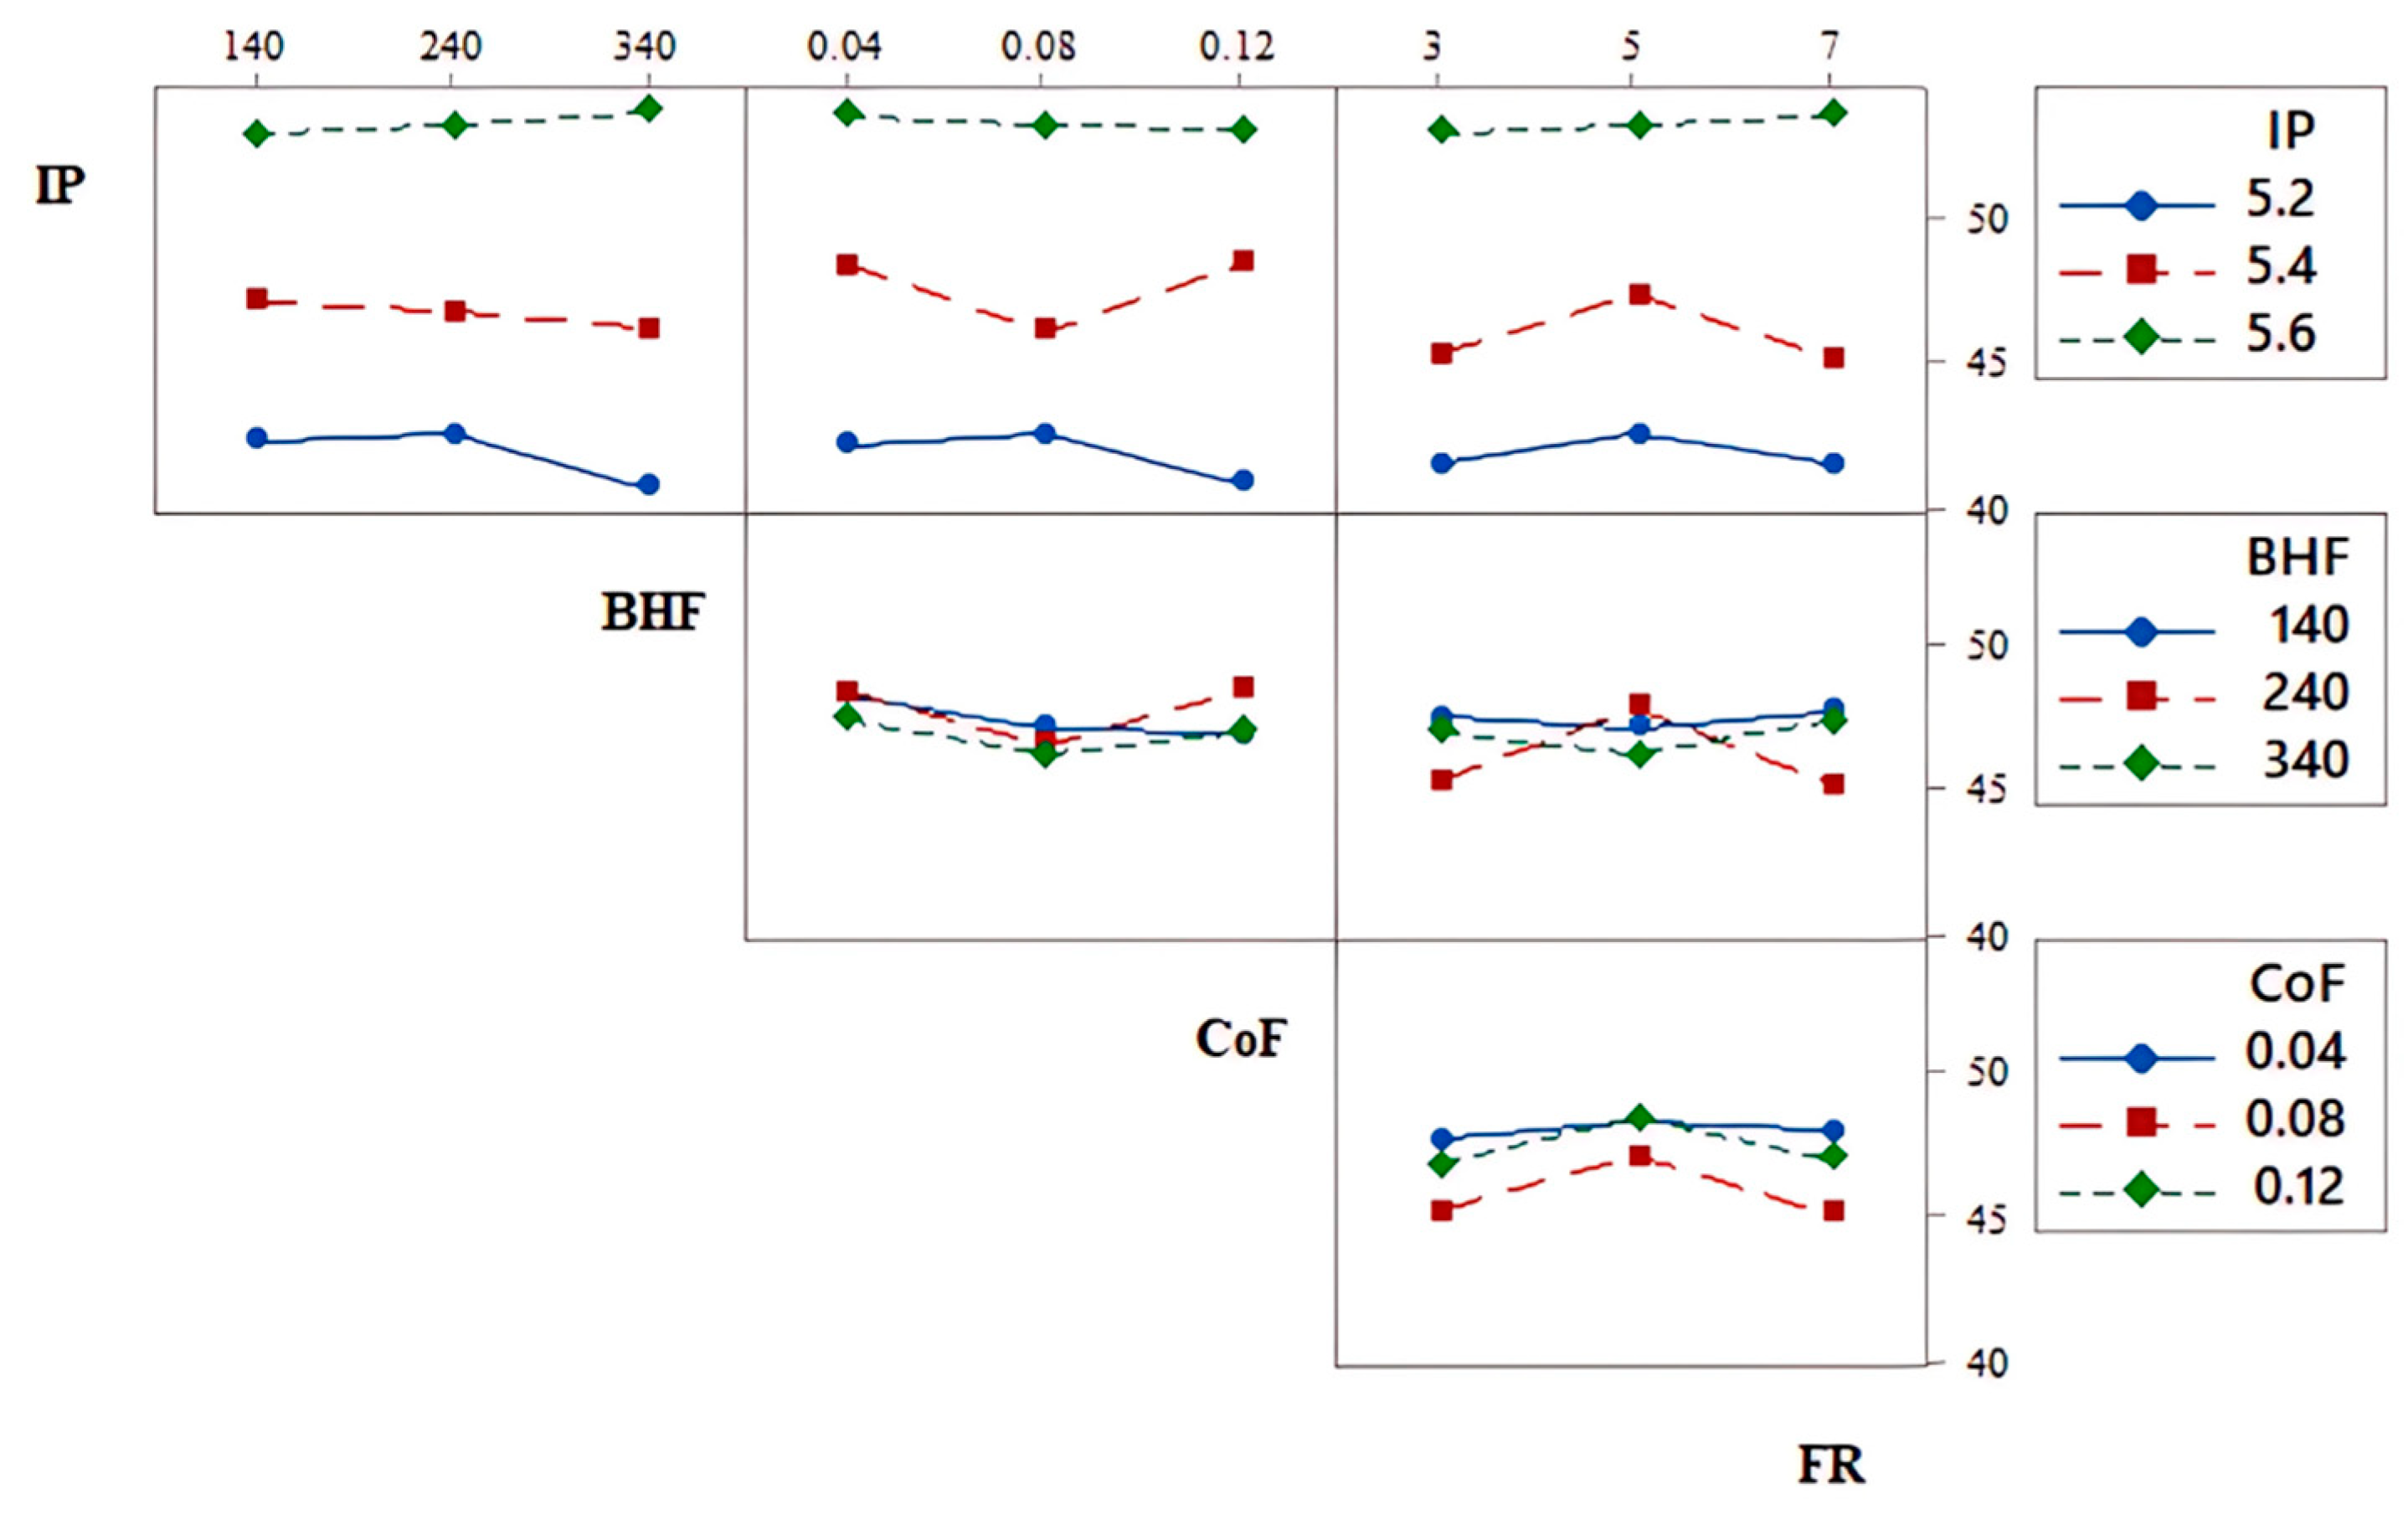
In the dome height plot, the IP again showed a dominant effect, with increased pressure resulting in a higher dome height. The BHF and CoF did not show substantial changes in dome height, while the effect of the FR was marginal.
The results showed that internal pressure had the most dominant effect on thinning and the dome height, reinforcing its role in driving symmetric deformation. The influence of other parameters such as the BHF and CoF was consistent across the axisymmetric geometry.
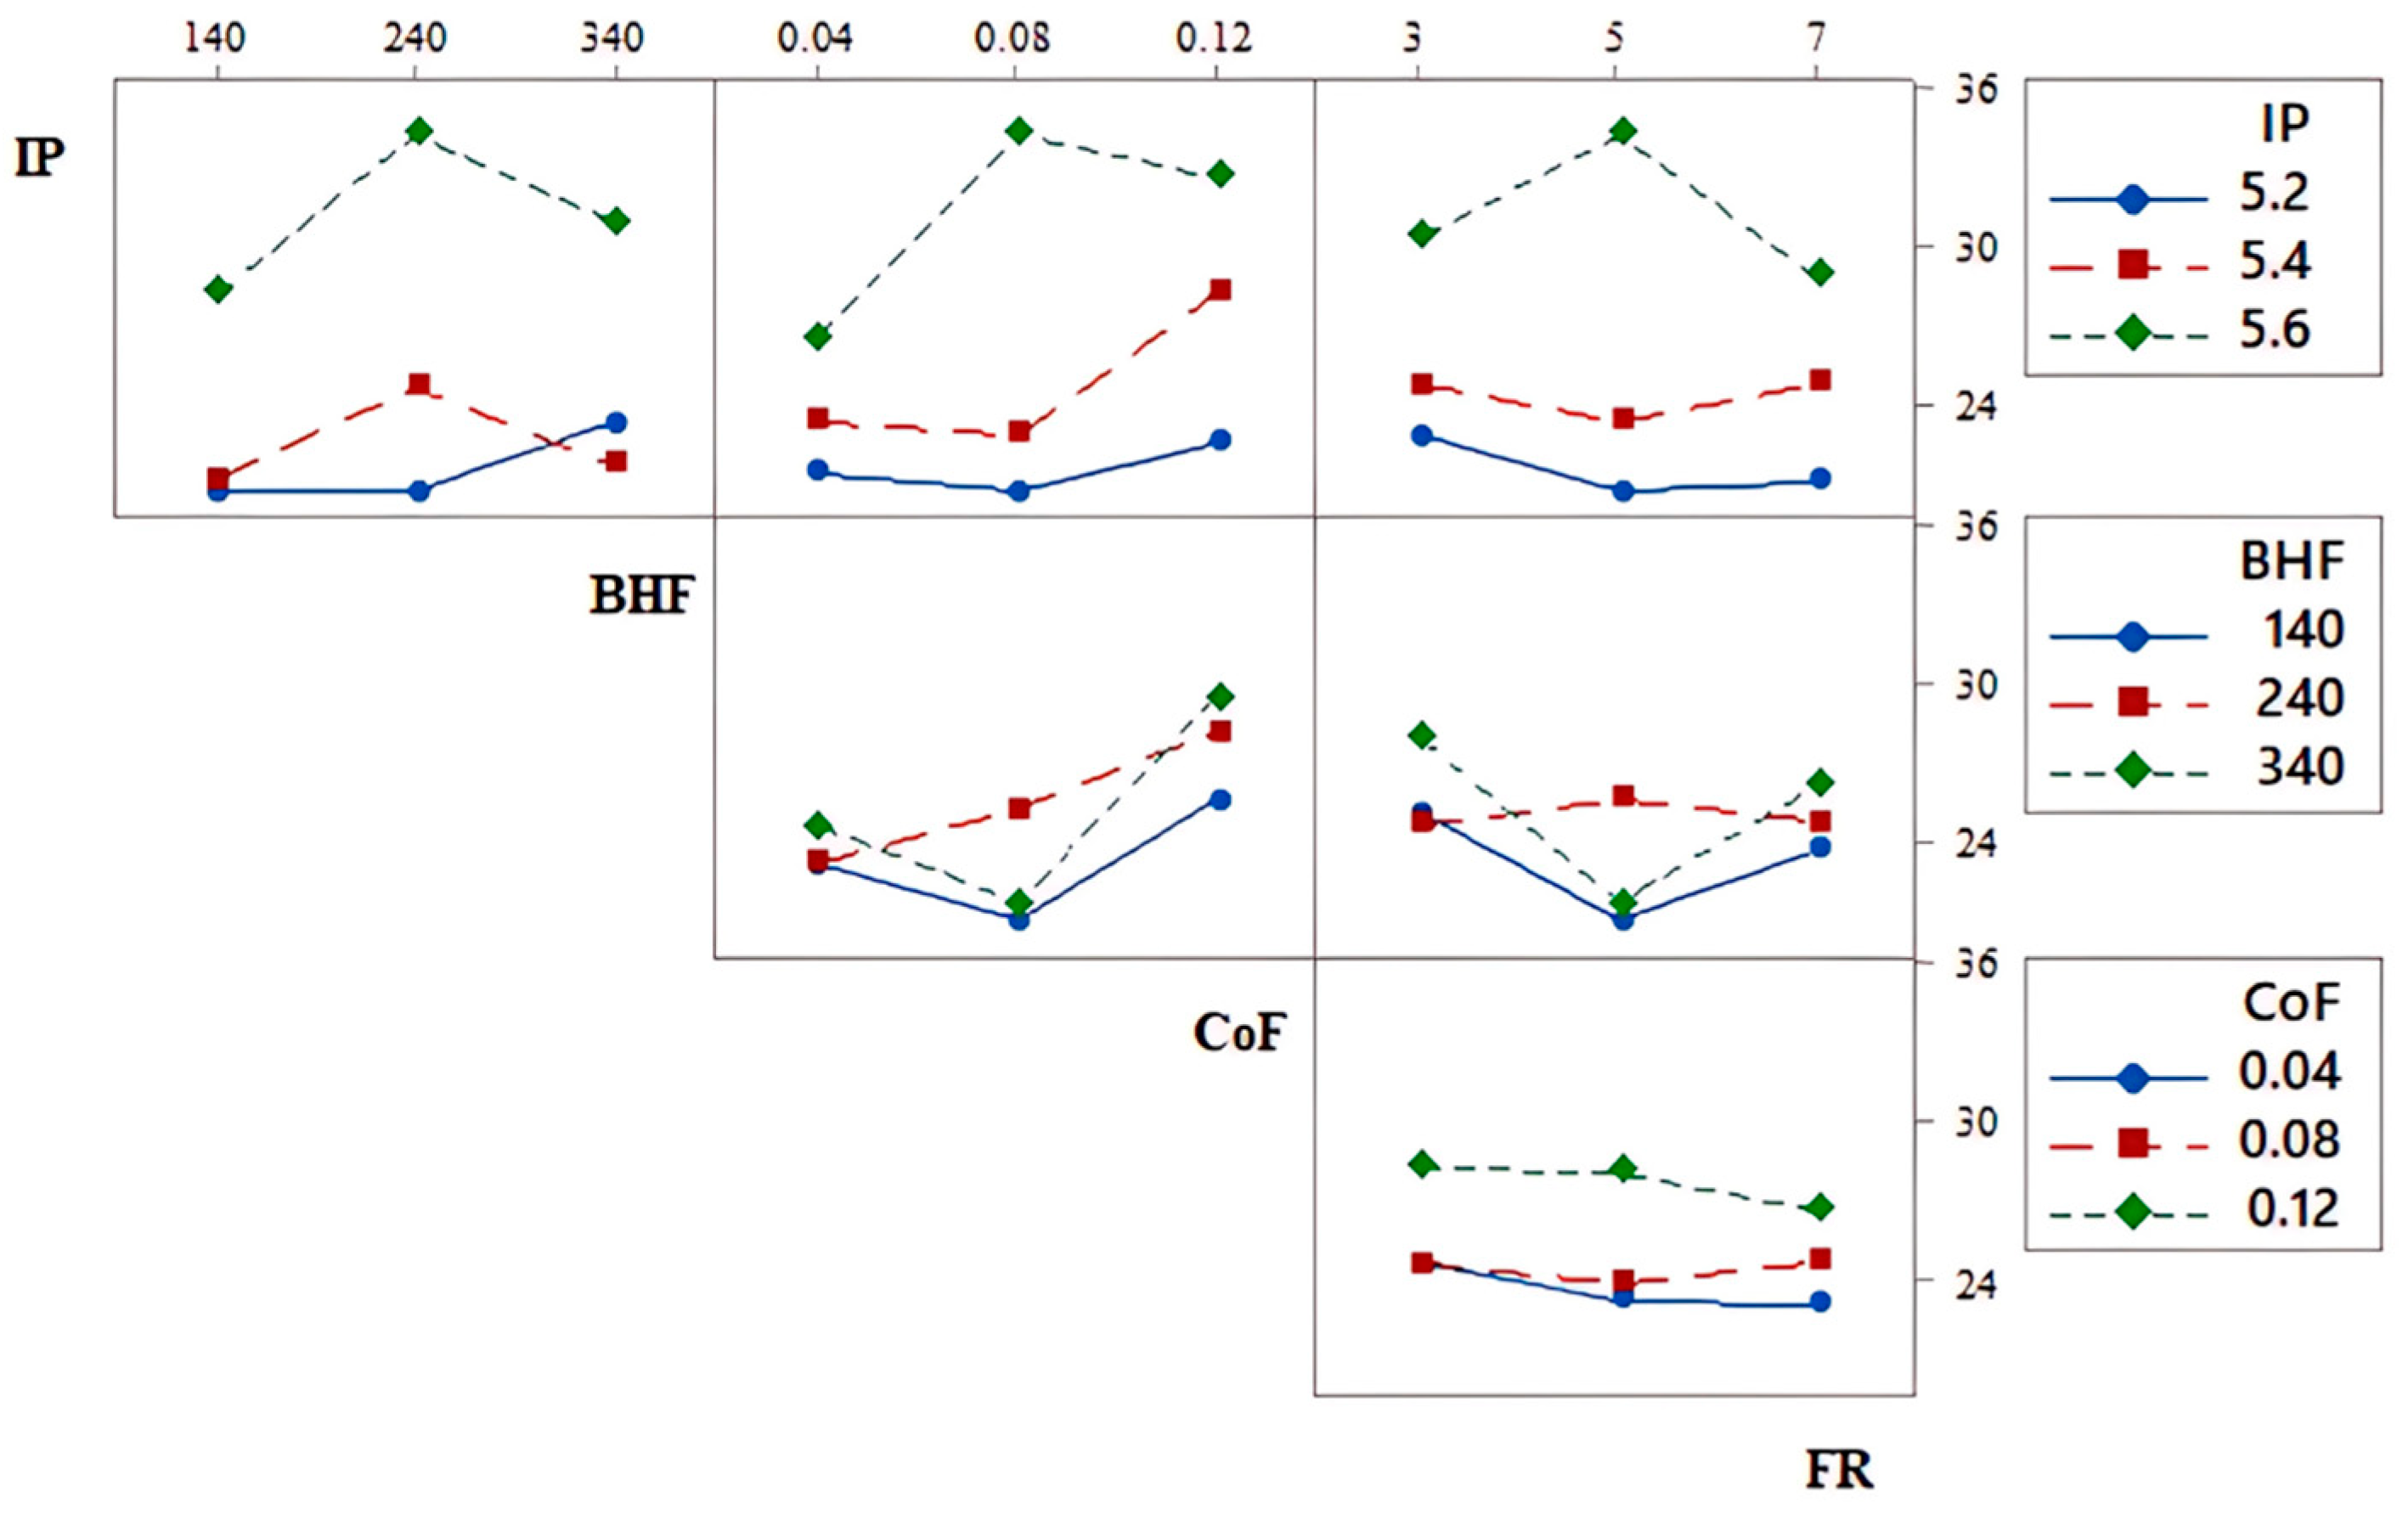
Interaction plots were used to understand the combined effect of two or more input parameters on the output responses in hydroforming processes. These plots visualize how changes in one parameter impacted the response when another parameter was varied, offering insights into parameter interactions that influence thinning and the dome height. The interaction plots for the SHF are shown in Figure 16 and Figure 17. The plots highlight the interactions among the IP, BHF, CoF, and FR and the responses of the thinning percentage and dome height. For the thinning percentage, the interaction between the IP and BHF significantly influenced the response, with a higher IP and higher BHF resulting in increased thinning. The interaction between the CoF and FR shows that increasing the CoF tends to increase thinning, while varying the FR has minimal impact. The interaction between the IP and CoF also indicates that thinning is more pronounced at higher CoF levels when the pressure is increased.
The regression equations derived for the thickness reduction and dome height are as follows:
% Thinning = 2629 − 980 IP + 0.1254 BHF − 793 CoF − 0.351 FR + 91.5 IP × IP − 0.000236 BHF × BHF + 155.6 IP × CoF
Dome Height = 573 − 218.0 IP − 0.1759 BHF − 167.3 CoF + 4.455 FR + 22.22 IP × IP + 893 CoF × CoF − 0.4391 FR × FR + 0.03125 IP × BHF + 0.0594 BHF × CoF
The optimization was carried out by setting the following objectives:
  • Minimize thinning to reduce material failure and enhance formability.
  • Achieve the targeted dome height of 50 mm to meet the design specifications.
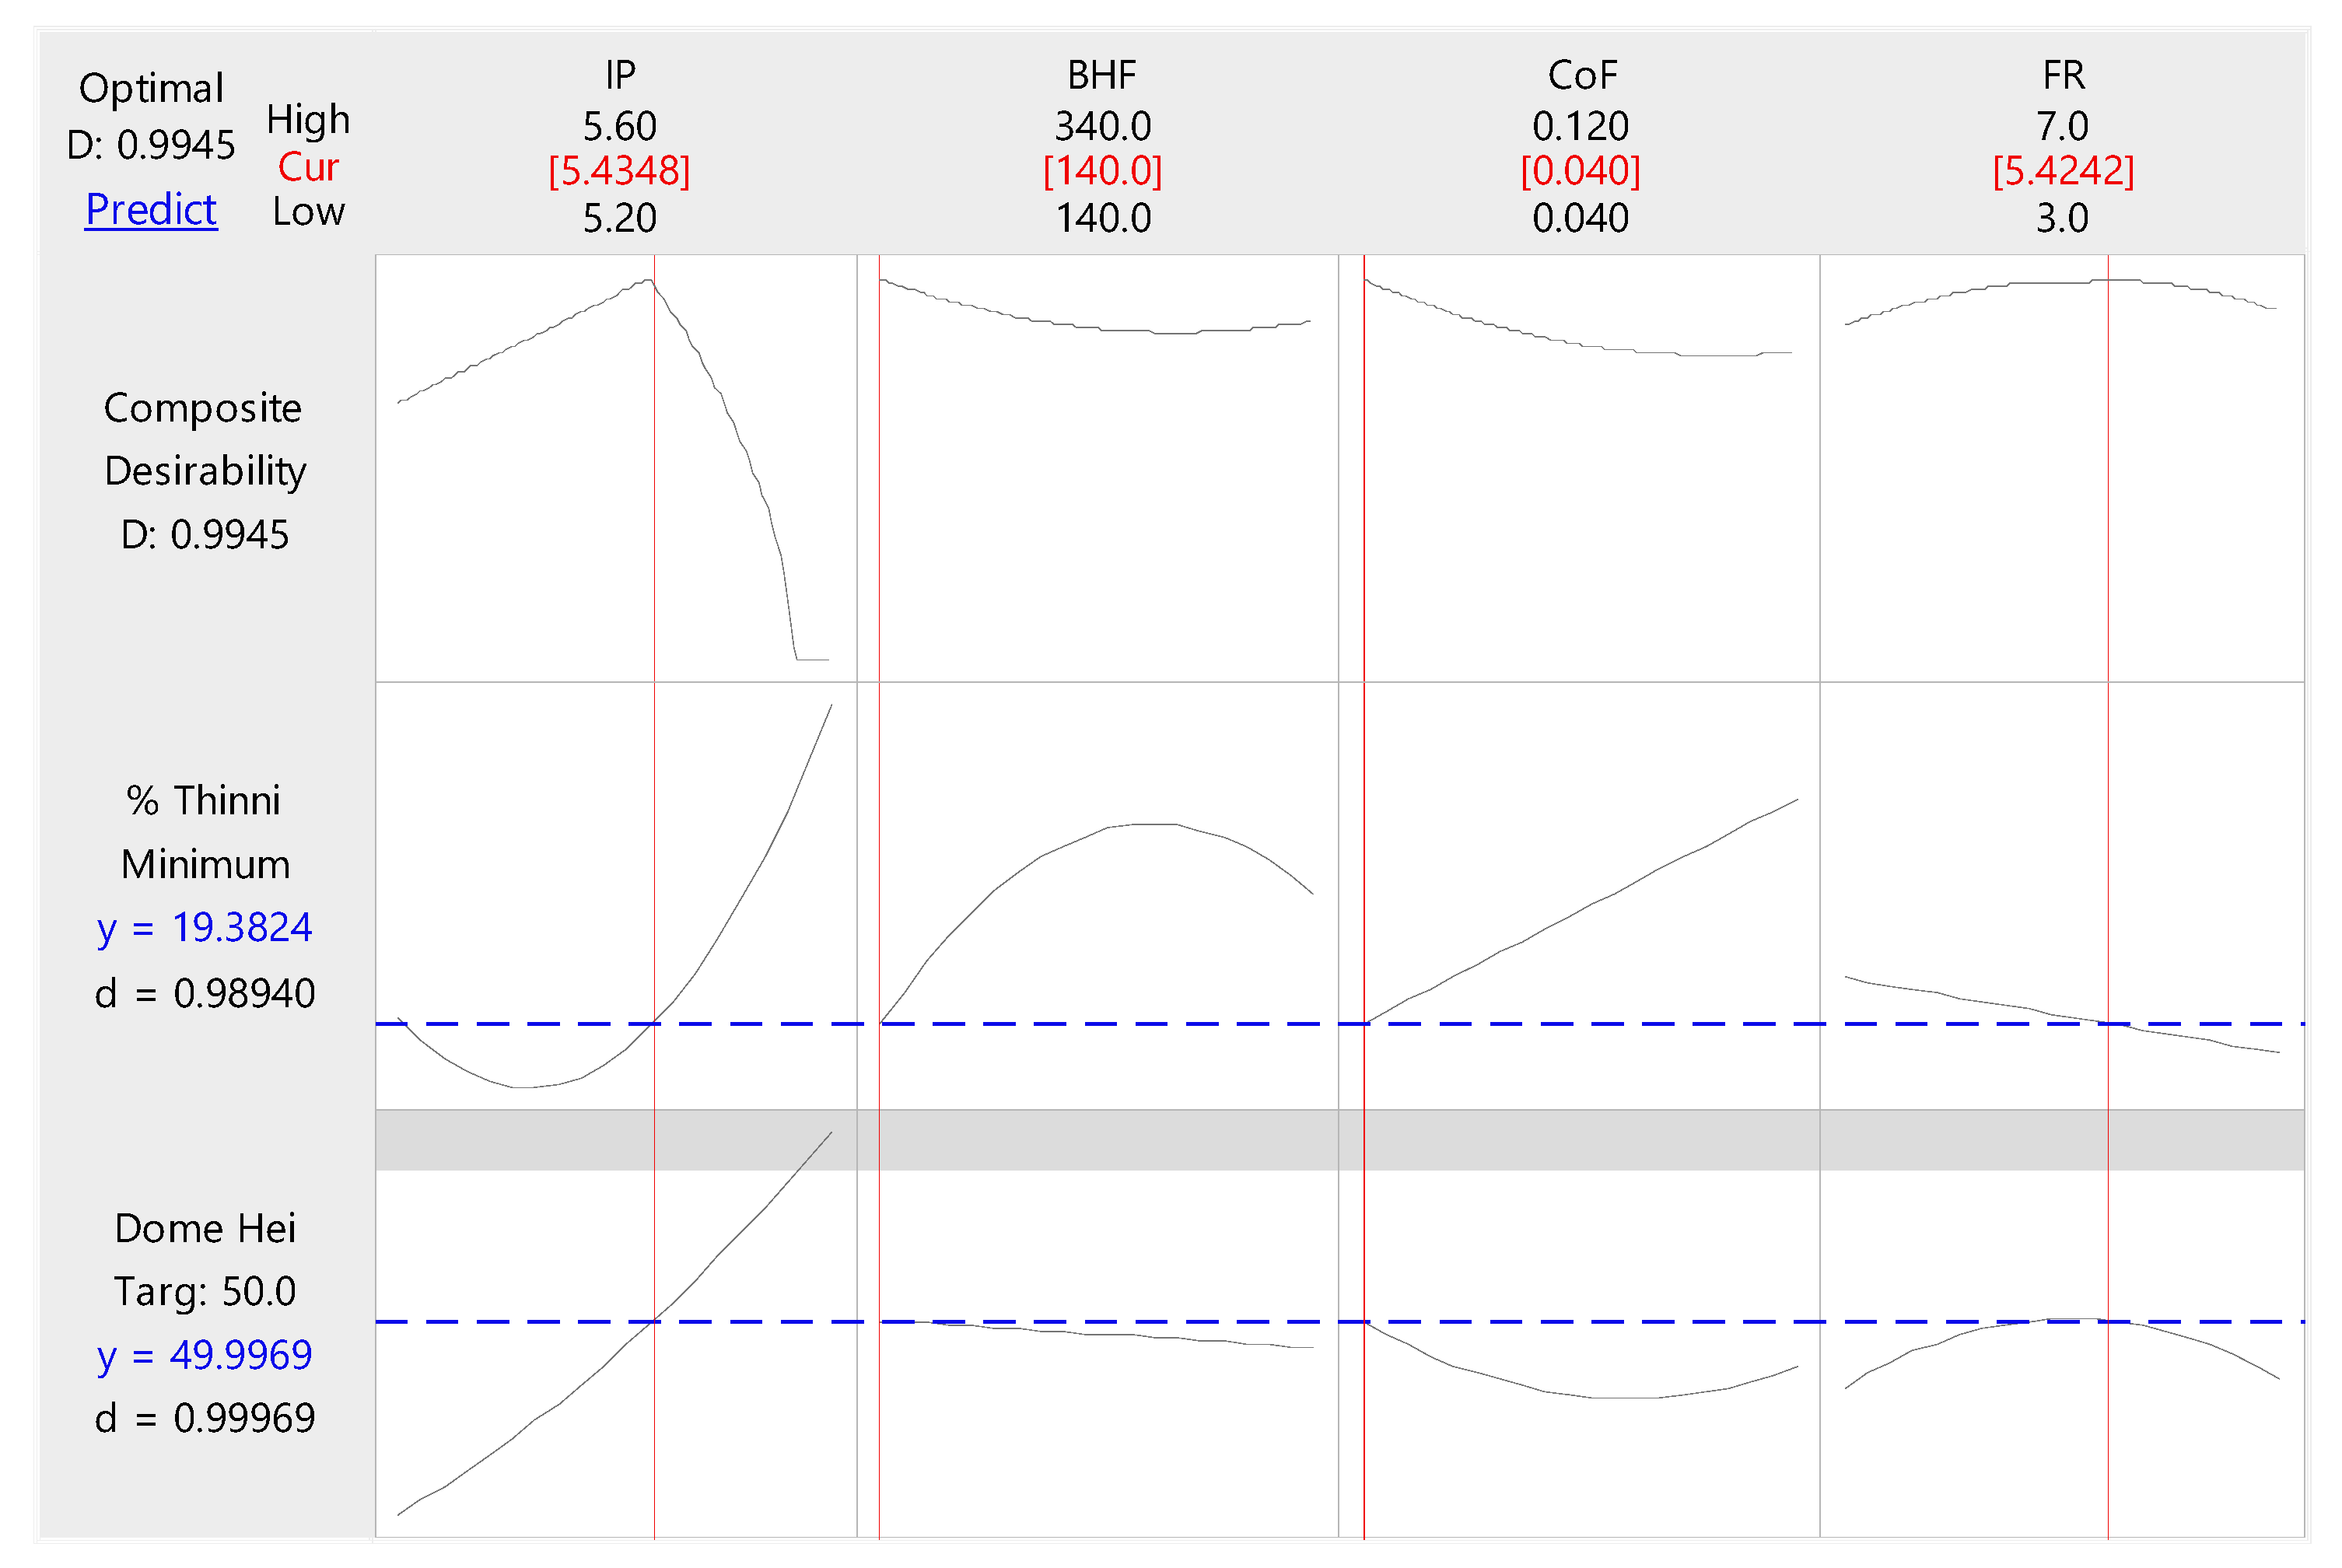
The optimization procedure involved the use of desirability functions, which combine multiple objective functions into a single performance metric. A composite desirability value closer to one indicates a better combination of process parameters. The optimal set of parameters was determined by maximizing this composite desirability.
The optimal parameters obtained from the optimization analysis were an IP of 5.43 MPa, a BHF of 140 kN, a CoF of 0.04, and an FR of 5.42 mm. These parameters ensured that the forming process was efficient while minimizing thinning and achieving the desired dome height. As a result of the optimization, the optimal output parameters achieved were a dome height of 50 mm, meeting the target specification, and a thinning percentage of 19.38%, indicating a well-balanced and efficient forming process. Figure 18 shows the optimization plot.
The composite desirability achieved was 0.9945, indicating a high level of optimization efficiency. The optimization plot is shown in Figure 18, illustrating the response surfaces and desirability contours for the SHF.
The optimized input parameters were then fed into simulations, and the resulting outputs were compared with the predictions. The FE analysis predicted a dome height of 51.58 mm and a thinning percentage of 19.6%, resulting in percentage errors of 3.08% and 1.12% respectively. This low error percentage indicates the reliability of the optimization process and the accuracy of the response surface models used.
4. Conclusions

  • A 3D experimental set-up and validated finite element (FE) model were developed to study the hydroforming of hemispherical shells, focusing on the following key parameters: the blank holding force (BHF), internal pressure (IP), friction coefficient (CoF), and flange radius (FR).
  • The FE model accurately replicated the deformation features observed experimentally, including the dome height, thinning, and wrinkle formation, confirming its predictive capability.
  • A process window was established to classify failure modes such as tearing, bursting, and incomplete forming, enabling the identification of safe operating zones.
  • Thickness distribution analysis revealed a maximum thinning of 21.55% at the apex.
  • The FE model showed that tensile hydrostatic stress of approximately 160 MPa contributed to material expansion and deformation. Although such stress conditions typically promote void nucleation, the use of a controlled strain rate of ε ˙ = 0.1 s−1 during the final forming stages effectively limited void growth, leading to stable material flow and uniform forming.
  • Multi-objective optimization using the response surface methodology (RSM) identified the optimal process parameters—IP = 5.43 MPa, BHF = 140 kN, CoF = 0.04, and FR = 5.42 mm—achieving the target dome height (50 mm) with minimized thinning (19.38%).
  • The model’s predictions closely matched the optimized outcomes, with errors of just 3.08% for the dome height and 1.12% for thinning, demonstrating the robustness of the integrated simulation optimization approach.
  • Overall, this study provides a reliable framework combining experimental validation, numerical modeling, and optimization for improving the hydroforming process and minimizing defects in complex geometries.

Author Contributions

Conceptualization, A.A. and A.R.; methodology, A.A. and K.N.; software, A.A., A.R., and K.N.; validation, A.A., A.R., and K.N.; formal analysis, A.A. and R.K.V.; investigation, K.N.; resources, K.N.; writing—original draft preparation, A.A.; writing—review and editing, A.R. and R.K.V.; visualization, A.A.; supervision, A.R.; project administration, A.R. and R.K.V. All authors have read and agreed to the published version of the manuscript.

Funding

This research received no external funding.

Data Availability Statement

The original contributions presented in this study are included in the article. Further inquiries can be directed to the corresponding authors.

Conflicts of Interest

The authors declare no conflicts of interest.

Abbreviations

The following abbreviations are used in this manuscript:
SHFShell hydroforming
FEFinite element
IPInternal pressure
BHFBlank holding force
CoFCoefficient of friction
FRFlange radius
DOEDesign of experiments
RSMResponse surface methodology

References

  1. Trzepieciński, T. Recent Developments and Trends in Sheet Metal Forming. Metals 2020, 10, 779. [Google Scholar] [CrossRef]
  2. Tisza, M. Recent Development Trends in Sheet Metal Forming. Int. J. Microstruct. Mater. Prop. 2013, 8, 125–140. [Google Scholar] [CrossRef]
  3. Singh, S.K. Sheet Metal Forming Processes Recent Technological Advances. Int. J. Sci. Res. Eng. Trends 2020, 6, 290–298. [Google Scholar]
  4. Trzepieciński, T.; Najm, S.M.; Oleksik, V.; Vasilca, D.; Paniti, I.; Szpunar, M. Recent Developments and Future Challenges in Incremental Sheet Forming of Aluminium and Aluminium Alloy Sheets. Metals 2022, 12, 124. [Google Scholar] [CrossRef]
  5. Bell, C.; Corney, J.; Zuelli, N.; Savings, D. A State of the Art Review of Hydroforming Technology Its Applications, Research Areas, History, and Future in Manufacturing. Int. J. Mater. Form. 2020, 13, 789–828. [Google Scholar] [CrossRef]
  6. Koç, M. Hydroforming for Advanced Manufacturing; Woodhead Publishing: Cambridge, UK, 2006; ISBN 9781845690496. [Google Scholar]
  7. Ahmetoglu, M.; Altan, T. Tube Hydroforming: State-of-the-Art and Future Trends. J. Mater. Process. Technol. 2000, 98, 25–33. [Google Scholar] [CrossRef]
  8. Feyissa, F.T.; Kumar, D.R. Enhancement of Drawability of Cryorolled AA5083 Alloy Sheets by Hydroforming. J. Mater. Res. Technol. 2019, 8, 411–423. [Google Scholar] [CrossRef]
  9. Modi, B.; Kumar, D.R. Development of a Hydroforming Setup for Deep Drawing of Square Cups with Variable Blank Holding Force Technique. Int. J. Adv. Manuf. Technol. 2013, 66, 1159–1169. [Google Scholar] [CrossRef]
  10. Jaber, A.; Mohammed, A.; Younis, K. Improvement of Formability of AISI 1006 Sheets by Hydroforming with Die in Square Deep Drawing. Eng. Technol. J. 2023, 41, 1488–1496. [Google Scholar] [CrossRef]
  11. Feyissa, F.; Ravi Kumar, D.; Rao, P.N. Characterization of Microstructure, Mechanical Properties and Formability of Cryorolled AA5083 Alloy Sheets. J. Mater. Eng. Perform. 2018, 27, 1614–1627. [Google Scholar] [CrossRef]
  12. Ramanathan, G.L.; Ramesh, A.; Achuthankutty, A. Numerical Investigation on Influence of Grooves on Tube Hydroforming Process of Aluminium Alloys. Period. Polytech. Mech. Eng. 2024, 68, 114–119. [Google Scholar] [CrossRef]
  13. Raut, S.V.; Ramesh, A.; Arun, A.; Sumesh, C.S. Finite Element Analysis and Optimization of Tube Hydroforming Process. Mater. Today Proc. 2021, 46, 5008–5016. [Google Scholar] [CrossRef]
  14. Satish, D.R.; Feyissa, F.T.; Kumar, D.R. Formability of Cryorolled Aluminum Alloy Sheets in Warm Forming. Int. J. Mater. Mech. Manuf. 2018, 6, 123–126. [Google Scholar] [CrossRef]
  15. Mohamed, M.; Carty, D.; Storr, J.; Zuelli, N.; Blackwell, P.; Savings, D. Feasibility Study of Complex Sheet Hydroforming Process: Experimental and Modelling. Key Eng. Mater. 2016, 716, 685–691. [Google Scholar] [CrossRef]
  16. Churiaque, C.; Sánchez-Amaya, J.M.; Caamaño, F.; Vazquez-Martinez, J.M.; Botana, J. Springback Estimation in the Hydroforming Process of UNS A92024-T3 Aluminum Alloy by FEM Simulations. Metals 2018, 8, 404. [Google Scholar] [CrossRef]
  17. Achuthankutty, A.; Ramesh, A.; Velamati, R.K. A 3D Non-Linear FE Model and Optimization of Cavity Die Sheet Hydroforming Process. Metals 2024, 14, 478. [Google Scholar] [CrossRef]
  18. Yuan, S. Fundamentals and Processes of Fluid Pressure Forming Technology for Complex Thin-Walled Components. Engineering 2021, 7, 358–366. [Google Scholar] [CrossRef]
  19. Maki, T.; Cheng, J. Sheet Hydroforming and Other New Potential Forming Technologies. IOP Conf. Ser. Mater. Sci. Eng. 2018, 418, 012117. [Google Scholar] [CrossRef]
  20. Nakamura, S.; Sugiura, H.; Onoe, H.; Ikemoto, K. Hydromechanical Drawing of Automotive Parts. J. Mater. Process. Technol. 1994, 46, 491–503. [Google Scholar] [CrossRef]
  21. Zhang, S.H. Developments in Hydroforming. J. Mater. Process. Technol. 1999, 91, 236–244. [Google Scholar] [CrossRef]
  22. Mo, C.; Xu, Y.; Yuan, S. Research on Hydroforming of 5A06 Aluminum Alloy Semi-Ellipsoid Shell with Differential Thickness. Int. J. Adv. Manuf. Technol. 2023, 125, 603–612. [Google Scholar] [CrossRef]
  23. Wang, Z.R.; Liu, G.; Yuan, S.J.; Teng, B.G.; He, Z.B. Progress in Shell Hydroforming. J. Mater. Process. Technol. 2005, 167, 230–236. [Google Scholar] [CrossRef]
  24. Zhang, R.; Zhang, W.W.; Yuan, S.J. Research on Hydro-Forming of Spherical Shells with Different Preform Types. Int. J. Adv. Manuf. Technol. 2017, 92, 2631–2638. [Google Scholar] [CrossRef]
  25. Alex, A.J.; Vaira Vignesh, R.; Padmanaban, R.; Govindaraju, M.B.C. Effect of Heat Treatment on the Mechanical and Wear Behavior of Friction Stir Processed AA5052 Alloy. Mater. Today Proc. 2020, 22, 3340–3346. [Google Scholar] [CrossRef]
  26. Kumar, B.G.; Kumar, R.L.; Ramalingam, V.V.; Viswanath, J.K.; Harikeshava, R.; Padmanaban, R. Corrosion and Tribological Characteristics of Friction Stir Processed Aluminium Alloy AA5052. Trans. Marit. Sci. 2022, 11, 22. [Google Scholar] [CrossRef]
  27. Foulke, C. Hydroforming Method—Instructional Video. 2016. Available online: https://www.youtube.com/watch?v=OhxMj1wnQZg&t=51s (accessed on 16 March 2023).
  28. ASTM E8/E8M-21; Standard Test Methods for Tension Testing of Metallic Materials. ASTM: West Conshohocken, PA, USA, 2022.
  29. Mahabunphachai, S.; Koç, M. Investigations on Forming of Aluminum 5052 and 6061 Sheet Alloys at Warm Temperatures. Mater. Des. 2010, 31, 2422–2434. [Google Scholar] [CrossRef]
  30. Bradley, N. The Response Surface Methodology; Indiana University of South Bend: South Bend, IN, USA, 2007. [Google Scholar]
  31. Khioon, M.; Hubeatir, K.; AL-Khafaji, M. Parametric Optimization of Laser Conduction Welding between Stainless Steel 316 and Polyethylene Terephthalate Using Taguchi Method. Eng. Technol. J. 2022, 40, 1630–1637. [Google Scholar] [CrossRef]
Figure 1. Shell hydroforming schematic diagram.
Symmetry 17 00989 g001
Figure 2. (a) Dimensions of lower blank holder and (b) lower blank holder with blank.
Symmetry 17 00989 g002
Figure 3. Experimental set-up for shell hydroforming.
Symmetry 17 00989 g003
Figure 4. Dome height vs. time plot.
Symmetry 17 00989 g004
Figure 5. Finite element model exploded view.
Symmetry 17 00989 g005
Figure 6. (a) Tearing, (b) bursting, (c) partially formed shell, and (d) fully formed shell.
Symmetry 17 00989 g006
Figure 8. Locations for thickness measurement from apex (Point 1) to flange edge (Point 10) along the dome profile.
Symmetry 17 00989 g008
Figure 9. Comparison of hemispherical shells from FE simulation (a) and experiment (b), with color contour indicating total displacement magnitude U in mm.
Symmetry 17 00989 g009
Figure 10. Comparison of experimental and FEM thicknesses at locations shown in Figure 8.
Symmetry 17 00989 g010
Figure 11. (a) Simulated von Mises stress distribution across the formed shell. (b) Stress variation along 10 locations from apex to flange.
Symmetry 17 00989 g011
Figure 12. (a) Simulated equivalent plastic strain distribution across the formed shell. (b) Strain variation along 10 locations from apex to flange.
Symmetry 17 00989 g012
Figure 13. Strain rate history at dome’s apex.
Symmetry 17 00989 g013
Figure 14. Main effect plots for thinning percentage.
Symmetry 17 00989 g014
Figure 15. Main effect plots for dome height.
Symmetry 17 00989 g015
Figure 16. Interaction plots for percentage thinning.
Symmetry 17 00989 g016
Figure 17. Interaction plots for dome height.
Symmetry 17 00989 g017
Figure 18. Optimization plot.
Symmetry 17 00989 g018
Table 1. Material composition.
AlMgFeCrSiMnZnCuOthers
96.652.320.390.270.120.0620.010.0030.175
Table 2. Material properties of AA5052.
DensityYoungs ModulusPoisson’s RatioYield StrengthTensile Strength% Elongation
2.68 g/cc70 GPa0.33149 MPa244 MPa12%
Table 3. Parameter range for optimization.
ParameterMin LevelMedium LevelMax Level
IP (MPa)5.25.45.6
BHF (kN)140240340
CoF0.040.080.12
FR (mm)357
Table 4. Input parameter combinations and corresponding output results.
IPBHFCoFFRDome Height% Thinning
5.21400.04343.120.7
5.23400.04340.823.5
5.63400.04353.727.4
5.61400.04352.927.3
5.42400.04548.323.3
5.21400.04743.419.2
5.23400.04740.922.0
5.63400.04754.025.8
5.61400.04753.625.6
5.42400.08345.224.7
5.22400.08542.420.6
5.42400.08546.722.0
5.41400.08547.121.1
5.43400.08546.221.7
5.62400.08553.234.3
5.42400.08745.124.8
5.21400.12341.422.3
5.23400.12340.324.6
5.61400.12352.330.1
5.63400.12353.036.4
5.42400.12548.328.3
5.23400.12740.222.9
5.21400.12741.020.1
5.61400.12752.730.0
5.63400.12754.134.0
Table 5. Thickness distribution along the locations marked in Figure 8.
Location% Thinning
1 27.5
2 25.8
3 22.5
4 20.8
5 16.7
6 11.7
7 7.5
8 3.3
9 2.5
10 6.7
Table 6. FE and experimental dome height comparison.
Dome Height (mm)Error Percentage
Experimental ValuesFE Values
5048.522.63
Disclaimer/Publisher’s Note: The statements, opinions and data contained in all publications are solely those of the individual author(s) and contributor(s) and not of MDPI and/or the editor(s). MDPI and/or the editor(s) disclaim responsibility for any injury to people or property resulting from any ideas, methods, instructions or products referred to in the content.